Abstract
Evapotranspiration plays a decisive role in the whole oasis ecosystem and is an important factor to maintain the ecological stability of oases. To quantitatively analyze the evapotranspiration differences of oases at different scales and the expansion of urbanization, it is necessary to compare and discuss them at different time scales. In this study, the spatial and temporal characteristics of evapotranspiration of Zhangye Oasis, Jinta Oasis, and Ejina Oasis in the Heihe River basin were analyzed by using the remote sensing dataset of daily surface evapotranspiration of 100 m resolution from 2010 to 2016. The difference in evapotranspiration intensity in different oases was analyzed, and the influences of irrigation and urbanization expansion on evapotranspiration were discussed. The conclusion is as follows: Zhangye Oasis is the largest oasis in the area and, compared with other oases, due to the largest proportion of wetland and farmland in the underlying surface, the intensity of evapotranspiration is also the largest, reaching 650 mm/year on average. There is no obvious annual change; the range of evapotranspiration changes fluctuates between positive and negative 60 mm/year. Jinta Oasis began to decline after 2012; the evapotranspiration value dropped from 620 mm/tear to 560 mm/year, while Ejina Oasis showed a slight increase after 2014. In the irrigation stage, the evapotranspiration intensity increased significantly. Especially in the peak season of crop growth, the evapotranspiration after irrigation increased by 4 mm/day compared with that before irrigation. The evapotranspiration in urban and oasis areas is different in summer: compare that of 2010 with 2016—the evapotranspiration intensity of the expanding towns in the northeast direction decreased by about 50 mm/month, the northwest expanding towns decreased by about 110 mm/month. There was no obvious annual change in evapotranspiration in the urban area. With the expansion of urbanization, the evapotranspiration intensity in oases decreased. The results of this study provide some reference for the study of oasis irrigation activities and urbanization expansion.
1. Introduction
Heihe River is the second largest inland river in China, which is formed by precipitation and ice melt water from the Qilian Mountains. Water resources are not only the source of oasis development in the Hexi Corridor but are the link between ecology and economy in the basin. The middle and lower reaches of the Heihe River basin are in arid and semi-arid regions [1]. The agricultural irrigated oases in the middle reaches (Zhangye Oasis and Jinta Oasis) and the vanishing oasis in the lower reaches (Ejina Oasis) are the important economic zones in this region, concentrating most of the population and wealth [2]. In recent years, due to unreasonable land use, the oases in this region have been degraded and desertification has been aggravated and the contradiction between people and land has been prominent, seriously affecting the sustainable development of the social economy and ecological environment in this region [3]. In the process of the oasis system being pitted against forced climate aridity, climate factors such as temperature, precipitation, and wind speed change correspondingly, and comprehensively show a series of unique microclimate characteristics, collectively called the “oasis effect” [4]. The “oasis effect” is the result of an energy exchange between the oasis and the surrounding desert and affects the evolution process of the oasis [5]. Zhangye Oasis is the region with the fastest social and economic development and the most prominent human–land relationship problems among the oases in the Heihe River basin, as well as the largest oasis in the Hexi Corridor of China [6]. In Jinta Oasis, the cultivated land and urban construction land have increased rapidly in recent years, while the grassland and woodland have decreased [7]. The multiscale observations in the HRB provide a unique opportunity to support the development and improvement of scaling methods for ET, soil moisture, LAI, and other land surface parameters [8,9]. The quantification of irrigation water efficiency at the field scale first requires accurate and high spatiotemporal resolution estimates of surface evapotranspiration (ET) [10]. Liu et al. [11] proposed an upscaling method (i.e., the integrated Priestley–Taylor equation) to acquire ET at the satellite pixel scale. Finally, a combined method, i.e., applying the AW method to relatively homogeneous surfaces or otherwise using the Priestley–Taylor method, was proposed to acquire both instantaneous and daily “ground-truth” ET data at the satellite pixel scale. Xu et al. [12] applied the AW method and combined it with a footprint analysis and the multivariate regression method to upscale multisite EC flux data in the kernel matrix area of the HiWATER-MUSOEXE. Ankur et al. [13] evaluated the moderate resolution imaging spectroradiometer (MODIS) satellite-based remote-sensing techniques and the water-budget approach built into the semi distributed variable infiltration capacity (VIC-3L) land–surface model by using the Penman–Monteith (PM) equation approach and crop coefficient approach. It reveals that there is a need for a regional-scale standardization of the MODIS-ET products using the PM or lysimeter data or possible modification of the MOD16A2 algorithm built into the MODIS for generalization. To determine the most appropriate upscaling approach for acquiring ground-truth ET data at the satellite pixel scale, Li et al. [14] used the dataset from two flux observation matrices in the midstream and downstream regions of the HRB and compared six upscaling methods (AW, Priestley–Taylor, WATARK, artificial neural network, random forest, and a deep belief network) via direct validation and cross-validation. Finally, an optimized method (using the AW and WATARK methods for homogeneous and moderately heterogeneous land surfaces, respectively, and using the random forest method for highly heterogeneous land surfaces) was proposed to acquire daily “ground-truth” ET data at the satellite pixel scale, which were used to validate remotely sensed ET products.
Grant et al. [15] showed that 70% of surface precipitation returned to the atmosphere through evapotranspiration, which could reach more than 90% in arid areas, indicating that evapotranspiration is the main form of agricultural water dissipation in oases. In the 1980s, Brown and Rosenberg [16] used the temperature data obtained by thermal infrared sensors to estimate evapotranspiration. Since then, a variety of remote sensing evapotranspiration estimation models have been constructed and tested in different regional meteorological and surface conditions [17]. Yang et al. [18] used MODIS remote sensing products and ground meteorological observation data to estimate evapotranspiration in the Heihe River basin through a SEBS model and obtained the spatial distribution of evapotranspiration. Meanwhile, the remote sensing data can improve the simulation of evapotranspiration process and the oasis effect in climate models [19]. Through modifying the initial soil moisture simulation experiment, it is found that evapotranspiration is the dominant factor of soil water content decrease in the arid environment [20]. However, on the one hand, the remote sensing data is the grid average value, differing greatly from site observation in scale, and the larger the scale difference is, the more obvious it will be. On the other hand, improving the model resolution is an effective way to describe the heterogeneity of the oasis, and the improvement of the resolution depends on the high-resolution satellite data. Rahimi et al. [21] found that SEBAL could invert hourly and daily evapotranspiration. Lian et al. [22] estimated the evapotranspiration of the oasis in the growing season by using high-resolution Landsat-8 remote sensing products and found that the evapotranspiration of the water body was the largest, followed by farmland.
The water demand for crops in the Heihe River basin is mainly through irrigation [23], with up to 84% of the total surface water consumption of agricultural irrigation stations [24]. In the irrigation period, the increase of soil moisture caused by irrigation affects the distribution of surface energy [25]. The sensible heat flux of the oasis after irrigation was lower than that before irrigation, while the latent heat flux was higher than that before irrigation. The greater the soil moisture, the more obvious the difference [26]. Irrigation has a huge impact on evapotranspiration in oases, and it is of great significance to use high-resolution data to fine-manage irrigation water.
In recent years, with the development of the social economy, the urban area and population in the oasis of the Heihe River basin have been increasing continuously, and the trend of urbanization has been further intensified. The expansion of urban areas will inevitably lead to a change of oasis surface energy distribution. Wen et al. [27] used the MM5 model to simulate the impact of urbanization on the climate effect of Jinta Oasis through a semi-ideal experiment and found that different urban expansion modes have different effects on the oasis effect. The expansion of urbanization will lead to significant changes in the stagnation, permeability, and thermal conditions of the underlying surface, resulting in corresponding changes in the hydrological elements and hydrological processes of urban and suburban areas. Thus, the actual evapotranspiration changes dramatically [28,29]. In recent years, with the increasing accuracy of the pattern for the underlying city surface characterization of hydrothermal process, the real situation of a numerical experiment can precisely simulate the effect of urbanization on evaporation. Qian [30] found that there were no obvious changes in temperature and precipitation, or reduction of river basin evaporation mainly associated with the reduction of the paddy field area.
Multi-source remote sensing data and its fusion technology are effective ways to obtain large-scale and refined surface evapotranspiration monitoring. MODIS data can provide long time series data, but the spatial resolution is low, which is difficult to meet the irrigation area water resources management. Resource satellite data has a high spatial resolution, but low temporal resolution. Ultra-high-resolution remote sensing ET data based on multi-source remote sensing data and near-surface meteorological elements data are used in this paper. It covers the entire Heihe River basin in space, which is convenient for comparing regional ET differences, greatly improves the spatial resolution and data accuracy compared with the previous ones, and provides a more intuitive reflection of the evapotranspiration differences of different underlying surfaces. This paper uses this data to compare and analyze the spatio-temporal variation of ET in oases of different scales, including the influence of irrigation, and the impact of urbanization expansion on ET. In this study, the detail about the in-situ observation data and remote sensing evapotranspiration data is given in Section 2, the results are in Section 3, and the conclusions and discussion are given in Section 4.
2. Data and Methods
2.1. In-Situ Observation Data and NDVI Data
The station data used in this study for comparison with remote sensing data are automatic meteorological observation data and eddy correlation observation data of three different underlying surfaces in the middle and lower reaches of Heihe River in 2014 [31,32]. These data contain the flux measurements eddy covariance system (EC). The longitude, latitude, and underlying surface of each station are shown in Table 1.

Table 1.
Location, underlying surface type and altitude of each site.
The raw data acquired at 10 Hz were processed using Eddypro post-processing software, including spike detection, lag correction of H2O/CO2 relative to the vertical wind component, sonic virtual temperature correction, coordinate rotation (2D rotation), corrections for density fluctuation (Webb–Pearman–Leuning correction), and frequency response correction. The EC data were subsequently averaged over 30 min periods. The observation data quality was divided into three classes according to the quality assessment method of stationarity (Δst) and the integral turbulent characteristics test (ITC): class 1–3 (high quality), class 4–6 (good), class 7–8 (poor, better than gap-filling data), class 9 (rejected). In addition to the above processing steps, the half-hourly flux data were screened in a four-step procedure: (1) data from periods of sensor malfunction were rejected; (2) data collected before or after 1 h of precipitation were rejected; (3) incomplete 30 min data were rejected when the missing data constituted more than 10% of the 30 min raw record; and (4) data were rejected at night when the friction velocity (u*) was less than 0.1 m/s [31,32].
During the data quality inspection, it was found that the latent heat flux data of the Hunhelin station in 2015 was abnormal. Through the calculation and verification of various variables at the Hunhelin station during 2014–2016, it can be seen from the results that the low value of latent heat flux in 2015 might be caused by the failure of the H2O/CO2 analyzer of eddy covariance system.
As can be seen from Figure 1a, the water vapor density in 2015 is significantly lower than that in 2014 and 2016. This data was obtained by the H2O/CO2 analyzer of eddy covariance system. From Figure 1b, it can be seen the vapor pressure difference has no significant changes from 2014 to 2016. This indicates that there is no abrupt change of the environment causing the change of latent heat flux. From Figure 1c,d, it can be seen the variation range of soil temperature from 2014 to 2016 is close to that of the soil temperature with no obvious mutation. The soil moisture value of 2015 was generally between that of 2014 and 2016, and the sudden increase of moisture occurred in early March and early August, respectively, which had nothing to do with the overall small latent heat flux value in summer. Combined with the analysis results of other variables, it can be considered that the failure of the H2O/CO2 analyzer of eddy covariance system led to the error of the observation data, so the data of 2015 was deleted in this study.
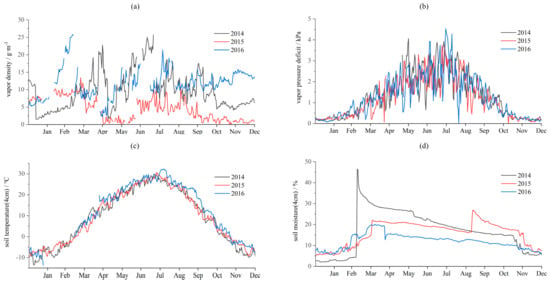
Figure 1.
Comparison of different variables at Hunhelin station from 2014 to 2016. (a) vapor density. (b) vapor pressure deficit. (c) soil temperature(4 cm). (d) soil moisture(4 cm).
Among them, latent heat flux data required for observation was measured by the eddy covariance instrument, precipitation was measured by a tipping bucket rain gauge, and soil moisture value was measured by a soil moisture sensor. The study found that the phenological period of maize was shown in Table 2, and the artificial irrigation was concentrated in June and July, according to the sudden change in soil moisture value.

Table 2.
Average time of maize growing season.
The 30 m/month vegetation index (NDVI/EVI) data set of Heihe River basin provides the monthly NDVI/EVI composite products from 2011 to 2014. This data uses the characteristics of HJ/CCD data of China’s domestic satellite, which has both high time resolution (2 days after networking) and spatial resolution (30 m), to construct multi-angle observation data set (CSTR: 18406.11.hiwater.295.2016.db) [33,34]. These data are used to analyze the relationship between evapotranspiration and urban expansion.
2.2. Remote Sensing Evapotranspiration Data
The land use data in Figure 2 is from the land use and cover data set of Heihe River basin in July 2014, provided by the HiWATER eco-remote Sensing Experiment [34,35]. In this study, a daily remote sensing evapotranspiration product with 100 m spatial resolution in the Heihe River basin was used, which is provided by the National Data Center for Tibetan Plateau Science. This data set mainly includes daily surface evapotranspiration products from 2010 to 2016 and is based on multi-source remote sensing data (MODIS Landsat TM/ETM+ data) and regional meteorological data (China meteorological forcing dataset, CMFD); sensitivity parameters of the theoretically robust surface energy balance system (SEBS) model were determined through global sensitivity analysis, and then the parameterization scheme of the model was optimized to improve the estimation accuracy. At the same time, combined spatial and temporal data fusion algorithms of remote sensing images were employed. Finally, high-temporal and Landsat-like surface evapotranspiration (ET) (HiTLL ET) was obtained over the Heihe Basin [36].
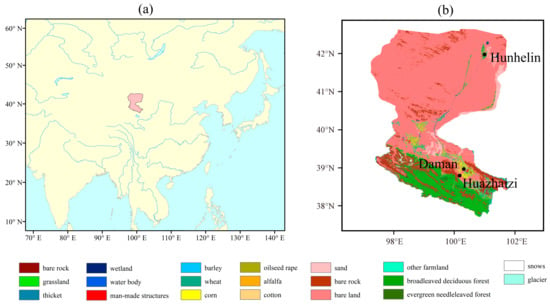
Figure 2.
Location and land use distribution of Heihe River Basin. (a) Heihe River Basin geographical location. (b) Land use distribution in Heihe River Basin.
MODIS data were from the Land Processes Distributed Active Archive Center (LP DAAC) (http://glovis.usgs.gov/, accessed on 20 September 2022) and ETM+ were obtained from the United States Geological Survey (USGS) (https://landsat.usgs.gov/, accessed on 20 September 2022). These data were calibrated and atmospherically corrected for the shortwave reflectance band using the QUAC module [37] of the ENVI and for the thermal band using the Atmospheric Correction Parameter Calculator [38] of NASA (https://atmcorr.gsfc.nasa.gov/, accessed on 20 September 2022). The input parameters for the ET models (LST, normalized difference vegetation index [NDVI], FVC, LAI, emissivity, and canopy height and building height [HCHB]) were also from MODIS and ETM+.
To estimate surface fluxes at high spatiotemporal resolution in the study area, spatially explicit meteorological variables at the reference height (wind speed, air temperature, relative humidity, atmospheric pressure, and downward short-wave radiation flux) are needed. The near-surface meteorological forcing data (5 km resolution) produced by the Weather Research and Forecasting (WRF) model were used [39]. These data were interpolated using the bilinear resampling method and averaged to determine daily values for all meteorological variables. Then, the WRF-derived meteorological variables were downscaled to a spatial resolution of 100 m using regression-kriging (RK) [40,41].
The HiTLL ET used the ESTARFM and compared the IPFA and EFTA, finding that at the high spatial heterogeneity, the IFTA is superior to ETFA. Considering there are different cases of estimating the HiTLL ET, such as clear-sky days and cloudy days, different situations will use different data. For clear-sky days, when the MODIS data and the Landsat Enhanced Thematic Mapper Plus (ETM+) data are both available, Landsat data were used to directly estimate instantaneous ET using the revised SEBS model and then instantaneous ET estimates were upscaled to daily values using the constant solar radiation ratio (SolRad) method [42]. If only the MODIS data could be used, the high spatial and temporal resolution model input parameters were obtained using ESTARFM [43]. For cloudy days, when the MODIS and ETM+ are both unavailable, daily ET maps were estimated using a temporal reconstruction method, the reference evapotranspiration method (ET_EToF) [44]. The surface parameters were then used to drive the revised Surface Energy Balance System (SEBS) model to estimate daily ET at a spatial resolution of 100 m.
A high-resolution digital elevation model (DEM), obtained from NASA Shuttle Radar Topography Mission (SRTM), was used to adjust the temperature of the in-situ measurements to sea level temperature [45]. After that, the HiTLL ET was validated by EC measurements from the flux observation stations and ETMap. Compared with the EC measurements, the low mean absolute percentage errors and root mean square errors show that the estimation scheme is successful. The validation result also shows that HiTLL can estimate effectively on clear-sky days. This data set can provide data support for the study of water consumption law and scientific effective management of watershed water resources within HRB, especially for woodland and grassland in the upper stream regions, oasis farmland, and desert vegetation in the midstream and downstream regions [36,46].
The HiTLL ET has been compared with other remote-sensing ET products for the oasis in the midstream of the HRB, including the MOD16 [47], ETMonitor [48], ETWatch [49], and Daily ET Datasets (2012) [50]. These products have highly biased estimates, and they are not suitable for assessment of ET changes in regional areas. The HiTLL ET shows the advantage over other products in characterization of the fine-spatiotemporal properties of different land cover types.
2.3. Statistical Methods
The remote sensing data and observation data of the three stations were further evaluated by statistical methods: mean deviation (ME), root mean square error (RMSE), and correlation coefficient (R). The corresponding formula is as follows:
2.4. Satellite Data Preprocessing and Model Equation
The fraction vegetation cover (FVC) is one of the input parameters for the ET model, it needs to be calculated as follows:
The represents the NDVI of bare soil, represents the maximum NDVI, and the constant k is 0.4631 [51].
In the SEBS model, the sensible heat flux (H) is computed based on the Monin–Obukhov similarity theory (MOST) theory:
In the equation, is the height above the surface, is the friction velocity, is the density of air; is the specific heat for air at constant pressure, k is the von Kármán constant, is the zero plane displacement height, and are the roughness heights for momentum and heat transfer, respectively, is the potential temperature at the surface, is the potential air temperature at height z; is the stability correction function for sensible heat transfer [52], and is the Obukhov length.
3. Evapotranspiration Process Analysis Based on High Resolution Remote Sensing Products
3.1. Comparison of Remote Sensing and In-Situ Data
Based on the remote sensing data of daily surface evapotranspiration of 100 m in the Heihe River basin from 2010 to 2016, the spatial and temporal characteristics of evapotranspiration simulation values in the three regions were analyzed. In-situ observation data of Daman station, Huazhaizi Station, and Hunhelin station in Zhangye oasis from 2014 to 2016 were selected to calculate monthly evapotranspiration and compared with the corresponding longitude and latitude values in remote sensing observation data.
It can be seen from Figure 3, that the monthly evapotranspiration of Daman station and Huazhaizi station in Zhangye Oasis dovetailed well with the remote sensing data from 2014 to 2016. At Daman station, there is a small fluctuation from March to May every year, and the evapotranspiration value increases, which is considered to be an error caused by irrigation. In summer, the station data was 27 mm/month higher than the remote sensing observation on average. At Huazhaizi station, the overall evapotranspiration intensity was lower than that of Daman Station, and the gap between the data was also smaller, with an average difference of 12 mm/month. It can be seen from 2014 and 2016 that the observation data of the site and remote sensing data are very close to each other In general, the accuracy of remote sensing data is very high, which can be used to accurately analyze regional evapotranspiration.
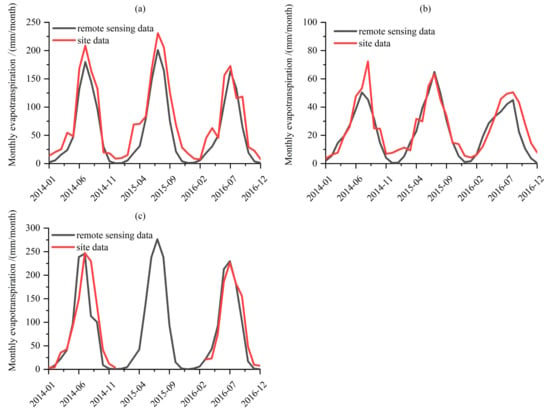
Figure 3.
Comparison of monthly evapotranspiration between observation data of each station and remote sensing observation from 2014 to 2016. (a) Daman station; (b) Huazhaizi station; (c) Hunhelin station.
Combined with Figure 3 and Table 3, the correlation between the remote sensing values and the observed values of Daman station and Huazhaizi station is high, being 0.96 and 0.91, respectively. The mean deviation of Daman station and Huazhaizi station is negative, indicating that the remote sensing value is less than the observed value. The root mean square error of Hunhelin station is the smallest, and the remote sensing value is closest to the observed value.

Table 3.
Statistical results of remote sensing values and observed values at different stations from 2014 to 2016.
3.2. Annual Variation of Evapotranspiration
The annual evapotranspiration data of Zhangye Oasis, Ejina Oasis, and Jinta Oasis from 2010 to 2016 were selected to analyze the interannual variation characteristics, and the latent heat flux value of 2010 was used as the reference value to analyze the latent heat difference between the following years and 2010, as shown in Figure 4.
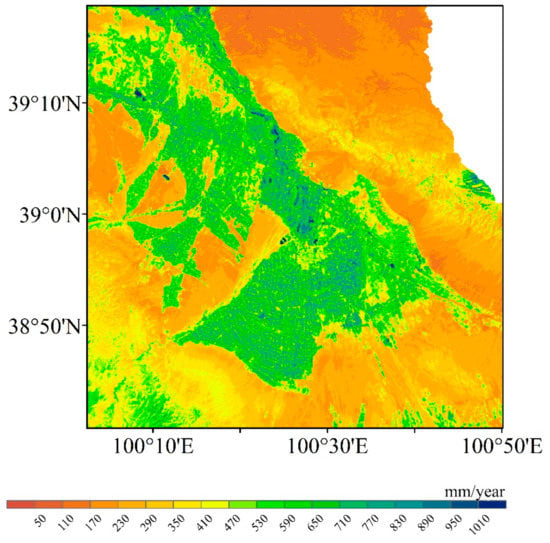
Figure 4.
Evapotranspiration in Zhangye region in 2010.
It can be seen from Figure 4 and Figure 5, that the annual evapotranspiration value of Zhangye Oasis in 2010 ranged from 470 mm/year to 830 mm/year, with the maximum area reaching more than 950 mm/year. Compared with 2010, evapotranspiration in Zhangye Oasis increased in the following years, but the difference was not obvious in 2011, 2013, and 2014, and the evapotranspiration decreased in some areas. Compared with 2010, the total evapotranspiration in 2012 increased by 0~20 mm/year, and the increase in 2015 and 2016 was more obvious, reaching 60 mm/year or above in some regions. The range of evapotranspiration changes fluctuates between positive and negative 60 mm/year. The difference in evapotranspiration in different areas of the oasis was large, and the large value area was mainly located in wetland and farmland.
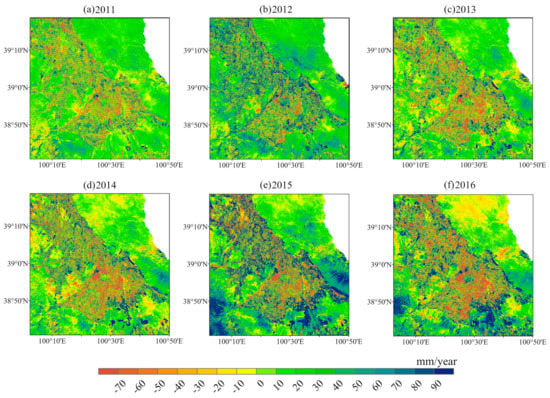
Figure 5.
The evapotranspiration difference between Zhangye region from 2011 to 2016 and 2010.
It can be seen from Figure 6 and Figure 7, that the total evapotranspiration of the Jinta area was smaller than that of the Zhangye area. Since 2013, the evapotranspiration of areas outside the triangle oasis began to decline; the evapotranspiration value dropped from 620 mm/year to 560 mm/year. Within the triangle area, the evapotranspiration of Jinta Oasis was scattered in pieces, and the change of evapotranspiration showed no obvious increase or decrease. In Jinta Oasis, there was a strip of high-value area of evapotranspiration, which was located at 98°40′E~98°50′E, 40°15′N~40°20′N, which is not obvious in 2010, and then there was an obvious rising difference which could reach more than 90 mm/year. The evapotranspiration of water bodies in Ejina region presents a high value. The area of Ejina Oasis is relatively small, and the evapotranspiration of the oasis part has been increasing since 2015 (Picture omitted).
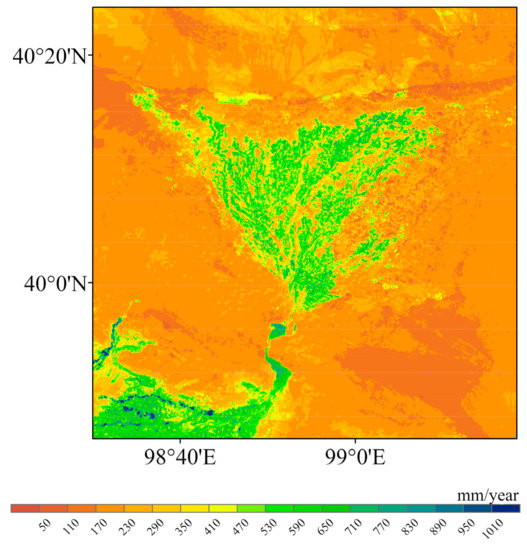
Figure 6.
Evapotranspiration in Jinta region in 2010.
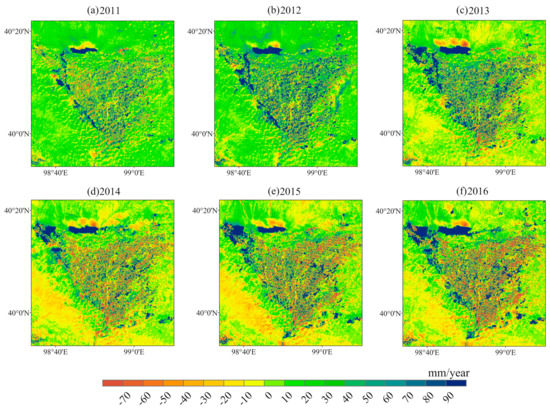
Figure 7.
Same as Figure 5, but for the evapotranspiration difference between Jinta region from 2011 to 2016 and 2010.
As can be seen from Figure 8 and Table 4, evapotranspiration of the three oases showed no obvious inter-annual change from 2010 to 2016; the variation range of evapotranspiration value in Zhangye Oasis is no more than 4.5%, in Ejina Oasis is no more than 9.5%, and in Jinta Oasis is no more than 5.9%. Since the area to obtain the average evapotranspiration also includes the desert area near the oasis, the value will be smaller than that of the oasis area with high vegetation coverage. The evapotranspiration value in Zhangye Oasis fluctuates between 438 mm/year and 469 mm/year, in Jinta Oasis fluctuates between 390 mm/year and 427 mm/year, and in Ejina Oasis fluctuates between 298 mm/year and 343 mm/year. Zhangye Oasis is a benign development oasis with the largest area and evapotranspiration intensity, while Ejina Oasis area is small, mainly surrounded by bare land, with evapotranspiration intensity is the least. Evapotranspiration in Ejina Oasis increased significantly from 2015 to 2016, with an increased rate of about 42 mm/year.
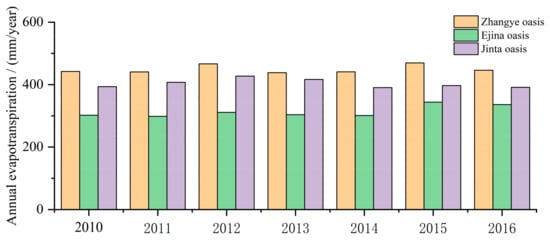
Figure 8.
Comparison of annual evapotranspiration in different oases.

Table 4.
The annual change of evapotranspiration value compared with the seven-year average (%).
3.3. Seasonal Variations of Evapotranspiration in Summer and Autumn
Taking the data from 2014 as an example, the variation characteristics of Zhangye Oasis, Ejina Oasis, and Jinta Oasis from May to October were analyzed, as shown in Figure 9. According to Figure 9a–f, monthly evapotranspiration in Zhangye Oasis increased significantly from May to July, with the most obvious increase in wetland and farmland areas, from 65~80 mm/month to 155~200 mm/month. From July to October, the evapotranspiration in the oasis area showed a significant weakening trend. In August, the evapotranspiration in the oasis area reached 110~140 mm/month and decreased to 65~110 mm/month in September. By October, the evapotranspiration in some oasis areas was not significantly different from the surrounding bare land. It can be seen from Figure 9g–l, in Jinta, the change range of monthly evapotranspiration is obviously from May to June, but from June to August, the change becomes small. It began to decline significantly from August. From Figure 9m–r, the monthly variation of evapotranspiration in Ejina area was similar to that in Zhangye area, which reached the maximum in July and then began to decline. The variation of evapotranspiration in bare land areas is small in summer and autumn, and the variation range of water body is the most obvious. Compared with Zhangye Oasis, evapotranspiration in Ejina Oasis had a smaller change range. Evapotranspiration increased only in part of the oasis from May to July and decreased less from July to August. Evapotranspiration decreased greatly from August to October, and no obvious oasis could be seen in October. The evapotranspiration in Zhangye Oasis increased significantly in July due to the abundance of farmland wetlands and the influence of irrigation. After irrigation, evapotranspiration decreased more significantly than that in Ejina Oasis and Jinta Oasis. From September to October, evapotranspiration decreased significantly due to the decrease in temperature and net radiation. In October, the soil in some areas began to enter the freeze–thaw process, soil moisture decreased, and evapotranspiration further decreased.
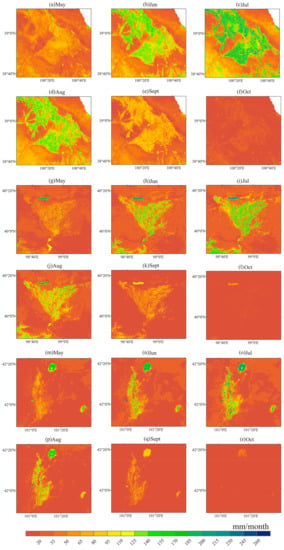
Figure 9.
Changes of monthly evapotranspiration in Zhangye, Jinta and Ejina from May to October 2014.
From Figure 10, the high-value area of NDVI and the high-value area of evapotranspiration correspond well. In January, the difference in NDVI between oasis area and the surrounding desert was not obvious, which was 0.15 and 0.05, respectively. In July, the difference began to increase, and the maximum value in oasis area could reach more than 0.3, and the NDVI in the desert area also increased, which could reach 0.13.
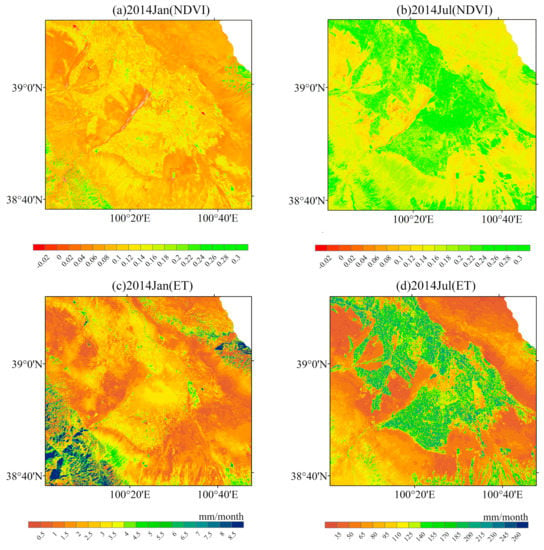
Figure 10.
Comparison of NDVI and evapotranspiration values between January and July in Zhangye area in 2014.
3.4. Effects of Irrigation on Regional Evapotranspiration
Taking the data from 2014 as an example, the influence of irrigation and rainfall on evapotranspiration in the surrounding area of Daman Station is analyzed. It can be seen from Figure 11 that there is no obvious corresponding relationship between soil moisture change and rainfall, indicating that artificial irrigation is the main factor affecting soil moisture. The period when soil moisture significantly increased in Figure 11 was selected for analysis. Since regional flood irrigation is not at a unified time, three irrigation periods before, during, and after irrigation are selected for comparison in different irrigation periods, and daily evapotranspiration of 5 days is selected for average in each period. Three irrigation processes were selected, including the first irrigation from 22 March to 26 March (before irrigation), 27 March to 31 March (in irrigation), and 1 April to 4 April (after irrigation). The second irrigation took place from 30 May to 3 June (before irrigation), 4 June to 8 June (in irrigation), and 9 June to 13 June (after irrigation), The third irrigation took place from 18 July to 22 July (before irrigation), 23 July to 27 July (in irrigation), and 28 July to 1 August (after irrigation). The result is shown in Figure 12.
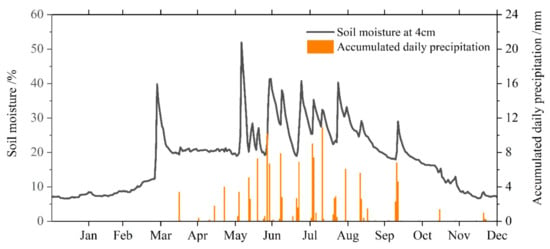
Figure 11.
Changes of soil moisture and daily accumulated rainfall at 4 cm at Daman Station in 2014.
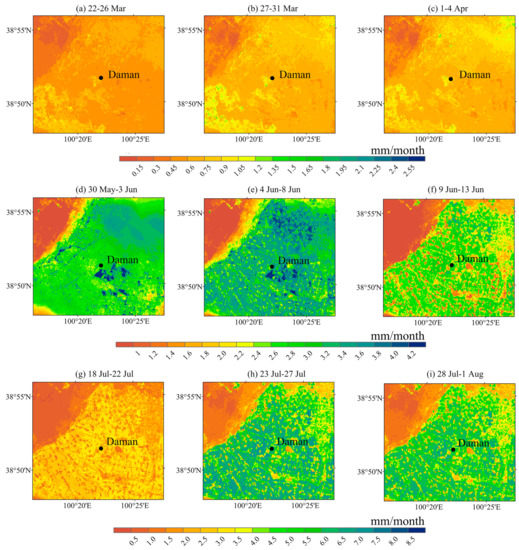
Figure 12.
Variations of evapotranspiration in Daman Station during different irrigation periods from 22 March to 4 April 2014 (The average daily evapotranspiration of 5 days is shown in each chart).
As can be seen from Figure 12a–c, in the early irrigation period, the overall evapotranspiration in the surrounding area of Daman station was weak, with a value of 0.3~0.75 mm/day. During the irrigation period, evapotranspiration increased significantly, with an increased rate of about 0.35 mm/day. After irrigation, some evapotranspiration values weakened slightly, decreasing by about 0.15 mm/day. Since it has not reached the vigorous growth season of crops in March and April, and the temperature is low, the overall evapotranspiration is weak, and the sudden increase of soil moisture causes no obvious increase in regional evapotranspiration.
It can be seen from Figure 12d–f, that the evapotranspiration value of the farmland area is significantly different from that of the bare land area. In the early stage of irrigation, the average daily evapotranspiration of farmland can reach 2.6~3.6 mm/day. In the middle stage of irrigation, the evapotranspiration of farmland increased significantly, while that of bare land remained unchanged, and the evapotranspiration of farmland increased up to 0.6 mm/day. At the later stage of irrigation, evapotranspiration of farmland decreased to a smaller value than that before irrigation, with a decrease of about 0.8 mm/day. At this time, soil moisture still maintained a high value, but evapotranspiration had a significant decline, indicating that evapotranspiration was also affected by other climate factors.
As can be seen from Figure 12g–i, the evapotranspiration of farmland in the early stage of irrigation was small, between 2.5~3.5 mm/day. With the progress of irrigation, evapotranspiration increased significantly, with an increase of up to 4 mm/day. In the late stage of irrigation, evapotranspiration decreased only slightly and was still 3.5 mm/day higher than before irrigation. In July, the shallow soil moisture at Daman station showed a zigzag change, indicating that there were multiple irrigation processes, and the irrigation frequency was high for less than 5 days. Therefore, after the first irrigation, the average daily evapotranspiration in the later irrigation period will not decrease too much.
3.5. Effects of Urban Expansion on Regional Evapotranspiration
The oasis city is the center of production and life in an arid area, and also the most sensitive area in the human–land relationship, as shown in Table 5. According to previous studies, urban land in Zhangye area has entered a period of rapid expansion since 2000, and it even became a type of high-speed expansion from 2006 to 2015, and the degree of urbanization expansion is gradually intensifying.

Table 5.
The change of urban land expansion time sequence in different periods in Zhangye.
Zhangye town is mainly located in the region of 100°25′E~100°30′E, 38°55′N~39°00′N. The expansion direction of Zhangye town is northeast and northwest. From 2006 to 2015, it mainly expanded to the northwest, presenting a shape similar to “✓” after expansion. The annual evapotranspiration of urban areas in 2010 and 2016 is shown in Figure 13, where the black box represents the old city, and the red box represents the urban expansion area. It can be seen from Figure 13, that the evapotranspiration in urban areas is much smaller than that in surrounding oasis areas. Compared with 2010 and 2016, the evapotranspiration intensity in old urban areas is smaller in 2010, only 350~530 mm/year, while it is slightly larger in 2016, up to 470~590 mm/year. In combination with the areas of urban expansion from 2006 to 2015, evapotranspiration decreased, especially in the towns expanding on the left.
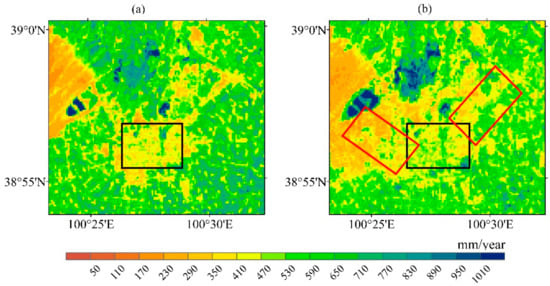
Figure 13.
Comparison of annual evapotranspiration in urban areas of Zhangye in 2010 and 2016 (the black border represents the old urban area and the red border represents the expanded urban area). (a) 2010; (b) 2016.
Comparative analysis was made on the variation degree of evapotranspiration of urban expansion in different seasons in 2010 and 2016, and the results are shown in Figure 14. As can be seen from Figure 14, in January, the evapotranspiration in the cities in 2010 was higher than that in the surrounding areas, with a value between 3.5~4.5 mm/month. The overall evapotranspiration difference between 2016 and 2010 was large, and the expanded towns had no obvious urban boundaries. Contrary to the situation in January, the evapotranspiration in April 2010 was lower than that in 2016, and it was 20 mm/month lower in urban and wetland areas than that in 2016. When the overall evapotranspiration was larger in 2016, the urban expansion area on the west side decreased slightly com-pared with that in 2010, with a size of about 5 mm/month. Evapotranspiration is strongest in July, and there are obvious boundaries between different underlying surfaces. Evapotranspiration is largest in wetland and farmland, followed by urban, desert, and bare land. Compared with 2010 and 2016, the overall evapotranspiration intensity was similar, and the difference was mainly reflected in urban expansion. The evapotranspiration intensity of the expanding towns in the northeast direction decreased slightly, with a decreased value of about 50 mm/month. The variation of evapotranspiration intensity in the northwest expanding towns was significantly different, and it decreased by about 110 mm/month compared with 2010. The evapotranspiration intensity was close to desert and smaller than the old urban area. The situation in October was contrary to that in April. The overall evapotranspiration in 2010 was higher than that in 2016, and the difference of evapotranspiration in urbanization expansion areas was more obvious. The overall evapotranspiration intensity in 2016 was less than that in 2010, and the evapotranspiration intensity in the old urban area was similar. In 2010, there was a small difference in evapotranspiration intensity between the town and its surrounding areas, while in 2016, there was an obvious difference between the old city and the expanded part of the town.
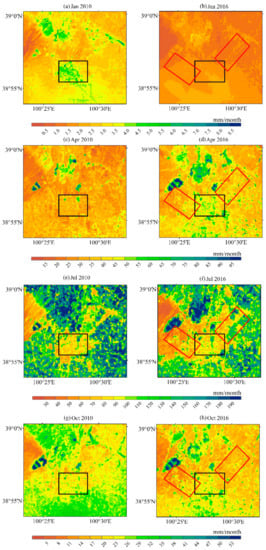
Figure 14.
Comparison of monthly evapotranspiration in urban areas of Zhangye in January 2010 and January 2016.
Considering the evapotranspiration in urban areas in different months in 2010 and 2016, the difference between small evapotranspiration in urban areas and surrounding oases is particularly obvious in the period of high evapotranspiration. With the expansion of cities and towns, the overall regional evapotranspiration will also weaken. The expansion of the town in the northwest direction is more obvious, and it also has an impact on the intensity of evapotranspiration in the surrounding wetlands.
In Figure 15, the black box represents the old urban area and the blue box represents the expansion area. It can be seen that the expansion of cities and towns will inevitably lead to the decline of NDVI value. Combined with the influence of urbanization expansion on evapotranspiration above, it can be seen that the more obvious the expansion is, the greater the decline of NDVI value will be. The NDVI value of the expanding towns in the northwest decreased from 0.425 in 2011 to 0.225 in 2014, and the NDVI value of the expanding towns in the northeast decreased from 0.3 in 2011 to 0.225 in 2014. Along with the process of urbanization, changes caused by urbanization issues such as land cover, climate and human disturbance have an important impact on the structure and function of the terrestrial ecosystem and regional climate. As a major component of the terrestrial ecosystem, vegetation is the basic condition for the existence of terrestrial ecosystem. Rapid urban development will have a huge impact on the oasis ecosystem. Quantitative assessment of the impact of urban expansion by means of evapotranspiration analysis and NDVI is of certain research significance for the long-term development of oases.
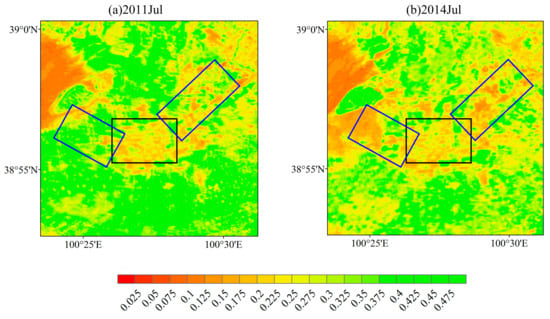
Figure 15.
Compare the NDVI values of 2011 and 2014 in urban expansion areas in July.
4. Conclusions
In this study, the spatial-temporal characteristics of evapotranspiration in oases of different scales were compared by using remote sensing data, the influence of irrigation on regional evapotranspiration was analyzed, and the influence of urbanization expansion on evapotranspiration in oases was discussed. The conclusions are as follows:
- (1)
- The evapotranspiration intensity of oases at different scales in the Heihe River basin had no significant interannual change. The average evapotranspiration intensity of Zhangye Oasis was up to 650 mm/year due to the abundance of farmland and wetland, and the overall evapotranspiration intensity was the highest in 2012 and 2015. The annual evapotranspiration intensity of Jinta Oasis was up to 580 mm/year and began to decrease slightly after 2012. The evapotranspiration intensity of Ejina Oasis was the lowest, which was up to 440 mm/year, and began to increase significantly after 2014.
- (2)
- In Zhangye Oasis, the peak of evapotranspiration in the oasis appears in July, and irrigation is the main factor causing the change in soil moisture. The obvious increase in soil moisture leads to a rapid increase in evapotranspiration, with a maximum value of 4 mm/day. After the end of irrigation, evapotranspiration decreases, to a certain extent. The evapotranspiration intensity did not decrease obviously after continuous irrigation.
- (3)
- The evapotranspiration intensity in urban areas did not change much with the season, and the intensity was smaller than that in oasis areas. The maximum difference was up to 120 mm/month in the peak period of evapotranspiration. With the urbanization expansion, regional evapotranspiration would be weakened. The urbanization expansion in the northwest direction is more obvious, and it also has an impact on the intensity of evapotranspiration in the surrounding wetlands.
For these data, the outcome of HiTLL ET may be affected due to the uncertainties associated with the use of meteorological forcing data and remote sensing data. The crop growth does not necessarily conform to a simple linear rule; it may cause errors in the linear interpolation of clear-sky ET values to continuous daily ET [46]. In addition, the ET of some underlying surfaces is underestimated (such as maize, vegetables, and orchards), which may be due to inappropriate model assumptions [53], uncertainties associated with model inputs and parameterizations [54] or EC measurements [55], time upscaling [56,57,58,59,60], or a mismatch in the spatial scales between estimated ET and EC measurements [61]. The HiTLL data in this study was used to analyze the differences of evapotranspiration in different oases. From the results of validation with the in-situ data, the HiTLL can accurately reflect the difference of evapotranspiration on different underlying surfaces. Due to the limited number of sites selected, and the observation value of a single site only representing the underlying surface of a certain area to a certain extent, the regional comparison between the actual value and the remote sensing value is not clear. On the other hand, in the peak season of crop growth, although irrigation activities are reflected in the remote sensing values, there is still a large difference between the observation values and the sites. Future work will focus on fusing retrieved LSTs with satellite passive microwave remote sensing data to improve the accuracy of the HiTLL ET estimations on cloudy days, and considering the influence of human activities such as irrigation, a more refined parametric scheme should be selected for estimation.
Author Contributions
Conceptualization, Y.W. and Y.A.; Validation, Z.L.; Formal analysis, Y.W. and Z.L.; Data curation, Y.W.; Supervision, Y.A. All authors have read and agreed to the published version of the manuscript.
Funding
This research was funded by the National Natural Science Foundations of China (41975014, 41675020, 42075089), the Science and Technology Research Plan of Gansu Province (22JR5RA048), the Youth Innovation Promotion Association CAS (QCH2019004).
Data Availability Statement
Not applicable.
Acknowledgments
The authors would like to acknowledge the data provided by the National Qinghai-Tibet Plateau Scientific Data Center. We also greatly acknowledge the computing resources and time at the Supercomputing Center, Northwest Institute of Eco-Environment and Resources, Chinese Academy of Sciences.
Conflicts of Interest
The authors declare no conflict of interest.
References
- Liu, C.; Liu, B.; Zhao, W.; Zhu, Z. Temporal and spatial variability of water use efficiency of vegetation and its response to precipitation and temperature in Heihe River Basin. Acta Ecol. Sin. 2020, 40, 888–899. [Google Scholar]
- Li, X.; Cheng, G.; Liu, S.; Xiao, Q.; Ma, M.; Jin, R.; Che, T.; Liu, Q.; Wang, W.; Qi, Y.; et al. Heihe Watershed Allied Telemetry Experimental Research (HiWATER): Scientific Objectives and Experimental Design. Bull. Am. Meteorol. Soc. 2013, 94, 1145–1160. [Google Scholar] [CrossRef]
- Gong, J.; Xie, Y.; Jia, Z.; Qian, D. Recent progress in land use and cover change in Heihe River Basin. J. Lanzhou University. Nat. Sci. 2014, 50, 390–397, 404. [Google Scholar]
- Qiang, Z.; Yinjiao, H. Oasis Effect in Arid Regions. Ziran Zazhi 2001, 23, 234–236, (In Chinese with English abstract). [Google Scholar] [CrossRef]
- Li, X.; Yu, D. Progress on Evapotranspiration Estimation Methods and Driving Forces in Arid and Semiarid Regions. Arid Zone Res. 2020, 37, 26–36. [Google Scholar]
- Hui, Z. Ecological Security Evaluation and Prediction of Zhangye Oasis. J. Lanzhou Univ. Arts Sci. (Nat. Sci. Ed.) 2019, 33, 57–64, (In Chinese with English abstract). [Google Scholar]
- Huiping, D.; Shanzhong, Q. Study on land use dynamic change of Arid inland River Oasis: A case study of Jinta Oasis. J. Anhui Agric. Sci. 2009, 37, 1656–1658, (In Chinese with English abstract). [Google Scholar]
- Ran, Y.; Li, X.; Sun, R.; Kljun, N.; Zhang, L.; Wang, X.; Zhu, G. Spatial representativeness and uncertainty of eddy covariance carbon flux measurements for upscaling net ecosystem productivity to the grid scale. Agric. For. Meteorol. 2016, 230, 114–127. [Google Scholar] [CrossRef]
- Jin, R.; Li, X.; Liu, S.M. Understanding the Heterogeneity of Soil Moisture and Evapotranspiration Using Multiscale Observations From Satellites, Airborne Sensors, and a Ground-Based Observation Matrix. IEEE Geosci. Remote Sens. Lett. 2017, 14, 2132–2136. [Google Scholar] [CrossRef]
- Bastiaanssen, W.G.M.; Noordman, E.J.M.; Pelgrum, H.; Davids, G.; Thoreson, B.P.; Allen, R.G. SEBAL model with remotely sensed data to improve water-resources management under actual field conditions. J. Irrig. Drain. Eng. 2005, 131, 85–93. [Google Scholar] [CrossRef]
- Liu, S.; Xu, Z.; Song, L.; Zhao, Q.; Ge, Y.; Xu, T.; Ma, Y.; Zhu, Z.; Jia, Z.; Zhang, F. Upscaling evapotranspiration measurements from multi-site to the satellite pixel scale over heterogeneous land surfaces. Agric. For. Meteorol. 2016, 230, 97–113. [Google Scholar] [CrossRef]
- Xu, F.; Wang, W.; Wang, J.; Xu, Z.; Qi, Y.; Wu, Y. Area-averaged evapotranspiration over a heterogeneous land surface: Aggregation of multi-point EC flux measurements with a high-resolution land-cover map and footprint analysis. Hydrol. Earth Syst. Sci. 2017, 21, 4037–4051. [Google Scholar] [CrossRef]
- Srivastava, A.; Sahoo, B.; Raghuwanshi, N.S.; Singh, R. Evaluation of Variable-Infiltration Capacity Model and MODIS-Terra Satellite-Derived Grid-Scale Evapotranspiration Estimates in a River Basin with Tropical Monsoon-Type Climatology. J. Irrig. Drain. Eng. 2017, 143. [Google Scholar] [CrossRef]
- Li, X.; Liu, S.; Li, H.; Ma, Y.; Wang, J.; Zhang, Y.; Xu, Z.; Xu, T.; Song, L.; Yang, X.; et al. Intercomparison of Six Upscaling Evapotranspiration Methods: From Site to the Satellite Pixel. J. Geophys. Res.-Atmos. 2018, 123, 6777–6803. [Google Scholar] [CrossRef]
- Grant, R.H. Microclimate: The Biological Environment, 2nd ed.; Rosenberg, N., Blad, B., Verma, S., Eds.; John Wiley & Sons: Hoboken, NJ, USA, 1984; Volume 82, pp. 562–563. [Google Scholar]
- Brown, K.W.; Rosenberg, N.J. Resistance model to predict evapotranspiration and its application to a sugar-beet field. Agron. J. 1973, 65, 341–347. [Google Scholar] [CrossRef]
- Zhang, B.; Xu, D.; Liu, Y.; Chen, H. Review of multi-scale evapotranspiration estimation and spatio-temporal scale expansion. Trans. Chin. Soc. Agric. Eng. 2015, 31, 8–16. [Google Scholar]
- Yongmin, Y.; Zhaodong, F.; Jian, Z. Evapotranspiration in Heihe River Basin based on SEBS model. J. Lanzhou Univ. Nat. Sci. 2008, 44, 1–6. [Google Scholar]
- Meng, X.; Lue, S.; Zhang, T.; Guo, J.; Gao, Y.; Bao, Y.; Wen, L.; Luo, S.; Liu, Y. Numerical simulations of the atmospheric and land conditions over the Jinta oasis in northwestern China with satellite-derived land surface parameters. J. Geophys. Res.-Atmos. 2009, 114. [Google Scholar] [CrossRef]
- Meng, X.; Lu, S.; Gao, Y.; Guo, J. Simulated effects of soil moisture on oasis self-maintenance in a surrounding desert environment in Northwest China. Int. J. Climatol. 2015, 35, 4116–4125. [Google Scholar] [CrossRef]
- Rahimi, S.; Sefidkouhi, M.A.G.; Raeini-Sarjaz, M.; Valipour, M. Estimation of actual evapotranspiration by using MODIS images (a case study: Tajan catchment). Arch. Agron. Soil Sci. 2015, 61, 695–709. [Google Scholar] [CrossRef]
- Lian, J.; Huang, M. Evapotranspiration Estimation for an Oasis Area in the Heihe River Basin Using Landsat-8 Images and the METRIC Model. Water Resour. Manag. 2015, 29, 5157–5170. [Google Scholar] [CrossRef]
- Kang, S.Z.; Shi, W.J.; Zhang, J.H. An improved water-use efficiency for maize grown under regulated deficit irrigation. Field Crops Res. 2000, 67, 207–214. [Google Scholar] [CrossRef]
- Ge, Y.; Li, X.; Huang, C.; Nan, Z. A Decision Support System for irrigation water allocation along the middle reaches of the Heihe River Basin, Northwest China. Environ. Model. Softw. 2013, 47, 182–192. [Google Scholar] [CrossRef]
- Wu, L.; Zuo, H.; Feng, J. Numerical simulation of the impacts of groundwater irrigation over the North China Plain on regional climate. Acta Meteorol. Sin. 2018, 76, 635–648. [Google Scholar]
- Luo, S.; Chen, S.; Lv, S. Sensitivity Test of Oasis Boundary Layer Characteristic under Different Soil Moisture. Plateau Meteorol. 2005, 24, 470–477. [Google Scholar]
- Wen, L.; Shihua, L.; Xianhong, M.; Heng, M.A. Numerical Simulation of the Climate Effect on Town in Oasis. Clim. Environ. Res. 2009, 14, 105–112. [Google Scholar]
- Li, H.; Zhang, Q.; Shi, J.; Zhao, J.; Wang, S. A study of the parameterization of land-surface processes over the natural vegetation surface of Loess Plateau. Acta Meteorol. Sin. 2012, 70, 1137–1148. [Google Scholar]
- Singh, R.K.; Senay, G.B.; Velpuri, N.M.; Bohms, S.; Verdin, J.P. On the Downscaling of Actual Evapotranspiration Maps Based on Combination of MODIS and Landsat-Based Actual Evapotranspiration Estimates. Remote Sens. 2014, 6, 10483–10509. [Google Scholar] [CrossRef]
- Hong, Q. Simulating the Effects of Land Use Change on the Evapotranspiration in the Process of Urbanization. Master’s Thesis, Nanjing University of Information Science and Technology, Nanjing, China, 2015. [Google Scholar]
- Liu, S.; Li, X.; Xu, Z.; Che, T.; Xiao, Q.; Ma, M.; Liu, Q.; Jin, R.; Guo, J.; Wang, L.; et al. The Heihe Integrated Observatory Network: A Basin-Scale Land Surface Processes Observatory in China. Vadose Zone J. 2018, 17, 1–21. [Google Scholar] [CrossRef]
- Liu, S.M.; Xu, Z.W.; Wang, W.Z.; Jia, Z.Z.; Zhu, M.J.; Bai, J.; Wang, J.M. A comparison of eddy-covariance and large aperture scintillometer measurements with respect to the energy balance closure problem. Hydrol. Earth Syst. Sci. 2011, 15, 1291–1306. [Google Scholar] [CrossRef]
- Zeng, Y.; Li, J.; Liu, Q.; Huete, A.R.; Xu, B.; Yin, G.; Zhao, J.; Yang, L.; Fan, W.; Wu, S.; et al. An Iterative BRDF/NDVI Inversion Algorithm Based on A Posteriori Variance Estimation of Observation Errors. Ieee Trans. Geosci. Remote Sens. 2016, 54, 6481–6496. [Google Scholar] [CrossRef]
- Li, X.; Liu, S.; Xiao, Q.; Ma, M.; Jin, R.; Che, T.; Wang, W.; Hu, X.; Xu, Z.; Wen, J.; et al. A multiscale dataset for understanding complex eco-hydrological processes in a heterogeneous oasis system. Sci. Data 2017, 4, 170083. [Google Scholar] [CrossRef]
- Zhong, B.; Ma, P.; Nie, A.; Yang, A.; Yao, Y.; Lu, W.; Zhang, H.; Liu, Q. Land cover mapping using time series HJ-1/CCD data. Sci. China-Earth Sci. 2014, 57, 1790–1799. [Google Scholar] [CrossRef]
- Ma, Y.; Liu, S. High-Temporal and Landsat-Like Surface Evapotranspiration in Heihe River Basin (2010–2016) (HiTLL ET V1.0). 2020. Available online: http://poles.tpdc.ac.cn/en/data/118dfdff-c07d-449a-8947-8a2a19d768b0/ (accessed on 8 December 2022). [CrossRef]
- Bernstein, L.S.; Jin, X.; Gregor, B.; Adler-Golden, S.M. Quick atmospheric correction code: Algorithm description and recent upgrades. Opt. Eng. 2012, 51, 111719. [Google Scholar] [CrossRef]
- Barsi, J.A.; Schott, J.R.; Palluconi, F.D.; Hook, S.J. Validation of a web-based atmospheric correction tool for single thermal band instruments. Proc. SPIE-Int. Soc. Opt. Eng. 2005, 5882, 136–142. [Google Scholar]
- Pan, X.; Li, X.; Shi, X.; Han, X.; Luo, L.; Wang, L. Dynamic downscaling of near-surface air temperature at the basin scale using WRF-a case study in the Heihe River Basin, China. Front. Earth Sci. 2012, 6, 314–323. [Google Scholar] [CrossRef]
- Redelsperger, J.-L.; Thorncroft, C.D.; Diedhiou, A.; Lebel, T.; Parker, D.J.; Polcher, J. African monsoon multidisciplinary analysis—An international research project and field campaign. Bull. Am. Meteorol. Soc. 2006, 87, 1739. [Google Scholar] [CrossRef]
- Kang, J.; Jin, R.; Li, X. Regression Kriging-Based Upscaling of Soil Moisture Measurements From a Wireless Sensor Network and Multiresource Remote Sensing Information Over Heterogeneous Cropland. IEEE Geosci. Remote Sens. Lett. 2015, 12, 92–96. [Google Scholar] [CrossRef]
- Jackson, R.D.; Hatfield, J.L.; Reginato, R.J.; Idso, S.B.; Pinter, P.J. Estimation of daily evapo-transpiration from one time-of-day measurements. Agric. Water Manag. 1983, 7, 351–362. [Google Scholar] [CrossRef]
- Yang, G.; Weng, Q.; Pu, R.; Gao, F.; Sun, C.; Li, H.; Zhao, C. Evaluation of ASTER-Like Daily Land Surface Temperature by Fusing ASTER and MODIS Data during the HiWATER-MUSOEXE. Remote Sens. 2016, 8, 75. [Google Scholar] [CrossRef]
- Xu, T.; Liu, S.; Xu, L.; Chen, Y.; Jia, Z.; Xu, Z.; Nielson, J. Temporal Upscaling and Reconstruction of Thermal Remotely Sensed Instantaneous Evapotranspiration. Remote Sens. 2015, 7, 3400–3425. [Google Scholar] [CrossRef]
- McVicar, T.R.; Van Niel, T.G.; Li, L.; Hutchinson, M.F.; Mu, X.; Liu, Z. Spatially distributing monthly reference evapotranspiration and pan evaporation considering topographic influences. J. Hydrol. 2007, 338, 196–220. [Google Scholar] [CrossRef]
- Ma, Y.; Liu, S.; Song, L.; Xu, Z.; Liu, Y.; Xu, T.; Zhu, Z. Estimation of daily evapotranspiration and irrigation water efficiency at a Landsat-like scale for an arid irrigation area using multi-source remote sensing data. Remote Sens. Environ. 2018, 216, 715–734. [Google Scholar] [CrossRef]
- Mu, Q.; Zhao, M.; Running, S.W. Improvements to a MODIS global terrestrial evapotranspiration algorithm. Remote Sens. Environ. 2011, 115, 1781–1800. [Google Scholar] [CrossRef]
- Cui, Y.; Jia, L. A Modified Gash Model for Estimating Rainfall Interception Loss of Forest Using Remote Sensing Observations at Regional Scale. Water 2014, 6, 993–1012. [Google Scholar] [CrossRef]
- Wu, B.; Yan, N.; Xiong, J.; Bastiaanssen, W.G.M.; Zhu, W.; Stein, A. Validation of ETWatch using field measurements at diverse landscapes: A case study in Hai Basin of China. J. Hydrol. 2012, 436, 67–80. [Google Scholar] [CrossRef]
- Zhou, Y.; Zhou, J.; Li, Y.; Wang, X. Simulating the evapotranspiration with SEBAL and Modified SEBAL (M-SEBAL) models over the desert and oasis of the middle reaches of the Heihe River. J. Glaciol. Geocryol. 2014, 36, 1526–1537. [Google Scholar]
- Zhao, L.; Ji, X. Quantification of Transpiration and Evaporation over Agricultural Field Using the FAO-56 Dual Crop Coefficient Approach—A Case Study of the Maize Field in an Oasis in the Middlestream of the Heihe River Basin in Northwest China. Sci. Agric. Sin. 2010, 43, 4016–4026. [Google Scholar]
- Brutsaert, W. Aspects of bulk atmospheric boundary layer similarity under free-convective conditions. Rev. Geophys. 1999, 37, 439–451. [Google Scholar] [CrossRef]
- Timmermans, J.; Su, Z.; van der Tol, C.; Verhoef, A.; Verhoef, W. Quantifying the uncertainty in estimates of surface-atmosphere fluxes through joint evaluation of the SEBS and SCOPE models. Hydrol. Earth Syst. Sci. 2013, 17, 1561–1573. [Google Scholar] [CrossRef]
- Kustas, W.P.; Nieto, H.; Morillas, L.; Anderson, M.C.; Alfieri, J.G.; Hipps, L.E.; Villagarcia, L.; Domingo, F.; Garcia, M. Revisiting the paper “Using radiometric surface temperature for surface energy flux estimation in Mediterranean drylands from a two-source perspective”. Remote Sens. Environ. 2016, 184, 645–653. [Google Scholar] [CrossRef]
- Cheng, Y.; Sayde, C.; Li, Q.; Basara, J.; Selker, J.; Tanner, E.; Gentine, P. Failure of Taylor’s hypothesis in the atmospheric surface layer and its correction for eddy-covariance measurements. Geophys. Res. Lett. 2017, 44, 4287–4295. [Google Scholar] [CrossRef]
- Van Niel, T.G.; McVicar, T.R.; Roderick, M.L.; van Dijk, A.I.J.M.; Renzullo, L.J.; van Gorsel, E. Correcting for systematic error in satellite-derived latent heat flux due to assumptions in temporal scaling: Assessment from flux tower observations. J. Hydrol. 2011, 409, 140–148. [Google Scholar] [CrossRef]
- Van Niel, T.G.; McVicar, T.R.; Roderick, M.L.; van Dijk, A.I.J.M.; Beringer, J.; Hutley, L.B.; van Gorsel, E. Upscaling latent heat flux for thermal remote sensing studies: Comparison of alternative approaches and correction of bias. J. Hydrol. 2012, 468, 35–46. [Google Scholar] [CrossRef]
- Ryu, Y.; Baldocchi, D.D.; Black, T.A.; Detto, M.; Law, B.E.; Leuning, R.; Miyata, A.; Reichstein, M.; Vargas, R.; Ammann, C.; et al. On the temporal upscaling of evapotranspiration from instantaneous remote sensing measurements to 8-day mean daily-sums. Agric. For. Meteorol. 2012, 152, 212–222. [Google Scholar] [CrossRef]
- Cammalleri, C.; Anderson, M.C.; Kustas, A.P. Upscaling of evapotranspiration fluxes from instantaneous to daytime scales for thermal remote sensing applications. Hydrol. Earth Syst. Sci. 2014, 18, 1885–1894. [Google Scholar] [CrossRef]
- Cammalleri, C.; Anderson, M.C.; Gao, F.; Hain, C.R.; Kustas, W.P. Mapping daily evapotranspiration at field scales over rainfed and irrigated agricultural areas using remote sensing data fusion. Agric. For. Meteorol. 2014, 186, 1–11. [Google Scholar] [CrossRef]
- Jia, Z.; Liu, S.; Xu, Z.; Chen, Y.; Zhu, M. Validation of remotely sensed evapotranspiration over the Hai River Basin, China. J. Geophys. Res.-Atmos. 2012, 117. [Google Scholar] [CrossRef]
Publisher’s Note: MDPI stays neutral with regard to jurisdictional claims in published maps and institutional affiliations. |
© 2022 by the authors. Licensee MDPI, Basel, Switzerland. This article is an open access article distributed under the terms and conditions of the Creative Commons Attribution (CC BY) license (https://creativecommons.org/licenses/by/4.0/).