Abstract
We employed ascending and descending Sentinel-1A, optical image data, and field investigation methods to identify and monitor landslides in the Jinsha River Basin to overcome the difficulties associated with the use of a single method and its inaccuracies in identifying landslides in the alpine and canyon areas. Using distributed scatterer-synthetic aperture radar interferometry (DS-InSAR), Sentinel-1A ascending and descending data were integrated to obtain surface deformation information within the study area from July 2017 to May 2019. Thereafter, high-resolution optical image data were introduced to interpret landslides, and field investigations were conducted to validate landslides. These combined methods enabled the assessment of spatiotemporal evolutionary characteristics, and their accuracy in identifying typical landslides was verified. The results showed that the use of both ascending and descending data effectively avoided certain problems, such as the inability to identify certain landslide hazards or the retrieval of incomplete identification results due to geometric distortion associated with single-track SAR imaging. The combined use of these methods effectively improves the timeliness and verification of the accuracy of landslides. Fifteen landslides were identified in the study area, which had different degrees of tension cracks, vertical dislocations, and slip marks that were verified in the field. Of these, two landslides show serious deformation characteristics that currently pose a serious threat to lives and infrastructure. Follow-up monitoring of these landslides is essential. These findings will assist in obtaining comprehensive information about the distribution of landslides and their deformation developmental trends in the Ahai Reservoir area of the Jinsha River Basin and show that the combined methods can be employed to prevent and control landslides in this area.
1. Introduction
Landslides are common geological disasters that can result in heavy losses to human life and infrastructure [1,2]. Landslides are generally concealed prior to a disaster occurring, and they can occur swiftly and without warning. Landslide activities exist to different degrees in various countries, such as within America, Italy, India, Spain, Tajikistan, Kyrgyzstan, and Austria [3,4,5,6,7,8,9], and a large number of potential landslides occur in high and remote areas in southwest China, and often within canyons formed by deep rivers [10]. Instability can trigger landslides that block rivers and form a series of disasters [11] that not only cause damage to the area in which the landslide occurs but also seriously threaten the safety of residents and infrastructure upstream and downstream of the event. The Jinsha River is the third longest river in the world [12], and it flows through different topographical and geological structures, and the meteorology changes along its length. The river flows within deep canyon areas and plateaus [13,14], and the maximum height difference between canyons ranges from 2000–3000 m. The river valley is deeply incised, and the slopes of both banks are steep; it can thus easily become unstable under the actions of unloading, gravity, rainfall, and river erosion due to the influences of various factors, such as topography, stratum lithology, and geological structures [15,16]. In addition, the impoundment of reservoirs in canyons can aggravate the destruction of bank slopes [17,18]. The Jinsha River confluence area has a broken structure, weak rock formations, and frequent geological disasters in ultra-high locations. The investigation and monitoring of large-scale landslides in this area are of great significance for disaster mitigation and prevention [19].
Landslide identification and monitoring are important research directions for landslide analysis [20]. Traditional monitoring methods, such as GPS, level measurements, and other techniques, are effective in monitoring known landslides within a small area, but they have obvious limitations, such as low spatial resolution, the need for on-site measurements, and the inability to identify some high and hidden landslides, and they are extremely difficult to identify large-scale landslides. The field investigation method is inefficient, costly, and difficult to reach by manpower in high mountain and canyon areas, which have great terrain restrictions. However, the development of high-precision earth observation technology, especially the emergence and popularization of technologies, such as optical remote sensing, radar remote sensing, and light detection and ranging (LiDAR) [21], which are based on multi-platform, multi-technology, and multi-source data integration, provides outstanding advantages in the identification and monitoring of landslides [22].
Optical remote sensing images have wide coverage and high resolution, and they provide rich image information that can show certain morphological features, the geological environment, and bearing bodies that potentially relate to landslide development. Such images can also be used to identify any changes in landslides that occur over a wide range. Not only do they enable detection, but retrospective deformation history can also be obtained, and risk assessments made [23]. However, reliance on the interpretation of optical image data alone cannot enable the identification of potential landslide hazards because although they show slow deformation phenomena that have a high probability of landslides being related to landslides under the action of external factors, it is difficult to determine obvious sliding signs on optical images. In addition, optical remote sensing is limited by the cloudy and rainy climate characteristics in most parts of China, so it can’t be acquired in real time.
As a new type of earth observation technology, interferometric synthetic aperture radar (InSAR) technology provides observations throughout the day under all weather, and it can penetrate clouds and rain [24,25,26]. In recent years, InSAR technology has been applied to identify and monitor landslides [20]. Compared with conventional geodetic techniques, such as GPS and leveling, InSAR technology is more capable of obtaining large-scale surface deformation time series with significantly improved spatial resolution and at markedly shorter time intervals [27,28]. In addition to the development of InSAR technology, many advanced timing InSAR processing methods and other improved methods continue to emerge, such as permanent scatterer (PS-InSAR) technology [29,30], small baseline subset (SBAS-InSAR) technology [31,32], Phase-Decomposition-Based PSInSAR (PD-PSInSAR) technology [33], and distributed scatterer (DS-InSAR) technology [34,35]. The advent of these technologies has made it possible to monitor surface deformation on a large scale [32,36]. In addition, synthetic aperture radar images, such as those of Radarsat-2 [37], ALOS-PALSAR [38], TerraSAR-X [39], and Sentinel-1, are increasingly being used for landslide monitoring and analysis [40,41], and InSAR technology and SAR images have now been applied to landslide monitoring and analysis, and good results have been achieved. For example, Rosi et al. used the persistent scattering interferometry (PSI) technique to update the landslide inventory in the Tuscany region [42]. Zhang et al. used the Stacking-InSAR method to monitor landslides near a national highway in Wenchuan County, China. They compared the results obtained using Stacking-InSAR with those of the traditional SBAS-InSAR method and found that, although the two methods provided highly consistent results, Stacking-InSAR missed some active slopes with small displacement levels on small spatial scales under certain atmospheric influences, although it provided good performance in poorly coherent areas. It also has low technical requirements and the computational advantages of requiring minimal labor [43]. Yao et al. used a cross-comparison approach to study landslides along the Jinsha River in Gongjue County using the SBAS-InSAR (Small Baseline Subset InSAR) and PS-InSAR (Permanent Scatterer InSAR) techniques. A comparative analysis of the spatial complementarity and temporal deformation of disturbance points showed that InSAR refined its deformation characteristics, which verified the reliability of the InSAR results [44]. Furthermore, Jie et al. monitored and analyzed the Jiazhou landslide in Danba County, Southwest China, using the DS-InSAR technique, and compared the results to those obtained with PS-InSAR and SBAS-InSAR. The results showed that the use of the DS-InSAR technique enabled a higher density of measurement points (MPs) to be obtained compared to the two other methods, particularly in non-urban areas and in areas with complex topographic environment conditions [45].
However, the InSAR technique is affected by terrain distortion (shadow, overlay, and foreshortening) in high mountain canyon areas, which prevents the acquisition of valid information in some areas. Besides these geometric distortions, land cover has a great influence on the applicability of differential radar interferometry [46]. Therefore, InSAR techniques need to be combined with other survey techniques and a priori information to enable better performance. In this respect, the study of Bozzano et al. combined InSAR techniques, aerial photographs, and geomorphological field survey results to evaluate and analyze landslide activity in central Italy [47]. Chen et al. combined MT-InSAR results with global navigation satellite system (GNSS), topographical information, terrestrial laser scanning (TLS), and terrestrial structure information, and the coupled GNSS, optical, and satellite image techniques provided strong support for landslide prediction, early warning, and post-crisis management [48]. Hu et al. combined the application of continuous Global Positioning System (GPS) data and spatially interferometric synthetic aperture radar data to reveal large landslide movement characteristics in the Columbia River Gorge (Washington State) [28]. In addition, Su et al. combined the SBAS-InSAR technique and optical imagery to identify, monitor, and analyze a widespread landslide in the Hunza valley in the northwestern Karakorum Mountains of northern Pakistan, and the applied method enabled a clear delineation of the landslide boundary [49]. The above studies show that the coupling of multiple monitoring methods is not only useful for improving the accuracy of identifying, monitoring, and analyzing landslides but can also contribute to gaining a comprehensive understanding of landslide movement characteristics.
Ahai Reservoir area in Jinsha River Basin is located in the deep mountain canyon area. Landslides will not only seriously affect the surrounding hydropower stations, but also threaten the safety of people’s lives and property. In the past, GPS technology was used to monitor a single landslide, which could not fully and dynamically understand large-scale landslide activities in this area. Therefore, we proposed a method that combined DS-InSAR, optical images, and field investigation to identify and monitor landslides in the Ahai Reservoir area of the Jinsha River Basin, with the aim of comprehensively understanding the landslide distribution and the deformation development trends in the area. In this respect, advanced DS-InSAR technology combined with Sentinel-1A ascending and descending data was used to obtain surface deformation information within the study area. High-resolution optical images were then introduced to conduct remote sensing interpretation of landslides, and the existence of landslides was confirmed through a field investigation. Typical landslides were then selected to analyze their spatiotemporal evolution characteristics. A quantitative analysis was subsequently conducted using GPS data, and corresponding suggestions were proposed. Compared with previous studies, the combined method proposed in this paper enabled the correct interpretation of InSAR results, and it also assisted in obtaining comprehensive information about landslides in a high mountain canyon area.
2. Study Area and Data
2.1. Study Area
An area measuring approximately 31 km and 14.5 km from north to south and east to west, respectively, was selected to identify, monitor, and analyze landslides. In Figure 1, the red area is the study area, the purple rectangular is the Sentinel-1 ascending coverage, the blue rectangular is the Sentinel-1 descending coverage, and the blue line is part of the Jinsha River basin. The study area is located in the middle of the Hengduan Mountains in northwest China, where the terrain is highest in the northwest and lowest in the southeast (highest and lowest elevations of 4184 m and 1402 m, respectively). The mountains and valleys in the area are narrow, the ravines are interlaced, and the Jinsha River valley is deeply incised [50]. The large differences in the height of the terrain and the steep mountains provide ideal conditions for the occurrence of landslides in the area. The Liyuan and Ahai Hydropower Stations are located in the upper and lower reaches of the Jinsha River Basin above and below the study area, respectively (as shown in Figure 1), and any landslides occurring in the study area potentially threaten the safe operation of these hydropower stations.
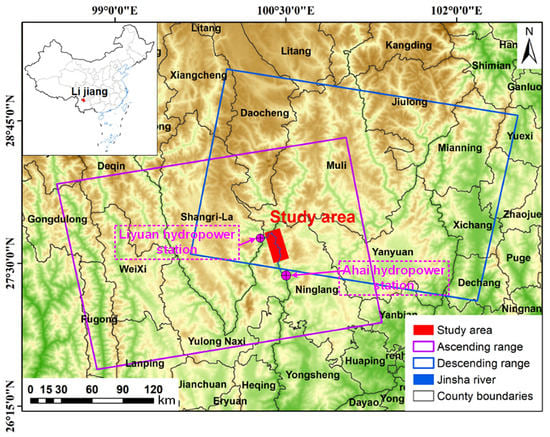
Figure 1.
Location of study area and regions of Sentinel-1A data coverage.
The study area is located in the Xianshui River-Eastern Yunnan seismic zone, which has historically been influenced by strong activity within the western strata [51], and both folding and faulting are well developed. The bedrock of the Neoproterozoic to Mesozoic Lower Upper Cretaceous system, the lower bedrock of the Mesozoic Upper Cretaceous system, and Quaternary sediments of the Cenozoic are distributed within the study area, and the latter are mainly found in valleys and areas with gentle slopes [13,52]. The soil within the study area mainly comprises gravelly clay, crushed gravel, chalky sand, and chalky clay mixed with lumps and boulders. The blockstone is composed of basalt, and the surface has been weathered; it is of low strength, poorly formed, and is easily softened by water.
Figure 2 shows the slopes and aspect maps of the study areas. The slope gradient in the study area ranged between 0° and 72.8° (Figure 2a). However, most of the slopes on both sides of the Jinsha River Basin have gradients of more than 30°, and the gradients lower than 30° in a few areas are highlighted by the black dotted line ranges in the figure. The slopes are roughly classified as lying to the north, northeast, east, southeast, south, southwest, west, and northwest (Figure 2b). The slopes on the right bank of the Jinsha River Basin mainly lean to the south, southwest, west, and northwest. The overall slope aspect of the landslide body is east–west, and the terrain is complex. Sentinel-1A is right-view imaging above the study area. However, when the angle between the line of sight and the slope and aspect of the landslide body is relatively small, deformation features of the detected surface are distorted, and large errors are produced; therefore, both ascending and descending orbit images were used to obtain deformation information on the right and left banks of the Jinsha River Basin, respectively. These images provided an increased angle between the line of sight and the slope of the landslide, which ensured that both banks of the Jinsha River Basin were visualized at a relatively high level.
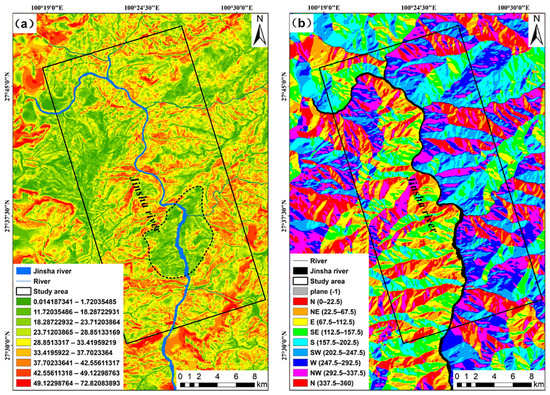
Figure 2.
Slope and aspect maps of the study area: (a) slope and (b) aspect.
The study area has a complex geological structure, and the region is generally dominated by fault structures (Figure 3a), which results in harsh terrain with well-developed mountains and vertical and horizontal valleys. This area has a three-dimensional climate; it is located within a low-latitude warm temperate plateau mountain monsoon climate, is influenced by plateaus and alpine and canyon topography, summers are hot and rainy, and the climate is humid in September. The vegetation on the slopes is sparse, and the area is classified as having medium vegetation coverage (Figure 3b). The strata in the region are relatively complete, and the lithological changes are distinct. The loose strata of the Quaternary and the soft rocks and soils represented by strongly weathered, magmatic rocks are widely distributed. All of these factors (the topography, geological structure, and meteorology and hydrology) provide favorable conditions for the occurrence of landslides in this region.
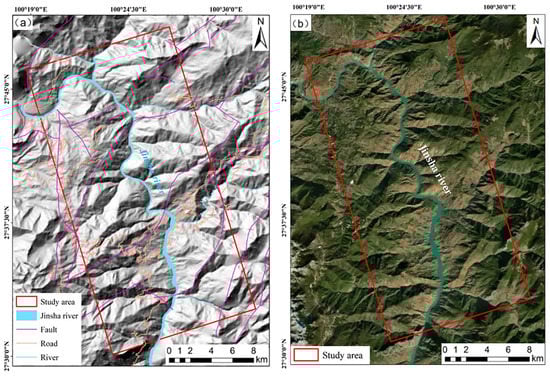
Figure 3.
Topographic and optical imaging of the study area: (a) topography and (b) optical image.
2.2. Data
In this study, Sentinel-1A in the C-band was selected as the source of the SAR data. Sentinel-1A data has a wavelength of 5.6 cm, a resolution of 5 m × 20 m, and the satellite has a revisitation period of 12 days. A total of 85 scenes from July 2017 to May 2019 were processed and analyzed, including 45 scenes of ascending data (path 99) and 40 scenes of descending data (path 135). When processing the time series of InSAR data, external digital elevation model (DEM) data were used as a reference. DEM data can provide a reference terrain and a geographic coordinate system to remove the influence of the terrain phase. The 1-arc-second Shuttle Radar Topography Mission (SRTM-1) elevation data (jointly measured by the Ministry of National Surveying and Mapping (NIMA)), which have a resolution of 30 m, were also used as a reference. Prior to processing Sentinel-1A data, the corresponding precise orbit data (POD) were obtained to remove systematic errors caused by orbit errors.
The optical image data are based on Google Earth image data and Landsat-8 series images. The Landsat-8 satellite has two sensors: the Operational Land Imager (OLI) and the Thermal Infrared Sensor (TIRS), and OLI contains all of the Enhanced Thematic Mapper(ETM+) bands. To avoid atmospheric absorption of some features, OLI readjusts the bands, which markedly improves the target object recognition ability. In addition, the two thermal TIRS bands allow for thermal wavelength atmospheric correction and a more reliable surface temperature and emissivity inversion [53,54]. GPS monitoring data for typical landslide areas from July 2017 to May 2019 were selected to verify and analyze the DS-InSAR deformation results. The experimental data parameters are shown in Table 1.

Table 1.
Experimental data parameters.
3. Methods
A flow chart of the study design is shown in Figure 4. The main technical methods employed included: (1) DS-InSAR to obtain surface deformation information, (2) optical images for conducting visual interpretations, (3) on-site inspection and verification of DS-InSAR and optical image accuracy, and (4) the selection of typical landslides to analyze the temporal and spatial variation characteristics.
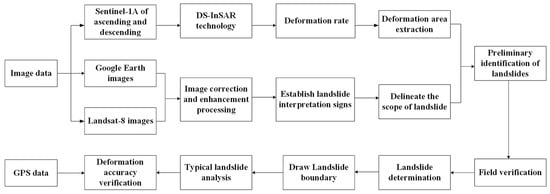
Figure 4.
Flow chart of study design.
3.1. DS-InSAR Method
Obtaining high-density point targets in non-urban areas is difficult when using the PS-InSAR method. As it is unable to reflect the overall deformation characteristics of certain study areas, researchers have instead focused on ground objects that have moderate scattering characteristics, such as bare land, desert, and cultivated land. Therefore, the DS-InSAR method is proposed for distributed scatterers (DS) to obtain temporally coherent and spatially continuous ground objects [35]. The core idea of this method is to filter out homogeneous points, optimize the DS phase according to the statistical characteristics of the homogeneous points, reduce the influence of noise on the DS, and combine the DS points and PS for deformation calculation, with the aim of improving non-urban area points and the target density and ultimately to obtain the complete surface deformation range. The DS-InSAR data processing method is shown in Figure 5, in which SHP is a statistically homogeneous pixel, DS is a distributed scatterer, PS is a permanent scatterer, is the threshold value of SHP, is the coherence of distributed scatterers, is the coherence threshold, and is the coherence of both distributed scatterers and permanent scatterers. PSC and DSC represent permanent scatterer candidates and distributed scatterer candidates, respectively.
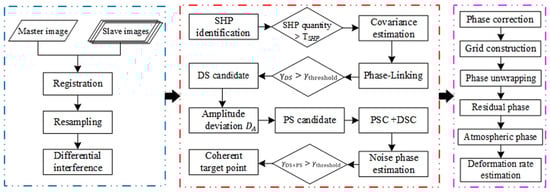
Figure 5.
DS-InSAR data processing flow.
- (1)
- Differential interferometric processing: the Sentinel-1A data were registered using the enhanced spectral diversity registration method of joint satellite orbit parameters. Thereafter, based on 30-m resolution SRTM-1 DEM data, the ground and terrain phase components were removed to obtain the differential interferometric phase.
- (2)
- DS point identification: the amplitude dispersion index was set to 0.55 to serve as the judgment criterion, and candidate PS points were extracted from the time series of the InSAR data set. Parizzi et al. showed that for homogeneous point selection in synthetic aperture radar, the Anderson-Darling (A-D) test performs better than other nonparametric tests [35]. Therefore, the A-D hypothesis test was used to evaluate the statistical distribution of pixels and identify the same in the defined window. Homogeneous pixels, which are pixels with more than 20 homogeneous pixels, were selected as DS candidate points.
- (3)
- Phase optimization: phase optimization is a key step in the DS-InSAR technology process. To solve the DS point interference phase decorrelation problem, the phase optimization method based on covariance matrix eigen-decomposition was adopted to estimate the optimal phase, according to the principle of phase closure. Notably, its winding phase is phase-linked to improve the interferogram phase signal-to-noise ratio [55].
- (4)
- Estimation and removal of atmospheric phase: after estimating the linear deformation and DEM error at each PS point, they were subtracted from the initial differential interferogram to obtain the residual phase, which mainly included the nonlinear deformation phase, atmospheric phase, and noise.
- (5)
- Deformation rate estimation: the DS pixels and PS pixels were combined to form a Delaunay triangulation for phase analysis. The spatially uncorrelated part of the viewing angle error and the master image contribution were separated from the wrapping phase, and this was followed by 3D phase unwrapping to resolve the phase consistency of the phase on both temporal and spatial scales [56,57]. Finally, after subtracting the atmospheric and orbital terms, the deformation time series displacement was estimated.
3.2. Optical Image Remote Sensing Interpretation
Landslides have specific morphological and textural surface features, and the key to identifying landslides with optical remote sensing is to establish interpretation marks. The types of remote sensing image interpretation marks used to identify target objects and reflect the nature and image characteristics of the target objects (such as the shape, size, shadows, and texture) can be divided into direct and indirect interpretation marks. In this respect, the direct interpretation signs of landslide remote sensing interpretation include the color tone of the landslide body and differences between geometric shapes and shadows, whereas indirect interpretation signs include the stratum lithology, vegetation coverage, landform, the water system, and landscape changes on both sides of the landslide [58,59].
As shown in Figure 6, when a landslide has formed, a circle-chair-shaped micro-geomorphic feature is often apparent, and the landform is steeper around the slope and gentler in the middle of the slope. A fully developed landslide generally has a landslide body, perimeter, wall, step, tongue, axis, drum, crack, sliding surface, sliding zone, and sliding bed. Although the forms of actual landslides differ, and not all of the above landslide elements are present, all landslides have a back wall, body, perimeter, sliding zone, and sliding bed. In remote sensing images, the only basic elements that can be interpreted are the apparent rear wall and perimeter of the landslide.
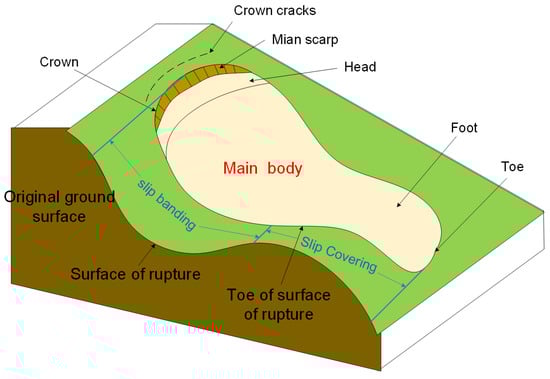
Figure 6.
Schematic diagram showing landslide characteristics.
Based on the optical remote sensing image characteristics, the landslide identification marks in the study area were obtained from three aspects: shape, vegetation, and landform, as shown in Table 2. Remote sensing images can reflect the hidden dangers and characteristics of landslides, and remote sensing interpretation signs were established to identify landslides in the study area.
Table 2.
Optical image remote sensing interpretation features.
4. Results
4.1. DS-InSAR Deformation Results and Analysis
Due to the influence of orbit incident angle differences, the deformation information detected by the ascending and descending data is mainly related to the east of the Jinsha River Basin and the west side of the Jinsha River, respectively. The deformation results obtained using the different orbits differed. This occurred because the ascending data were obtained during a flight with a direction roughly from south to north, and the radar line of sight was on the right; the results were, therefore, more sensitive to deformation information obtained from east to west on both sides of the mountain and canyon. In contrast, the flight direction used to obtain descending data was from west to east on both sides of the alpine valley, and it was found to be more sensitive in obtaining surface deformation information. However, the results showed that the different orbital data complemented each other, which provided results that were more accurate and comprehensive than using a single orbit. In addition, they avoided problems, such as geometric distortion, which can be caused when using a single orbit.
Figure 7 shows the deformation rate in the line of sight (LOS) direction of Sentinel-1A ascending data during the monitoring period. Positive values in the graph indicate motion close to the satellite, and negative values indicate motion away from the satellite. As the study area is located in an area with high mountains and deep canyons, the geometric distortion is severe. Therefore, the subsidence and uplift of the ground surface cannot be obtained simply by using the positive and negative deformation values; the area comprises deformation regardless of whether the deformation value is positive or negative. A total of seven deformation areas were detected from the ascending data, and these were numbered H1–H7. Of these, three relatively obvious areas were located on the east side of the Jinsha River Basin. The maximum deformation rate of 128 mm/yr occurred at H7. However, only a few deformation points were detected in the four areas located on the west side of the Jinsha River Basin. Figure 8 shows the deformation rates in the LOS direction of Sentinel-1A descending data during monitoring. A total of six deformation areas were detected in the descending data, which were numbered H8–H13. The maximum deformation occurred at H8, and the maximum deformation rate was determined as −113 mm/yr. The combined information obtained from optical images and field verification results confirmed that these deformation areas were landslides.
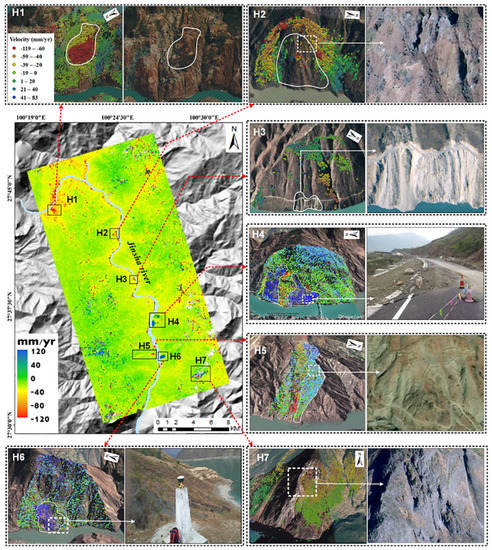
Figure 7.
Deformation observed using ascending Sentinel-1A data and landslide identification results.
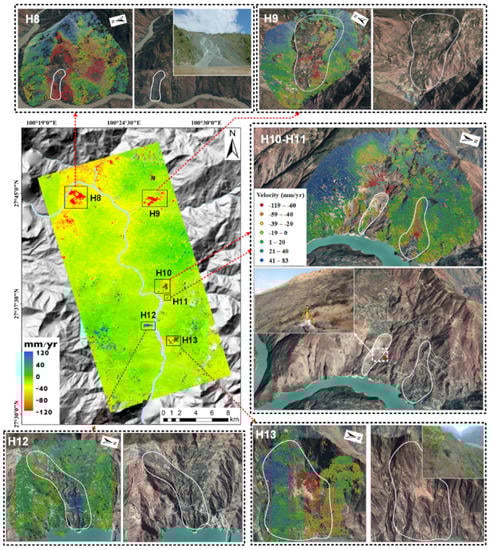
Figure 8.
Deformation information obtained from descending Sentinel-1A data and landslide identification results.
The number and density of measurement points (MPs) detected by the ascending and descending data were statistically analyzed separately, and the results are shown in Table 3. As shown in the table, 431,970 and 573,562 MPs were detected from the ascending data and descending data, respectively. The study area covers 499.5 km2, therefore, the densities of the MPs detected by the ascending and descending data are 961/km2 and 1276/km2, respectively. Approximately 1.3 times more MPs were detected in the descending data than in the ascending orbit data. The main reason for the discrepancy was the influence of topography in the study area, and the descending data related to areas that were more visible than the regions covered by the ascending data, which thus resulted in an increase in the number of MPs detected in the descending data.
Table 3.
Number and density of MPs detected in ascending and descending data.
4.2. Optical Image Recognition Results
Due to the influence of vegetation coverage and the geometric distortion of SAR imaging, it was difficult to completely identify landslide hazards in the study area using DS-InSAR technology alone. Therefore, a remote sensing interpretation of landslides identified using DS-InSAR technology was conducted using Google Earth images and Landsat-8 images. In doing so, two newly discovered landslides were identified and numbered H14 and H15, respectively (Figure 9). Compared with the DS-InSAR results, no obvious deformation phenomena were found in these two landslides.
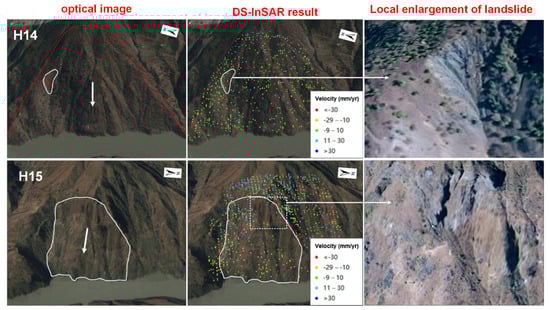
Figure 9.
Landslide definition based on optical image recognition and DS-InSAR results.
4.3. Final Landslide Identification Results
The DS-InSAR deformation analysis results, optical image remote sensing interpretation results, and on-site verification results were combined, and a total of 15 landslide hazards were finally identified in the study area. The distribution of landslide hazards is shown in Figure 10. Of these, H1–H7 were landslide hazards identified using ascending Sentinel-1A data (a total of 7), H8–H13 were landslide hazards identified using descending Sentinel-1A data (a total of 6), and two landslide hazards (H14–H15) were identified via remote sensing interpretation of optical images. Based on the identification results, the landslide identification rate of the ascending track Sentinel-1A data in the study area was 47%, that of the descending track Sentinel-1A data was 40%, and that of the combined ascending track Sentinel-1A data was 87%. The above analysis shows that it is difficult to comprehensively identify landslide hazards in alpine and canyon valley areas using SAR data from a single track. The combined monitoring method using ascending and descending data and DS-InSAR technology effectively improved the identification rate of landslide hazards.
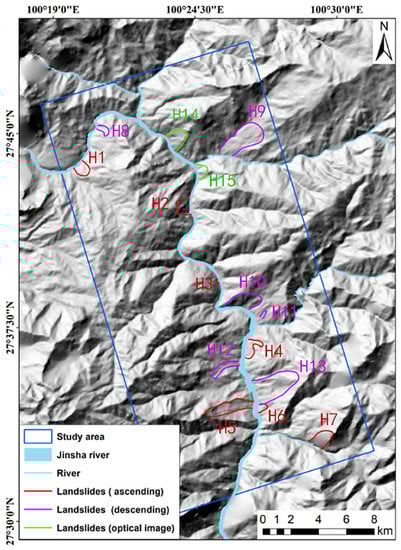
Figure 10.
Sources of landslide identification results within the study area.
The landslides in the study area are all landslides formed by loose overburden and strongly weathered bedrock (mainly tuffaceous basalt and volcanic conglomerate), mostly shallow surface or medium-thick layers according to the thickness of the landslides, and a few deep landslides (such as H8, H10, H13). According to their activity status, they can be roughly divided into three categories. First, ancient landslides formed earlier (such as H1, H6, H9, H11, H12, H13). Second, new landslides with local activity (H3, H4, H5, H8, H10, H14); third, landslides with the possibility of overall instability (H2, H7, H15). Most of the old landslides are bedrock landslides, which are larger in scale and generally related to lithology, weathering, and bank slope structure. Most of the landslides that are still active are developed in the surface slope, residual layer, and full and strongly weathered rock, which are shallow surface or medium-thick layer landslides and are related to human activities. According to the scale of landslides, the landslides in the study area basically belong to medium-sized landslides.
5. Analysis and Verification of Typical Landslides
5.1. Analysis of the Spatiotemporal Evolution Characteristics
The Xin Jian (XJ) landslide (shown in Figure 11a, H4) was selected to analyze its temporal and spatial evolution characteristics. The new landslide mass was located on the east bank of the Jinshajin River Basin, and the vegetation in and around the landslide mass was relatively sparse. The gully cracks, as shown by the green dotted lines in Figure 11b (named 1#, 2#, 3# and 4#, respectively), were basically distributed along an east-west direction. The relevant government departments have apparently organized and implemented relocation work; however, the Google Earth image in Figure 11b shows that residents continue to live in the vicinity of the newly created landslide, and there is a road and a bridge of Georgian degree at the bottom of the XJ landslide. Therefore, when a secondary landslide occurs, the lives of residents will be at risk, and traffic infrastructure and properties are at serious risk of being damaged.
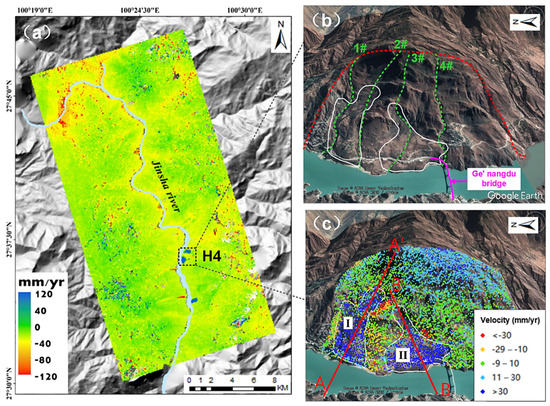
Figure 11.
Deformation rate of the XJ landslide mass obtained using DS-InSAR technology and a corresponding optical image. (a) is the deformation rate of DS-InSAR, (b) is the location of cracks 1#, 2#, 3# and 4#, and (c) is the local enlarged view of H4.
Therefore, in this section, we analyzed the evolution of the landscape and the spatiotemporal characteristics of its deformation. As the data obtained from the ascending orbit Sentinel-1A were more sensitive to deformation in this area than the descending data, the deformation rate of the XJ landslide in the LOS direction was obtained under the orbit of ascending Sentinel-1A data, as shown in Figure 11c. As depicted in the figure of the new landslide body, two deformation zones exist (deformation zones I and II). Deformation zone I is the area along 1# gully to the south of the fracture and to the north of 2# gully. Influenced by the water level in the reservoir area, the front edge was rebuilt. During the monitoring period, the amount of displacement in the LOS direction was approximately 50–170 mm, and the area of deformation covered was 0.41 km2. The surface layer and bedrock were weathered, the rock mass on the soil surface was loose, and the soil surface and bedrock were weakly weathered and highly permeable. As a result, the landslide was easily deformed under its own gravity. Deformation zone II is the area south of 3# gully and north of the 4# gully crack, where the most serious displacement occurs, and the maximum LOS deformation accumulation is 196 mm, and the area of deformation covers 0.37 km2. Deformation zone II is a typical mixed sedimentary body, mainly composed of boulders, and gravel-bearing clay, which mainly comprises basalt. The surface layer and bedrock are strongly weathered, and the rock mass on the soil surface is loose. Under the influence of rainfall, reservoir water storage, and gravity, the shear strength of the landslide body has decreased, which has resulted in landslide deformation. The direction of the landslide is basically the same, and it is displaced in the slope direction along the hillside to the riverside.
To further analyze the spatiotemporal characteristics of XJ landslide deformation, section lines A-A’ and B-B’ were drawn along the sliding direction on deformation zones I and II, respectively (Figure 11c). Figure 12a,b show the deformation rate values on the section lines A-A’ and B-B’, respectively. As shown in the figure, the maximum deformation rates of deformation zones I and II are both located at the bottom of the landslide (landslide accumulation). The maximum deformation rate on the A-A’ section line is 158 mm/yr, and that on the B-B’ section line is 78 mm/yr. The deformation rate at the top of the landslide and at the sliding position is relatively small.
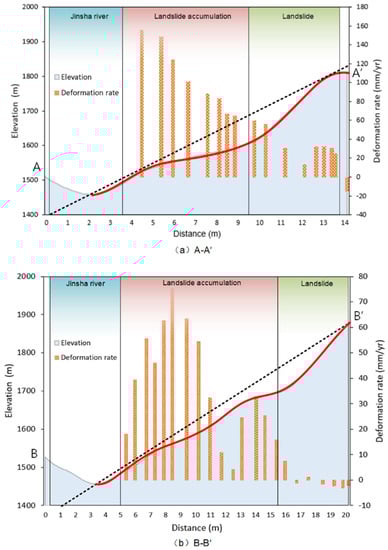
Figure 12.
Deformation rates on section lines A-A’ and B-B’: (a) A-A’ and (b) B-B’.
To better show the temporal and spatial characteristics of the time series deformation of the XJ landslide from July 2017 to May 2019, using the image (20170704) as a reference, and setting its deformation variable to 0, we calculated the time series cumulative deformation of the new landslide mass, and the results are shown in Figure 13. As shown in the figure, the deformation characteristics of the XJ landslide were not obvious from July 2017 to February 2018, and only a small amount of local deformation phenomena were apparent. However, after February 2018, the XJ landslide showed obvious deformation phenomena; deformation was more prominent in the middle of the landslide body in deformation zone I and at the bottom of the landslide in deformation zone II near the Jinsha River Basin, and the maximum cumulative deformation amount reached 196 mm.
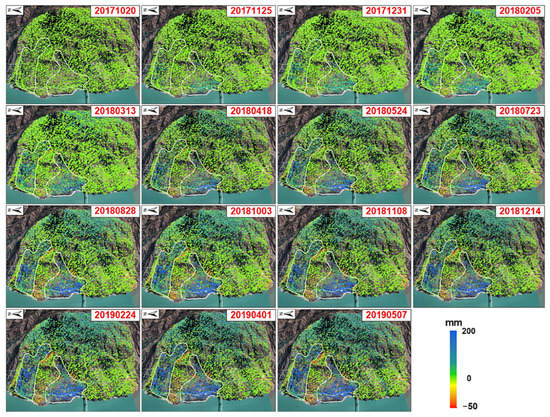
Figure 13.
Cumulative deformation from October 2017 to May 2019 of the XJ landslide.
5.2. Validation and Analysis of DS-InSAR Results
Field investigations revealed multiple macroscopic deformation phenomena associated with the XJ landslide. Large-scale vertical dislocations are apparent at the top of the landslide, and the damage is reflected in the concave shape, which comprises multiple landslide steps. Numerous tension cracks can also be seen within the landslide body. The width of one seam is approximately 10 cm, and the staggered stage is approximately 15 cm, whereas the other part of the seam is approximately 30 cm wide, and the staggered stage is approximately 50 cm (Figure 14a–c). There are obvious cracks and deformation marks in the road pavement at the bottom of the landslide body, and the road edge has collapsed, which seriously affects driving conditions (Figure 14d,e). Dozens of residential buildings still stand on the landslide body, and obvious landslide traces are evident around the buildings (Figure 14f). The continuous deformation of the landslide poses a serious threat to these buildings. The Genandu Bridge is also located at the bottom of Deformation zone II. This bridge is an important passage connecting the east and west banks of the Jinsha River Basin. The stone piers at the eastern end of the bridge and the local area of the bridge are skewed and damaged to varying degrees (Figure 14g–i), which seriously affects their use and function.
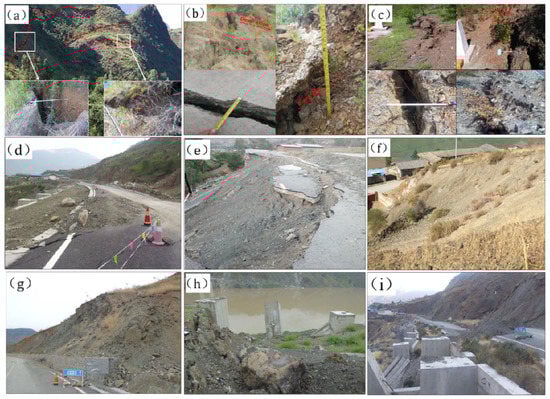
Figure 14.
Field investigation images of the XJ landslide. (a–i) are the field investigation photos of XJ landslide.
The XJ landslide (H4) is shown in Figure 15, where the measured GPS data were used to verify the accuracy of the DS-InSAR monitoring results of the landslide body. Sixteen GPS monitoring points are located in this typical landslide, and the distribution of the location of each GPS monitoring point is shown in Figure 15a. In the verification process, GPS monitoring reference points were used, and the nearest neighbor search method was employed to obtain the DS-InSAR measurement point closest to each GPS point. A comparative analysis was then conducted.
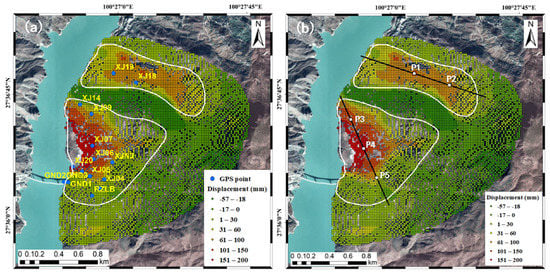
Figure 15.
(a) Distribution of GPS monitoring points on the new landslide, (b) deformation rate of the new landslide and characteristic points. P1-P5 are selected InSAR feature points.
The results obtained by DS-InSAR and GPS were not inherently comparable. Accordingly, they must be projected in the same direction. The more common methods include projecting the DS-InSAR and GPS observations to the slope aspect, projecting the DS-InSAR observations to the 3D direction, and projecting the GPS observations to the line-of-sight direction. As mentioned above, DS-InSAR based on a time series is currently used in the monitoring of settlements and uplifts that have small deformation gradients because the calculation is clearer. For mountain landslides, most of the ground surface is displaced along the slope direction. However, the slope aspect and slope distribution in the study area are complex. Furthermore, when the unique imaging geometry of DS-InSAR is applied to the surface within such a mountainous area, the local incident angle is either too large or too small, which results in displacement of the line of sight and actual displacement. The differences can be relatively large, and this error is inherent when applying the DS-InSAR line-of-sight direction. In addition, surface deformation undergoes three-dimensional changes. For mountain landslides in particular, the movements are not simple horizontal or vertical movements, and the deformation obtained by DS-InSAR is the projection of the three-dimensional surface deformation component in the line of sight. At this time, if the DS-InSAR results are decomposed into three dimensions, this is equivalent to the introduction of errors. Therefore, projection calculation was not performed on the DS-InSAR line-of-sight results, and the deformation components of the three GPS directions were projected to the line-of-sight direction. Displacement in the south–north direction was first considered, and the results were then combined with displacement in the vertical direction. For a point, P, on the surface, its deformation along the north-south and east-west directions were and respectively. Deformations in the due north and due east directions were positive, and the deformation components of these two directions were projected to the direction of the satellite flight orbit (azimuth). Based on Figure 16a, the following was obtained,
where represents deformation of ground target point, P, along the satellite flight direction (azimuth direction). The azimuth direction is specified as positive and represents the angle between the flight directions of the satellite and the true north direction. For the sentinel-1 satellite, its orbital declination angle is 98.18°, , then .
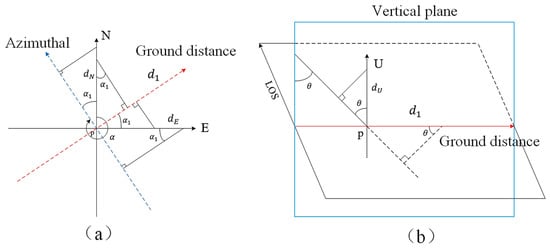
Figure 16.
Deformation projection geometry. (a) shows the azimuthal and geodetic projection of the satellite, (b) shows the line-of-sight projection of the satellite.
Projecting and to the ground distance direction perpendicular to the azimuth direction of the satellite orbit, and specifying that the ground distance direction is positive (Figure 16b), the displacement of the ground point P along the ground distance direction can be obtained as follows,
where is the projection of the displacement components of the ground point P in the east-west and north-south directions to the displacement perpendicular to the satellite flight direction (ground distance direction). The ground distance direction displacement, , is projected to the satellite radar line of sight upward, and point P is introduced vertically and serves as the deformation component in the straight direction. The vertical upward is positive, and from the spatial geometric relationship, the following can be obtained,
where is the projection of the three-dimensional deformation of the ground point P to the displacement of the satellite line of sight, and is the radar incident angle.
Through projection transformation processing, the GPS line-of-sight deformation value was obtained at the same time as that in the SAR image, and the results were compared at 14 points, including XJ03, XJ04, XJ05, XJ06, XJ07, XJ09, XJ14, XJ17, XJ18, XJ19, RZLA, RZLB, GND1, and GND3, as shown in Figure 17. In theory, the values of the two should be equal. As shown in Figure 17, the time-series of cumulative deformation obtained by the two methods was highly consistent. However, when the amount of deformation was large, the projection value of GPS was several times higher than that of DS-InSAR. This shows that the accuracy of the DS-InSAR results was seriously impacted, and this occurred for the following main reasons: first, a certain deviation occurred between the two due to temporal and spatial differences and the calculation methods employed. Second, the surface deformation along the LOS direction during the two radar observations exceeded the monitoring range of the radar wave, namely (the Sentinel-1 data in this experiment are C-band radar, ) and an interference fringe . However, the time deformation laws presented by the two were consistent, which did not affect the analysis of the settlement mechanism. Nevertheless, when the deformation rate was small, the agreement between the two results was relatively high. For example, the cumulative deformation at points XJ07, XJ14, XJ18, XJ18, RZLB, GND1, and GND3 was within 100 mm, and the corresponding root mean square error (RMSE) between the two was within 20 mm, which is consistent with the theory. When the deformation gradient was small, the phase gradient of the pixels in the adjacent two-scene images did not exceed the maximum detectable deformation gradient limit value. In addition, the deformation value obtained by DS-InSAR was relatively close to the measured GPS value.
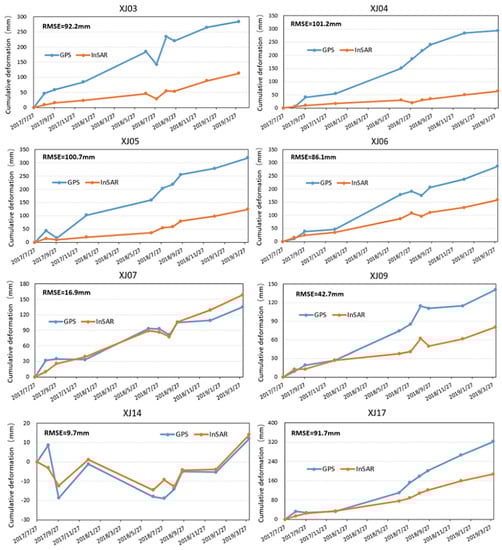
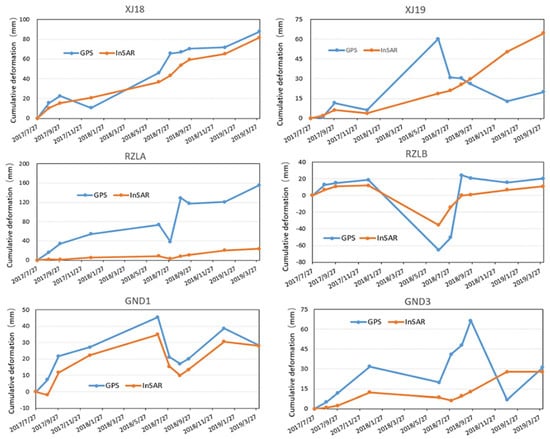
Figure 17.
Comparison of DS-InSAR and GPS survey results of XJ landslide from July 2017 to March 2019.
5.3. Relationship between Landslide Time Series Displacement and Rainfall
Under normal circumstances, rainfall is a key factor involved in triggering landslides. To analyze the correlation between landslide temporal deformation and rainfall, we obtained the temporal deformation sum of the five DS-InSAR feature points shown in Figure 15b. The matching monthly rainfall, deformation curve of each point (Figure 18), and rainfall in the same period were plotted. The precipitation data were collected from the Goddard Earth Sciences Data and Information Services Center (https://disc.gsfc.nasa.gov/, accessed on 7 December 2022). The rainy season in the study area mainly occurs from June to October annually, and rainfall during the rainy season accounts for more than 80% of the annual rainfall. Based on the figure, the displacement of each deformation point showed obvious acceleration characteristics from July 2017 to October 2017 and from July 2018 to October 2018. In contrast, the acceleration of deformation displacement slowed down slightly at other times and showed a uniform characteristic. This result indicates that rainfall is an important factor leading to the displacement and deformation of landslides in this area. Under the action of rainfall, the pore water pressure of the landslide body increases, the strength of the geotechnical body decreases, and deformation occurs easily under the action of gravity. In addition, rainwater enters the weak sliding surface along cracks and joints, which reduces the shear strength of the sliding surface and aggravates landslide deformation.
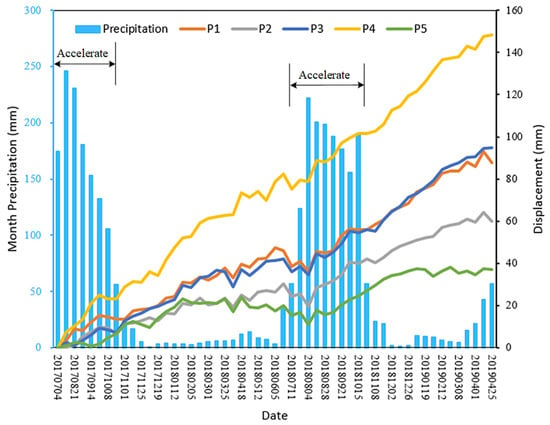
Figure 18.
Time series displacement of XJ landslide monitoring sites with rainfall during July 2017–May 2019.
6. Conclusions
InSAR technology has been widely used to identify the locations of landslides and monitor their deformation. However, identifying landslides based on InSAR presents challenges, particularly in mountainous and canyon areas where prior information is lacking. Due to the geometric distortion of SAR imaging, the recognition rate of landslides in alpine canyon areas is low when using single-track SAR data. Therefore, this study adopted the DS-InSAR method to process a combination of ascending and descending Sentinel-1A data. Optical image data were also used to support identification, and a field study was conducted to verify the results. The joint method can be used to comprehensively identify, monitor, and analyze landslides in the Ahai reservoir area of the Jinsha River Basin.
The combined method identified 15 landslides on both sides of the Jinsha River Basin; seven were identified from the ascending Sentinel-1A data, six were identified from the descending Sentinel-1A data, and two new landslide hazards were identified using optical image remote sensing interpretation. The landslide identification rate of the ascending track Sentinel-1A data in the study area was 47%, that of the descending track Sentinel-1A data was 40%, that of the combined ascending track Sentinel-1A data was 87%, and that achieved by combining ascending and descending data, optical image interpretation, and field verification was 100%. A comparison between the use of the DS-InSAR method and GPS measurement results showed that DS-InSAR deformation monitoring was highly precise and that the maximum cumulative deformation obtained reached 196 mm. The time sequence deformation laws of the cumulative deformation obtained using the DS-InSAR and GPS measurements were highly consistent. The results also enabled the effect of heavy precipitation to be analyzed; this was found to have a great influence on landslide deformation, and there was a time lag of 1–2 months between the peak value of precipitation and the maximum deformation rate. The field investigation conducted here revealed differing degrees of tension cracks, vertical dislocation, sliding traces, and other phenomena in the landslides identified in this study, which indicates that our method can be effectively employed to accurately identify landslides in this alpine valley area. The research findings have important guiding significance for improving the ability to identify and investigate landslides, even those that are newly formed.
To prevent landslide disasters, it is important to accurately identify landslides and assess their susceptibility risks, hazard-causing factors, and mechanisms, and to conduct disaster-causing factor and disaster-causing mechanism analyses. Based on this study, follow-up research will be conducted using deep learning algorithms to assess disaster mechanisms, perform susceptibility evaluations, and evaluate instability and disaster prediction models.
Author Contributions
Y.L. and X.Z. conceived the manuscript; Y.L. interpreted the results and drafted the manuscript; X.Z., D.Z. and X.Y. check and revise the manuscript; Y.L., X.Z. and X.L. conducted experiments and obtained the results; Y.L., X.Y., S.G., C.S. and C.H. conducted the field surveys; Y.L., X.Z. and F.L. contributed to the discussion of the results; X.Z. and W.W. provided funding support. All authors have read and agreed to the published version of the manuscript.
Funding
This research was funded by the National Natural Science Foundation of China (Grant No. 42161067 and 42004006) and the Scientific Research Fund Project of Yunnan Provincial Department of Education (2019J0562).
Data Availability Statement
Not applicable.
Acknowledgments
This work was supported by the Yunnan Geological Environment Monitoring Institute and Land Information Center of Yunnan Provincial Department of Natural Resources. The authors wish to thank the ESA for arranging the Sentinel-1A data, NASA and NIMA for providing the SRTM-1 DEM data, and the ESA for releasing the POD data. All authors agree, and thank anonymous commenters for their in-depth comments and helpful suggestions, which greatly help to improve this article.
Conflicts of Interest
The authors declare no conflict of interest.
References
- Petley, D. Global patterns of loss of life from landslides. Geology 2012, 40, 927–930. [Google Scholar] [CrossRef]
- Froude, M.J.; Petley, D.N. Global fatal landslide occurrence from 2004 to 2016. Nat. Hazards Earth Syst. Sci. 2018, 18, 2161–2181. [Google Scholar] [CrossRef]
- Zhao, C.; Lu, Z.; Zhang, Q.; de la Fuente, J. Large-area landslide detection and monitoring with ALOS/PALSAR imagery data over Northern California and Southern Oregon, USA. Remote Sens. Environ. 2012, 124, 348–359. [Google Scholar] [CrossRef]
- Bayer, B.; Simoni, A.; Schmidt, D.; Bertello, L. Using advanced InSAR techniques to monitor landslide deformations induced by tunneling in the Northern Apennines, Italy. Eng. Geol. 2017, 226, 20–32. [Google Scholar] [CrossRef]
- Mishra, V.; Jain, K. Satellite based assessment of artificial reservoir induced landslides in data scarce environment: A case study of Baglihar reservoir in India. J. Appl. Geophys. 2022, 205, 104754. [Google Scholar] [CrossRef]
- Herrera, G.; Gutiérrez, F.; García-Davalillo, J.; Guerrero, J.; Notti, D.; Galve, J.; Fernández-Merodo, J.; Cooksley, G. Multi-sensor advanced DInSAR monitoring of very slow landslides: The Tena Valley case study (Central Spanish Pyrenees). Remote Sens. Environ. 2013, 128, 31–43. [Google Scholar] [CrossRef]
- Jones, N.; Manconi, A.; Strom, A. Active landslides in the Rogun Catchment, Tajikistan, and their river damming hazard potential. Landslides 2021, 18, 3599–3613. [Google Scholar] [CrossRef]
- Teshebaeva, K.; Roessner, S.; Echtler, H.; Motagh, M.; Wetzel, H.-U.; Molodbekov, B. ALOS/PALSAR InSAR time-series analysis for detecting very slow-moving landslides in Southern Kyrgyzstan. Remote Sens. 2015, 7, 8973–8994. [Google Scholar] [CrossRef]
- Promper, C.; Gassner, C.; Glade, T. Spatiotemporal patterns of landslide exposure–a step within future landslide risk analysis on a regional scale applied in Waidhofen/Ybbs Austria. Int. J. Disaster Risk Reduct. 2015, 12, 25–33. [Google Scholar] [CrossRef]
- Jia, H.; Wang, Y.; Ge, D.; Deng, Y.; Wang, R. InSAR Study of Landslides: Early Detection, Three-Dimensional, and Long-Term Surface Displacement Estimation—A Case of Xiaojiang River Basin, China. Remote Sens. 2022, 14, 1759. [Google Scholar] [CrossRef]
- Ouyang, C.; An, H.; Zhou, S.; Wang, Z.; Su, P.; Wang, D.; Cheng, D.; She, J. Insights from the failure and dynamic characteristics of two sequential landslides at Baige village along the Jinsha River, China. Landslides 2019, 16, 1397–1414. [Google Scholar] [CrossRef]
- Wang, C.; Zhou, J.; Lu, P.; Yuan, L. Long-term scheduling of large cascade hydropower stations in Jinsha River, China. Energy Convers. Manag. 2015, 90, 476–487. [Google Scholar] [CrossRef]
- Zhao, C.; Kang, Y.; Zhang, Q.; Lu, Z.; Li, B. Landslide Identification and Monitoring along the Jinsha River Catchment (Wudongde Reservoir Area), China, Using the InSAR Method. Remote Sens. 2018, 10, 993. [Google Scholar] [CrossRef]
- Wu, Y.; Fang, H.; Huang, L.; Ouyang, W. Changing runoff due to temperature and precipitation variations in the dammed Jinsha River. J. Hydrol. 2020, 582, 124500. [Google Scholar] [CrossRef]
- Soltanieh, A.; Macciotta, R. Updated understanding of the Ripley landslide kinematics using satellite InSAR. Geosciences 2022, 12, 298. [Google Scholar] [CrossRef]
- El-Haddad, B.A.; Youssef, A.M.; El-Shater, A.H.; El-Khashab, M.H. Slope Stability Hazard Assessment Using 3D Remote Sensing and Field Sketching Techniques Along Sohag-Red Sea-Cairo Highway, Egypt. Adv. Cult. Living Landslides 2017, 2, 407–417. [Google Scholar] [CrossRef]
- Zhu, Y.; Yao, X.; Yao, L.; Zhou, Z.; Ren, K.; Li, L.; Yao, C.; Gu, Z. Identifying the Mechanism of Toppling Deformation by InSAR: A Case Study in Xiluodu Reservoir, Jinsha River. Landslides 2022, 19, 2311–2327. [Google Scholar] [CrossRef]
- Ren, K.; Yao, X.; Li, R.; Zhou, Z.; Yao, C.; Jiang, S. 3D displacement and deformation mechanism of deep-seated gravitational slope deformation revealed by InSAR: A case study in Wudongde Reservoir, Jinsha River. Landslides 2022, 19, 2159–2175. [Google Scholar] [CrossRef]
- Yang, C.S.; Dong, J.H.; Zhu, S.N.; Xiong, G.H. Detection, identification and deformation characteristics of landslide groups by InSAR in Batang section of Jinsha River convergence zone. China J. Earth Sci. Environ. 2021, 43, 398–408. [Google Scholar] [CrossRef]
- Canuti, P.; Casagli, N.; Catani, F.; Falorni, G.; Farina, P. Integration of remote sensing techniques in different stages of landslide response. In Progress in Landslide Science; Springer: Berlin/Heidelberg, Germany, 2007; pp. 251–260. [Google Scholar] [CrossRef]
- Glenn, N.F.; Streutker, D.R.; Chadwick, D.J.; Thackray, G.D.; Dorsch, S.J. Analysis of LiDAR-Derived Topographic Information for Characterizing and Differentiating Landslide Morphology and Activity. Geomorphology 2006, 73, 131–148. [Google Scholar] [CrossRef]
- Zhang, C.; Li, Z.; Yu, C.; Song, C.; Xiao, R.; Peng, J. Using GACOS-Assisted InSAR Stacking to Monitor the Landslide in Jinsha River Basin; Geomatics and Information Science of Wuhan University: Wuhan, China, 2021; p. 46. [Google Scholar]
- Qu, F.; Qiu, H.; Sun, H.; Tang, M. Post-failure landslide change detection and analysis using optical satellite Sentinel-2 images. Landslides 2020, 18, 447–455. [Google Scholar] [CrossRef]
- Hao, J.; Wu, T.; Hu, G.; Zou, D.; Zhu, X.; Zhao, L.; Li, R.; Xie, C.; Ni, J.; Yang, C.; et al. Investigation of a Small Landslide in the Qinghai-Tibet Plateau by InSAR and Absolute Deformation Model. Remote Sens. 2019, 11, 2126. [Google Scholar] [CrossRef]
- Dini, B.; Daout, S.; Manconi, A.; Loew, S. Classification of slope processes based on multitemporal DInSAR analyses in the Himalaya of NW Bhutan. Remote Sens. Environ. 2019, 233, 111408. [Google Scholar] [CrossRef]
- Liu, L.; Millar, C.I.; Westfall, R.D.; Zebker, H.A. Surface motion of active rock glaciers in the Sierra Nevada, California, USA: Inventory and a case study using InSAR. Cryosphere 2013, 7, 1109–1119. [Google Scholar] [CrossRef]
- Lin, B.; Jiang, L.; Wang, H.; Sun, Q. Spatiotemporal characterization of land subsidence and uplift (2009–2010) over wuhan in central china revealed by terrasar-x insar analysis. Remote Sens. 2016, 8, 350. [Google Scholar]
- Hu, X.; Lu, Z.; Pierson, T.C.; Kramer, R.; George, D.L. Combining InSAR and GPS to Determine Transient Movement and Thickness of a Seasonally Active Low-Gradient Translational Landslide. Geophys. Res. Lett. 2018, 45, 453–462. [Google Scholar] [CrossRef]
- Ferretti, A.; Prati, C. Nonlinear subsidence rate estimation using permanent scatterers in differential sar interferometry. IEEE Trans. Geosci. Remote Sens. 2000, 38, 2202–2212. [Google Scholar]
- Ferretti, A.; Prati, C.; Rocca, F. Permanent scatterers in sar interferometry. IEEE Trans. Geosci. Remote Sens. 2002, 39, 8–20. [Google Scholar]
- Berardino, P.; Fornaro, G.; Lanari, R.; Sansosti, E. A New Algorithm for Surface Deformation Monitoring Based on Small Baseline Differential SAR Interferograms. IEEE Trans. Geosci. Remote Sens. 2002, 40, 2375–2383. [Google Scholar] [CrossRef]
- Schmidt, D.A.; Bürgmann, R. Time-dependent land uplift and subsidence in the Santa Clara valley, California, from a large interferometric synthetic aperture radar data set. J. Geophys. Res. 2003, 108, 1–11. [Google Scholar] [CrossRef]
- Cao, N.; Lee, H.; Jung, H.C. A Phase-Decomposition-Based PSInSAR Process-ing Method. IEEE Trans. Geosci. Remote Sens. 2016, 54, 1074–1090. [Google Scholar] [CrossRef]
- Lee, J.S.; Pottier, E. Polarimetric Radar Imaging: From Basics to Applications; CRC Press: Boca Raton, FL, USA, 2009. [Google Scholar]
- Parizzi, A.; Brcic, R. Adaptive InSAR stack multilooking exploiting amplitude statistics: A comparison between different techniques and practical results. IEEE Geosci. Remote Sens. Lett. 2010, 8, 441–445. [Google Scholar] [CrossRef]
- Casu, F.; Elefante, S.; Imperatore, P.; Zinno, I.; Manunta, M.; De Luca, C.; Lanari, R. SBAS-DInSAR Parallel Proce-ssing for Deformation Time-Series Computation. IEEE J. Sel. Top. Appl. Earth Obs. Remote Sens. 2014, 7, 3285–3296. [Google Scholar] [CrossRef]
- Li, M.; Zhang, L.; Dong, J.; Tang, M.; Shi, X.; Liao, M.; Xu, Q. Characterization of pre- and post-failure displacements of the Huangnibazi landslide in Li County with multi-source satellite observations. Eng. Geol. 2019, 257, 105140. [Google Scholar] [CrossRef]
- Dong, J.; Zhang, L.; Li, M.; Yu, Y.; Liao, M.; Gong, J.; Luo, H. Measuring precursory movements of the recent Xinmo landslide in Mao County, China with Sentinel-1 and ALOS-2 PALSAR-2 datasets. Landslides 2018, 15, 135–144. [Google Scholar] [CrossRef]
- Shi, X.; Zhang, L.; Balz, T.; Liao, M. Landslide deformation monitoring using point-like target offset tracking with multi-mode high-resolution TerraSAR-X data. Isprs J. Photogramm. Remote Sens. 2015, 105, 128–140. [Google Scholar] [CrossRef]
- Malenovsky, Z.; Rott, H.; Cihlar, J.; Schaepman, M.E.; García-Santos, G.; Fernandes, R.; Berger, M. Sentinels for science: Potential of Sentinel-1, -2, and -3 missions for scientific observations of ocean, cryosphere, and land. Remote Sens. Environ. 2012, 120, 91–101. [Google Scholar] [CrossRef]
- Yague-Martinez, N.; Prats-Iraola, P.; Gonzalez, F.R.; Brcic, R.; Shau, R.; Geudtner, D.; Eineder, M.; Bamler, R. Interferometric Processing of Sentinel-1 TOPS Data. IEEE Trans. Geosci. Remote Sens. 2016, 54, 2220–2234. [Google Scholar] [CrossRef]
- Rosi, A.; Tofani, V.; Tanteri, L.; Stefanelli, C.T.; Agostini, A.; Catani, F.; Casagli, N. The new landslide inventory of Tuscany (Italy) updated with PS-InSAR: Geomorphological features and landslide distribution. Landslides 2018, 15, 5–19. [Google Scholar] [CrossRef]
- Zhang, L.; Dai, K.; Deng, J.; Ge, D.; Liang, R.; Li, W.; Xu, Q. Identifying potential landslides by stacking-InSAR in southwestern China and its performance comparison with SBAS-InSAR. Remote Sens. 2021, 13, 3662. [Google Scholar] [CrossRef]
- Yao, J.; Yao, X.; Liu, X. Landslide Detection and Mapping Based on SBAS-InSAR and PS-InSAR: A Case Study in Gongjue County, Tibet, China. Remote Sens. 2022, 14, 4728. [Google Scholar] [CrossRef]
- Dong, J.; Zhang, L.; Tang, M.; Liao, M.; Xu, Q.; Gong, J.; Ao, M. Mapping landslide surface displacements with time series SAR interferometry by combining persistent and distributed scatterers: A case study of Jiaju landslide in Danba, China. Remote Sens. Environ. 2018, 205, 180–198. [Google Scholar] [CrossRef]
- Plank, S.; Singer, J.; Minet, C.; Thuro, K. GIS based suitability evaluation of the Differential Radar Interferometry method (D-InSAR) for detection and deformation monitoring of landslides. In Fringe 2009 Workshop; ESA Special Publication: Frascati, Italy, 2010; Available online: https://ui.adsabs.harvard.edu/abs/2010ESASP.677E.105P/abstract (accessed on 7 December 2022).
- Bozzano, F.; Mazzanti, P.; Perissin, D.; Rocca, A.; De Pari, P.; Discenza, M.E. Basin scale assessment of landslides geomorphological setting by advanced InSAR analysis. Remote Sens. 2017, 9, 267. [Google Scholar] [CrossRef]
- Chen, X.; Achilli, V.; Fabris, M.; Menin, A.; Monego, M.; Tessari, G.; Floris, M. Combining sentinel-1 interferometry and ground-based geomatics techniques for monitoring buildings affected by mass movements. Remote Sens. 2021, 13, 452. [Google Scholar] [CrossRef]
- Su, X.; Zhang, Y.; Meng, X.; Rehman, M.U.; Khalid, Z.; Yue, D. Updating Inventory, Deformation, and Development Characteristics of Landslides in Hunza Valley, NW Karakoram, Pakistan by SBAS-InSAR. Remote Sens. 2022, 14, 4907. [Google Scholar] [CrossRef]
- Shang, Y.; Yang, Z.; Li, L.; Liao, Q.; Wang, Y. A Super-Large Landslide in Tibet in 2000: Back-ground, Occurrence, Disaster, and Origin. Geo Morphol. 2003, 54, 225–243. [Google Scholar]
- Zhang, X. Seismic analysis of Dongsha Dam at the early stage of water storage in Ahai Hydropower Station. Yunnan Hydropower 2022, 38, 29–32. [Google Scholar]
- Song, D.; Liu, X.; Huang, J.; Wang, E.; Zhang, J. Characteristics of wave propagation through rock mass slopes with weak structural planes and their impacts on the seismic response characteristics of slopes: A case study in the middle reaches of Jinsha River. Bull. Eng. Geol. Environ. 2021, 80, 1317–1334. [Google Scholar] [CrossRef]
- Irons, J.R.; Dwyer, J.L.; Barsi, J.A. The next Landsat satellite: The Landsat data continuity mission. Remote Sens. Environ. 2012, 122, 11–21. [Google Scholar] [CrossRef]
- Roy, D.P.; Wulder, M.A.; Loveland, T.R.; Woodcock, C.E.; Allen, R.G.; Anderson, M.C.; Helder, D.; Irons, J.R.; Johnson, D.M.; Kennedy, R.; et al. Landsat-8: Science and product vision for terrestrial global change research. Remote Sens. Environ. 2014, 145, 154–172. [Google Scholar] [CrossRef]
- Monti-Guarnieri, A.; Tebaldini, S. On the exploitation of target statistics for SAR interferometry applications. IEEE Trans. Geosci. Remote Sens. 2008, 46, 3436–3443. [Google Scholar] [CrossRef]
- Goldstein, R.M.; Werner, C.L. Radar interferogram filtering for geophysical applications. Geophys. Res. Lett. 1998, 25, 4035–4038. [Google Scholar] [CrossRef]
- Chen, C.W. Statistical-Cost Network-Flow Approaches to Two-Dimensional Phase Unwrapping for Radar Interferometry. Ph.D. Thesis, Stanford University, Stanford, CA, USA, 2001. [Google Scholar]
- Malamud, B.D.; Turcotte, D.L.; Guzzetti, F.; Reichenbach, P. Landslide inventories and their statistical properties. Earth Surf. Process. Landf. 2004, 29, 687–711. [Google Scholar] [CrossRef]
- Fan, X.; Xu, Q.; Alonso-Rodriguez, A.; Subramanian, S.S.; Li, W.; Zheng, G.; Dong, X.; Huang, R. Successive landsliding and damming of the Jinsha River in eastern Tibet, China: Prime investigation, early warning, and emergency response. Landslides 2019, 16, 1003–1020. [Google Scholar] [CrossRef]
Publisher’s Note: MDPI stays neutral with regard to jurisdictional claims in published maps and institutional affiliations. |
© 2022 by the authors. Licensee MDPI, Basel, Switzerland. This article is an open access article distributed under the terms and conditions of the Creative Commons Attribution (CC BY) license (https://creativecommons.org/licenses/by/4.0/).