Technical Note

Gale Wind Speed Retrieval Algorithm Using Ku-Band Radar Data Onboard GPM Satellite

Institute of Applied Physics Russian Academy of Sciences, 603950 Nizhny Novgorod, Russia
*
Author to whom correspondence should be addressed.
Remote Sens. 2022, 14(24), 6268; https://doi.org/10.3390/rs14246268
Submission received: 19 October 2022 / Revised: 8 December 2022 / Accepted: 9 December 2022 / Published: 10 December 2022
(This article belongs to the Special Issue Remote Sensing of Ocean Surface Winds)

Abstract

:
An algorithm to retrieve the wind speed within a wide swath from the normalized radar cross section (NRCS) is developed for the data of Ku-band radar operating in scanning mode installed onboard the Global Precipitation Measurement (GPM) satellite. NRCS at the nadir is calculated within a wide swath and is used to obtain the wind speed. The scatterometer data are used to obtain the dependence between NRCS at the nadir and the wind speed for gale winds. The algorithm was validated also using the Advanced Scatterometer (ASCAT) data and revealed good accuracy.

Graphical Abstract

1. Introduction

Tropical cyclone observation is an essential problem in microwave remote sensing. The cyclone’s trajectory can be obtained using the cloud-top image from geostationary satellites. However, monitoring of wind speed evolution in the cyclone demands more frequent measurements. The information about wind speed is retrieved from measurements of the microwave scatterometers, which operate at moderate incidence angles. However, the potential of microwave radars operating at low incidence angles has yet to be thoroughly studied. A number of papers are devoted to retrieving wind speed using radar altimeter measurements [1,2,3]. The methods developed in these papers are based on buoy measurements and are reliable for wind speeds lower than about 18 m/s. At higher wind speeds, buoy tilt and sheltering effects can cause problems. The algorithm development for higher winds from radar altimeter data can be based on scatterometer data. This approach was applied, for example, in [4,5]. In [4], the wind speed in cyclones was retrieved using the information on the normalized radar cross-section (NRCS) only. In [5], a multi-parametric algorithm was developed, also using the information on significant wave height and radiometer measurements.
There is another type of active sensor whose potential for wind speed retrieval is of interest nowadays. These are scanning microwave radars of Ka- and Ku-band of the Dual-frequency Precipitation Radar (DPR) onboard the Global Precipitation Measurement satellite launched in 2014 [6] and Surface Waves Investigation and Monitoring (SWIM) radar onboard the Chinese-French Oceanography Satellite (CFOSAT) launched in 2018. Wind speed retrieval algorithms using the data at low incidence angles from the radars mentioned above were developed, for example, in [7,8,9,10,11]. However, the algorithms for high wind speed retrieval using DPR and SWIM data have not received attention yet. This paper is devoted to the development of a method for gale wind speed retrieval from the Ku-band DPR radar, operating at low incidence angles. The primary mission of the GPM satellite was the measurement of the spatial distribution of precipitation, but in the absence of the latter, information on the underlying surface can be retrieved from NRCS. The ability to monitor the precipitation rate is critical, especially for wind speed retrieval in cyclones.
It is known that NRCS at incidence angles about 8 –10 is practically insensitive to the wind speed [12]. This feature leads to high error in wind speed retrieval from NRCS at such incidence angles [13]. In [11], it was shown that the problem could be solved if the information on the NRCS dependence on incidence angle is taken into account. First, “nadir NRCS” was calculated in a wide swath using the NRCS dependence, and then, the equation for wind speed retrieval was obtained. It was shown that with this approach, the wind speed could be retrieved with good accuracy in the entire swath, including areas corresponding to incidence angles 8 –10 . The equation was obtained using buoy data on wind speed below 18 m/s.
This work logically continues the research work started in [11]. The present paper aims to create the algorithm for retrieval of gale wind speed up to 27 m/s from DPR data using the methodology suggested in [11]. At high wind speeds, buoy data should not be used as in situ reference; thus, in the present paper, the algorithm was developed based on the data of the scatterometer ASCAT onboard the Metop-A satellite to serve as the “ground truth”.

2. NRCS at Nadir

DPR onboard the GPM satellite consists of Ka- and Ku-band radars with the antenna beam width being 0 . 7 , and the antenna footprint dimension being about 5 km. At Ku-band, it observes a 245 km wide swath. The radar operates in scanning mode. The local incidence angle, calculated taking into account the shape of Earth, varies from 18 to 18 .
The primary mission of the GPM satellite is to measure the spatial distribution of precipitation, but the data on the NRCS of the surface are also available. DPR level 2A data include NRCS, local incidence angles, and the antenna footprint coordinates. In addition, the data contain a rain flag and surface-type flag for each incidence angle bin. Data over land or ice are excluded from further processing.
The behavior of the Ku-band signal at low incidence angles at high wind speeds was investigated in [14,15]. In [14], the NRCS dependence on the incidence angle, mean square slope (mss), and the effective reflection coefficient was studied experimentally and theoretically for wind speeds below 40 m/s. In [15], the range of the considered wind speeds was extended to 70 m/s. It was shown that at incidence angles of about 0 –3 , NRCS increases drastically when wind speed increases from about 32 m/s to 40 m/s, and then, becomes generally invariable for higher winds.
However, both papers prove that for wind speeds below 30 m/s, the dependence of the NRCS on the incidence angle is proportional to the probability density function of sea wave slopes which is close to normal distribution. This means that for such wind speed range, the retrieval approach for “nadir NRCS” within a broad swath from [11,16] can be applied. Let us briefly review the idea of the method.
Within the frameworks of the geometrical optics (GO) approximation, the NRCS is proportional to the probability density function of sea surface slopes [17]
σ 0 = π | R e f f 0 | 2 w ( s x , s y ) cos 4 θ ,
where | R e f f θ | 2 is the effective reflection coefficient, θ is the angle of incidence, w ( s x , s y ) denotes the joint probability density function of the sea surface slopes; s x , y = q x , y / q z , where q = k s k i , k i and k s are the wave vectors of incident and scattered radiation, respectively.
The probability density function of the slopes is close to the Gaussian distribution. In this case, (1) takes the form
σ 0 θ = | R e f f 0 | 2 cos 4 θ exp tan 2 θ 2 σ x 2 2 σ x 2 σ y 2 ,
where σ x 2 and σ y 2 are radar-filtered mss along X and Y, respectively, where X is the direction of radar look and Y is a perpendicular direction. From (2), NRCS at nadir can be directly obtained at θ = 0 :
σ 0 0 = | R e f f 0 | 2 2 σ x 2 σ y 2 ,
hence,
σ 0 θ = σ 0 0 cos 4 θ exp tan 2 θ 2 σ x 2 .
This model is valid for incidence angles lower than at least 12 . Around each resolution element of the swath where θ < 12 . 5 , the window of 5 × 5 elements is considered. The linear regression equation is obtained for each window
ln σ 0 ( θ ) cos 4 θ = A + B tan 2 ( θ ) .
Knowing the intercept, one can obtain σ 0 0 in the center of each window as follows
σ 0 ( 0 ) = exp ( A ) .
In this study, only the Ku-band data at 13.6 GHz is used. At this frequency, the atmosphere is mainly transparent in the area of non-precipitating clouds and aerosols, but rain significantly impacts the signal. The advantage of the DPR is the simultaneous information on the rain rate. Areas, where the rain rate exceeds 0.5 mm/h, were excluded from the processing.
An example of data processing is considered for the case of the tropical cyclone Maria. In Figure 1a, the sample of the raw DPR data is presented. In the background, the image of brightness temperature from the radiometer GPM Microwave Imager (GMI) data at 89 GHz, V-polarization shows the position of the hurricane. The precipitation rate within the cyclone is presented in Figure 1b. The obtained “nadir NRCS” within the swath is presented in Figure 2. The gaps in the swath are due to excluding rain-contaminated areas and quality control procedure for the data processing [11].

3. Datasets

The collocated array of scatterometer ASCAT (onboard Metop-A) wind speed data and the “nadir NRCS” derived from the Ku-band DPR data was formed using the observations for 2017 and 2018. The collocation distance was 25 km, and the time lag was not higher than 1 h. The data over land, ice, and rain-contaminated areas are removed from our consideration at the stage of “nadir NRCS” calculation. The total array contains 1,163,500 such “nadir NRCS”/wind speed pairs ( σ 0 ( 0 ) , U 10 A S C A T ) . The array for wind speed above 18 m/s consists of 11,908 pairs. In Figure 3, the histogram of ASCAT wind speeds above 18 m/s is presented.
In Figure 4, the locations of events with wind speeds above 18 m/s in the collocated dataset are presented on the map. The inclination of the GPM orbit is 65 ; thus, the areas at high latitudes are not available for the satellite. It should be noted that almost all the events with wind speed above 18 m/s are concentrated closer to the poles, and tropical cyclones events are almost not represented. Four cases of tropical cyclones are considered in Section 5, and the positions of the cyclones are shown in the figure.

4. High Wind Speed Model

The array was randomly divided into training and validation sets with an equal number of points. The number of elements with wind speed above 18 m/s was also equal in both arrays.
The histogram for the training set is presented in Figure 5. The wind speed range from 18 to 27 m/s was divided into bins of 0.4 m/s. All collocated σ 0 ( 0 ) values within each bin were averaged. The binning procedure aims to balance the contribution of the data corresponding to different wind speeds.
A linear regression for the binned data for high winds was performed, yielding the following expression
U 10 = 3.9 σ 0 + 59.5 , 8.2   dB σ 0 10.5   dB .
For the NRSC above 10.5 dB, the wind speed is calculated using the model from [11]
U 10 = ( a σ 0 + b ) + ( a σ 0 + b ) 2 + c 2 + d , σ 0 > 10.5   dB
where a = 1.92 , b = 28.02 , c = 1.69 , d = 2.02 . In Figure 5, the red line represents the dependence (8) extrapolated to high winds. The blue line represents the dependence (7). It can be seen that the parameterization (8) would underestimate the wind speed. Thus, the parameterization for wind speed retrieval from DPR data consists of two parts: (7) and (8).

5. Discussion and Validation

The model was validated using the second half of the collocated array. In Figure 6, the comparison between DPR and ASCAT wind speed is presented for the validation dataset. Good agreement for all the range of wind speeds up to 27 m/s is observed.
For high wind speeds (where σ 0 ( 0 ) < 10.5 dB), the bias is 0.1 m/s and the standard deviation is 1.8 m/s.
In Figure 7, the distribution of the retrieved wind speed is presented for Hurricane Maria described in Section 2. The obtained wind speed in the areas free of rain reaches 25 m/s.
Hurricane Dorian was observed with the Ku-band DPR instrument on 30 August 2019. The same steps of data processing described in the previous sections are performed and presented in Figure 8. Areas of high winds coincide with areas of intense precipitation; thus, the highest wind speed from the DPR data for this case is 16 m/s in the rain-free areas.
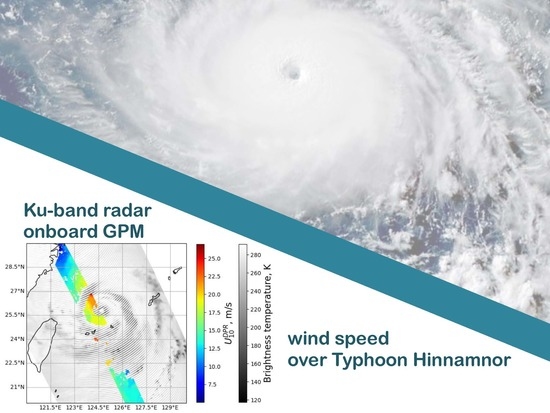
An example of data processing for Typhoon Hinnamnor on 3 September 2022 is presented in Figure 9. Around the typhoon eye, the rain-free ring is observed. The wind speed retrieved from the DPR data close to the cyclone’s center reaches 27 m/s.
Collocation of the DPR and ASCAT tracks was performed for the unnamed cyclone that was observed on 31 January 2015, at 14:30 UTC by DPR and at 12:30 by ASCAT. The maximum wind speed was not high in this cyclone. Wind speed in the DPR swath is presented in Figure 10a, and wind field from ASCAT data is presented in Figure 10b.
The DPR track passes through the center of the cyclone. In Figure 11, the sections along the left side of the DPR swath for DPR (red dots) and ASCAT (black dots) wind speeds are presented. The data of the two radars are in good agreement. However, there is a gap in the ASCAT measurements near the isles, while DPR allows us to obtain the wind speed close to the shore.

6. Conclusions

The wind speed retrieval algorithm for high winds was developed using the data from the Ku-band radar onboard the GPM satellite. The method consists of two steps: retrieval of “nadir NRCS” for a broad swath and calculation of the wind speed from the regression model. The model for gale winds from 18 to 27 m/s was built using ASCAT scatterometer data. The validation revealed good accuracy of the method. The examples of tropical cyclones were considered, and it was shown that DPR and scatterometer data are in good agreement. Possible improvements of the method could include taking into account the effect of the atmosphere using the GMI radiometer data.

Author Contributions

Conceptualization, M.P. and V.K.; methodology, M.P. and V.K.; software, M.P.; validation, M.P.; data curation, M.P.; writing—original draft preparation, M.P.; writing—review and editing, M.P. and V.K.; visualization, M.P. All authors have read and agreed to the published version of the manuscript.

Funding

This work is supported by Russian Science Foundation grant 20-17-00179.

Data Availability Statement

DPR data were downloaded from https://storm.pps.eosdis.nasa.gov, accessed on 5 September 2022, ASCAT data were downloaded from https://podaac-tools.jpl.nasa.gov/hitide/, accessed on 7 September 2022.

Acknowledgments

This work is supported by RSF grant 20-17-00179. We would like to thank Jakov Toporkov, who helped to improve the manuscript, the Academic Editor, and anonymous reviewers for valuable comments.

Conflicts of Interest

The authors declare no conflict of interest.

Abbreviations

The following abbreviations are used in this manuscript:
ASCATthe Advanced Scatterometer
DPRDual Frequency Precipitation Radar
GMIGPM Microwave Imager
GOGeometrical Optics
GPMGlobal Precipitation Measurement
NRCSNormalized Radar Cross Section
UTCCoordinated Universal Time

References

  1. Abdalla, S. Ku-Band Radar Altimeter Surface Wind Speed Algorithm. Mar. Geod. 2012, 35, 276–298. [Google Scholar] [CrossRef] [Green Version]
  2. Gourrion, J.; Vandemark, D.; Bailey, S.; Chapron, B.; Gommenginger, G.P.; Challenor, P.G.; Srokosz, M.A. A Two-Parameter Wind Speed Algorithm for Ku-Band Altimeters. J. Atmos. Ocean. Technol. 2002, 19, 2030–2048. [Google Scholar] [CrossRef]
  3. Karaev, V.Y.; Kanevsky, M.B.; Balandina, G.N.; Cotton, P.D.; Challenor, P.G.; Gommenginger, C.P.; Srokosz, M.A. On the Problem of the Near Ocean Surface Wind Speed Retrieval by Radar Altimeter: A Two-Parameter Algorithm. Int. J. Remote Sens. 2002, 23, 3263–3283. [Google Scholar] [CrossRef]
  4. Quilfen, Y.; Vandemark, D.; Chapron, B.; Feng, H.; Sienkiewicz, J. Estimating Gale to Hurricane Force Winds Using the Satellite Altimeter. J. Atmos. Ocean. Technol. 2011, 28, 453–458. [Google Scholar] [CrossRef]
  5. Sharoni, S.M.H.; Md Reba, M.N.; Hossain, M.S. Tropical Cyclone Wind Speed Estimation From Satellite Altimeter-Derived Ocean Parameters. J. Geophys. Res. Ocean. 2021, 126, e2020JC016988. [Google Scholar] [CrossRef]
  6. Gao, J.; Tang, G.; Hong, Y. Similarities and Improvements of GPM Dual-Frequency Precipitation Radar (DPR) upon TRMM Precipitation Radar (PR) in Global Precipitation Rate Estimation, Type Classification and Vertical Profiling. Remote Sens. 2017, 9, 1142. [Google Scholar] [CrossRef] [Green Version]
  7. Li, L.; Im, E.; Connor, L.; Chang, P. Retrieving ocean surface wind speed from the TRMM Precipitation Radar measurements. IEEE Trans. Geosci. Remote Sens. 2004, 42, 1271–1282. [Google Scholar] [CrossRef]
  8. Bao, Q.; Zhang, Y.; Lang, S.; Lin, M.; Gong, P. Sea Surface Wind Speed Inversion Using the Low Incident NRCS Measured by TRMM Precipitation Radar. IEEE J. Sel. Top. Appl. Earth Obs. Remote Sens. 2016, 9, 5262–5271. [Google Scholar] [CrossRef]
  9. Ren, L.; Yang, J.; Zheng, G.; Wang, J. Wind speed retrieval from Ku-band Tropical Rainfall Mapping Mission precipitation radar data at low incidence angles. J. Appl. Remote Sens. 2016, 10, 1–14. [Google Scholar] [CrossRef]
  10. Hossan, A.; Jones, W.L. Ku- and Ka-Band Ocean Surface Radar Backscatter Model Functions at Low-Incidence Angles Using Full-Swath GPM DPR Data. Remote Sens. 2021, 13, 1569. [Google Scholar] [CrossRef]
  11. Panfilova, M.; Karaev, V. Wind Speed Retrieval Algorithm Using Ku-Band Radar Onboard GPM Satellite. Remote Sens. 2021, 13, 4565. [Google Scholar] [CrossRef]
  12. Chu, X.; He, Y.; Karaev, V.Y. Relationships Between Ku-Band Radar Backscatter and Integrated Wind and Wave Parameters at Low Incidence Angles. IEEE Trans. Geosci. Remote Sens. 2012, 50, 4599–4609. [Google Scholar] [CrossRef]
  13. Ren, L.; Yang, J.; Xu, Y.; Zhang, Y.; Zheng, G.; Wang, J.; Dai, J.; Jiang, C. Ocean Surface Wind Speed Dependence and Retrieval From Off-Nadir CFOSAT SWIM Data. Earth Space Sci. 2021, 8, e2020EA001505. [Google Scholar] [CrossRef]
  14. Yan, Q.; Fan, C.; Zhang, J.; Meng, J. Understanding Ku-Band Ocean Radar Backscatter at Low Incidence Angles under Weak to Severe Wind Conditions by Comparison of Measurements and Models. Remote Sens. 2020, 12, 3445. [Google Scholar] [CrossRef]
  15. Li, X.; Zhang, B.; Mouche, A.; He, Y.; Perrie, W. Ku-Band Sea Surface Radar Backscatter at Low Incidence Angles under Extreme Wind Conditions. Remote Sens. 2017, 9, 474. [Google Scholar] [CrossRef] [Green Version]
  16. Panfilova, M.A.; Karaev, V.Y.; Guo, J. Oil Slick Observation at Low Incidence Angles in Ku-Band. J. Geophys. Res. Ocean. 2018, 123, 1924–1936. [Google Scholar] [CrossRef]
  17. Bass, F.; Fuks, I. (Eds.) Chapter 2—Statistical Formulation of the Diffraction Problem. In Wave Scattering from Statistically Rough Surfaces; International Series in Natural Philosophy; Pergamon: Oxford, UK, 1979; Volume 93, pp. 31–71. [Google Scholar]
Figure 1. (a) Raw data of Ku-band radar over the image of brightness temperature from the GPM Microwave Imager (GMI) data at 89 GHz, V-polarization. The track passed over Hurricane Maria at 12:15 UTC on 23 September 2017; (b) rain rate.
Remotesensing 14 06268 g001
Figure 2. “Nadir normalized radar cross section (NRCS)” over the image of brightness temperature from the GMI data at 89 GHz, V-polarization, Hurricane Maria at 12:15 UTC on 23 September 2017.
Remotesensing 14 06268 g002
Figure 3. Histogram of the Advanced Scatterometer (ASCAT) wind speed above 18 m/s in the collocated dataset.
Remotesensing 14 06268 g003
Figure 4. The locations of high wind speed areas in the collocated dataset and the position of tropical cyclones discussed in Section 5.
Remotesensing 14 06268 g004
Figure 5. Histogram of wind speed dependence on NRCS. The red line represents the dependence (8) extrapolated to high winds (dashed part). The blue line represents the dependence (7).
Remotesensing 14 06268 g005
Figure 6. Comparison between wind speed from the Dual Frequency Precipitation Radar (DPR) and ASCAT data.
Remotesensing 14 06268 g006
Figure 7. Wind speed over the image of brightness temperature from the GMI data at 89 GHz, V-polarization, Hurricane Maria at 12:15 UTC on 23 September 2017.
Remotesensing 14 06268 g007
Figure 8. The DPR track over Hurricane Dorian at 21:33 UTC on 30August 2019. Raw data of Ku-band radar over the image of brightness temperature from the GMI data at 89 GHz, V-polarization (a); rain rate (b); “nadir NRCS” (c); wind speed (d).
Remotesensing 14 06268 g008
Figure 9. The DPR track over Typhoon Hinnamnor at 22:15 UTC on 3 September 2022. Raw data of the Ku-band radar over the image of brightness temperature from the GMI data at 89 GHz, V-polarization (a); rain rate (b); “nadir NRCS” (c); wind speed (d).
Remotesensing 14 06268 g009
Figure 10. Wind speed from the DPR data over the image of brightness temperature from the GMI data at 89 GHz, V-polarization, tropical cyclone at 14:30 UTC on 31 January 2015 (a); wind field from ASCAT data at 12:30 UTC (b).
Remotesensing 14 06268 g010
Figure 11. The section along the left edge of the DPR swath in Figure 10: ASCAT wind speed (black dots), DPR wind speed (red dots).
Remotesensing 14 06268 g011
Publisher’s Note: MDPI stays neutral with regard to jurisdictional claims in published maps and institutional affiliations.

