Abstract
The unmanned aerial vehicle (UAV)-borne hyperspectral imaging system has the advantages of high spatial resolution, flexible operation, under-cloud flying, and easy cooperation with ground synchronous tests. Because this platform often flies under clouds, variations in solar illumination lead to irradiance inconsistency between different rows of hyperspectral images (HSIs). This inconsistency causes errors in radiation correction. In addition, due to the accuracy limitations of the GPS/inertial measurement unit (IMU) and irregular changes in flight platform speed and attitude, HSIs have deformation and drift, which is harmful to the geometric correction and stitching accuracy between flight strips. Consequently, radiation and geometric error limit further applications of large-scale hyperspectral data. To address the above problems, we proposed an integrated solution to acquire and correct UAV-borne hyperspectral images that consist of illumination data acquisition, radiance and geometric correction, HSI, multispectral image (MSI) registration, and multi-strip stitching. We presented an improved three-parameter empirical model based on the illumination correction factor, and it showed that the accuracy of radiation correction considering illumination variation improved, especially in some low signal-to-noise ratio (SNR) bands. In addition, the error of large-scale HSI stitching was controlled within one pixel.
1. Introduction
Unmanned aerial vehicles (UAV) are also called drones. UAV-borne hyperspectral imaging systems have rapidly achieved good application in precision agriculture, forest research, geological and mineral exploration, hydrological research [1], monitoring of reservoirs [2], agriculture [3] and measurements of the geomorphic landforms [4]. Compared to a satellite platform, an UAV has the advantages of flexible operation, high spatial resolution, low operating cost, and data acquisition in dangerous environments [5,6]. Some researchers developed typical day- and night-time photogrammetric models to exploit the application potential of UAV [7].
At present, hyperspectral images (HSIs) can be divided into two types: linear pushbroom and frame-imaging. The data collected by the former sacrifice spatial structure stability to ensure relatively high spectral image fidelity, such as Micro-hyperspec (Headwall Photonics, Bolton, MA, USA) [8], Specim FX [9], MicroHSI 410 SHARK [10,11]. The data obtained via frame imaging maintains a spatial structure feature well, but balancing spectral accuracy and spatial resolution is difficult. The main-frame imaging manner includes an Acousto-Optic Tunable Filter (AOTF) [12] and snapshots such as Cubert UHD185 [11]. A Hyperspectral imager based on an AOTF requires a long imaging time. A snapshot imager is suitable for low-altitude flight, and its data have a relatively low spatial resolution. In addition, there is a hyperspectral imager that uses an internal push scan. By hovering and shooting, hyperspectral data cubes are obtained by a built-in scanning system with the help of a stable flight platform [13].
An UAV-borne hyperspectral imaging system is composed of an UAV, spectral imager, and supplementary components essential for image quality and data acquisition [11]. These components are a GPS inertial measurement unit (GPS/IMU) [14], stabilizing gimbal [15], storage equipment [16], and a ground auxiliary measurement device. Samples of the Headwall Airborne hyperspectral system Nano Hyperspec [8,17] and Corning’s MicroHSI 410 SHARK [10] were built with a high-precision GPS/IMU. The former used proprietary SpectralView® software (version 3.2, Boston, USA) for radiometric and geometric correction by laying reflective whiteboards on the ground. The latter was processed by general commercial software, such as The Environment for Visualizing Images (ENVI), for an image mosaic.
GPS/IMU information is usually used for geometric correction in line-array pushbroom hyperspectral imaging systems. Images between adjacent flight strips can easily be affected by the velocity and attitude of the flight platforms, and this leads to oversampling or undersampling of the ground target. The deformation of ground objects in these images hinders accurate matching between adjacent flight strips and harms the accuracy of the ground object’s geographic information.
With the wide application of the UAV hyperspectral imager, highly precision radiation correction of data is necessary [18,19]. The UAV-borne hyperspectral remote sensing platform is less affected by weather and can work on both overcast and sunny days [20]. When the UAV hyperspectral platform works under clouds, solar illumination variation leads to irradiance inconsistency between different rows of hyperspectral images [19,21]. This inconsistency leads to errors in the radiation correction results. Most of the existing radiation correction methods assume that the images collected by an UAV have radiation consistency. However, it is difficult to improve radiation correction accuracy if the same atmospheric parameters or ground objects are used to correct the collected images.
To reduce the error caused by the desynchronization between the collected time of the illumination and the target, the influence of solar illumination on the ground reflectance calculation should be considered. Burkart et al. used two marine optical spectrometers: one to measure radiation reflected from objects on a multi-rotor UAV, and the other to measure the whiteboard on the ground. This was similar to the classical two-ground spectrograph measurement setup, which provides reflection coefficients by continuously measuring the target and the Lambert reference panel [22]. Mamaghani observed the same object several times during the drone flight for illumination correction. Multiple observations of the target’s reflection can significantly reduce the standard deviation of the healthy crop index [23,24]. Jong-min adopted the Dual ASD Fieldspec®3 Radiometer system by using two mutually calibrated ASD spectrometers that simultaneously collected the target’s standard reference and radiation spectra. The main purpose of the system is to eliminate the illumination variation error when the measurement time is not strictly synchronized [25].
Radiation correction and a geometric mosaic are required for some UAV hyperspectral data applications. In view of the UAV work environment, the convenience of data preprocessing, and radiation quantitative accuracy, we proposed an integrated solution to acquire and correct the UAV hyperspectral imaging system. It consists of an UAV platform, linear array hyperspectral imager, multispectral camera, ground acquisition equipment, and data-processing software module. In this paper, we processed UAV hyperspectral data more conveniently and effectively and improved radiation correction accuracy taking into account the illumination variation and mosaic results between flight strips.
The main contributions of this paper are the following:
- (1)
- Full use of an UAV-borne hyperspectral imaging system that cooperated easily with a ground synchronous test and which included illumination correction to reduce the radiation correction error caused by illumination variation.
- (2)
- Coding of calibration target to recognize the target area quickly and improve automation of radiation correction.
- (3)
- Improvement in total accuracy, especially in low SNR bands, by introducing illumination into our modified three-parameter empirical method.
- (4)
- Addition of a multispectral camera for array imaging under low spatial distortion. If the hyperspectral geometric correction and stitching could not be improved because of accuracy limitations to the position and orientation system (POS), we took an MSI as the base map to achieve accurate hyperspectral geometric correction and stitching over a large area.
The remaining part of this paper is organized as follows. Section 2 introduces the UAV imaging system, methods of geometric correction with MSI and radiation correction considering outdoor illumination variation. We present our data acquisition and results in Section 3. The analysis of extensive experiences is presented in Section 4. Section 5 summarizes the conclusions of this work.
2. Materials and Methods
2.1. UAV Imaging System
The UAV hyperspectral imaging system in this paper consisted of a lightweight UAV, MicroHSI 410 SHARK hyperspectral imager, RedEdge multispectral imager, and a DJI Ronin MX stabilized platform, as shown in Figure 1.
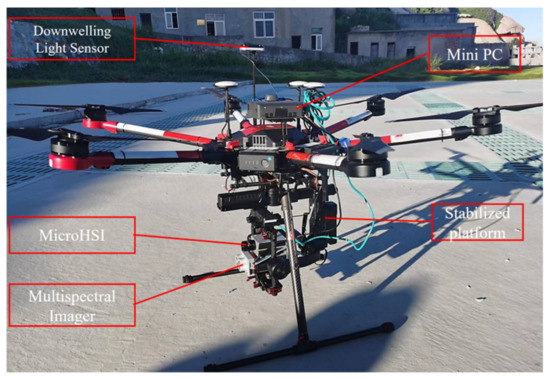
Figure 1.
Photograph of UAV imaging system.
The UAV platform used an M600pro DJI UAV, which is low-cost and easy to operate. The payload is up to 6.0 kg; total weight is 10 kg, including the battery; maximum wind speed is 8 m/s; maximum horizontal flight speed is 18 m/s; hover time without load is 38 min, and the working environment temperature was −10 to 40 C [11]. Considering that power consumption in the ascending and descending stages was greater than in the normal constant flight speed or the safety buffer time required by the flight mission, a single sortie lasted not more than 20 min, and the imaging time was not more than 16 min.
A DJI Ronin MX with multiple power interfaces was selected as the stable platform: weight 2.15 kg and payload 4.5 kg [26]. The platform improved overall stability and reduced high-frequency flight vibration and fierce motion. It was very important for the linear array pushbroom hyperspectral imager to obtain high-quality data. In this paper, the stabilized platform was used to fix simultaneously a hyperspectral imaging system (MicroHSI 410 SHARK), and a multispectral camera (RedEdge-MX) having a total payload of approximately 0.932 kg.
The RedEdge-MX is a compact professional multispectral sensor that integrates easily into multi-rotor and fixed-wing UAV platforms. The multispectral camera captures high-resolution images in five narrow-band spectra and has a spatial resolution of 8 cm/pixel at an altitude of 120 m. Table 1 shows the detailed parameters of the device.

Table 1.
Main specifications for some components of the hyperspectral UAV system.
The MicroHSI 410 SHARK Hyperspectral Imaging system integrates a hyperspectral imager, data acquisition and storage system, and inertial navigation. Its optical module, Offner, is a high-reflection diffraction grating with excellent transmission efficiency, SNR, spectral fidelity, and spatial resolution. Detailed equipment parameters are shown in Table 1.
In addition, the inertial navigation system (INS) recorded the irregularity of the data acquisition track, a slight change in attitude, and height. The post-processing software then geometrically corrects the data according to the accurate position and attitude information. The INS of the hyperspectral imager provides the position and attitude of each frame, which is updated at the frequency of 200 Hz. Each frame of data is accurately time-stamped when acquired. This kind of file is called the navigation file of the instrument. The recording format of the instrument includes a text file and ENVI Input Geometry (IGM) file. The text file stores each line of navigation data, including acquisition time, position and attitude information. The IGM file contains the latitude and longitude of each pixel in the image.
The above two spectral devices are installed in the framework of DJI ronin MX to ensure that the spectral devices observe vertically downward in a stable attitude when collecting data in flight. The interface for both spectrometers is browser-based, requiring no additional software on the client machine.
2.2. Ground Auxiliary Correction System
2.2.1. Downwelling Irradiance Measurement Device
The atmospheric downwelling irradiance measuring device (DIMD) consisted of an analytical spectral device (ASD) and a cosine corrector (Figure 2a). In addition, downwelling irradiance at each moment had a GPS time stamp, which was convenient for time matching with each frame of data collected by the hyperspectral imager. To improve the accuracy of solar downline irradiance measurement [27], the DIMD was equipped with a cosine corrector to collect radiance up to a 180 solid angle and eliminate optical coupling problems caused by geometric limitation [28]. The spectral resolution obtained by the ASD was 1 nm. To ensure that the downwelling irradiance measured by ASD and the hyperspectral images had the same spectral resolution, spectral sampling was used to preprocess the downwelling irradiance data. Figure 2b shows the variation of outdoor downwelling irradiance over time. The DIMD did not need calibration, and it calculated the relative downwelling irradiance variation.
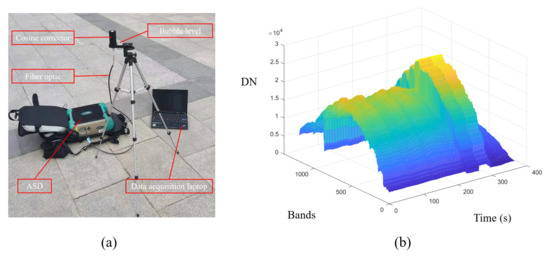
Figure 2.
(a) The atmospheric Downwelling Irradiance Measuring Device (DIMD) and (b) the variation of outdoor downwelling irradiance over time.
2.2.2. QR Code Target Extraction System
To improve the automation of the UAV hyperspectral radiation correction, we extracted the calibration targets by searching the image’s QR code for radiation correction, and finally obtaining the reflectance image. The calibration targets were made of polyurethane (PU) leather with good spectral flatness and Lambert property and had varied gray levels and reflectance. Using calibration targets with multiple gray levels is convenient for ensuring the accuracy of radiation correction; even the nonlinear influence is strong.
The QR code is printed on an oilcloth of the same size as the calibration target. The QR code interface is shown in Figure 3. The program interface included image reading, parameter setting, and curve drawing. The QR code was designed to store reflectance information of the calibration targets, which helps ascertain the location of calibration targets in UAV images. This method of extracting calibration target reflectance information was also helpful for realizing real-time correction of UAV images.
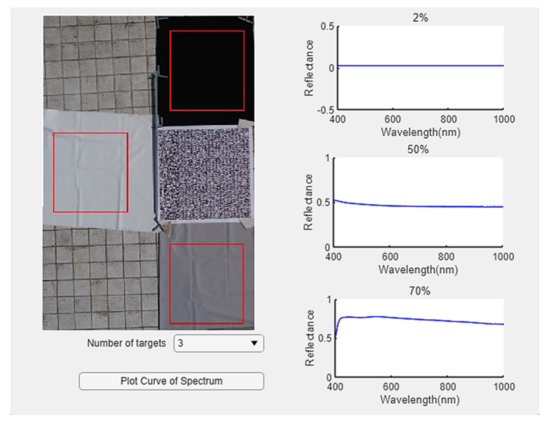
Figure 3.
The interface of QR code target extraction system.
2.3. Data Processing Workflow
The data processing flow is shown in Figure 4. The data type included hyperspectral and multispectral images, both of which needed radiation and geometric correction. Radiation correction adopted the laboratory calibration coefficient. The radiation-corrected multispectral data needed registration and layer stacking of different bands between images. We then performed geometric correction and mosaic processing to obtain multispectral large-area images. RedEdge-MX is an area array imaging sensor that retains a spatial texture structure well. It is less disturbed by the airflow during flight or the attitude change of the UAV and completes geometric correction with high accuracy by relying only on GPS/IMU information. After the radiation calibration of hyperspectral images, we performed illumination correction, calculated the radiation correction parameters using multiple gray targets, and then verified the results. For geometric processing, we used the line-wise coordinate and attitude information synchronized with hyperspectral pushbroom imaging to conduct geometric correction. Because of the influence of GPS accuracy, wind speed and the performance of the stabilized platform, the geometric correction of a single strip did not satisfy the inter-strip mosaic. In this paper, we took the MSI as the base map, registered the HSI strip by strip, and finally stitched and obtained a large-area HSI.
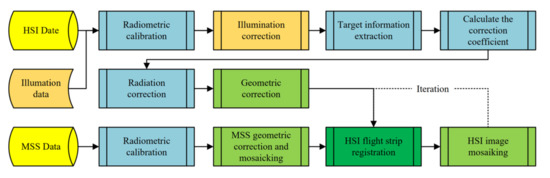
Figure 4.
Data processing flow chart.
2.3.1. Radiance and Surface Reflectance Computation
The hyperspectral imager was calibrated before leaving the factory, and all images were converted into radiance images through calibration coefficients. Periodic laboratory or field calibration of the instrument is recommended for monitoring changes in the radiation performance of the equipment [1]. The radiation correction of this study mainly included the following two parts.
- (1)
- Illumination correction
The flight altitude of the UAV remote-sensing platform was often below the clouds, and the solar illumination changed rapidly due to the influence of the cloud cover, causing the image to be bright or dark. Some processing methods for image uniformity correction include the histogram-matching [29] and linear-transformation [30] methods. Hyperspectral remote sensing focuses on representing the quantitative information of ground objects. We not only pursue the consistency of the visual effects, but also analyzed and considered the cause of the change in radiance. Image brightness was not uniform due to the change in solar illumination and heterogeneity of the atmosphere. This kind of problem needs to be solved by quantifying downward illumination information [24].
Variations in solar illumination and the atmosphere changed the downwelling irradiance at the imaging moment. We used the DIMD for continuous observation of the downward irradiance. To avoid errors caused by a varying observation angle and stray light, the cosine corrector was placed in an open area toward the zenith. We set the downwelling irradiance data at a certain time to be the reference value, but when DIMD observation values at other times were different, illumination correction between the image lines had to be conducted. The frequency of DIMD data collection had to be higher than that of UAV data collection. The acquisition time of pushbroom lines cannot match the measurement time of DIMD completely, so we interpolated the time dimension to address the problem.
The results measured by the DIMD needed to be equivalent and integrated into the corresponding channel of the hyperspectral imager with the following formula: [31]:
where and is the maximum and minimum wavelength of each band, denotes spectral response of the band . L represents the radiance collected by the sensor, i is band number.
We matched the acquisition time of downwelling irradiance value L and hyperspectral push broom , and treated the illumination at a certain time as the benchmark. Then, we obtained the illumination correction coefficient line-wise of each band by dividing the illumination of benchmark.
- (2)
- Atmospheric correction
In our study, we calculated the surface reflectance by considering illumination correction using the empirical linear method (ELM), which is often used for atmospheric correction. It established a linear regression relationship between the recorded image value and the actual measured value (bright target and dark target of more than two ground targets) in each band, calculated its linear gain coefficient and deviation value, and then corrected other pixel values [32]. We added illumination correction to improve the method as follows:
where, is the radiance of the target region in the image, is the reflectance of target surface; a and b are linear regression coefficients between the ground reflectance and the radiance measured by the UAV imager.
Hao et al. proposed a three-parameter empirical method to compensate for the multiple scattering effects ignored by the traditional ELM, but the effect was more obvious under the condition of a heavy aerosol [11]. After considering the influence of downwelling irradiance variation, the improved formula is as follows:
where, A, B and C are the conversion coefficients. They represent the path radiation, the hemispheric albedo at the bottom of atmosphere, and the additional parameters. Therefore, at least three different calibration targets are used in the flight area to obtain these three parameters. The setting of the calibration targets is shown in Figure 3.
2.3.2. Georeferencing and Mosaic
The linear array pushbroom hyperspectral imager acquires spatial dimension information with the motion of the UAV platform. All spectral information in the calibration target area of the linear array field of view is obtained in each frame to ensure spectral purity. However, this spatial dimension pushbroom method is inevitably affected by airflow, UAV vibration, and attitude stability, which will lead to the dislocation of spatial structure information. Therefore, geometric correction is necessary.
Due to the influence of detector size, imaging field of view, and flight height and weight, the imaging range of an UAV hyperspectral single strip is limited. It is necessary to splice images of different strips in a large-scale airborne quantitative application. The offset and dislocation of adjacent strips have randomness, which increases the difficulty of the strip mosaic. Usually, POS accuracy cannot satisfy a multistrip mosaic.
Our experiment included the geometric correction and mosaic of MSI and HSI data. The Pix4d software was used for the MSI geometric correction of RedEedge data. The Pix4d mapper is an automatic and fast piece of UAV-processing software that integrates remote-sensing image processing, photogrammetry, and spatial information processing. Image and GPS information was imported through the pix4d mapper, and a topological relationship between the images was established. We then calculated the external orientation elements of the original image and the coordinates of the corresponding ground points through the forward intersection. Finally, we conducted feature-point matching and a mosaic [33]. Geometric self-correction and registration of HSI were carried out strip by strip with MSI as the base map.
The geometric course correction of hyperspectral data mainly depended on the GPS/IMU information recorded in each image frame [11]. We registered hyperspectral and multispectral data with the commercial software ENVI Modeler. It has a visual interface and rapid implementation of complex workflow and image batch processing. The operation of the ENVI Modeler is flexible, and our modeling flow is shown in Figure 5.
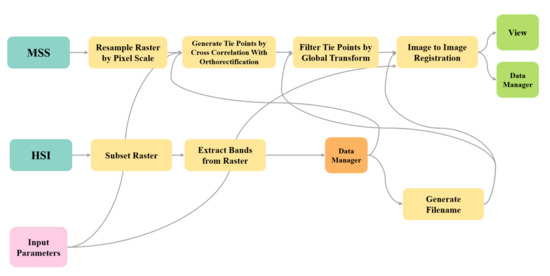
Figure 5.
Our modeling flow by ENVI Modeler.
First, we resampled the multispectral image to the same resolution as the hyperspectral image and selected the bands. Then, a single file of control points to which corresponding multispectral images were generated. Each band interval of a multispectral image corresponds to the bands of multiple hyperspectral images. The number of control points can be increased by band-wise iterative generation to improve the registration accuracy. After registration, we stitched different strip images to obtain a large-area hyperspectral image.
3. Experiments and Analysis
3.1. Data Acquisition
We conducted the field experiment in the industrial park in Xi’an (34.10N;108.51E), Shaanxi province, China, on 30 May 2022. During the experiment, the flight altitude of the UAV was 50 m; the spatial resolution of the 410 SHARK hyperspectral camera was 0.037 × 0.037 m, and the spatial resolution of the RedEdge multispectral camera was 0.040 × 0.040 m. The weather was sunny with a few clouds. The flight time exceeded 3 h.
To facilitate the establishment of the radiation correction model and the verification of data processing, we laid nine calibration targets of different gray levels on a building roof in the flight area. The reflectance of the calibration target was 2, 5, 10, 20, 40, 50, 60, and 70%. The reflectance of each calibration target was measured with a ground object spectrometer (the ASD FieldSpec 4) and the standard whiteboard [5].
Solar illumination changes were obvious during the experiment. The UAV flight path is shown in Figure 6. The measured reflectance curve of the calibration target is shown in Figure 7.
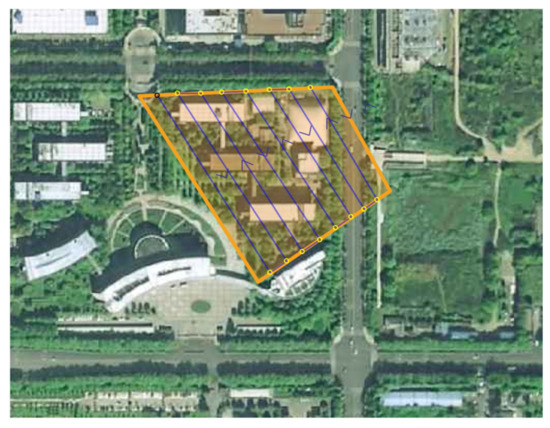
Figure 6.
The UAV flight path.
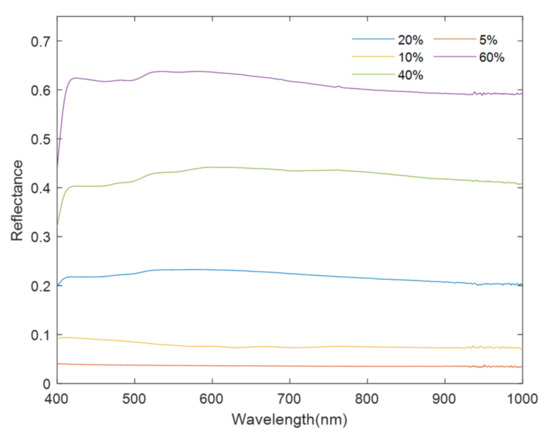
Figure 7.
The measured reflectance curve of the calibration target.
3.2. Radiance and Surface Reflectance Computation
In our experiment, we adopted two- and three-parameter ELM models to calculate the radiation correction coefficients. Then, the reflectivity image was calculated by the radiation correction coefficients. We analyzed and evaluated the results by comparing the multi-level calibration target in the reflectivity image and the field measurement. When using the two-parameter ELM model for calculation, we chose 50 and 70% calibration targets for the linear regression calculation to obtain the radiation correction coefficients. When using the three-parameter ELM model for calculation, we chose 2, 50, and 70% calibration targets. The field measurement values are shown in Figure 5.
With consideration of the influence of solar illumination and atmosphere non-uniform variation on the calculation of surface reflectance, we added the illumination correction factor (Formula (4)) to the two-parameter and three-parameter models based on the traditional ELM method and calculate the surface reflectance. The multi-gray level calibration targets are used to compare the calculation results with and without illumination correction factors.
Figure 8 shows the reflectance of the calibration targets obtained from ground measurement and extracted from reflectance images by the ELM method with or without illumination variance. Figure 9 shows the corresponding absolute error curves of the calibration targets. Different colors represent different gray-level calibration targets. The area of the color denotes the error value. The reflectance of the calibration targets were 5, 10, 20, 40, and 60%. Figure 10 indicates the difference in calibration target reflectance obtained by ground measurement and calculated with the three-parameter method with or without illumination variance. Figure 11 reveals the corresponding absolute error curve of each gray-level calibration target. Table 2 shows the average of absolute errors with the three-parameter method and ELM (with or without illumination variation).
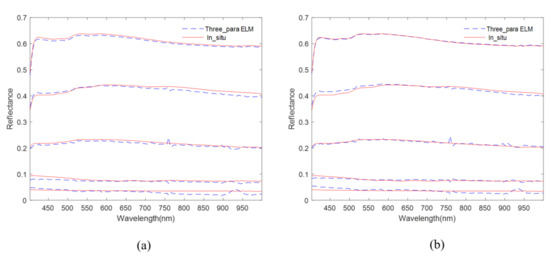
Figure 8.
Comparison of the reflectance results of multi-gray level calibration target retrieved by three-parameter empirical method with in suit measurement results: (a) Three parameter empirical method; and (b) three parameter empirical method of adding illumination correction.
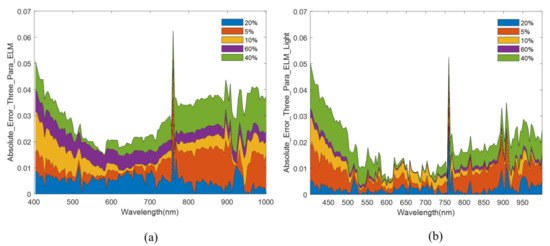
Figure 9.
The absolute error between the retrieved results of multi-gray level target and in suit measurement results: (a) ELM method; and (b) ELM method of adding illumination correction.
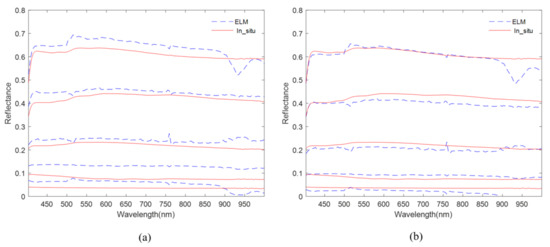
Figure 10.
Comparison of the reflectance results of multi-gray level target retrieved by ELM method with in suit measurement results: (a) ELM method; and (b) ELM method of adding illumination correction.
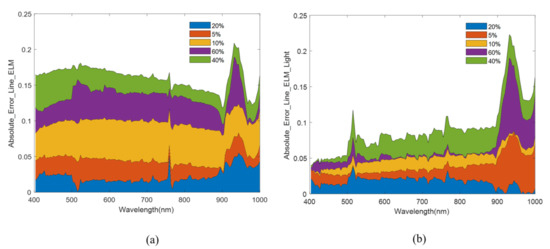
Figure 11.
The absolute error between the retrieved results of multi-gray level calibration target and in suit measurement results: (a) ELM method; and (b) ELM method of adding illumination correction.
Table 2.
Mean absolute error of different calibration targets.
3.3. Image Registration and Mosaic Results
The true color results of MSI registration and the mosaic in this experiment are shown in Figure 12a. It can be seen that the spatial structure and relative position were well preserved, and there was no dislocation between different strips. The result of the geometric correction of the HSI (Figure 12b) was based on its GPS/IMU information. After geometric correction, each pixel was given geographical location reference information. The overlapping area of adjacent flight bands has dislocation and distortion, as shown in Figure 12b. This dislocation was more obvious at the edges of buildings of a certain height. Figure 12c shows the band-wise image registration results of the HSI and MSI. The dislocation between the repeated regions of adjacent bands was greatly reduced. Figure 12d shows the final large-area mosaic results. For comparison, the true color results of input geometry (IGM) correction and mosaic results are shown in Figure 13. Figure 13a shows the result of IGM of the hyperspectral data. Although there is a large overlap between the flight strips, due to the influence of GPS accuracy, there are large gaps between the flight strips, which is harmful to the stitching of large-scale images. Figure 13b shows the mosaic result of IGM geometric correction. Splicing can fill some gaps. However, it cannot completely remove the gaps. There are obvious dislocations between different flight strips. This also proves that for low-precision GPS, it is necessary to register each flight strip with MSI.
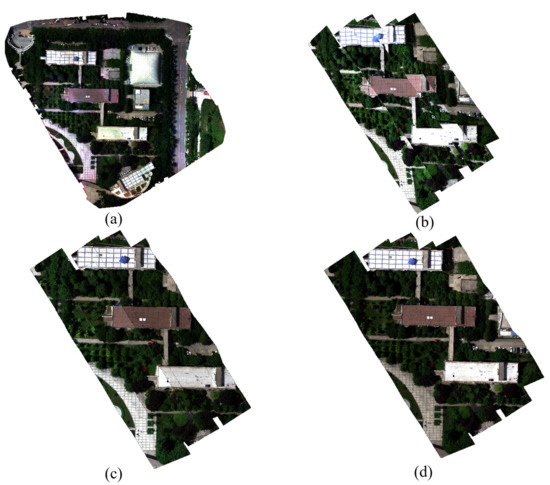
Figure 12.
(a) Mosaic results of MSI; (b) HSI images with geometric correction; (c) HSI images of (b) registered with MSI; and (d) Mosaic result of HSI.
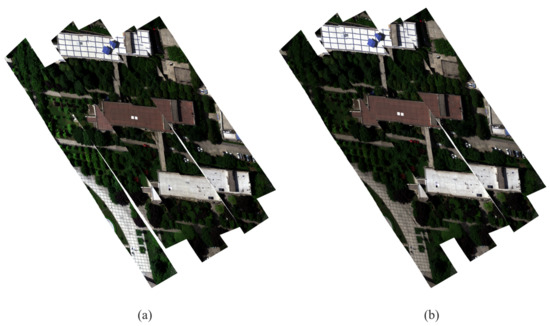
Figure 13.
Results of IGM: (a) IGM geometric correction result; and (b) Mosaic result of IGM geometric correction.
We adopted the Root Mean Square Error (RMSE), Correlation Coefficient (CC), and joint histogram to evaluate the registration results quantitatively as shown in Table 3. To evaluate the registration accuracy of the target and reference images, we selected a certain number of homonymous feature points on the image and reference image, and calculated their RMSE on the x and y directions as well as the total RMSE. CC was used to measure the overall linear correlation. The joint histograms directly reflected the change in correlation between the reference image and the results as shown in Figure 14.
Table 3.
The accuracy evaluation of mosaic results.
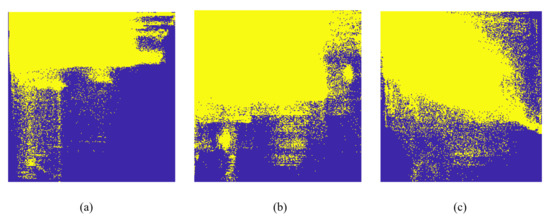
Figure 14.
The joint histogram. (a) IGM geometric correction; (b) GPS+IMU geometric correction; (c) GPS+IMU geometric correction with registration. Blue is the background, and yellow dots represent shared pixels in the joint histogram.
4. Discussion
We analyzed the results of UAV hyperspectral data processing focused on radiation correction and geometric registration. For the radiance correction, we improved the accuracy of reflectivity through illumination correction. For the geometric registration, we combined the advantages of an MSI and an HSI from the same platform to improve the geometric correction and stitching of an HSI of a large area.
From the proximity of retrieved curves to in suit measurement curves in Figure 8, and the absolute error area in Figure 9, illumination correction can reduce the absolute error of the reflectivity curve. The inverted reflectance curve was closer to the measured ground curve. Without considering the illumination variance, the error decreased with the increase in wavelength. If we consider the illumination variance, the error tended to be stable with the change of wavelength, but in the 900–1000 nm band range, the error increased significantly. This was related to the response and linearity decrease in the detector near 1000 nm.
The absolute error of the reflectance curve was significantly reduced after illumination correction in Figure 10 and Figure 11. The area of the curve in Figure 11 represented the variance of the error. Overall, the error showed a high trend at both ends and a low trend in the middle, but the error of some bands was large. In the range of 400–590 nm, the error decreased gradually, mainly because in the VNIR band range, light scattering decreased with the increase in wavelength. In the blue band, atmospheric scattering was the most significant, but as the wavelength increased, the atmospheric scattering gradually decreased, and the influence on light radiation transmission became smaller, so the error decreased. In the 590–760 nm range, the error was relatively small. Affected by the oxygen absorption front, the error at 760 nm had obvious fluctuations. After illumination correction, the error of the data was obviously reduced. The error of 760–1000 nm increased gradually due to the decrease in transmittance of the optical system and the response of the end detector. However, the trend of error increase slowed down after the illumination correction. The error fluctuation at 960 nm was mainly due to the influence of water vapor absorption.
In Figure 8 and Figure 10, our comparison results indicated that the reflectance calculated by the three-parameter method was a better fit for the trend of different bands and gray-scale calibration targets. The curve was more stable and closer to the measured value on the ground, and there were fewer abnormal values.
We calculated the mean absolute error of the above methods in Table 2. The error of the three-parameter method with the illumination correction factor became smaller and the surface reflectance accuracy was higher. An UAV often works under non-clear and cloudless weather conditions and flies at an altitude below 1 km. The multiple scattering effects between the ground and the bottom of the atmosphere cannot be ignored and is more obvious when the aerosol optical thickness (AOT) is large. The three-parameter method compensated for the multiple scattering effects between the ground and the atmosphere, and the model with illumination correction factor constrained the influence of the downward radiation variance on the radiation correction. The three-parameter method is recommended for deriving the reflectance of an UAV imager, especially under non-ideal weather conditions.
For GPS+IMU geometric correction and stitching, we selected 48 groups of feature points to calculate the RMSE. A smaller number indicated higher registration accuracy. Table 3 shows that the RMSE in the x and y directions and the total RMSE were significantly reduced with registration. For unregistered images, the RMSE in the y direction was higher. This may have been caused by a change in wind speed and direction during the UAV flight. After registration, the RMSE in the y direction was significantly reduced and smaller than for the x direction, which indicated that registration helped reduce the effect of non-uniform platform motion on image sampling. In addition, it also showed that the mosaic of the adjacent flight band was more easily affected by the change in the UAV flight course. In Table 3, we can see that the CC value improved significantly after registration, as did registration accuracy. Meanwhile, we compared our results with IGM correction, which is used for Corning’s 410 microHSI. Our GPS+IMU geometric correction with and without registration all performed better than IGM correction.
The joint histogram counted the frequency of gray values of two pixels at the same position in two images. According to the statistical correlation characteristics, more and more points were concentrated on the diagonal when the matching accuracy between the two images improved. On the other hand, more and more points were distributed outside the diagonal. In Figure 14c, the registered joint histogram was closer to the diagonal than Figure 14a,b. This indicated that the pixels and actual geographic coordinates of the HSI were closer to the MSI, and our method with registration performed better than IGM. We adopted the MSI frame image as the base map for registration and stitching, which was actually a solution when the GPS/IMU could not improve geometric positioning accuracy and large-scale HSI stitching quality. This method greatly reduced the GPS slip effect, wind direction and speed changes, and the effect of inconsistent accuracy between the push and linear array of the pushbroom HSI. We simplified the complex and difficult problem caused by multiple factors into a controllable process of image registration.
5. Conclusions
In this paper, we proposed a solution for HSI and MSI system integration and data processing. We took into account the characteristics of the operating environment of an UAV platform (such as changing wind and light conditions) and combined the advantages of an MSI and HSI (linear pushbroom) for data acquisition. For radiation correction, we presented an improved three-parameter empirical model by combining the data of downward irradiance. The model helped improve the robustness of radiometric correction accuracy when illumination varied and improved the reflectance accuracy of low SNR bands. For geometric correction and stitching, we took an MSI as the base map under the condition of limited GPS/IMU precision. We completed high-precision geometric correction of HSI data and a wide range of multi-strip stitching. The image-matching error was controlled within one pixel. At present, the geometric registration accuracy of the system depends mainly on the geometric parameter information of the MSI. To improve performance in future research, we will add RTK to the process of MSI data acquisition and verify the effect through the real geographical location. Furthermore, we intend to improve the overall spatial resolution and the spectral resolution of the platform system through data fusion.
Author Contributions
Conceptualization, H.L., L.S. and T.C.; methodology, L.S., H.L. and J.C.; supervision, J.F. and Q.W.; formal analysis, S.L., J.C. and H.L.; writing—original draft preparation, H.L., L.S. and T.C.; writing—review and editing, J.F. and Q.W. All authors have read and agreed to the published version of the manuscript.
Funding
National Natural Science Foundation of China (No.42101380), Natural Science Foundation of Shaanxi Province (No.2021JQ-324), National Key Research and Development Program of China (2022YFF1300201). We thank the support of China Scholarship Council. Program of China (2016YFB0500304 and 2016YFD0300603).
Data Availability Statement
Not applicable.
Conflicts of Interest
The authors declare no conflict of interest. The funders had no role in the design of the study; in the collection, analyses, or interpretation of data; in the writing of the manuscript, or in the decision to publish the results.
References
- Colomina, I.; Molina, P. Unmanned aerial systems for photogrammetry and remote sensing: A review. ISPRS J. Photogramm. Remote Sens. 2014, 92, 79–97. [Google Scholar] [CrossRef]
- Erena, M.; Atenza, J.F.; García-Galiano, S.; Domínguez, J.A.; Bernabé, J.M. Use of drones for the topo-bathymetric monitoring of the reservoirs of the Segura River Basin. Water 2019, 11, 445. [Google Scholar] [CrossRef]
- Holasek, R.; Nakanishi, K.; Ziph-Schatzberg, L.; Santman, J.; Woodman, P.; Zacaroli, R.; Wiggins, R. The selectable hyperspectral airborne remote sensing kit (SHARK) as an enabler for precision agriculture. In Proceedings of the 2017 Society of Photo-Optical Instrumentation Engineers (SPIE), Anaheim, CA, USA, 22–25 May 2017. [Google Scholar]
- Specht, C.; Lewicka, O.; Specht, M.; Dąbrowski, P.; Burdziakowski, P. Methodology for carrying out measurements of the tombolo geomorphic landform using unmanned aerial and surface vehicles near Sopot Pier. Pol. J. Mar. Sci. Eng. 2020, 8, 384. [Google Scholar] [CrossRef]
- Haiwei, L.; Hao, Z.; Bing, Z.; Zhengchao, C.; Minhua, Y.; Yaqiong, Z. A Method Suitable for Vicarious Calibration of a UAV Hyperspectral Remote Sensor. IEEE J. Sel. Top. Appl. Earth Obs. Remote Sens. 2015, 8, 3209–3223. [Google Scholar]
- Zhong, Y.; Wang, X.; Xu, Y.; Wang, S.; Jia, T.; Hu, X.; Zhao, J.; Wei, L.; Zhang, L. Mini-UAV-Borne Hyperspectral Remote Sensing from Observation and Processing to Applications. IEEE Geosci. Remote Sens. Mag. 2018, 6, 46–62. [Google Scholar] [CrossRef]
- Burdziakowski, P.; Bobkowska, K. UAV Photogrammetry under Poor Lighting Conditions—Accuracy Considerations. Sensors 2021, 21, 3531. [Google Scholar] [CrossRef]
- Rodionov, I.D.; Rodionov, A.I.; Vedeshin, L.A.; Vinogradov, A.N.; Egorov, V.V.; Kalinin, A.P. Airborne hyperspectral systems for solving remote sensing problems. Izv. Atmos. Ocean. Phys. 2014, 50, 989–1003. [Google Scholar] [CrossRef]
- Ma, T.; Schimleck, L.; Dahlen, J.; Yoon, S.C.; Inagaki, T.; Tsuchikawa, S.; Sandak, A.; Sandak, J. Comparative performance of NIR-Hyperspectral imaging systems. Foundations 2022, 2, 523–540. [Google Scholar] [CrossRef]
- Kwon, S.; Seo, I.W.; Noh, H.; Kim, B. Hyperspectral retrievals of suspended sediment using cluster-based machine learning regression in shallow waters. Sci. Total Environ. 2022, 833, 155168. [Google Scholar] [CrossRef]
- Zhang, H.; Zhang, B.; Wei, Z.; Wang, C.; Huang, Q. Lightweight Integrated Solution for a UAV-Borne Hyperspectral Imaging System. Remote Sens. 2020, 12, 657. [Google Scholar] [CrossRef]
- Liu, H.; Yu, T.; Hu, B.; Hou, X.; Zhang, Z.; Liu, X.; Liu, J.; Wang, X.; Zhong, J.; Tan, Z.; et al. UAV-Borne Hyperspectral Imaging Remote Sensing System Based on Acousto-Optic Tunable Filter for Water Quality Monitoring. Remote Sens. 2021, 13, 4069. [Google Scholar] [CrossRef]
- Yi, X.S.; Lan, A.J.; Wen, X.M.; Zhang, Y.; Li, Y. Monitoring of heavy metals in farmland soils based on ASD and GaiaSky-mini. Chin. J. Ecol. 2018, 37, 1781. [Google Scholar]
- Angelino, C.V.; Baraniello, V.R.; Cicala, L. UAV position and attitude estimation using IMU, GNSS and camera. In Proceedings of the 15th International Conference on Information Fusion, Suntec Convention Hall, Singapore, 9–12 July 2012. [Google Scholar]
- Xiang, B.; Mu, Q. Gimbal control of inertially stabilized platform for airborne remote sensing system based on adaptive RBFNN feedback model. IFAC J. Sys. Control 2021, 16, 100148. [Google Scholar] [CrossRef]
- Kidd, T.; Yu, Z.; Dobbs, S.; Anderson, K.R.; Oetting, G.; Kim, J.; O’Connell, M. UAV Power Management, Generation, and Storage System Principles and Design. In Proceedings of the 2020 IEEE Conference on Technologies for Sustainability (SusTech), Santa Ana, CA, USA, 23–25 April 2020. [Google Scholar]
- Headwall. Available online: https://www.headwallphotonics.com (accessed on 6 February 2021).
- Aasen, H.; Burkart, A.; Bolten, A.; Bareth, G. Generating 3D hyperspectral information with lightweight UAV snapshot cameras for vegetation monitoring: From camera calibration to quality assurance. ISPRS J. Photogramm. Remote Sens. 2015, 108, 245–259. [Google Scholar] [CrossRef]
- Zarco-Tejada, P.J.; González-Dugo, V.; Berni, J.A. Fluorescence, temperature and narrow-band indices acquired from a UAV platform for water stress detection using a micro-hyperspectral imager and a thermal camera. Remote Sens. Environ. 2012, 117, 322–337. [Google Scholar] [CrossRef]
- Sheng, H.; Chao, H.; Coopmans, C.; Han, J.; McKee, M.; Chen, Y. Low-cost UAV-based thermal infrared remote sensing: Platform, calibration and applications. In Proceedings of the 2010 IEEE/ASME International Conference on Mechatronic and Embedded Systems and Applications, Qingdao, China, 15–17 July 2010. [Google Scholar]
- Jia, J.; Wang, Y.; Chen, J.; Guo, R.; Shu, R.; Wang, J. Status and application of advanced airborne hyperspectral imaging technology: A review. Infra. Phy. Techn. 2019, 104, 103115. [Google Scholar] [CrossRef]
- Burkart, A.; Cogliati, S.; Schickling, A.; Rascher, U. A Novel UAV-Based Ultra-Light Weight Spectrometer for Field Spectroscopy. IEEE Sens. J. 2013, 14, 62–67. [Google Scholar] [CrossRef]
- Mamaghani, B.; Salvaggio, C. Comparative study of panel and panelless-based reflectance conversion techniques for agricultural remote sensing. arXiv 2019, arXiv:1910.03734. [Google Scholar]
- Schneider-Zapp, K.; Cubero-Castan, M.; Shi, D.; Strecha, C. A new method to determine multi-angular reflectance factor from lightweight multispectral cameras with sky sensor in a target-less workflow applicable to UAV. Remote Sens. Environ. 2019, 229, 60–68. [Google Scholar] [CrossRef]
- Yeom, J.M.; Ko, J.; Hwang, J.; Lee, C.S.; Choi, C.U.; Jeong, S. Updating Absolute Radiometric Characteristics for KOMPSAT-3 and KOMPSAT-3A Multispectral Imaging Sensors Using Well-Characterized Pseudo-Invariant Tarps and Microtops II. Remote Sens. 2018, 10, 697. [Google Scholar] [CrossRef]
- Ronin, M.X. Available online: https://store.dji.com/cn/product/ronin-mx (accessed on 6 February 2021).
- Bendig, J.; Gautam, D.; Malenovský, Z.; Lucieer, A. Influence of Cosine Corrector and Uas Platform Dynamics on Airborne Spectral Irradiance Measurements. In Proceedings of the IGARSS 2018—2018 IEEE International Geoscience and Remote Sensing Symposium, Valencia, Spain, 22–27 July 2018. [Google Scholar]
- Aasen, H.; Honkavaara, E.; Lucieer, A.; Zarco-Tejada, P.J. Quantitative Remote Sensing at Ultra-High Resolution with UAV Spectroscopy: A Review of Sensor Technology, Measurement Procedures, and Data Correction Workflows. Remote Sens. 2018, 10, 1091. [Google Scholar] [CrossRef]
- Stark, A.J. Adaptive image contrast enhancement using generalizations of histogram equalization. IEEE Trans. Image Proces. 2000, 9, 889–896. [Google Scholar] [CrossRef]
- Canty, M.J.; Nielsen, A.A. Automatic radiometric normalization of multitemporal satellite imagery with the iteratively re-weighted MAD transformation. Remote Sens. Environ. 2008, 112, 1025–1036. [Google Scholar] [CrossRef]
- Guo, Y.; Chen, S.; Li, X.; Cunha, M.; Jayavelu, S. Machine Learning-Based Approaches for Predicting SPAD Values of Maize Using Multi-Spectral Images. Remote Sens. 2022, 14, 1337. [Google Scholar] [CrossRef]
- Smith, G.M.; Milton, E.J. The use of the empirical line method to calibrate remotely sensed data to reflectance. Int. J. Remote Sens. 1999, 20, 2653–2662. [Google Scholar] [CrossRef]
- De Oca, A.M.; Flores, G. The AgriQ: A low-cost unmanned aerial system for precision agriculture. Expert Syst. App. 2021, 182, 115163. [Google Scholar] [CrossRef]
Publisher’s Note: MDPI stays neutral with regard to jurisdictional claims in published maps and institutional affiliations. |
© 2022 by the authors. Licensee MDPI, Basel, Switzerland. This article is an open access article distributed under the terms and conditions of the Creative Commons Attribution (CC BY) license (https://creativecommons.org/licenses/by/4.0/).