


Landslide Risk Assessment in Eastern Kentucky, USA: Developing a Regional Scale, Limited Resource Approach
 , ,
, ,  , ,
, ,
Abstract
1. Introduction
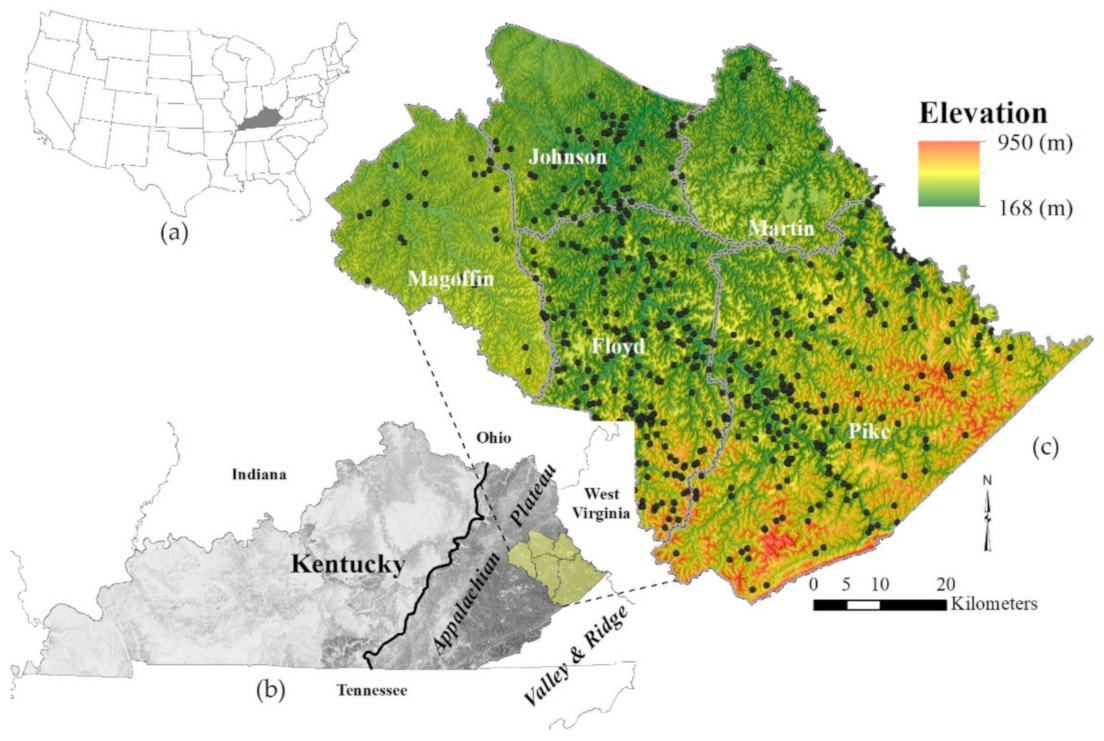
2. Study Area
2.1. Geology
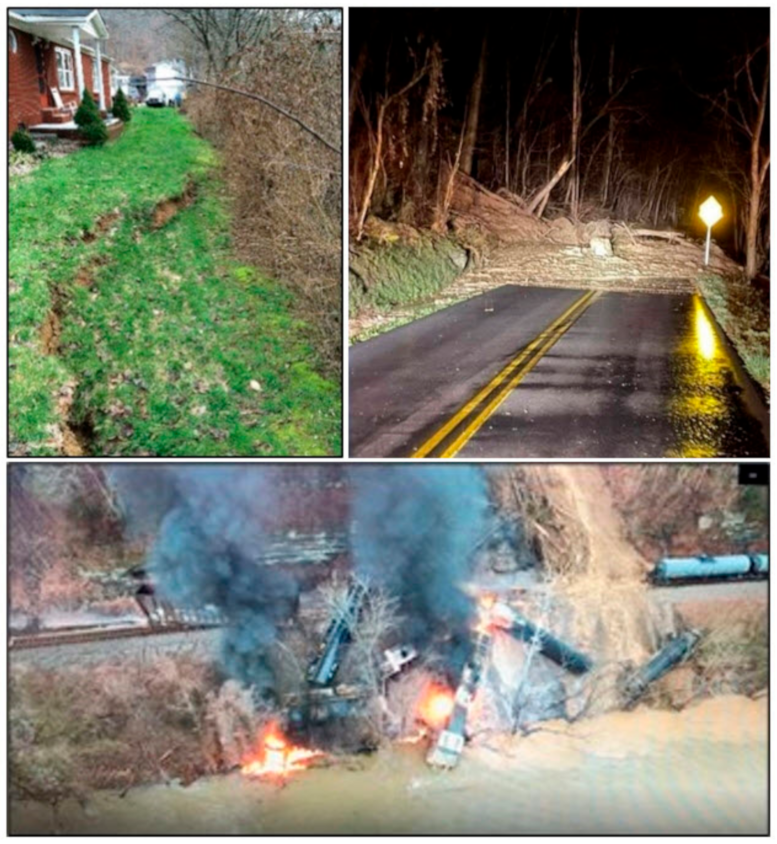
2.2. Study Area Impact
3. Materials and Methods
3.1. Landslide Susceptibility Approach
3.1.1. Hazard Input
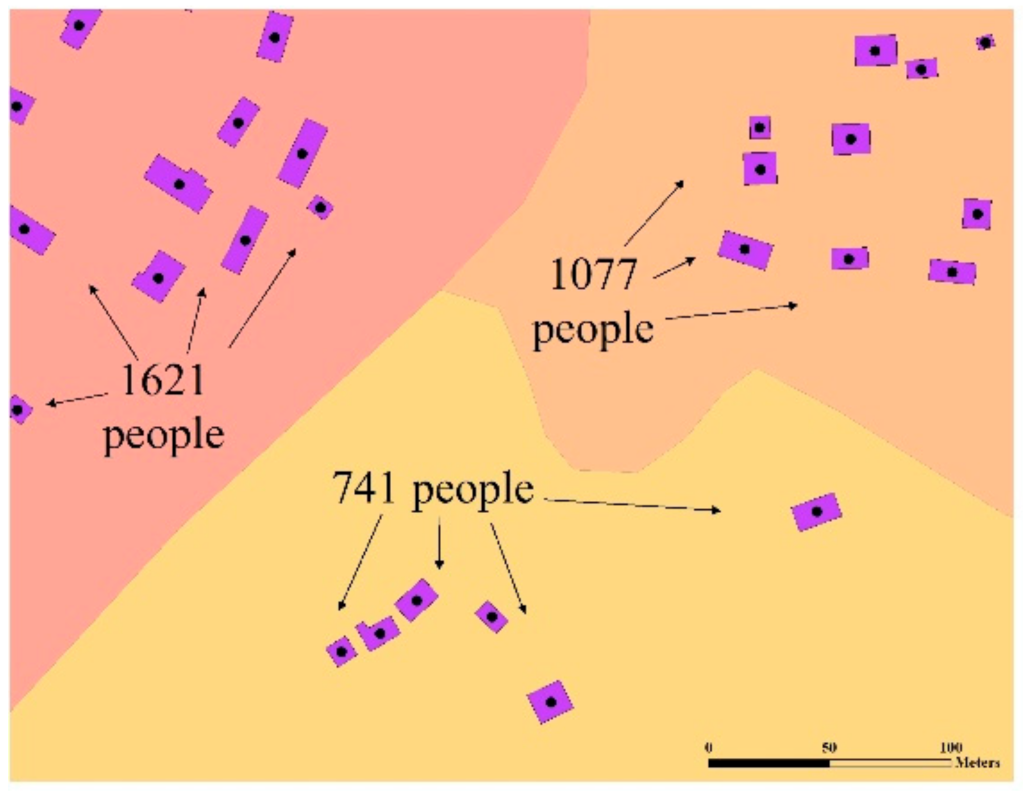
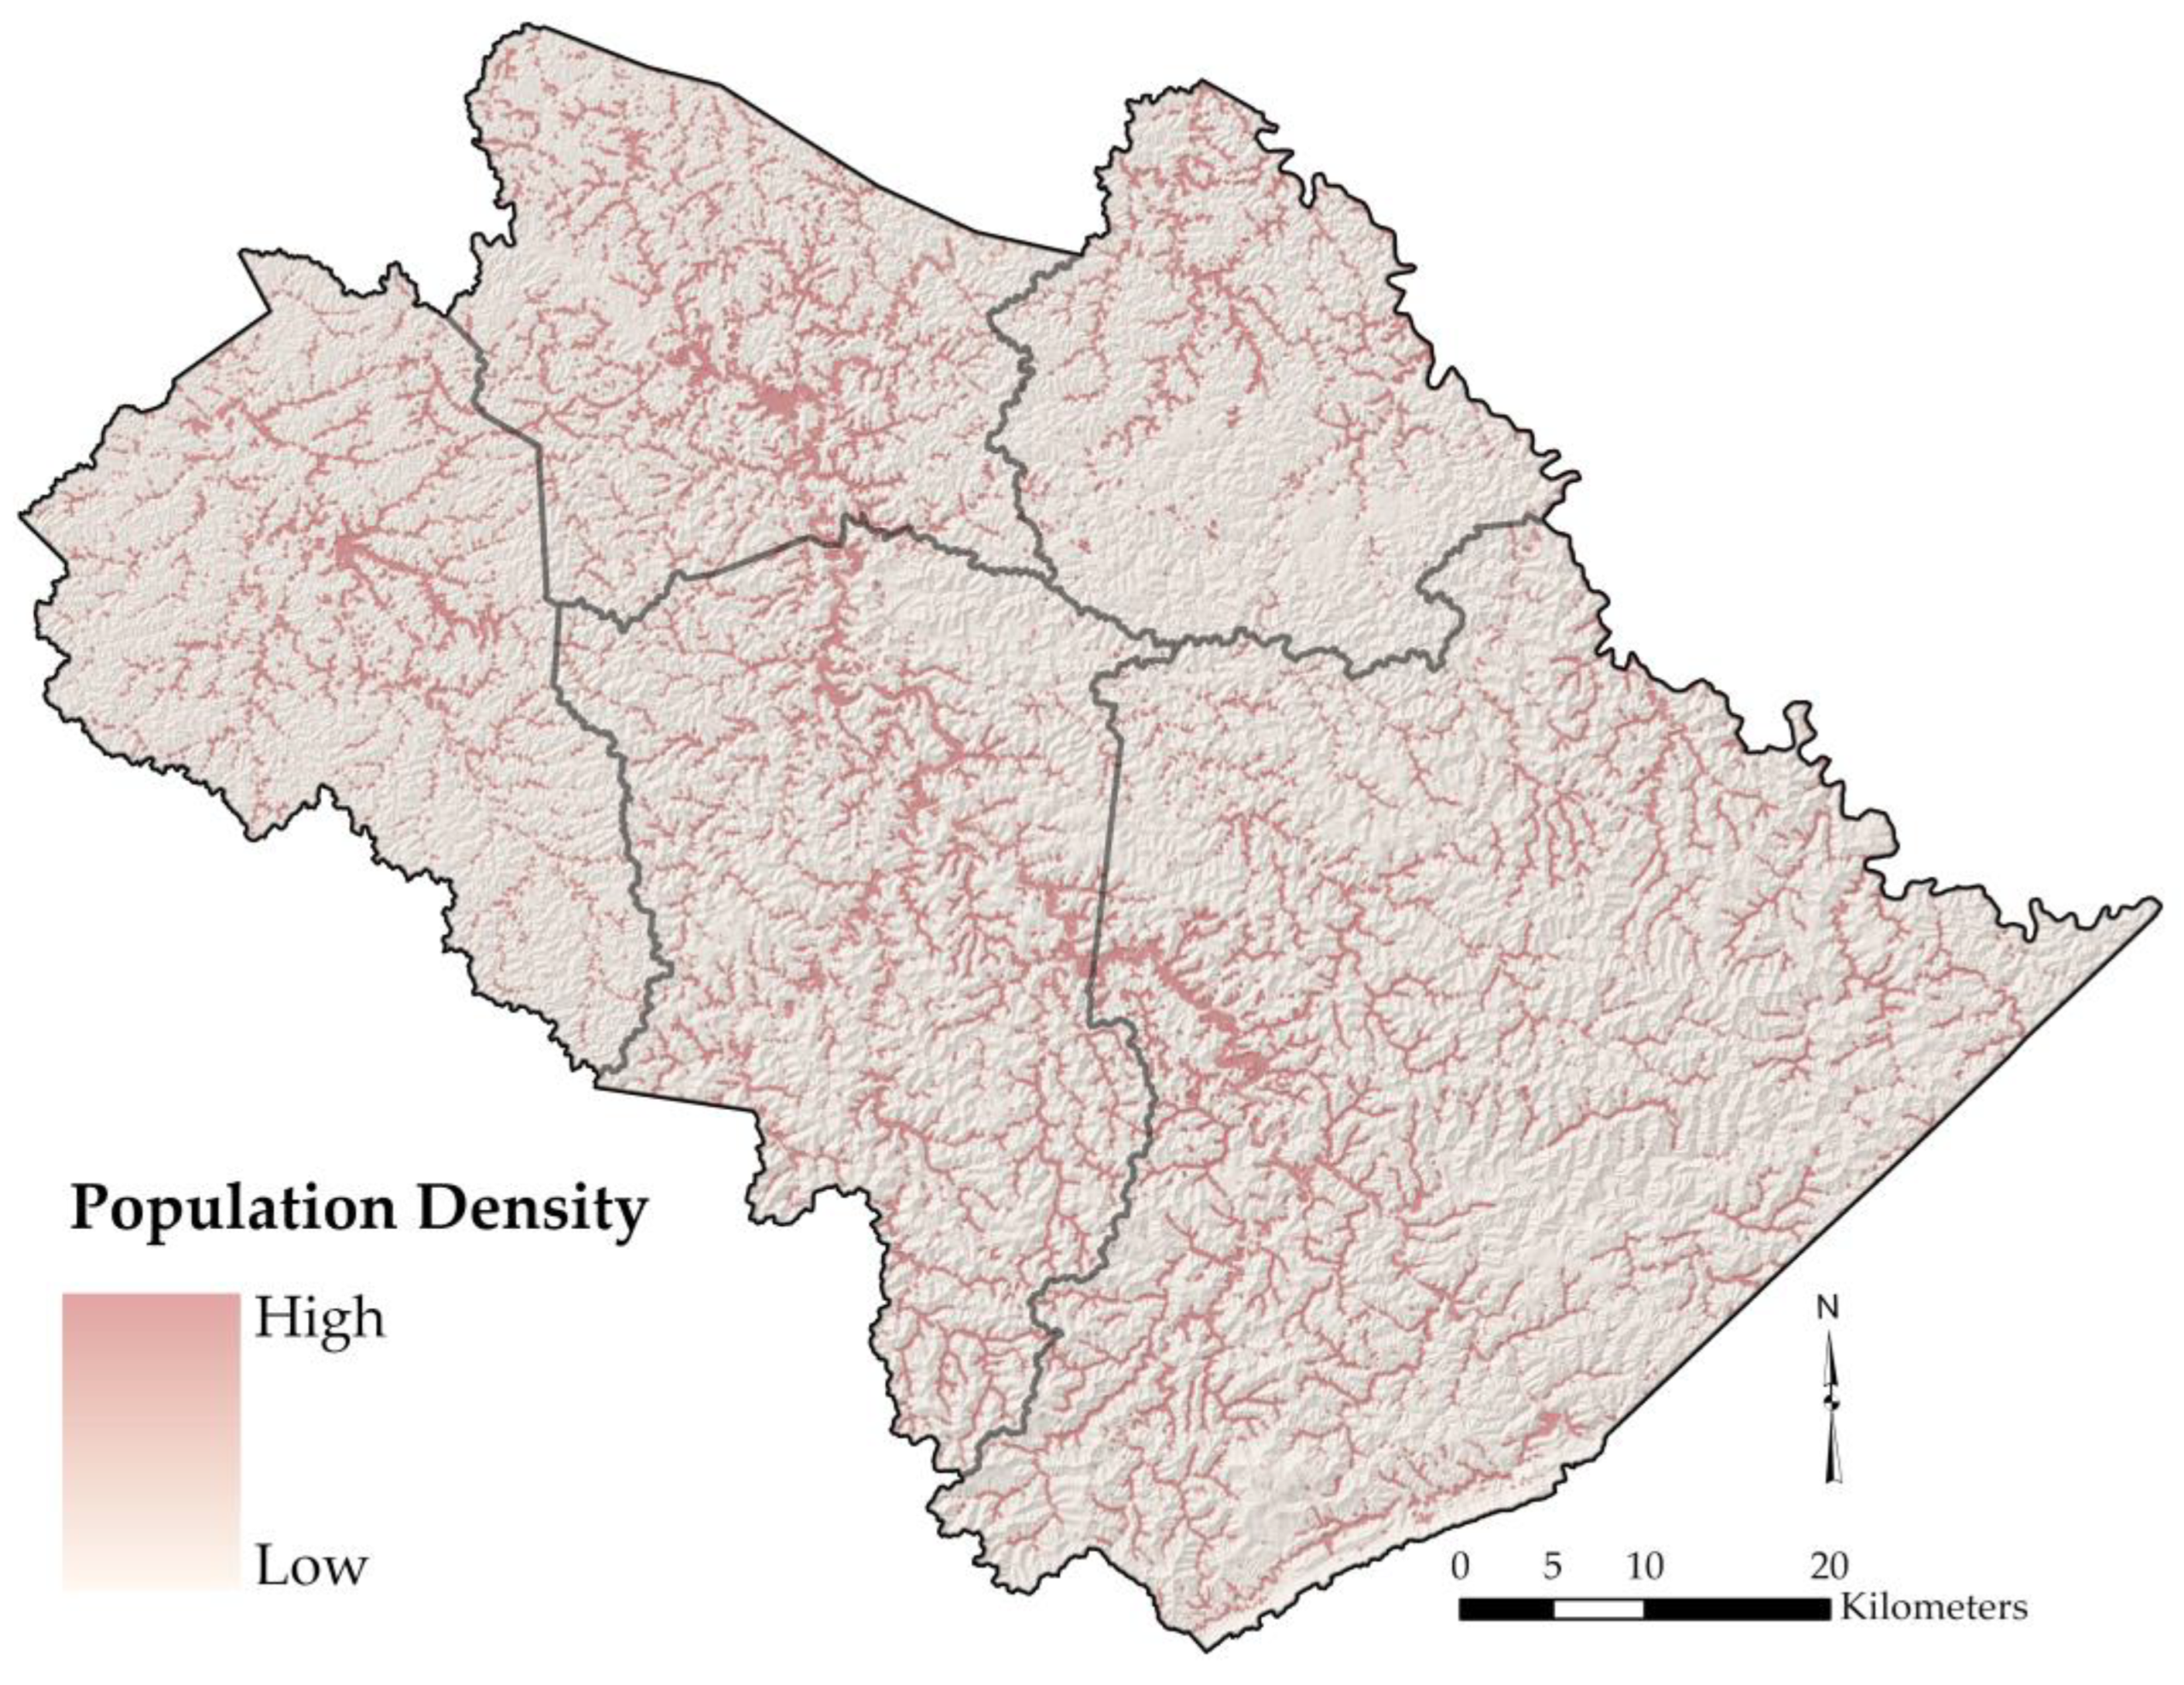
3.1.2. Elements at Risk (Exposure and Assets)
3.1.3. Asset Values
3.1.4. Vulnerability and Consequence
3.2. Coarse, Slope-Based Approach
3.3. Risk Model Estimation
4. Results
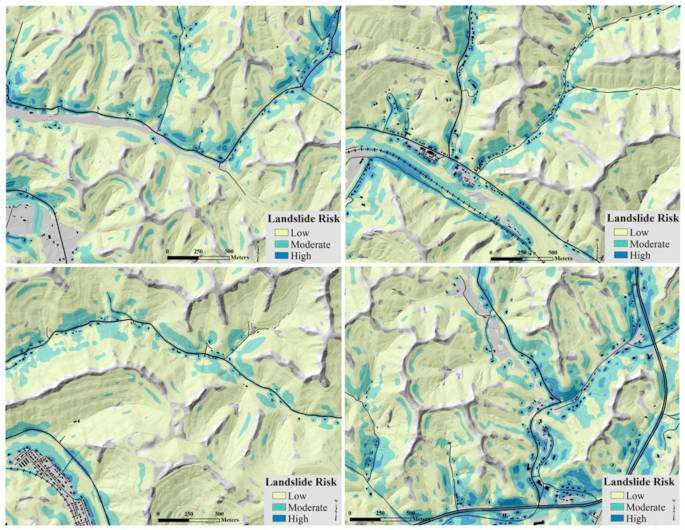
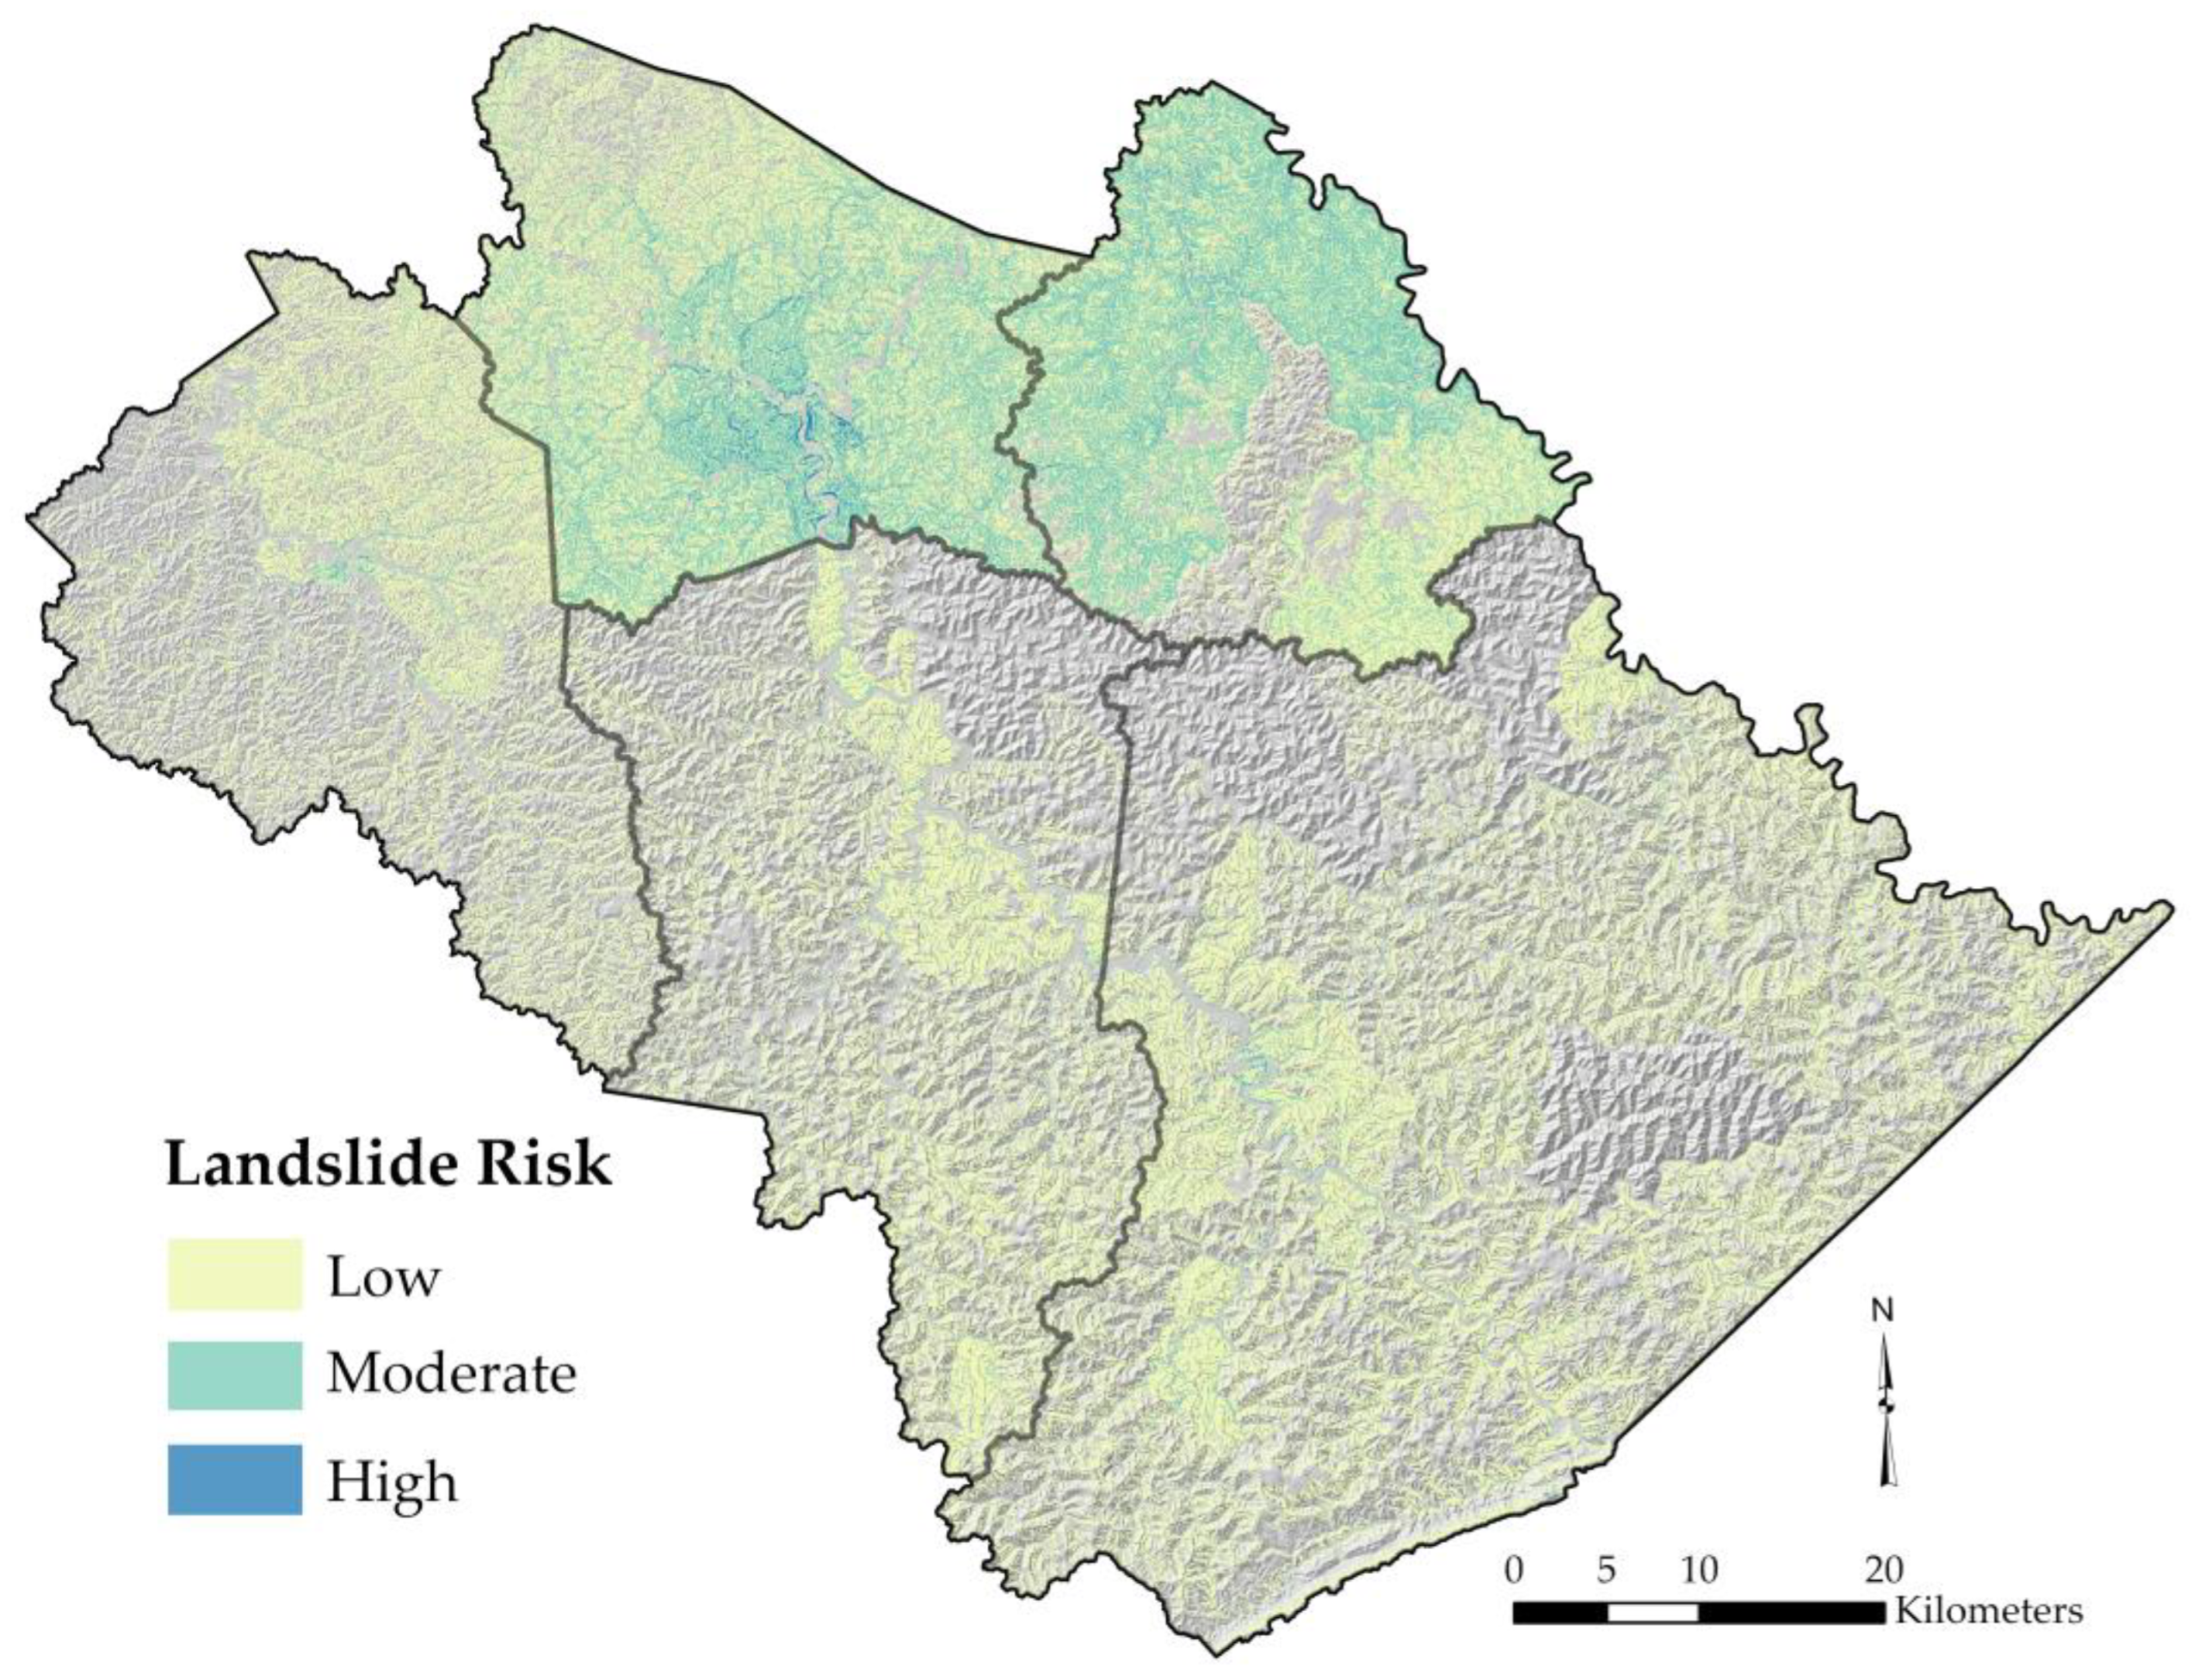
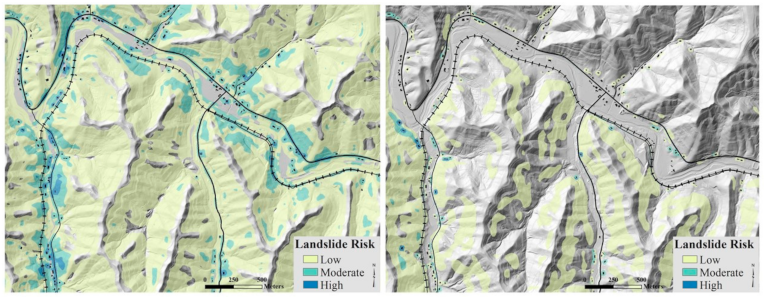
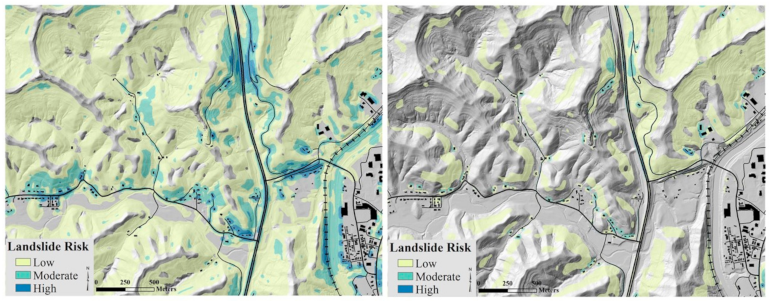
4.1. Susceptibility-Based Risk Map
4.2. Slope-Based Risk Map
- (1)
- The census block group data outweighs the asset density to skew the risk distribution compared to the susceptibility-based map. The coarseness of the census block group data creates sharp and unrealistic risk boundaries. The modeled results show large areas with little risk and some blocks with no risk. These boundaries create inconsistency with how assets fall within risk classes.
- (2)
- A broad under-prediction at all classes relative to the susceptibility-based maps, particularly in less populated areas. In rural, sparsely populated areas, the moderate and high-risk classes are significantly reduced to low or no risk in the slope-based map. Risk in the low class dropped an average of 39 percent over all counties in the slope-based map.
- (3)
- Only two counties showed an increase in the moderate risk class, 16 and 22 percent in Johnson and Martin counties, respectively, which contains some of the most populated census blocks. However, this creates high risk surrounding buildings, roads, and stream banks inconsistent.
- (4)
- Few building footprints adjacent to steep high-hazard slopes, particularly in the narrow valleys and catchments, are classified as moderate or high risk. Classification of risk along roads, particularly local roads, is much less consistent compared to the susceptibility-based map. Very few local roads fall within the high-risk category.
- (5)
- Because of the slope input, the map shows less over-prediction compared to the susceptibility-based map at congested valley bottoms or engineered embankments. These small, high-density areas of roads, railroads, and buildings are not likely to be at risk.
5. Discussion
6. Conclusions
Author Contributions
Funding
Data Availability Statement
Acknowledgments
Conflicts of Interest
References
- Schuster, R.L. Socioeconomic significance of landslides. In Landslides Investigation and Mitigation, Special Report 247; Turner, A.K., Schuster, R.L., Eds.; Transportation Research Board, National Research Council: Washington, DC, USA, 1996; pp. 12–35. [Google Scholar]
- Crozier, M.J. Deciphering the effect of climate change on landslide activity: A review. Geomorphology 2010, 124, 260–267. [Google Scholar] [CrossRef]
- Anderson, M.G.; Holcombe, E. Community-Based Landslide Risk Reduction: Managing Disasters in Small Steps; World Bank Publications: Washington, DC, USA, 2013; 404p. [Google Scholar]
- Corominas, J.; van Westen, C.; Frattini, P.; Cascini, L.; Malet, J.P.; Fotopoulou, S.; Catani, F.; Van Den Eeckhaut, M.; Mavrouli, O.; Agliardi, F.; et al. Recommendations for the quantitative analysis of landslide risk. Bull. Eng. Geol. Environ. 2014, 73, 209–263. [Google Scholar] [CrossRef]
- Ludwig, K.A.; Ramsey, D.W.; Wood, N.J.; Pennaz, A.B.; Godt, J.W.; Plant, N.G.; Luco, N.; Koenig, T.A.; Hudnut, K.W.; Davis, D.K.; et al. Science for a Risky World—A U.S. Geological Survey Plan for Risk Research and Applications; U.S. Geological Survey Circular 1444; USGPO: Washington, DC, USA, 2018; 57p. [CrossRef]
- Gariano, S.L.; Guzzetti, F. Landslides in a changing climate. Earth-Sci. Rev. 2016, 162, 227–252. [Google Scholar] [CrossRef]
- Froude, M.J.; Petley, D.N. Global fatal landslide occurrence from 2004 to 2016. Nat. Hazards Earth Syst. Sci. 2018, 18, 2161–2181. [Google Scholar] [CrossRef]
- Sim, B.S.; Lee, M.L.; Wong, S.Y. A review of landslide acceptable risk and tolerable risk. Geoenvironmental Disasters 2022, 9, 1–17. [Google Scholar] [CrossRef]
- Mirus, B.B.; Jones, E.S.; Baum, R.L.; Godt, J.W.; Slaughter, S.; Crawford, M.M.; Lancaster, J.; Stanley, T.; Kirschbaum, D.B.; Burns, W.J.; et al. Landslides across the USA: Occurrence, susceptibility, and data limitations. Landslides 2020, 17, 2271–2285. [Google Scholar] [CrossRef]
- Keaton, J.R.; Roth, R.J., Jr. Mapping landslides for the insurance industry–lessons from earthquakes. In Proceedings of the EUROENGEO, the 2nd European Conference of International Association for Engineering Geology, Madrid, Spain, 9 June 2008; Volume 15, p. 19. [Google Scholar]
- Guinau, M.; Pallas, R.; Vilaplana, J.M. A feasible methodology for landslide susceptibility assessment in developing countries: A case-study of NW Nicaragua after Hurricane Mitch. Eng. Geol. 2005, 80, 316–327. [Google Scholar] [CrossRef]
- Papathoma-Köhle, M.; Kappes, M.; Keile, M.; Glade, T. Physical vulnerability assessment for alpine hazards: State of the art and future needs. Nat. Hazards 2011, 58, 645–680. [Google Scholar] [CrossRef]
- IUGS Working Group on Landslides; Committee on Risk Assessment. Quantitative assessment for slopes and landslides—The state of the art. In Landslide Risk Assessment, Proceedings of the Workshop on Landslide Risk Assessment, Honolulu, HI, USA, 19–21 February 1997; Cruden, D.M., Fell, R., Eds.; Balkema: Rotterdam, The Netherlands, 1997; pp. 3–12. [Google Scholar]
- VanDine, D.F. Landslide hazard and risk assessments for small projects, preliminary studies and emergency response. In Landslide Risk Assessment, Proceedings of the International Workshop on Landslide Risk Assessment, Honolulu, HI, USA, 19–21 February 1997; Cruden, D.M., Fell, R., Eds.; Balkema: Rotterdam, The Netherlands, 1997; 371p. [Google Scholar]
- Varnes, D.J. Landslides Hazard Zonation: A Review of Principles and Practice; UNESCO: Paris, France, 1984; 63p.
- Papathoma-Köhle, M.; Neuhäuser, B.; Ratzinger, K.; Wenzel, H.; Dominey-Howes, D. Elements at risk as a framework for assessing the vulnerability of communities to landslides. Nat. Hazards Earth Syst. Sci. 2007, 7, 765–779. [Google Scholar] [CrossRef]
- Zuzak, C.; Goodenough, E.; Stanton, C.; Mowrer, M.; Ranalli, N.; Kealey, D.; Rozelle, J. National Risk Index Technical Documentation; Federal Emergency Management Agency: Washington, DC, USA, 2021; 411p. Available online: https://www.fema.gov/sites/default/files/documents/fema_national-risk-index_technical-documentation.pdf (accessed on 31 August 2021).
- Crozier, M.J.; Glade, T. Landslide hazard and risk: Issues, concepts, approaches. In Landslide Hazard and Risk; Glade, T., Anderson, M.A., Crozier, M.J., Eds.; Wiley: Chichester, UK, 2005; pp. 1–40. [Google Scholar]
- Fell, R.; Ho, K.K.S.; Lacasse, S.; Leroi, E. A framework for landslide risk assessment and management. In Landslide Risk Management; Hungr, O., Fell, R., Couture, R., Eberhardt, E., Eds.; Taylor and Francis: London, UK, 2005; pp. 3–26. [Google Scholar]
- Remondo, J.; Bonachea, J.; Cendrero, A. Quantitative landslide risk assessment and mapping on the basis of recent occurrences. Geomorphology 2008, 94, 496–507. [Google Scholar] [CrossRef]
- Kappes, M.S.; Papathoma-Köhle, M.; Keiler, M. Assessing physical vulnerability for mult-hazards using an indicator-based methodology. Appl. Geogr. 2012, 32, 577–590. [Google Scholar] [CrossRef]
- Lee, E.M. Landslide risk assessment: The challenge of communicating uncertainty to decision-makers. Q. J. Eng. Geol. Hydrogeol. 2015, 49, 21–35. [Google Scholar] [CrossRef]
- Strouth, A.; McDougall, S. Societal risk evaluation for landslides: Historical synthesis and proposed tools. Landslides 2021, 18, 1071–1085. [Google Scholar] [CrossRef]
- Uzielli, M.; Nadim, F.; Lacasse, S.; Kaynia, A.M. A conceptual framework for quantitative estimation of physical vulnerability to landslides. Eng. Geol. 2008, 102, 251–256. [Google Scholar] [CrossRef]
- Van Westen, C.J.; van Asch, T.W.J.; Soeters, R. Landslide hazard and risk zonation–why is it still so difficult? Bull. Eng. Geol. Environ. 2006, 65, 167–184. [Google Scholar] [CrossRef]
- Wu, T.H.; Tang, W.H.; Einstein, H.H. Landslide hazard and risk assessment. In Landslides Investigation and Mitigation; Turner, A.K., Schuster, R.L., Eds.; Special Report 247; Transportation Research Board, National Research Council: Washington, DC, USA, 1996; pp. 106–118. [Google Scholar]
- Finlay, P.J.; Fell, R. Landslides: Risk perception and acceptance. Can. Geotech. J. 1997, 34, 169–188. [Google Scholar] [CrossRef]
- Leroi, E. Landslide risk mapping: Problems, limitations and developments. In Landslide Risk Assessment, Proceedings of the International Workshop on Landslide Risk Assessment, Honolulu, HI, USA, 19–21 February 1997; Cruden, D.M., Fell, R., Eds.; Balkema: Rotterdam, The Netherlands, 1997; pp. 239–250. [Google Scholar]
- Chowdhury, R.; Flentje, P. Uncertainties in rainfall-induced landslide hazard. Q. J. Eng. Geol. Hydrogeol. 2022, 35, 61–69. [Google Scholar] [CrossRef]
- Calvello, M.; Papa, M.N.; Pratschke, J.; Crescenzo, M.N. Landslide risk perception: A case study in Southern Italy. Landslides 2016, 13, 349–360. [Google Scholar] [CrossRef]
- Li, Z.; Nadim, F.; Huang, H.; Uzielli, M.; Lacasse, S. Quantitative vulnerability estimation for scenario-based landslide hazards. Landslides 2010, 7, 125–134. [Google Scholar] [CrossRef]
- Guillard-Gonçalves, C.; Zêzere, J. Combining social vulnerability and physical vulnerability to analyze landslide risk at the municipal scale. Geosciences 2018, 8, 294–317. [Google Scholar] [CrossRef]
- Haneberg, W.C.; Johnson, S.E.; Gurung, N. Response of the Laprak, Nepal, landslide to the 2015 Mw 7.8 Gorkha earthquake. Nat. Hazards 2022, 111, 567–584. [Google Scholar] [CrossRef]
- Caleca, F.; Tofani, V.; Segoni, S.; Raspini, F.; Rosi, A.; Natali, M.; Catani, F.; Casagli, N. A methodological approach of QRA for slow-moving landslides at a regional scale. Landslides 2022, 19, 1539–1561. [Google Scholar] [CrossRef] [PubMed]
- Rossi, M.; Guzzetti, F.; Salvati, P.; Donnini, M.; Napolitano, E.; Bianchi, C. A predictive model of societal landslide risk in Ital. Earth-Sci. Rev. 2019, 196, 102849. [Google Scholar] [CrossRef]
- Lan, H.; Tian, N.; Li, L.; Wu, Y.; Macciotta, R.; Clague, J.J. Kinematic-based landslide risk management for the Sichuan-Tibet Grid Interconnection Project (STGIP) in China. Eng. Geol. 2022, 308, 106823. [Google Scholar] [CrossRef]
- Catani, F.; Casagli, N.; Ermini, L.; Righini, G.; Menduni, G. Landslide hazard and risk mapping at catchment scale in the Arno River basin. Landslides 2005, 2, 329–342. [Google Scholar] [CrossRef]
- Dai, F.C.; Lee, C.F.; Ngai, Y.Y. Landslide risk assessment and management: An overview. Eng. Geol. 2002, 64, 65–87. [Google Scholar] [CrossRef]
- Puissant, A.; Eeckhaut, M.; Malet, J.P.; Maquaire, O. Landslide consequence analysis: A region-scale indicator-based methodology. Landslides 2014, 11, 843–858. [Google Scholar] [CrossRef]
- Abella, E.A.C.; Van Westen, C.J. Generation of landslide risk index map for Cuba using spatial multi-criteria evaluation. Landslides 2007, 4, 311–325. [Google Scholar] [CrossRef]
- Lee, E.M.; Jones, D.K.C. Landslide Risk Assessment; Thomas Telford: London, UK, 2004. [Google Scholar]
- Fell, R.; Corominas, J.; Bonnard, C.; Cascini, L.; Leroi, E.; Savage, W.Z. Guidelines for landslide susceptibility hazard, and risk zoning for land use planning. Eng. Geol. 2008, 102, 99–111. [Google Scholar] [CrossRef]
- Crawford, M.M.; Dortch, J.M.; Koch, H.J.; Killen, A.A.; Zhu, J.; Zhu, Y.; Bryson, L.S.; Haneberg, W.C. Using landslide-inventory for a combined bagged-trees and logistic regression approach to landslide susceptibility in eastern Kentucky, United States. Q. J. Eng. Geol. Hydrogeol. 2021, 54. [Google Scholar] [CrossRef]
- Outerbridge, W.F. The Logan Plateau, a Young Physiographic Region in West Virginia, Kentucky, Virginia, and Tennessee; Bulletin 1620; USGPO: Washington, DC, USA, 1987; 19p.
- Crawford, M.M. Kentucky Geological Survey Landslide Inventory: From Design to Application; Information Circular 31, Series 12; Kentucky Geological Survey: Lexington, KY, USA, 2014; 18p. [Google Scholar]
- McDowell, R.C. Geology of Kentucky—A Text to Accompany the Geologic Map of Kentucky; U.S. Geological Survey Professional Paper 1151-H; USGPO: Washington, DC, USA, 1986.
- U.S. Census Bureau, 2020, County Population Totals. Available online: https://www.census.gov/programs-surveys/popest/technical-documentation/research/evaluation-estimates/2020-evaluation-estimates/2010s-counties-total.html (accessed on 22 February 2022).
- Appalachian Regional Commission, Classifying Economic Distress in Appalachian Counties. Available online: https://www.arc.gov/classifying-economic-distress-in-appalachian-counties/ (accessed on 21 February 2022).
- Blair, T.C.; McPherson, J.G. Grain-size and textural classification of coarse sedimentary particles. J. Sediment. Res. 1999, 69, 6–19. [Google Scholar] [CrossRef]
- Outerbridge, W.F. Relation between landslides and bedrock in the central Appalachian Plateaus. In Landslides of Eastern North America; Schultz, A.P., Southworth, C.S., Eds.; U.S. Geological Survey Circular 1008; USGPO: Washington, DC, USA, 1987; 43p. [Google Scholar]
- Turner, A.K. Colluvium and talus. In Landslides Investigation and Mitigation; Turner, A.K., Schuster, R.L., Eds.; Special Report 247; Transportation Research Board, National Research Council: Washington, DC, USA, 1996; pp. 525–554. [Google Scholar]
- Crawford, M.M. Kentucky Geological Survey landslide inventory (2022-01). Ky. Geol. Surv. Res. Data 2022. [Google Scholar] [CrossRef]
- Wieczorek, G.F.; Mossa, G.S.; Morgan, B.A. Regional debris-flow distribution and preliminary risk assessment from severe storm events in the Appalachian Blue Ridge Province, USA. Landslides 2004, 1, 53–59. [Google Scholar] [CrossRef]
- Wold, R.L., Jr.; Jochim, C.L. Landslide Loss Reduction: A Guide for State and Local Government Planning; Earthquake Hazards Reduction Series 52; Federal Emergency Management Agency: Washington, DC, USA, 1989; 50p.
- Overfield, B.L.; Carey, D.I.; Weisenfluh, G.A.; Wang, R.; Crawford, M.M. The Geologic Context of Landslide and Rockfall Maintenance Costs in Kentucky; Report of Investigations, 34, Series 12; Kentucky Geological Survey: Lexington, KY, USA, 2015; 54p. [Google Scholar]
- U.S. Census Bureau, 2014–2018 American Community Survey 5-Year Estimates. Available online: https://www.census.gov/programs-surveys/acs/technical-documentation/code-lists.2018.html (accessed on 22 February 2022).
- Silverman, B.W. Density Estimation for Statistics and Data Analysis; Routledge: London, UK, 1998. [Google Scholar] [CrossRef]
- Governmental Accounting Standards Board, Summary of Statement No. 34. Available online: http://www.gasb.org/st/summary/gstsm34.html (accessed on 15 September 2021).
- Aberdeen Carolina and Western Railway. Available online: http://www.acwr.com/economic-development/railroads-101/rail-siding-costs (accessed on 15 September 2021).
- Davis, M.A.; Larson, W.D.; Oliner, S.D.; Shui, J. The price of residential land for counties, ZIP codes, and census tracts in the United States. J. Monet. Econ. 2020, 118, 413–431. [Google Scholar] [CrossRef]
- Halich, G.; Pulliam, P. Land Value and Cash Rent Survey; AEC-97; Cooperative Extension Service, College of Agriculture, University of Kentucky; University of Kentucky: Lexington, KY, USA, 2013. [Google Scholar]
- U.S. Department of Agriculture. Land Values 2019 Summary, National Agricultural Statistics Service. 2019. Available online: https://www.nass.usda.gov/Publications/Todays_Reports/reports/land0819.pdf (accessed on 27 May 2020).
- Glade, T. Vulnerability assessment in landslide risk analysis. Erde 2003, 134, 123–146. [Google Scholar]
- Shuttle Radar Topography Mission (SRTM), 1 Arc-Second Global. Available online: https://doi.org/10.5066/F7PR7TFT (accessed on 7 March 2022).
- Althuwaynee, O.F.; Pradhan, B. Semi-quantitative landslide risk assessment using GIS-based exposure analysis in Kuala Lumpur City. Geomat. Nat. Hazards Risk 2016, 8, 706–732. [Google Scholar] [CrossRef]
- Arguez, A.; Durre, I.; Applequist, S.; Vose, R.S.; Squires, M.F.; Yin, X.; Heim, R.R., Jr.; Owen, T.W. NOAA’s 1981–2010 US climate normals: An overview. Bull. Am. Meteorol. Soc. 2012, 93, 1687–1697. [Google Scholar] [CrossRef]


| Dates | Rainfall | Disaster Declarations | Landslides Documented |
|---|---|---|---|
| March 2015 | 80 mm on March 3–4 over much of SE KY, followed by 50 to 200 mm in April | 4 | Over 100 landslides documented for the year |
| 2016 | Average of 1285 mm statewide | 1 | Approximately 60 landslides documented |
| Winter 2018 | data | ||
| 125 to 250 mm of 14-day observed rainfall ending February 18 across SE KY | 2 | Approximately 43 landslides documented from December to March | |
| 2019 | An average of 1525 mm statewide | 1 | Approximately 153 landslides documented for the year |
| Winter-Spring 2020 | 50 to150 mm from February 4–6 in SE KY, 66 mm in 12 h in parts of two counties, 200 to 380 mm from January 1 to February 11, 25 to 75 mm followed in 24 h on April 13, and 25 to 100 mm on May 19–20. | 2 | Approximately 123 landslides documented for the year, 30 landslides documented from January through May |
| 2021 | Average 1306 mm statewide | 2 | Over 100 landslides documented |
| County | Probability | Landslide Susceptibility | % Area | % Buildings | % Roads | % Railroads |
|---|---|---|---|---|---|---|
| Magoffin | 0–0.2 | low | 37.67 | 28.0 | 26.34 | NA |
| 0.21–0.4 | low-moderate | 34.8 | 24.25 | 40.14 | NA | |
| 0.41–0.6 | moderate | 16.77 | 1.47 | 8.67 | NA | |
| 0.61–0.8 | moderate-high | 5.17 | 0.11 | 1.32 | NA | |
| 0.81–1 | high | 0.25 | 0.002 | 0.09 | NA | |
| Floyd | 0–0.2 | low | 29.16 | 21.18 | 25.0 | 21.05 |
| 0.21–0.4 | low-moderate | 31.97 | 24.04 | 36.37 | 34.67 | |
| 0.41–0.6 | moderate | 21.64 | 2.19 | 8.05 | 8.37 | |
| 0.61–0.8 | moderate-high | 10.96 | 0.25 | 1.89 | 2.61 | |
| 0.81–1 | high | 0.91 | 0.03 | 0.32 | 0.72 | |
| Johnson | 0–0.2 | low | 36.35 | 24.23 | 26.31 | 18.57 |
| 0.21–0.4 | low-moderate | 34.39 | 22.42 | 37.31 | 30.27 | |
| 0.41–0.6 | moderate | 15.91 | 1.57 | 7.60 | 10.48 | |
| 0.61–0.8 | moderate-high | 5.59 | 0.16 | 1.61 | 5.52 | |
| 0.81–1 | high | 0.42 | 0.01 | 0.23 | 2.78 | |
| Martin | 0–0.2 | low | 31.79 | 20.37 | 22.34 | 29.20 |
| 0.21–0.4 | low-moderate | 33.35 | 30.39 | 41.98 | 40.19 | |
| 0.41–0.6 | moderate | 19.63 | 3.77 | 10.85 | 11.05 | |
| 0.61–0.8 | moderate-high | 10.49 | 0.45 | 2.57 | 4.28 | |
| 0.81–1 | high | 1.01 | 0.04 | 0.50 | 0.84 | |
| Pike | 0–0.2 | low | 30.27 | 21.97 | 26.22 | 20.96 |
| 0.21–0.4 | low-moderate | 31.0 | 28.52 | 40.67 | 40.55 | |
| 0.41–0.6 | moderate | 20.51 | 3.33 | 10.47 | 12.44 | |
| 0.61–0.8 | moderate-high | 13.01 | 0.40 | 2.96 | 4.65 | |
| 0.81–1 | high | 2.32 | 0.06 | 0.43 | 0.86 |
| Assets | Value | Source |
|---|---|---|
| Major Road | $15,000,000 per km | KYTC |
| Local Road | $9,000,000 per km | KYTC |
| Railway | $600,000 per km | ACW Railway |
| Developed Land | $237,500 per hectare | FHFA |
| Undeveloped Land | $4500 per hectare | UK Agriculture |
| Lanes | Rural | Developed | ||||
|---|---|---|---|---|---|---|
| Flat | Rolling | Mountainous | Flat | Rolling | Mountainous | |
| 1 to 2 | 4.5 | 7 | 14 | 6.5 | 9 | 16 |
| 3 to 4 | 6.5 | 11 | 24 | 8.5 | 13 | 26 |
| 5 to 6 | 12 | 18 | 32 | 14 | 20 | 34 |
| 7 + | 18 | 26 | 42 | 20 | 28 | 44 |
| Risk Map | Hazard | Vulnerability | Consequence |
|---|---|---|---|
| Susceptibility-based | Landslide susceptibility; sourced from 1.5- lidar-based DEM | 1 |
|
| Slope-based | Slope degrees; sourced from global 30 m DEM | 1 |
|
| County | Risk Factor Score | % Area | Landslide Risk Classification |
|---|---|---|---|
| Magoffin | 0–0.0023 | 15.8 | Excluded |
| 0.0024–0.0102 | 70.3 | Low | |
| 0.0103–0.0213 | 12.0 | Moderate | |
| 0.0214–1 | 1.9 | High | |
| Floyd | 0–0.0036 | 14.9 | Excluded |
| 0.0037–0.0182 | 74.1 | Low | |
| 0.0183–0.0403 | 9.6 | Moderate | |
| 0.0404–1 | 1.4 | High | |
| Johnson | 0–0.0032 | 15.5 | Excluded |
| 0.0033–0.015 | 70.9 | Low | |
| 0.016–0.0324 | 11.6 | Moderate | |
| 0.0325–1 | 2.0 | High | |
| Martin | 0–0.0034 | 14.8 | Excluded |
| 0.0035–0.016 | 71.5 | Low | |
| 0.017–0.0344 | 12.2 | Moderate | |
| 0.0345–1 | 1.5 | High | |
| Pike | 0–0.0035 | 15.4 | Excluded |
| 0.0036–0.0186 | 72.7 | Low | |
| 0.0187–0.043 | 10.7 | Moderate | |
| 0.0431–1 | 1.2 | High |
Publisher’s Note: MDPI stays neutral with regard to jurisdictional claims in published maps and institutional affiliations. |
© 2022 by the authors. Licensee MDPI, Basel, Switzerland. This article is an open access article distributed under the terms and conditions of the Creative Commons Attribution (CC BY) license (https://creativecommons.org/licenses/by/4.0/).
Share and Cite
Crawford, M.M.; Dortch, J.M.; Koch, H.J.; Zhu, Y.; Haneberg, W.C.; Wang, Z.; Bryson, L.S. Landslide Risk Assessment in Eastern Kentucky, USA: Developing a Regional Scale, Limited Resource Approach. Remote Sens. 2022, 14, 6246. https://doi.org/10.3390/rs14246246
Crawford MM, Dortch JM, Koch HJ, Zhu Y, Haneberg WC, Wang Z, Bryson LS. Landslide Risk Assessment in Eastern Kentucky, USA: Developing a Regional Scale, Limited Resource Approach. Remote Sensing. 2022; 14(24):6246. https://doi.org/10.3390/rs14246246
Chicago/Turabian StyleCrawford, Matthew M., Jason M. Dortch, Hudson J. Koch, Yichuan Zhu, William C. Haneberg, Zhenming Wang, and L. Sebastian Bryson. 2022. "Landslide Risk Assessment in Eastern Kentucky, USA: Developing a Regional Scale, Limited Resource Approach" Remote Sensing 14, no. 24: 6246. https://doi.org/10.3390/rs14246246
APA StyleCrawford, M. M., Dortch, J. M., Koch, H. J., Zhu, Y., Haneberg, W. C., Wang, Z., & Bryson, L. S. (2022). Landslide Risk Assessment in Eastern Kentucky, USA: Developing a Regional Scale, Limited Resource Approach. Remote Sensing, 14(24), 6246. https://doi.org/10.3390/rs14246246