Article

High-Resolution Mapping of Seaweed Aquaculture along the Jiangsu Coast of China Using Google Earth Engine (2016–2022)

1
School of Geographic Sciences, East China Normal University, Shanghai 200241, China
2
Center for Systems Integration and Sustainability, Department of Fisheries and Wildlife, Michigan State University, East Lansing, MI 48823, USA
3
School of Design, Shanghai Jiaotong University, Shanghai 200040, China
4
State Key Laboratory of Estuarine and Coastal Research, East China Normal University, Shanghai 200241, China
*
Author to whom correspondence should be addressed.
Remote Sens. 2022, 14(24), 6202; https://doi.org/10.3390/rs14246202
Submission received: 1 November 2022 / Revised: 2 December 2022 / Accepted: 4 December 2022 / Published: 7 December 2022

Abstract

:
Seaweed aquaculture produces enormous economic and ecological service benefits, making significant contributions to achieving global Sustainable Development Goals (SDGs). However, large-scale development of seaweed aquaculture and the unreasonable use of aquaculture rafts may trigger green tide, bringing negative ecological, social, and economic impacts. Therefore, it is vital to monitor the seaweed aquaculture industry accurately. Here, we mapped 10-m-resolution seaweed aquaculture along the Jiangsu coast of China based on active and passive remote sensing (Sentinel-1/2) and Random Forest using Google Earth Engine. The results demonstrate satisfactory model performance and data accuracy. The square seaweed aquaculture in the Lianyungang Offshore (Mode-I) has gradually expanded to the deep sea since 2016, with a maximum area of 194.06 km2 in 2018. Between 2021 and 2022, the area of the strip-shaped seaweed aquaculture in Subei radiation shoals (Mode-II) was considerably reduced, with most of the reduced land lying on the east side of the Dafeng Elk National Nature Reserve. In general, the area of the seaweed aquaculture in the prohibited breeding area was reduced from 20.32 km2 to 3.13 km2, and the area of the seaweed aquaculture in the restricted breeding area was reduced from 149.71 km2 to 33.15 km2. Results show that under the policy restriction, the scale of unsustainable seaweed aquaculture along the Jiangsu coast has been greatly reduced within seven years. This study can provide an efficient approach for the medium-scale extraction of seaweed aquaculture and provide decision support for the sustainable development of marine aquaculture.

1. Introduction

The scale-up and sustained healthy development of seaweed farming makes a significant contribution to attaining global Sustainable Development Goals (SDGs) (e.g., SDG2 (Zero Hunger), SDG3 (Good Health and Well-Being), SDG13 (Climate Action), SDG14 (Life Below Water) [1], and SDG15 (Life on Land)). It is also one of the pillar industries of marine aquaculture in China, providing a wide variety of economic and ecological services. In terms of economic value, rich nutrients in seaweed can supplement the needs of the human body, prevent and treat diseases (e.g., goiter and liver cancer), and be processed into industrial products (e.g., food additives and gelling agents) [2,3]. In terms of ecological service value, large-scale seaweed production is a viable option for increasing the ocean carbon sink and achieving carbon neutrality [4]. At the same time, it has a short production cycle and relatively low labor requirements, so the investment cost of seaweed farming is comparatively low [5]. Seaweed farming does not occupy terrestrial and freshwater resources. Supplementing terrestrial vegetable production with seaweed production can limit the degradation of terrestrial ecosystems, so it is of great significance for resource conservation and efficient use [6].
In the past few years, some coastal areas have frequently suffered from green tides [7]. In 2021, green tides in the Yellow Sea occurred on an unprecedented scale, covering about 1746 km2, 2.3 times the historical record in China in 2013 [8]. Relevant studies have shown that different amounts of Enteromorpha prolifera can be attached to aquaculture facilities. Under the influence of wind and ocean currents, it gradually reached the coast of Shandong, causing a green tide [9].
Recently, many studies have tried to monitor seaweed cultivation. Traditional survey-based methods may consume a lot of human, material, and financial resources, and cannot understand seaweed aquaculture’s spatial distribution [10]. In contrast, remote sensing technology has the superiority of low cost, near real-time, and wide monitoring range. As reliable data for information extraction, Multi-spectral Instrument (MSI) and Synthetic-Aperture Radar (SAR) images have been widely used in the field of remote sensing. However, the former is limited by the interference of clouds, fog, and noise limits the latter, so it is difficult to obtain stable and effective images [11]. The threshold and object-based methods are widely developed for monitoring seaweed farming [12,13]. However, the former cannot apply a wealth of spectral and textural features, and the latter classification results may have many broken patches. Moreover, the current seaweed mapping uses mostly medium-resolution remote sensing satellites such as Landsat [14]. As an emerging remote sensing image in recent years, the 10-meter resolution Sentinel data provided by the European Space Agency (ESA) is free and open-access. Sentinel data have obvious advantages in terms of imager type, the number of bands, and resolution, providing strong data support for future research [11]. In addition, deep learning algorithms, such as FCN and U-Net, have been used to extract the seaweed patches [15,16], but these methods have not been applied in large-scale or medium-scale research due to the complexity of the model structure. Therefore, using these deep learning methods is still challenging for accurately mapping seaweed aquaculture on large spatial scales and different geographical environments. Random forest training has fast convergence speed, wide application range, certain robustness, and is suitable for large-scale prediction. Teluguntla et al. used the random forest algorithm to calculate the cultivated land areas of Australia and China based on Google Earth Engine and Landsat 30-meter resolution images [17]. Xia et al. used random forest classification and Sentinel time series images to successfully map China’s water photovoltaics [18].
Few studies have used the Google Earth Engine (GEE) platform and active-passive-high-resolution remote sensing to discuss the spatial distribution of seaweed farming areas on large or medium spatial scales, which makes it challenging to identify its scope, development, and impact. GEE is a cloud computing platform that can provide massive geospatial data, making it simple to design algorithms and process time-series imageries in batches lowering the cost and analytical complexity [19]. Here we used the Sentinel data and GEE platform to map the seaweed using a machine learning method—random forest. To sum up, the study’s objectives were to: (1) extract the seaweed aquaculture area using the GEE platform and a random forest classification algorithm; (2) analyze the seaweed aquaculture areas, and spatial dynamics in Jiangsu from 2016 to 2022; (3) investigate whether the current seaweed farming areas are distributed in the prohibited and restricted breeding areas, and summarize which policies issued by governments, at all levels, have an impact on its spatial distribution and economic benefits. Our results will provide stakeholders with timely and spatially explicit information to track the development of seaweed aquaculture while providing quantitative support for the sustainable development of marine fisheries and the protection of the ecological environment.

2. Study Area, Data, and Materials

2.1. Study Area

Jiangsu province is located in Eastern China, bordering the Yellow Sea to the east (Figure 1(Left)). The cultivation areas of Chinese seaweed are mainly distributed along the southern coast of the Yellow Sea to the north of the Yangtze River Estuary. The coast of Jiangsu province owned more than 99% of Chinese production enterprises [20]. Lianyungang, Yancheng, and Nantong are coastal municipalities with a total coastline of 954 km. The tidal flat area is more than 5000 km2, which is nearly a quarter of the tidal flat area in China [21]. Consequently, we chose the coastal areas of Jiangsu Province as the study area, where seaweed aquaculture is widely distributed and the modes of seaweed cultivation are more typical than that in other regions.
There are two main types of seaweed farming in Jiangsu province (Figure 1(Right)): The first is the square-shaped seaweed aquaculture in the Lianyungang Offshore area, where the height of the net screen can be adjusted so that the seaweed can be fully exposed to the sunlight (Mode-I, Figure 1a). The second is the strip-shaped seaweed aquaculture in Subei radiation shoals (Mode-II, Figure 1b), with a fixed net-screen height so the exposure time can be affected by the tidal periodicity [22].

2.2. Data and Materials

2.2.1. Satellite Datasets

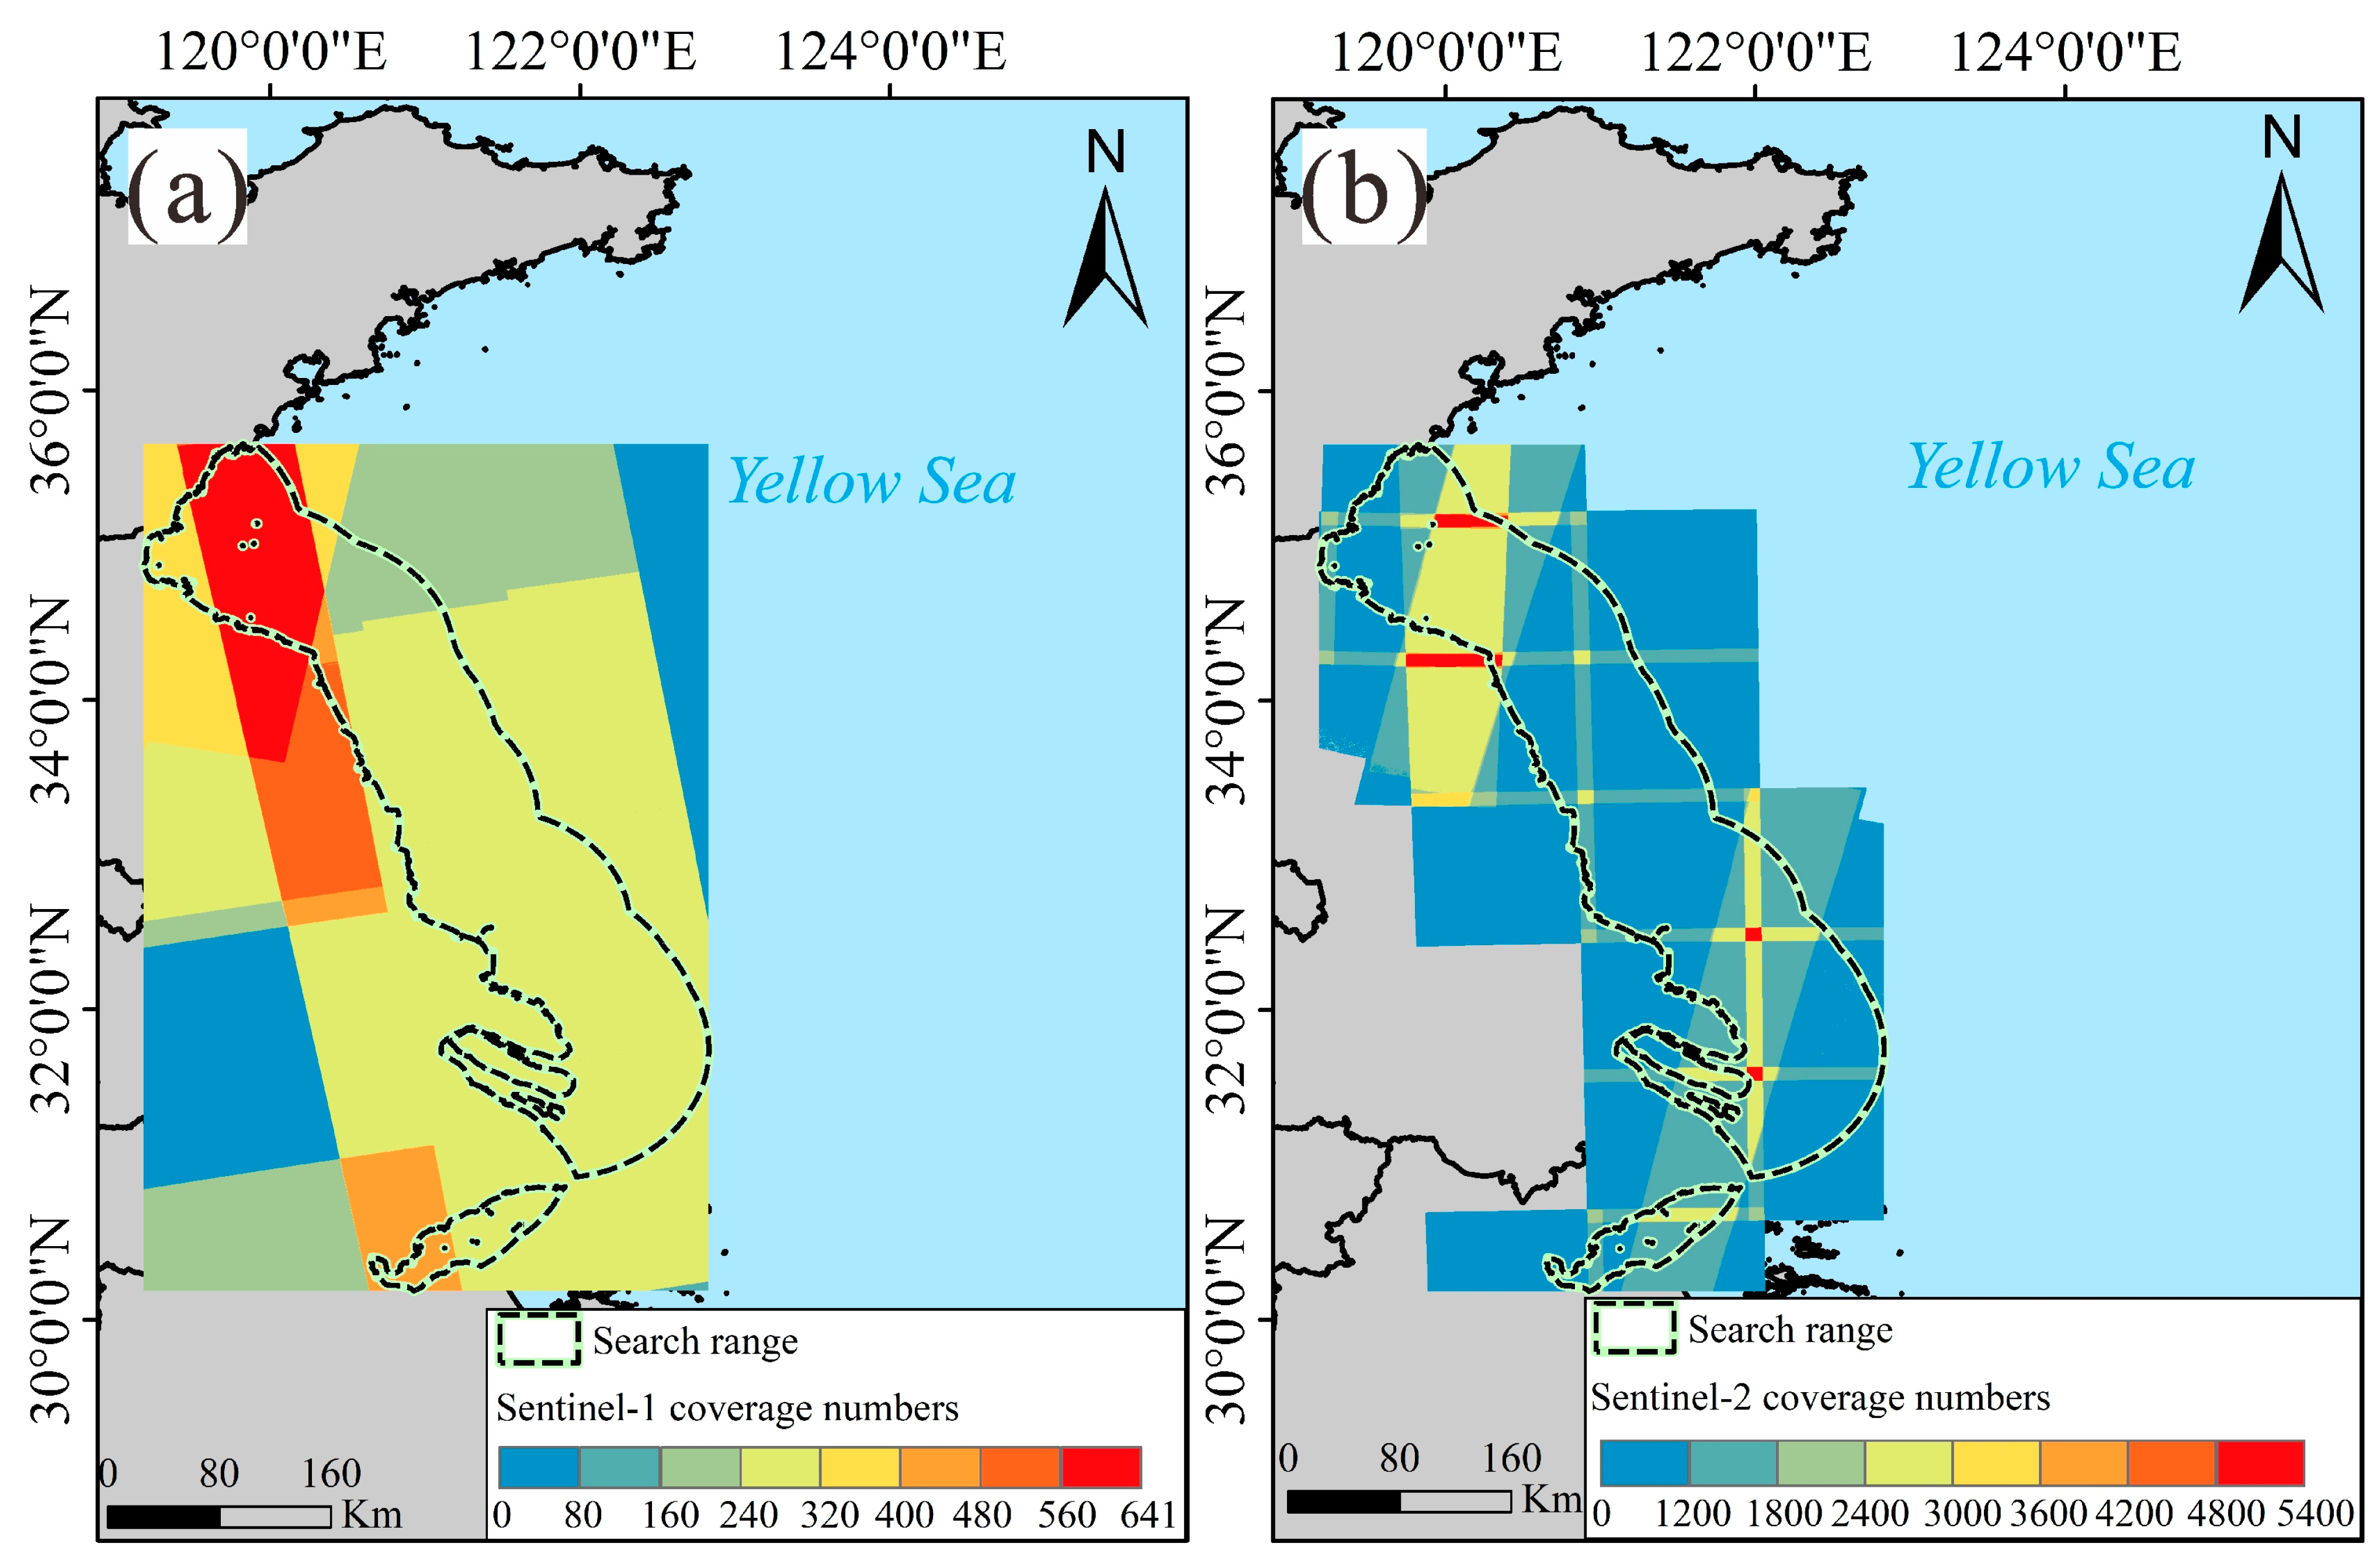
Due to the study areas’ complex climate and environmental variables, the GEE platform was used to conduct active and passive remote sensing monitoring of seaweed cultivation areas. This paper’s in-use remote sensing data were from Sentinel-1 and Sentinel-2 satellites, which easily conduct pre-processing and analysis on GEE. The coverage and number of observations for both sensors are given in Figure 2.
The Sentinel-2 satellites consist of two optical satellites, A and B. Sentinel-2A and Sentinel-2B satellites were launched in June 2015 and March 2017, respectively. By integrating the data from these two satellites, the revisit period can be five days [23]. Sentinel-2’s 13 bands provide more support for vegetation classification by creatively dividing the red wave band into three separate bands (B5, B6, B7) in addition to the visible light contained in conventional optical images. Meanwhile, the near-infrared band (B8) can detect the strong reflection of plants. Multiple spectrum indices can be constructed using these abundant bands, which are helpful for data collection and monitoring in seaweed farming. This article uses two levels of Sentinel-2 data, Level-1C, and Level-2A. Level-1C products are Top-of-Atmosphere corrected reflectance products. Level-2A products are Bottom-of-Atmosphere corrected reflectance products that have been ortho-corrected, geometrically corrected, and atmospherically corrected by European Space Agency (ESA) and are available after 28 March 2017.
Sentinel-1 satellites are widely used for land and ocean observations and have all-weather, all-day radar imaging capabilities. Sentinel-1A and Sentinel-1B satellites were successfully launched in April 2014 and April 2016, respectively. The revisit period of the two satellites has been greatly shortened to 6 days. The Sentinel-1 products have been pre-processed using the ESA’s Sentinel-1 toolbox, including orbital reconstruction, thermal noise removal, radiometric calibration, and terrain correction [24]. Previous studies have shown that farming rafts are easier to observe in isotropic polarization images [25]. Correspondingly, in the Interferometric Wide swath (IW) mode, the image of vertical-horizontal (VH)+ vertical-vertical (VV) polarization in ground range detected (GRD) format was chosen as the data source from ESA’s Copernicus project’s dual polarized C-band SAR. A detailed introduction of the parameters of Sentinel-1/2 data are shown in Table 1.

2.2.2. Data from Government Statistics and Reports

In the Tidal Flat Planning for Aquaculture Waters in Jiangsu Province (2020–2030) issued by the Jiangsu Provincial Department of Agriculture and Rural Affairs, three concepts are defined: available breeding areas, restricted breeding areas, and prohibited breeding areas. To identify the rationality of the offshore seaweed aquaculture in Jiangsu, we define the prohibited and restricted breeding areas as the areas of unsustainable development of seaweed aquaculture. Subsequently, the areas of unsustainable development of seaweed aquaculture and the seaweed aquaculture extraction results were overlaid for analysis [26]. In addition, for three coastal cities, we applied the Tidal Flat Planning for Aquaculture Waters. To check the accuracy of these results, we collected the China Fisheries Statistical Yearbook from 2016 to 2020 [27]. Furthermore, we collected the Jiangsu Province Marine Disaster Bulletin and the China Marine Disaster Bulletin to analyze the dynamics of seaweed farming areas [28,29].

3. Methods

Our research process is shown in Figure 3.

3.1. Image Pre-Processing

3.1.1. MISC-OA Marine Mask Extraction

To avoid the interference of the spectral reflectance of the land, we created a high-resolution ocean mask based on Sentinel-2. First, an initial time-series image collection was constructed using 10,440 scenes of surface reflection images in Jiangsu Province from 1 January 2016 to 1 April 2022.
Considering the continuity of the research and the possibility that the coastline may change with factors such as crustal movement and land reclamation, we made year-by-year dynamic marine masks. Due to the limitation of image shooting time, some images often contain exposed tidal flats, so obtaining the maximum water surface area with only one image may not be possible. Jia et al. proposed to use the method of maximum spectral index composite (MSIC) combined with the Otsu algorithm (OA) to obtain the maximum water surface range [30]. The objectives of the method are: (1) utilize the QA60 band to disguise observations of poor image quality due to opaque and cirrus clouds [31]; (2) a study shows that modified Normalized Difference Water Index (mNDWI)-MSIC can represent the largest seawater surface extent in coastal information extraction and is the best choice for capturing the highest water level [30]. The modified Normalized Difference Water Index (mNDWI) is developed from the Normalized Difference Water Index (NDWI), which can enhance open water features, and effectively suppress or remove vegetation and soil noise [32]. So, on the GEE, we used the qualityMosaic function to implement the MSIC method, and mNDWI was calculated by traversing all images in each year to capture the maximum water surface per year (Table 2); (3) based on image histogram, OA underpinned automatically dividing an optimal threshold for segmenting images into two categories [33], water and land; (4) convert raster data to vector data for further classification. We finally acquired the mask data in each year using the above steps.

3.1.2. Sentinel Image Pre-Processing

Raft aquaculture facilities are generally placed in the sea from September to October. March and April are the harvest periods of seaweed, and the seaweed facilities are recycled to the shore from the end of May to early June [34]. Accordingly, the images were used to extract the seaweed cultivation area before the harvest period. Furthermore, in the Mode-I area, there is no large-scale tidal flat, so there is no need to consider the impact of tidal flat exposure on the binary extraction of seaweed aquaculture. In the Mode-II area located in Subei radiation shoals, the images we chose needed to avoid large areas of tidal flat exposure. Appropriate images helped reduce mixed pixels and distinguish the characteristics of water and seaweed farming areas while avoiding the disturbance caused by tidal flats.
We built the time-series images in the following steps: first, for Sentinel-1,1-month composites were produced with the median values of the effective observations so that noise interference could be minimized to some extent in this manner. Since the quality of the Sentinel-1 monthly median image in 2019 was greatly disturbed by tidal flats, we only used a single image with better quality for subsequent feature selection and extraction; next, for Sentinel-2, cloudless or less than 10% cloudy before the seaweed harvest were filtered. Then it was judged whether the image had been atmospherically corrected, as the L1-C level datasets before 28 March 2017, on the GEE, have not been atmospherically corrected. If no atmospheric correction has been conducted, a SIAC atmospheric correction model based on GEE is required [35]; finally, each image band was resampled to 10 m to ensure all the data used in the paper have the same spatial resolutions.

3.2. Feature Selection and Extraction

The Sentinel-2 MSI image contains rich spectral and textural features, while the Sentinel-1 SAR image can penetrate clouds and fog well, offering a multi-dimensional feature space for seaweed agriculture extraction. According to the special geographical environment of the study area, we used the initial bands of Sentinel-2, and dual-polarized features of Sentinel-1 (VV + VH) and constructed commonly used indices (Table 2). We selected five spectral indices and one dual-polarized index to assist in the classification of images. Therefore, we utilized the features in Table 2 to construct the input feature set for the random forest algorithm for seaweed extraction.
According to the features of the study area, we constructed the features of the water index, vegetation index, and soil index, respectively. Currently, Sentinel-1 dual-polarized Water Index (SDWI) and the mNDWI were utilized to capture water. Considering the signal difference between water and other objects in dual-polarized features, SDWI can enhance water information while eliminating the influence of soil and vegetation [36]. The modified Normalized Difference Water Index (mNDWI) can enhance open water features, and effectively suppress or remove vegetation and soil noise (Section 3.1.1). For vegetation features, we chose the following three representative vegetation indices: Normalized Difference Vegetation Index (NDVI) is one of the most broadly used vegetation indices, which can reflect vegetation’s growth status and distribution density [37]. Enhanced Vegetation Index (EVI, also known as soil and atmosphere resistant vegetation index (SARVI2)) is improved from NDVI, and after constructing a feedback mechanism developed by Liu et al., the influence of soil and atmospheric environment is simultaneously corrected through the parameters [38,39]. L is the canopy background adjustment parameter. C1 and C2 weigh the use of the blue channel in the aerosol correction of the red channel. The value of L (L = 1), C1 (C1 = 6.0), and C2 (C2 = 7.5) in the EVI formula were first calculated by Huete et al. [40]. They have been widely accepted as common coefficients. Firstly, these coefficients were calculated for MODIS [41,42], and then the researchers found that the values of these coefficients were also effective for Landsat and Sentinel-2 data [43,44]. Difference Vegetation index (DVI) is sensitive to soil background changes and suitable for vegetation monitoring with low vegetation coverage or in the early and middle stages of vegetation growth [45]. To extract coastal tidal flats and wetland features, the Normalized Difference Soil Index (NDSI) was introduced as a select metric, which enables us to differentiate the soil, water, and vegetation [46]. For the Sentinel-2 multispectral bands, we chose the B1–B5, B8, B8A, B11, and B12 bands. B1 is the coastal/aerosol band used to monitor aerosols in near-shore water and the atmosphere. B2, B3, and B4 are visible light bands. B5, B6, and B7 are vegetation red edge bands. B9 and B10 are the water vapor and the cirrus bands, with a resolution of only 60 m. In order to avoid overfitting, model degradation, and long training periods, we removed the low-resolution and abundant bands (B6, B7, B9, and B10) [47]. Through our observation of images and a previous study [25], we found that the seaweed rafts in the Mode-I region are easier to observe in the VV band of Sentinel-1. There are more tidal flats in the Mode-II area, and VH of Sentinel-1 has been proven to have a better observation effect [11], thus, we chose different polarization bands for the two regions.

3.3. Classification with Random Forest

Random forest decision theory was first formally proposed in July 2001 [48]. Random forest (RF) is a classification algorithm based on decision trees with high computational accuracy, short model training time, and low sensitivity to the quantity and quality of training samples [18]. It has been successfully applied to remote sensing fields such as water photovoltaic extraction, land cover classification, and mapping of crops [18,47,49].
Binary classification (seaweed aquaculture and non-seaweed aquaculture) was conducted derived from the RF algorithm and training samples. We set up the parameters of RF when training the classifiers: (1) number Of Trees (T): Previous studies have shown that T can effectively improve the classification accuracy of random forests [49]. After the T exceeds 100, the model will reduce the sensitivity to the number Of Trees, and the classification results tend to be stable. The T in our study was set to 500 through multiple experiments. (2) Five other parameters including the number of variables per split, the fraction of input to bag per tree, the minimum number of samples required to be at a leaf node, random seed, and the maximum number of leaf nodes in each tree, were set by default.

3.4. Post-Classification

3.4.1. Integrated Updating

Update methods are increasingly used for land cover classification and variation analysis [50]. Xia et al. used the integrated update method to modify the classification results of each year by using the pixel values of the classification results of water body types (aquaculture ponds and other water bodies) for many years as a reference map [23]. This method can reduce the “false changes” in the classification process and improve classification accuracy. Considering that the rafts for seaweed farming will be in that location for several years once they are placed, it is suitable to apply the integrated update method to remove misclassified pixels outside the scale of seaweed aquaculture. Therefore, we used the binary map of the classification results over the years as a reference map and improved the performance.

3.4.2. Fill and Smooth Edges

Considering the challenges of pixel-based classification, the extracted results need to be filled with empties and smoothed edges. For example, the edges of the extracted results were misclassified, and the interiors of the extracted results were spatially discontinuous (empties). We can fill empties and smooth edges through clumping. Clumping is a method of clustering and merging adjacent similarly classified regions using mathematical morphological operators (erosion and dilation). Most speckles will disappear in the resulting maps via filling empties, while jagged edge information will be alleviated via smoothing edges.

3.4.3. Remove Noise and Debris

Pixel-based classification is prone to pixel islanding problems. To address this problem, we used the eight-connection method of the connectedPixelCount function in GEE to extract the seaweed aquaculture from small areas.

3.4.4. Remove Offshore Wind Power

According to the microwave scattering principle, the echo intensity is mainly determined by the ground objects’ complex permittivity and surface roughness. Due to the unique side-view imaging method of SAR images, very few reflected electromagnetic waves are received by the sensor in the water where specular reflection occurs, resulting in a low backscattering coefficient of the water. However, the echo intensity of small-scale offshore wind turbines in Subei radiation shoals was relatively large, which had a certain impact on the correct analysis of the images. Although we selected many windmill samples, there are still mis-extractions of windmill edge information (e.g., windmill wings). We also used the connectedPixelCount function to remove the wrong pixels.

3.5. Convex Hull Algorithm

Convex Hull is a classical and commonly used algorithm in computational geometry. It is mathematically defined as: in the vector space V, the intersection S of all convex sets containing X is named the convex hull of X. The problem solved by the convex hull algorithm is: given a bunch of discrete points in space, calculate a convex polygon containing all the points. We conducted it to obtain the circumscribed polygon of the seaweed cultivation area, which is beneficial to grasp the direction and scale of its spatial expansion intuitively.

3.6. Validation

To evaluate the classification accuracy from 2016 to 2022, 30% of the samples were used as a validation sample to reckon the user’s overall accuracy (OA) and Kappa coefficients. The samples were generated by expert visual interpretation based on free satellite images such as Landsat, Sentinel, and Google Earth historical images. Moreover, we utilized the China Fisheries Statistical Yearbook to verify the reliability further.

4. Results and Analysis

4.1. Accuracy Assessment

The accuracy assessment showed that our results have high accuracy (OA > 88% and Kappa coefficient > 0.74) (Table 3). We found that there were still variations in some years (Figure 4c). Compared with the statistical yearbook, the area of seaweed aquaculture in 2016 was high, while the area of seaweed aquaculture in 2017 was low. We considered that multiple hazards (e.g., sea ice disaster, sargasso disaster, wave disaster) might cause bias in our observations, which we will discuss in Section 5.2.

4.2. Spatiotemporal Dynamics in Seaweed Aquaculture

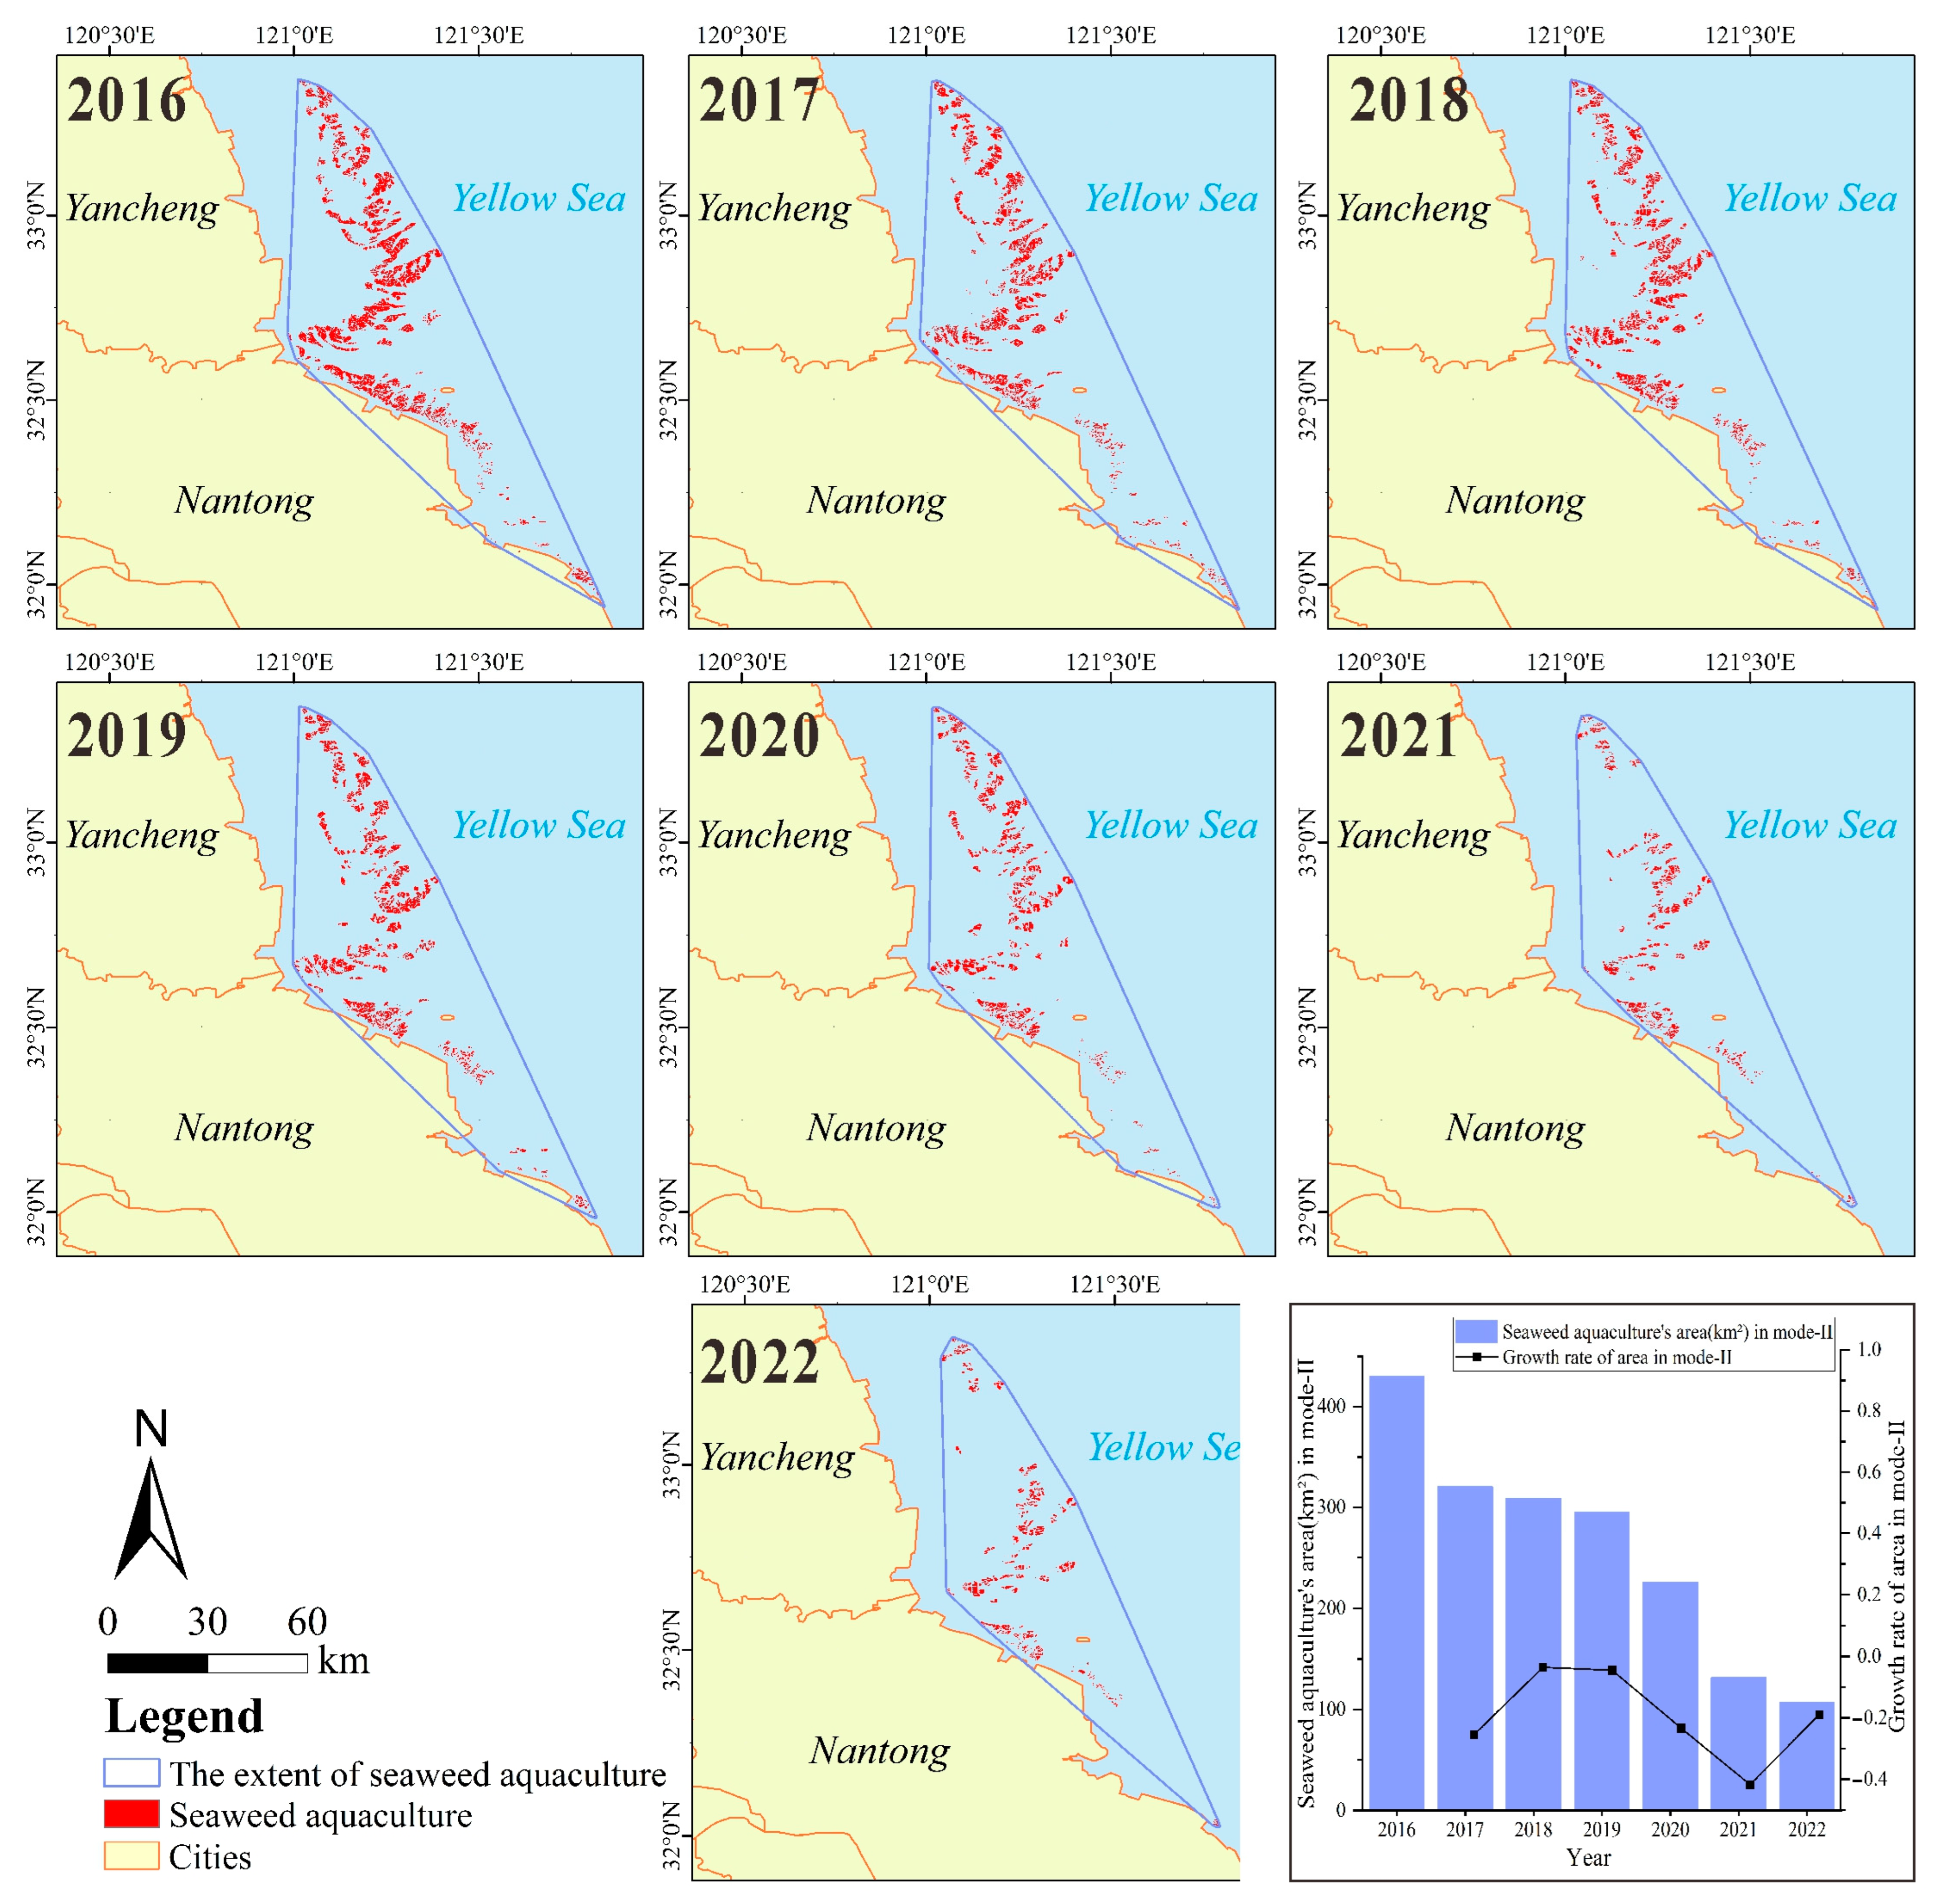
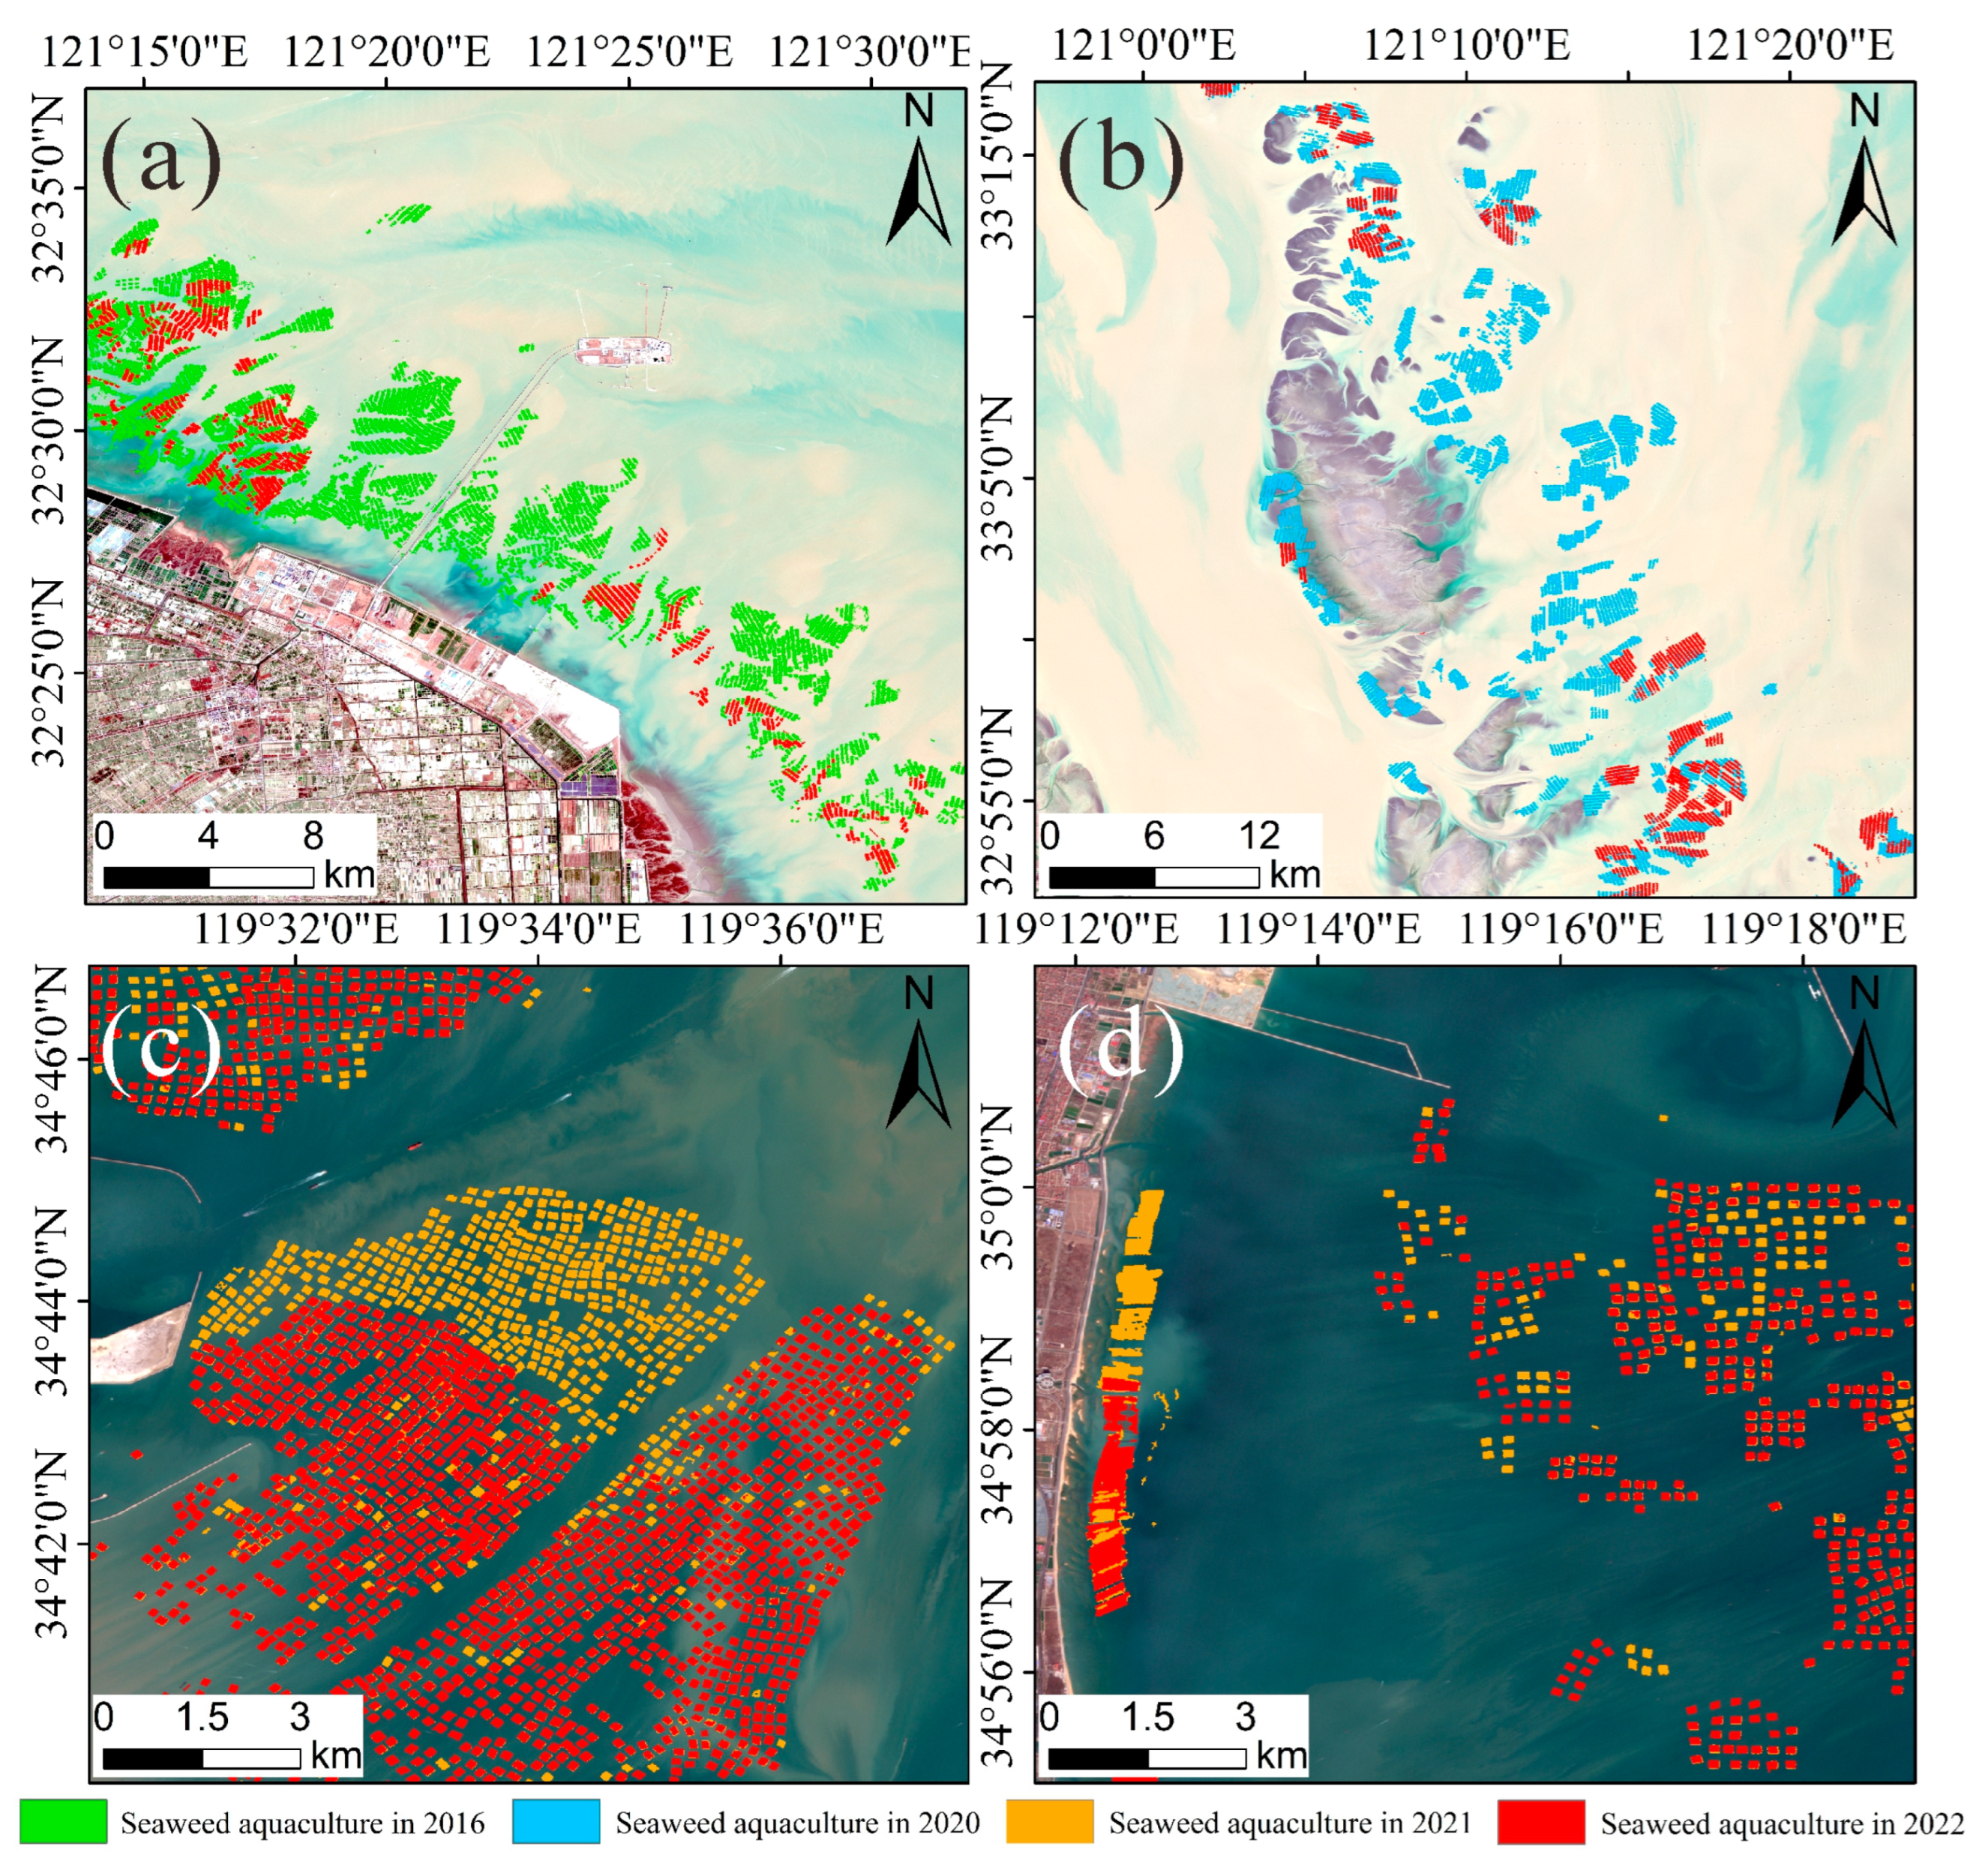
The seaweed aquaculture areas in Jiangsu Province are mainly distributed in the Haizhou Bay (Mode-I) in Lianyungang and Subei radiation shoals (Mode-II). The total area of seaweed aquaculture in Jiangsu has reduced by half from 507.96 km2 (2016) to 242.95 km2 (2022) (Figure 4c). We used the convex hull algorithm to enclose the range of the seaweed farming areas (Figure 5 and Figure 6). From 2016 to 2020, the area of Mode-II was always larger than that of Mode-I, with a maximum difference of 351.47 km2 in 2016. However, Mode-I’s area exceeded Mode-II’s area in 2021, with a maximum difference of 29.55 km2 in 2022. The spatial expansion trend was (Figure 4a,b): the area of Mode-I gradually expanded from nearshore to the deep eastern sea, and some nearshore areas had a reduction in the breeding density and the reduction of the aquaculture areas (Figure 7c,d). The area of Mode-II was not significantly expanded in space, but in 2017, the seaweed aquaculture area near Yangkou Port was partially reduced compared to 2016, and no seaweed farming has been installed in this region since then (Figure 7a). In 2021, the breeding area near the tidal flat in the eastern sea area of Dafeng Elk National Nature Reserve significantly decreased (Figure 7b). Compared with 2020, the area of Mode-II decreased by 94.36 km2.

4.3. Spatial Distribution of Diverse Modes of Seaweed Aquaculture

Seaweed was grown and matured on rafts’ net screens as an artificial large-scale cultured algae. The seaweed rafts are mainly composed of net screens, floating ropes, rafts, buoys, and so on. The buoy has the function of floating, the raft supports the net screen, and seaweed is distributed on the net screen, which can make the laver float on the seawater surface (Figure 8) [51].
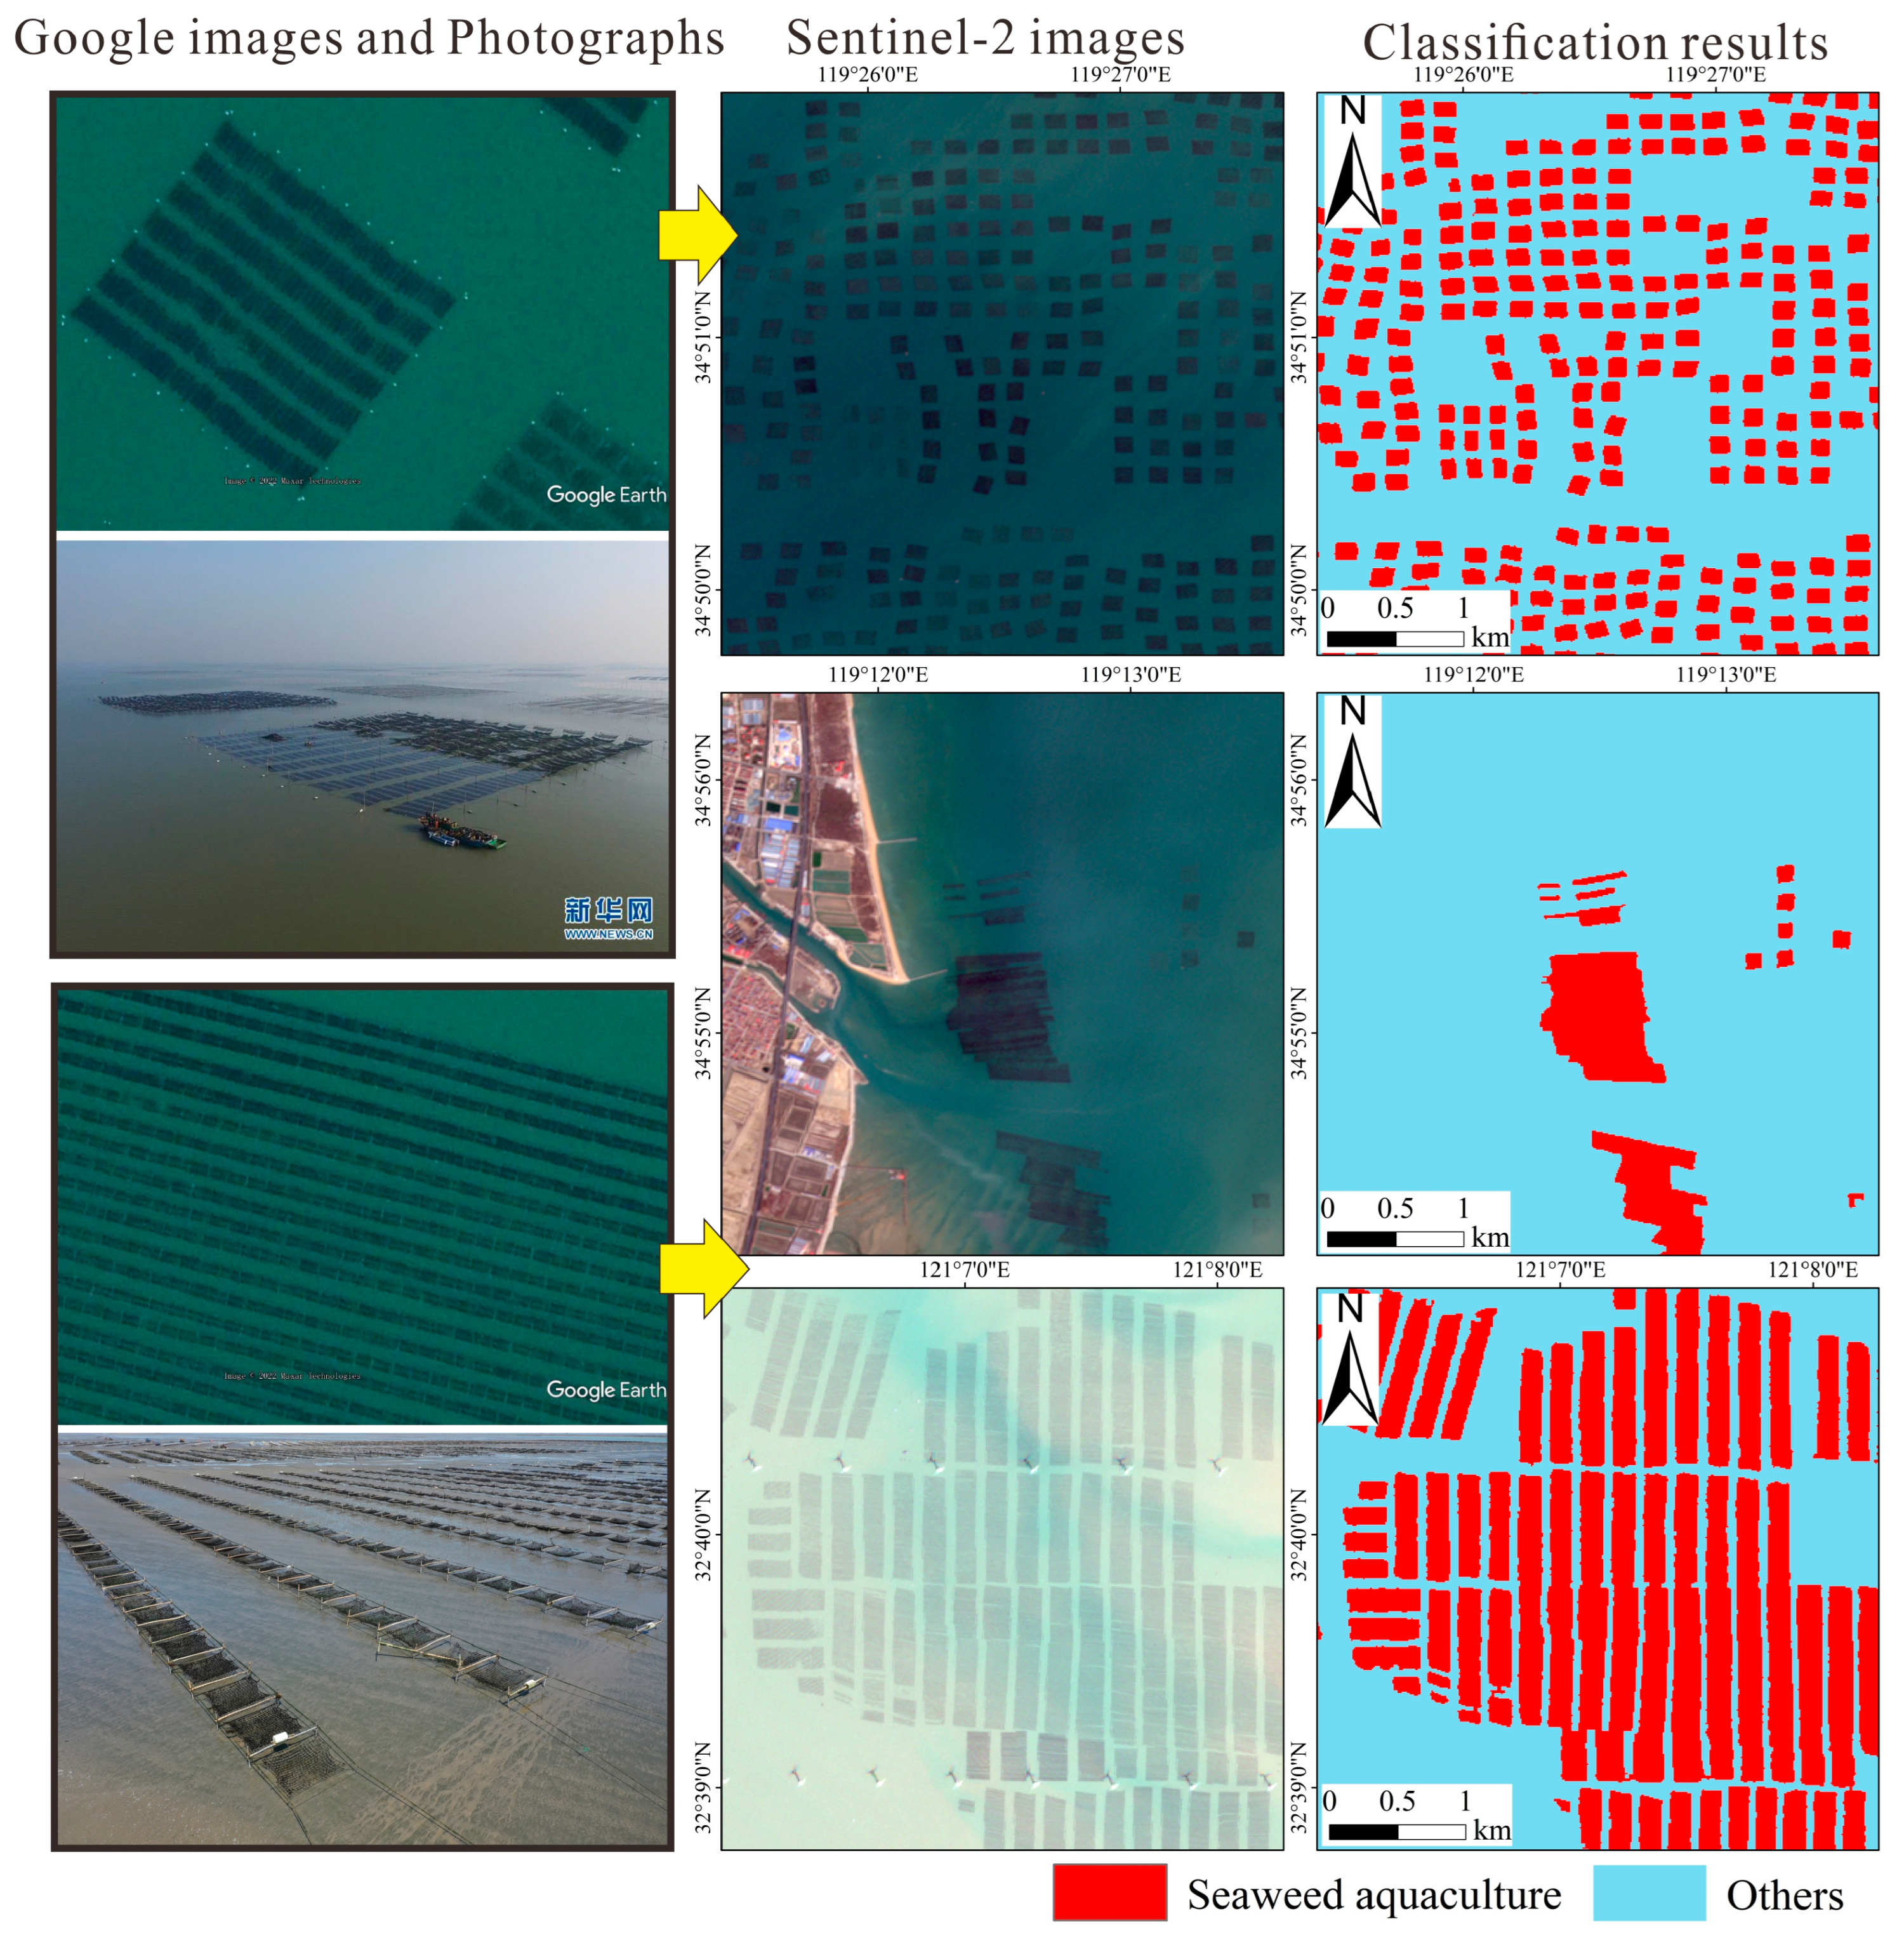
Through remote sensing observations, it was discovered that there were a few strip-shaped seaweed aquaculture areas near the coast and in the deep sea in Haizhou Bay of Lianyungang. Most areas of Haizhou Bay have square-shaped seaweed aquaculture areas with adjustable raft heights (Mode-I) (Figure 9). Data collection and field investigation found that the aquaculture area mainly adopts the stay-pole raft aquaculture method (Figure 8(Left)). It is a method that directly inserts bamboo poles, wooden stakes, or FRP (Fiberglass Reinforced Plastics) poles into the seabed as pillars, and hangs a net screen on the pillars so that the net screen floats or dries out with the rise and fall of the tide. During the breeding period, farmers constantly adjust the tightness of the floating ropes of the rafts at regular time intervals to avoid the rafts being completely submerged in water due to the impact of wind, waves, and tides. The spacing of each seaweed farming unit is used to provide a channel for picking. With the continuous development of aquaculture technology, seaweed aquaculture will gradually expand from near-shore shallow-water areas to offshore deep-water areas.
It was discovered that the seaweed aquaculture areas in Subei radiation shoals were all strip-shaped seaweed aquaculture areas with fixed raft heights affected by the tide (Mode-II). The unique geographical condition in Subei radiation shoals has created a semi-floating raft aquaculture method that is unique in China and is suitable for the intertidal zone with a large tidal range (Figure 8(Right)). In this way, the net screen and the raft are suspended in the sea when the tide rises. When the tide falls, the net screen and raft are exposed on the beach [22].

4.4. Analysis of Unsustainable Development of Seaweed Aquaculture

In recent years, the government of Jiangsu Province has gradually realized the seriousness of green tide. It has successfully issued various policies and plans, such as Jiangsu Province’s “14th Five-Year” Marine Economic Development Plan and the Planning of Tidal Flats in Aquaculture Waters in Jiangsu Province (2020–2030) [26,52]. These policies and plans aim to achieve marine aquaculture’s sustainable and healthy development, reduce the pressure on the marine environment, and build a blue space for a new development pattern.
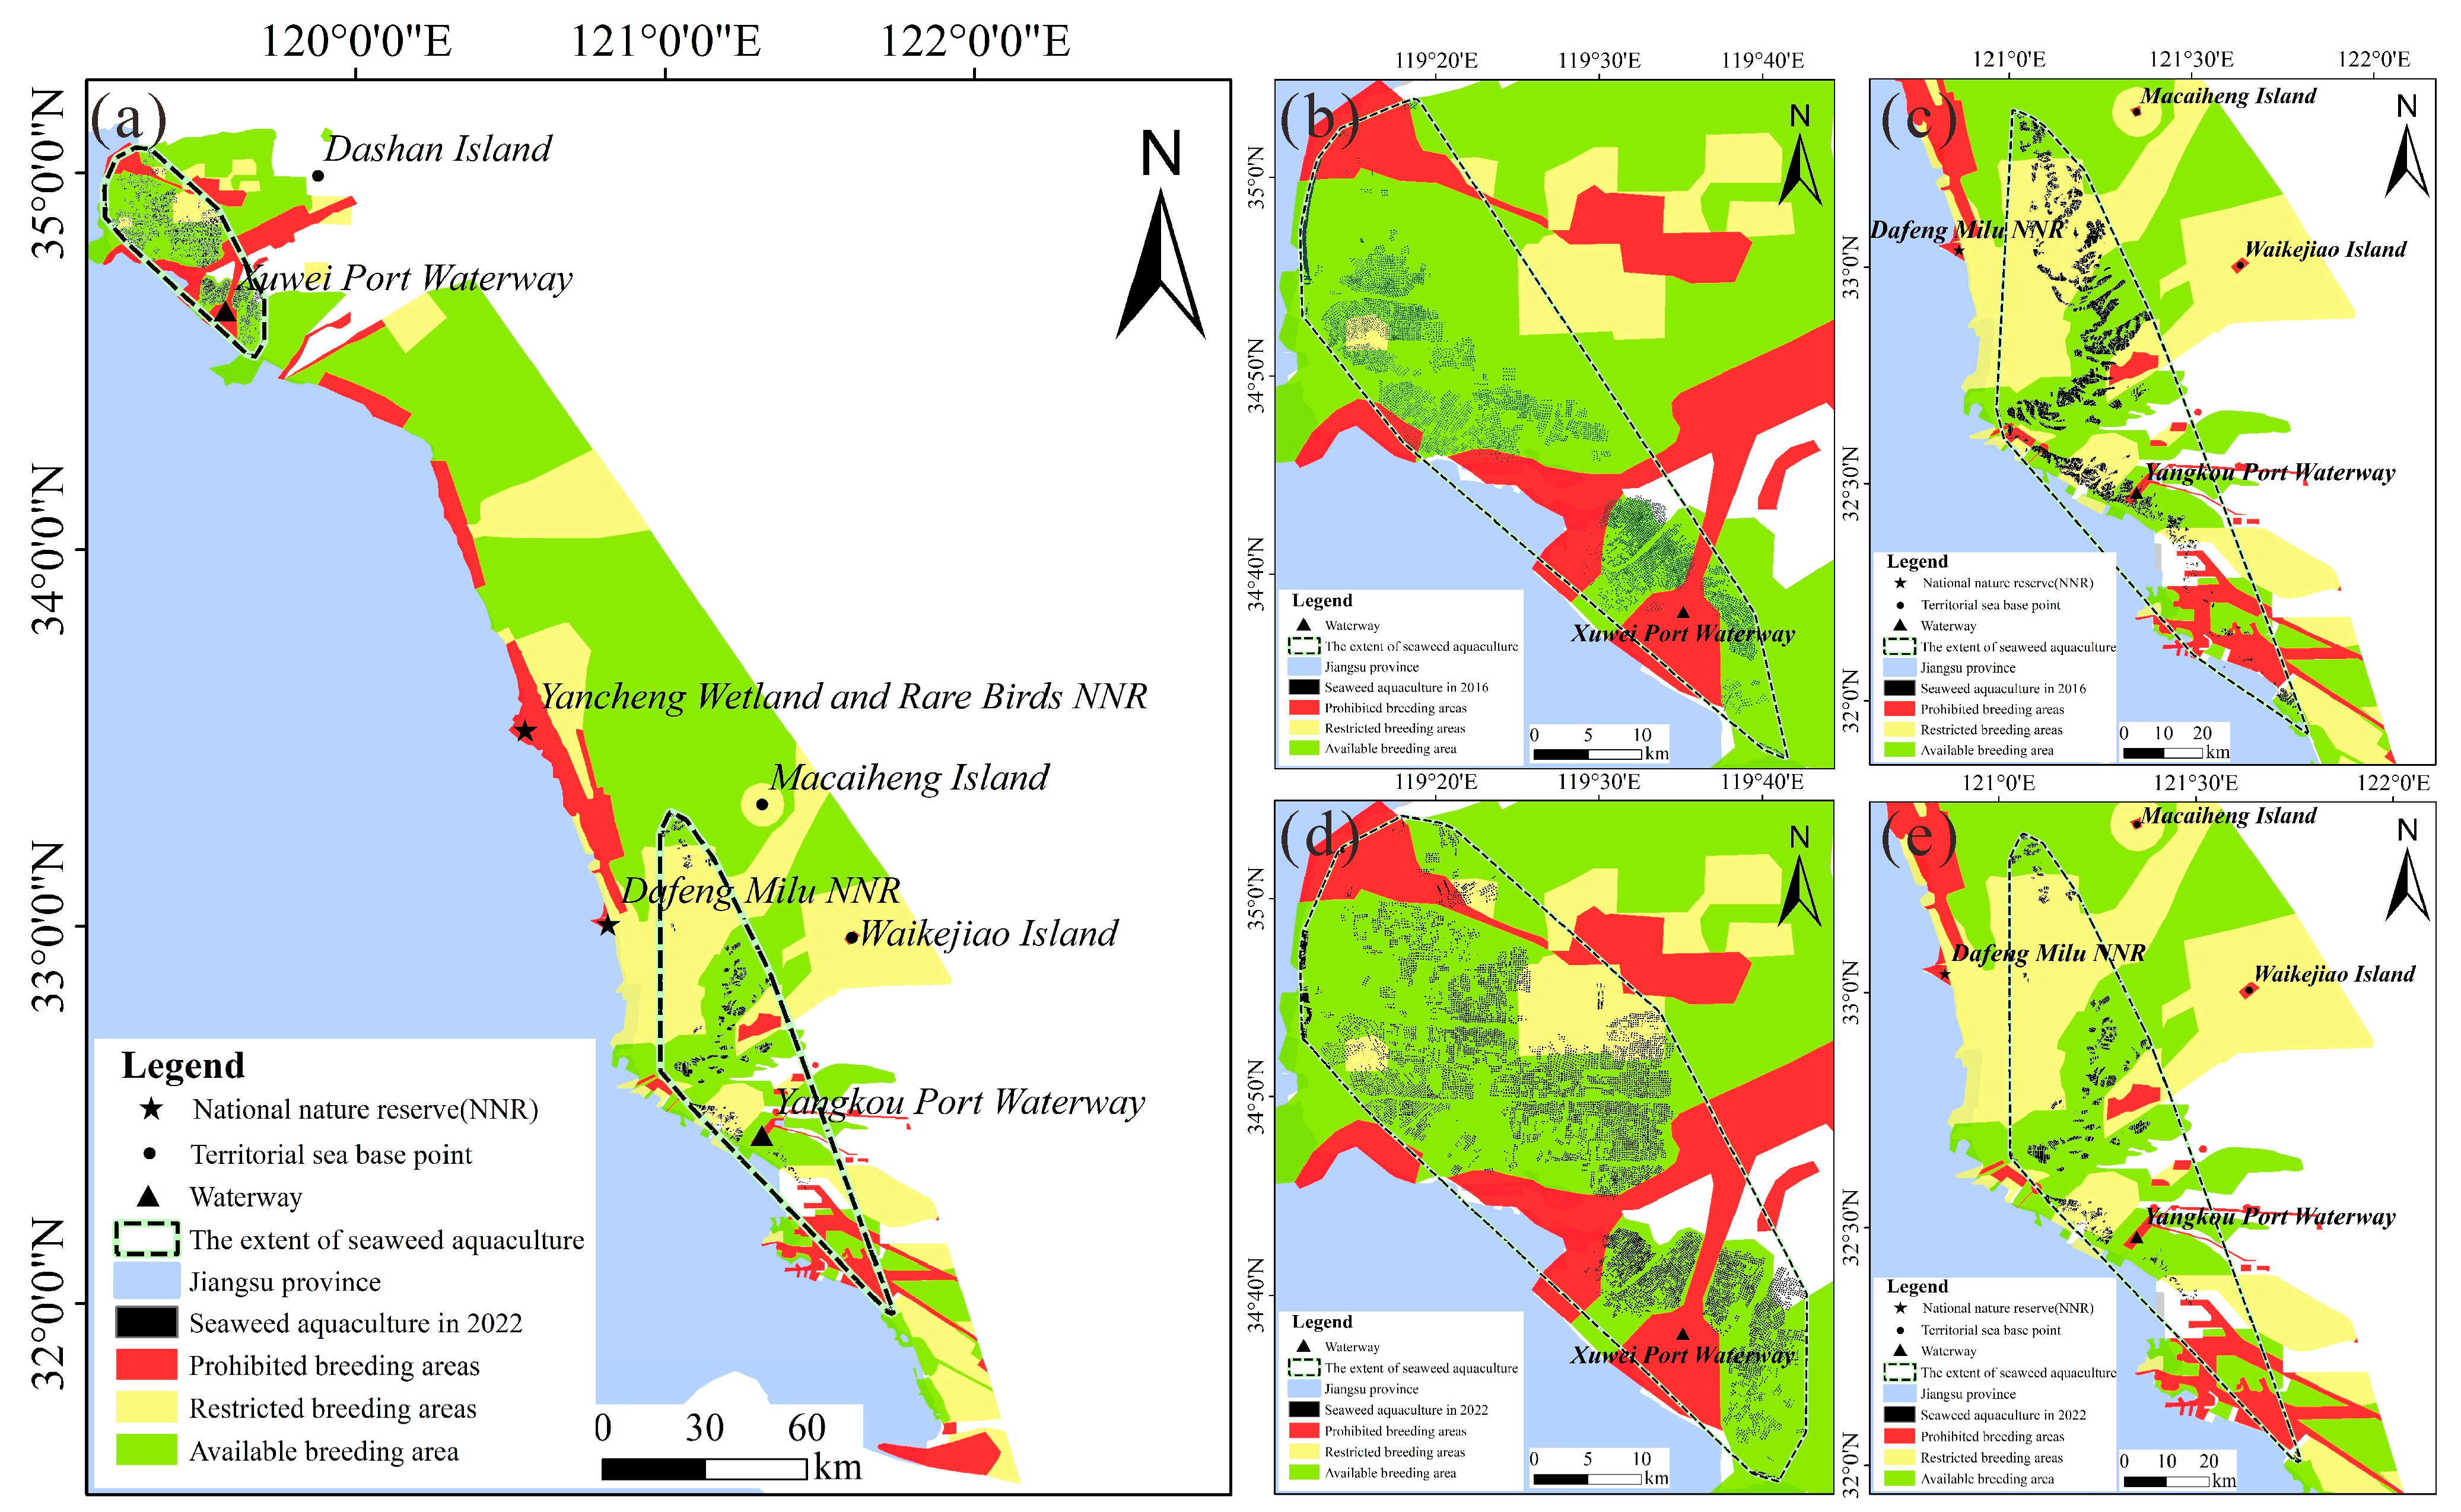
The overlay analysis of the mariculture planning map and the extraction results of the seaweed aquaculture area in 2022 shows that the Xuwei port waterway of Lianyungang and the Yangkou port waterway of Nantong, the core area and buffer area of the national nature reserve in Jiangsu, and the core areas and buffer zones of China’s territorial sea bases are setting as prohibited or restricted breeding areas (Figure 10).
We calculated the area of seaweed aquaculture in prohibited and restricted breeding areas in 2016 and 2022. In general, the area of the seaweed aquaculture in the prohibited breeding area was reduced from 20.32 km2 to 3.13 km2, and the area of the seaweed aquaculture in the restricted breeding area was reduced from 149.71 km2 to 33.15 km2. In addition, the area of Mode-I in the prohibited breeding area was reduced from 4.84 km2 to 2.69 km2, but the area of Mode-I in the restricted breeding area was increased from 2.39 km2 to 9.69 km2. The area of Mode-II in the prohibited breeding area and the restricted breeding area was reduced from 15.48 km2 to 0.44 km2 and 147.32 km2 to 23.46 km2. This shows that in the past seven years, due to the improvement of government planning and laws, the area of unsustainable development of seaweed aquaculture tends to decrease, and the unsustainable development area of seaweed aquaculture in Mode-II has decreased more significantly. In the future, the supervision of unsustainable farming behaviors in the northwest of Haizhou Bay should be strengthened.

5. Discussion

5.1. Model Performance and Data Accuracy

Although previous studies used remote sensing images to extract seaweed aquaculture, most did not obtain higher resolution mapping of seaweed aquaculture, which brought certain challenges to area estimation [14]. Our research used high-resolution Sentinel time-series imagery and machine learning methods to correctly identify small, easily overlooked farming units and reduce misclassification caused by edge-confused pixels. Therefore, it was a favorable attempt to accurately map the medium-scale seaweed cultivation areas along the coast of Jiangsu. Meanwhile, our framework is also a very active application of GEE in extracting seaweed aquaculture, which can quickly retrieve long-time series images and map the latest vintage of seaweed aquaculture (2022). In addition, to avoid the impact of land reclamation on coastline changes, this paper proposed to use annual time series remote sensing images for coastline measurements, rather than utilizing fixed vector data. The overall accuracy can reach higher than 0.88, and the Kappa coefficient can reach higher than 0.74. Concurrently, the comparison with statistical data was added, which showed that our model had high accuracy for extracting seaweed cultivation areas.
As more and more machine learning methods, remote sensing datasets, and socioeconomic data are integrated into the Google Earth Engine cloud computing platform, it has become easier to extract information from remote sensing images and analyze hot issues. This framework is an active application of rapid mapping of seaweed aquaculture areas based on Google Earth Engine, which can provide a reference for other coastal information extraction.

5.2. Development and Impact of Seaweed Aquaculture

In recent years, the demand for seaweed in various countries in the world has increased, and the development of China’s seaweed industry has taken the lead in the world [53]. This paper indicated that from 2016 to 2022, the seaweed cultivation area in Mode-I first increased and then decreased, and there was a trend of expanding to the deep-sea area. In 2018, it reached a maximum area of 194.06 km2. Since then, Mode-I has reduced the breeding scale and breeding density in the nearshore area, and the area has gradually decreased. The area in Mode-II showed a trend of decreasing year-by-year, of which the area in 2017 and 2021 decreased by 25.43% and 41.75%, respectively, compared with the previous year. In 2021, the scale of aquaculture in the Dongsha area (radial sand ridges) of Subei radiation shoals reduced significantly.
With the influence of climate warming, unstable marine environment, and human factors, the seaweed aquaculture industry will face huge disaster risks (e.g., sea ice expansion, sargassum invasion, typhoons, and higher waves) and bring potential ecological impacts. Affected by the extremely cold weather, the main seaweed-producing area (Mode-I) of Haizhou Bay in Lianyungang reached the lowest temperature in 46 years in early January 2016. The sea ice expansion caused severe damage to tens of thousands of hectares of fresh seaweed [54]. Our results indicated that the area of seaweed cultivation in 2016 was 78.24 km2, but the actual yield may be lower than that measured and mapped from remote sensing because the seaweed was damaged by freezing. From December 2016 to early 2017, large-scale golden tides occurred on the Subei radiation shoals [55]. A large amount of sargassum accumulated on the breeding rafts, and almost all the seaweed rafts on the edge of the tidal flat collapsed, resulting in a large-scale reduction in seaweed production and a major economic loss of about 500 million yuan [56]. Our results indicated that the aquaculture area of Mode-II in 2017 decreased by 25.43% compared with 2016, and in the following years did not return to the scale of 2016 (Figure 6). In addition, the extreme wave disasters in 2016, 2017, and 2020 also caused a large-scale reduction in aquaculture production, and the coastal aquaculture rafts were seriously damaged and washed away by the waves [29]. Compared with 2019, the total area of seaweed aquaculture decreased by 16.59% in 2020. Therefore, the compounding of multiple extreme events may be responsible for the bias in our extraction results and statistical yearbooks.
In 2007, the green tide was first detected along the coast of Qingdao, Shandong Province, in the northeastern part of Jiangsu province [13]. Since then, the Green Tide Control Department has adopted measures such as reducing the area of seaweed cultivation to support the control of green tides. However, in 2021, the Yellow Sea still ushered the largest green tides in 15 years [7]. Relevant studies have shown that some damaged bamboo poles may become the attachment base of prolifera, triggering the green tide [9]. Currently, the Chinese government has incentives and subsidies to encourage the early harvest of seaweed and the use of new raft materials [57]. Therefore, raft fixing technology and raft materials (e.g., FRP) should be fundamentally improved, then seaweed farming should be controlled at a reasonable scale.
In addition, attention to the impact of seaweed aquaculture on biodiversity is crucial. Subei radiation shoals are also an important area on the migration route of East Asian-Australian migratory birds. However, the large-scale expansion of the seaweed farming industry may lead to a reduction in the area of biological habitats. The Enteromorpha disaster caused by the unsustainable development of seaweed aquaculture may lead to the death of marine organisms due to hypoxia.
While extracting seaweed, we unexpectedly found that the offshore wind power projects in Subei radiation shoals have been further expanded in recent years. We should realize synergies between offshore wind energy and Integrated Multi-trophic Aquaculture (IMTA) systems to improve ocean resource utilization and avoid energy shortages in coastal cities [58].

5.3. Recent Policy Restrictions on Seaweed Aaquaculture

Since 1994, China’s national and local governments have issued five relevant laws, three regulations, twelve plans, and two policy suggestions related to the seaweed aquaculture industry (Table S1). Especially since 2018, policies related to the seaweed aquaculture industry in Jiangsu have emerged.
Therefore, the development of marine aquaculture has been restricted by some policies. The Opinions on Accelerating the Healthy Development of the Seaweed Industry, released in 2018, proposed that in the future, Lianyungang City will reduce the high-density breeding of seaweed, guide farmers to control the breeding density within a reasonable range, and centrally treat and use the waste generated by aquaculture. It is also proposed that it is planned to gradually withdraw seaweed farming from offshore tidal flats in 2025, to speed up the healthy development of the seaweed industry in Lianyungang. From our results, we can see that compared with other years, Lianyungang actively reduced the area of seaweed aquaculture and the density of seaweed rafts in some areas in 2022 (Figure 7c,d). In the Tidal Flat Plan for Aquaculture Waters in Jiangsu Province (2020–2030) released in 2022, and Planning of the National Ecological Protection Red Line in Jiangsu Province, released in 2018, coastal wetlands, national nature reserves, and their buffer zones, territorial sea bases and their buffer zones, and port waterways were all regarded as key ecological protection and restricted development areas, which restrict the direction and speed of seaweed aquaculture expansion. Results also showed that the scale of seaweed aquaculture in the regions mentioned above is decreasing. The Opinions of the General Office of the Jiangsu Provincial Government on Accelerating the Promotion of High-quality Development of Fisheries released in 2020 emphasizes the promotion of ecologically healthy farming, requires research on aquaculture capacity in coastal waters, and reasonably controls the scale of aquaculture. Our research can provide quantitative data support for formulating healthy ecological aquaculture policies [59].

5.4. Applicability and Limitations of Research Methods

This research could be applied to other multispectral and SAR images to accurately create the distribution map of seaweed aquaculture and comprehend its spatiotemporal distribution variations using the methods of sea and land mask extraction and seaweed extraction. Additionally, using the GEE platform, our methodology can be used for the quick and precise extraction of seaweed farming in various coastal areas and for mastering diverse kinds of aquaculture. Furthermore, we can assess the seaweed industry’s future output and carbon sequestration capacity, and then provide quantitative support for ocean blue carbon, sustainable aquaculture development, and disaster prevention.
Researchers should pay attention to the phenological aspects of seaweed aquaculture, the data and procedure uncertainties to implement this technology, and the importance of filtering appropriate images in other places. To begin with, different harvest periods apply to different places. The raft’s installation and recuperation times, as well as the seedling and harvest phases, must all be considered, otherwise unclear spectral characteristics may be introduced, resulting in missing extractions. Due to the tides and the growth environment of shallow seabed algae (coral reefs, seagrass, macroalgae), water column correction should be considered in the future to improve the accuracy of algae extraction below the sea surface [60]. Furthermore, our results may overestimate the actual seaweed aquaculture area due to the gap between the seaweed raft unit and the resolution of remote sensing photos.

6. Conclusions

Few studies have connected active and passive remote sensing on the GEE platform to map seaweed aquaculture and analyze their spatiotemporal dynamics. This study aimed to bridge this gap using the above-mentioned methodologies and the random forest classification algorithm. According to our findings, the seaweed aquaculture industry in Jiangsu experienced significant fluctuations between 2016 and 2022 due to laws and regulations. Since 2016, Mode-I has gradually expanded to the deep eastern sea, while reducing the breeding density and range in the nearshore area, and it reached a maximum area of 194.06 km2 in 2018. The expansion of Mode-II was not apparent in space, and the area was greatly reduced in 2021 and 2022. Its reduced area was mainly located in the eastern part of the Dafeng Elk National Nature Reserve. In addition, we studied the area change of unsustainable seaweed aquaculture in 2016 and 2022. We found that in the last seven years, the area of unsustainable development of seaweed aquaculture has decreased, especially Mode-II has decreased obviously. In 2022, the areas of seaweed aquaculture in the prohibited and restricted breeding areas are 3.13 km2 and 33.15 km2, respectively, and there is more unsustainable development of seaweed aquaculture in the northwest of Haizhou Bay. In the future, the government of Jiangsu Province needs to vigorously develop the marine aquaculture industry, pay attention to the innovation of marine aquaculture technology, make efficient use of marine resources, and explore a sustainable development path for marine aquaculture. This will help the world to develop ocean blue carbon better, achieve carbon neutrality, and adapt to and mitigate climate change.
The extraction method of seaweed aquaculture areas in this research can be easily deployed to map seaweed farming areas in other extensive places. Rapid, precise, and timely mapping of seaweed aquaculture can be an important source of data for evaluating carbon sequestration capacity and potential impact on marine ecosystems.

Supplementary Materials

The following supporting information can be downloaded at: https://www.mdpi.com/article/10.3390/rs14246202/s1, Table S1: Policies, regulations and materials related to seaweed aquaculture.

Author Contributions

Conceptualization, R.C. and J.G.; Methodology, J.C. and N.J.; software and data curation, J.C.; validation, J.C. and N.J.; resources, F.Z.; writing—original draft preparation, J.C.; writing—review and editing, N.J., X.G. and R.C.; visualization, J.C.; supervision and project administration and funding acquisition, R.C. All authors have read and agreed to the published version of the manuscript.

Funding

This work was supported by the Key Technologies Research and Development Program (2017YFC1503001), the National Social Science Fund of China (20ZDA085), and the National Natural Science Foundation of China [grant number 41771119].

Data Availability Statement

All data created in this study are publicly available. Our research relies on the Google Earth Engine cloud computing platform jointly developed by Google, Carnegie Mellon University and the US Geological Survey (https://earthengine.google.com/ (accessed on 20 January 2022)). The Sentinel datasets are openly available in Google Earth Engine. The download path of processed data can be found in Zenodo repository with the identifier https://doi.org/10.5281/zenodo.7053911 (accessed on 6 September 2022). The Chinese fishery Statistical Yearbooks from 2016 to 2020 and The Planning of Tidal Flats in Aquaculture Waters in Jiangsu Province (2020–2030) are also downloaded and placed in the Zenodo repository. Requests for raw data should be made to [email protected].

Acknowledgments

Thanks to the GEE platform for providing Sentinel-1 and Sentinel-2 data.

Conflicts of Interest

The authors declare no conflict of interest.

References

  1. Jiang, Q.; Xu, Z.; Zhang, H. Global impacts of COVID-19 on sustainable ocean development. Innovation 2022, 3, 100250. [Google Scholar] [CrossRef] [PubMed]
  2. Cornish, M.L.; Critchley, A.T.; Mouritsen, O.G. A role for dietary macroalgae in the amelioration of certain risk factors associated with cardiovascular disease. Phycologia 2019, 54, 649–666. [Google Scholar] [CrossRef]
  3. Hasan, M.M. Algae as Nutrition, Medicine and Cosmetic: The Forgotten History, Present Status and Future Trends. World J. Pharm. Pharm. Sci. 2017, 6, 1934–1959. [Google Scholar] [CrossRef] [Green Version]
  4. Duarte, C.M.; Bruhn, A.; Krause-Jensen, D. A seaweed aquaculture imperative to meet global sustainability targets. Nat. Sustain. 2021, 5, 185–193. [Google Scholar] [CrossRef]
  5. Rimmer, M.A.; Larson, S.; Lapong, I.; Purnomo, A.H.; Pong-Masak, P.R.; Swanepoel, L.; Paul, N.A. Seaweed Aquaculture in Indonesia Contributes to Social and Economic Aspects of Livelihoods and Community Wellbeing. Sustainability 2021, 13, 10946. [Google Scholar] [CrossRef]
  6. Garcia-Poza, S.; Leandro, A.; Cotas, C.; Cotas, J.; Marques, J.C.; Pereira, L.; Goncalves, A.M.M. The Evolution Road of Seaweed Aquaculture: Cultivation Technologies and the Industry 4.0. Int. J. Environ. Res. Public Health 2020, 17, 6528. [Google Scholar] [CrossRef] [PubMed]
  7. Sun, Y.; Yao, L.; Liu, J.; Tong, Y.; Xia, J.; Zhao, X.; Zhao, S.; Fu, M.; Zhuang, M.; He, P.; et al. Prevention strategies for green tides at source in the Southern Yellow Sea. Mar. Pollut. Bull. 2022, 178, 113646. [Google Scholar] [CrossRef]
  8. Guo, X.; Zhu, A.; Chen, R. China’s algal bloom suffocates marine life. Science 2021, 373, 751–752. [Google Scholar] [CrossRef]
  9. Xu, Q.; Zhang, H.; Cheng, Y.; Zhang, S.; Zhang, W. Monitoring and Tracking the Green Tide in the Yellow Sea With Satellite Imagery and Trajectory Model. IEEE J. Sel. Top. Appl. Earth Obs. Remote Sens. 2016, 9, 5172–5181. [Google Scholar] [CrossRef]
  10. Ahmed, Z.U.; Hasan, O.; Rahman, M.M.; Akter, M.; Rahman, M.S.; Sarker, S. Seaweeds for the sustainable blue economy development: A study from the south east coast of Bangladesh. Heliyon 2022, 8, e09079. [Google Scholar] [CrossRef]
  11. Mahdianpari, M.; Salehi, B.; Mohammadimanesh, F.; Homayouni, S.; Gill, E. The First Wetland Inventory Map of Newfoundland at a Spatial Resolution of 10 m Using Sentinel-1 and Sentinel-2 Data on the Google Earth Engine Cloud Computing Platform. Remote Sens. 2018, 11, 43. [Google Scholar] [CrossRef] [Green Version]
  12. Lin, H.; Lu, X.; Wang, X.; He, S.; Li, S.; Zheng, W.; Luo, W. Study on Spatial Expansion Model of Laver Cultivation Area in Jiangsu Offshore. Mar. Sci. Bull. 2021, 40, 206–216. [Google Scholar] [CrossRef]
  13. Xing, Q.; An, D.; Zheng, X.; Wei, Z.; Wang, X.; Li, L.; Tian, L.; Chen, J. Monitoring seaweed aquaculture in the Yellow Sea with multiple sensors for managing the disaster of macroalgal blooms. Remote Sens. Environ. 2019, 231, 111279. [Google Scholar] [CrossRef]
  14. Siddiqui, M.D.; Zaidi, A.Z.; Abdullah, M. Performance Evaluation of Newly Proposed Seaweed Enhancing Index (SEI). Remote Sens. 2019, 11, 1434. [Google Scholar] [CrossRef] [Green Version]
  15. Cui, B.; Fei, D.; Shao, G.; Lu, Y.; Chu, J. Extracting Raft Aquaculture Areas from Remote Sens. Images via an Improved U-Net with a PSE Structure. Remote Sens. 2019, 11, 2053. [Google Scholar] [CrossRef] [Green Version]
  16. Shi, T.; Xu, Q.; Zou, Z.; Shi, Z. Automatic Raft Labeling for Remote Sens. Images via Dual-Scale Homogeneous Convolutional Neural Network. Remote Sens. 2018, 10, 1130. [Google Scholar] [CrossRef] [Green Version]
  17. Teluguntla, P.; Thenkabail, P.S.; Oliphant, A.; Xiong, J.; Gumma, M.K.; Congalton, R.G.; Yadav, K.; Huete, A. A 30-m landsat-derived cropland extent product of Australia and China using random forest machine learning algorithm on Google Earth Engine cloud computing platform. ISPRS J. Photogramm. Remote Sens. 2018, 144, 325–340. [Google Scholar] [CrossRef]
  18. Xia, Z.; Li, Y.; Guo, X.; Chen, R. High-resolution mapping of water photovoltaic development in China through satellite imagery. Int. J. Appl. Earth Obs. Geoinf. 2022, 107, 102707. [Google Scholar] [CrossRef]
  19. Gorelick, N.; Hancher, M.; Dixon, M.; Ilyushchenko, S.; Thau, D.; Moore, R. Google Earth Engine: Planetary-scale geospatial analysis for everyone. Remote Sens. Environ. 2017, 202, 18–27. [Google Scholar] [CrossRef]
  20. Lu, Q.; Zhou, W.; Zhu, J.; Yan, B.; Ni, J.; Yang, L. The History, Status Quo and Development Trend of Pyropia Yezoensis Industry of China. Mar. Econ. China 2018, 3, 3–11. [Google Scholar]
  21. Xu, N.; Wang, Y.; Huang, C.; Jiang, S.; Jia, M.; Ma, Y. Monitoring coastal reclamation changes across Jiangsu Province during 1984–2019 using landsat data. Mar. Policy 2022, 136, 104887. [Google Scholar] [CrossRef]
  22. Xie, G.; Zhou, Y.; Bao, S.; Mao, H.; Shan, C. Thoughts on the ecological control methods of prolifera in the semi-floating raft type seaweed cultivation area in the northern Jiangsu shoal. Aquaculture 2021, 42, 69–70. [Google Scholar] [CrossRef]
  23. Xia, Z.; Guo, X.; Chen, R. Automatic extraction of aquaculture ponds based on Google Earth Engine. Ocean. Coast. Manag. 2020, 198, 105348. [Google Scholar] [CrossRef]
  24. Sentinel-1 Algorithms. Available online: https://developers.google.com/earthengine/guides/sentinel1 (accessed on 5 May 2022).
  25. Zhang, Y.; Wang, C.; Ji, Y.; Chen, J.; Deng, Y.; Chen, J.; Jie, Y. Combining Segmentation Network and Nonsubsampled Contourlet Transform for Automatic Marine Raft Aquaculture Area Extraction from Sentinel-1 Images. Remote Sens. 2020, 12, 4182. [Google Scholar] [CrossRef]
  26. Tidal Flat Planning for Aquaculture Waters in Jiangsu Province (2020–2030). Available online: http://coa.jiangsu.gov.cn/art/2022/1/25/art_11977_10330806.html (accessed on 8 May 2022).
  27. China Fisheries Statistical Yearbook. Available online: https://www.cafs.ac.cn/info/1397/37342.htm (accessed on 8 May 2022).
  28. Jiangsu Province Marine Disaster Bulletin. Available online: http://zrzy.jiangsu.gov.cn/gtxxgk/nrglIndex.action?classID=8a908254409a391f01409a4c2f31000d (accessed on 8 May 2022).
  29. China Marine Disaster Bulletin. Available online: http://gi.mnr.gov.cn/202205/t20220507_2735508.html (accessed on 8 May 2022).
  30. Jia, M.; Wang, Z.; Mao, D.; Ren, C.; Wang, C.; Wang, Y. Rapid, robust, and automated mapping of tidal flats in China using time series Sentinel-2 images and Google Earth Engine. Remote Sens. Environ. 2021, 255, 112285. [Google Scholar] [CrossRef]
  31. Li, H.; Jia, M.; Zhang, R.; Ren, Y.; Wen, X. Incorporating the Plant Phenological Trajectory into Mangrove Species Mapping with Dense Time Series Sentinel-2 Imagery and the Google Earth Engine Platform. Remote Sens. 2019, 11, 2479. [Google Scholar] [CrossRef] [Green Version]
  32. Xu, H. Modification of normalised difference water index (NDWI) to enhance open water features in remotely sensed imagery. Int. J. Remote Sens. 2007, 27, 3025–3033. [Google Scholar] [CrossRef]
  33. Otsu, N. A threshold selection method from gray-level histograms. IEEE Trans. Syst. Man Cybern 1979, 9, 62–66. [Google Scholar] [CrossRef] [Green Version]
  34. Jiang, X.; Zhou, X.; Lin, J.; Kang, Z.; Liu, Q. Research progress in the ecological consequences of Ulva prolifera green tides in the Yellow Sea. Mar. Environ. Sci. 2021, 40, 648–652. [Google Scholar] [CrossRef]
  35. Yin, F.; Lewis, P.E.; Gomez-Dans, J.L.; Wu, Q. A Sensor Invariant Atmospheric Correction: Sentinel-2/MSI and Landsat 8/OLI. Available online: https://eartharxiv.org/repository/view/1034/ (accessed on 8 May 2022).
  36. Sun, Z.; Luo, J.; Yang, J.; Yu, Q.; Zhang, L.; Xue, K.; Lu, L. Nation-Scale Mapping of Coastal Aquaculture Ponds with Sentinel-1 SAR Data Using Google Earth Engine. Remote Sens. 2020, 12, 3086. [Google Scholar] [CrossRef]
  37. Tucker, C.J. Red and photographic infrared linear combinations for monitoring vegetation. Remote Sens. Environ. 1979, 8, 127–150. [Google Scholar] [CrossRef]
  38. Huete, A.; Liu, H.; Batchily, K.; Van Leeuwen, W. A Comparison of Vegetation Indices over a Global Set of TM Images for EOS-MODIS. Remote Sens. Environ. 1997, 59, 440–451. [Google Scholar] [CrossRef]
  39. Liu, H.Q.; Huete, A. A feedback based modification of the NDVI to minimize canopy background and atmospheric noise. IEEE Trans. Geosci. Remote Sens. 1995, 33, 457–465. [Google Scholar] [CrossRef]
  40. Huete, A.; Justice, C.; Liu, H. Development of vegetation and soil indices for MODIS-EOS. Remote. Sens. Environ. 1994, 49, 224–234. [Google Scholar] [CrossRef]
  41. Obata, K.; Miura, T.; Yoshioka, H.; Huete, A.; Vargas, M. Spectral Cross-Calibration of VIIRS Enhanced Vegetation Index with MODIS: A Case Study Using Year-Long Global Data. Remote Sens. 2016, 8, 34. [Google Scholar] [CrossRef] [Green Version]
  42. Huete, A.; Didan, K.; Rodriguez, E.P.; Gao, X.; Ferreira, L.G. Overview of the radiometric and biophysical performance of the MODIS vegetation indices. Remote Sens. Environ. 2002, 83, 195–213. [Google Scholar] [CrossRef]
  43. Chu, D.; He, K.; Lin, S.; Zuo, Y.; Chen, X. Comparison of forest and shrublands in potentially afforested areas based on remote sensing and field surveys. Acta Ecol. Sin. 2022, 42, 7362–7371. [Google Scholar] [CrossRef]
  44. Nejatian, A.; Makian, M.; Gheibi, M.; Fathollahi-Fard, A.M. A novel viewpoint to the green city concept based on vegetation area changes and contributions to healthy days: A case study of Mashhad, Iran. Environ. Sci. Pollut. Res. Int. 2022, 29, 702–710. [Google Scholar] [CrossRef]
  45. Li, L.; Zheng, X.; Wei, Z.; Zou, J.; Xing, Q. A Spectral-Mixing Model for Estimating Sub-Pixel Coverage of Sea-Surface Floating Macroalgae. Atmosphere-Ocean 2018, 56, 296–302. [Google Scholar] [CrossRef]
  46. Rogers, A.S.; Kearney, M.S. Reducing signature variability in unmixing coastal marsh Thematic Mapper scenes using spectral indices. Int. J. Remote Sens. 2010, 25, 2317–2335. [Google Scholar] [CrossRef]
  47. You, N.; Dong, J.; Huang, J.; Du, G.; Zhang, G.; He, Y.; Yang, T.; Di, Y.; Xiao, X. The 10-m crop type maps in Northeast China during 2017–2019. Sci. Data 2021, 8, 41. [Google Scholar] [CrossRef] [PubMed]
  48. Breiman, L. Random Forests. Mach. Learn. 2001, 45, 5–32. [Google Scholar] [CrossRef] [Green Version]
  49. Pelletier, C.; Valero, S.; Inglada, J.; Champion, N.; Dedieu, G. Assessing the robustness of Random Forests to map land cover with high resolution satellite image time series over large areas. Remote Sens. Environ. 2016, 187, 156–168. [Google Scholar] [CrossRef]
  50. Ren, C.; Wang, Z.; Zhang, Y.; Zhang, B.; Chen, L.; Xi, Y.; Xiao, X.; Doughty, R.B.; Liu, M.; Jia, M.; et al. Rapid expansion of coastal aquaculture ponds in China from Landsat observations during 1984–2016. Int. J. Appl. Earth Obs. Geoinf. 2019, 82, 101902. [Google Scholar] [CrossRef]
  51. Liu, F.; Niu, J.; Sui, Z.; Shan, T.; Wang, T.; Tang, X.; Liang, Z.; Pang, S. Overview and Prospects of China Economic Seaweed Cultivation Technology. J. Agric. Sci. Technol. 2020, 22, 1–9. [Google Scholar] [CrossRef]
  52. Jiangsu Province’s “14th Five-Year” Marine Economic Development Plan. Available online: http://zrzy.jiangsu.gov.cn/gggs/2021/08/1310014567860.html (accessed on 8 May 2022).
  53. Hu, Z.M.; Shan, T.F.; Zhang, J.; Zhang, Q.S.; Critchley, A.T.; Choi, H.G.; Yotsukura, N.; Liu, F.L.; Duan, D.L. Kelp aquaculture in China: A retrospective and future prospects. Rev. Aquac. 2021, 13, 1324–1351. [Google Scholar] [CrossRef]
  54. Tens of Thousands of Acres of Seaweed Severely Damaged by Sea Ice. Available online: http://pic.people.com.cn/n1/2016/0125/c1016-28081828.html (accessed on 8 May 2022).
  55. Liu, J.; Xia, J.; Zhuang, M.; Zhang, J.; Sun, Y.; Tong, Y.; Zhao, S.; He, P. Golden seaweed tides accumulated in Pyropia aquaculture areas are becoming a normal phenomenon in the Yellow Sea of China. Sci. Total Environ. 2021, 774, 145726. [Google Scholar] [CrossRef]
  56. Detailed Explanation of Marine Disasters in Jiangsu in 2017: Golden Tide Landed on the Coast and Flooded. Available online: http://www.hycfw.com/Article/211801 (accessed on 8 May 2022).
  57. Notice on the Release of Provincial Subsidy Funds for the Prevention and Control of Prolifera Green Tide in 2021. Available online: http://czt.jiangsu.gov.cn/art/2021/8/17/art_77309_9977448.html (accessed on 8 May 2022).
  58. Gimpel, A.; Stelzenmüller, V.; Grote, B.; Buck, B.H.; Floeter, J.; Núñez-Riboni, I.; Pogoda, B.; Temming, A. A GIS modelling framework to evaluate marine spatial planning scenarios: Co-location of offshore wind farms and aquaculture in the German EEZ. Mar. Policy 2015, 55, 102–115. [Google Scholar] [CrossRef]
  59. Opinions of the General Office of the Jiangsu Provincial Government on Accelerating the Promotion of High-Quality Development of Fisheries. Available online: http://www.js.gov.cn/art/2020/6/17/art_64797_9217205.html (accessed on 18 November 2022).
  60. Hadi, A.A.; Wicaksono, P. Accuracy assessment of relative and absolute water column correction methods for benthic habitat mapping in Parang Island. In Proceedings of the International Conference on Smart and Innovative Agriculture, Yogyakarta, Indonesia, 4–5 November 2020. [Google Scholar]
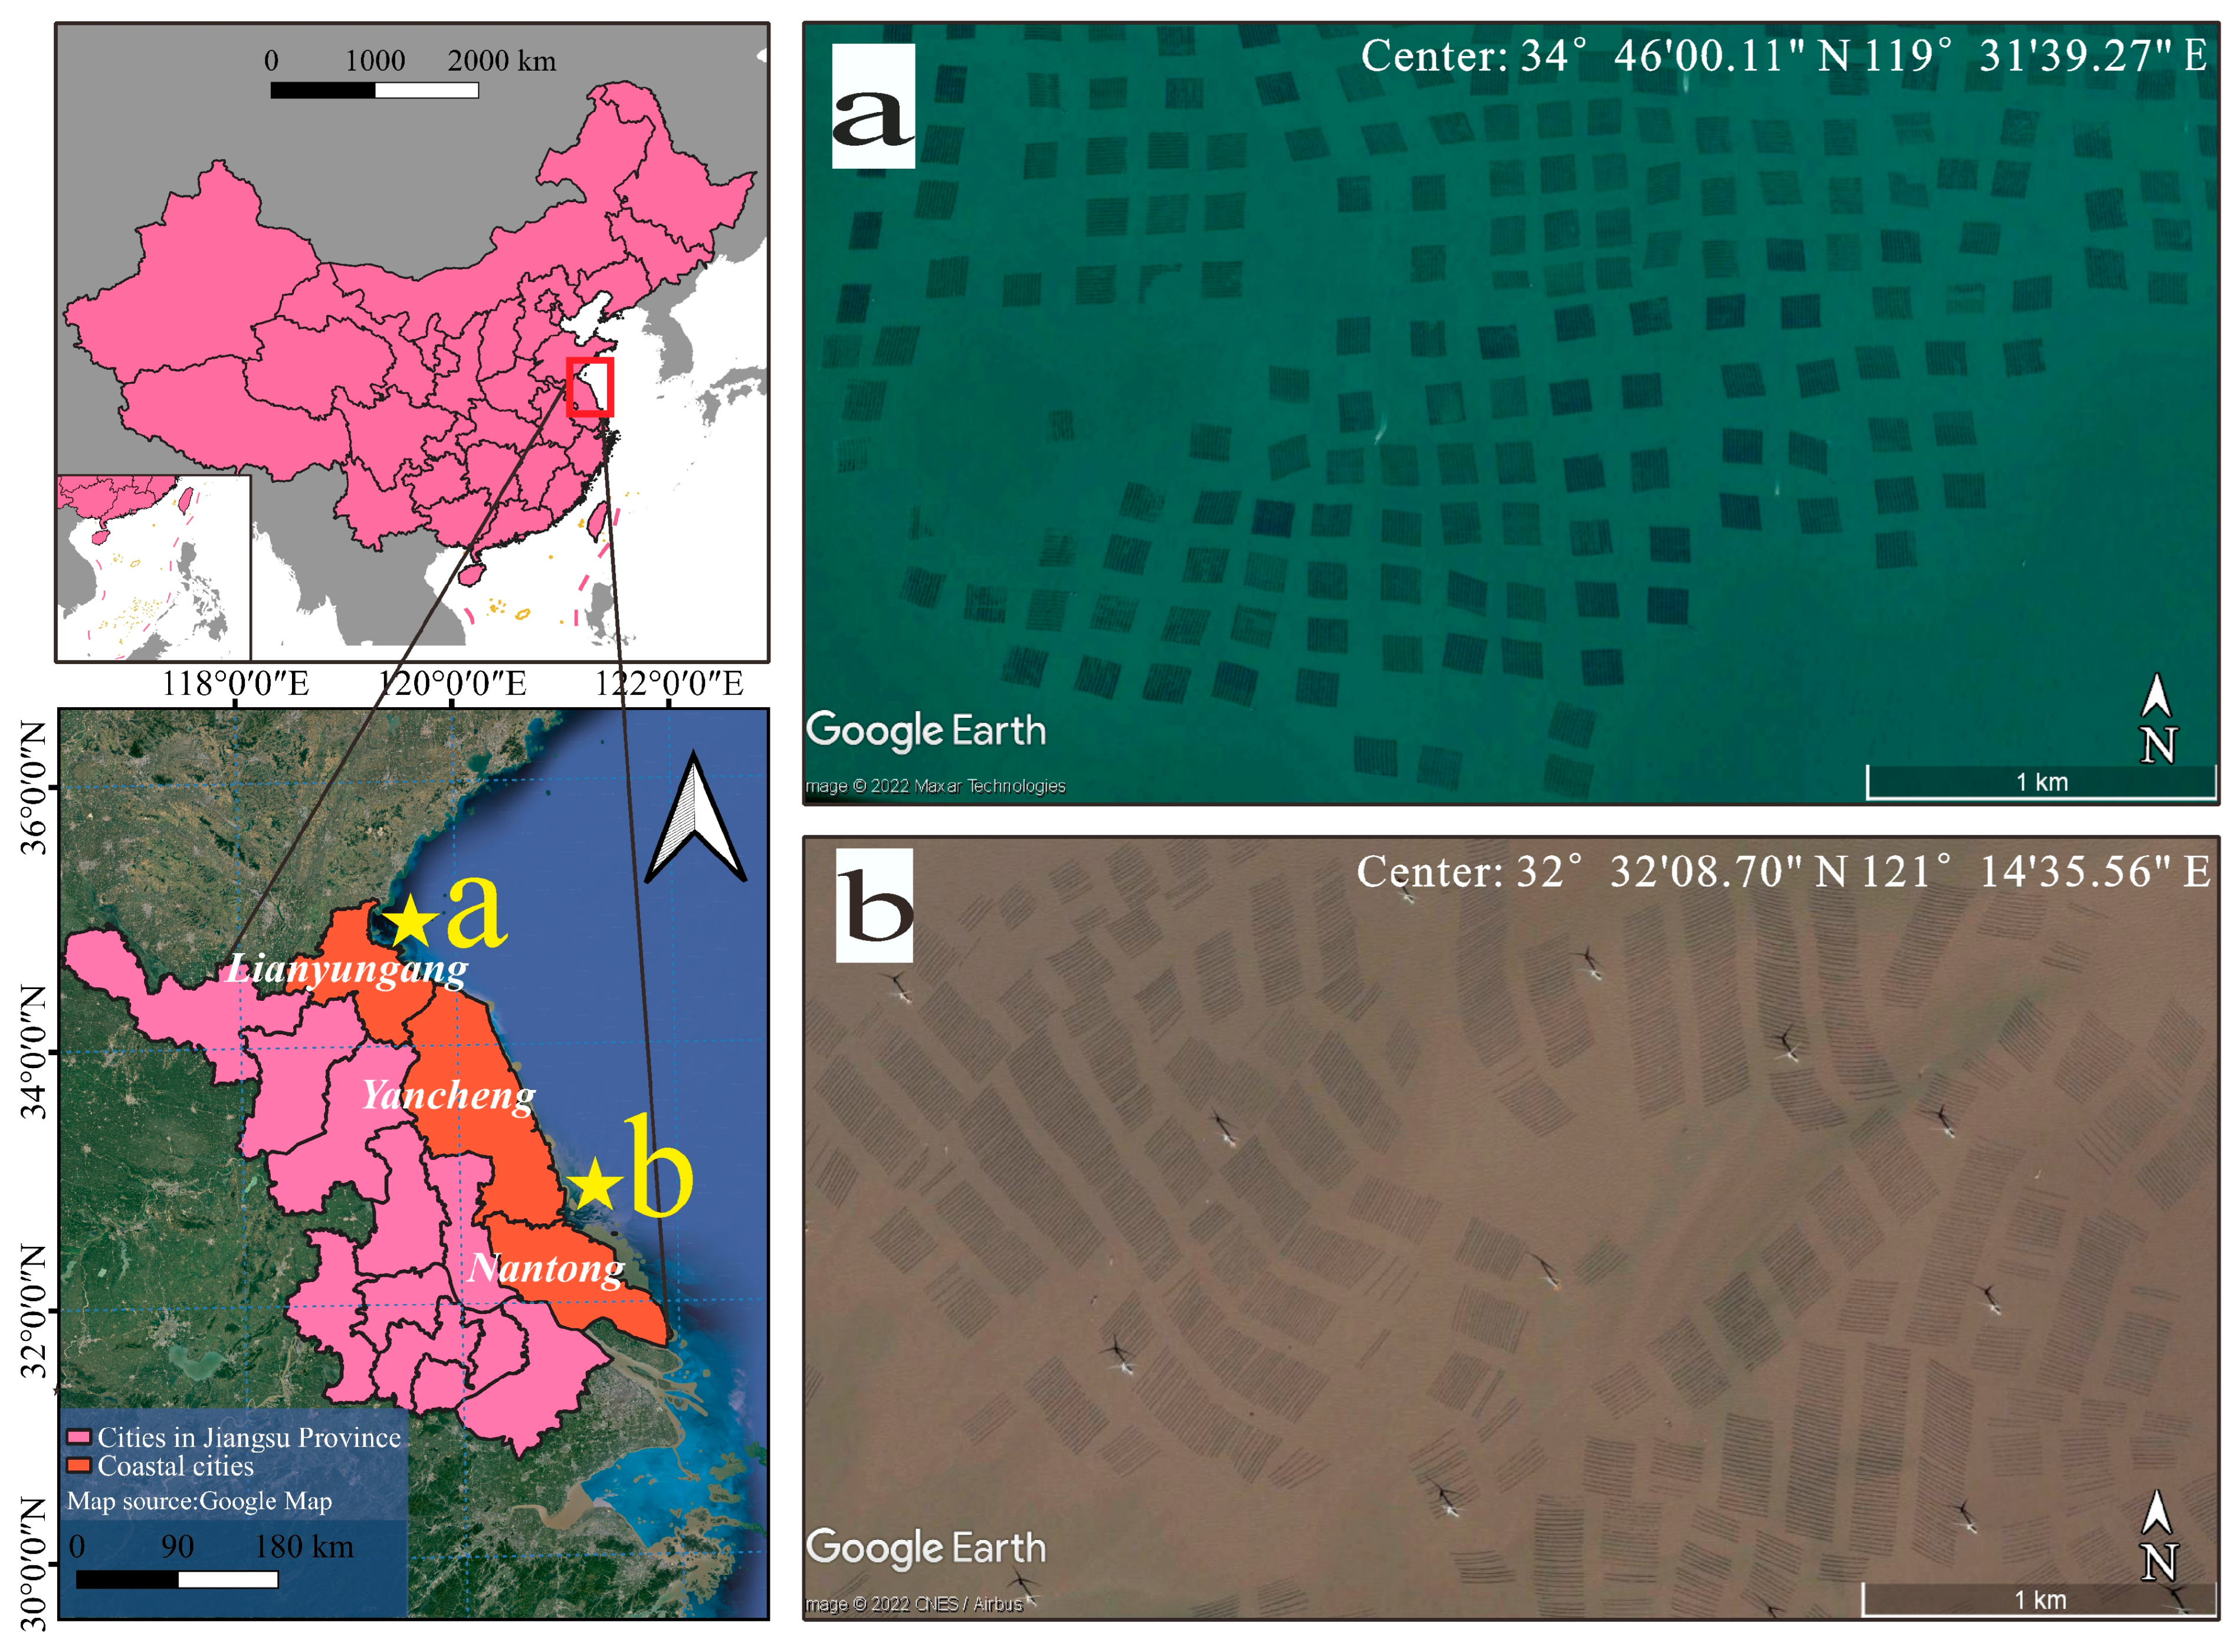
Figure 1. The scope of the study area (Left) and seaweed aquaculture on Google Earth Pro (Right, a,b).
Remotesensing 14 06202 g001
Figure 2. Spatial distribution of Sentinel-1/2 data: (a) total number of Sentinel-1 SAR images; (b) total number of Sentinel-2 optical images.
Remotesensing 14 06202 g002
Figure 3. Process flow for extracting seaweed aquaculture area.
Remotesensing 14 06202 g003
Figure 4. Spatial change of seaweed aquaculture (2016–2022) (a,b) and comparison of extraction results and statistical data of seaweed aquaculture and culturing raft from 2016 to 2022 (c) the data for 2021–2022 has not been announced yet.
Remotesensing 14 06202 g004
Figure 5. Spatiotemporal dynamics of seaweed aquaculture in mode-I (2016–2022).
Remotesensing 14 06202 g005
Figure 6. Spatiotemporal dynamics of seaweed aquaculture in mode-II (2016–2022).
Remotesensing 14 06202 g006
Figure 7. Spatial performance of policy restrictions (the reduction of the breeding scale of Mode-II is in the Yangkou Port waterway (a) and the east of the nature reserve (b); Mode-I’s reduction in breeding scale (c) and breeding density (d)).
Remotesensing 14 06202 g007
Figure 8. Diagram of different types of seaweed rafts (Stay-pole raft aquaculture in the shallow sea (Left), Semi-floating raft in the intertidal zone (Right)).
Remotesensing 14 06202 g008
Figure 9. Display of amplified extraction results and related pictures of seaweed aquaculture (square seaweed aquaculture (Mode-I, image source: http://jingzhou.cjyun.org/p/33094.html (accessed on 8 May 2022)) and strip-shaped seaweed aquaculture (Mode-II, photograph is from field surveys)).
Remotesensing 14 06202 g009
Figure 10. Distribution of unsustainable development of seaweed aquaculture ((a): Seaweed farming in prohibited/restricted breeding areas in 2022; (b,c): Scope of Mode-I and Mode-II distributed in prohibited/restricted breeding areas in 2016; (d,e): Scope of Mode-I and Mode-II distributed in prohibited/restricted breeding areas in 2022).
Remotesensing 14 06202 g010
Table 1. Various parameters of satellite sensors.
Satellite
Sensor
Format or LevelSpatial Resolution
(m)
Time Resolution
(Day)
Duration of This Study
(Year)
Sentinel-1 SARIW/Level-11062016–2022
Sentinel-2 MSIL1-C/L2-A1052016–2022
Table 2. Input feature set for the random forest algorithm for seaweed extraction.
Feature TypeFormulation/Band
SpectrumSentinel-2 (B1-B5, B8, B8A, B11, B12)
RadarSentinel-1 (VV + VH)
Water indices mNDWI = ( b G     b SWIR ) / ( b G + b SWIR )
SDWI = ln   ( 10   ×   VH   ×   VV )     8
Vegetation indices EVI = G   ×   ( b NIR     b R ) /   ( b NIR + C 1   ×   b R     C 2   ×   b B + L )
DVI = b NIR     b R
NDVI = ( b NIR     b R ) / ( b NIR + b R )
Soil index NDSI = ( b SWIR     b NIR ) / ( b SWIR + b NIR )
b + band name means the reflectance of the specific band. In the EVI formula, L is the canopy background adjustment parameter ( L = 1 ) and G is the gain factor ( G = 2.5 ). C 1 , C 2 are the coefficients of the aerosol resistance term ( C 1 = 6.0 ,   C 2 = 7.5 ), which are used to correct the aerosol influences on the red band through the blue band.
Table 3. Accuracy assessment.
Time/Breeding ModeMode-IMode-II
Overall Accuracy KappaOverall Accuracy Kappa
20160.950.900.940.89
20170.970.940.950.89
20180.960.920.980.96
20190.980.950.880.74
20200.930.860.950.90
20210.980.950.960.91
20220.970.940.960.92
Publisher’s Note: MDPI stays neutral with regard to jurisdictional claims in published maps and institutional affiliations.