
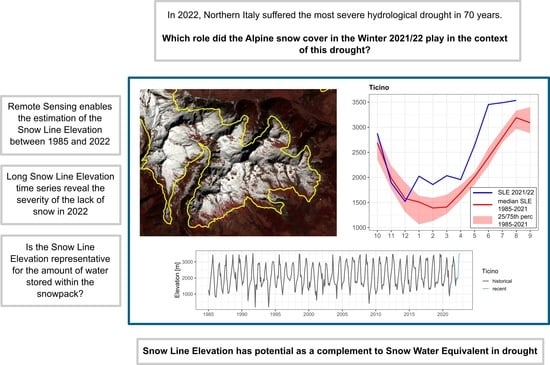
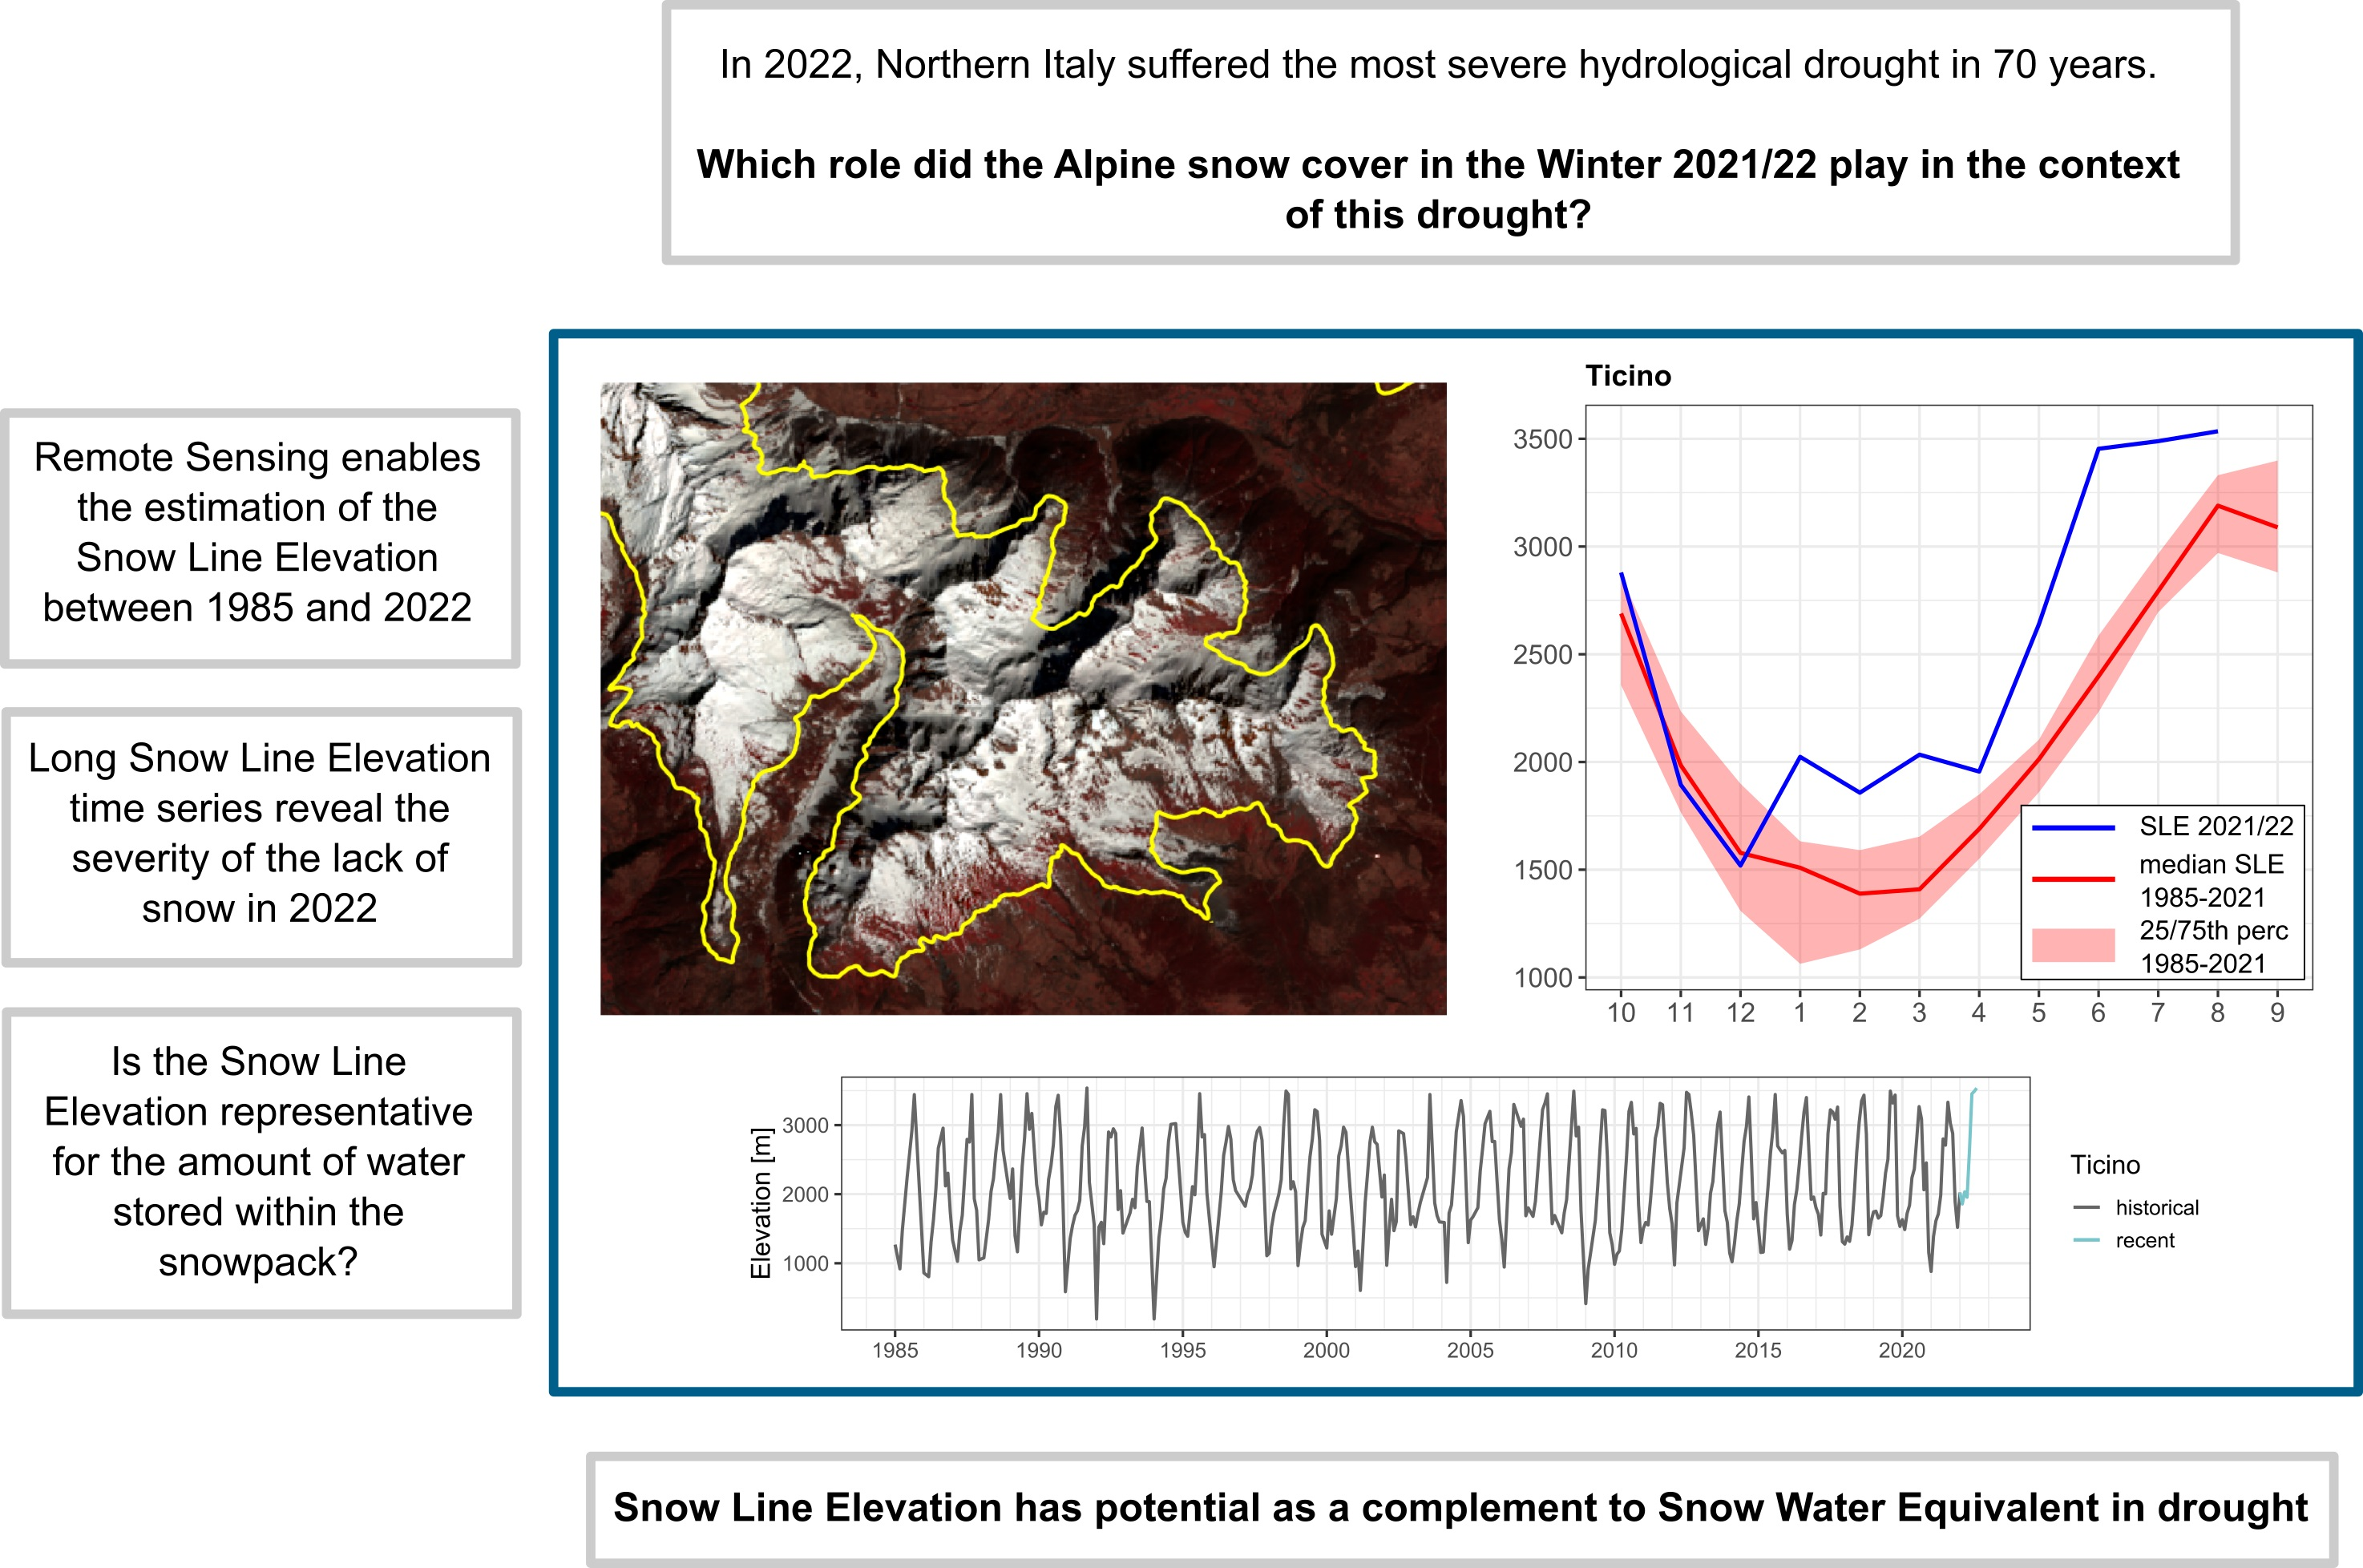
Drought in Northern Italy: Long Earth Observation Time Series Reveal Snow Line Elevation to Be Several Hundred Meters Above Long-Term Average in 2022

 ,
,  , , , , ,
  ,
,  and
and
Abstract
1. Introduction
2. Materials and Methods
3. Results
4. Discussion
5. Conclusions
Supplementary Materials
Author Contributions
Funding
Data Availability Statement
Acknowledgments
Conflicts of Interest
References
- Toreti, A.; Bavera, D.; Avanzi, F.; Cammalleri, C.; De Felice, M.; de Jager, A.; Di Ciollo, C.; Gabellani, S.; Maetens, W.; Magni, D.; et al. Drought in Northern Italy March 2022: GDO Analytical Report; Publications Office of the European Union: Luxembourg, 2022; ISBN 978-92-76-50158-9.
- Autorità di Bacino Distrettuale del Fiume Po. Osservatorio Permanente Sugli Utilizzi Idrici nel Distretto Idrografico del Fiume Po. Bollettino n. 04/2022. 2022. Available online: https://www.adbpo.it/wp-content/uploads/2022/03/Bollettino29Marzo22_Osservatorio-1.pdf (accessed on 11 November 2022).
- Mariani, S.; Lastoria, B.; Braca, G.; Bussettini, M.; Tropeano, R.; Piva, F. Nota ISPRA Sulle Condizioni Di Siccità in Corso e Sullo Stato Della Risorsa Idrica a Livello Nazionale. 2022. Available online: https://www.isprambiente.gov.it/files2022/notizie/nota_ispra-_siccita_dispon_idrica_luglio2022.pdf (accessed on 6 October 2022).
- Toreti, A.; Masante, D.; Acosta Navarro, J.; Bavera, D.; Cammalleri, C.; De Felice, M.; de Jager, A.; Di Ciollo, C.; Hrast Essenfelder, A.; Maetens, W.; et al. Drought in Europe July 2022: GDO Analytical Report; Publications Office of the European Union: Luxembourg, 2022; ISBN 978-92-76-54953-6.
- European Commission. Crop monitoring in Europe August 2022. In JRC MARS Bulletin; Publications Office of the European Union: Luxembourg, 2022; Volume 30. [Google Scholar] [CrossRef]
- Ranzi, R.; Rigon, R.; Toth, E. Alcune Considerazioni Della Società Idrologica Italiana Sulla Grave Siccità Dell’estate 2022. 2022. Available online: http://www.sii-ihs.it/files/allegatiFile/Riflessioni%20della%20SII%20sulla%20Siccita%CC%80%20del%202022_28sett_Finale.pdf (accessed on 6 October 2022).
- Toreti, A.; Bavera, D.; Acosta Navarro, J.; Cammalleri, C.; de Jager, A.; Di Ciollo, C.; Hrast Essenfelder, A.; Maetens, W.; Magni, D.; Masante, D.; et al. Drought in Europe August 2022: GDO Analytical Report; Publications Office of the European Union: Luxembourg, 2022; ISBN 978-92-76-55855-2.
- Massari, C.; Avanzi, F.; Bruno, G.; Gabellani, S.; Penna, D.; Camici, S. Evaporation Enhancement Drives the European Water-Budget Deficit during Multi-Year Droughts. Hydrol. Earth Syst. Sci. 2022, 26, 1527–1543. [Google Scholar] [CrossRef]
- Avanzi, F. Why the 2022 Italian Snow Drought Matters to You. 2022. Available online: https://blogs.egu.eu/divisions/cr/2022/09/16/why-the-2022-italian-snow-drought-matters-to-you/ (accessed on 6 October 2022).
- Immerzeel, W.W.; Lutz, A.F.; Andrade, M.; Bahl, A.; Biemans, H.; Bolch, T.; Hyde, S.; Brumby, S.; Davies, B.J.; Elmore, A.C.; et al. Importance and Vulnerability of the World’s Water Towers. Nature 2020, 577, 364–369. [Google Scholar] [CrossRef] [PubMed]
- Huning, L.S.; AghaKouchak, A. Global Snow Drought Hot Spots and Characteristics. Proc. Natl. Acad. Sci. USA 2020, 117, 19753–19759. [Google Scholar] [CrossRef] [PubMed]
- Hatchett, B.J.; Rhoades, A.M.; McEvoy, D.J. Monitoring the Daily Evolution and Extent of Snow Drought. Nat. Hazards Earth Syst. Sci. 2022, 22, 869–890. [Google Scholar] [CrossRef]
- Luojus, K.; Pulliainen, J.; Takala, M.; Lemmetyinen, J.; Mortimer, C.; Derksen, C.; Mudryk, L.; Moisander, M.; Hiltunen, M.; Smolander, T.; et al. GlobSnow v3.0 Northern Hemisphere Snow Water Equivalent Dataset. Sci. Data 2021, 8, 163. [Google Scholar] [CrossRef]
- Dietz, A.J.; Kuenzer, C.; Gessner, U.; Dech, S. Remote Sensing of Snow—A Review of Available Methods. Int. J. Remote Sens. 2012, 33, 4094–4134. [Google Scholar] [CrossRef]
- Belward, A.S.; Bourassa, M.; Dowell, M.; Briggs, S.; Dolman, H.; Holmlund, K.; Husband, R.; Quegan, S.; Saunders, R.; Simmons, A.; et al. The Global Observing System for Climate: Implementation Needs; World Meteorological Organization: Geneva, Switzerland, 2016; Available online: https://library.wmo.int/doc_num.php?explnum_id=3417 (accessed on 6 October 2022).
- Krajčí, P.; Holko, L.; Perdigão, R.A.P.; Parajka, J. Estimation of Regional Snowline Elevation (RSLE) from MODIS Images for Seasonally Snow Covered Mountain Basins. J. Hydrol. 2014, 519, 1769–1778. [Google Scholar] [CrossRef]
- Koehler, J.; Bauer, A.; Dietz, A.J.; Kuenzer, C. Towards Forecasting Future Snow Cover Dynamics in the European Alps—The Potential of Long Optical Remote-Sensing Time Series. Remote Sens. 2022, 14, 4461. [Google Scholar] [CrossRef]
- Hu, Z.; Dietz, A.; Zhao, A.; Uereyen, S.; Zhang, H.; Wang, M.; Mederer, P.; Kuenzer, C. Snow Moving to Higher Elevations: Analyzing Three Decades of Snowline Dynamics in the Alps. Geophys. Res. Lett. 2020, 47, e2019GL085742. [Google Scholar] [CrossRef]
- Hu, Z.; Dietz, A.J.; Kuenzer, C. Deriving Regional Snow Line Dynamics during the Ablation Seasons 1984–2018 in European Mountains. Remote Sens. 2019, 11, 933. [Google Scholar] [CrossRef]
- Hu, Z.; Dietz, A.; Kuenzer, C. The Potential of Retrieving Snow Line Dynamics from Landsat during the End of the Ablation Seasons between 1982 and 2017 in European Mountains. Int. J. Appl. Earth Obs. Geoinf. 2019, 78, 138–148. [Google Scholar] [CrossRef]
- Earth Resources Observation and Science (EROS) Center Collection-2 Landsat 8-9 OLI (Operational Land Imager) and TIRS (Thermal Infrared Sensor) Level-2 Science Products. 2013. Available online: https://www.usgs.gov/centers/eros/science/usgs-eros-archive-landsat-archives-landsat-8-9-olitirs-collection-2-level-2 (accessed on 11 November 2022).
- Earth Resources Observation and Science (EROS) Center Collection-2 Landsat 7 Enhanced Thematic Mapper Plus (ETM+) Level-2 Science Products. 1999. Available online: https://www.usgs.gov/centers/eros/science/usgs-eros-archive-landsat-archives-landsat-7-etm-plus-collection-2-level-2 (accessed on 11 November 2022).
- Earth Resources Observation And Science (EROS) Center Collection-2 Landsat 4-5 Thematic Mapper (TM) Level-2 ScienceProducts. 2020. Available online: https://www.usgs.gov/centers/eros/science/usgs-eros-archive-landsat-archives-landsat-4-5-tm-collection-2-level-2-science (accessed on 11 November 2022).
- Ripper, E.; Schwaizer, G.; Nagler, T.; Metsämäki, S.; Törmä, M.; Fernandes, R.; Crawford, C.J.; Painter, T.H.; Rittger, K. Guidelines for the Generation of Snow Extent Products from High Resolution Optical Sensors. 2019. Available online: https://snowpex.enveo.at/doc/D08_Guidelines_for_the_generation_of_snow_extent_products_from_HR_optical_sensors_FINAL_v2.1.pdf (accessed on 4 October 2022).
- Klein, A.G.; Hall, D.K.; Riggs, G.A. Improving Snow Cover Mapping in Forests through the Use of a Canopy Reflectance Model. Hydrol. Process. 1998, 12, 1723–1744. [Google Scholar] [CrossRef]
- Poon, S.K.M.; Valeo, C. Investigation of the MODIS Snow Mapping Algorithm during Snowmelt in the Northern Boreal Forest of Canada. Can. J. Remote Sens. 2006, 32, 254–267. [Google Scholar] [CrossRef]
- Metsämäki, S.; Pulliainen, J.; Salminen, M.; Luojus, K.; Wiesmann, A.; Solberg, R.; Böttcher, K.; Hiltunen, M.; Ripper, E. Introduction to GlobSnow Snow Extent Products with Considerations for Accuracy Assessment. Remote Sens. Environ. 2015, 156, 96–108. [Google Scholar] [CrossRef]
- ESA Copernicus DEM—Global and European Digital Elevation Model (COP-DEM). Available online: https://spacedata.copernicus.eu/web/cscda/dataset-details?articleId=394198 (accessed on 11 November 2022).
- Lehner, B.; Grill, G. Global River Hydrography and Network Routing: Baseline Data and New Approaches to Study the World’s Large River Systems: Global River Hydrography and Network Routing. Hydrol. Process. 2013, 27, 2171–2186. [Google Scholar] [CrossRef]
- Alpine Convention Perimeter of the Alpine Convention. 2020. Available online: https://www.atlas.alpconv.org/layers/geonode_data:geonode:Alpine_Convention_Perimeter_2018_v2 (accessed on 11 November 2022).
- Python. Available online: https://www.python.org/ (accessed on 11 November 2022).
- R Core Team. R: A Language and Environment for Statistical Computing; R Foundation for Statistical Computing: Vienna, Austria, 2022. [Google Scholar]
- EUMETSAT SWE-E (H13). Snow Water Equivalent by MW Radiometry. Available online: https://hsaf.meteoam.it/Products/Detail?prod=H13 (accessed on 11 November 2022).
- Matiu, M.; Hanzer, F. Bias Adjustment and Downscaling of Snow Cover Fraction Projections from Regional Climate Models Using Remote Sensing for the European Alps. Hydrol. Earth Syst. Sci. 2022, 26, 3037–3054. [Google Scholar] [CrossRef]
- Endrizzi, S.; Gruber, S.; Dall’Amico, M.; Rigon, R. GEOtop 2.0: Simulating the Combined Energy and Water Balance at and below the Land Surface Accounting for Soil Freezing, Snow Cover and Terrain Effects. Geosci. Model Dev. 2014, 7, 2831–2857. [Google Scholar] [CrossRef]
- Engel, M.; Notarnicola, C.; Endrizzi, S.; Bertoldi, G. Snow Model Sensitivity Analysis to Understand Spatial and Temporal Snow Dynamics in a High-Elevation Catchment. Hydrol. Process. 2017, 31, 4151–4168. [Google Scholar] [CrossRef]
- Lievens, H.; Brangers, I.; Marshall, H.-P.; Jonas, T.; Olefs, M.; De Lannoy, G. Sentinel-1 Snow Depth Retrieval at Sub-Kilometer Resolution over the European Alps. Cryosphere 2022, 16, 159–177. [Google Scholar] [CrossRef]
- Bongio, M.; Arslan, A.N.; Tanis, C.M.; De Michele, C. Snow Depth Time Series Retrieval by Time-Lapse Photography: Finnish and Italian Case Studies. Cryosphere 2021, 15, 369–387. [Google Scholar] [CrossRef]
- Slovenian Environment Agency; Central Institution for Meteorology and Geodynamics. Standardised Snow Pack Index—ERA5_QM SSPI-30 (Version 1.0); EURAC: Bolzano, Italy, 2022. [CrossRef]
- Olefs, M.; Koch, R.; Schöner, W.; Marke, T. Changes in Snow Depth, Snow Cover Duration, and Potential Snowmaking Conditions in Austria, 1961–2020—A Model Based Approach. Atmosphere 2020, 11, 1330. [Google Scholar] [CrossRef]
- Hock, R.; Rasul, G.; Adler, C.; Cáceres, B.; Gruber, S.; Hirabayashi, Y.; Jackson, M.; Kääb, A.; Kang, S.; Kutuzov, S.; et al. High Mountain Areas. In IPCC Special Report on the Ocean and Cryosphere in a Changing Climate; Pörtner, H.-O., Roberts, D.C., Masson-Delmotte, V., Zhai, P., Tignor, M., Poloczanska, E., Mintenbeck, K., Alegría, A., Nicolai, M., Okem, A., Eds.; Cambridge University Press: Cambridge, UK; New York, NY, USA, 2019. [Google Scholar]


| Catchment | January 2022 | February 2022 | March 2022 | April 2022 |
|---|---|---|---|---|
| Maira | +609 | +690 | +509 | +186 |
| Dora Baltea | +616 | +555 | +489 | +116 |
| Sesia | +703 | +794 | +802 | +168 |
| Ticino | +515 | +469 | +625 | +267 |
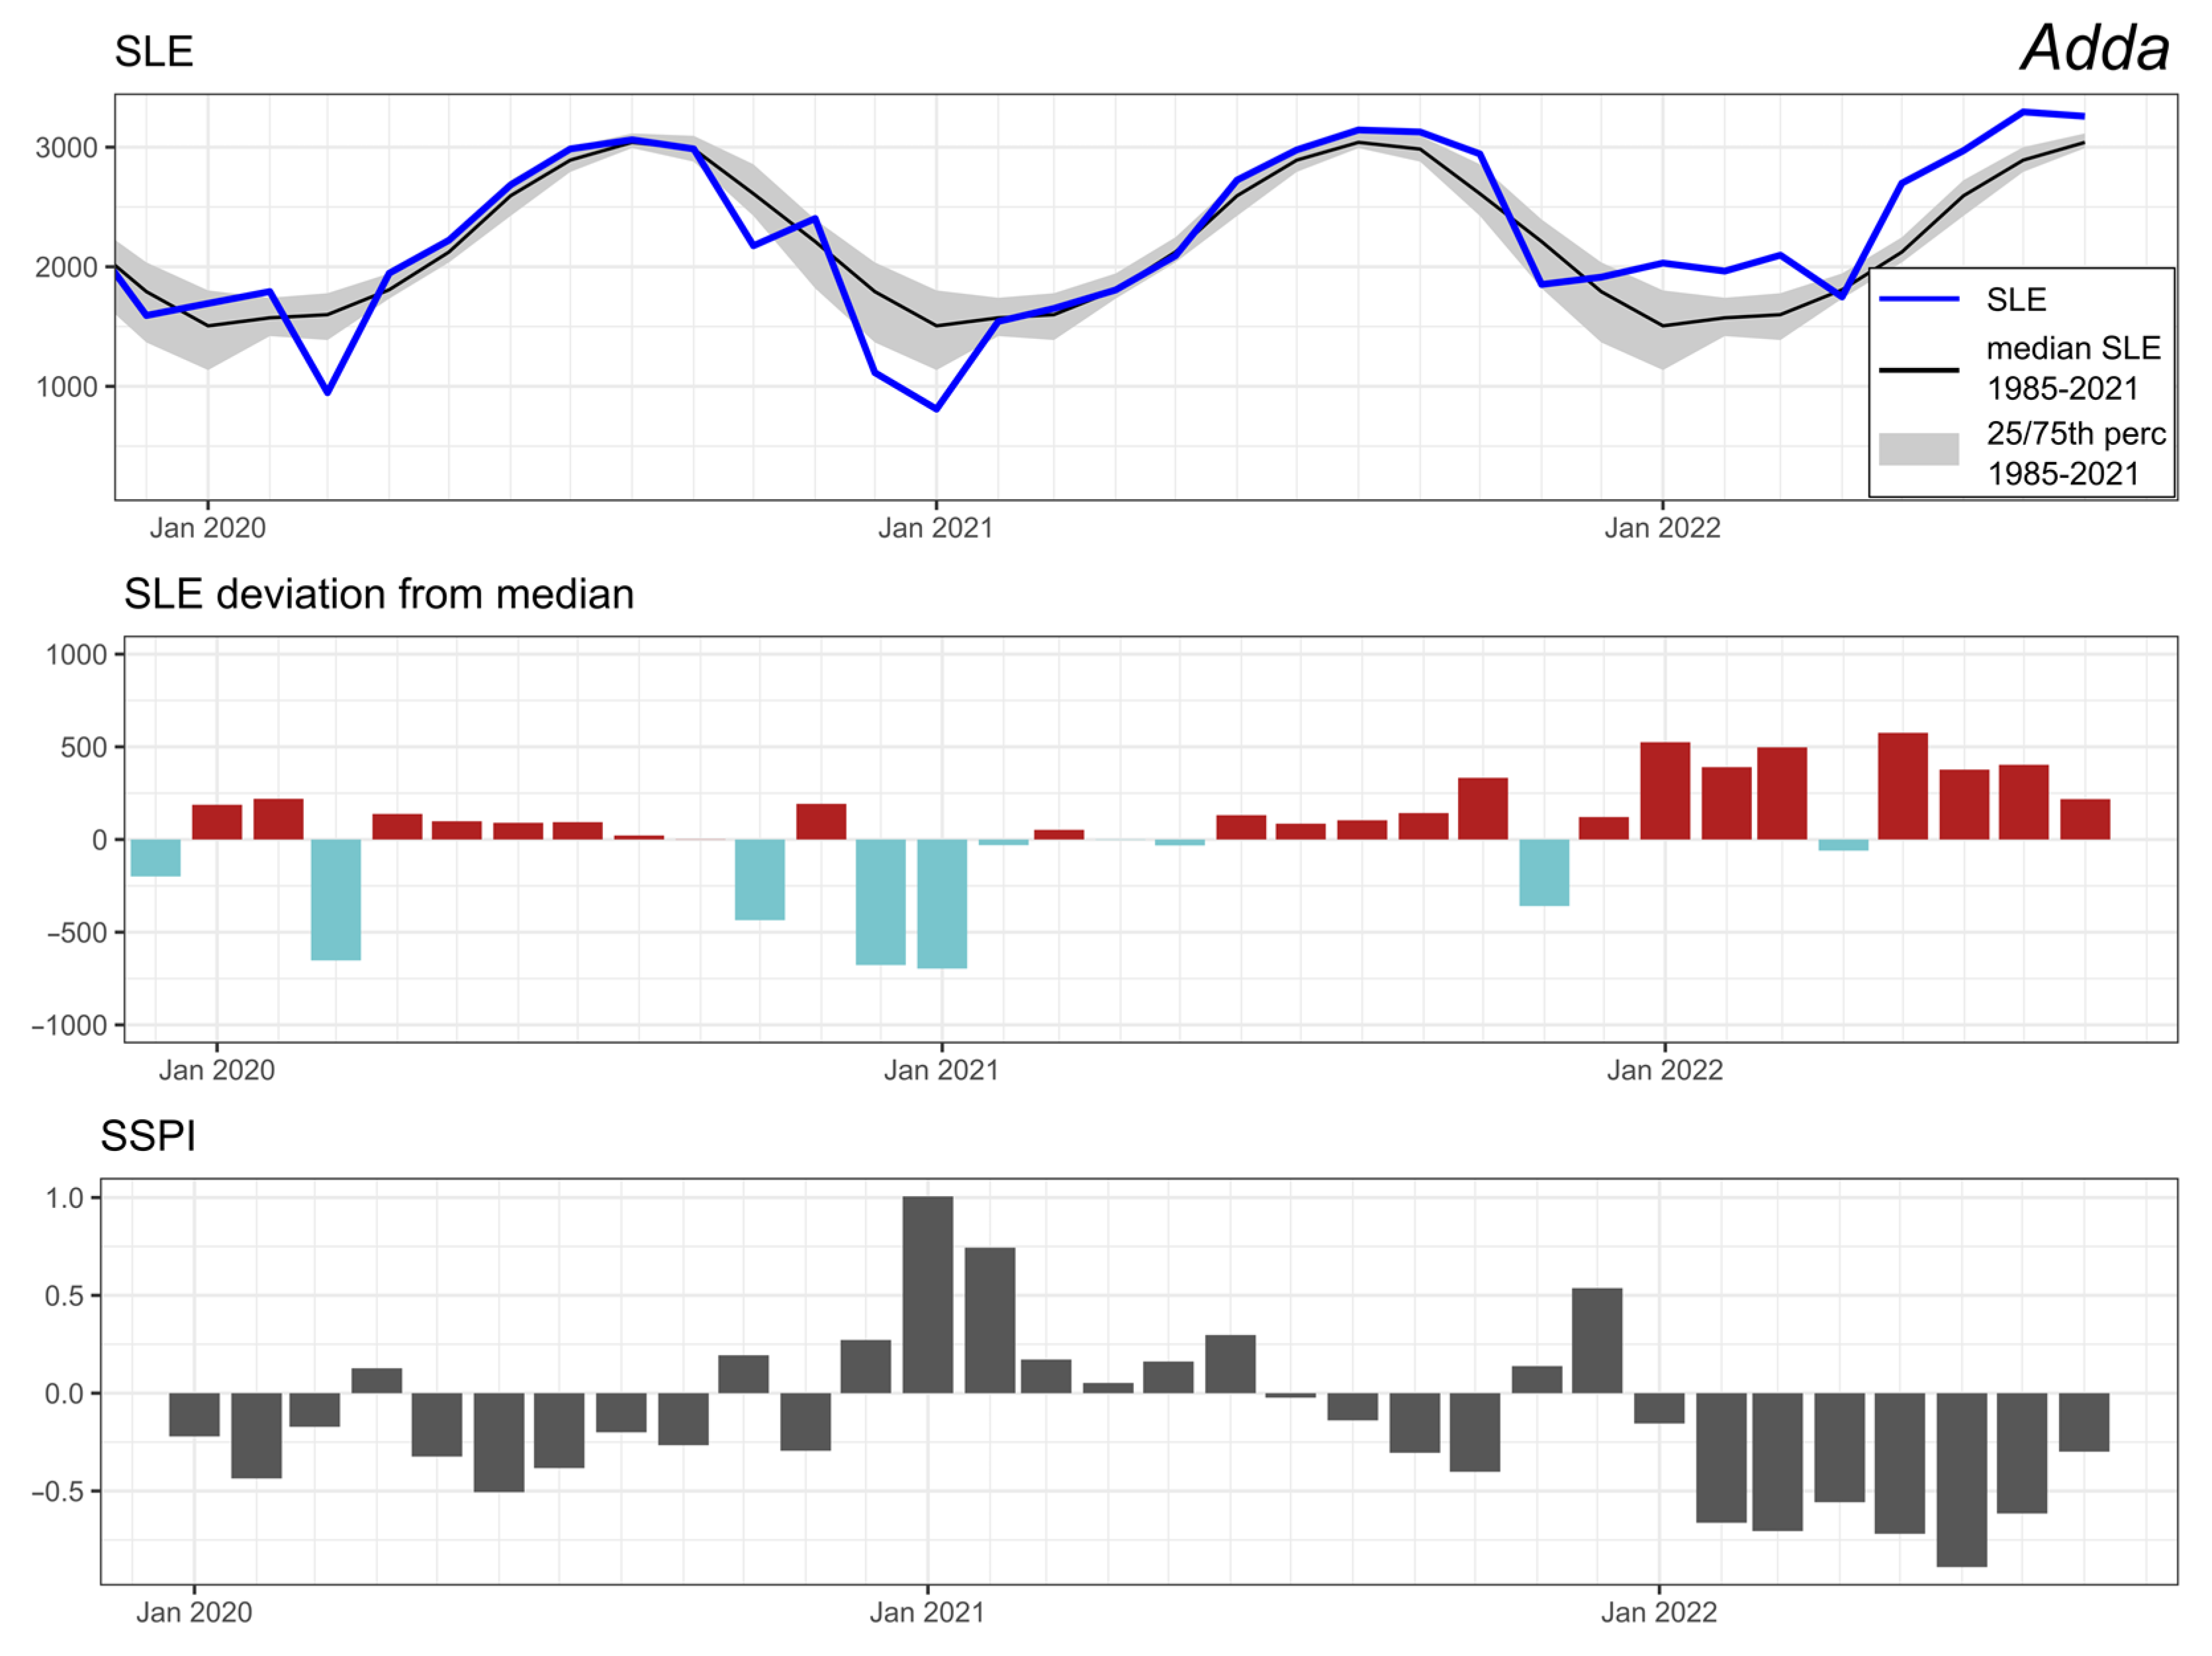
| Adda | +546 | +395 | +508 | −62 |
| Oglio | +372 | +35 | +462 | −42 |
| Mincio | +337 | +96 | +477 | −71 |
| Adige | +393 | +46 | +475 | −102 |
| Brenta | +199 | +151 | +357 | +216 |
| Catchment | January | February | March 2022 | April 2022 | ||||||||
|---|---|---|---|---|---|---|---|---|---|---|---|---|
| Exp. FSC | FSC 2022 | Difference | Exp. FSC | FSC 2022 | Difference | Exp. FSC | FSC 2022 | Difference | Exp. FSC | FSC 2022 | Difference | |
| Maira | 48% | 24% | −50% | 48% | 21% | −57% | 37% | 17% | −54% | 34% | 26% | −22% |
| Dora Baltea | 79% | 55% | −31% | 78% | 56% | −28% | 72% | 50% | −31% | 64% | 58% | −8% |
| Sesia | 30% | 8% | −74% | 32% | 7% | −79% | 27% | 5% | −83% | 19% | 14% | −28% |
| Ticino | 43% | 21% | −50% | 48% | 28% | −41% | 47% | 21% | −56% | 35% | 24% | −32% |
| Adda | 49% | 28% | −43% | 46% | 30% | −34% | 45% | 25% | −44% | 37% | 39% | +6% |
| Oglio | 34% | 20% | −41% | 33% | 31% | −4% | 35% | 17% | −50% | 25% | 27% | +6% |
| Mincio | 29% | 18% | −39% | 28% | 25% | −12% | 28% | 14% | −51% | 21% | 23% | +12% |
| Adige | 59% | 39% | −33% | 56% | 54% | −4% | 54% | 31% | −43% | 38% | 43% | +13% |
| Brenta | 22% | 13% | −40% | 25% | 17% | −30% | 24% | 9% | −61% | 16% | 9% | −45% |
Publisher’s Note: MDPI stays neutral with regard to jurisdictional claims in published maps and institutional affiliations. |
© 2022 by the authors. Licensee MDPI, Basel, Switzerland. This article is an open access article distributed under the terms and conditions of the Creative Commons Attribution (CC BY) license (https://creativecommons.org/licenses/by/4.0/).
Share and Cite
Koehler, J.; Dietz, A.J.; Zellner, P.; Baumhoer, C.A.; Dirscherl, M.; Cattani, L.; Vlahović, Ž.; Alasawedah, M.H.; Mayer, K.; Haslinger, K.; et al. Drought in Northern Italy: Long Earth Observation Time Series Reveal Snow Line Elevation to Be Several Hundred Meters Above Long-Term Average in 2022. Remote Sens. 2022, 14, 6091. https://doi.org/10.3390/rs14236091
Koehler J, Dietz AJ, Zellner P, Baumhoer CA, Dirscherl M, Cattani L, Vlahović Ž, Alasawedah MH, Mayer K, Haslinger K, et al. Drought in Northern Italy: Long Earth Observation Time Series Reveal Snow Line Elevation to Be Several Hundred Meters Above Long-Term Average in 2022. Remote Sensing. 2022; 14(23):6091. https://doi.org/10.3390/rs14236091
Chicago/Turabian StyleKoehler, Jonas, Andreas J. Dietz, Peter Zellner, Celia A. Baumhoer, Mariel Dirscherl, Luca Cattani, Živa Vlahović, Mohammad Hussein Alasawedah, Konrad Mayer, Klaus Haslinger, and et al. 2022. "Drought in Northern Italy: Long Earth Observation Time Series Reveal Snow Line Elevation to Be Several Hundred Meters Above Long-Term Average in 2022" Remote Sensing 14, no. 23: 6091. https://doi.org/10.3390/rs14236091
APA StyleKoehler, J., Dietz, A. J., Zellner, P., Baumhoer, C. A., Dirscherl, M., Cattani, L., Vlahović, Ž., Alasawedah, M. H., Mayer, K., Haslinger, K., Bertoldi, G., Jacob, A., & Kuenzer, C. (2022). Drought in Northern Italy: Long Earth Observation Time Series Reveal Snow Line Elevation to Be Several Hundred Meters Above Long-Term Average in 2022. Remote Sensing, 14(23), 6091. https://doi.org/10.3390/rs14236091