Abstract
Ionospheric scintillation is one of the main error sources of Global Navigation Satellite System (GNSS) positioning. The presence of scintillation may result in cycle slips, measurement errors or even losses of lock on satellites, eventually leading to complete failure of positioning. Typically, scintillation parameters S4 and σϕ are used to characterize amplitude and phase scintillation, respectively. However, the scintillation parameters can only be generated from data with a frequency of at least 1 Hz. Rate of change of total electron content index (ROTI) is often used as a proxy for scintillation parameters, which can be obtained from 1/30 Hz data. However, previous research has shown the inefficiency of ROTI to represent scintillation. Therefore, the multipath parameter (MP) has been proposed as another proxy for scintillation parameters, which can also be obtained from 1/30 Hz data. In this paper, both MP and ROTI (standard parameters) were used to mitigate scintillation effects on precise point positioning (PPP). To evaluate the effectiveness of MP and ROTI in mitigating scintillation effects, S4 and σϕ were also used for comparison and validation. Three strategies are proposed: (1) remove all observations from the satellite that is most affected by scintillation; (2) remove the scintillation-affected observations; (3) weight the measurement noise matrix in the Kalman Filter (KF) process. The results show that the observation removal and weighting strategies are considerably more effective than the satellite removal strategy. The results also show that the improvement of PPP outputs reaches 93.1% and the performance of standard parameters is comparable to that of scintillation parameters in the observation removal and weighting strategies.
1. Introduction
Ionospheric scintillation can lead to a variety of effects on the Global Navigation Satellite System (GNSS), including cycle slips, measurement errors and even loss of lock on satellites, which reduces the number of available satellites tracked by GNSS receivers. The geomagnetic storm is one of the main causes of scintillation [1,2]. According to Luo et al. [3], more than 70% of cycle slips were caused by strong scintillation. Furthermore, the phase lock loop (PLL) cannot recover after a long time period of cycle slips under strong scintillation, which leads the baseband signal power to decrease by more than 13 dB [4]. Thus, the PLL frequency is further detuned and as a consequence the signal is completely lost. Even worse, such conditions cannot be avoided under strong scintillation, even when using high-grade GNSS receivers. Therefore, the satellite geometry is degraded or the positioning may even fail due to having fewer than four satellites in view. Thus, mitigation of the ionospheric scintillation effects is important, especially in equatorial and auroral areas.
A variety of methods have been proposed to mitigate the effect of scintillation on GNSS positioning. The effect of scintillation can be mitigated effectively using these methods. However, most of these methods employed scintillation parameters S4 and σϕ, which are respectively used to characterize amplitude and phase scintillation [5]. Aquino et al. [6] modelled the tracking error variance of GNSS receiver delay locked loop (DLL), based on Conker et al. [7]. The variances were used to weight the pseudorange measurements in the least squares stochastic (LSS) model and the root mean square (RMS) of height was improved by up to 21%. Furthermore, the tracking error variance of the PLL was also applied to weight the carrier phase measurements in the LSS model, where the improvement of height RMS increased to 38% [8]. However, the Conker model is invalid when S4 (L1) exceeds 0.707. Additionally, it is not easy to obtain the spectral strength and slope required for computing the tracking error variance component relevant to the phase scintillation, especially for high frequency signals. Thus, a modified version of the Conker model, named the Conker’ model was proposed, where S4’ is derived instead of S4 [9]. In the Conker’ model, the normalization of the signal-to-noise ratio (SNR) was implemented at each second in S4’ instead of each minute in S4 [9]. Using the Conker’ model, the positioning performance can be substantially improved under strong scintillation. In addition, Sreeja et al. [10] applied the α-μ model [11] instead of the Conker model to calculate the tracking error variances of the DLL and PLL; adjustment to the weights of the LSS model improved the 3D RMS by 62–75%. Moreover, Bougard et al. [12] managed to detect and exclude scintillation affected satellites during the positioning process, using a technique called receiver autonomous integrity monitoring (RAIM) which substantially improved the resilience of precise point positioning (PPP) to scintillation. Even with these methods, loss of signal lock and cycle slips are still the primary problems under scintillation, which can be severe when using a single satellite constellation. Therefore, it was proposed that the data of GPS and GLONASS could be integrated to obtain more reliable positioning solutions under moderate to strong scintillation [13]. This improved the RMS by 63% in height and 57% in 3D compared to using GPS alone. By applying an integrated novel adaptive architecture named MF-On-ARKF, the RMS error (RMSE) of the light of sight (LOS) phase considerably decreased under both single- and multi-frequency conditions, which improved the synchronization performance [14].
Scintillation parameters can be generated from data with a frequency of at least 1 Hz [15,16,17,18]. Thus, scintillation parameters can be obtained from standard geodetic receivers. However, 1 Hz data is substantially less available than 1/30 Hz data [19]. The 1/30 Hz data can be acquired from around 500 stations daily, while 1 Hz data can be acquired from less than 170 stations each day. Furthermore, the International GNSS Service (IGS) started to provide 1/30 Hz and 1 Hz data in 1991 and 2001, respectively. In addition, the file size of 1/30 Hz data is substantially smaller than that of 1 Hz data. Therefore, the ability to use 1/30 Hz data for scintillation research opens opportunities by using archived data for more detailed studies of past scintillation events.
The rate of change of total electron content index (ROTI) has been used to show the presence of scintillation instead of the scintillation parameters used in past research [20,21,22,23,24]. In addition, multipath parameter (MP) also has the ability to show a part of scintillation events [20,25,26]. Both ROTI and MP (standard parameters) can be generated using 1/30 Hz. Based on MP and ROTI, we propose three strategies for improving the positioning quality of PPP:
- remove the satellite with the largest MP or ROTI value;
- remove observations where MP or ROTI values exceed a threshold;
- weight the measurement noise matrix of the Kalman Filter (KF) using MP or ROTI values.
To evaluate the effectiveness of MP and ROTI, the S4 and σϕ values were also utilized in the three strategies for comparison and validation.
2. Materials and Methods
2.1. Data and Instrumentation
Data for 75 days were collected from three stations (15, 30 and 30 days from SNA0P, SAO0P and SJCU stations, respectively). SNA0P (2.84°W, 71.67°S) is located in Antarctica, SAO0P (46.65°W, 23.55°S) and SJCU (45.96°W, 23.21°S) are located in Sao Paulo, Brazil. The receiver type at SNA0P and SJCU stations is Septentrio PolaRxS 2.9.0 and that at SAO0P station is Septentrio PolaRxS 2.9.6. Data from 14 days (7, 3 and 4 days from SNA0P, SAO0P and SJCU stations, respectively) with scintillation were used for the PPP improvement experiments, where scintillation events were identified using the methods presented in Li et al. [27]. The 14 days are: 7 September 2017, 8 September 2017, 13 September 2017 (SAO0P station); 4 September 2017, 7 September 2017, 8 September 2017, 13 September 2017 (SJCU station) and 18 February 2016, 2 April 2016, 13 April 2016, 9 May 2016, 6 June 2016, 28 July 2016, 13 October 2016 (SNA0P station).
One day data without scintillation was used to estimate the convergence time of the PPP software for each station. The scintillation-free data on 29 May 2016 at SNA0P, 1 September 2017 at SAO0P and 1 September 2017 at SJCU were selected (see Section 3.1.1). MP and ROTI were respectively derived from the 1/60 Hz and 1/30 Hz data, while S4 and σϕ at 1 min interval were generated from the 50 Hz data.
Data from all 75 days were used to generate the mild threshold (MT) and extreme threshold (ET) that were used to define outliers for the observation removal strategy. This approach is explained in detail by Li et al. [27] and is summarized below, where MT and ET are defined as:
where and are the upper (3) and lower (1) quartiles for height or 3D positioning errors. is mild threshold and is extreme threshold.
2.2. Software
PPPH is a freely available MATLAB-based software developed by Bahadur and Nohutcu [28]. It has also been validated by Bahadur and Nohutcu [28] that the behavior of PPPH is comparable to that of another PPP software namely GPS Analysis and Positioning Software (GAPS-http://gaps.gge.unb.ca/ (accessed on 20 October 2021)). In PPPH, Hatch–Melbourne–Wübbena and geometry-free combinations are used to detect and fix cycle slips. The ionosphere-free (IF) combination is applied to mitigate first-order ionospheric error on GNSS. Furthermore, the dry part of the tropospheric error is mitigated by the Saastamoinen model and the wet part is evaluated using random walk process. In addition, antenna phase center offsets (PCOs) of GPS and GLONASS satellites are corrected using the values from the IGS absolute antenna model while those of Galileo and BeiDou satellites are corrected using the conventional PCO values. For the ambiguity, it is estimated as floating numbers in the unknown parameters in KF. Thus, the ambiguity mainly affects the accuracy of measurements during the convergence period. Considering that the code of PPPH is freely available and open to user’s preferences at all processing steps, we used PPPH to modify the positioning algorithm and obtain the PPP results. We used MATLAB version 2018a (Mathworks® China, https://ww2.mathworks.cn/en/products/matlab.html, accessed 28 November 2022) to run PPPH and to edit the code.
2.3. ROTI
ROTI was defined by Pi et al. [29] to evaluate the occurrence of scintillation in the ionosphere. ROTI is estimated at the sampling rate of 1/30 Hz and a time interval of 5 min, as originally defined by Pi et al. [29]. Additionally, a moving average is applied in the ROTI calculation so that its time interval is consistent with other parameters.
2.4. MP
Multipath is a type of interference to GNSS receivers which is caused by reflected signals. MP1 and MP2 are parameters defined by Estey and Meertens [30] to quantify the multipath effect. In this study, MP1 and MP2 are generated using the quality control (QC) command of the TEQC software on the Receiver Independent Exchange Format (RINEX) version 2.11 files from the SAO0P station, including both observation and navigation files [31].
2.5. KF
KF as the core algorithm during the GNSS positioning process is used to increase the accuracy of positioning by integrating more measurements. There are two major procedures in KF, prediction and update, which iterate for all the measurements [32]. Figure 1 shows the flowchart on how to apply KF step by step.
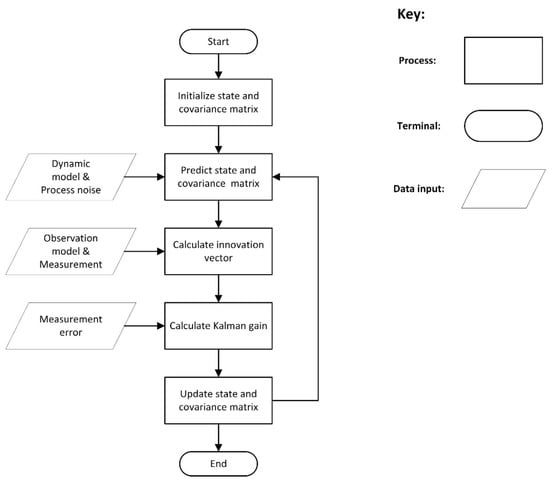
Figure 1.
Flowchart of KF.
As shown in Figure 1, the state and covariance matrix were initialized first, where the covariance matrix is the estimation of state error. Then, following inputting of the dynamic model and process noise, the state and covariance matrices were predicted based on the initialized values or the values updated at the previous epoch. After that, the innovation vector was calculated as the difference between the input values and values generated from the previous epoch. Next, the Kalman gain was obtained by introducing the measurement error. Afterwards, the state and covariance matrix were updated using the Kalman gain as the weight of the innovation vector. The output was used to predict the state and covariance matrix for next iteration until all the measurements were processed. Further details of the Kalman Filter approach are provided in the electronic supporting material.
2.6. Methodology
Before conducting the experiments on scintillation mitigation, the convergence time of PPPH was estimated. Typically, a day without scintillation is used to evaluate the convergence time [33]. Thus, the data on 1 September 2017 at SAO0P station, 1 September 2017 at SJCU station and 29 May 2016 at SNA0P station was used for this purpose. The convergence was defined by An et al. [33] as the positioning accuracy reaching a specific tolerance, which typically refers to 0.1 m for the Up component. Thus, this defintion of convergence was applied in this paper. Figure 2 shows the flowchart of the method used to mitigate scintillation effects. First, the data on the scintillation day was input, where the scintillation days could be determined with the method introduced by Li et al. [27]. All the data was applied with an elevation mask of 10°. Then, the first strategy was conducted, where the satellite with the maximum value of each reference parameter was removed. As there were five parameters (MP1, MP2, ROTI, S4 and σϕ), this step was repeated five times in order to compare the effectiveness of different parameters. It shoud be noted that values of S4 are not high in the Antarctica station SNA0P, which is typical at high latitudes [34]. Thus, S4 was not used for the SNA0P station in the satellite and observation removal strategies. After that, the processed and original data was input into PPPH to obtain the height and 3D time series outputs. Based on the PPP outputs, RMSE of both original and processed data during the period affected by scintillation as well as the corresponding improvement rates could be calculated. If the scintillation occurs at the beginning of the day, the RMSE was calculated after the convergence period. When computing RMSE, a reference coordinate should be input. In this paper, the Natural Resources Canada’s Canadian Spatial Reference System (CSRS) PPP was used to generate the reference coordinate by inputting the RINEX file on a day without scintillation [35]. Moreover, the geometric dilution of precision (GDOP) was generated to investigate the change of position and clock quality of satellites before and after satellites or observations were removed; this was calculated with the position of each visible satellite relative to that of the receiver and it started with a fraction of the design matrix [36]:
where is the fraction that contains the information of position and clock of satellites. Then, GDOP was calculated using the covariance of :
where , , and are the RMSEs of the estimated receiver coordinates and clock, respectively, and is the sum of the matrix dagonal. When satellites are far apart, the geometry is regarded to be strong and low DOP values can be obtained, thus, with a higher accuracy. Typically, the geometric quality is reliable and acceptable with a DOP value less than 5 and 10, respectively [37]. To observe the variation in the small values of GDOP, GDOP values larger than 30 are set to 30.
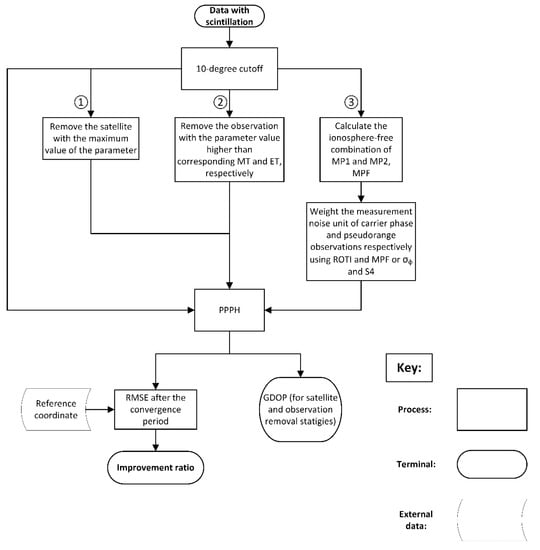
Figure 2.
Method flow chart. The three strategies: (1) satellite removal, (2) observation removal and (3) observation weighting strategy.
For the second strategy we removed outliers, defined as parameter values that exceeded a threshold. We compared the mild threshold (MT) and extreme threshold (ET) as thresholds for defining outliers. As different parameters may reflect different scintillation activities [20], the combination between parameters may cover more data influenced by scintillation. Thus, a series of permutations and combinations of parameters were used in observation removals so that the optimal combination could be determined. Standard (MP and ROTI) and scintillation (S4 and σϕ) parameters were applied separately for comparison. Taking scintillation parameters as an example, there were 3 combinations: (1) S4; (2) σϕ; (3) S4 and σϕ. Since there might be outliers in σϕ that were not in S4, the combination of S4 and σϕ could cover more outliers, and more outlier removals might lead to more accurate results. Similarly, there were 7 combinations of standard parameters. It should be noted that the same idea was not applied to the satellite removal because excessive satellite removals might result in complete failure of the positioning algorithm when the number of tracked satellites was less than four. The same procedures as satellite removal were repeated for the observation removal straegy after inputting into PPPH.
An additional step in the third strategy was to calculate the IF combination of MP1 and MP2 (MPF) that was used to down-weight the multipath effect as proposed by Mohammed [38]. Though the primary ionospheric error in MPF was mitigated through IF combination, the cycle slip and corresponding IF ambiguity caused by scintillation could still affect MPF. As suggested by Roberts [39], it is possible that only one of the carrier phase and pseudorange observations is affected by scintillation, where the carrier phase is more susceptible to scintillation [40]. On the contrary, the effect of multipath on pseudorange observations is considerably greater than that on carrier phase observations. Furthermore, MPF was used mainly to characterize multipath, but also to describe scintillation and ROTI was used mainly to characterize ionospheric activity. Based on these propositions, MPF was applied to weight the IF combination of pseudorange observation and ROTI was applied to weight the IF combination of carrier phase observation in PPP, which could achieve the best improvement as compared with other weighting strategies. In addition, S4 and σϕ were, respectively, used to weight pseudorange and carrier phase as S4 was calculated based on signal intensity and σϕ was obtained from signal carrier phase, which in turn were the influence factors, respectively. of pseudorange and carrier phase. In the Kalman filter (KF), the weights of observations were dependent on the measurement error covariance matrix introduced in [32]. Assume that the numbers of pseudorange and carrier phase observations are both . Thus, could be initiated with an -by- identity matrix as below [32]:
Then, an initial weight dependent on the a priori standard deviation (SD) of measurements was multiplied to each value on the diagonal of [32]:
where and are the a priori SDs of code and phase measurements, respectively, typically 3 m and 0.03 m, respectively [32,41]; and separately indicate the initial weight for code and phase measurements. After that, a weight method dependent on satellite elevations is typically used:
Next, the code and phase measurements were respectively weighted by MPF and ROTI or S4 and σϕ for down-weighting the signal affected by scintillation:
where and were the weights for down-weighting the scintillation effect respectively on code and phase measurements. The proposal of these two weights is the primary novelty in the weight strategy proposed in this paper. After the weighting process, the same procedures as previous strategies were repeated for the weight strategy after inputting into PPPH.
3. Results
The results of 14 days with scintillation used in the PPP improvement experiment are presented. Since a large number of graphs were generated from all 14-days data, graphs on 13 September 2017 at SAO0P station are shown as an example for visualization in Section 3.1 and the results on all the days were statistically tabulated and analyzed, as presented in Section 3.2.
3.1. Visualization Example
The convergence time was estimated using the scintillation-free data on 29 May 2016 at SNA0P, 1 September 2017 at SAO0P and 1 September 2017 at SJCU in Section 3.1.1. The relationship between standard and scintillation parameters on 13 September 2017 at SAO0P station has already been investigated by Li et al. [20], where the scintillation occurred during the first three hours. In Section 3.1.2, RMSE and GDOP changes of PPP positioning outputs before and after removing satellites with the strongest scintillation are presented. For the observation removal strategy, there are 10 combinations (7 for standard parameters and 3 for scintillation parameters) between parameters for each threshold type, as discussed in Section 3.2.2 as an example. Thus, in Section 3.1.3, PPP outputs of 4 out of 7 combinations of standard parameters in the observation removal strategy based on MT are displayed as an example. The results of other combinations are presented in the statistical results in Section 3.2. In Section 3.1.4, the RMSE changes of PPP outputs before and after weighting observations based on scintillation and standard parameters are shown.
3.1.1. Convergence Time Estimation
The height error variation on 1 September 2017 at SAO0P station, 1 September 2017 at SJCU station and 29 May 2016 at the SNA0P station is shown in Figure 3. The convergence time at all three stations was approximately 30 min, where the height estimate reached a stable continuous accuracy of approximately 0.1 m. Thus, the convergence period of 30 min was applied for RMSE computation in the following results.
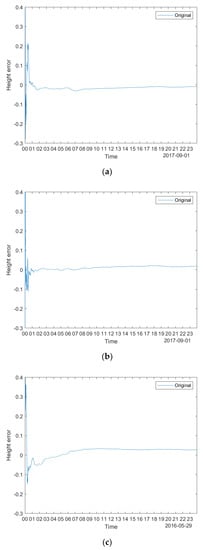
Figure 3.
The height error variation on (a) 1 September 2017 at SAO0P station; (b) 1 September 2017 at SJCU station; (c) and 29 May 2016 at SNA0P station. The height error is in metres.
3.1.2. Satellite Removal Strategy
Based on MP1, MP2, S4 and σϕ, G10 was considered to be the satellite affected most by scintillation; G21 was the most affected according to ROTI only on 13 September 2017 at SAO0P station. As shown in Figure 4, the original and G10-removed PPP height (a) and 3D (b) errors were compared based on RMSE on 13 September 2017 at SAO0P station. It can be observed from Figure 4 that the original height and 3D errors display variabillity during the first ten hours. By comparison, the RMSE of both height and 3D errors barely changed after G10 was removed, which meant removing G10 did not contribute to error mitigation though it was the satellite with strongest scintillation according to MP and scintillation parameters. During the scintillation period, there were 8 to 11 visible satellites including G10. Thus, removing G10 hardly affected the availability of satellites and the positioning algorithm. Furthermore, another scintillation satellite G21 was removed according to ROTI and the same comparison was conducted that is shown in Figure 5. On this occasion, the RMSE of height and 3D errors were slightly improved, where improvement rates of results shown in Figure 5a,b are 5.5% and 4.6%, respectively.
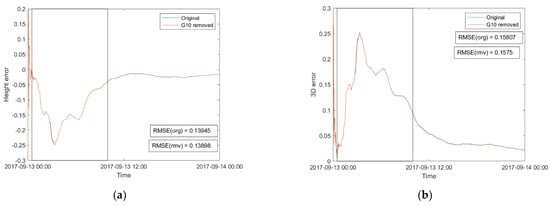
Figure 4.
Comparison between (a) the original and G10-removed RMSE of the height error, (b) the original and G10-removed RMSE (m) of the 3D error on 13 September 2017 at SAO0P station. The period affected by scintillation is framed in a rectangle (0.5 to 10 UT).
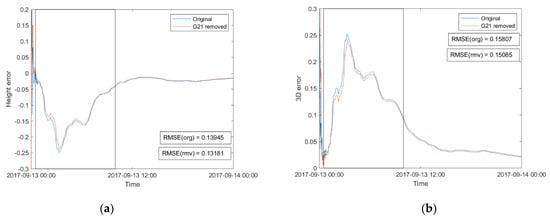
Figure 5.
As Figure 4 except G21 was removed rather than G10.
In order to investigate the influence of satellite removal on the GDOP, the GDOP time series plots before and after removing G10 or G21 are shown in Figure 6. The GDOP values mostly remain below 5 and all the GDOP values remain below 8. The GDOP values slightly increased during the first six hours in both graphs and in the last half hour in Figure 6b. As aforementioned, there were 8 to 11 satellites available during the scintillation period. In this case, removing a single satellite has little effect on the satellite geometry and thus, DOP.
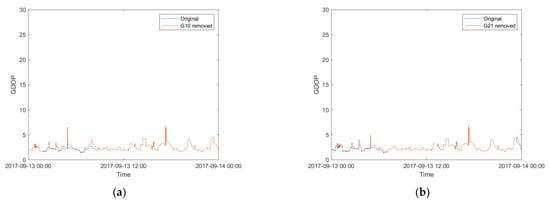
Figure 6.
Comparison between (a) the original and G10-removed GDOP, (b) the original and G21-removed GDOP on 13 September 2017 at SAO0P station. GDOP is dimensionless.
3.1.3. Observation Removal Strategy
As compared with satellite removal strategy, larger improvements in height and 3D were found when using the observation removal strategy as shown in Figure 7 and Figure 8. It can be seen that the variability during the period affected by scintillation and the general deviation from the reference coordinate were further mitigated though the improvement based on MP2 was not substantial compared with the other parameters. As shown in Figure 7, it can be seen that using ROTI as the threshold led to the best improvement. As shown in Figure 8, the combination of MP1, MP2 and ROTI improved the 3D error more than the others. Improvement rates of results on Figure 7a–d and Figure 8a–d are 59.9%, 27.4%, 87.7%, 80.6%, 59.8%, 0.5%, 80.5% and 81.7%, respectively. The improvements by observation removal were larger than that by satellite removal, especially when ROTI and the combination of MP1, MP2, ROTI were applied where the improvement exceeded 80%.
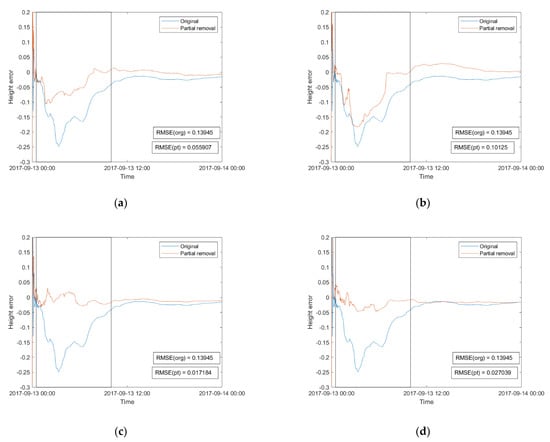
Figure 7.
Comparison between the RMSE (m) of PPP height error of the original state and that after observation was removed based on the MT of (a) MP1, (b) MP2, (c) ROTI, (d) MP1, MP2 and ROTI. Units as in Figure 4. The period affected by scintillation is framed in a rectangle.
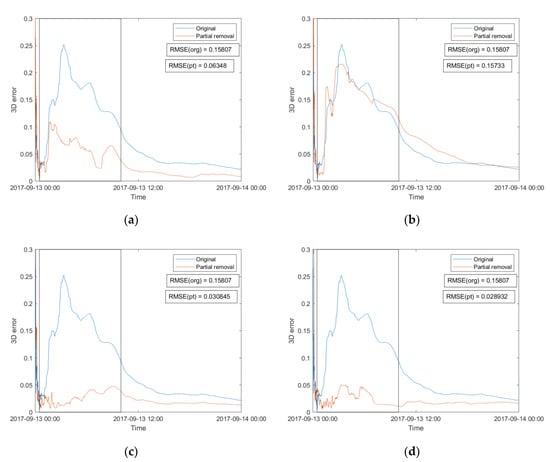
Figure 8.
As Figure 7 except for 3D RMSE rather than height errors.
The GDOP changes due to observation removal based on MP1, MP2, ROTI and the combination are shown in Figure 9a–d, respectively, and were considerably more significant than that due to satellite removal. The GDOP change in Figure 9a is the smallest. The change was larger in Figure 9c due to ROTI, where several GDOP values reached or even exceeded 30. ROTI is more sensitive to scintillation than MP. Thus, ROTI is more likely to exceed the threshold than MP and it is more likely that corresponding measurements would be removed, which leads to higher GDOP values. Furthermore, the change was even more severe in Figure 9d, which is predictable as more observations were removed. Though ROTI and the combination of MP1, MP2 and ROTI could lead to higher improvements than the others, the dramatically varying GDOP could lead to a decrease in the reliability of the results, which could be one of reasons for the lower height improvement with this combination than with ROTI.
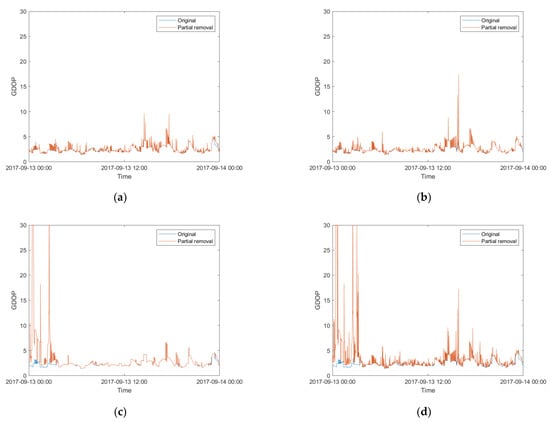
Figure 9.
Comparison between the GDOP before and after the observation was removed based on the MT of (a) MP1, (b) MP2, (c) ROTI, (d) MP1, MP2 and ROTI.
3.1.4. Weight Strategy
The RMSE improvement results, based on scintillation and standard parameters, through the weight strategy, are shown in Figure 10. It can be observed that using the standard parameters improved the RMSE slightly more than the scintillation parameters. The improvement rates in Figure 10a–d are 71.6%, 72.7%, 73.1% and 73.4%, respectively, which are comparable to those in Figure 7a–d and Figure 8a–d. Though the best improvements were larger when applying the observation removal strategy, this led to high GDOP values. High GDOP values typically indicate close distances between satellites and a low confidence level of observations from these satellites, which may lead to large position uncertainty [42]. As weighting observations have no effect on the satellite availability, the GDOP remains unchanged after applying the weight strategy.
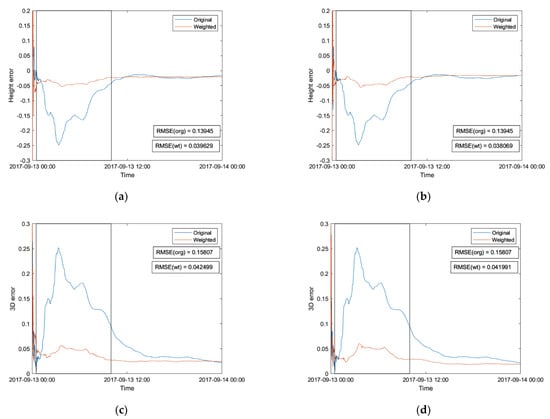
Figure 10.
Comparison between the original and weighted RMSE of the (a) PPP height error based on S4 and σϕ, (b) PPP height error based on MPF and ROTI, (c) PPP 3D error based on S4 and σϕ, (d) PPP 3D error based on MPF and ROTI. Units as in Figure 4. The period affected by scintillation is framed in a rectangle.
3.2. Statistical Results
3.2.1. Satellite Removal Strategy
The change of height and 3D positioning errors (RMSE) after removing scintillation-affected satellites based on MP1, MP2, ROTI, S4 and σϕ on 14 days at 3 stations are summarized in Table 1, Table 2 and Table 3. The improved RMSEs are highlighted in bold. It was observed that the satellite removal strategy based on MP1, MP2, ROTI and σϕ improved the positioning error on 7, 8, 6 and 5 days, respectively, within 14 days, while S4 improved the positioning error on 2 of the 7 days. The effectiveness of scintillation parameters was not higher than that of standard parameters, where S4 is the least effective parameter. Additionally, the situation exists that removing satellites based on MP can improve the error while using the other parameters cannot, and vice versa. Furthermore, the height and 3D errors were not always improved simultaneously. The error was improved on 8 out of 14 days at most, but most improvements were less than 0.05 m or even 0.01 m, where most of the original errors were at the decimeter level. Hence it can be concluded that the satellite removal strategy was not effective.

Table 1.
Change of the height and 3D positioning errors (m) through the satellite removal strategy as represented by the RMSE at SAO0P. Improved RMSEs (m) are highlighted in bold.

Table 2.
Change of the height and 3D positioning errors (m) through the satellite removal strategy as represented by the RMSE at SJCU. Improved RMSEs (m) are highlighted in bold.

Table 3.
Change of the height and 3D positioning errors (m) through the satellite removal strategy as represented by the RMSE at SNA0P. Improved RMSEs (m) are highlighted in bold.
3.2.2. Observation Removal Strategy
The improvement of height and 3D positioning errors after removing scintillation-affected observations based on the MT and ET of permutations and combinations of MP1, MP2, ROTI, S4 and σϕ on 14 days at 3 stations are summarized in Table 4. Due to the large number of combinations (see Section 3.1), results of the observation removal strategy are summarized in the main article and the detailed results are presented in Tables S1–S28 in the supporting material. Two criteria were used to evaluate the effectiveness of this strategy: proportion of days with improvement and the best improvement rate. As S4 was low at the SNA0P station, S4 was only used on 7 days at the other two stations in this strategy. When S4 was not considered for comparison, the highest proportions of days showing improvement in height and 3D errors were 8/14 and 11/14, respectively. The largest best improvement rate in height and 3D errors were 91.7% and 87.9%, respectively, both obtained with standard parameters. The largest proportion of days (8/14) with improvement in height errors was obtained by both standard and scintillation parameters. For 3D errors, the largest proportion of days (11/14) with improvement was obtained with the scintillation parameters. These results indicate that scintillation parameters could lead to a higher possibility of improvement and standard parameters could result in a higher degree of improvement. When MP1 and MP2 were used alone or the combination of MP1 and MP2 was used, the possibility and degree of improvement were relatively low. For example, when MP2 was used alone and ET was applied, the proportion of days with improvement and the best improvement in height errors were 3/14 and 16.3%, respectively, substantially lower than the others. However, when MP was combined with ROTI, the improvement was comparable or even higher than when ROTI was used alone. For instance, when MP1 was combined with ROTI and MT was used, the proportions of improved days and the best improvement in 3D errors slightly exceeded when ROTI was used alone. Moreover, σϕ was more effective than S4 according to the best improvement though it is largely because S4 was not high on 7 days at the Antarctica station SNA0P and can only be applied on the other 7 days. In terms of the proportion of days with improvement, S4 was comparable to σϕ when only considering the 7 days’ data. Hence, σϕ was more effective than S4 in scintillation mitigation.

Table 4.
Summary of the height and 3D positioning errors improvement through observation removal.
MT was generally more effective than ET according to both proportion of days with improvement and also the best improvement. The proportion of days with improved 3D errors was generally higher than that of height errors and the case was contrary for best improvement rate. Furthermore, when a single reference parameter was applied, the effectiveness of ROTI and scintillation parameters were comparable. When combinations were applied, the improvement in effectiveness of scintillation parameters was not substantial due to low S4 at SNA0P. However, combinations of standard parameters, such as the combination of MP1 and ROTI were able to further improve the results. For standard parameters, the combination of MP1 and ROTI was more robust than the others, in the sense that was able to acquire higher possibility and level of improvement. Thus, it was possible that the combination of MP and ROTI was able to cover and mitigate more errors than a single parameter.
3.2.3. Weight Strategy
The improvement of height and 3D errors obtained using the weight strategy on 14 days at 3 stations are presented in Table 5, Table 6 and Table 7. The improved RMSEs are highlighted in bold. Scintillation and standard parameters, respectively, improved the height RMSE on 6 and 8 out of 14 days, where the best improvement rates were 93.1% and 86.1%, respectively. For 3D errors, scintillation and standard parameters separately improved 3D RMSE on 8 and 7 out of 14 days, where the best improvement rates were 85.5% and 73.4%, separately. Thus, in weight strategy, standard parameters were comparable to scintillation parameters for improving both height and 3D errors according to the proportion of days with improvement and the best improvement rate. Furthermore, the improvement in height error was generally larger than that in 3D error.

Table 5.
Change of the height and 3D positioning errors through the weight strategy as represented by the RMSE at SAO0P. Improved RMSEs are highlighted in bold.

Table 6.
Change of the height and 3D positioning errors through the weight strategy as represented by the RMSE at SJCU. Improved RMSEs are highlighted in bold.

Table 7.
Change of the height and 3D positioning errors through the weight strategy as represented by the RMSE at SNA0P. Improved RMSEs are highlighted in bold.
4. Discussion
Data from 75 days at three stations, SAO0P, SJCU and SNA0P, were used in the PPP improvement experiments using the freely available MATLAB-based software PPPH. Data from 14 days with scintillation were investigated using three mitigation strategies for improving positioning quality. In Section 3.1.1, we evaluated the convergence time for PPPH at the three stations and concluded that it was around 30 min on a day without scintillation (Figure 3). Then, a visualization example was given based on the data on 13 September 2017 at SAO0P. In the first strategy, G10 and G21 were found to be the satellites with the most intense scintillation according to MP1, MP2, S4, σϕ and ROTI, respectively. As shown in Figure 4 and Figure 5, removing G10 scarcely decreased the RMSE for both height and 3D errors while removing G21 improved the height error by 5.5% height and 3D error by 4.6%, which is not effective compared to improvements obtained in other strategies. However, future research could investigate the properties of the removed satellites to identify which conditions could lead to improvements in PPP. It should also be noted that, when the number of satellites was high and their geometry was good, the change of GDOP was not substantial when removing a single satellite, as shown in Figure 6.
More substantial improvements were obtained with the observation removal strategy as seen in Figure 7 and Figure 8. When using a single parameter as the threshold reference to remove observations, the improvement based on ROTI was higher than that based on MP1 and MP2; it exceeded 80% and was substaintially more than the improvement through the satellite removal strategy. One possible reason for this phenomenon was that ROTI could identify more scintillation-affected observations than MP. Furthermore, when using a combination of MP1, MP2 and ROTI to remove observations, the height improvement was larger than that of MP1 and MP2, but smaller than that of ROTI. However, this combination improved the 3D error more than ROTI alone. A possible reason for this was that multipath effects are typically more severe at lower elevation. Thus, it is more likely that multipath contributes to the horizontal error rather than the height error, where the former is contained in the 3D error. Further, MP can be used to characterize multipath effects whereas ROTI cannot. Therefore, the combination of MP1, MP2 and ROTI was able to mitigate, not only scintillation, but also multipath in 3D. In addition, the GDOP was considerably influenced in the second strategy, especially when applying the combination of MP1, MP2 and ROTI, where several GDOP values exceeded 30 during first three hours as shown in Figure 9. This could be one of reasons why the height improvement using the combination was lower than that using ROTI.
Compared with the observation and satellite removal strategies, the weight strategy had no effect on the GDOP, which is one of its advantages. As shown in Figure 10, the improvements based on scintillation and standard parameters were comparable, which were also comparable to most of improvements based on the observation removal strategy. Thus, the weight strategy was more reliable and stable than the other two strategies with consistently high improvements based on this example.
All the results on 14 days were statistically summarized in Table 1, Table 2, Table 3, Table 4, Table 5, Table 6 and Table 7. Compared with the other two strategies, the satellite removal strategy was relatively ineffective in improving the positioning error. As shown in Table 1, Table 2 and Table 3, the highest proportion of days with improvement was 8 out of 14 days based on MP2. However, most of the improvements were less than 0.05 m or even 0.01 m, which was not substantial. There were two possible reasons for this phenomenon. First, it was highly possible that the observations from the satellite with the maximum parameter value encountered cycle slips, which might have been detected and repaired by the methods namely Hatch–Melbourne–Wübbena and the Geometry-Free Combination in the PPH preprocessing, before application of the positioning algorithm. Alternatively, the outlier detection algorithm in PPPH had identified and removed the noisy observations from the scintillation satellite in advance [28]. As a consequence, removing this scintillation satellite scarcely impacted the output. Moreover, it was possible that multiple satellites were affected by scintillation, hence removing a single satellite could not effectively mitigate the scintillation effect. However, it would not be appropriate to remove multiple satellites simultaneously as the number of available satellites might drop below 4, or the DOP values could be severely affected.
The improvement achieved with the observation removal strategy was more substantial than the satellite removal strategy. As shown in Table 4, the 3D error was improved on 11 out of 14 days based on MT and scintillation parameters, and the largest improvement in height error was 91.7% based on MT and standard parameters. Hence, it is possible that scintillation parameters are more likely to lead to improvement in positioning whereas standard parameters tend to lead to larger improvements in the observation removal strategy. However, the combination of standard parameters can be more effective. For instance, the combination of MP1 and ROTI could improve the height error more substantially than scintillation parameters using MT. In this case, standard parameters were able to replace scintillation parameters. Compared with the satellite removal strategy, the observation removal strategy was able to remove scintillation-affected observations from multiple satellites for an epoch once the corresponding parameter value exceeded the threshold. Furthermore, MT generally led to a higher success rate of improvement and improvement percentage. As MT was lower than ET, MT removed more observations, which led to fewer measurements with errors. Therefore, the scintillation effect was more thoroughly mitigated, which explained the higher effectiveness of applying MT in the observation removal strategy. However, more observations removed could also lead to a worse satellite geometry and larger GDP, resulting in the instability of positioning quality [42]. Thus, the observation removal strategy was less reliable than the weight strategy especially when MT was applied. There is a tradeoff between choosing MT for a larger improvement and a higher success rate of improvement, and choosing ET for a better satellite geometry.
As shown in Table 5, Table 6 and Table 7, though the proportion of days with improvement obtained with the weight strategy was relatively lower as compared with the observation removal strategy, the weight strategy was capable of acquiring an even higher improvement, that is 93.1% in height error. However, the errors considerably increased on 8 September 2017, 13 September 2017 at SJCU and 6 June 2016, 28 July 2016 at SNA0P. The same situation also occurred for the observation removal strategy as shown in Tables S6, S7 and S12–S14, which did not occur for the satellite removal strategy. This is partially because the original RMSEs were already small on several days, such as 2 April 2016, 28 July 2016 and 13 October 2016 at SNA0P, where the RMSEs did not exceed 0.01 m. This meant that the positioning performance of PPP was not substantially affected by scintillation on these days. Hence the presence of scintillation does not always mean that positioning will be affected and removing or weighting multiple observations simultaneously may even degrade the positioning performance of PPP. To clarify this, the number of satellites affected by cycle slip was investigated. Take SAO0P and SJCU, stations close to each other, as an example. The errors on 8 September 2017 substantially decreased at SAO0P, but substantially increased at SJCU. During the scintillation period, 4 and 3 satellites were simultaneously affected by cycle slips at SJCU and SAO0P, respectively, and the numbers of visible satellite were 8 at both stations. This might indicate that more satellites affected by cycle slip could lead to the ineffectiveness of the weight strategy. To support this statement, the same investigation was conducted at SNA0P. During the scintillation period, the number of satellites affected by cycle slips were 5, 7 and 6 on 13 April 2016, 9 May 2016 and 6 June 2016, respectively, when the number of visible satellites were 11, 10 and 10, separately. In other words, 6, 3 and 4 satellites were free of cycle slip on the three days, respectively. Further, the improvement was obtained on 13 April 2016 but not on the other two days. This suggests that, when fewer satellites were affected by cycle slip, this could provide conditions for the successful application of the weight strategy. In addition, the elevation angles of satellites affected by cycle slip were investigated. On 7 September 2017, 8 September 2017 and 13 September 2017 at SAO0P and 7 September 2017 at SJCU, the satellite with the highest elevation angle was affected by cycle slips less than 4 times when that on 8 September 2017 and 13 September 2017 at SJCU was affected by cycle slips more than 8 times. A satellite with a higher elevation contributes more to the geometry quality of satellites. Thus, if the high-elevation satellite is less affected by cycle slips, the satellite geometry should also be less affected. Therefore, this suggests that it is more likely to obtain improvements with the weight strategy when the high-elevation satellite is less affected by cycle slips.
Moreover, it was possible that standard parameters worked when scintillation parameters did not, and vice versa. Furthermore, it was also possible that either standard or scintillation parameters led to a higher improvement. One possible reason is that MP included in standard parameters is also able to characterize the multipath effect in addition to scintillation. Thus, standard parameters are capable of down-weighting more types of errors. On this occasion, standard parameters should be more effective in scintillation mitigation. However, MP and ROTI may sometimes fail to represent scintillation. In this case, scintillation parameters should be more effective in scintillation mitigation. Thus, standard parameters and scintillation parameters both have advantages in scintillation mitigation.
As presented in the introduction section, a great deal of research has been conducted to improve positioning accuracy under the scintillation conditions. By weighting the least square stochastic (LSS) model, the height positioning accuracy was respectively improved by 21% and 38% by Aquino et al. [6] and Aquino et al. [8], and the 3D positioning accuracy was separately improved by up to 77.3% and 75% by Park et al. [9] and Sreeja et al. [10]. In contrast, by weighting the KF model, the height and 3D error improvements, respectively, reached 93.1% and 86.1% in this paper, which were substantially higher as compared with the results obtained by Park et al. [9] and Sreeja et al. [10]. Moreover, scintillation parameters were required in all these methods when standard parameters (MP and ROTI) with comparable performance were alternative in the method used in this paper, which meant that the data with the time interval of 30 s could also be used to mitigate the scintillation effects. This substantially increased the coverage of scintillation study with the assistance of global agencies such as IGS, which provides data from more than 500 permanent GNSS stations covering over 100 countries. Furthermore, Marques et al. [13] integrated data from multiple constellations to improve the height and 3D error by 63% and 57%, respectively. This could be a part of future work, where the effectiveness of the observation removal and weight strategies could be investigated. Especially for the observation removal strategy, the satellite geometry is supposed to be less degraded with more visible satellites from multiple GNSS than using GPS only. Furthermore, with methods such as Bayesian optimization [43], genetic algorithm and machine learning, it is likely that the efficiency and consistency of weight strategy could also be improved. Thus, further research is necessary to evaluate the improvement of strategies through these methods.
5. Conclusions
In this paper, the experiment on mitigating scintillation effects on PPP has been conducted based on three strategies: satellite removal, observation removal and weighting the measurement noise matrix. The satellite removal strategy led to the smallest improvement, the observation removal strategy resulted in the most consistent improvement and the weight strategy generated the largest improvement. In the observation removal strategy, the effectiveness of standard parameters was comparable to that of scintillation parameters, especially with the combination of MP1 and ROTI. Though the observation removal strategy resulted in the most consistent improvement, the GDOP variation due to excessive removals led to the instability of this strategy. Using data from multiple constellations is a possible way to address the drawback of the observation removal strategy. In contrast, the weight strategy improved the height error by 93.1% at most. The standard parameters were also comparable to scintillation parameters in the observation removal and weight strategy. Thus, the primary novelty of the method in this paper was that parameters from 30 s data could also be used to effectively mitigate the scintillation effects on PPP. In addition, the observation removal strategy was proposed for the first time. Though there were some shortcomings with this strategy, it was easier-to-use than the weight strategy and could improve the errors more consistently.
Supplementary Materials
The following supporting information can be downloaded at: https://www.mdpi.com/article/10.3390/rs14236089/s1, Tables S1–S28: Change of the height and 3D positioning errors through the observation removal strategy based on MT/ET at SAO0P/SJCU/SNA0P on 4 September 2017/7 September 2017/8 September 2017/13 September 2017/18 February 2016/13 April 2016/9 May 2016/6 June 2016/28 July 2016/13 October 2016. Improved RMSEs (m) are highlighted in bold [44].
Author Contributions
Conceptualization, C.L., N.A.S.H. and C.M.H.; methodology, C.L., D.Z. and N.A.S.H.; software, C.L. and D.Z.; validation, C.L., C.M.H., S.V.V. and N.A.S.H.; formal analysis, C.L.; investigation, C.L.; resources, C.M.H. and N.A.S.H.; data curation, C.L.; writing—original draft preparation, C.L.; writing—review and editing, C.L., C.M.H., S.V.V. and N.A.S.H.; visualization, C.L.; supervision, C.M.H., S.V.V. and N.A.S.H.; project administration, N.A.S.H.; funding acquisition, N.A.S.H., C.M.H. and D.Z. All authors have read and agreed to the published version of the manuscript.
Funding
We acknowledge the University of Nottingham Ningbo China Faculty of Science and Engineering for provision of a PhD scholarship to C.L. (17053FOSE) as well as further support through a new researcher’s grant to N.A.S.H. and C.M.H. This project was further supported by the Natural Science Foundation of Jiangsu Province (No. BK20200664) and Key Laboratory of Geospace Environment and Geodesy, Ministry of Education, Wuhan University (No. 20-01-09). The APC was funded by a waiver to C.M.H.
Data Availability Statement
The GNSS data at the SJCU station was provided by Projects CIGALA and CALIBRA which can be accessed from https://ismrquerytool.fct.unesp.br/is/ismrtool/retrieval/download_ismr.php?lan=en (accessed 28 November 2022). The GNSS data at the SAO0P station were provided by INGV which can be accessed from http://www.eswua.ingv.it/ (accessed 28 November 2022).
Acknowledgments
Monitoring stations from the network were deployed in the context of the Projects CIGALA and CALIBRA, both funded by the European Commission (EC) in the framework of the FP7-GALILEO-2009-GSA and FP7–GALILEO–2011–GSA–1a, respectively, and FAPESP Project Number 06/04008-2; now maintained by the INCT GNSS NavAer, with financial support of CNPq (Grant 465648/2014-2), FAPESP (Grant 2017/50115-0) and CAPES (23038.000776/2017-54). We acknowledge eSWua system (www.eswua.ingv.it) owned by the Istituto Nazionale di Geofisica e Vulcanologia (INGV) and operated by the Upper Atmosphere Physics and Radiopropagation group for providing data from SAO0P station.
Conflicts of Interest
The authors declare no conflict of interest.
References
- Aquino, M.; Sreeja, V. Correlation of scintillation occurrence with interplanetary magnetic field reversals and impact on Global Navigation Satellite System receiver tracking performance. Space Weather 2013, 11, 219–224. [Google Scholar] [CrossRef]
- Li, Q.; Su, X.; Xu, Y.; Ma, H.; Liu, Z.; Cui, J.; Geng, T. Performance Analysis of GPS/BDS Broadcast Ionospheric Models in Standard Point Positioning during 2021 Strong Geomagnetic Storms. Remote Sens. 2022, 14, 4424. [Google Scholar] [CrossRef]
- Luo, X.; Liu, Z.; Lou, Y.; Gu, S.; Chen, B. A study of multi-GNSS ionospheric scintillation and cycle-slip over Hong Kong region for moderate solar flux conditions. Adv. Space Res. 2017, 60, 1039–1053. [Google Scholar] [CrossRef]
- Humphreys, T.E.; Psiaki, M.L.; Kintner, P.M. Modeling the effects of ionospheric scintillation on GPS carrier phase tracking. IEEE Trans. Aerosp. Electron. Syst. 2010, 46, 1624–1637. [Google Scholar] [CrossRef]
- Van Dierendonck, A.J.; Klobuchar, J.A.; Hua, Q. Ionospheric Scintillation Monitoring Using Commercial Single Frequency C/A Code Receivers. In Proceedings of the 6th International Technical Meeting of the Satellite Division of the Institute of Navigation, Salt Lake City, UT, USA, 22–24 September 1993. [Google Scholar]
- Aquino, M.; Dodson, A.; deFranceschi, G.; Alfonsi, L.; Romano, V.; Monico, J.; Marques, H.; Mitchell, C. Towards forecasting and mitigating ionospheric scintillation effects on GNSS. In Proceedings of the ELMAR 2007, Zadar, Croatia, 12–14 September 2007. [Google Scholar]
- Conker, R.S.; El-Arini, M.B.; Hegarty, C.J.; Hsiao, T. Modeling the effects of ionospheric scintillation on GPS/Satellite-Based Augmentation System availability. Radio Sci. 2003, 38, 1001. [Google Scholar] [CrossRef]
- Aquino, M.; Monico, J.F.G.; Dodson, A.H.; Marques, H.; De Franceschi, G.; Alfonsi, L.; Romano, V.; Andreotti, M. Improving the GNSS positioning stochastic model in the presence of ionospheric scintillation. J. Geod. 2009, 83, 953–966. [Google Scholar] [CrossRef]
- Park, J.; Vadakke Veettil, S.; Aquino, M.; Yang, L.; Cesaroni, C. Mitigation of Ionospheric Effects on GNSS Positioning at Low Latitudes. Navigation 2017, 64, 67–74. [Google Scholar] [CrossRef]
- Vadakke Veettil, S.; Aquino, M.; Marques, H.A.; Moraes, A. Mitigation of ionospheric scintillation effects on GNSS precise point positioning (PPP) at low latitudes. J. Geod. 2020, 94, 15. [Google Scholar] [CrossRef]
- de Oliveira Moraes, A.; Costa, E.; de Paula, E.R.; Perrella, W.J.; Monico, J.F.G. Extended ionospheric amplitude scintillation model for GPS receivers. Radio Sci. 2014, 49, 315–329. [Google Scholar] [CrossRef]
- Bougard, B.; Simsky, A.; Sleewaegen, J.-M.; Park, J.; Aquino, M.; Spogli, L.; Romano, V.; Mendonça, M.; Monico, G. CALIBRA: Mitigating the impact of ionospheric scintillation on Precise Point Positioning in Brazil. In Proceedings of the GNSS Vulnerabilities and Solutions Conference, Baška, Krk Island, Croatia, 18–20 April 2013. [Google Scholar]
- Marques, H.A.; Marques, H.A.S.; Aquino, M.; Vadakke Veettil, S.; Monico, J.F.G. Accuracy assessment of Precise Point Positioning with multi-constellation GNSS data under ionospheric scintillation effects. J. Space Weather Space Clim. 2018, 8, A15. [Google Scholar] [CrossRef]
- Vilà-Valls, J.; Linty, N.; Closas, P.; Dovis, F.; Curran, J.T. Survey on signal processing for GNSS under ionospheric scintillation: Detection, monitoring, and mitigation. Navigation 2020, 67, 511–536. [Google Scholar] [CrossRef]
- Nguyen, V.K.; Rovira-Garcia, A.; Juan, J.M.; Sanz, J.; González-Casado, G.; La, T.V.; Ta, T.H. Measuring phase scintillation at different frequencies with conventional GNSS receivers operating at 1 Hz. J. Geod. 2019, 93, 1985–2001. [Google Scholar] [CrossRef]
- Luo, X.; Gu, S.; Lou, Y.; Cai, L.; Liu, Z. Amplitude scintillation index derived from C/N0 measurements released by common geodetic GNSS receivers operating at 1 Hz. J. Geod. 2020, 94, 27. [Google Scholar] [CrossRef]
- Zhao, D.; Li, W.; Li, C.; Tang, X.; Zhang, K. Extracting an ionospheric phase scintillation index based on 1 Hz GNSS observations and its verification in the Arctic region. Acta Geod. Et Cartogr. Sin. 2021, 50, 368–383. [Google Scholar]
- Zhao, D.; Li, W.; Li, C.; Tang, X.; Wang, Q.; Hancock, C.M.; Roberts, G.W.; Zhang, K. Ionospheric Phase Scintillation Index Estimation Based on 1 Hz Geodetic GNSS Receiver Measurements by Using Continuous Wavelet Transform. Space Weather 2022, 20, e2021SW003015. [Google Scholar] [CrossRef]
- IGS. International GNSS Service. Available online: https://igs.org/ (accessed on 23 November 2021).
- Li, C.; Hancock, C.M.; Hamm, N.A.S.; Vadakke Veettil, S.; You, C. Analysis of the Relationship between Scintillation Parameters, Multipath and ROTI. Sensors 2020, 20, 2877. [Google Scholar] [CrossRef] [PubMed]
- Yang, Z.; Liu, Z. Correlation between ROTI and Ionospheric Scintillation Indices using Hong Kong low-latitude GPS data. GPS Solut. 2016, 20, 815–824. [Google Scholar] [CrossRef]
- Olwendo, J.O.; Cilliers, P.; Weimin, Z.; Ming, O.; Yu, X. Validation of ROTI for Ionospheric Amplitude Scintillation Measurements in a Low-Latitude Region Over Africa. Radio Sci. 2018, 53, 876–887. [Google Scholar] [CrossRef]
- Acharya, R.; Majumdar, S. Statistical relation of scintillation index S4 with ionospheric irregularity index ROTI over Indian equatorial region. Adv. Space Res. 2019, 64, 1019–1033. [Google Scholar] [CrossRef]
- Basu, S.; Groves, K.M.; Quinn, J.M.; Doherty, P. A comparison of TEC fluctuations and scintillations at Ascension Island. J. Atmos. Sol.-Terr. Phys. 1999, 61, 1219–1226. [Google Scholar] [CrossRef]
- Romano, V.; Spogli, L.; Aquino, M.; Dodson, A.; Hancock, C.; Forte, B. GNSS station characterisation for ionospheric scintillation applications. Adv. Space Res. 2013, 52, 1237–1246. [Google Scholar] [CrossRef]
- Hancock, C.M.; Ligt, H.D.; Xu, T. The possibility of using GNSS quality control parameters to assess ionospheric scintillation errors. In Proceedings of the Fig Working Week, Helsinki, Finland, 29 May–2 June 2017. [Google Scholar]
- Li, C.; Hancock, C.M.; Vadakke Veettil, S.; Zhao, D.; Galera Monico, J.F.; Hamm, N.A.S. Distinguishing ionospheric scintillation from multipath in GNSS signals using geodetic receivers. GPS Solut. 2022, 26, 150. [Google Scholar] [CrossRef]
- Bahadur, B.; Nohutcu, M. PPPH: A MATLAB-based software for multi-GNSS precise point positioning analysis. GPS Solut. 2018, 22, 113. [Google Scholar] [CrossRef]
- Pi, X.; Mannucci, A.J.; Lindqwister, U.J.; Ho, C.M. Monitoring of global ionospheric irregularities using the Worldwide GPS Network. Geophys. Res. Lett. 1997, 24, 2283–2286. [Google Scholar] [CrossRef]
- Estey, L.H.; Meertens, C.M. TEQC: The Multi-Purpose Toolkit for GPS/GLONASS Data. GPS Solut. 1999, 3, 42–49. [Google Scholar] [CrossRef]
- Estey, L.; Meertens, C. Teqc Tutorial: Basic of Teqc Use and Teqc Products; UNAVCO Inc.: Boulder, CO, USA, 2014. [Google Scholar]
- Axelrad, P.; Brown, R.G. GPS Navigation Algorithms. In Global Positioning System: Theory and Applications, Volume I; American Institute of Aeronautics and Astronautics: Reston, VA, USA, 1996; pp. 409–433. [Google Scholar]
- An, X.; Meng, X.; Jiang, W. Multi-constellation GNSS precise point positioning with multi-frequency raw observations and dual-frequency observations of ionospheric-free linear combination. Satell. Navig. 2020, 1, 7. [Google Scholar] [CrossRef]
- Jiao, Y.; Morton, Y.T. Comparison of the effect of high-latitude and equatorial ionospheric scintillation on GPS signals during the maximum of solar cycle 24. Radio Sci. 2015, 50, 886–903. [Google Scholar] [CrossRef]
- Mireault, Y.; Tétreault, P.; Lahaye, F.; Héroux, P.; Kouba, J. Online precise point positioning: A new, timely service from Natural Resources Canada. GPS World 2008, 19, 59–64. [Google Scholar]
- Spilker, J. Satellite Constellation and Geometric Dilution of Precision. In Global Positioning System: Theory and Applications, Volume I; American Institute of Aeronautics and Astronautics: Reston, VA, USA, 1996; pp. 177–208. [Google Scholar] [CrossRef]
- Lulu, W.; Zaimin, H.; Zhenxing, H.; Yuanyuan, H.; Gang, L. Single-chain hyperbolic positioning GDOP calculation based on longitude transformation method. J. Time Freq. 2020, 43, 196–203. [Google Scholar]
- Mohammed, J.J. Precise Point Positioning (PPP): GPS vs. GLONASS and GPS+GLONASS with an Alternative Strategy for Tropospheric Zenith Total Delay (ZTD) Estimation. Ph.D. Thesis, University of Nottingham, Nottingham, UK, 2017. Unpublished work. [Google Scholar]
- Roberts, G.W. Noise comparison of triple frequency GNSS carrier phase, doppler and pseudorange observables. Measurement 2019, 144, 328–344. [Google Scholar] [CrossRef]
- Roberts, G.W.; Fossá, S.; Jepsen, C. Temporal characteristics of triple-frequency GNSS scintillation during a visible aurora borealis event over the Faroe Islands amid a period of very low solar activity. GPS Solut. 2019, 23, 89. [Google Scholar] [CrossRef]
- Zhang, X.; Li, P.; Tu, R.; Lu, X.; Ge, M.; Schuh, H. Automatic Calibration of Process Noise Matrix and Measurement Noise Covariance for Multi-GNSS Precise Point Positioning. Mathematics 2020, 8, 502. [Google Scholar] [CrossRef]
- Langley, R.B. Dilution of Precision. In GPS World; North Coast Media: Cleveland, OH, USA, 1999; Volume 10, pp. 52–59. [Google Scholar]
- Raj, R.; van der Tol, C.; Hamm, N.A.S.; Stein, A. Bayesian integration of flux tower data into a process-based simulator for quantifying uncertainty in simulated output. Geosci. Model Dev. 2018, 11, 83–101. [Google Scholar] [CrossRef]
- Guo, F.; Zhang, X. Adaptive robust Kalman filtering for precise point positioning. Meas. Sci. Technol. 2014, 25, 105011. [Google Scholar] [CrossRef]
Publisher’s Note: MDPI stays neutral with regard to jurisdictional claims in published maps and institutional affiliations. |
© 2022 by the authors. Licensee MDPI, Basel, Switzerland. This article is an open access article distributed under the terms and conditions of the Creative Commons Attribution (CC BY) license (https://creativecommons.org/licenses/by/4.0/).