Abstract
Reconstruction of historical land uses helps to understand patterns, drivers, and impacts of land-use change, and is essential for finding solutions to land-use sustainability. In order to analyze the relationship between land-use change and urban flooding, this study used the Classification and Regression Tree (CART) method to extract modern (2017) land-use data based on remote sensing images. Then, the Paleo-Land-Use Reconstruction (PLUR) program was used to reconstruct the land-use maps of Xi’an during the Ming (1582) and Qing (1766) dynasties by consulting and collecting records of land-use change in historical documents. Finally, the Flo-2D model was used to simulate urban flooding under different land-use scenarios. Over the past 435 years (1582–2017), the urban construction land area showed a trend of increasing, while the unused land area and water bodies were continuously decreasing. The increase in urban green space and buildings was 20.49% and 19.85% respectively, and the unused land area changed from 0.32 km2 to 0. Urban flooding in the modern land-use scenario is the most serious. In addition to the increase in impervious areas, the increase in building density and the decrease in water areas are also important factors that aggravate urban flooding. This study can provide a reference for future land-use planning and urban flooding control policy formulation and revision in the study area.
1. Introduction
Human-caused land use/cover change (LUCC) is one of the key indicators of surface environmental change, which has a significant influence on long-term environmental sustainability [,]. Common effects of land-use change include clearing of natural vegetation, disruption of carbon sinks, loss of biodiversity, changes to hydrology, and impacts on climate [,,,,]. Therefore, it is necessary to comprehend the patterns, causes, and effects of land-use change in order to find solutions for land-use sustainability []. Historical LUCC is crucial for identifying the mechanism of climate change, defining the environmental consequences of LUCC across long time scales, and understanding present and future land-use and cover-change processes [,]. Since the 1990s, the International Geosphere-Biosphere Programme (IGBP) and International Human Dimensions Programme on Global Environmental Change (IHDP) have taken the understanding of LUCC in the past (especially in the past 300 years) as one of the key points of its core program [,,]. Consequently, research on LUCC in historical periods has attracted extensive attention worldwide.
Long-term (decadal–centennial) land-use change history research can offer unique insights into the intricate linkages between societal and environmental processes in land systems []. Reconstructed historical land uses are critical data for assessing general historical processes and trends in human activities at global/regional scales, as well as for assessing long-term impacts on biodiversity, biogeochemistry, geomorphic processes, and climate systems [,,]. Globally, land-use reconstruction depends on inverse modeling, which integrates dynamic changes in human-environment connections spanning hundreds or thousands of years [,,,,]. Regional historical reconstruction is based on archives, inverse modeling, or a mix of data and models [,]. Sohl et al. [] used a wide range of historical data sources and a spatially explicit modeling framework to simulate the spatially explicit historical LUCC of the mainland United States from 1938 to 1992, and the results obtained were broadly consistent with the temporal and spatial change trends of land use in historical data sources. Meiyappan et al. [] proposed an implicit method to improve the consistency between the historical land-cover situation and actual remote sensing observations and used three widely recognized historical land-use estimates, combined with common urban land datasets, to generate three different estimates of historical land-cover change and potential LUCC conversion. Fang et al. [] proposed a methodological framework for assessing the credibility of global land-cover datasets and studied five cases, such as the amount of historical cultivated land in Germany in the past 1000 years and the spatial distribution accuracy of cultivated land-cover in the North China Plain in the past 300 years, to evaluate the credibility of historical cultivated land-cover data. Luo et al. [] developed a new method to estimate historical land use, reconstructing historical land use in the Kamo River Basin (KRB) in Japan in 1843, 1902, and 1927. This approach produces a set of basic rules by comparing existing land uses with historical documents, allowing users to quickly reconstruct historical land uses using historical information.
LUCC is an important element determining regional hydrological features, and its modification causes changes in water distribution patterns and hydrological processes such as evaporation, runoff, lateral flow, infiltration, and groundwater recharge [,]. Since the middle of the 20th century, several studies have been carried out to determine how LUCC patterns affect hydrological processes [,,]. Studies on the connection between variations in plant cover and water runoff dynamics offer knowledge for managing water resources and successfully mitigating the harm brought on by land-use changes [,,,]. Glavan et al. [] used the existing digital map of historical land use in a small watershed (Raka River) in Slovenia to compare with the land-use situation in the same study area in 2009, and simulated the impact of historical land use on water quality through a SWAT watershed model.
Land use/cover in the historical period is the precursor and basis of modern land use/cover. The study of land use/cover change in the historical period can not only explore how ancient people transformed the original living environment to adapt to the rapidly developing society, but also guide current urban land use. The objects of this study are: (1) to reconstruct the ancient land-use map of the study area by collecting historical documents and analyzing the changes in land use in different periods; (2) to simulate flooding in the study area under modern and ancient land-use scenarios; (3) analyze the relationship between land-use change and urban flooding.
2. Materials and Methods
2.1. Study Area
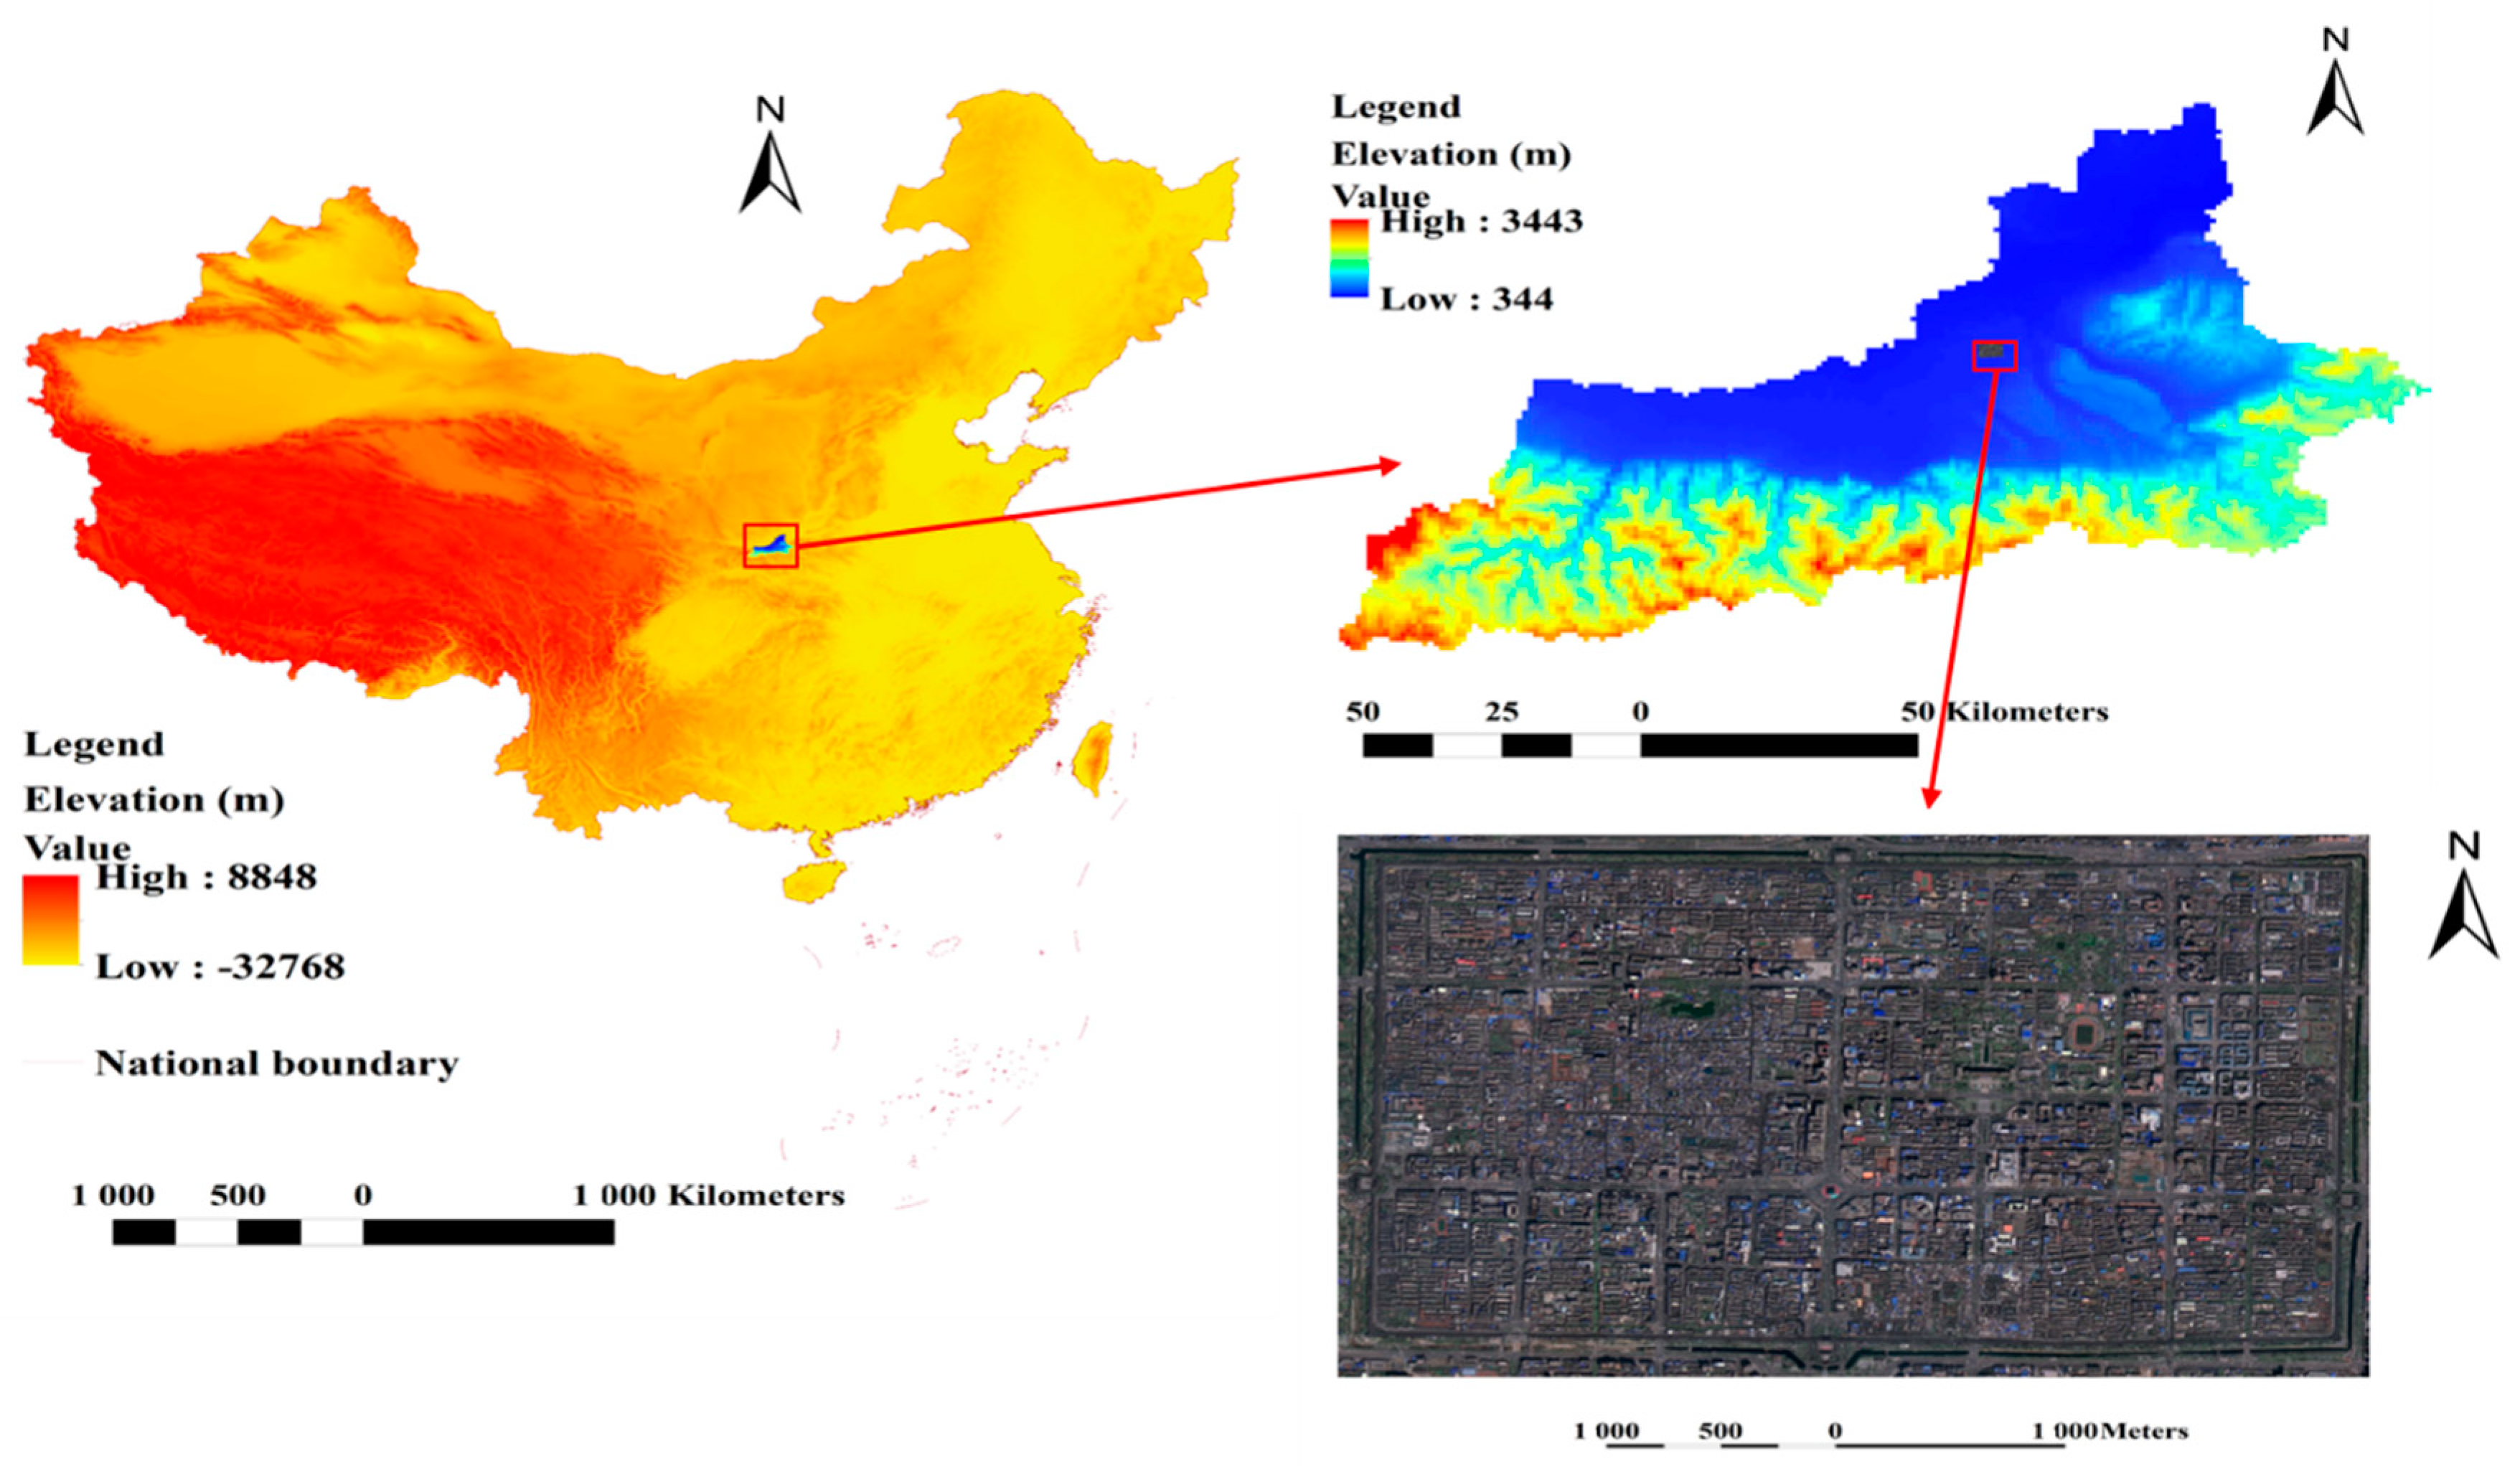
Xi’an City is located in the Guanzhong Basin in the middle of the Weihe River Basin, between 107.40°–109.49°E and 33.42°–34.45°N, with an annual average temperature of 13.4 °C and annual precipitation of 621 mm. It is an important central city in western China and an important national scientific research, education, and industrial base.
In this paper, the area of Xi’an within the Ming-era city wall was selected as the study area to study land-use change. The total area of the study area is 13.69 km2, as shown in Figure 1.

Figure 1.
Location and remote sensing image of the study area.
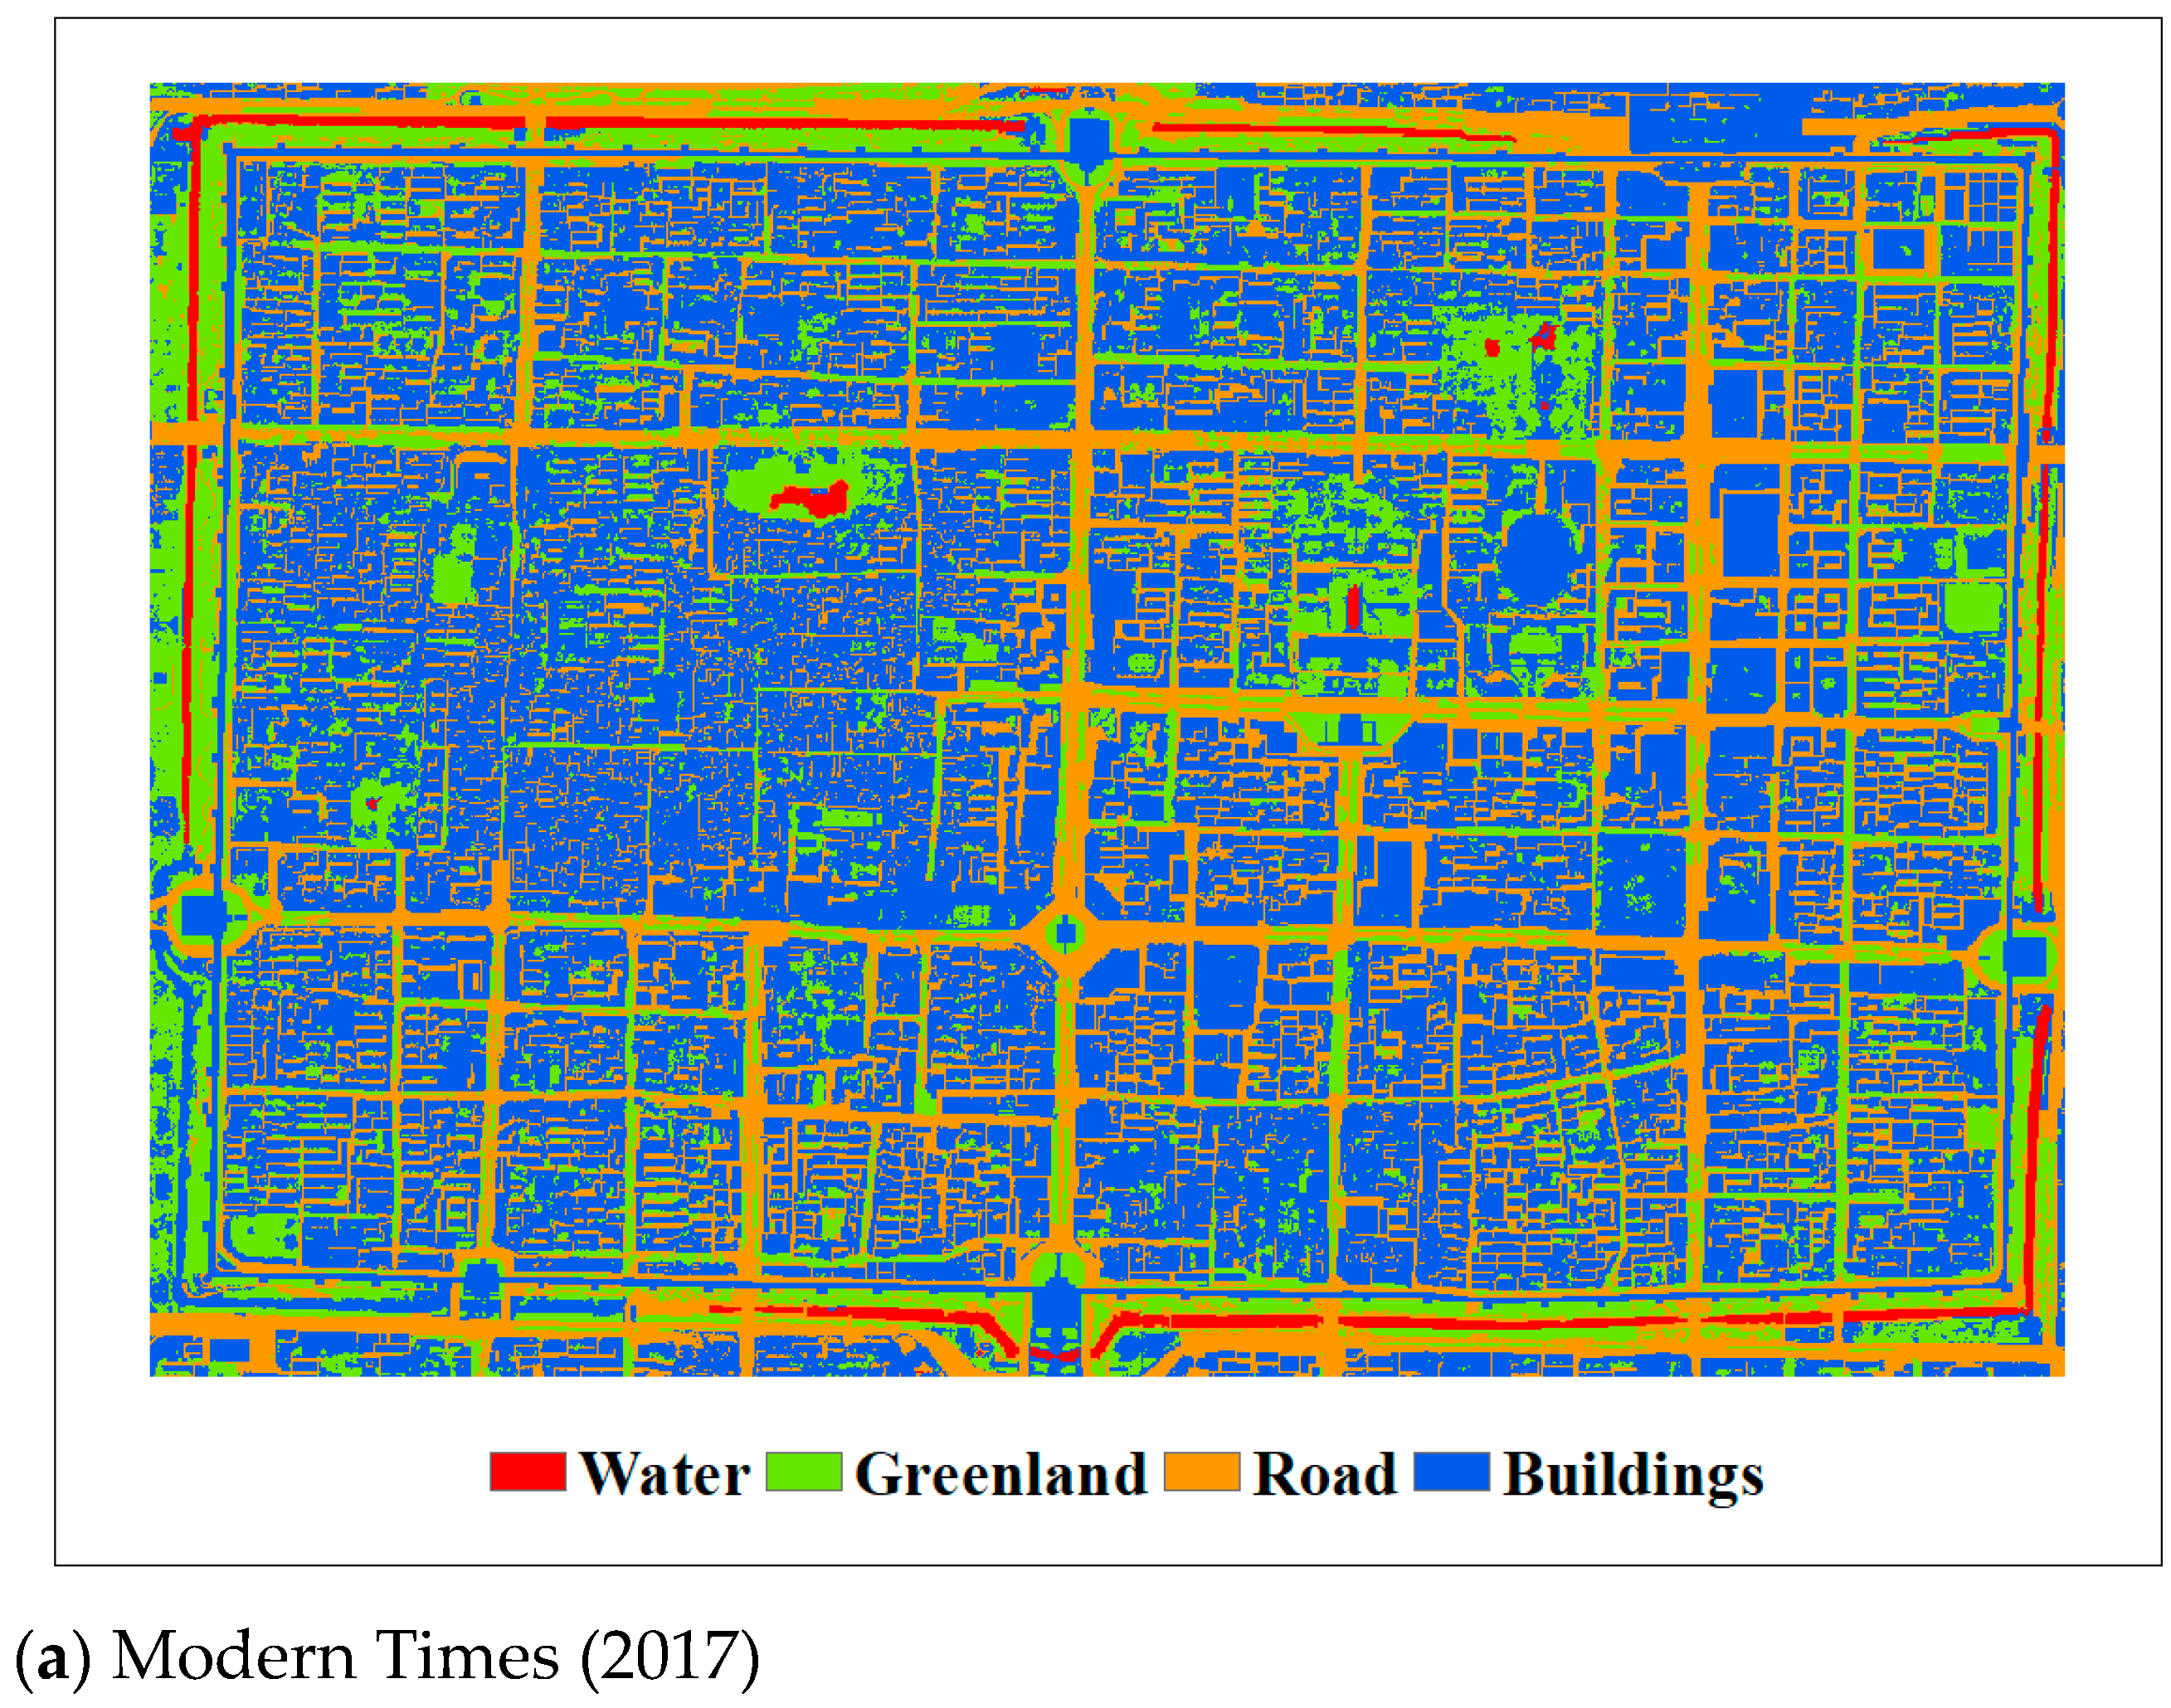
2.2. Modern Land Use Data
The remote sensing image data for this study come from the Resource and Environmental Science and Data Center of the Chinese Academy of Sciences (https://www.resdc.cn (accessed on 5 December 2020)). The data were collected on 12 April 2017. The spatial resolution of the full-color image is 0.8 m, the spatial resolution of the PMS1 sensor multispectral image is 3.2 m, and the image size is 25 km × 25 km.
In this study, the Classification and Regression Tree (CART) method proposed by Grajski et al. [] was used to extract land-use data based on remote sensing images.
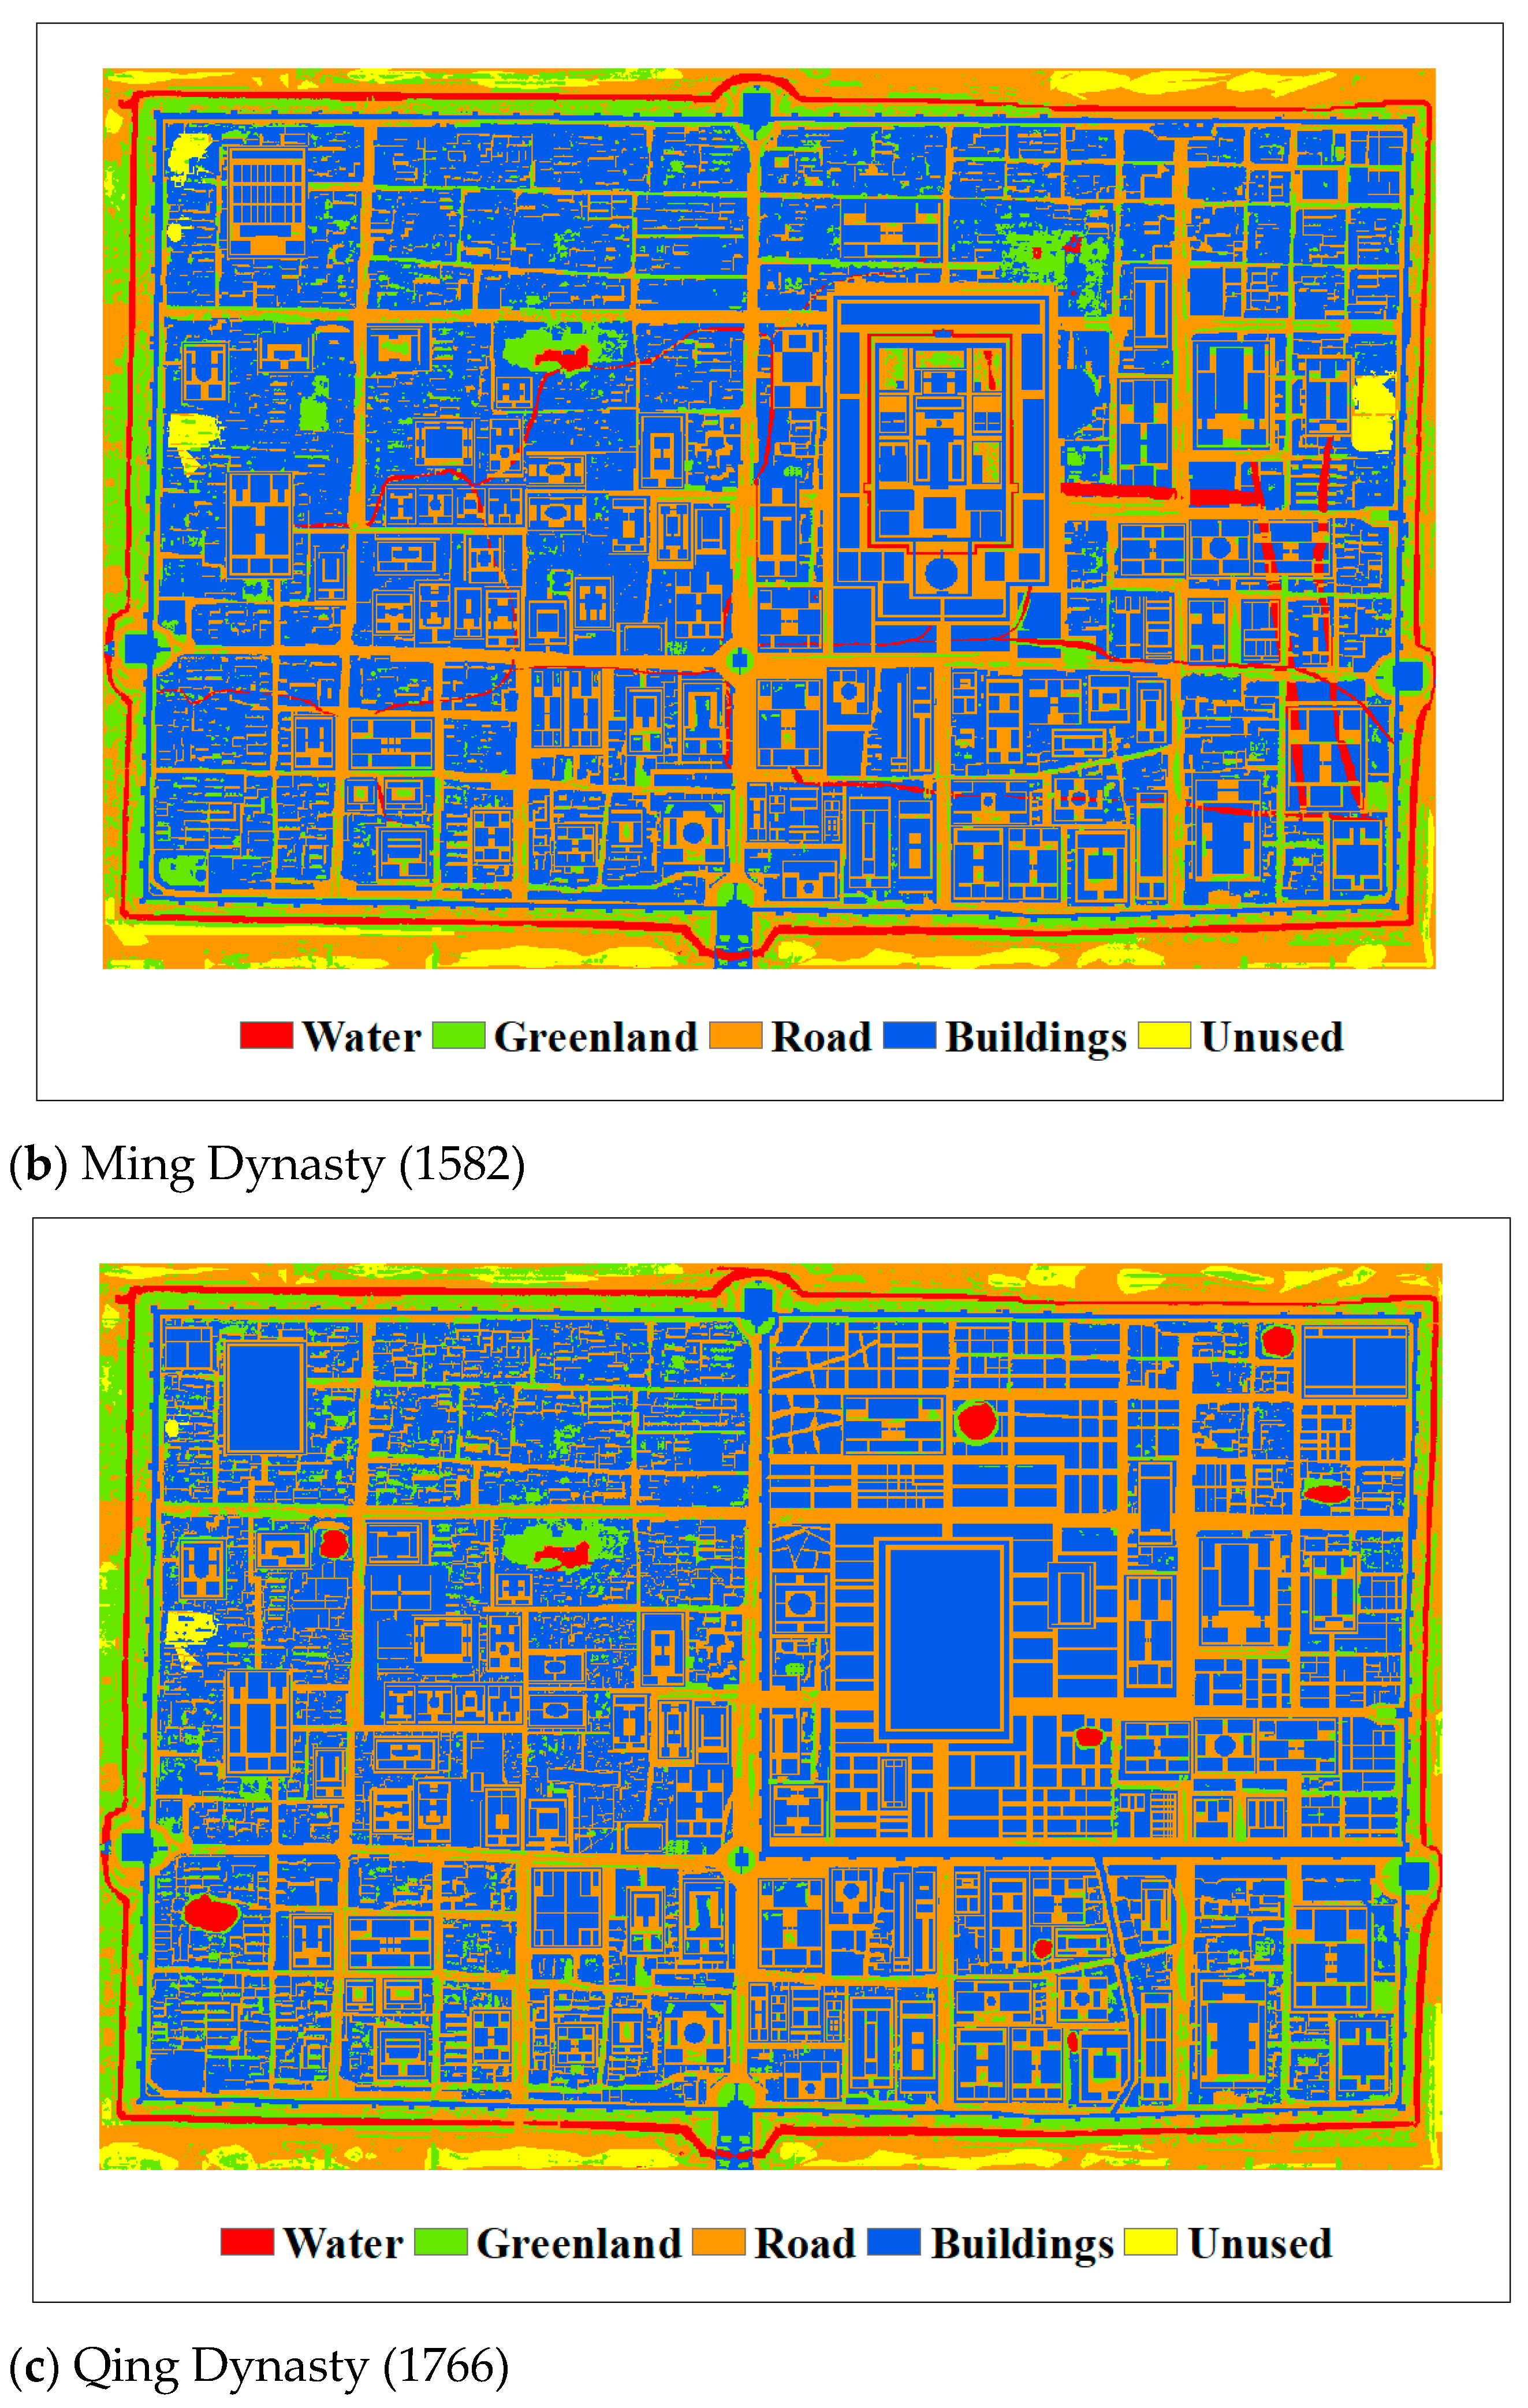
2.3. Paleo Land Use Reconstruction
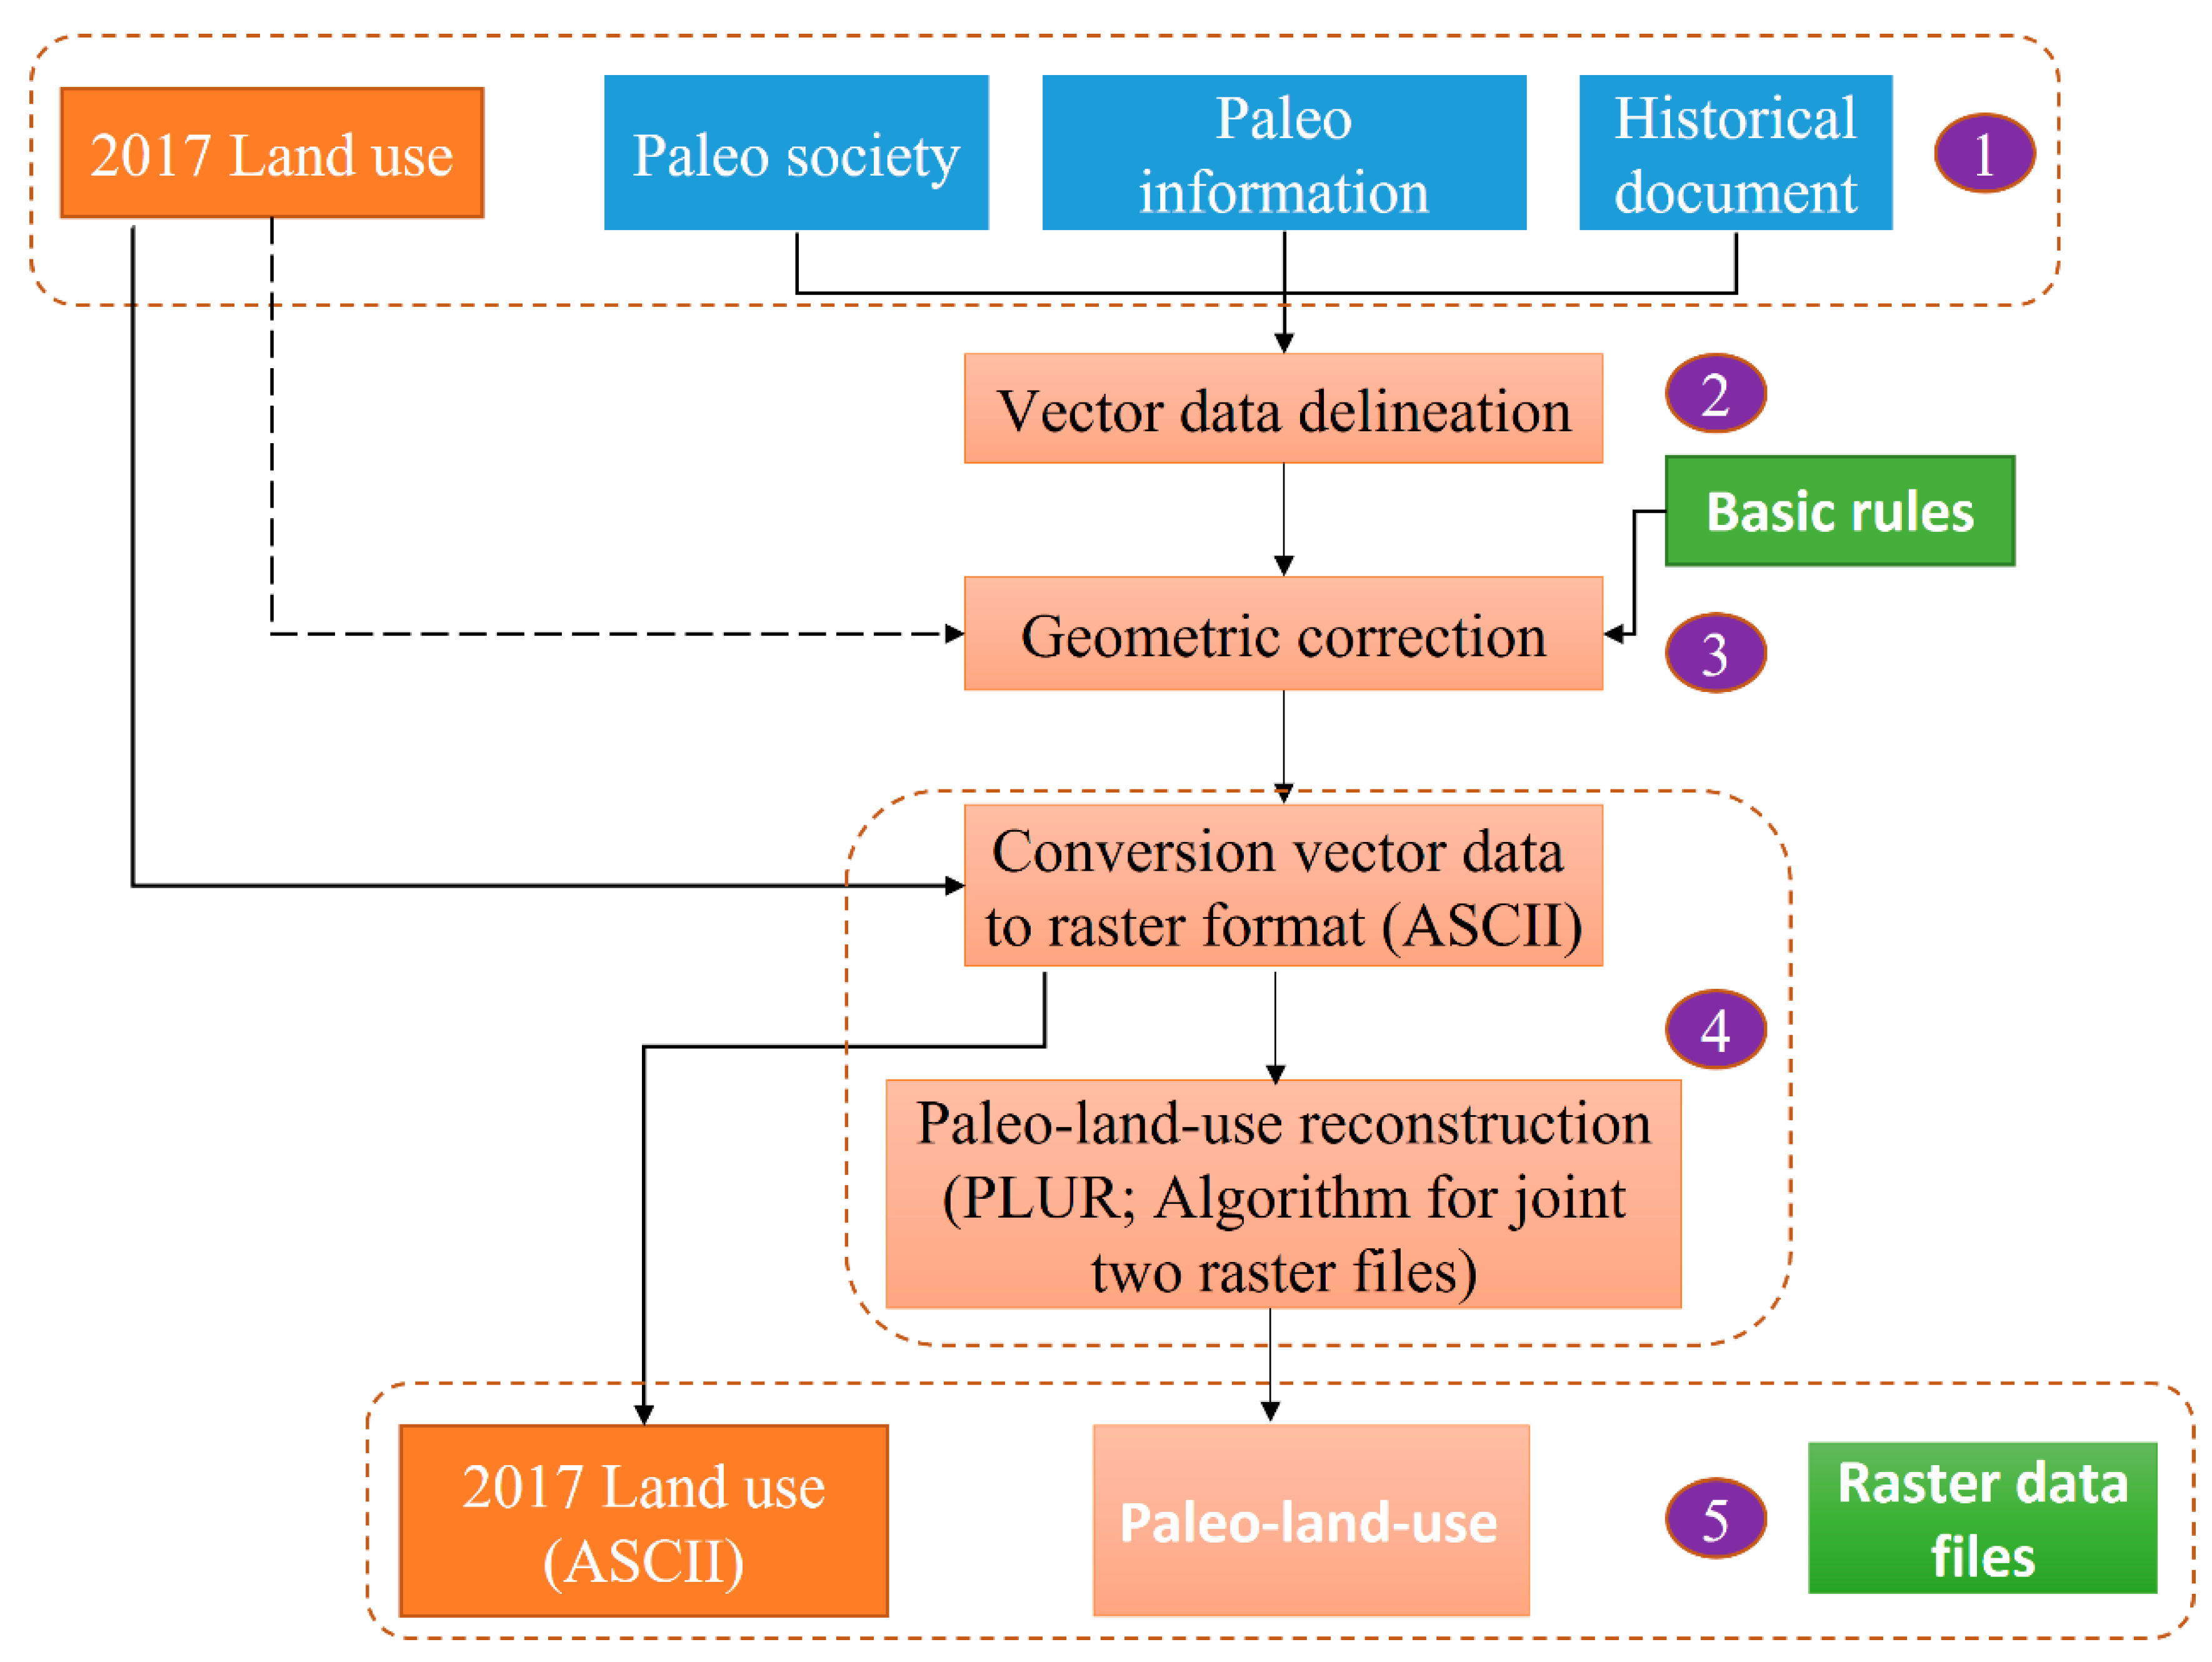
The Paleo-Land-Use Reconstruction (PLUR) program is a Fortran-based algorithm for combining two raster data files []. It aims to reconstruct the historical land use of the target area based on historical information (historical social structure, historical environment, historical ancient books, historical maps, historical documents, etc.). The reconstruction of historical land use through PLUR requires 5 steps (Figure 2), which are described in detail below:

Figure 2.
Historical Land-Use Reconstruction Process Using the PLUR Program.
(1) Collect historical information related to the study area, including land-use change records and social information.
(2) According to the completed information in step (1), delineate the area of land-use change and build it into vector data (features and polygons). The vector data delineation is a three-step process: (a) Geographically unchanged landmarks are used to match modern land use with ancient historical documentation. (b) Document areas of change based on past and present land use comparisons. (c) Draw the vector polygons of the land types of the ancient study area according to the information sorted out in the previous two steps.
(3) Make geometric corrections. Use a few basic rules to modify the shape of the vector data and compare it with modern digitized land-use data. In this step, we need to consider the history of urban construction from ancient times to modern times, and the new ancient study area land-use vector data is created after geometric correction. The basic rulemaking process is detailed as follows: (a) Collect historical books, paper maps, and modern digital land use data. (b) Using the results of step (a), we analyze digital land-use data and historical paper maps and consult historical books to identify detailed historical information such as the locations of temples, roads, rivers, and other landmarks. (c) Unchanged areas are used to synchronize historical and modern land use information.
(4) Convert the modern land-use vector data files and geometrically corrected ancient study area land-use vector data to raster data in ASCII file format. Provide the ASCII input files of modern land-use raster data and new vector data to the PLUR program.
(5) After step (4), the reconstructed historical land-use raster data is output from the PLUR program, giving details of each classification of the reconstructed historical land use.
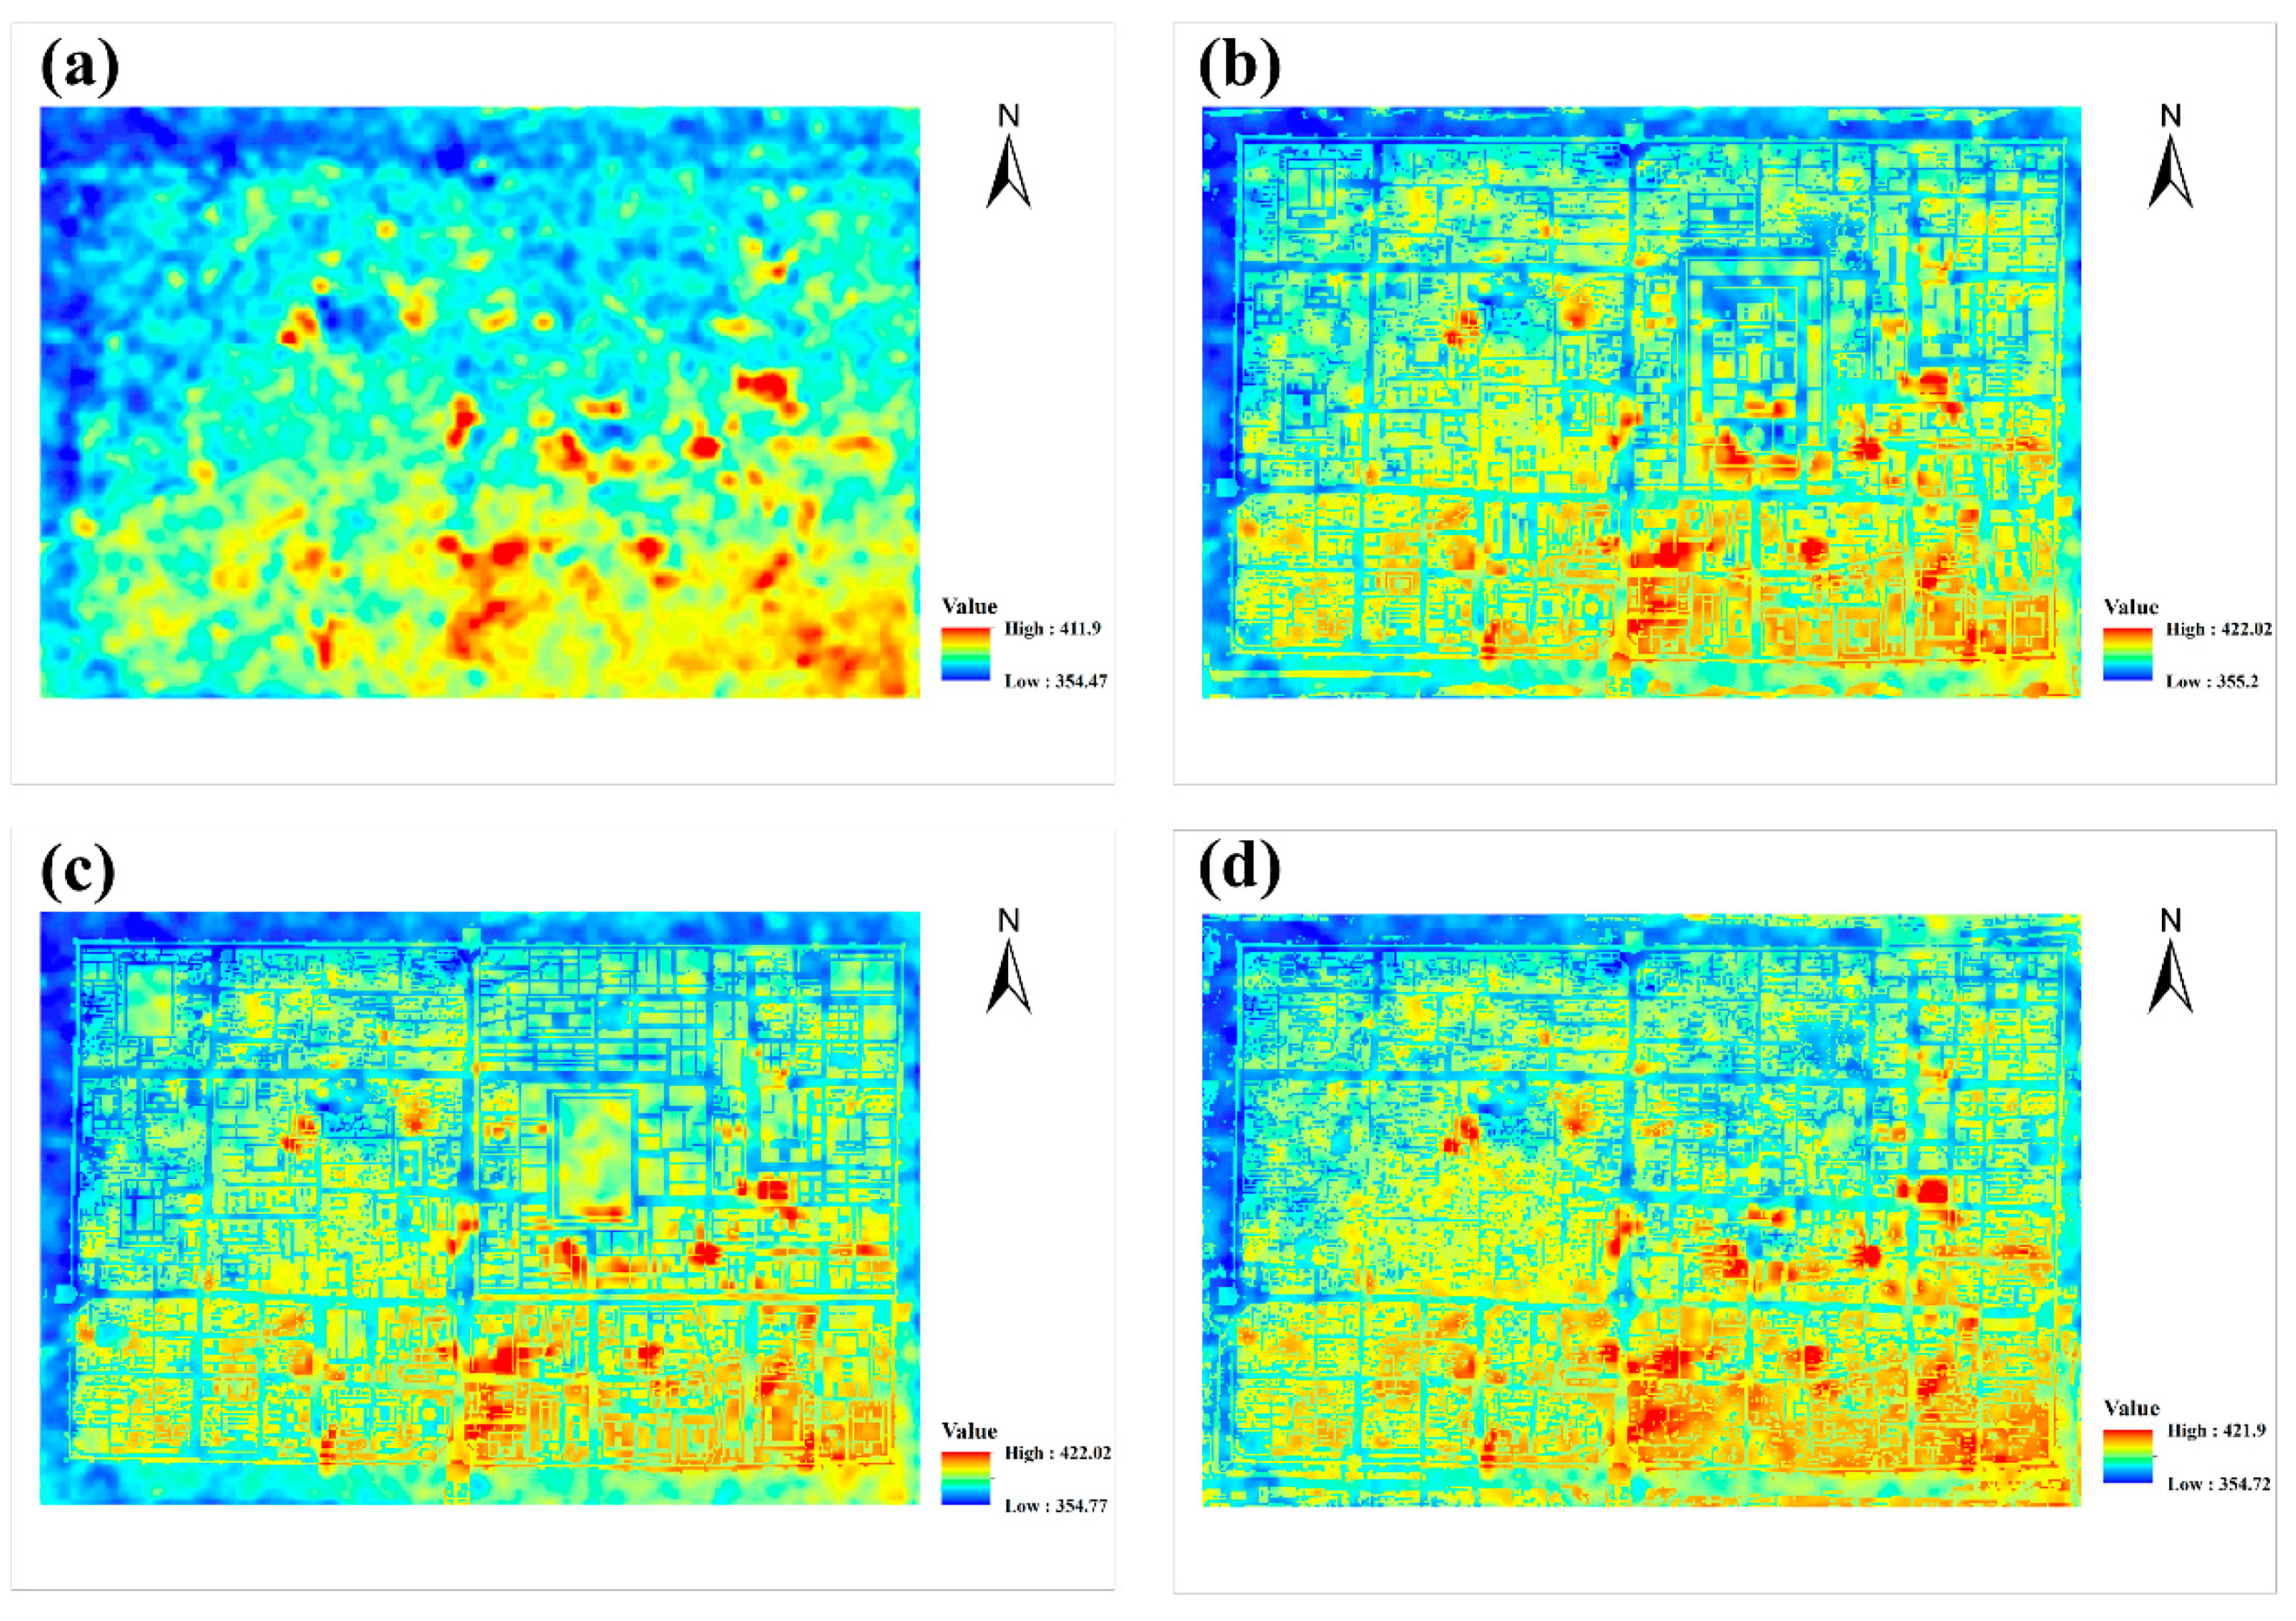
2.4. DEM Generalization
Roads are prone to urban flooding, and buildings in cities can have a blocking effect on surface runoff. In order to simulate more realistic urban flooding, we modified the topographic data from the study area based on a modern DEM (Figure 3a) with a resolution of 12.5 m. We subtracted 2 m from the elevation of the grid where a water body is located and 15 cm from the grid where a road is located and increased the elevation of the grid where a building site is located by 10 m. The topographic generalization results of the study area over the three periods are shown in Figure 3b–d, respectively.

Figure 3.
DEM of the study area. (a) Untreated; (b) Ming dynasty; (c) Qing dynasty; (d) Modern.
2.5. Flo-2D Model
Flo-2D is a two-dimensional finitely differential flood model based on a mesh system that simulates floods at high resolution []. The two-dimensional flood calculus control equation of the model is as follows:
where t is the time, h is the depth of the water, V is the velocity of the water flow in the x direction, g is the acceleration due to gravity, i is the hydraulic slope, Sf is the friction descent, and S0 is the slope of the riverbed.
2.6. Infiltration Intensity and Manning Roughness
Based on the characteristics of the study area, the Horton infiltration method is selected in this paper. This method is suitable for the simplicity of the urban watershed, where runoff is not sensitive to soil parameters and there is a reasonable balance between the infiltration process. The Horton infiltration equation is:
where f is the infiltration rate (mm/h) at time t after rainfall begins, fi is the initial infiltration rate (mm/h), f0 is the stable infiltration rate (mm/h), and A is the attenuation coefficient (h−1). The parameter range of the Horton infiltration model can be obtained by referring to the FLO-2D model manual.
In this study, the impermeable surface (road, construction land) is not calculated as seepage, and the precipitation in the water area is completely infiltration. For the study area, the drainage capacity of the pipe network in the modern period (2017) is equivalent to an infiltration rate of 10.74 mm/h []. That is, the part with rainfall intensity less than 10.74 mm/h will be discharged through the urban pipe network, and the part with rainfall intensity greater than 10.74 mm/h will form surface runoff.
The relevant infiltration parameters and Manning’s coefficient of urban unused land in the Ming and Qing Dynasties can be referred to the study of Hou et al. [], who set the infiltration rate as 19.43 mm/h and Manning’s coefficient as 0.03. Since the main roads in the study area were paved with blue slate in the Ming and Qing dynasties, the non-main roads were mostly natural dirt roads rather than impermeable surfaces. Therefore, referring to the soil types and related osmotic parameters recorded in the Ming and Qing Dynasties, the average infiltration rate of trunk and non-trunk roads was 13.5 mm/h, and the average Manning coefficient was 0.021.
The detail of the infiltration parameters and Manning’s coefficients are listed in Table 1 and Table 2, respectively.

Table 1.
The numerical value table of the infiltration parameters of the permeable surface.

Table 2.
Manning’s coefficient values.
2.7. Rainfall Data
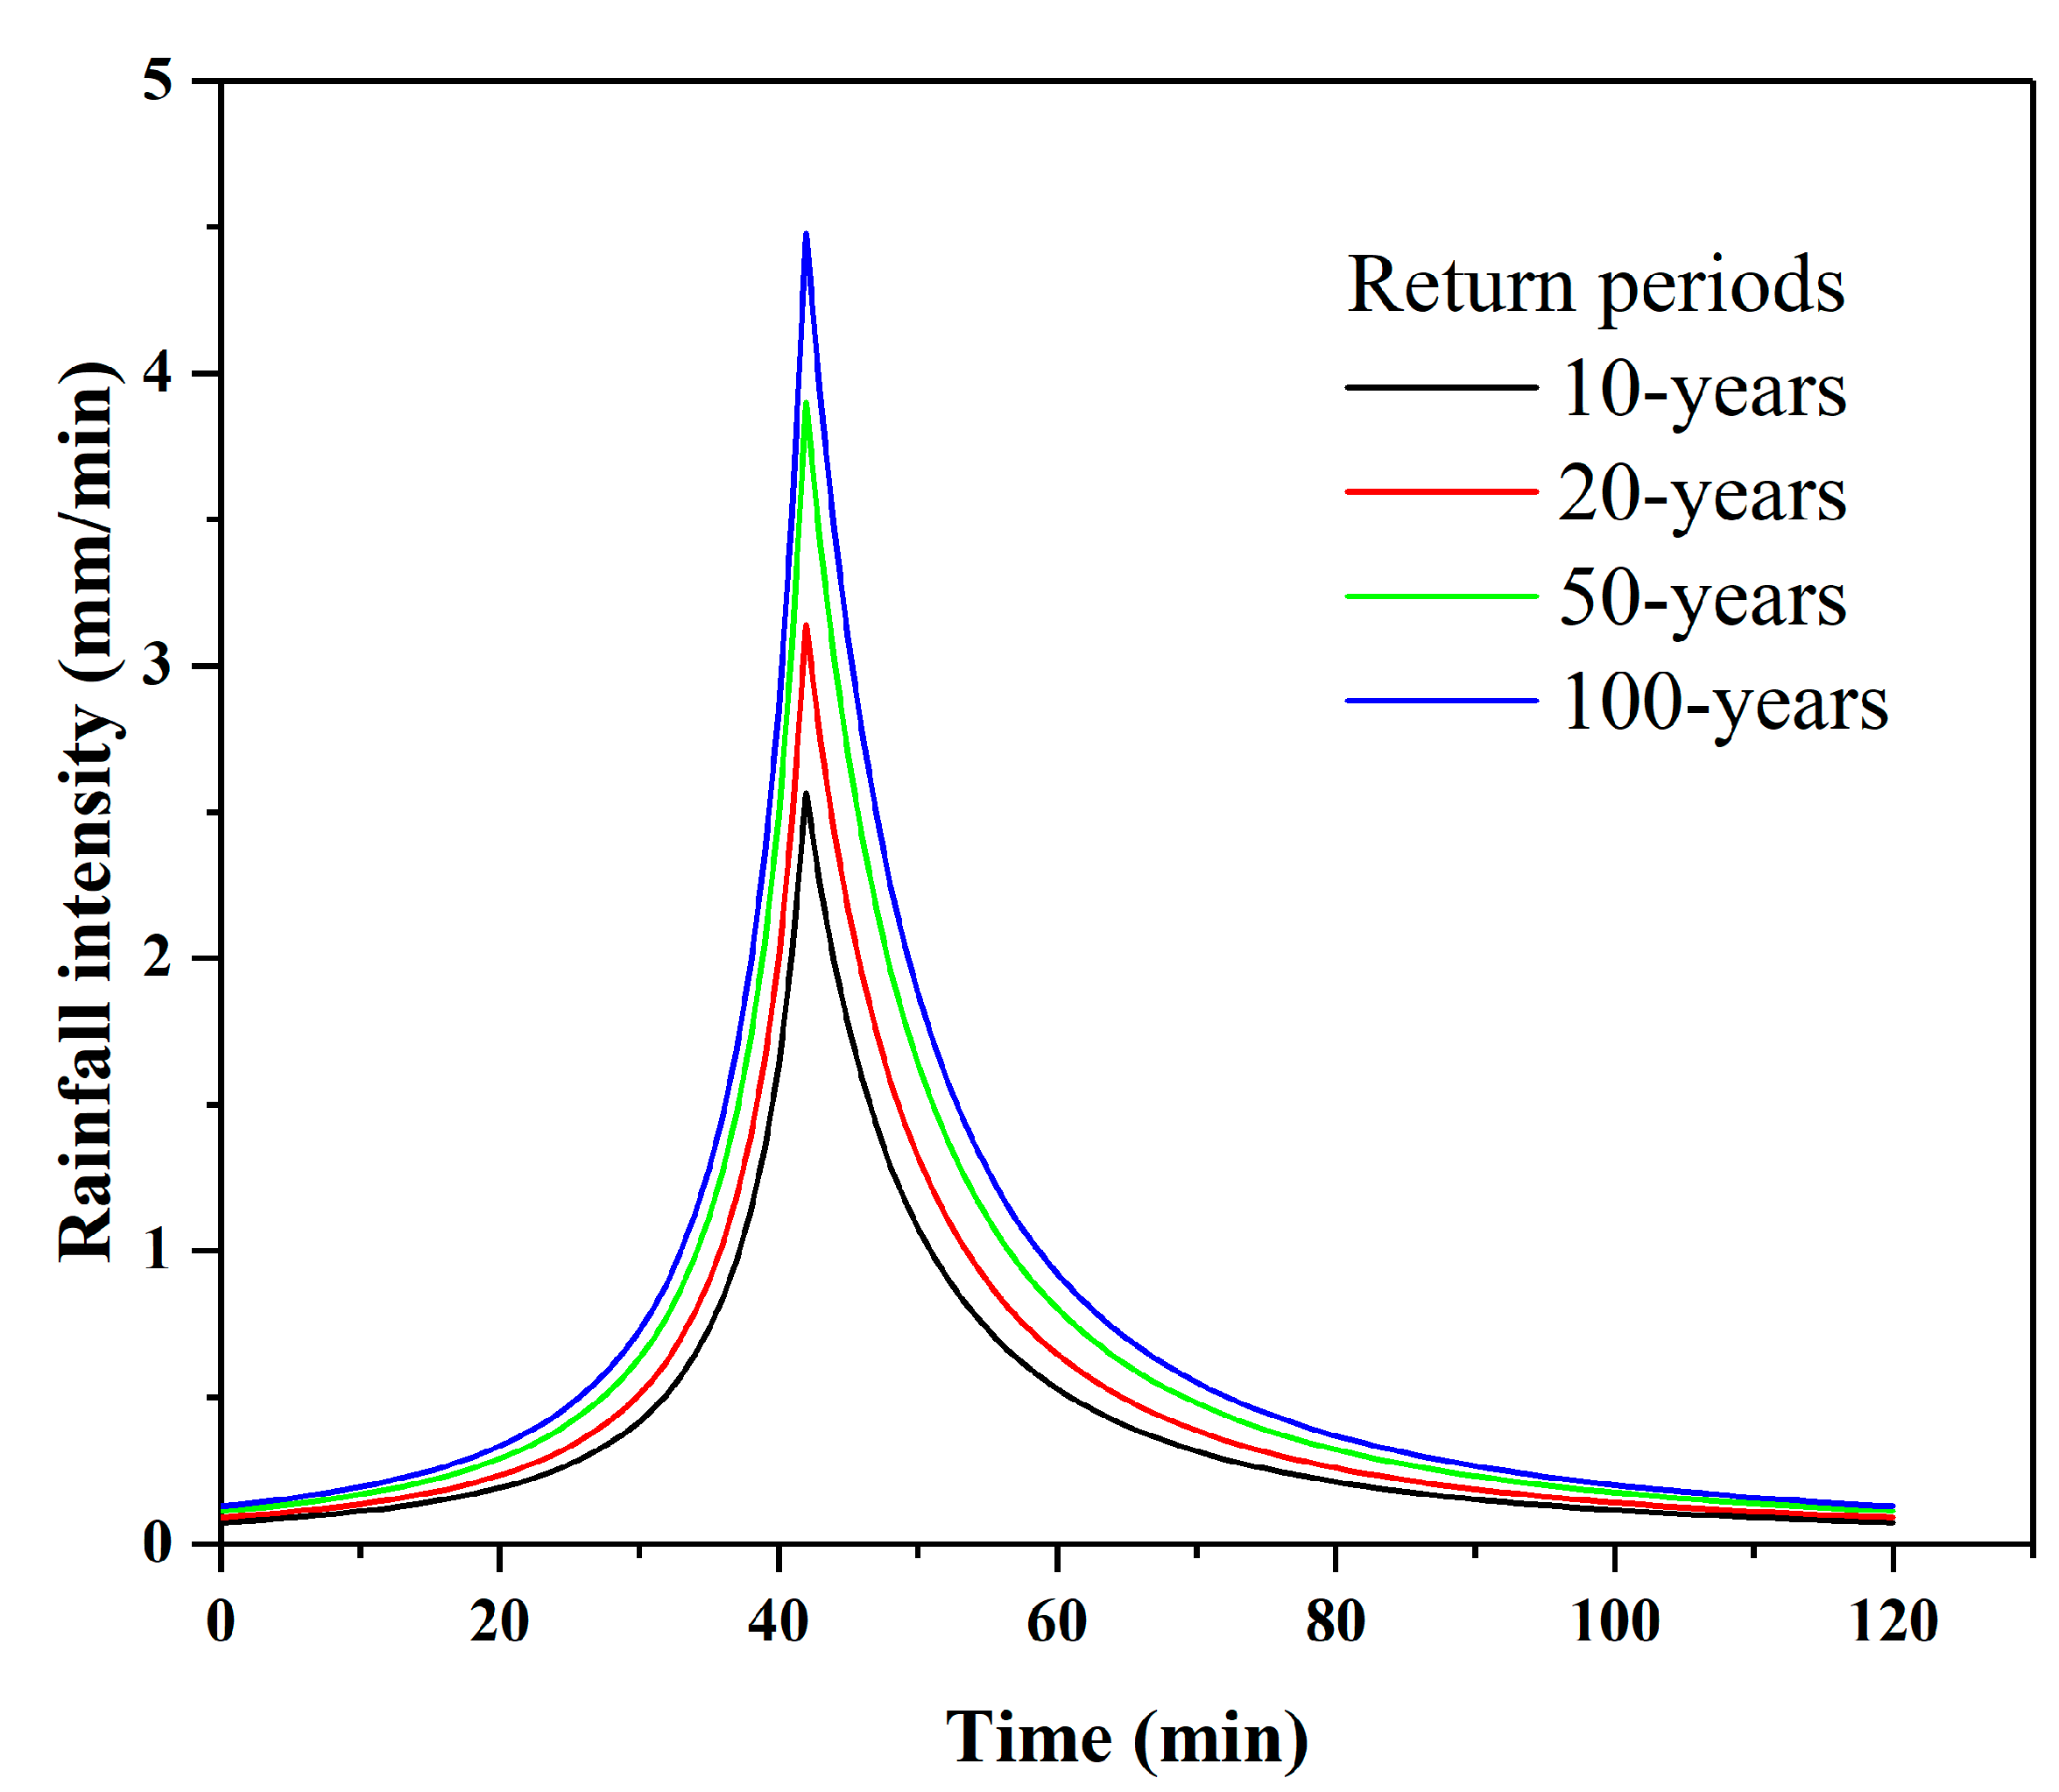
Based on the Xi’an rainstorm formula and the Chicago rain type method, this study designed four kinds of rainstorm recurrence periods of 10 years, 20 years, 50 years, and 100 years, and the rainstorm lasted 2 h.
According to the literature [], the calculation formula for the intensity of heavy rain in Xi’an is:
where q and i both represent the intensity of the rainstorm, where the unit of q is L⁄(h∙m2) and the unit of i is (mm⁄min); p is the recurrence period; and t is the period the heavy rain lasted.
The Chicago rain type method uses the peak ratio to express the ratio of the peak at present time to rainstorm time. According to the results of the study of Bi Xu et al. [], the value range of the peak ratio in Xi’an is 0.31731–0.49679. This study selected the peak ratio as 0.35. The design of the rainstorm is shown in Figure 4. The designed rainstorm intensity of each return period was 25 mm/h (10-year return period), 30 mm/h (20-year return period), 38 mm/h (50-year return period), and 44 mm/h (100-year return period).

Figure 4.
The different design hyetographs.
3. Results
3.1. Land-Use Change
Figure 5 shows the land use classification of the study area in the Ming Dynasty, Qing Dynasty, and modern times.


Figure 5.
Land use in the three periods of the study.
In the three periods, the main land use types within the Ming city wall of Xi’an were green space, traffic area, and buildings. From 1582 to 1766, the largest increase was for buildings, and the largest decrease was for water bodies, followed by unused land and green spaces (Figure 6). The increased buildings are mainly converted from roads, urban green spaces, and water bodies, and the decreased water bodies are mainly converted to buildings (Table 3).

Figure 6.
Land-use change Statistics.

Table 3.
Land use transfer matrix from 1582 to 1766/km2.
From 1766 to 2017, the largest increase was urban green space, mainly converted from buildings and roads. The largest decrease is the unused land (Figure 6), which is mainly converted into buildings (Table 4).

Table 4.
Land use transfer matrix from 1766 to 2017/km2.
Over the past 435 years (1582–2017), the increase in urban green space and buildings was 20.49% and 19.85% respectively, and the unused land changed from 0.32 km2 to 0.
3.2. Simulation of Urban Flooding in Different Scenarios
3.2.1. Model Validation
This study verifies the model parameters using the heavy rainfall data of Xi’an City from “20160724” (24 July 2016) and the corresponding measured inundation data (Table 5). According to the monitoring data of Station V8923, the “20160724” rainfall lasted for 2 h, with a total rainfall of 67.2 mm, and the recurrence period exceeded 30 years.

Table 5.
Validation results of flood points in the study area on 24 July 2016.
The simulation results are shown in Figure 7 (ignoring water depths of less than 5 cm). In combination with Table 5, it can be found that the water depth of the water points marked in Figure 7 is largely consistent with the measured results. The minimum relative error between the measured and simulated results is 4.0%, and the maximum relative error is 8.8%. This shows that the parameters of the model are reasonable and have good applicability to the simulation of surface inundation in the study area.

Figure 7.
Distribution of the maximum inundation depth of the “20160724” rainstorm.
3.2.2. Total Amount of Urban Flood Water
Under the four designed rainstorms, the urban flooding in modern land use is the most serious (Figure 8 and Table 6), and when the designed rainstorm recurrence period is 100 years, the surface accumulated water amount reaches 351,900 m3. With the 10- and 20-year rainfall recurrence periods, the water accumulation in the Qing Dynasty land-use scenario is the smallest, which is 5500 m3, 28,100 m3 less than the modern land-use scenario. When the rainfall recurrence periods are 50 years and 100 years, the Ming Dynasty land-use scenario has the smallest surface water accumulation, which was 37,100 m3, 86,400 m3 less than the modern land-use scenario.

Figure 8.
The total amount of surface water volume under the designed rainstorm in different periods.

Table 6.
Comparison of the peak value of the total amount of water volume.
3.2.3. Flood Area
Drawing on the research of Dai et al. [], the urban flooding level is divided according to the water depth:
Level I: mild urban flooding, the inundation depth is between 5 and 10 cm;
Level II: moderate urban flooding, the inundation depth is between 10 and 25 cm;
Level III: severe urban flooding, inundation depth greater than 25 cm.
Level I urban flooding has a small impact on cities and will not be discussed here. For a comparison of the area of Level II and Level III urban flooding under the different designed rainstorms, see Figure 9 and Table 7. Under the same rainfall recurrence period, the Level II and Level III inundation area under the modern land-use scenario is the highest.

Figure 9.
(a) level II and (b) level III inundation area.

Table 7.
Inundation area at level II and level III.
Compared with the ancient land-use situation, the level II and level III inundation area in the modern land-use scenario increased greatly. Under the 10-year return period rainfall condition, compared with the Qing Dynasty, it increased by 85.42% and 133.33% respectively. Under the 100-year return period rainfall condition, the level II and level III inundation area in the modern land-use scenario increased by 40.37% compared with that in the Ming Dynasty.
Under the scenario of 10-, 20-, and 50-year rainstorm recurrence periods, the inundation area in the Qing Dynasty and the Ming Dynasty was largely the same (Figure 9). However, under the scenario of the 100-year rainstorm recurrence period, the inundation area of the Qing Dynasty was far greater than that of the Ming Dynasty.
3.2.4. Maximum Inundation Depth
Flo-2D Mapper is a post-processing program for the simulation results of Flo-2D. Through this program, the change process of inundation depth of each cell in the study area can be obtained. Because there are 136,800 cells in the study area, there are too many cells to show the inundation process one by one. Therefore, the cell with the largest peak inundation depth in the model simulation results under each scenario was selected for analysis (Table 8).

Table 8.
Maximum inundation depth under different recurrence periods and land-use scenarios.
As can be seen from Figure 10, when the recurrence period is 10 and 20 years, the modern land-use scenario takes the least time to reach the peak inundation depth, followed by the land-use scenario of the Ming Dynasty, and finally that of the Qing Dynasty. With a rainstorm recurrence period of 50 and 100 years, the land-use scenario of the Ming Dynasty reached the peak inundation depth first, but the land-use scenario of the Qing Dynasty have the deepest inundation.

Figure 10.
Variation process of the inundation depth of the maximum water accumulation point in (a) 10-year recurrence period; (b) 20-year recurrence period; (c) 50-year recurrence period; (d) 100-year recurrence period.
4. Discussion
4.1. Influencing Factors of Land-Use Change
According to Table 3 and Table 4, and Figure 6, it can be seen that from 1582 to 2017, urban green space has shown a trend of first decreasing and then increasing. The reduction of urban green space from 1582 to 1766 was mainly due to the emphasis on military affairs in Xi’an City in the Qing Dynasty, which led to the demolition of many gardens to build places for military training. The increase in urban green space from 1766 to 2017 was due to the need for modern urban landscapes and windbreaks and sand fixation.
The trend in roads in the study area from 1582 to 2017 was that they first increased and then decreased. Due to the continuous improvement of the road traffic network in Xi’an City in the Qing Dynasty, the area occupied by roads increased slightly compared with the Ming Dynasty. However, with the urbanization process, the road area in the study area decreased by 24.78% from 1766 to 2017. From Table 4 it can be seen that 1.79 km2 of the reduced road area during the 251 years was converted to construction land.
The area given over to water bodies has been decreasing from 1582 to 2017. In order to meet the water demand in the city, the Longshou Canal and Tongji Canal were excavated in the city of Xi’an in the Ming Dynasty. In addition, there was the moat of Xi’an city wall, the moat of Qin Wangfu, various landscape ponds, etc., which made water bodies of Xi’an city in the Ming Dynasty cover a wider area. The reduction in the area of water bodies in the Qing Dynasty was mainly due to the abandonment of the Longshou Canal and the Tongji Canal, and the demolition and reconstruction of the Ming and Qin Wangfu, which led to the filling of the Wangfu moat. However, for the needs of residents in the city, many springs were dug in the city. With the development of the city, the main source of modern urban water is underground water, so the springs dug in the Qing Dynasty gradually disappeared.
4.2. Influence of Historical Land Use on Urban Flooding
In ancient Xi’an City, only the main road was paved with blue slate, and other roads were basically dirt roads. In the Ming and Qing Dynasties, the impervious area only accounted for 45% and 48% of the whole study area, respectively (Table 9). Under the modern land-use scenario, the impervious area accounts for 81% of the study area. Increased impermeable area makes rainfall infiltration difficult and a large amount of accumulated water results []. In addition to the difference in impervious area, the area of water bodies in the study area is much smaller in the modern scenario than that in ancient times, which greatly reduces the absorption capacity of rainfall runoff in the study area. Therefore, under different rainstorm conditions, the total amount and area of flooding in the study area in the Ming and Qing dynasties were smaller than those in modern times.

Table 9.
Land Use Area Statistics.
Observing the land use maps of the three eras, we can see that the distribution of buildings in the Ming and Qing dynasties is less dense than that of modern times. In addition, in the Ming Dynasty, the distribution of buildings was more concentrated, and the density was less than that of the Qing Dynasty. According to previous studies [,], the surface confluence time of rainwater will increase with the increase in building density. According to this point of view, as the building area and density in the land use situation of the Ming Dynasty in this study were the smallest, this period should reach the peak of submergence first. But compared with ancient times, the underlying surface has changed greatly in modern times. Modern roads and building land are almost completely impermeable surfaces, while in the Ming and Qing dynasties only the main roads had a hardened surface. A hardened road surface has less roughness. A more hardened road surface is certainly more conducive to rainwater pooling []. Therefore, the inundation depth of modern land use is the quickest to reach a peak under the rainfall scenarios of 10- and 20-year return periods. However, under the rainfall conditions of 50- and 100-year return periods, due to the increase in rainfall intensity, the influence of roughness on catchment time was no longer significant, so the flood peak was reached first under the land-use conditions of the Ming Dynasty.
5. Conclusions
Based on the PLUR land use reconstruction program, this study reconstructs the land-use classification of the Ming and Qing dynasties within the Ming city wall of Xi’an. Then, the FLO-2D model was used to simulate urban flooding under four designed rainstorm conditions under different land-use scenarios. The main conclusions are as follows:
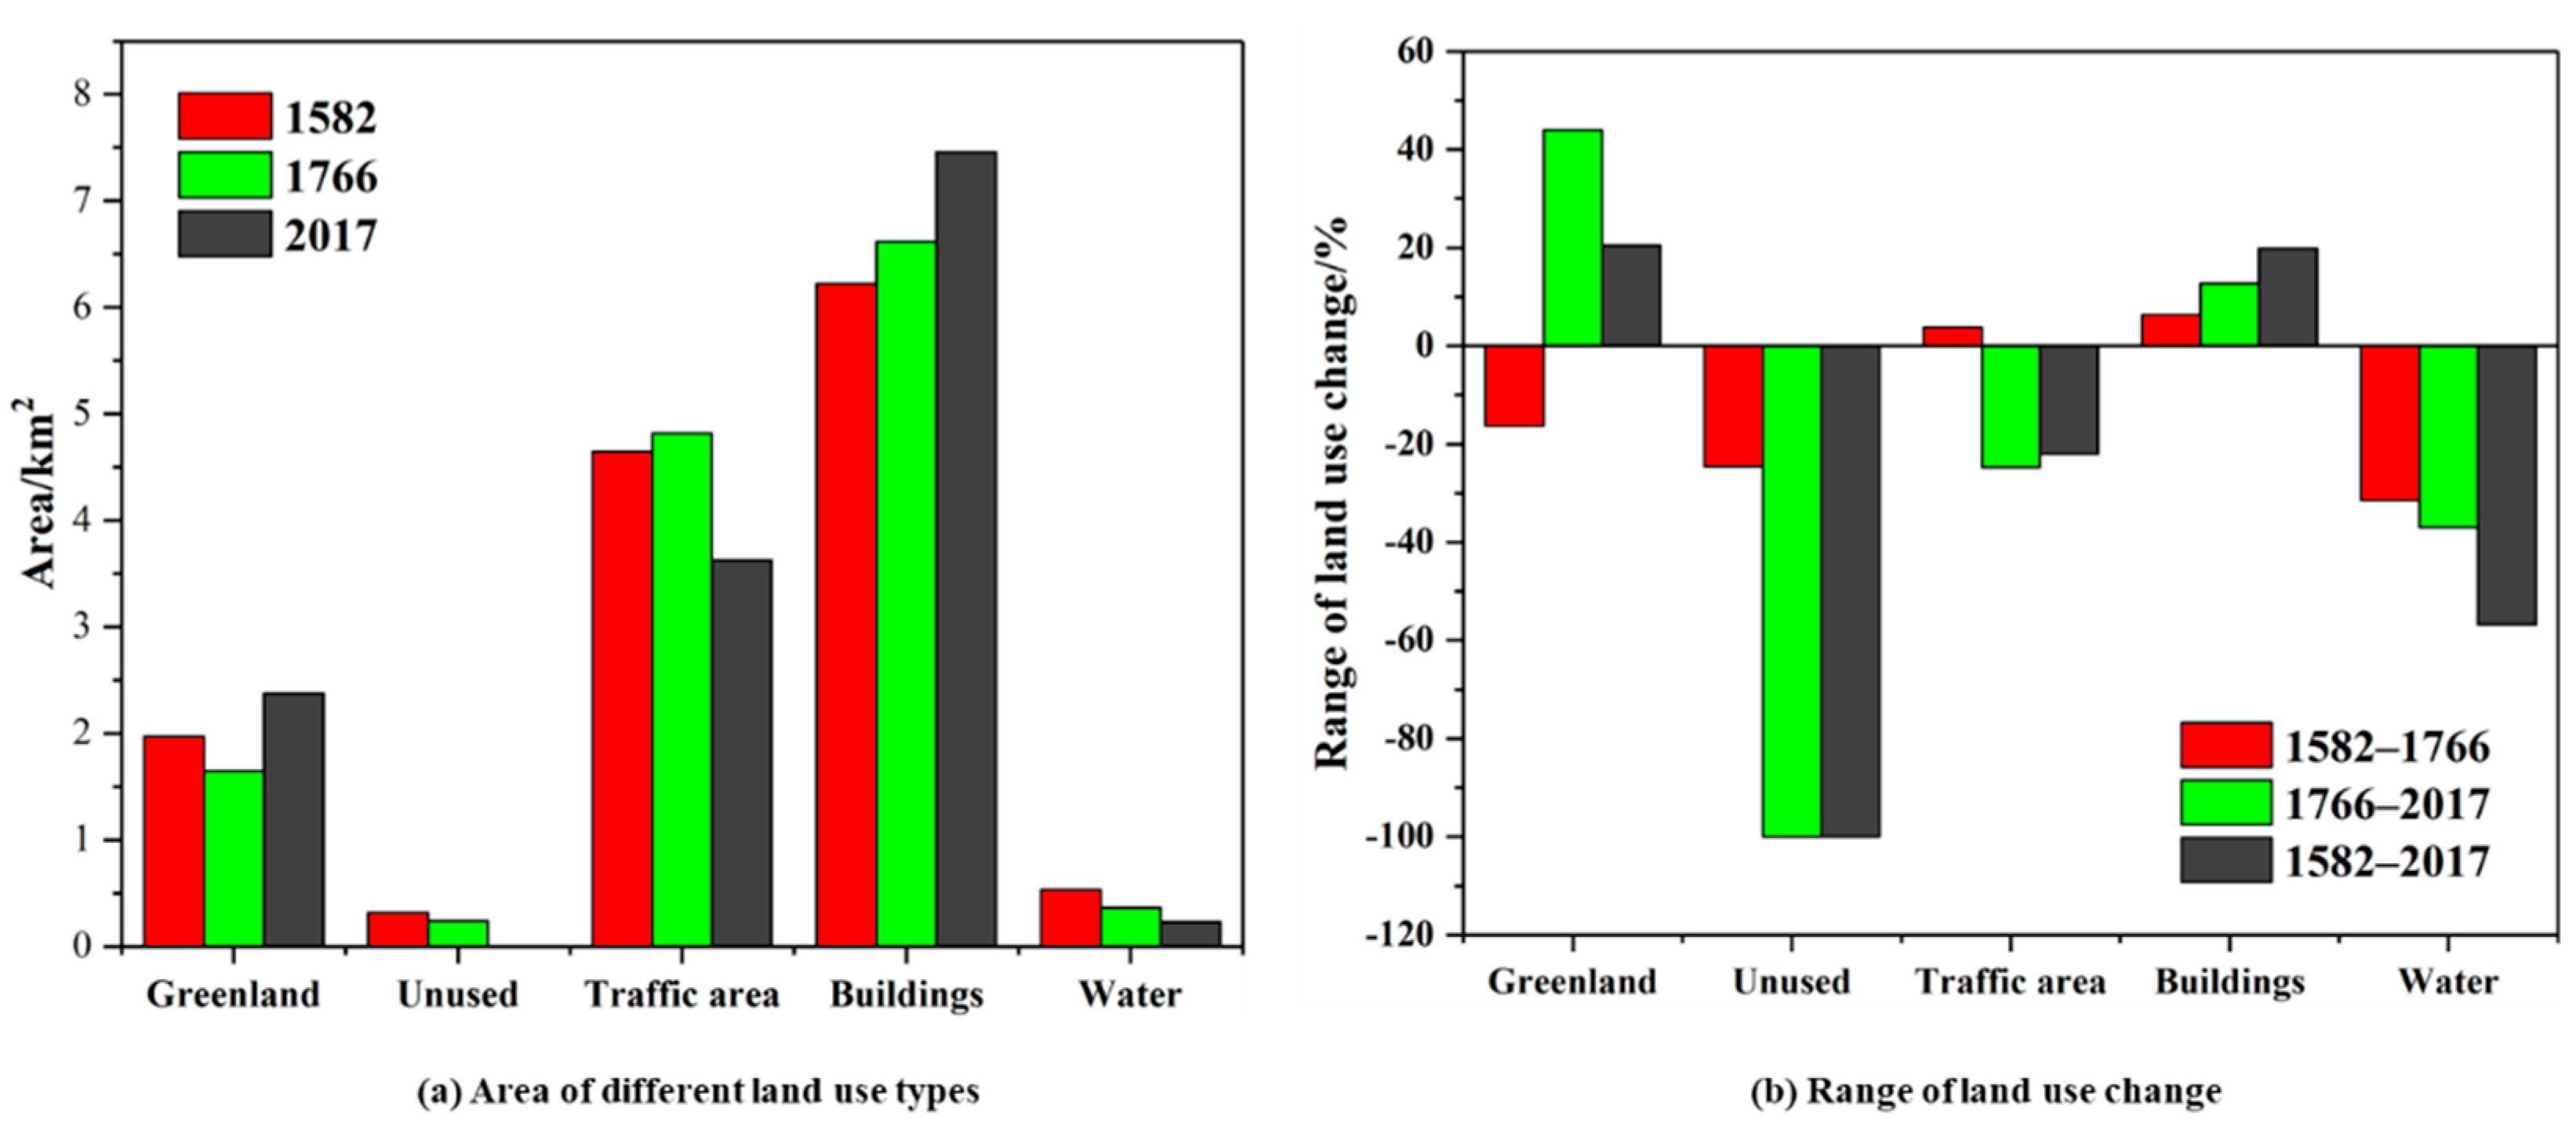
(1) Combined with the modern land-use situation in the study area, the urban construction land area showed a trend of increasing across the 435 years of the study, while the area of unused land and that of water bodies were continuously decreasing. By 2017, there was no unused land in the study area. Urbanization is the main factor leading to the change in land use within the Ming city wall of Xi’an.
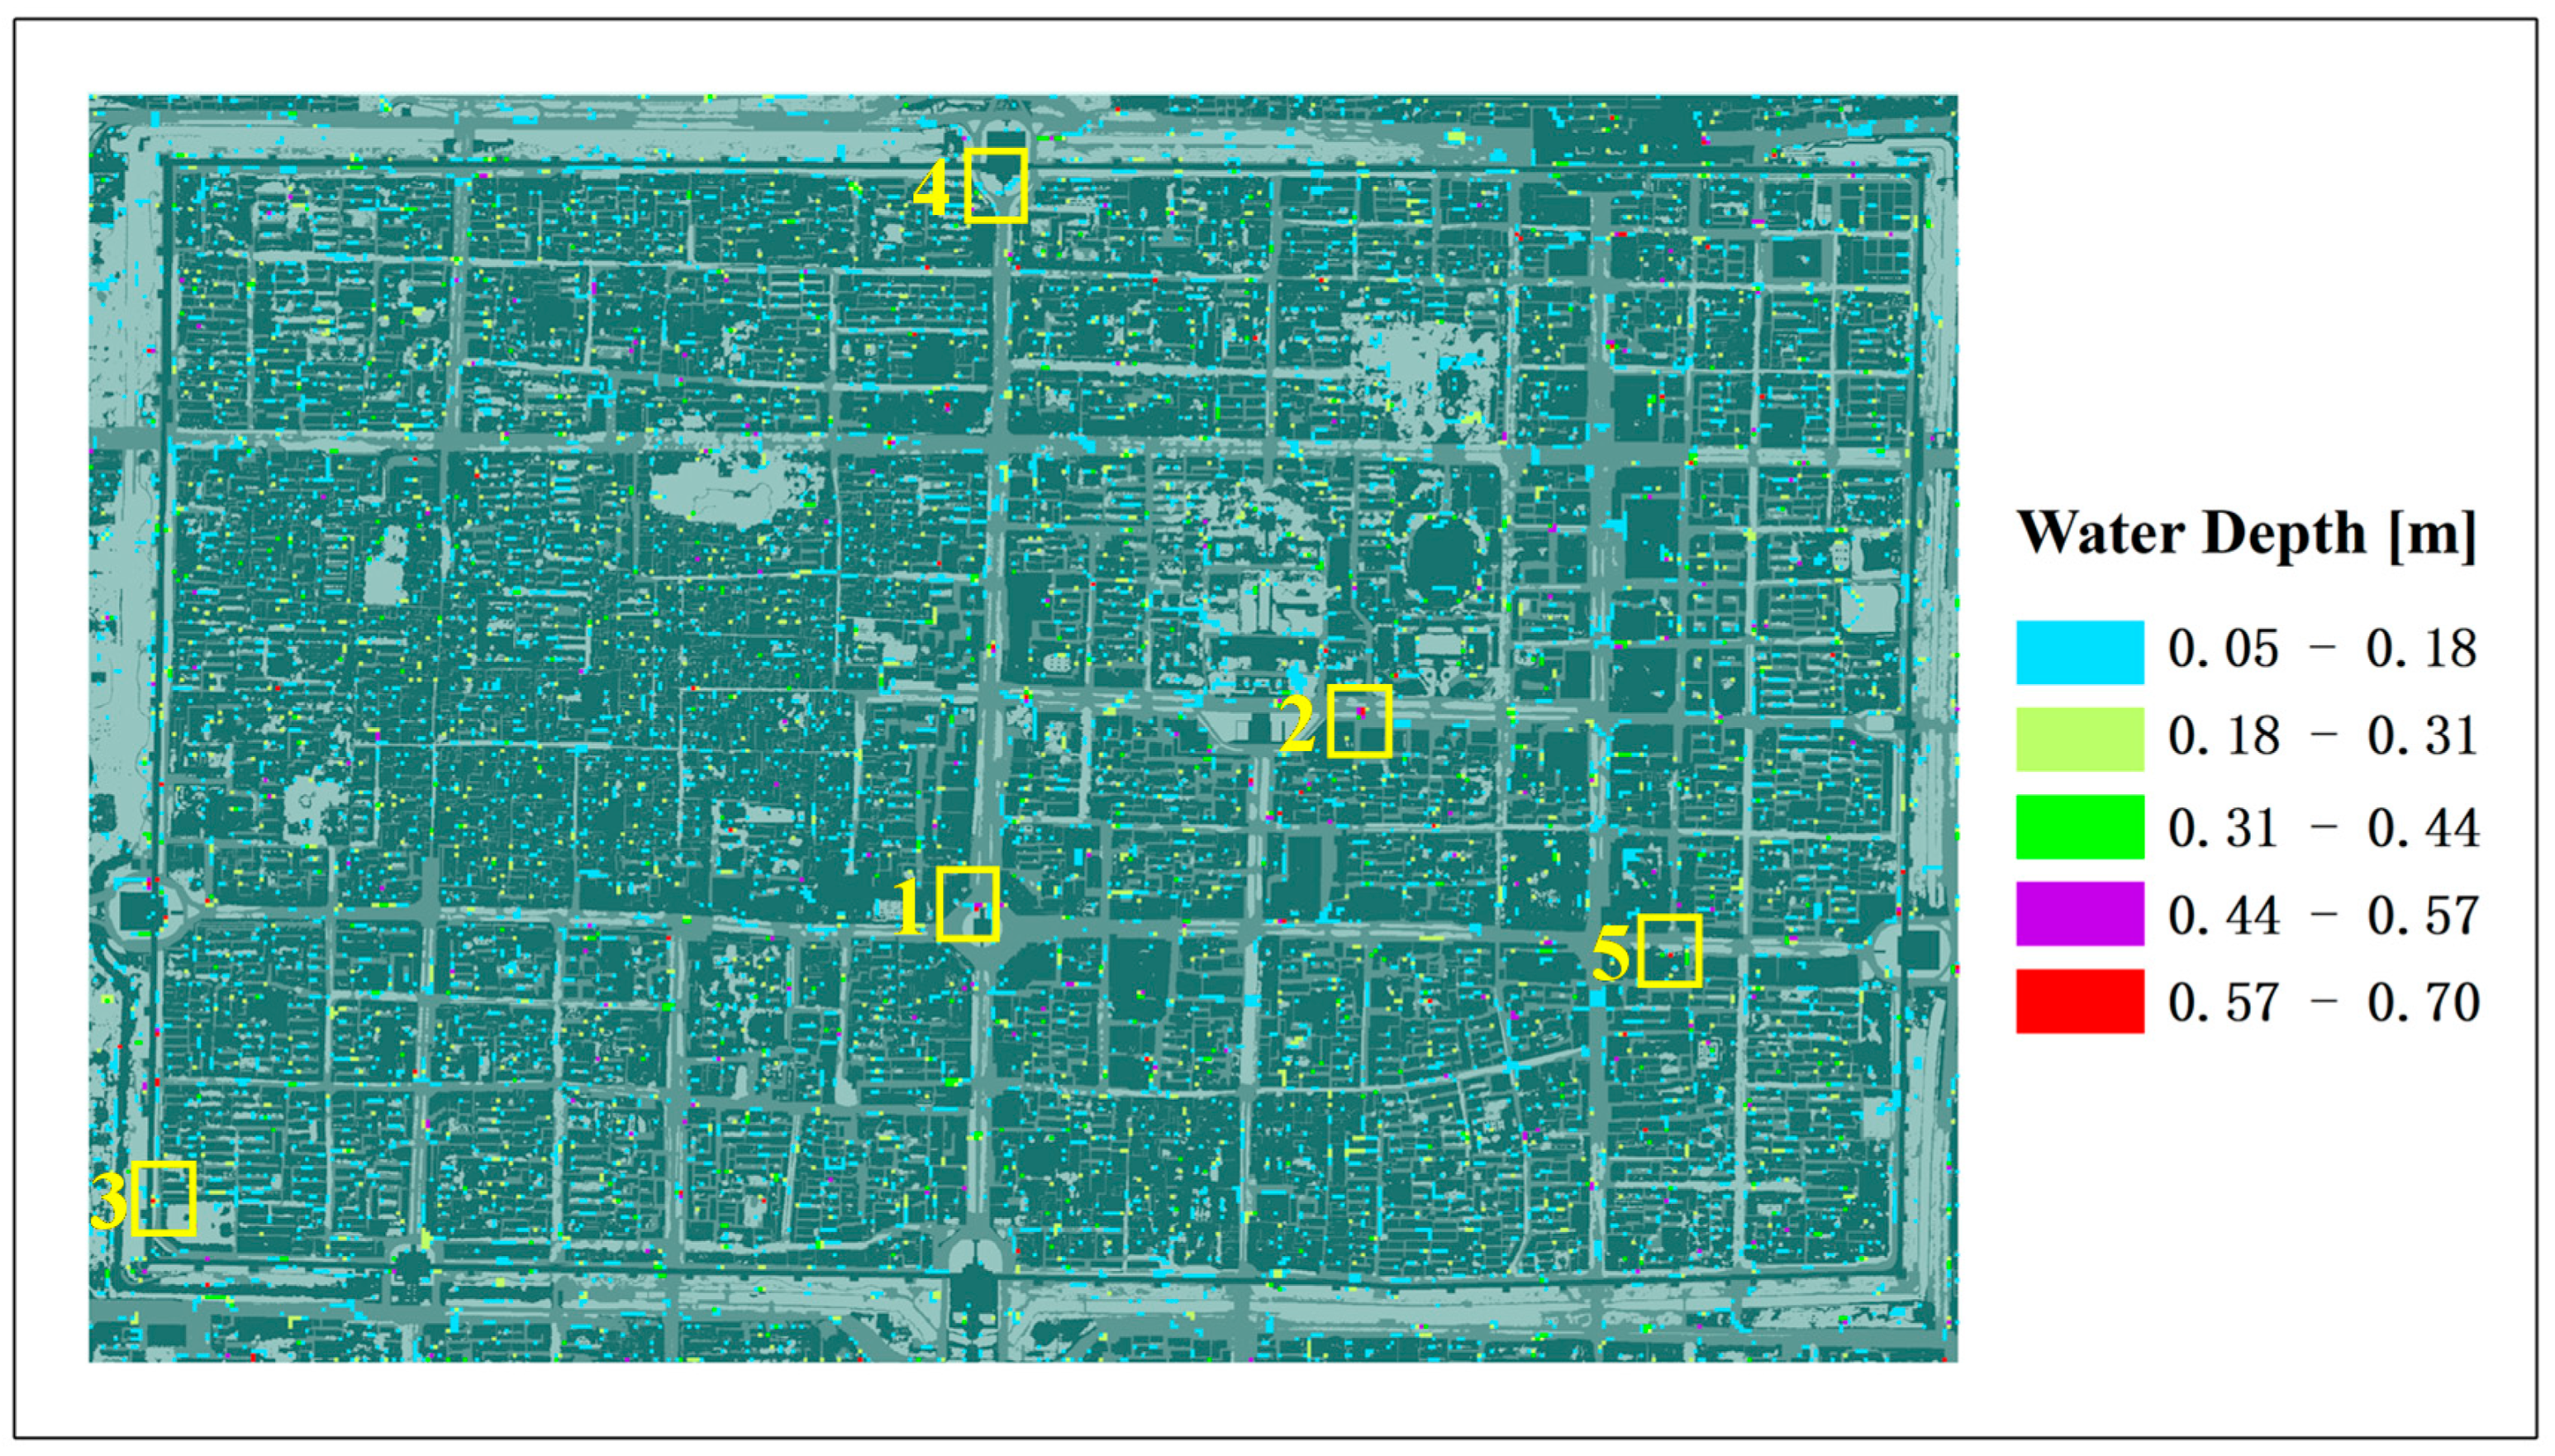
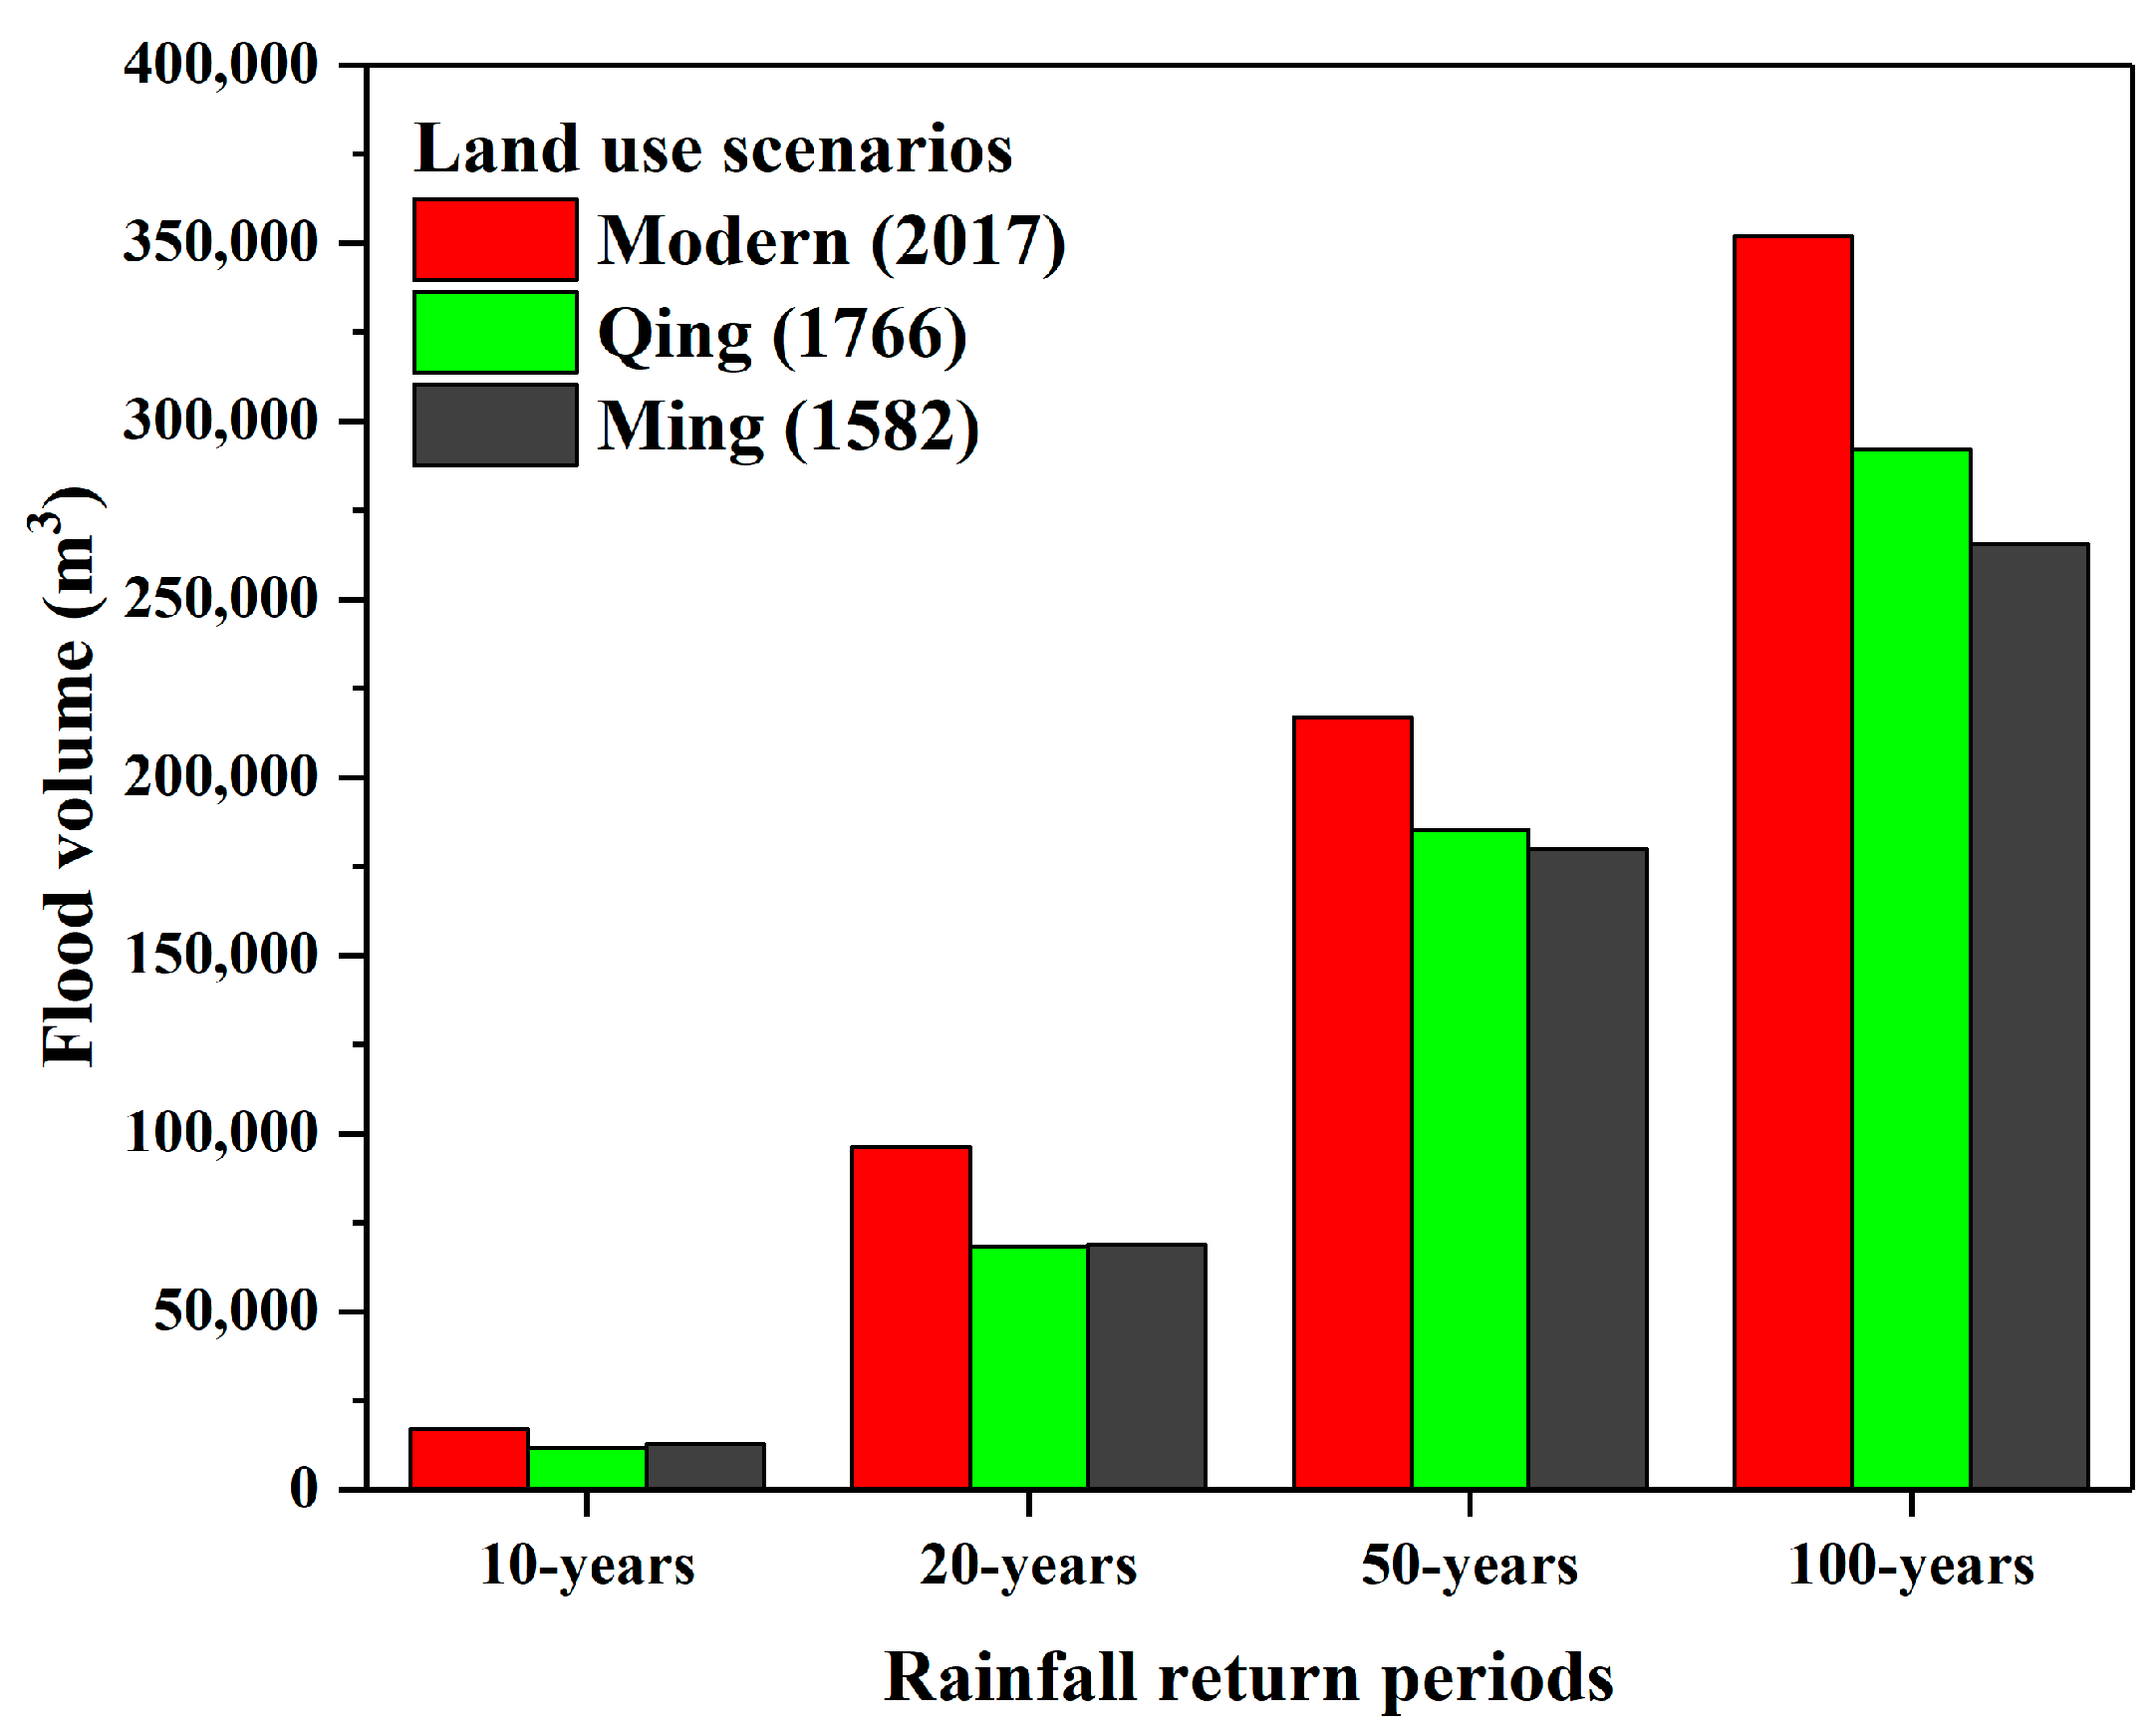
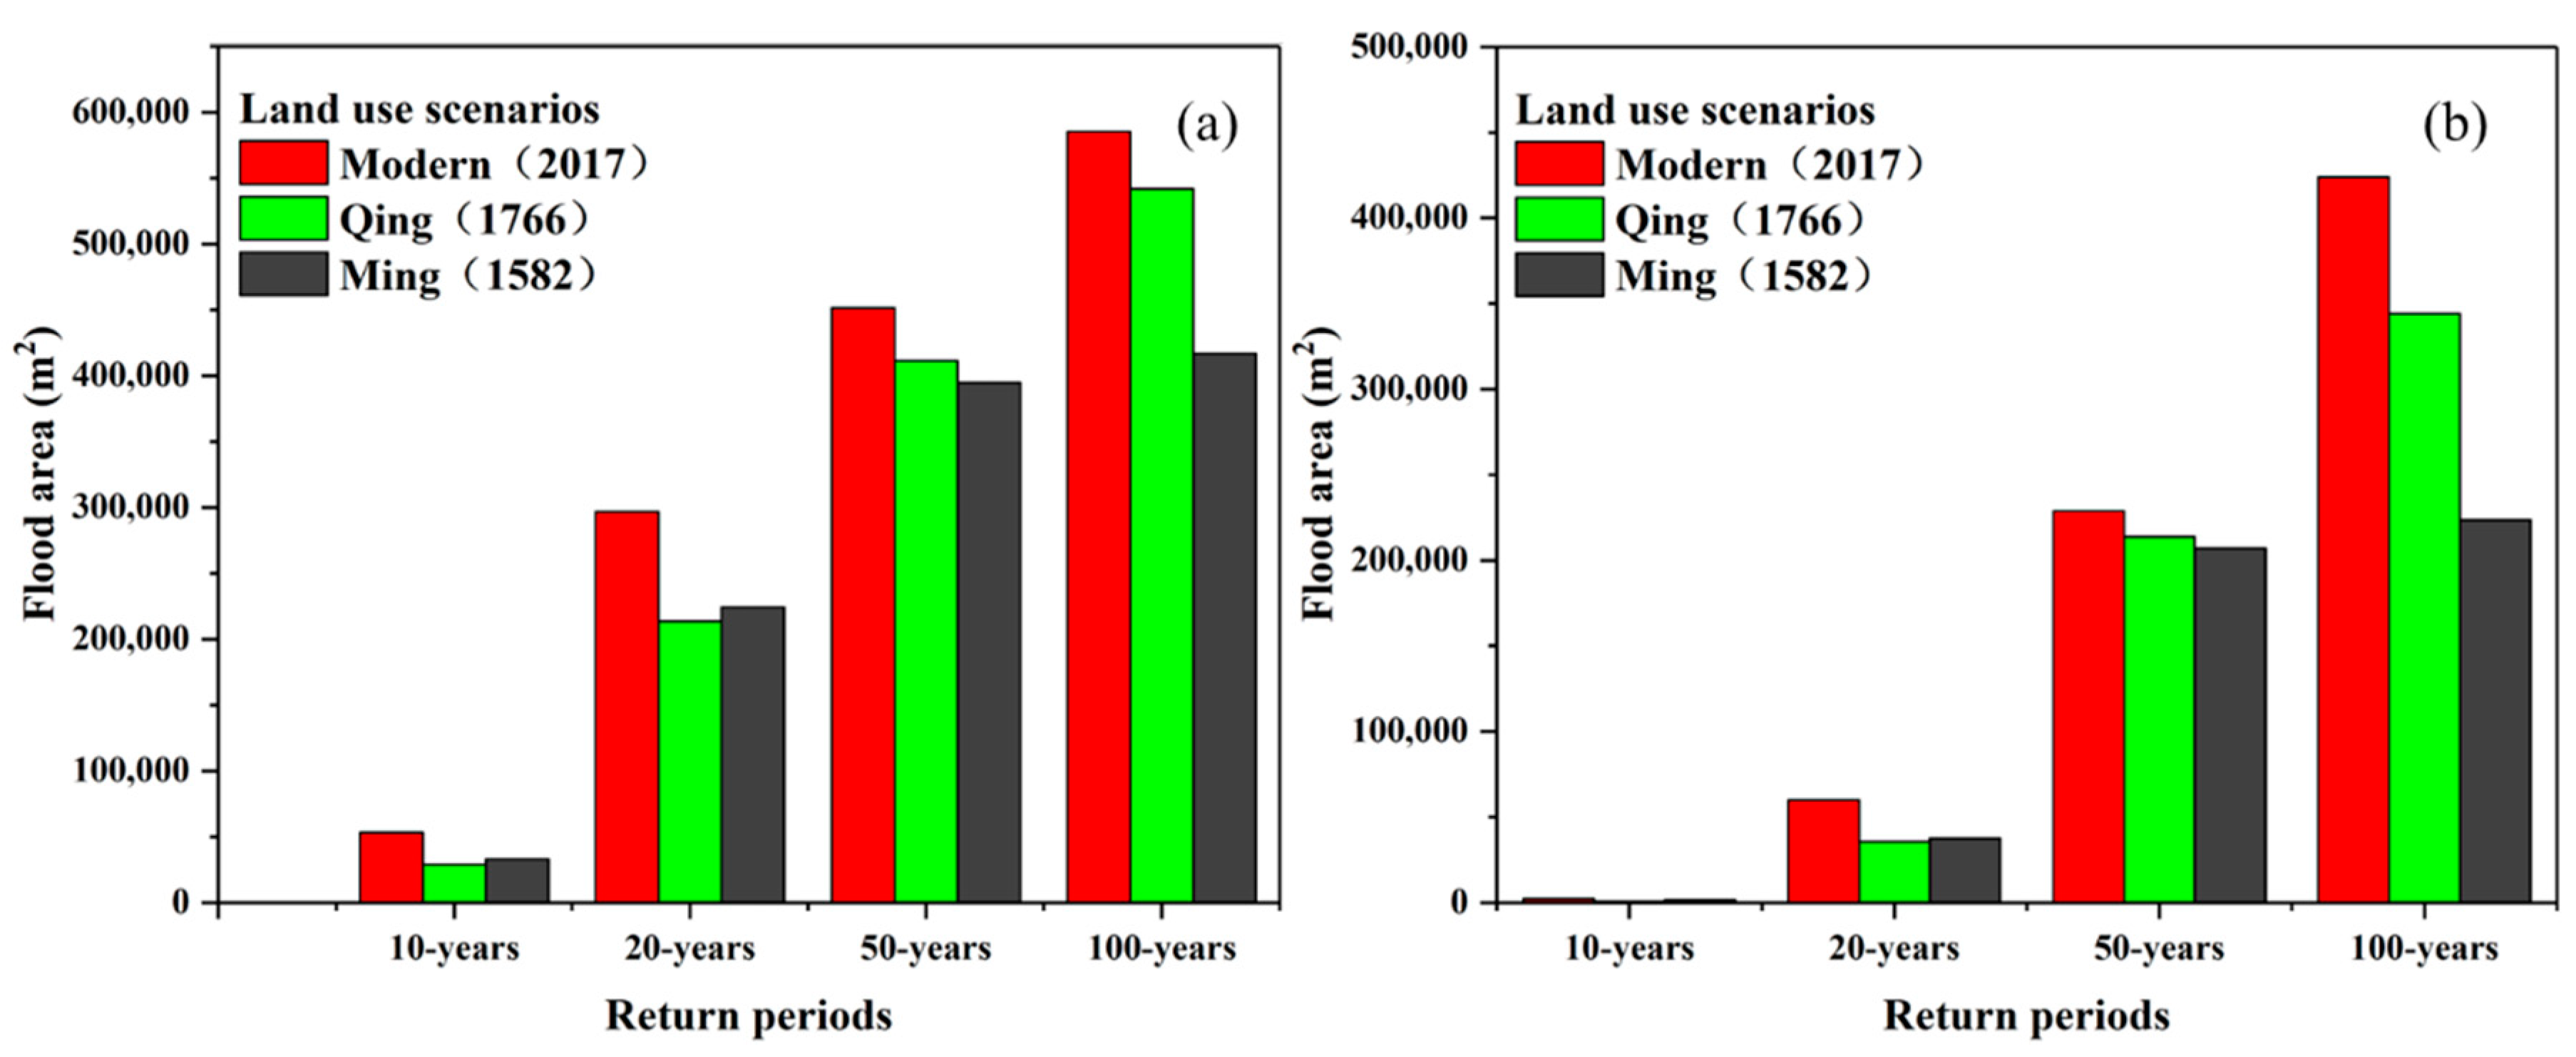
(2) The flooding in the modern land-use scenario is the most serious. Under the four rainfall return periods, the flood volume and flooded area of the modern land-use scenarios are at a maximum.
(3) The increase in impervious area, the decrease in water bodies, and the increasing density of buildings are the main reasons for worsening urban flooding.
In the future flood control work in the study area, it is necessary to comprehensively consider increasing the proportion of permeable surface area, increasing urban water bodies, improving the design standard of the underground drainage network, and determining the most suitable flood control policy to deal with urban flooding.
Author Contributions
Conceptualization, S.W. and P.L.; methodology, S.W. and C.X.; software, Z.C.; validation, W.Z., S.W. and Z.C.; formal analysis, P.L.; investigation, S.W.; resources, P.L.; data curation, S.W.; writing—original draft preparation, S.W.; writing—review and editing, C.X. and S.L.; visualization, S.W.; supervision, P.L.; project administration, P.L.; funding acquisition, P.L. All authors have read and agreed to the published version of the manuscript.
Funding
This research was funded by the National Key R&D Program of China (2018YFE0103800), the International Education Research Program of Chang’an University (300108221102), a General Project of Shaanxi Provincial Key R&D Program—Social Development Field (2021SF-454), the Yinshanbeilu Grassland Eco-hydrology National Observation and Research Station, China Institute of Water Resources and Hydropower Research, Beijing 100038, China (Grant NO.YSS2022004), and a China National Social Science Fund Project (20XKS006).
Acknowledgments
I am grateful for the scholarship provided by China Scholarship Council (Grant No.: Liujinmei [2022] No. 45; Liujinxuan [2022] No. 133). We also appreciate the reviewers for providing valuable comments.
Conflicts of Interest
No conflict of interest exists in the submission of this manuscript, and the manuscript is approved by all authors for publication. I would like to declare on behalf of my co-authors that the work described was original research that has not been published previously, and is not under consideration for publication elsewhere, in whole or in part. All the authors listed have approved the manuscript that is enclosed.
References
- Vanwalleghem, T.; Gómez, J.; Amate, J.I.; González, d.; Vanderlinden, K.; Guzmán, G.; Laguna, A.; Giráldez, J. Impact of historical land use and soil management change on soil erosion and agricultural sustainability during the Anthropocene. Anthropocene 2017, 17, 13–29. [Google Scholar] [CrossRef]
- Cui, Q.Y.; Gaillard, M.J.; Lemdahl, G.; Stenberg, L.; Sugita, S.; Zernova, G. Historical land-use and landscape change in southern Sweden and implications for present and future biodiversity. Ecol. Evol. 2014, 4, 3555–3570. [Google Scholar] [CrossRef] [PubMed]
- Bardgett, R.D.; Freeman, C.; Ostle, N.J. Microbial contributions to climate change through carbon cycle feedbacks. Isme J. 2008, 2, 805–814. [Google Scholar] [CrossRef]
- Bright, R.M.; Davin, E.; O’Halloran, T.; Pongratz, J.; Cescatti, A. Local temperature response to land cover and management change driven by non-radiativeprocesses. Nat. Clim. Chang. 2017, 7, 296–302. [Google Scholar] [CrossRef]
- Geist, H. Land-Use and Land-Cover Change: Local Processes and Global Impacts; Springer: Berlin/Heidelberg, Germany, 2006. [Google Scholar]
- Wang, S.; Cao, Z.; Luo, P.; Zhu, W. Spatiotemporal Variations and Climatological Trends in Precipitation Indices in Shaanxi Province, China. Atmos 2022, 13, 744. [Google Scholar] [CrossRef]
- Luo, P.; Zheng, Y.; Wang, Y.; Zhang, S.; Yu, W.; Zhu, X.; Huo, A.; Wang, Z.; He, B.; Nover, D. Comparative Assessment of Sponge City Constructing in Public Awareness, Xi’an, China. Sustainability 2022, 14, 11653. [Google Scholar] [CrossRef]
- Wu, J. Landscape sustainability science: Ecosystem services and human well-being in changing landscapes. Landsc. Ecol. 2013, 28, 999–1023. [Google Scholar] [CrossRef]
- Wickham, J.D.; Wade, T.G.; Riitters, K.H. Comparison of cropland and forest surface temperatures across the conterminous United States. Agric. For. Meteorol. 2012, 166–167, 137–143. [Google Scholar] [CrossRef]
- Luo, P.; Luo, M.; Li, F.; Qi, X.; Huo, A.; Wang, Z.; He, B.; Takara, K.; Nover, D. Urban flood numerical simulation: Research, methods and future perspectives. Environ. Model. Softw. 2022, 156, 105478. [Google Scholar] [CrossRef]
- Turner, B.L.I.; Skole, D.L.; Sanderson, S.; Fischer, G.; Fresco, L.; Leemans, R. Land-use and land-cover change. Science/Research plan. Glob. Chang. Rep. 1995, 43, 669–679. [Google Scholar]
- Luo, P.; Liu, L.; Wang, S.; Ren, B.; He, B.; Nover, D. Influence assessment of new Inner Tube Porous Brick with absorbent concrete on urban floods control. Case Stud. Constr. Mater. 2022, 17, e01236. [Google Scholar] [CrossRef]
- Luo, P.; Xu, C.; Kang, S.; Huo, A.; Lyu, J.; Zhou, M.; Nover, D. Heavy metals in water and surface sediments of the Fenghe River Basin, China: Assessment and source analysis. Water Sci. Technol. 2021, 84, 3072–3090. [Google Scholar] [CrossRef] [PubMed]
- Dearing, J.A.; Braimoh, A.K.; Reenberg, A.; Turner, B.L.; Sander, V. Complex Land Systems: The Need for Long Time Perspectives to Assess their Future. Ecol. Soc. 2010, 15, 21. [Google Scholar] [CrossRef]
- Miao, L.; Zhu, F.; Sun, Z.; Moore, J.C.; Cui, X. China’s land-use changes during the past 300 years: A historical perspective. Int. J. Environ. Res. Public Health 2016, 13, 847. [Google Scholar] [CrossRef]
- Zhu, W.; Wang, S.; Luo, P.; Zha, X.; Cao, Z.; Lyu, J.; Zhou, M.; He, B.; Nover, D. A Quantitative Analysis of the Influence of Temperature Change on the Extreme Precipitation. Atmos 2022, 13, 612. [Google Scholar] [CrossRef]
- Zhu, Y.; Luo, P.; Zhang, S.; Sun, B. Spatiotemporal analysis of hydrological variations and their impacts on vegetation in semiarid areas from multiple satellite data. Remote Sens. 2020, 12, 4177. [Google Scholar] [CrossRef]
- Goldewijk, K.K.; Beusen, A.; Drecht, G.V.; Vos, M.D. The HYDE 3.1 spatially explicit database of human-induced global land-use change over the past 12,000 years. Glob. Ecol. Biogeogr. 2015, 20, 73–86. [Google Scholar] [CrossRef]
- Goldewijk, K.K.; Verburg, P.H. Uncertainties in global-scale reconstructions of historical land use: An illustration using the HYDE data set. Landsc. Ecol. 2013, 28, 861–877. [Google Scholar] [CrossRef]
- Ramankutty, N.; Foley, J.A. Estimating historical changes in global land cover: Croplands from 1700 to 1992. Glob. Biogeochem. Cycles 1999, 13, 997–1027. [Google Scholar] [CrossRef]
- Wang, Z.; Luo, P.; Zha, X.; Xu, C.; Kang, S.; Zhou, M.; Nover, D.; Wang, Y. Overview assessment of risk evaluation and treatment technologies for heavy metal pollution of water and soil. J. Clean. Prod. 2022, 379, 134043. [Google Scholar] [CrossRef]
- Bai, H.; Li, Z.; Guo, H.; Chen, H.; Luo, P. Urban Green Space Planning Based on Remote Sensing and Geographic Information Systems. Remote Sens. 2022, 14, 4213. [Google Scholar] [CrossRef]
- Ciais, P.; Gervois, S.; Vuichard, N.; Piao, S.L.; Viovy, N. Effects of land use change and management on the European cropland carbon balance. Glob. Chang. Biol. 2011, 17, 320–338. [Google Scholar] [CrossRef]
- Zhu, F.; Cui, X.; Miao, L. China’s Spatially-explicit Historical Land-use Data and Its Reconstruction Methodology. Prog. Geogr. 2012, 31, 1563–1573. [Google Scholar]
- Sohl, T.; Reker, R.; Bouchard, M.; Sayler, K.; Dornbierer, J.; Wika, S.; Quenzer, R.; Friesz, A. Modeled historical land use and land cover for the conterminous United States. J. Land Use Sci. 2016, 11, 476–499. [Google Scholar] [CrossRef]
- Meiyappan, P.; Jain, A.K. Three distinct global estimates of historical land-cover change and land-use conversions for over 200 years. Front. Earth Sci. 2012, 6, 122–139. [Google Scholar] [CrossRef]
- Fang, X.; Zhao, W.; Zhang, C.; Zhang, D.; Ye, Y. Methodology for credibility assessment of historical global LUCC datasets. Sci. China Earth Sci. 2020, 63, 1013–1025. [Google Scholar] [CrossRef]
- Luo, P.; Takara, K.; Apip; He, B.; Nover, D. Reconstruction assessment of historical land use: A case study in the Kamo River basin, Kyoto, Japan. Comput. Geosci. 2014, 63, 106–115. [Google Scholar] [CrossRef]
- Li, P.; Li, H.; Yang, G.; Zhang, Q.; Diao, Y. Assessing the hydrologic impacts of land use change in the Taihu Lake Basin of China from 1985 to 2010. Water 2018, 10, 1512. [Google Scholar] [CrossRef]
- Deng, H.; Pepin, N.; Chen, Y.; Guo, B.; Zhang, S.; Zhang, Y.; Chen, X.; Gao, L.; Meibing, L.; Ying, C. Dynamics of Diurnal Precipitation Differences and Their Spatial Variations in China. J. Appl. Meteorol. Climatol. 2022, 61, 1015–1027. [Google Scholar] [CrossRef]
- Dwarakish, G.; Ganasri, B. Impact of land use change on hydrological systems: A review of current modeling approaches. Cogent Geosci. 2015, 1, 1115691. [Google Scholar] [CrossRef]
- Zhang, L.; Nan, Z.; Xu, Y.; Li, S. Hydrological impacts of land use change and climate variability in the headwater region of the Heihe River Basin, Northwest China. PLoS ONE 2016, 11, e0158394. [Google Scholar] [CrossRef] [PubMed]
- Jaiswal, M.K.; Amin, N. Impact of land-use land cover dynamics on runoff in Panchnoi River basin, North East India. GeoScape 2021, 15, 19–29. [Google Scholar] [CrossRef]
- Yin, J.; He, F.; Xiong, Y.J.; Qiu, G.Y. Effects of land use/land cover and climate changes on surface runoff in a semi-humid and semi-arid transition zone in northwest China. Hydrol. Earth Syst. Sci. 2017, 21, 183–196. [Google Scholar] [CrossRef]
- He, Y.; Lin, K.; Chen, X. Effect of land use and climate change on runoff in the Dongjiang Basin of South China. Math. Probl. Eng. 2013, 2013, 471429. [Google Scholar] [CrossRef]
- Cao, Z.; Wang, S.; Luo, P.; Xie, D.; Zhu, W. Watershed Ecohydrological Processes in a Changing Environment: Opportunities and Challenges. Water 2022, 14, 1502. [Google Scholar] [CrossRef]
- Duan, W.; Zou, S.; Christidis, N.; Schaller, N.; Chen, Y.; Sahu, N.; Li, Z.; Fang, G.; Zhou, B. Changes in temporal inequality of precipitation extremes over China due to anthropogenic forcings. NPJ Clim. Atmos. Sci. 2022, 5, 33. [Google Scholar] [CrossRef]
- Glavan, M.; Miličić, V.; Pintar, M. Finding options to improve catchment water quality—Lessons learned from historical land use situations in a Mediterranean catchment in Slovenia. Ecol. Model. 2013, 261, 58–73. [Google Scholar] [CrossRef]
- Grajski, K.A.; Breiman, L.; Prisco, G.V.D.; Freeman, W.J. Classification of EEG Spatial Patterns with a Tree-Structured Methodology: CART. IEEE Trans. Biomed. Eng. 1987, 33, 1076–1086. [Google Scholar] [CrossRef]
- Erena, S.H.; Worku, H.; De Paola, F. Flood hazard mapping using FLO-2D and local management strategies of Dire Dawa city, Ethiopia. J. Hydrol. Reg. Stud. 2018, 19, 224–239. [Google Scholar] [CrossRef]
- Hou, J.; Guo, K.; Wang, Z.; Jing, H.; Li, D. Numerical simulation of design storm pattern effects on urban flood inundation. Adv. Water Sci. 2017, 28, 820–828. [Google Scholar]
- Lu, J.S.; Cheng, Y.; Wang, S.P.; Zheng, Q.; Du, R. Research on Simplified Calculating Program for Rainstorm Intensity Formula. In Proceedings of the International Conference on Intelligent Computation and Industrial Application (ICIA2011), Shenzhen, China, 6–8 June 2011; pp. 245–248. [Google Scholar]
- Bi, X.; Chen, L.; Yao, D. Analysis on urban rainstorm pattern of Xi’an. J. Anhui Agric.-Sci. 2015, 43, 295–297. [Google Scholar]
- Dai, J.; Liu, Z.; Lu, S. Risk-assessment of city waterlogging based on numerical simulation—Case study on urban center of Suzhou. China Water Resour. 2015, 13, 20–23. [Google Scholar]
- Guan, D.; Li, H.; Inohae, T.; Su, W.; Nagaie, T.; Hokao, K. Modeling urban land use change by the integration of cellular automaton and Markov model. Ecol. Model. 2011, 222, 3761–3772. [Google Scholar] [CrossRef]
- Isidoro, J.M.; de Lima, J.L.; Leandro, J. Influence of wind-driven rain on the rainfall-runoff process for urban areas: Scale model of high-rise buildings. Urban Water J. 2012, 9, 199–210. [Google Scholar] [CrossRef]
- Sjöman, J.D.; Gill, S.E. Residential runoff–The role of spatial density and surface cover, with a case study in the Höjeå river catchment, southern Sweden. Urban For. Urban Green. 2014, 13, 304–314. [Google Scholar] [CrossRef]
- Rai, R.; Upadhyay, A.; Singh, V. Effect of variable roughness on runoff. J. Hydrol. 2010, 382, 115–127. [Google Scholar] [CrossRef]
Publisher’s Note: MDPI stays neutral with regard to jurisdictional claims in published maps and institutional affiliations. |
© 2022 by the authors. Licensee MDPI, Basel, Switzerland. This article is an open access article distributed under the terms and conditions of the Creative Commons Attribution (CC BY) license (https://creativecommons.org/licenses/by/4.0/).