Article

Research on Sediment Discharge Variations and Driving Factors in the Tarim River Basin

1
State Key Laboratory of Desert and Oasis Ecology, Xinjiang Institute of Ecology and Geography, Chinese Academy of Sciences, Urumqi 830011, China
2
Akesu National Station of Observation and Research for Oasis Agro-Ecosystem, Akesu 843017, China
3
School of Geographical Sciences, Shanxi Normal University, Taiyuan 030031, China
*
Author to whom correspondence should be addressed.
These authors contributed equally to this work.
Remote Sens. 2022, 14(22), 5848; https://doi.org/10.3390/rs14225848
Submission received: 3 October 2022 / Revised: 3 November 2022 / Accepted: 12 November 2022 / Published: 18 November 2022
(This article belongs to the Special Issue Remote Sensing in Natural Resource and Water Environment)

Abstract

:
Sediment discharge is widely regarded as a critical indicator of soil and water loss. The Mann–Kendall (M-K) test was applied to analyze the trends of temperature, precipitation, annual runoff, annual sediment discharge (ASD), and snow cover area proportion (SCAP). Sensitivity coefficient and contribution rate were adopted to assess the sensitivity of ASD to driving factors, and the contribution of driving factors to ASD. The results showed: (1) ASD of the Kaidu River and the Aksu River originating from Tien Shan decreased at rates of 3.8503 × 10⁷ kg per year (p < 0.01) and 47.198 × 10⁷ kg per year, respectively, from 2001 to 2019. The ASD there was also found to be more sensitive to SCAP changes in autumn and winter, respectively. (2) ASD of the Yarkand River and the Yulong Kashgar River originating from the Karakoram Mountains increased at rates of 21.807 × 10⁷ kg per year and 27.774 × 10⁷ kg per year, respectively, during 2001–2019. The ASD there was determined to be more sensitive to annual runoff. (3) In terms of contribution rate, except for the Kaidu River, annual runoff of the other three rivers made the largest contribution. (4) In addition, the proportion of glacial-melt water, slope, glacierization and human activities are also possible factors affecting sediment discharge.

1. Introduction

River sediment transport is an essential index to objectively reflect changes of soil and water loss intensity, and constitutes an important topic in global soil and water loss research [1]. Compared with runoff, river sediment transport is more sensitive to changes in climate and surface processes [2]. It is also a main indicator used to quantify land degradation and soil resource reduction, and an essential part of the geochemical cycle [2]. In the context of global climate change, because of the overlapping effects of natural processes and human activities, the runoff and sediment transport of many rivers globally have experienced rapid and dramatic changes [2,3].
Numerous studies have confirmed that regional differences exist in sediment discharge. The reasons for these dissimilarities are manifold, and include those related to human activities, climate, hydrology, policy and land use, in addition to the influence of topography and landform. Based on the simulation of soil erosion and sediment discharge in the East River Basin, it has been found that soil erodibility and topography play a crucial role during soil erosion [1]. This is also the case in the middle reaches of the Yellow River [4] and the Loess Plateau [5]. According to Li et al. [3], 24% of the world’s great rivers are experiencing major changes in water flux and 40% in sediment flux. Furthermore, most of the sediment transport in Asian rivers shows a substantial decreasing trend, while sediment concentration in the Amazon River exhibits an increasing trend [3]. From a comprehensive investigation of eight major rivers on the Qinghai-Tibet Plateau, Zhang et al. [6] reported that runoff and sediment transport of the Yarkand River, the Shule River, the Heihe River, and the Nujiang River increased markedly. In addition, except for the Heihe River, the sediment transport of the other three rivers was highly positively correlated with air temperature. Zhao et al. [7] determined that the future water and sediment change trend was closely related to the Yellow River governance, and increasingly frequent extreme rainfall events make the future situation of water and sediment in the Yellow River increasingly uncertain. In assessing climate impacts, precipitation and temperature are primary drivers of flow and sediment flux in most hydrological models [8]. Indeed, global natural river flow and sediment flux are highly sensitive to human-induced climate change in the 21st century [9].
Chen et al. [10] demonstrated that global warming accelerated the melting of mountain glaciers and snow cover, which manifests as glacier recession, snow cover area shrinkage, and water storage reduction. Watershed hydrology is strongly controlled by the residual snow on the ground in snow-covered areas [11,12,13,14]. Iida et al. [15] estimated that more than 60% of annual suspended sediment loads flowed out during the snow-melting period, and the mean suspended sediment flux during the snowmelt period was 6–7 times that of other periods due to increase of water volume, at a catchment in a coastal region of northern Honshu along the Sea of Japan. Therefore, under the forces of global warming, snow cover area changes will inevitably influence runoff and sediment transport.
Sediment discharge, also known as sediment-transport rate, refers to the amount of sediment moved by a stream in a given period of time measured by dry weight or by volume. The sediment discharge here refers to the suspended mass, which is ubiquitous in aquatic ecosystems and contributes to bottom material composition, water-column turbidity, and chemical constituent transport [16,17]. It is widely regarded as a critical indicator of soil and water loss. Sediment discharge increase is usually accompanied by decreases in soil fertility and grassland degradation, which leads to ecological degradation. In addition, the expanded sediment deposition resulting from increasing sediment discharge may affect reservoir capacity and storage capacity [18], as well as farmland irrigation. Changes in sediment discharge also exert an impact on the safety of water conservancy projects, such as power generation capacity of downstream hydropower stations, safety of embankments, and flood control. Furthermore, it can have a profound impact on surrounding social and economic development. Compared to other rivers in southwest China, rivers in northeast China are characterized by fewer water resources and more sand, with an arid climate and sparse vegetation. Their rivers’ runoff primarily depends on the meltwater of mountains, glaciers, snow, and precipitation [19]. This region is also more sensitive to climate change, e.g., mountain glaciers and snow are melting more rapidly and permafrost activity is more pronounced, in response to climate change. As a direct consequence, the exposed land surface area expands, with soft soil, and sediment discharge is more markedly affected [20]. The source of water of the Tarim River Basin (TRB) is mainly glacial/snow meltwater, accounting for approximately 48.25% of the total water volume [21]. Climate change has an important impact on watershed water resources [22], which will also affect the change of sediment discharge. With the background of global climate change, the variation characteristics and driving factors of sediment discharge in inland river basins in arid areas are different from those in humid areas. At present, in the extant literature, there is an absence of research on the sediment discharge in the headstream area of the TRB, except the Yarkand River. Research on the variations and driving factors of the sediment discharge in this basin is critical to understand the influence of mechanisms of climate change on the sediment discharge in the large inland river basins in arid areas.
In this paper, based on the above-mentioned findings, we took sediment discharge from major hydrologic sites in the TRB in 2001–2019 as the research object. Specifically, we chose the Kaidu River, the Aksu River, the Yarkand River, and the Yulong Kashgar River for investigation. The Mann–Kendall trend was used to test the variation trends of temperature, precipitation, annual runoff, annual sediment discharge (ASD), and snow cover area proportion (SCAP), and linear regression analysis was used to elucidate interannual variation rates of the above elements. Runoff, precipitation, air temperature, and SCAP were introduced to explore the correlation between temporal and spatial differences of sediment discharge, as well as any influencing factors. Sensitivity analysis and contribution rate were adopted to quantitatively describe the relationship between ASD and driving factors.

2. Material and Methods
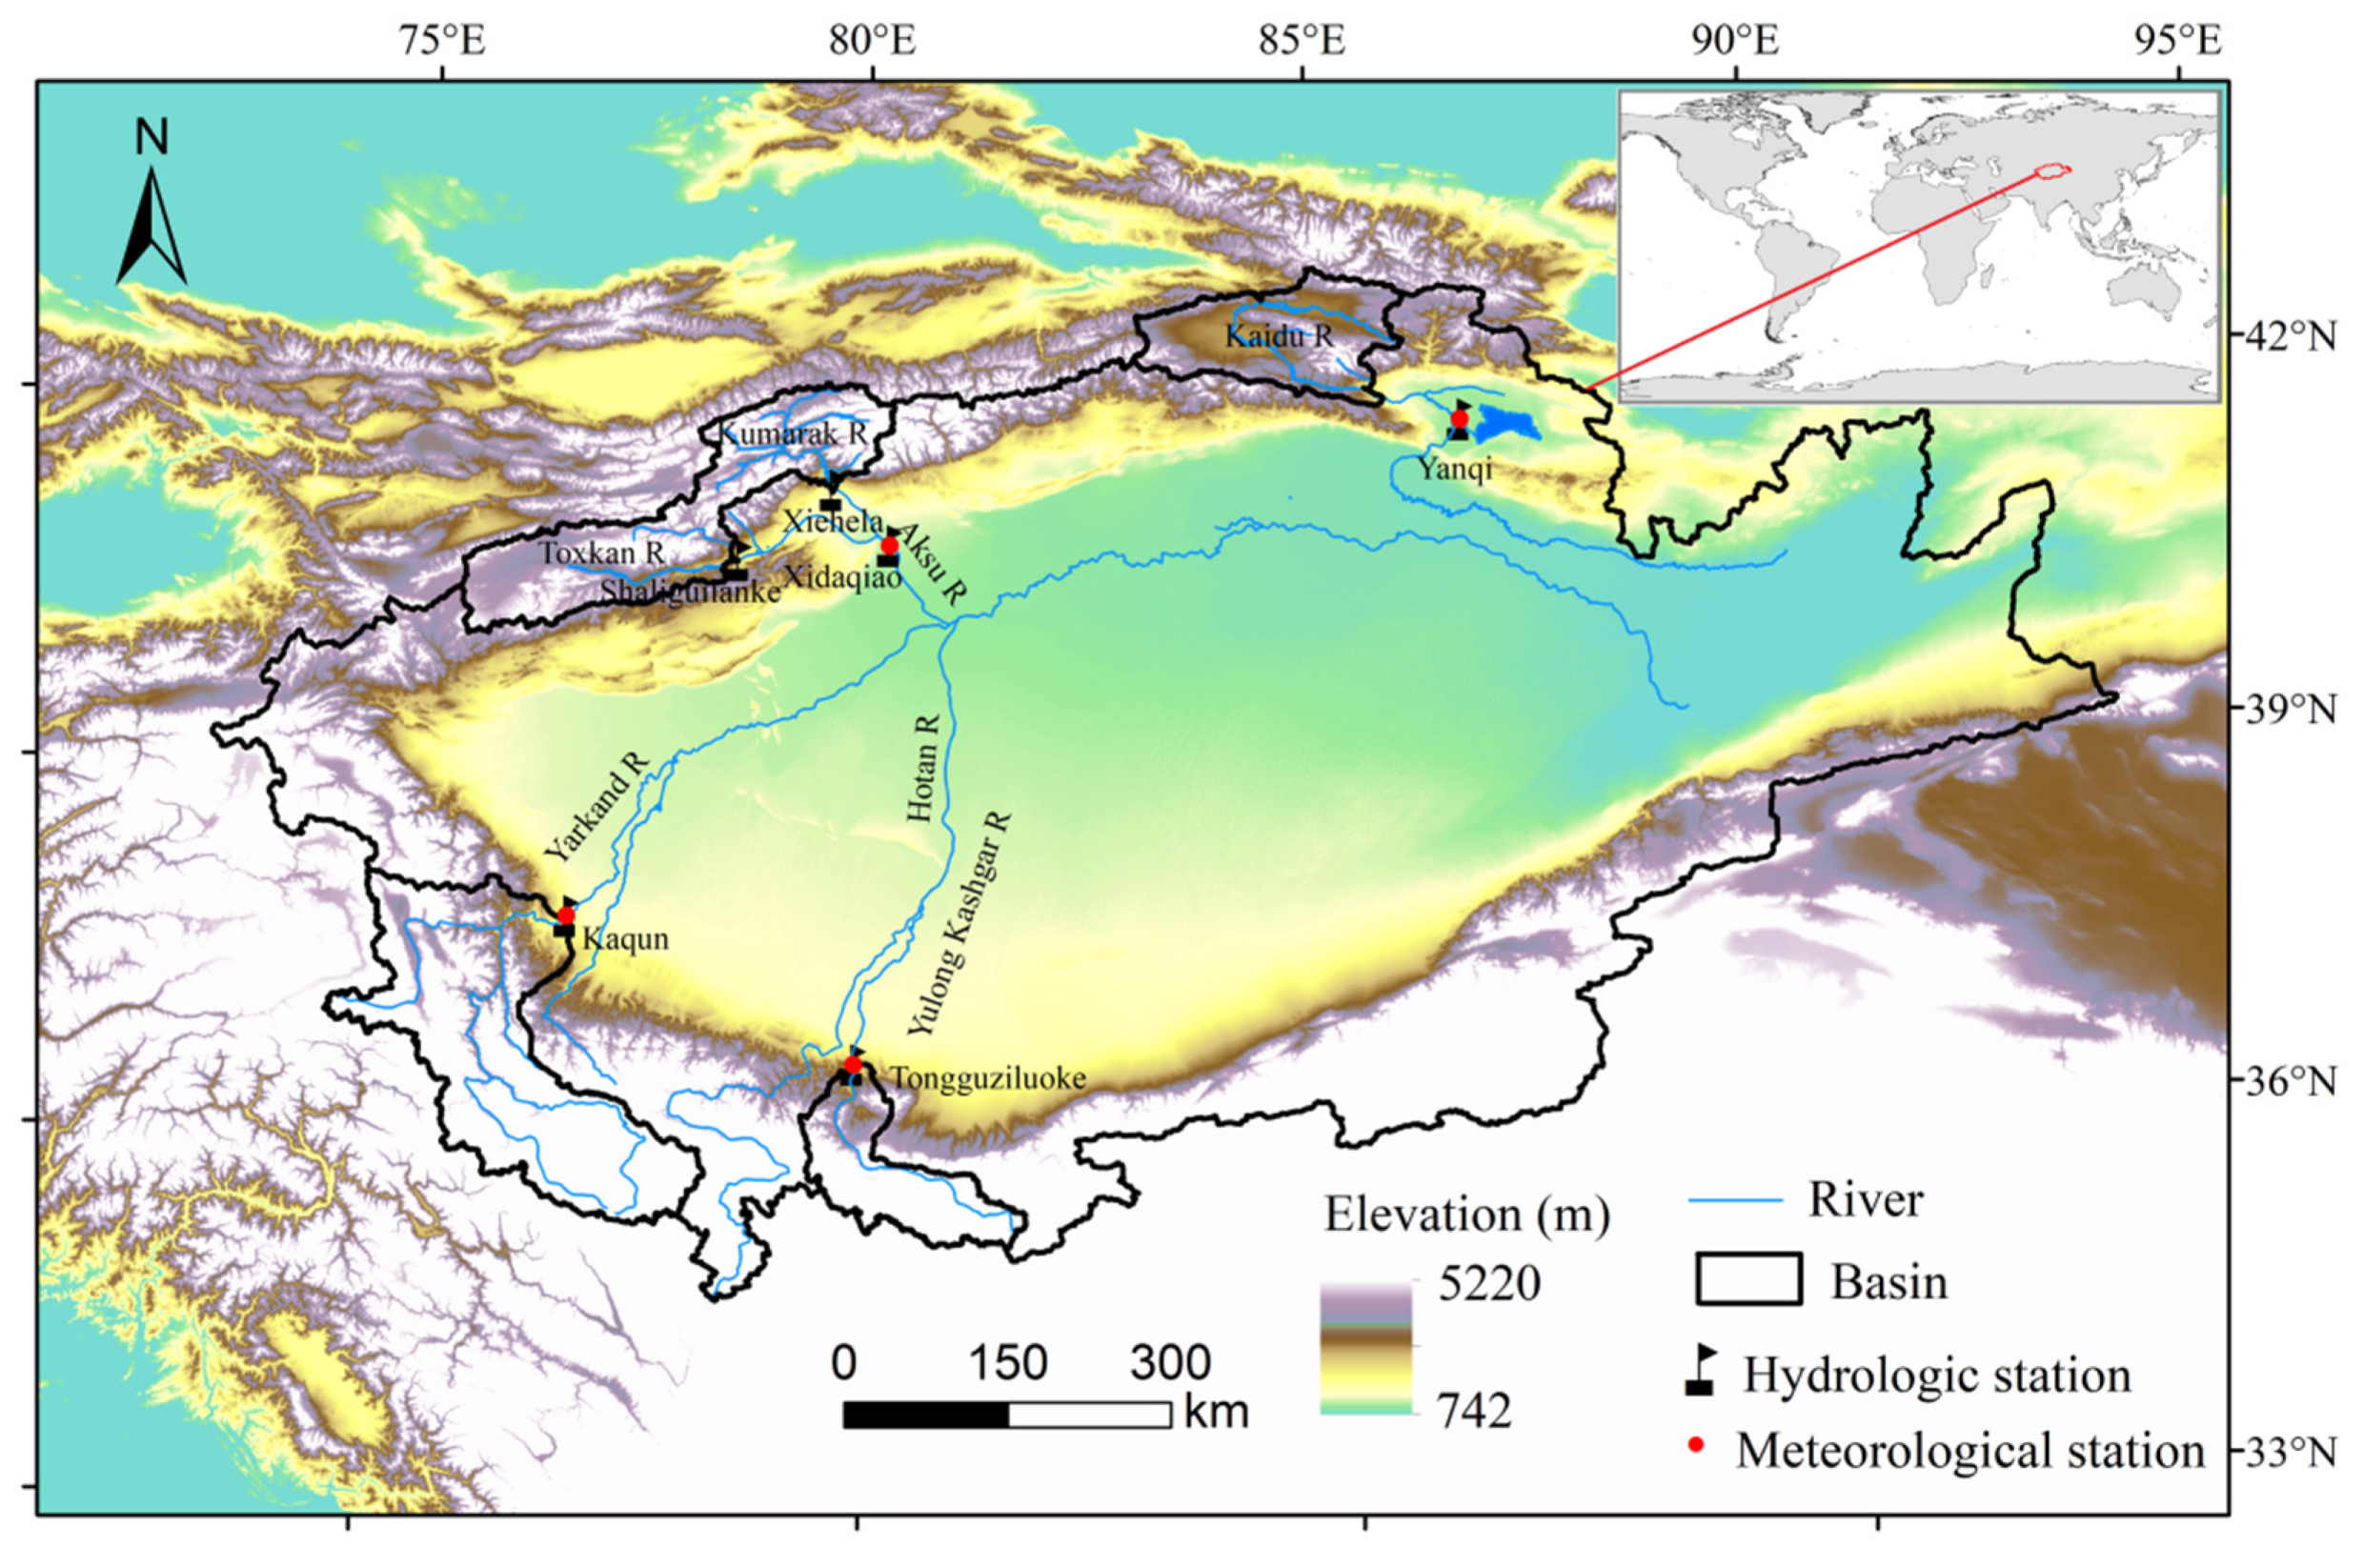
2.1. Study Area

Known as the largest inland river in China, the Tarim River is located in the TRB in southern Xinjiang, between 73°10′–94°05′E and 34°55′–43°08′N, and possesses a total basin area of 1.02 × 10⁶ km2. Historically, the Tarim River comprises a total of 144 rivers, constituting nine major river systems around the TRB. Under the warming climate scenario and disturbances from human activities regarding the exploitation and utilization of water resources, only four headwaters of the Kaidu River, the Aksu River, the Yarkand River, and the Hotan River are connected with the surface water of the Tarim River, resulting in a pattern of “four headwaters and one trunk” (Figure 1). The main stream of the Tarim River is 1321 km long. The TRB is located far from any ocean, and is in the hinterland of Eurasia in mid-latitude, surrounded by the northern Tien Shan, the East Pamir Plateau, and the southern mountains of the Karakorum Mountains and the Kunlun Mountains.
According to the climatic and hydrological characteristics of different regions in the TRB, precipitation is rare and uneven, with a dry climate environment. The source of runoff is mainly formed by the melting water of glacier-snow and precipitation in mountain areas [23]. Table 1 presents basic information about the typical rivers and hydrologic stations in the TRB. In the Kaidu River Basin, the total area is 2.25 × 10⁴ km2, and its multiyear average runoff, controlled by the Yanqi hydrologic station with an elevation of 1058 m, is 26.19 × 10⁸ m3, and multiyear average sediment discharge is 0.3 × 10⁹ kg. In terms of runoff components, glacier meltwater contributes 14.1%, and precipitation and snow meltwater provide 45.3%, of the total annual runoff. The total basin area of the Aksu River is 4.31 × 10⁴ km2. The multiyear average runoff and sediment discharge, controlled by the Xidaqiao hydrologic station (with an altitude of 1100 m), is 43.55 × 10⁸ m3 and 15.91 × 10⁹ kg, respectively. Regarding annual runoff, 24.7–52.4% comes from glacier meltwater, while 30.4–45.1% is recharged by snow meltwater and precipitation. Concerning the Yarkand River, with a total basin area of 5.02 × 10⁴ km2, its average annual average runoff, controlled by the Kaqun hydrologic station, with an altitude of 1370 m, is 72.70 × 10⁸ m3, and annual average sediment discharge is 33.78 × 10⁹ kg. Glacier meltwater accounts for 64% of the runoff, while snow and precipitation recharge comprise 13.4% of the runoff. In terms of the Hotan River, it is composed of two main tributaries, the Yulong Kashgar River and the Karakax River. The Yulong Kashgar River Basin covers an area of 1.46 × 10⁴ km2, contributing 51% of the runoff of the Hotan River. The multiyear average runoff and sediment discharge, controlled by the Tongguziluoke hydrologic station with an altitude of 1650 m, is 25.64 × 10⁸ m3 and 14.31 × 10⁹ kg, respectively. Regarding annual components, total glacier meltwater contributes 64.9%, and snow meltwater and precipitation provide 17%, of total annual runoff.
In order to eliminate the impact of different basin areas, we calculated the average runoff depth and annual sediment modulus of four rivers in the last 20 years (Table 1). The results showed that the order of average runoff depth is Yulong Kashgar River > Yarkand River > Kaidu River > Aksu River. Concerning the average sediment modulus, the order is Yulong Kashgar River > Yarkand River > Aksu River > Kaidu River. By comparing the average runoff depth and sediment modulus of these four major rivers, they can be roughly divided into three categories: (1) the Yulong Kashgar River and the Yarkand River are relatively rich in water and sand; (2) the Kaidu River is characterized by relatively little water and little sediment; and (3) the Aksu River features little water and moderate sediment.

2.2. Data

2.2.1. Meteorological and Hydrological Data

Data of temperature and precipitation in the TRB during 2001–2019 were provided by the China Meteorological Data Network (http://data.cma.cn (accessed on 2 October 2022)), which are site-measured data. Annual and seasonal sediment discharge and annual runoff were acquired from the China River Sediment Bulletin, covering the time period from 2001 to 2019. Glacierization data of four rivers were obtained from Fang et al. [19].

2.2.2. MODIS Snow Cover Product

In this study, the daily SCAP data from 2002 to 2018 were downloaded from the National Cryosphere Desert Data Center (NCDDC, http://www.ncdc.ac.cn (accessed on 2 October 2022)). It provides a 500 m horizontal resolution, of which original data were obtained from moderate-resolution imaging spectroradiometer (MODIS)-normalized snow index data. This data set was processed involving the application of additional terrain data and multiple snow cover cloud elimination algorithms. This newly obtained data set provides a cloud-free estimation (cloud cover < 10%) of SCAP over High Asia, which meets the input requirements of the energy model. Compared to the binary snow products under cloud-free conditions, SCAP products are largely consistent with binary snow products in both space and time during snow accumulation. In the case of winter 2013, when the SCAP was greater than 50%, their correlation-coefficient was as high as 0.86. Therefore, SCAP that exceeds 50% was recorded as snow cover in this study. To be consistent with the time series of meteorological and hydrological data, we extended the data. The daily SCAP data for 2001 and 2019 were averaged for the years during 2002–2004 and 2016–2018, respectively.

2.3. Methods

2.3.1. Trend and Correlation Analysis

The Mann–Kendall (M-K) test was applied for analyzing the trends of temperature, precipitation, annual runoff, ASD, and SCAP [24,25]. It is a non-parametric test, recognized to be relatively more objective to the trends of times series, and is widely used in trend analysis of hydrologic and climatic-variables [26,27]. In the M-K trend test, for a given confidence level α, if |Z|≥ Z1−α/2, then the original assumption H0 is unacceptable (H0 = R), i.e., on the confidence level α, time series data show an obvious up or down trend. Specifically, a positive value of Z denotes a positive trend, while a negative value denotes a negative trend [28].
Linear regression is used to analyze variation rates in temperature, precipitation, annual runoff, ASD, and SCAP during the period of 2001–2019.
SPSS software was used for Pearson correlation analysis, and a bilateral significance test was conducted. In the process of correlation analysis, the default method of listwise deletion in SPSS can be directly used to process the data.

2.3.2. Sensitivity and Contribution Analysis

Considering that correlation cannot directly represent causality among variables [29], for further exploring the quantitative relationship between sediment discharge and driving factors, this study adopts the calculation method of sensitivity coefficient proposed by Zheng et al. [30] to analyze the sensitivity of ASD to temperature, precipitation, annual runoff and SCAP of four seasons. The calculation formula is:
ε = X ¯ D ¯ X i X ¯ D i D ¯ X i X ¯ 2
where ε is the sensitivity coefficient of ASD to driving factors (temperature, precipitation, annual runoff, or SCAP of four seasons), and means that a 1% change in driving factors will cause a ε% change in ASD; Xi is driving factors; Di is ASD; X is the annual average of driving factors; and D is the average ASD. For quantitatively identifying the contribution rate of driving factors to ASD, the formula for calculating the contribution rate is as follows:
= x X ¯ × ε × 100 %
where φ refers to the contribution rate of driving factors to ASD; and ∆x is the multiyear variation of driving factors.

3. Results

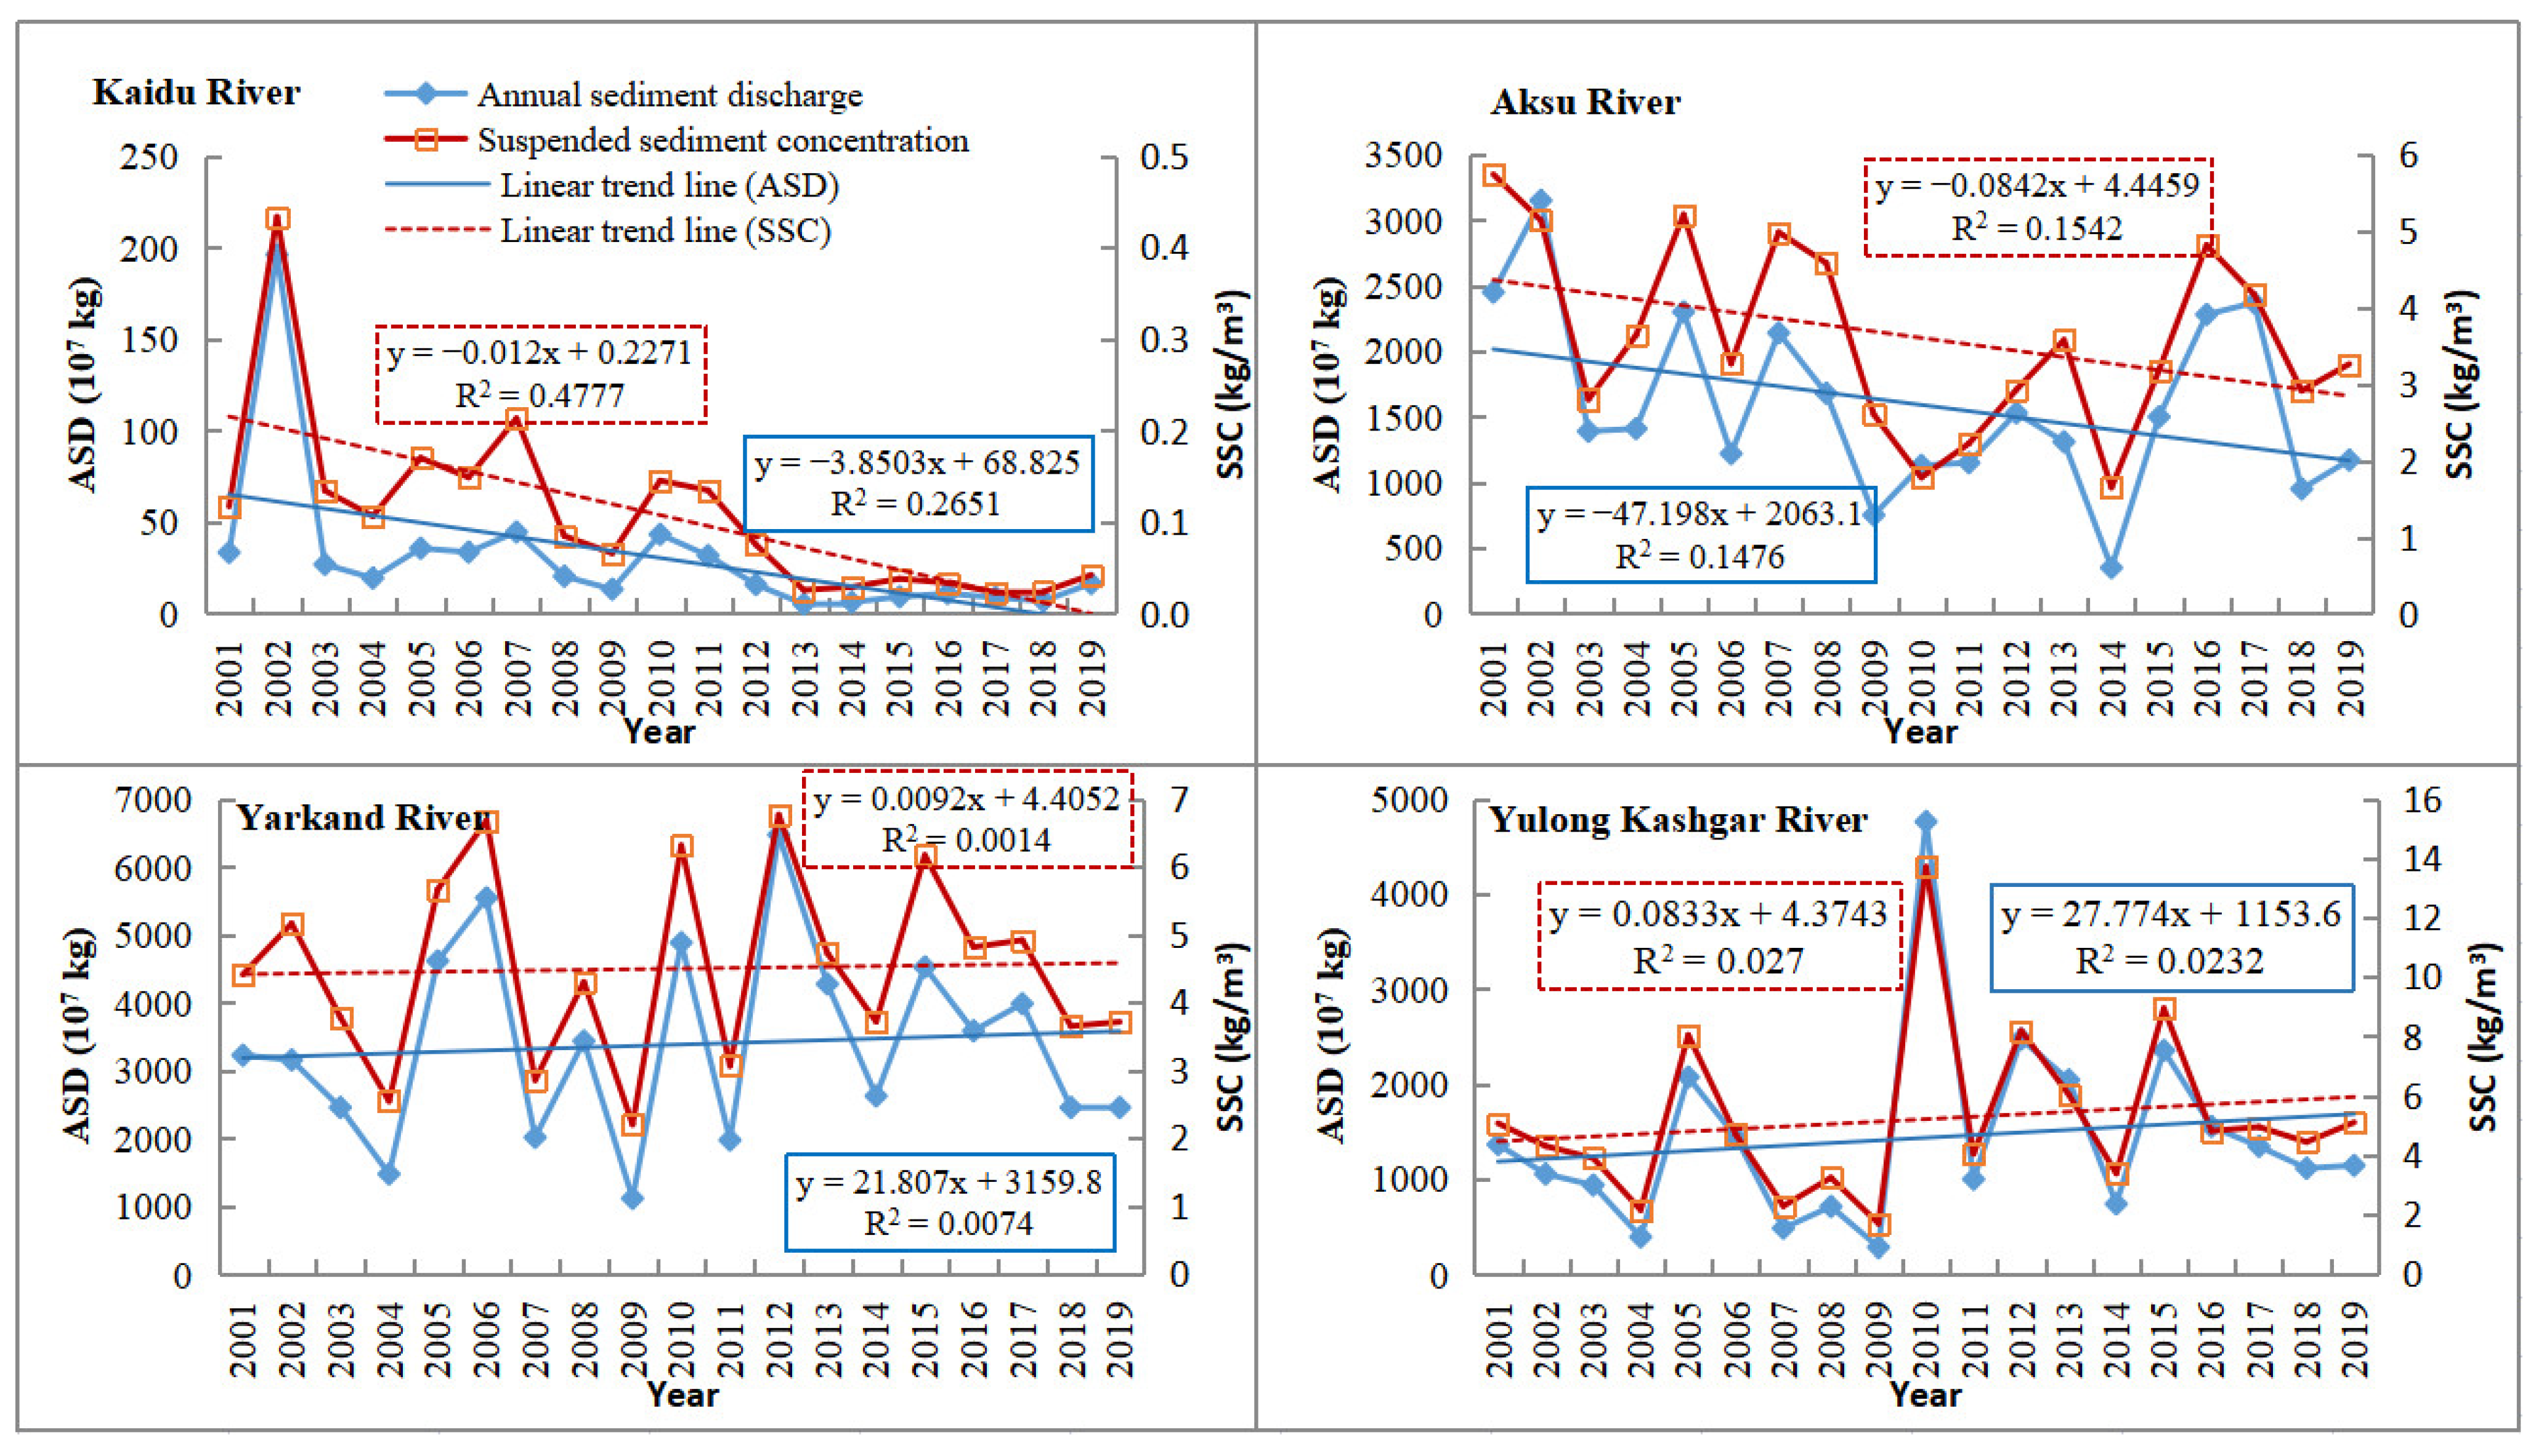
3.1. Variations of Suspended Sediment

The ASD of the rivers in the Tien Shan region decreased year by year, and the decreasing rates of ASD in the Kaidu River and the Aksu River were 3.8503 × 10⁷ kg per year (p < 0.01) and 47.198 × 10⁷ kg per year, respectively (Figure 2). However, in the Yarkand River and the Yulong Kashgar River, which originate in the Karakoram Mountains, an increasing trend was found year by year, and the increasing rates of ASD in the Yarkand River and the Yulong Kashgar River are 21.807 × 10⁷ kg per year and 27.774 × 10⁷ kg per year, respectively (Figure 2). Since the multiyear average runoff of the four rivers varies greatly (Table 1), to eliminate the influence of runoff on sediment transport, we calculated the suspended sediment concentration (SSC) of the four rivers. The SSC of the four rivers still show similar variation rules to ASD (Figure 2). The decreasing rates of SSC in the Kaidu River and the Aksu River were 0.012 kg/m3 per year and 0.0842 kg/m3 per year, respectively. The moderate increasing rates of SSC in the Yarkand River and the Yulong Kashgar River were 0.0092 kg/m3 per year and 0.0833 kg/m3 per year, respectively. However, the ASD and SSC showed similar trends in all of the rivers, but the Kaidu River significantly differed in value. By further observing the runoff of the four rivers, it can be seen that the runoff of the Kaidu River shows an increasing trend year by year (Table 2), while the sediment discharge decreases year by year (Figure 2), which inevitably leads to a declining rate of sediment concentration greater than that of sediment discharge, while the runoff and sediment discharge of the other three rivers show the tendency to increase or decrease at the same time (Table 2 and Figure 2).
From the intra-annual variation sediment discharge at the four rivers (Figure 3), more than 97% of the sediment discharge was concentrated in April to September, among which the maximum sediment transport of the Kaidu River and the Yulong Kashgar River occurred in July, accounting for 32% and 35% of the whole year, respectively. The maximum sediment transport of the Aksu River and the Yarkand River occurred in August, accounting for 38% and 44% of the whole year, respectively.

3.2. Change Rates of Precipitation, Temperature and Annual Runoff

The linear regression method was applied to further calculate the average change rates in precipitation, air temperature and annual runoff of four major rivers in the TRB, and the Mann–Kendall method was applied for the trend test (Table 2). Influenced by the length of time series, each river exhibited an obvious trend of increase and decrease. Precipitation in the Kaidu River, the Aksu River and the Yulong Kashgar River exhibited a trend of increasing, while precipitation in the Yarkand River showed an insignificant trend of decreasing. The air temperatures of the four rivers showed a trend of increasing, particularly in the Yarkand River, with a significant rising rate of 0.42 °C/10a (p < 0.05). Annual runoff of the Kaidu River, the Yarkand River and the Yulong Kashgar River increased, while this trend reversed in the Aksu River, but again the trends were not significant.

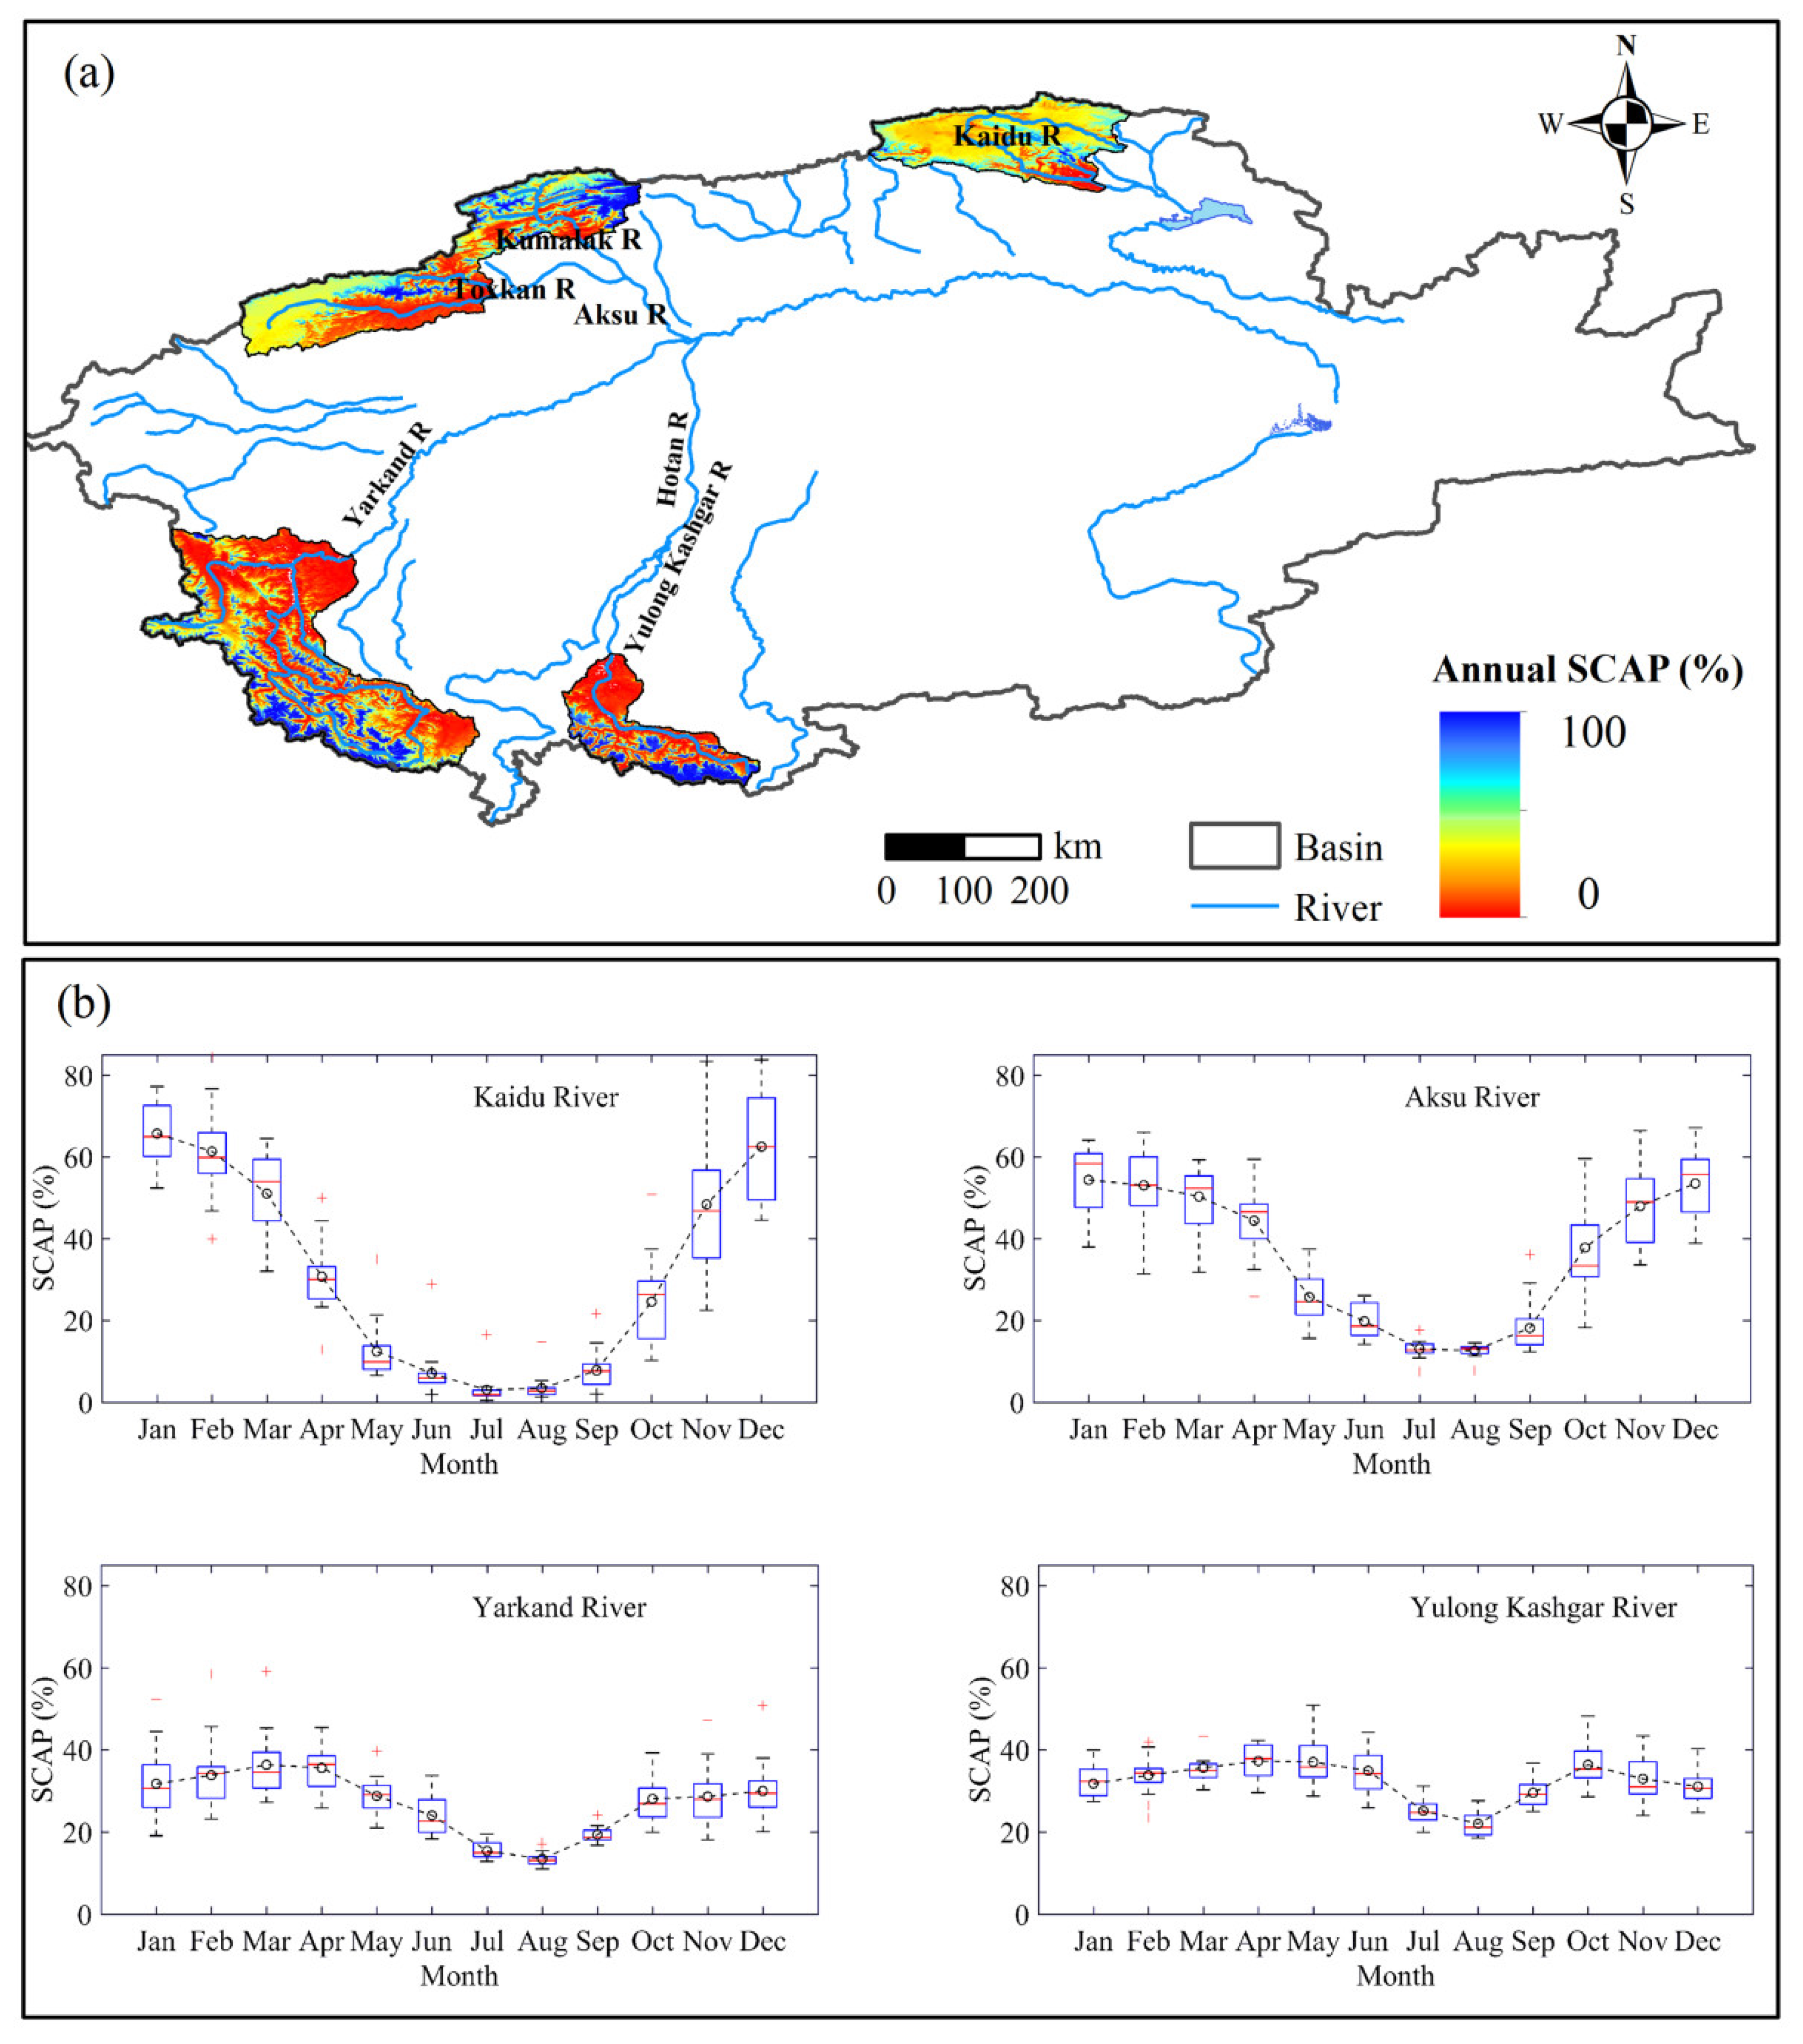
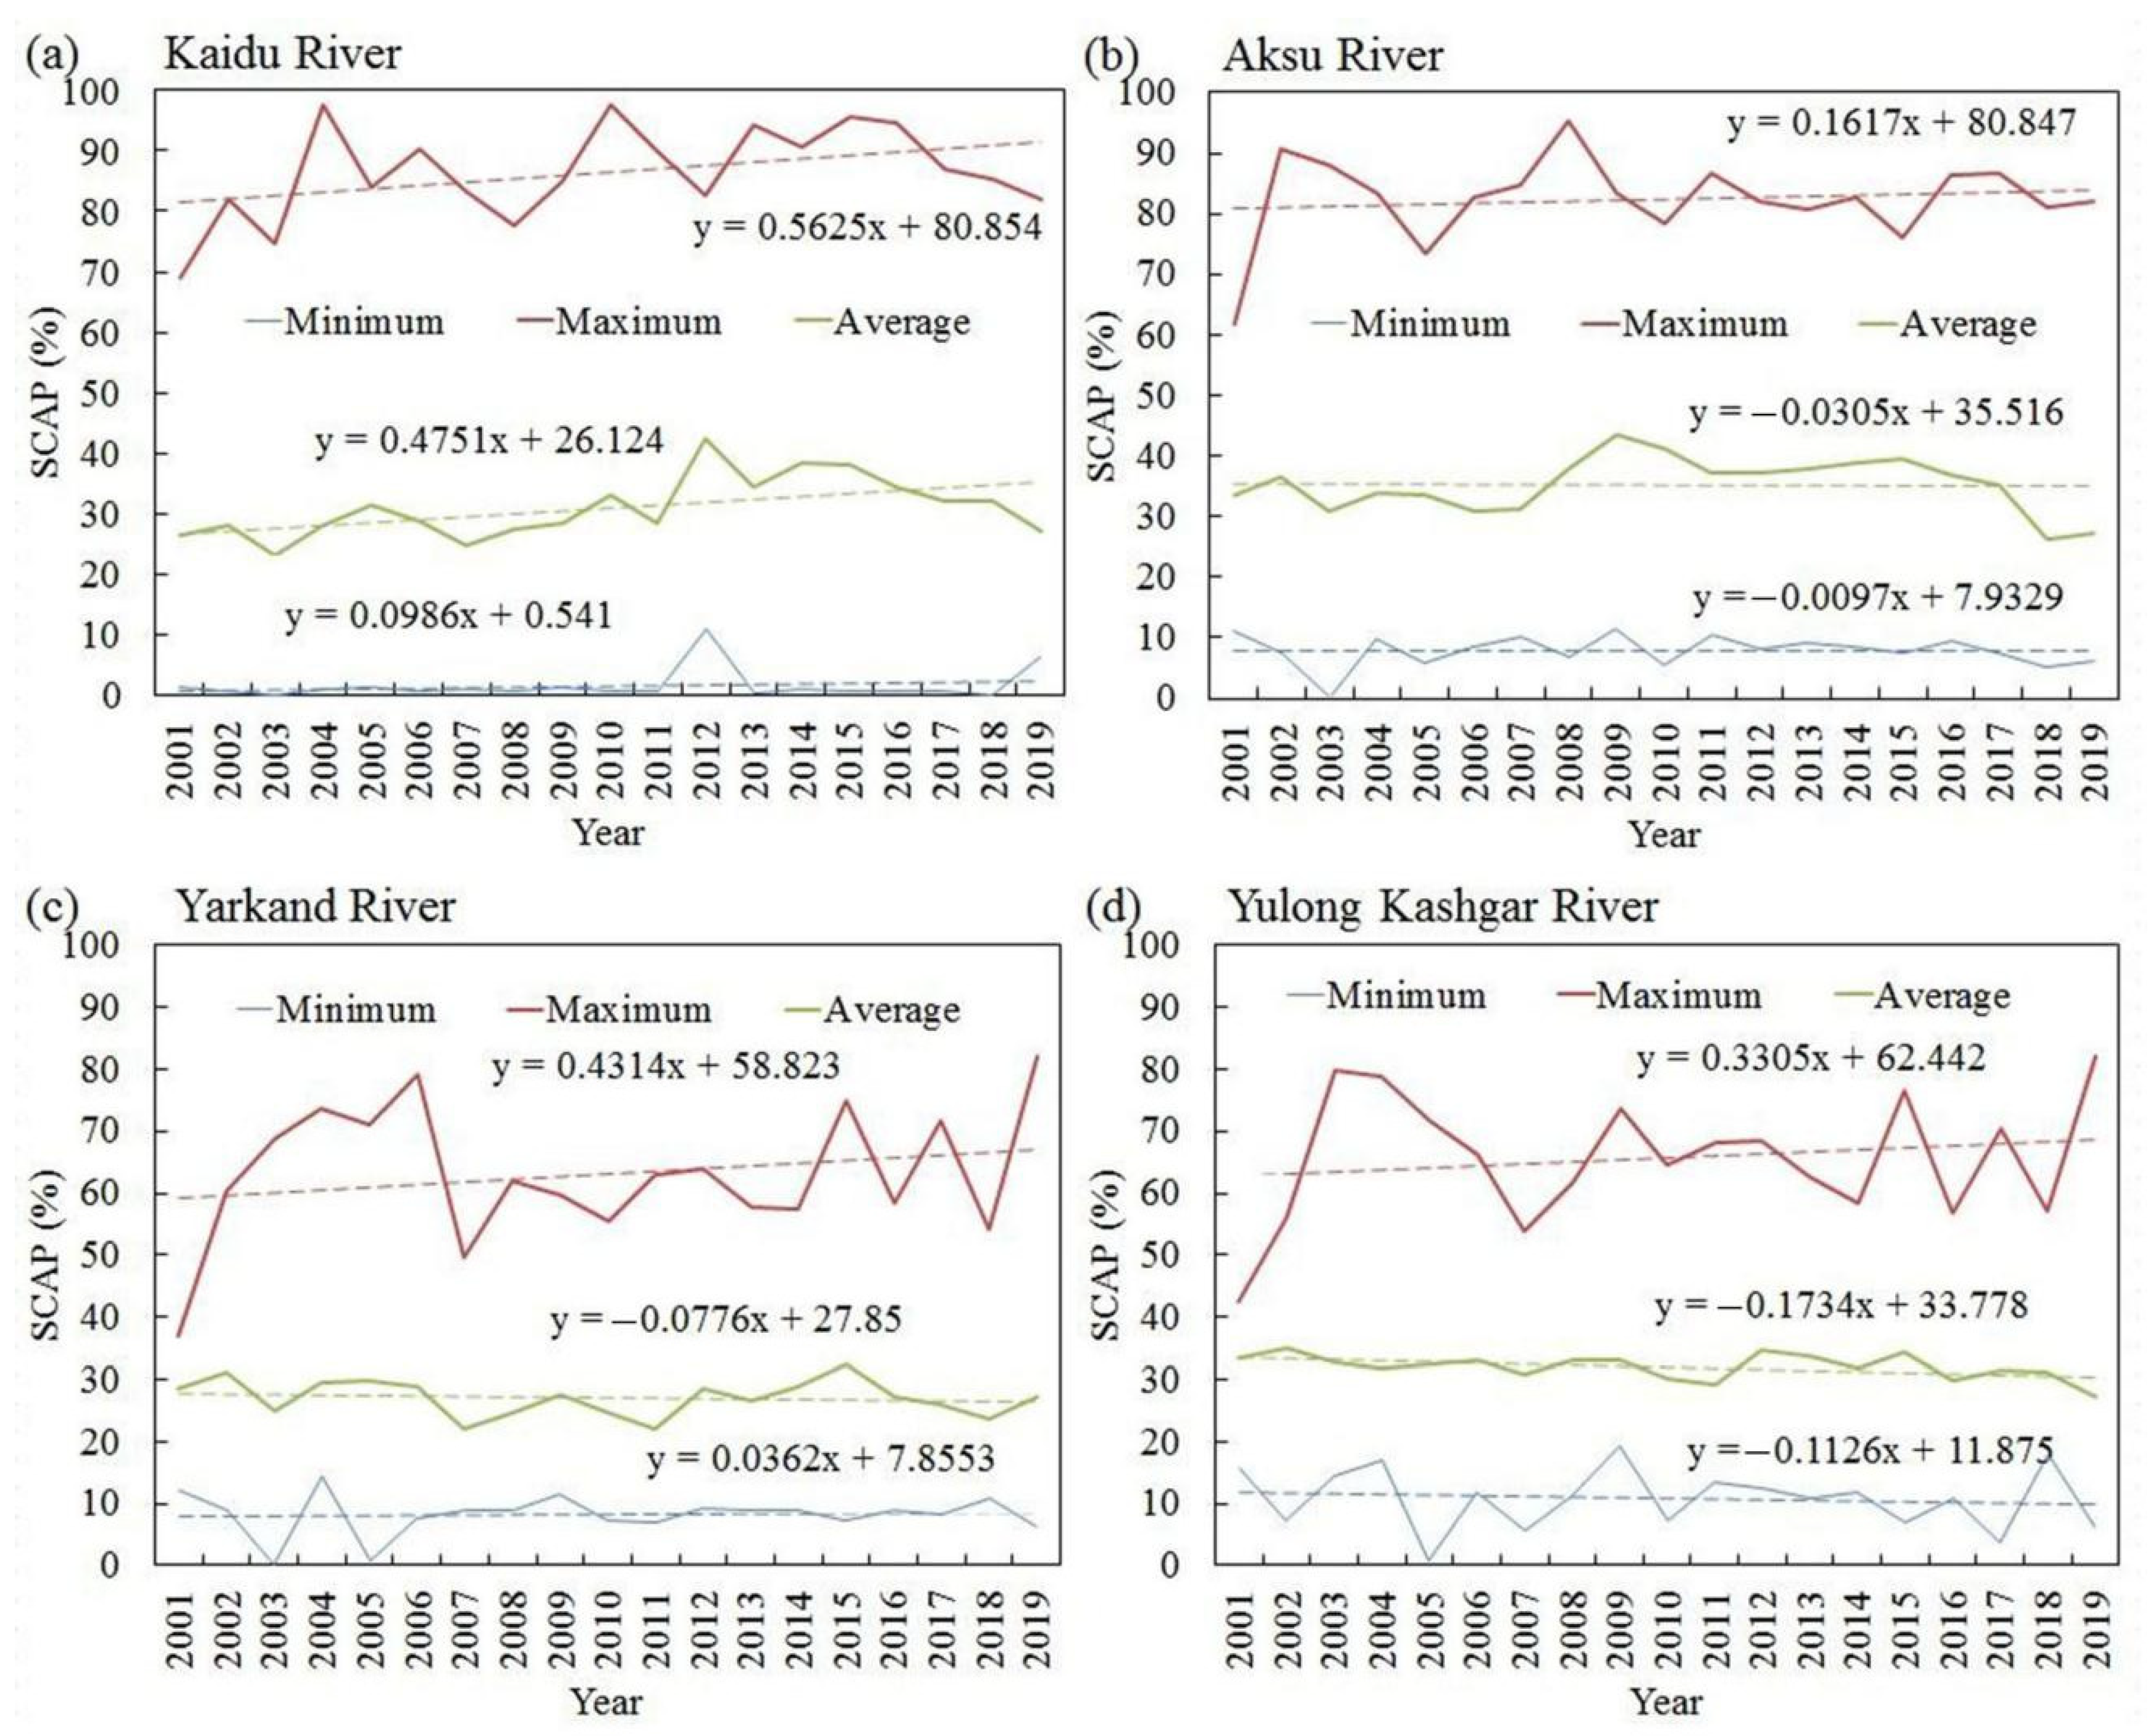
3.3. The Spatial Distribution and Changes of SCAP in the TRB

Snow change is primarily affected by solar radiation in mountainous areas. Through analyzing seasonal SCAP in the TRB based on MODIS data, it was found that snow accumulation occurs in September with increasing SCAP, and the maximum SCAP occurs in January for the Kaidu River Basin and the Aksu River Basin of the Tien Shan region, located in the north of the TRB, with an average SCAP of 65.73% and 54.37%, respectively. The maximum SCAP for the Yarkand River Basin and the Yulong Kashgar River Basin occur in March–April, with an average SCAP of 35.61–36.35% and 37.03–37.27%, respectively. After February, with rising temperatures in mountainous areas of the TRB, SCAP begins to decrease, with the minimum area occurring in July–August. The minimum SCAP in the Kaidu River Basin is 3.11%, 12.57% in the Aksu River Basin, 13.445% in the Yarkand River Basin, and 22% in the Yulong Kashgar River Basin.
In terms of the distribution of SCAP in different sub-basins of the TRB from 2001–2019 (Figure 4), the average SCAP of the Kaidu River Basin was 31.36%, specifically 62.81% in winter, followed in spring and autumn with an average SCAP of 31.21% and 26.66%, respectively, and the minimum SCAP was 4.52% in summer. Regarding the Aksu River Basin, the average SCAP was 35.78%, with its maximum SCAP in winter of 51.29%, followed by spring and autumn with an average SCAP of 39.99% and 34.81%, respectively, and the minimum SCAP was 15.03% in summer. Concerning the Yarkand River Basin, the average SCAP was 27.05%, which is 33.04% in spring, followed in winter and autumn with an average SCAP of 30.92% and 25.24%, respectively, and the minimum SCAP was 17.67% in summer. In terms of the Yulong Kashgar River Basin, the average SCAP was 32.26%, which is 36.65% in spring, followed in winter and autumn with an average SCAP of 32.05% and 32.97%, respectively, and the minimum SCAP was 27.27% in summer.
The coefficient variation (CV) values in the sub-basins of the TRB were all between 0.1–0.2 (Table 3). In addition, the rivers recharged with a larger amount of snow meltwater with higher SCAP values, which means that the larger the proportion of snow and snow meltwater in the whole basin and river runoff, the more unstable the interannual and seasonal change in SCAP. For instance, SCAP in the Kaidu River exhibits a higher oscillation than other basins, followed by the Aksu River. SCAP in the Yarkand River Basin and the Yulong Kashgar River Basin with a lower SCAP are more stable than those regions of the Tien Shan. A remarkable characteristic was also found, in which the greater the CV value of SCAP, the stronger the effect on river sediment discharge. Overall, the smaller the CV values of SCAP, the weaker or even non-existent its influence on sediment discharge.
Under global warming, SCAP in the TRB is experiencing rapid changes (Figure 5). From 2001 to 2019, for the Kaidu River Basin, the maximum, average annual, and minimum SCAP all exhibited an increasing trend. Moreover, the maximum SCAP in the Kaidu River shows a notable increasing trend of 0.56% per year (p < 0.01). The maximum SCAP in the Aksu River Basin of the Tien Shan in the northern part of the Tarim River exhibits an increasing trend, whereas the average annual and minimum SCAP shows a trend of decreasing. The maximum SCAP in the Aksu River shows a slower increasing trend of 0.16% per year. The maximum and minimum SCAP in the Yarkand River Basin exhibit increasing trends, with rates of 0.43% and 0.04% per year, respectively, whereas the average annual SCAP shows a slower decreasing trend of 0.08% per year. The maximum SCAP in the Yulong Kashgar River increases 0.33% per year. In contrast, the average annual and minimum SCAP shows slower decreasing trends, with rates of 0.17% and 0.11% per year, respectively.
According to the seasonal variations of SCAP in the four source regions of the TRB from 2001 to 2019 (Figure 6) and the Mann–Kendall test, it was found that the SCAP of the Kaidu River Basin increased in all seasons, especially in autumn and winter, with a rate of 0.71% per year and 1.00% per year, respectively (p < 0.05). In the Aksu River Basin, SCAP also increased in all seasons, especially in spring and winter, with a rate of 0.37% per year and 0.48% per year, respectively. In the Yarkand River Basin, except for winter, SCAP exhibited a slower downward trend in all other seasons. For the Yulong Kashgar River Basin, SCAP exhibited a decreasing trend in all seasons, especially in spring and autumn, with a rate of 0.16% per year and 0.23% per year, respectively.

3.4. Correlation, Sensitivity and Contribution Rate between Sediment Discharge and Driving Factors

In Figure 2, the Kaidu and Aksu Rivers show significantly different trends from the Yarkand and Yulong Rivers. However, the SCAP trends (in Figure 5) are similar across all four basins. This means that some uncertainty exists regarding the variation of river sediment transport, which mainly comes from the balance mechanism of positive and negative feedback of multiple influencing factors and their spatial differences. In addition to SCAP, there must be other factors affecting the variation of ASD. In this paper, annual runoff, precipitation, temperature and SCAP in four seasons are selected as the driving factors.
As can be seen from Table 4, the ASD and runoff are all positively correlated, and the correlation of the Aksu River, the Yarkand River, and the Yulong Kashgar River is extremely significant. The correlation coefficient from large to small is the Yarkand River (0.88 **), the Yulong Kashgar River (0.78 **), the Aksu River (0.59 **) and the Kaidu River (0.54 *). The influence of runoff on sediment discharge is both profound and obvious. To quantify the relationship, the sensitivity coefficient of ASD to each influencing factor and the contribution rate of each influencing factor to ASD were analyzed (Table 4).
A significant negative correlation exists between ASD and SCAP in autumn and winter in the Kaidu River. From the perspective of sensitivity, ASD is more sensitive to SCAP in winter, followed by SCAP in autumn and annual runoff. If SCAP in winter increases by 1%, ASD will decrease by 5.33%, and vice versa. In terms of contribution rate, that of SCAP in autumn is the largest, followed by annual runoff and SCAP in winter.
A significant negative correlation exists between ASD and SCAP in autumn in the Aksu River. From the perspective of sensitivity, ASD is more sensitive to the change of SCAP in autumn, followed by annual runoff. If SCAP in autumn increases by 1%, ASD will decrease by 1.26%, and vice versa. In terms of contribution rate, that of annual runoff is the largest, followed by SCAP in autumn.
SCAP in spring is significantly positively correlated to ASD in the Yarkand River. From the perspective of sensitivity, ASD is more sensitive to annual runoff, followed by SCAP in spring. If annual runoff increases by 1%, ASD will increase by 2.4%, and vice versa. In terms of contribution rate, that of annual runoff is the largest, followed by SCAP in spring.
An extremely significant positive correlation exists between ASD and annual precipitation in the Yulong Kashgar River. From the perspective of sensitivity, ASD is more sensitive to annual runoff, followed by precipitation. If annual runoff increases by 1%, the ASD will increase by 2.88%, and vice versa. In terms of contribution rate, that of annual runoff is also the largest, followed by precipitation.

4. Discussion

4.1. Effects of SCAP in Four Seasons and Other Factors on ASD

It is generally believed that air temperature, precipitation and glacial meltwater constitute positive feedback factors to increase river sediment discharge [6]. However, it was found in this study that dissimilarities exist between the feedback effects of SCAP and river sediment discharge in different seasons. Specifically, SCAP in autumn and winter imparts a negative feedback effect on sediment discharge, while that in spring has a positive feedback effect on sediment discharge.
Alpine snow is considered to be a solid freshwater resource, and forms a crucial part of the cryosphere. It is also regarded as a sensitive indicator of climate change, and thus plays an essential role in cryosphere research. Energy exchange in the process of snow cover phase change, seasonal snow ablation and accumulation, as well as other phenomena, exert an important influence on the regional climate. Mountain areas in the TRB develop a mass of seasonal and permanent snow. Therefore, it is of great significance to elucidate the change of water resources in the TRB region by conducting a comparative analysis of snow cover change. By comparing Figure 2 and Figure 6, it can be seen intuitively that inter-annual variations of ASD in the Kaidu River and the Aksu River are opposite to that of SCAP in four seasons. From the perspective of sensitivity, ASD in the Kaidu River and the Aksu River is more sensitive to SCAP in winter and in autumn, respectively (Table 4). A recent study suggests that heavy snow accumulation led to later snow loss, and thus delayed the onset of soil warming [31]. For example, in the Kaidu River, there is a significant negative correlation between SCAP in autumn and winter, and air temperature in autumn, with correlation coefficients of −0.51 (p < 0.05) (Table 5). Falling temperatures in autumn accelerate the accumulation of snow, so that snow melt is delayed, which leads to reduced surface-exposed area and time, and ultimately causes reduced sediment transport.
The inter-annual variation of ASD in the Yarkand River is similar to that of SCAP in winter, but opposite to that of SCAP in other seasons. From the perspective of sensitivity, ASD is more sensitive to annual runoff (Table 4). Many investigations have demonstrated that runoff constitutes the most significant environmental factor affecting sediment discharge [3,7,9,32,33]. According to the Chinese River Sediment Bulletin 2019, the sediment discharge of the Yarkand River (Kaqun hydrologic station) from June to October accounts for more than 97% of the total ASD. In other words, almost all sediment discharge is concentrated in summer and autumn, which is closely associated with the runoff of the Yarkand River in summer and autumn. Obviously, the influence of annual runoff on the ASD plays a dominant role. Precipitation changes were the primary factor for increasing streamflow in the Yarkand River Basin with a larger glacier area retreating ratio [34]. Although the results of correlation analysis showed that precipitation was not significantly correlated with ASD (Table 4), precipitation could indirectly affect ASD by affecting runoff.
The inter-annual variation of ASD in the Yulong Kashgar River is opposite to that of SCAP in four seasons. From the perspective of sensitivity, ASD is more sensitive to annual runoff (Table 4). In the last 20 years, annual precipitation of the Yulong Kashgar River exhibits an increasing trend. Moreover, ASD and annual precipitation both increase and decrease obviously. In 2009, precipitation and ASD were 23.5 mm and 28×108 kg, respectively, which were the minimum values in the last 20 years. In 2010, precipitation and ASD reached 186.9 mm and 47.6×10⁹ kg, respectively, which were the maximum values in the last 20 years, 8 times and 17 times the values in 2009, and 3 times and 3.3 times the average values in the last 20 years. Further analysis identifies a significant positive correlation between annual precipitation and runoff (Pearson correlation is 0.69, p < 0.01) (Table 5). This further confirms the close relationship between ASD and precipitation and runoff.

4.2. Other Possible Influencing Factors

After removing the influence of basin area, it was found that the proportion of glacial-melt water, slope, glacierization and human activities are also possible factors affecting sediment discharge of different rivers. The rivers with relatively rich water and sand both originate from the Karakoram Canyon. More than 64% of runoff is supplied by glacier-melt water in the Yarkand River [23], and the Yulong Kashgar River constitutes a typical mountain snow-melt replenishment river with 64.9% glacier-melt water (Table 1). The two rivers also possess a feature in common, which is a deep slope in their course (Table 1). Steep slopes of rivers increase water erosion and sediment transport capacity, thus carrying more sediment per unit runoff. For the river with relatively little water and little sediment, its control station is located at the Yanqi hydrologic station with a lower elevation (1058 m) (Table 1). As the river proceeds, it has been increasingly affected by human activities, and the slope becomes slow after entering the plain area, resulting in lower average runoff depth and sediment modulus. For the river with little water and moderate sediment, its control station is located at the Xidaqiao hydrologic station with a lower elevation (1100 m). It is at the intersection of the Toxkan and the Kumarak Rivers. The retreating water of agricultural irrigation interferes greatly along the river course, and the influencing factors are highly complicated. In terms of the glacier area ratio of the four rivers [19], except for the Kaidu River, the larger the glacierization, the smaller the runoff depth and the sediment modulus of the other three rivers. The extant literature has demonstrated that sediment modulus is generally positively correlated with glacierization and runoff depth in basins [6], whereas, in the TRB, the opposite situation is present. In aggregate, the influencing factors of sediment discharge change in the TRB are markedly complex, and further analysis is needed.
Vegetation is usually considered a negative feedback factor to reduce soil and water loss: it reduces surface runoff by trapping and improving soil infiltration, and inhibits erosion by protecting surface soil, thus slowing down the process of soil and water loss [35,36,37]. At the same time, the growth of vegetation will inevitably cause mechanical fracture of rock minerals, i.e., contribute to mechanical denudation. The final performance depends on which action dominates. Studies have shown that, on the whole, the correlation coefficient between sediment transport and forest coverage rate in major basins in China is not large, which may be because the forest coverage rate in China is generally not high, resulting in the insignificant protective effect of vegetation and tendency to be affected by other influencing factors [38]. The influence of vegetation on sediment yield in the basin is complex and needs to be further discussed by collecting more regional data in the future.
Because the study area is located in the source or upstream of the river and human activities are small in scale, the influence of human activities is not considered in this study.

4.3. The Significance of This Study

Zhang et al. [6] statistically analyzed the variation of sediment transport of eight rivers on the Qinghai–Tibet Plateau, and determined that sediment transport of rivers on the Plateau was affected by multiple factors, including topography, climate conditions, and land use. Studies on a global scale revealed that global warming has a significant impact on temporal and spatial variation in precipitation, while the driving effects of climate change on emission patterns and sediment dynamics are amplified by other factors, such as topography and lithology [9]. In addition to natural factors, the influence of human activities on sediment discharge cannot be underestimated [32,39]. The numerous factors affecting the variation of sediment discharge can be divided into five categories: (1) geographical environment elements, including terrain, landform, slope, etc.; (2) climate factors, mainly including precipitation and temperature; (3) hydrologic factors, such as runoff, water level, flow velocity, etc.; (4) glaciers, snow cover, etc.; and (5) land use and other human activities. Because of the complexity and diversity of the factors affecting sediment discharge variation, this study is particularly necessary.
Based on the analysis of the influence of temperature, precipitation and runoff on ASD in four main headstreams of TRB, this paper introduces four groups of factors, including SCAP in four seasons. On the one hand, some new and meaningful understandings have been obtained in this study, which provides a new idea for the research on driving factors of sediment discharge variation. On the other hand, the results enrich the connotation of the study on sediment transport in inland river basins under the background of climate change. The dynamic change of sediment discharge can indirectly reflect the change of soil fertility, and can also be used as the basis to judge whether grassland degradation or even ecological degradation has occurred.

5. Conclusions

The ASD of the Kaidu River and the Aksu River originating from Tien Shan decreased with rates of 3.8503×10⁷ kg per year (p < 0.01) and 47.198 × 10⁷ kg per year, respectively, from 2001 to 2019. The ASD there is more sensitive to SCAP changes in autumn and winter, respectively. Falling temperatures in autumn accelerate snow accumulation, which leads to delays in snow loss and soil warming, a reduction in surface exposed area and time, and a series of chain reactions that ultimately causes a reduction in river sediment discharge.
The ASD of the Yarkand River and the Yulong Kashgar River originating from the Karakoram Mountains increased at rates of 21.807 × 10⁷ kg per year and 27.774 × 10⁷ kg per year, respectively, during 2001–2019. The ASD there is more sensitive to annual runoff. The positive effect of precipitation increase on runoff further leads to the increase of sediment discharge.
This study is of great scientific significance to understand the changing trend of river sediment discharge under different climate change scenarios in the future, and can provide guidance for governments to make scientific decisions in local river management. Sediment transport may be similar to runoff, with periodic variation. Due to the limitation of time series data, at present, relatively accurate periodic analysis is not possible. We look forward to obtaining longer series data in the future to further investigate the driving factors of sediment transport in inland river basins under the background of climate change.

Author Contributions

Conceptualization, Z.Y.; data curation, Z.Y. and Q.Z.; formal analysis, Z.Y.; investigation, Z.Y. and X.Z.; methodology, Z.Y. and Q.Z.; software, Y.L.; supervision, Z.Y. and Y.C.; writing—original draft, Z.Y. and Q.Z. All authors have read and agreed to the published version of the manuscript.

Funding

This work was supported by the Third Xinjiang Scientific Expedition Program (Grant No. 2022xjkk0107), the Strategic Priority Research Program of the Chinese Academy of Sciences (Grant No. XDA19030204), the Xinjiang Uygur Autonomous Region Innovation Environment (Talent, Base) Construction Special Project (Grant No. 2019Q032), the Science and Technology Planning Project of the Xinjiang Production and Construction Corps (Grant No. 2020JS016).

Acknowledgments

The authors are grateful to Jake Carpenter, who provided language consultation. The authors also thank the editors and anonymous reviewers for their invaluable comments and suggestions on the article.

Conflicts of Interest

The authors declare that they have no conflict of interest.

References

  1. Wu, Y.P.; Chen, J. Modeling of soil erosion and sediment transport in the East River Basin in southern China. Sci. Total Environ. 2012, 441, 159–168. [Google Scholar] [CrossRef] [PubMed]
  2. Walling, D.E.; Fang, D. Recent trends in the suspended sediment loads of the world’s rivers. Glob. Planet. 2003, 39, 111–126. [Google Scholar] [CrossRef]
  3. Li, L.; Ni, J.R.; Chang, F.; Yue, Y.; Frolova, N.; Magrltsky, D.; Borthwick, A.G.L.; Ciais, P.; Wang, Y.C.; Zheng, C.M.; et al. Global trends in water and sediment fluxes of the world’s large rivers. Sci. Bull. 2020, 65, 62–69. [Google Scholar] [CrossRef] [Green Version]
  4. Yao, X.L.; Yu, J.S.; Jiang, H.; Sun, W.C.; Li, Z.J. Roles of soil erodibility, rainfall erosivity and land use in affecting soil erosion at the basin scale. Agric. Water Manag. 2016, 174, 82–92. [Google Scholar] [CrossRef]
  5. Zhang, K.L.; Cai, Y.M.; Liu, B.Y.; Jiang, Z.S. Evaluation of soil erodibility on the Loess Plateau. Acta Ecol. Sin. 2001, 21, 1687–1695. (In Chinese) [Google Scholar]
  6. Zhang, F.; Shi, X.; Zeng, C.; Wang, G.; Chen, Y.; Wang, L.; Zhang, H.; Yu, Z. Variation and influence of riverine sediment transport from Tibetan Plateau, China. Bull. Chin. Acad. Sci. 2019, 34, 1274–1284. (In Chinese) [Google Scholar]
  7. Zhao, Y.; Cao, W.H.; Hu, C.H.; Wang, Y.S.; Wang, Z.Y.; Zhang, X.M.; Zhu, B.S.; Cheng, C.; Yin, X.L.; Liu, B.; et al. Analysis of changes in characteristics of flood and sediment yield in typical basins of the Yellow River under extreme rainfall events. Catena 2019, 177, 31–40. [Google Scholar] [CrossRef]
  8. Syvitski, J.P.; Vörösmarty, C.J.; Kettner, A.J.; Green, P. Impact of humans on the flux of terrestrial sediment to the global coastal ocean. Science 2005, 308, 376–380. [Google Scholar] [CrossRef]
  9. Moragoda, N.; Cohen, S. Climate-induced trends in global riverine water discharge and suspended sediment dynamics in the 21st century. Glob. Planet. Chang. 2020, 191, 103199. [Google Scholar] [CrossRef]
  10. Chen, Y.N.; Li, Z.; Fang, G.H.; Deng, H.J. Impact of climate change on water resources in the Tianshan Mountians, Central Asia. Acta Geogr. Sin. 2017, 72, 18–26. (In Chinese) [Google Scholar] [CrossRef]
  11. Singh, P.; Singh, V.P. Snow and Glacier Hydrology; Kluwer Academic: Dordrecht, The Netherlands, 2001; pp. 309–414. [Google Scholar]
  12. Pomeroy, J.W.; Brun, E. Physical properties of snow. In Snow Ecology; Jones, H.G., Pomeroy, J.W., Walker, D.A., Hoham, R.W., Eds.; Cambridge University Press: Cambridge, UK, 2001; pp. 45–126. [Google Scholar]
  13. Bales, R.C.; Molotch, N.P.; Painter, T.H.; Dettinger, M.D.; Rice, R.; Dozier, J. Mountain hydrology of the western United States. Water Resour. Res. 2006, 42, W08432. [Google Scholar] [CrossRef]
  14. Whitaker, A.C.; Sugiyama, H.; Hayakawa, K. Effect of snow cover conditions on the hydrologic regim: Case study in a pluvial-nival watershed, Japan. J. Am. Water Resour. Assoc. 2008, 44, 814–828. [Google Scholar] [CrossRef]
  15. Iida, T.; Kajihara, A.; Okubo, H.; Okajima, K. Effect of seasonal snow cover on suspended sediment runoff in a mountainous catchment. J. Hydrol. 2012, 428–429, 116–128. [Google Scholar] [CrossRef]
  16. Duan, W.L.; He, B.; Takara, K.; Luo, P.P.; Nover, D.; Hu, M.C. Modeling suspended sediment sources and transport in the Ishikari River basin, Japan, using SPARROW. Hydrol. Earth Syst. Sci. 2015, 19, 1293–1306. [Google Scholar] [CrossRef] [Green Version]
  17. Duan, W.L.; Takara, K.; He, B.; Luo, P.P.; Nover, D.; Yamashiki, D. Spatial and temporal trends in estimates of nutrient and suspended sediment loads in the Ishikari River, Japan, 1985 to 2010. Sci. Total Environ. 2013, 461–462, 499–508. [Google Scholar] [CrossRef]
  18. Binh, D.V.; Kantoush, S.; Sumi, T. Changes to long-term discharge and sediment loads in the Vietnamese Mekong Delta caused by upstream dams. Geomorphology 2020, 353, 107011. [Google Scholar] [CrossRef]
  19. Fang, G.H.; Yang, J.; Chen, Y.N.; Li, Z.; Ji, H.P.; Maeyer, P.D. How hydrologic processes differ spatially in a Large Basin: Multi-site and multi-objective modeling in the Tarim River Basin. J. Geophys. Res. Atmos. 2018, 123, 7098–7113. [Google Scholar] [CrossRef]
  20. Delaney, I.; Adhikari, S. Increased subglacial sediment discharge in a warming climate: Consideration of ice dynamics, glacial erosion, and fluvial sediment transport. Geophys. Res. Lett. 2020, 47, e2019GL085672. [Google Scholar] [CrossRef]
  21. Chen, Y.N.; Li, W.H.; Xu, C.C.; Hao, X.M. Effects of climate change on water resources in Tarim River Basin, Northwest China. J. Environ. Sci. 2007, 19, 488–493. [Google Scholar] [CrossRef]
  22. Chen, Y.N.; Su, B.D.; Tao, H.; Zhao, C.Y.; Mao, W.Y. China Climate Change Impact Report: Tarim River Basin; China Meteorological Press: Beijing, China, 2014.
  23. Xu, C.C.; Chen, Y.N.; Hamid, Y.; Tashpolat, T.; Chen, Y.P.; Ge, H.T.; Li, W.H. Long-term change of seasonal snow cover and its effects on river runoff in the Tarim River basin, northwestern China. Hydrol. Processes 2009, 23, 2045–2055. [Google Scholar] [CrossRef]
  24. Mann, H.B. Nonparametric tests against trend. Econometrica 1945, 13, 245–259. [Google Scholar] [CrossRef]
  25. Kendall, M.G. Rank Correlation Methods; Springer: Bosten, MA, USA, 1975. [Google Scholar]
  26. Zhang, F.; Shi, X.N.; Zeng, C.; Wang, L.; Xiao, X.; Wang, G.X.; Chen, Y.; Zhang, H.B.; Lu, X.X.; Immerzeel, W. Recent stepwise sediment flux increase with climate change in the Tuotuo River in the central Tibetan Plateau. Sci. Bull. 2020, 65, 410–418. [Google Scholar] [CrossRef]
  27. Ke, C.Q.; Li, X.C.; Xie, H.J.; Liu, X.; Kou, C. Variability in snow cover phenology in China from 1952 to 2010. Hydrol. Earth Syst. Sci. 2016, 20, 755–770. [Google Scholar] [CrossRef] [Green Version]
  28. Kour, R.; Patel, N.; Krishna, A.P. Assessment of temporal dynamics of snow cover and its validation with hydro-meteorological data in parts of Chenab Basin, western Himalayas. Sci. China Earth Sci. 2016, 59, 1081–1094. [Google Scholar] [CrossRef]
  29. Huang, Y.Y. Study on the Relationship between the Changes of Snow Cover Area and Runoff in Upper Reaches of Yalong River; Lanzhou Jiaotong University: Lanzhou, China, 2016. (In Chinese) [Google Scholar]
  30. Zheng, H.G.; Zhang, L.; Zhu, R.R.; Liu, C.M.; Sato, Y.; Fukushima, Y. Responses of streamflow to climate and land surface change in the headwaters of the Yellow River Basin. Water Resour. Res. 2009, 45, W00A19. [Google Scholar] [CrossRef]
  31. Sanmiguel-Vallelado, A.; Camarero, J.J.; Morán-Tejeda, E.; Gazol, A.; Colangelo, M.; Alonso-González, E.; López-Moreno, J.I. Snow dynamics influence tree growth by controlling soil temperature in mountain pine forests. Agric. For. Meteorol. 2021, 296, 108205. [Google Scholar] [CrossRef]
  32. Hu, C.H.; Zhang, X.M.; Zhao, Y. Cause analysis of the centennial trend and recent fluctuation of the Yellow River sediment load. Adv. Water Sci. 2020, 31, 725–733. Available online: http://kns.cnki.net/kcms/detail/32.1309.P.20200611.1614.008.html (accessed on 2 October 2022). (In Chinese).
  33. Zhang, Q.F.; Chen, Y.N.; Li, Z.; Fang, G.H.; Xiang, Y.Y.; Li, Y.P.; Ji, H.P. Recent changes in water discharge in snow and glacier melt-dominated rivers in the Tianshan Mountains, Central Asia. Remote Sens. 2020, 12, 2704. [Google Scholar] [CrossRef]
  34. Wang, X.L.; Luo, Y.; Sun, L.; Shafeeque, M. Different climate factors contributing for runoff increases in the high glacierized tributaries of Tarim River Basin, China. J. Hydrol. Reg. Stud. 2021, 36, 100845. [Google Scholar] [CrossRef]
  35. Shao, Q.Q.; Xiao, T.; Liu, J.Y.; Qi, Y.Q. Soil erosion rates and characteristics of typical alpine meadow using 137Cs technique in Qinghai-Tibet Plateau. Chin. Sci. Bull. 2011, 56, 1708–1713. [Google Scholar] [CrossRef] [Green Version]
  36. An, S.S.; Darboux, F.; Cheng, M. Revegetation as an efficient means of increasing soil aggregate stability on the Loess Plateau (China). Geoderma 2013, 209–210, 75–85. [Google Scholar] [CrossRef]
  37. Qian, J.; Zhang, L.; Wang, W. Effects of vegetation cover and slope length on nitrogen and phosphorus loss from a sloping land under simulated rainfall. Environ. Stud. 2014, 23, 835–843. [Google Scholar]
  38. Li, J.Y.; Zhang, J. Natural controls of sediment yield in the major rivers in China. J. Ocean Univ. Qingda 2003, 33, 565–573. (In Chinese) [Google Scholar]
  39. Li, D.F.; Lu, X.X.; Yang, X.K.; Chen, L.; Lin, L. Sediment load responses to climate variation and cascade reservoirs in the Yangtze River: A case study of the Jinsha River. Geomorphology 2018, 322, 41–52. [Google Scholar] [CrossRef]
Figure 1. Study area of the Tarim River Basin. Note: The letter R means river.
Remotesensing 14 05848 g001
Figure 2. Annual sediment discharge and suspended sediment concentration at the main rivers of the TRB.
Remotesensing 14 05848 g002
Figure 3. Intra-annual variation of sediment discharge at the main rivers of the TRB.
Remotesensing 14 05848 g003
Figure 4. Average annual and monthly SCAP in the Kaidu River Basin, the Aksu River Basin, the Yarkand River Basin, and the Yulong Kashgar River Basin over the period of 2001–2019. (a) Spatial averaged SCAP in the Tarim River Basin; (b) monthly SCAP in different sub-basins of the Tarim River Basin.
Remotesensing 14 05848 g004
Figure 5. Variations of maximum, average, and minimum SCAP in the Tarim River Basin during 2001–2019.
Remotesensing 14 05848 g005
Figure 6. Seasonal variations of SCAP in the Tarim River Basin from 2001 to 2019.
Remotesensing 14 05848 g006
Table 1. Basic information of main rivers and hydrologic stations in the TRB.
RiverHydrologic StationLongitudeLatitudeAltitude of Hydrologic Station (m)Drainage Area
(104 km2)
Slope of River
(‰)
Average Runoff (2001–2019)
(108 m3)
Kaidu RiverYanqi86°34′E42°02′N10582.254.4526.19
Aksu RiverXidaqiao80°15′E41°07′N11004.311.2543.55
Yarkand RiverKaqun76°54′E37°59′N13705.024.88 [6]72.20
Yulong Kashgar RiverTongguziluoke79°55′E36°49′N16501.465.3725.64
RiverASD (2001–2019)
(109 kg/year)
Runoff Depth
(mm)
Sediment Modulus
(t/km2)
Glacierization
(%)
The Values of the Runoff Contribution
Kaidu River0.3116.4013.481.21Glacier-melt water: 14.1%;
Precipitation and snow-melt water: 45.3%.
Aksu River15.91101.04369.189.46Glacier-melt water: 24.7–52.4%;
Snow-melt water and precipitation: 30.4–45.1%.
Yarkand River33.78144.82672.891.45Glacier-melt water: 64%;
Snow and precipitation: 13.4%.
Yulong Kashgar River14.31175.60980.390.30Glacier-melt water: 64.9%;
Snow-melt water and precipitation: 17%.
Table 2. Ten-year change rates of precipitation, temperature and annual runoff, and their significance of major rivers in the TRB.
RiverPrecipitation
(mm/10a)
Temperature
(°C/10a)
Annual Runoff
(108m3/10a)
Kaidu River4.200.243.10
Aksu River5.480.37−3.56
Yarkand River−3.830.42 *3.75
Yulong Kashgar River4.630.280.18
Note: * indicates a significant correlation at the 0.05 level.
Table 3. Characteristics of annual and seasonal SCAP in four typical river basins in the TRB.
BasinAnnual Average SCAP (%)CV Value
AnnualSpringSummerAutumnWinter
Kaidu River31.360.160.230.880.270.16
Aksu River35.780.120.150.130.220.15
Yarkand River27.050.110.140.140.160.18
Yulong Kashgar River32.260.050.080.090.120.13
Table 4. Relationship between ASD and relative indicators.
River Annual RunoffPrecipitationTemperatureSCAP
SpringSummerAutumnWinter
Kaidu RiverPearson correlation0.54 *−0.050.10−0.38−0.16−0.54 *−0.56 *
Sig. (two-tailed)0.020.850.700.150.540.030.02
Sensitivity coefficient2.60−0.142.27−0.72−0.28−2.94−5.33
Contribution rate62.3%−8.0%13.4%−17.7%−17.3%−87.2%−59.8%
Aksu RiverPearson correlation0.59 **−0.260.050.06−0.35−0.58 *−0.37
Sig. (two-tailed)0.010.280.460.820.170.020.16
Sensitivity coefficient1.02−0.270.480.15−1.46−1.26−1.09
Contribution rate27.8%−11.9%2.2%1.9%−17.8%−19.0%−12.5%
Yarkand RiverPearson correlation0.88 **0.17−0.320.55 *0.16−0.020.32
Sig. (two-tailed)0.000.500.200.030.550.950.22
Sensitivity coefficient2.400.14−3.451.920.58−0.050.79
Contribution rate40.6%7.9%−14.0%23.5%9.1%−0.8%15.0%
Yulong Kashgar RiverPearson correlation0.78 **0.75 **−0.120.350.28−0.20−0.03
Sig. (two-tailed)0.000.000.620.190.270.450.90
Sensitivity coefficient2.880.85−2.173.171.89−1.29−0.19
Contribution rate66.9%58.0%−10.4%26.9%22.7%−14.2%−2.8%
Note: * indicates a significant correlation at the 0.05 level; ** indicates a significant correlation at the 0.01 level. They are shown in bold in the table.
Table 5. Relationship between SCAP in autumn and winter and temperature in autumn in the Kaidu River, between annual runoff and precipitation in the Yulong Kashgar River.
Kaidu River SCAPYulong Kashgar River Annual Runoff
AutumnWinter
Temperature in AutumnPearson correlation−0.51 *−0.51 *PrecipitationPearson correlation0.69 **
Sig.(2-tailed)0.040.05Sig.(2-tailed)0.00
Note: * indicates a significant correlation at the 0.05 level; ** indicates a significant correlation at the 0.01 level.
Publisher’s Note: MDPI stays neutral with regard to jurisdictional claims in published maps and institutional affiliations.

