


Remote Sensing-Supported Flood Forecasting of Urbanized Watersheds—A Case Study in Southern China
Abstract
1. Introduction
2. Methods and Materials
2.1. Liuxihe Model
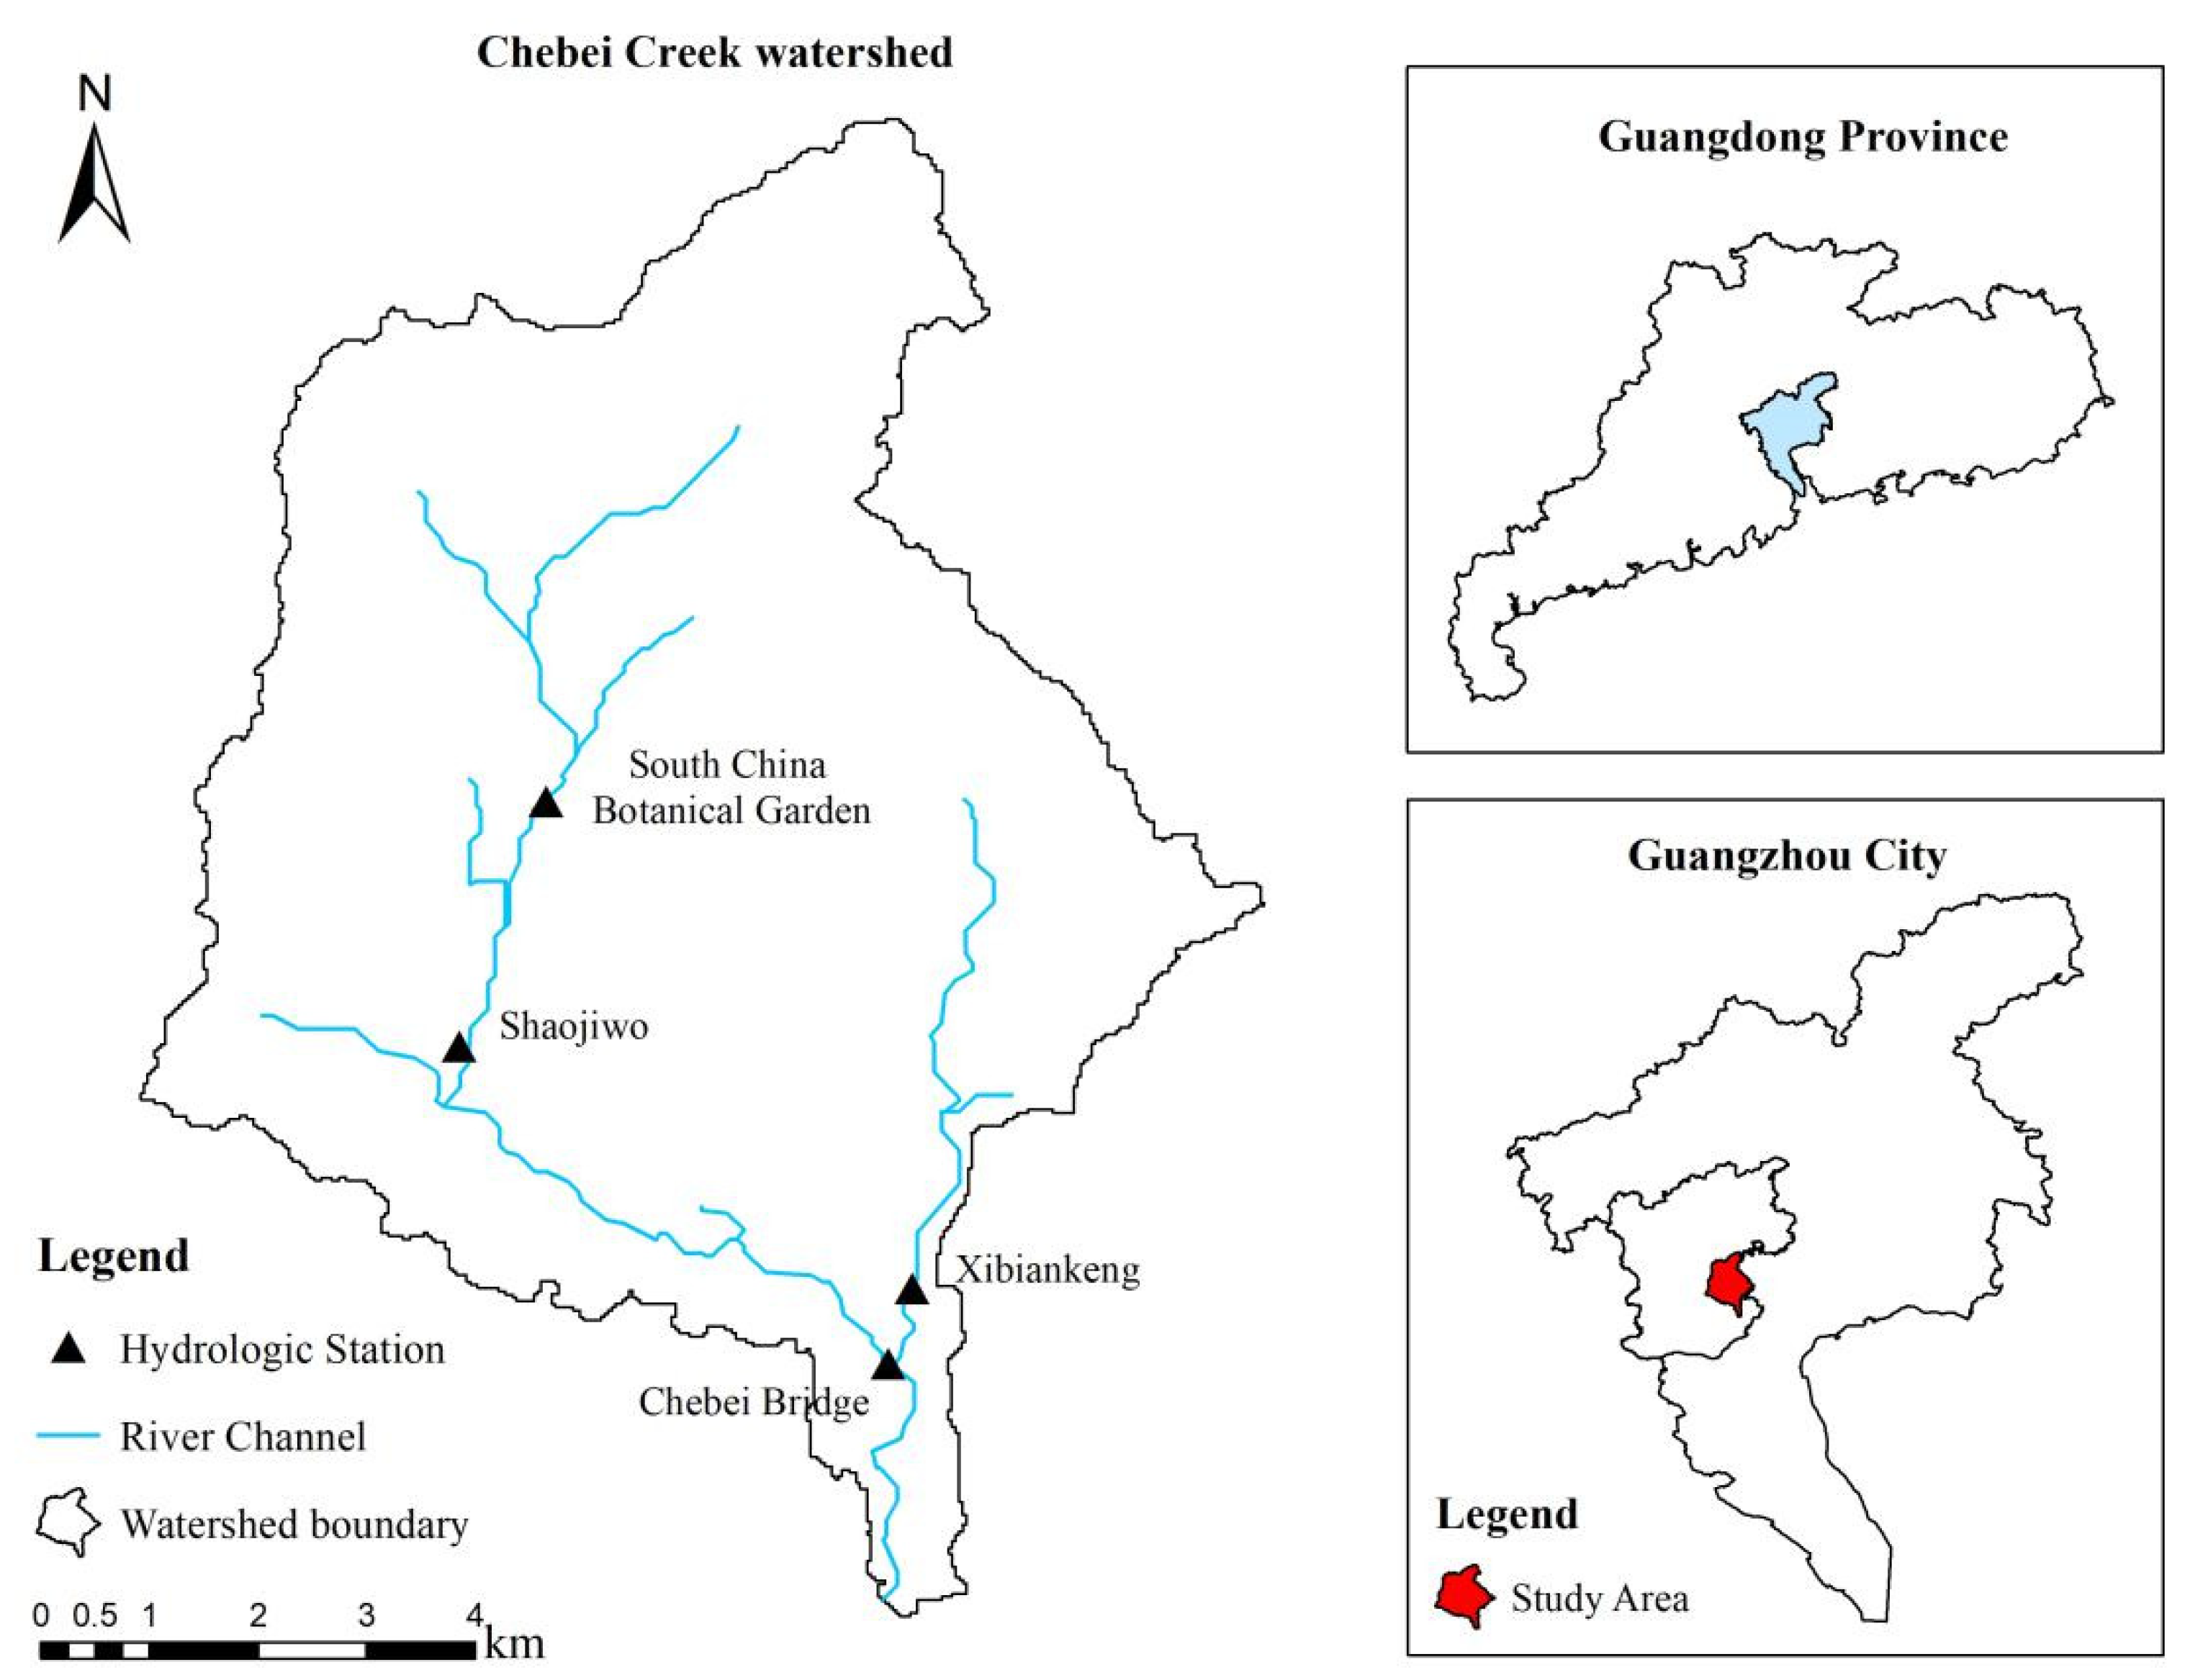
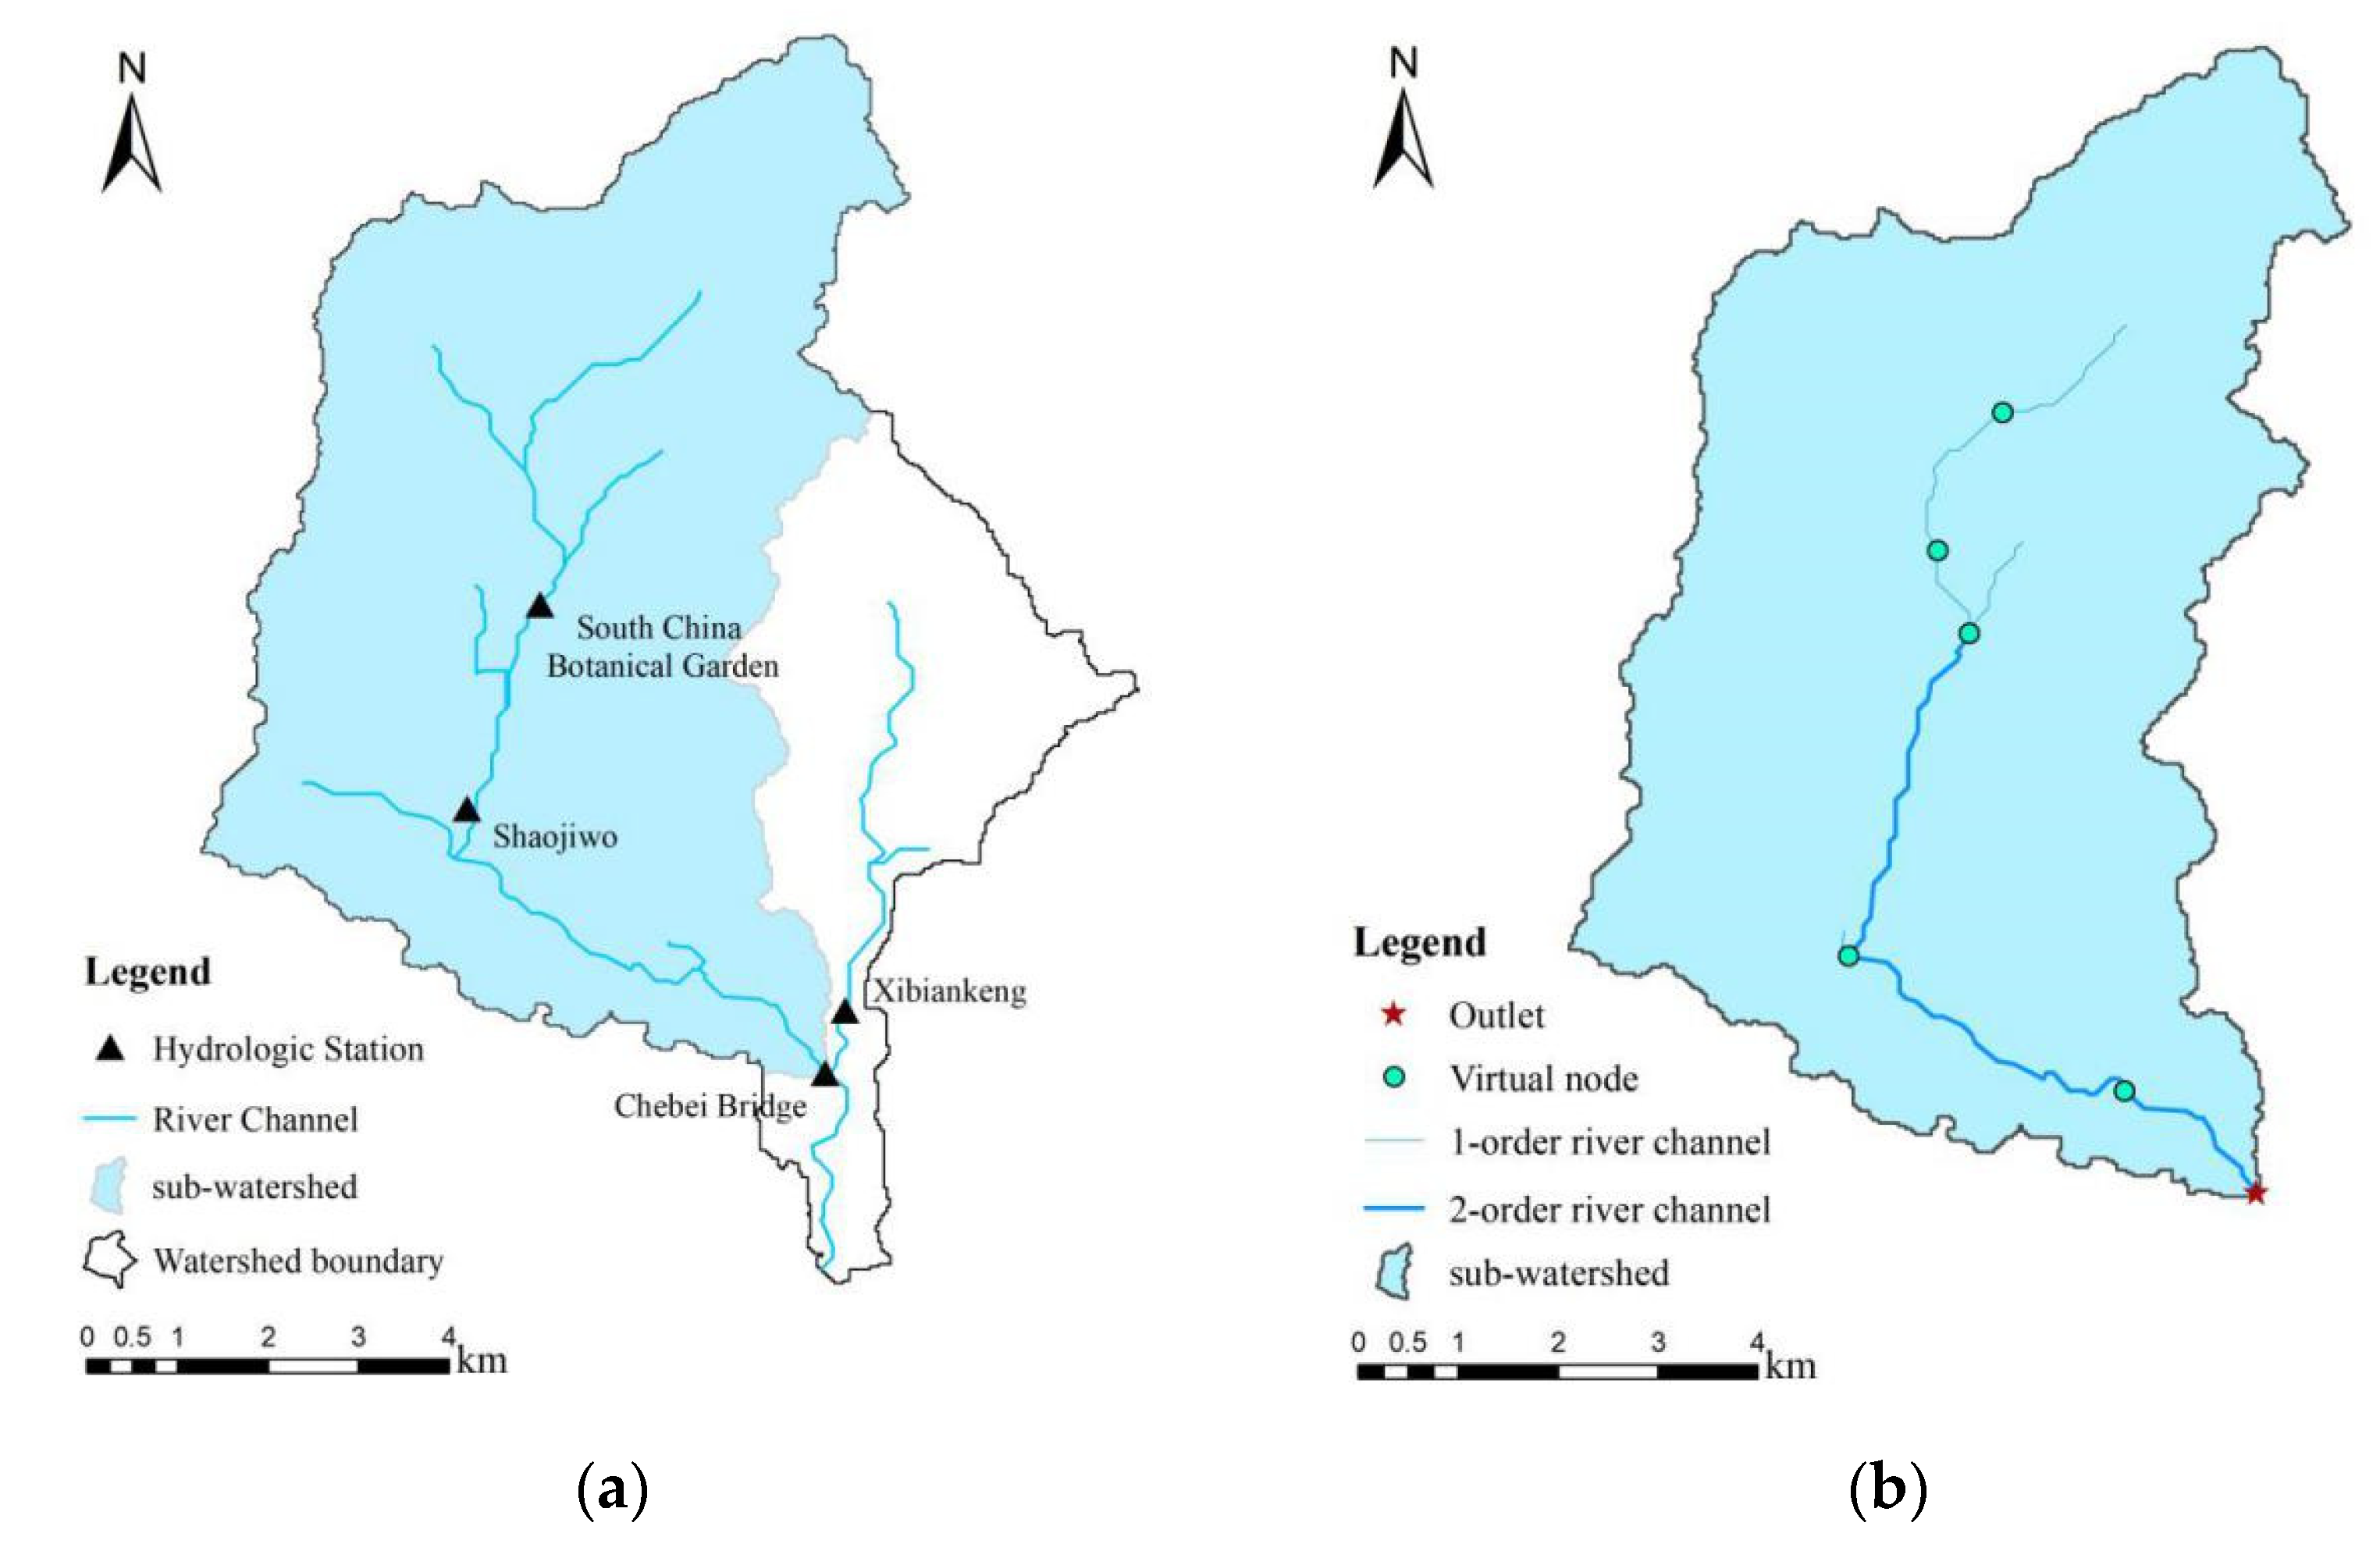
2.2. Chebei Creek Watershed
2.3. Terrain Property Data
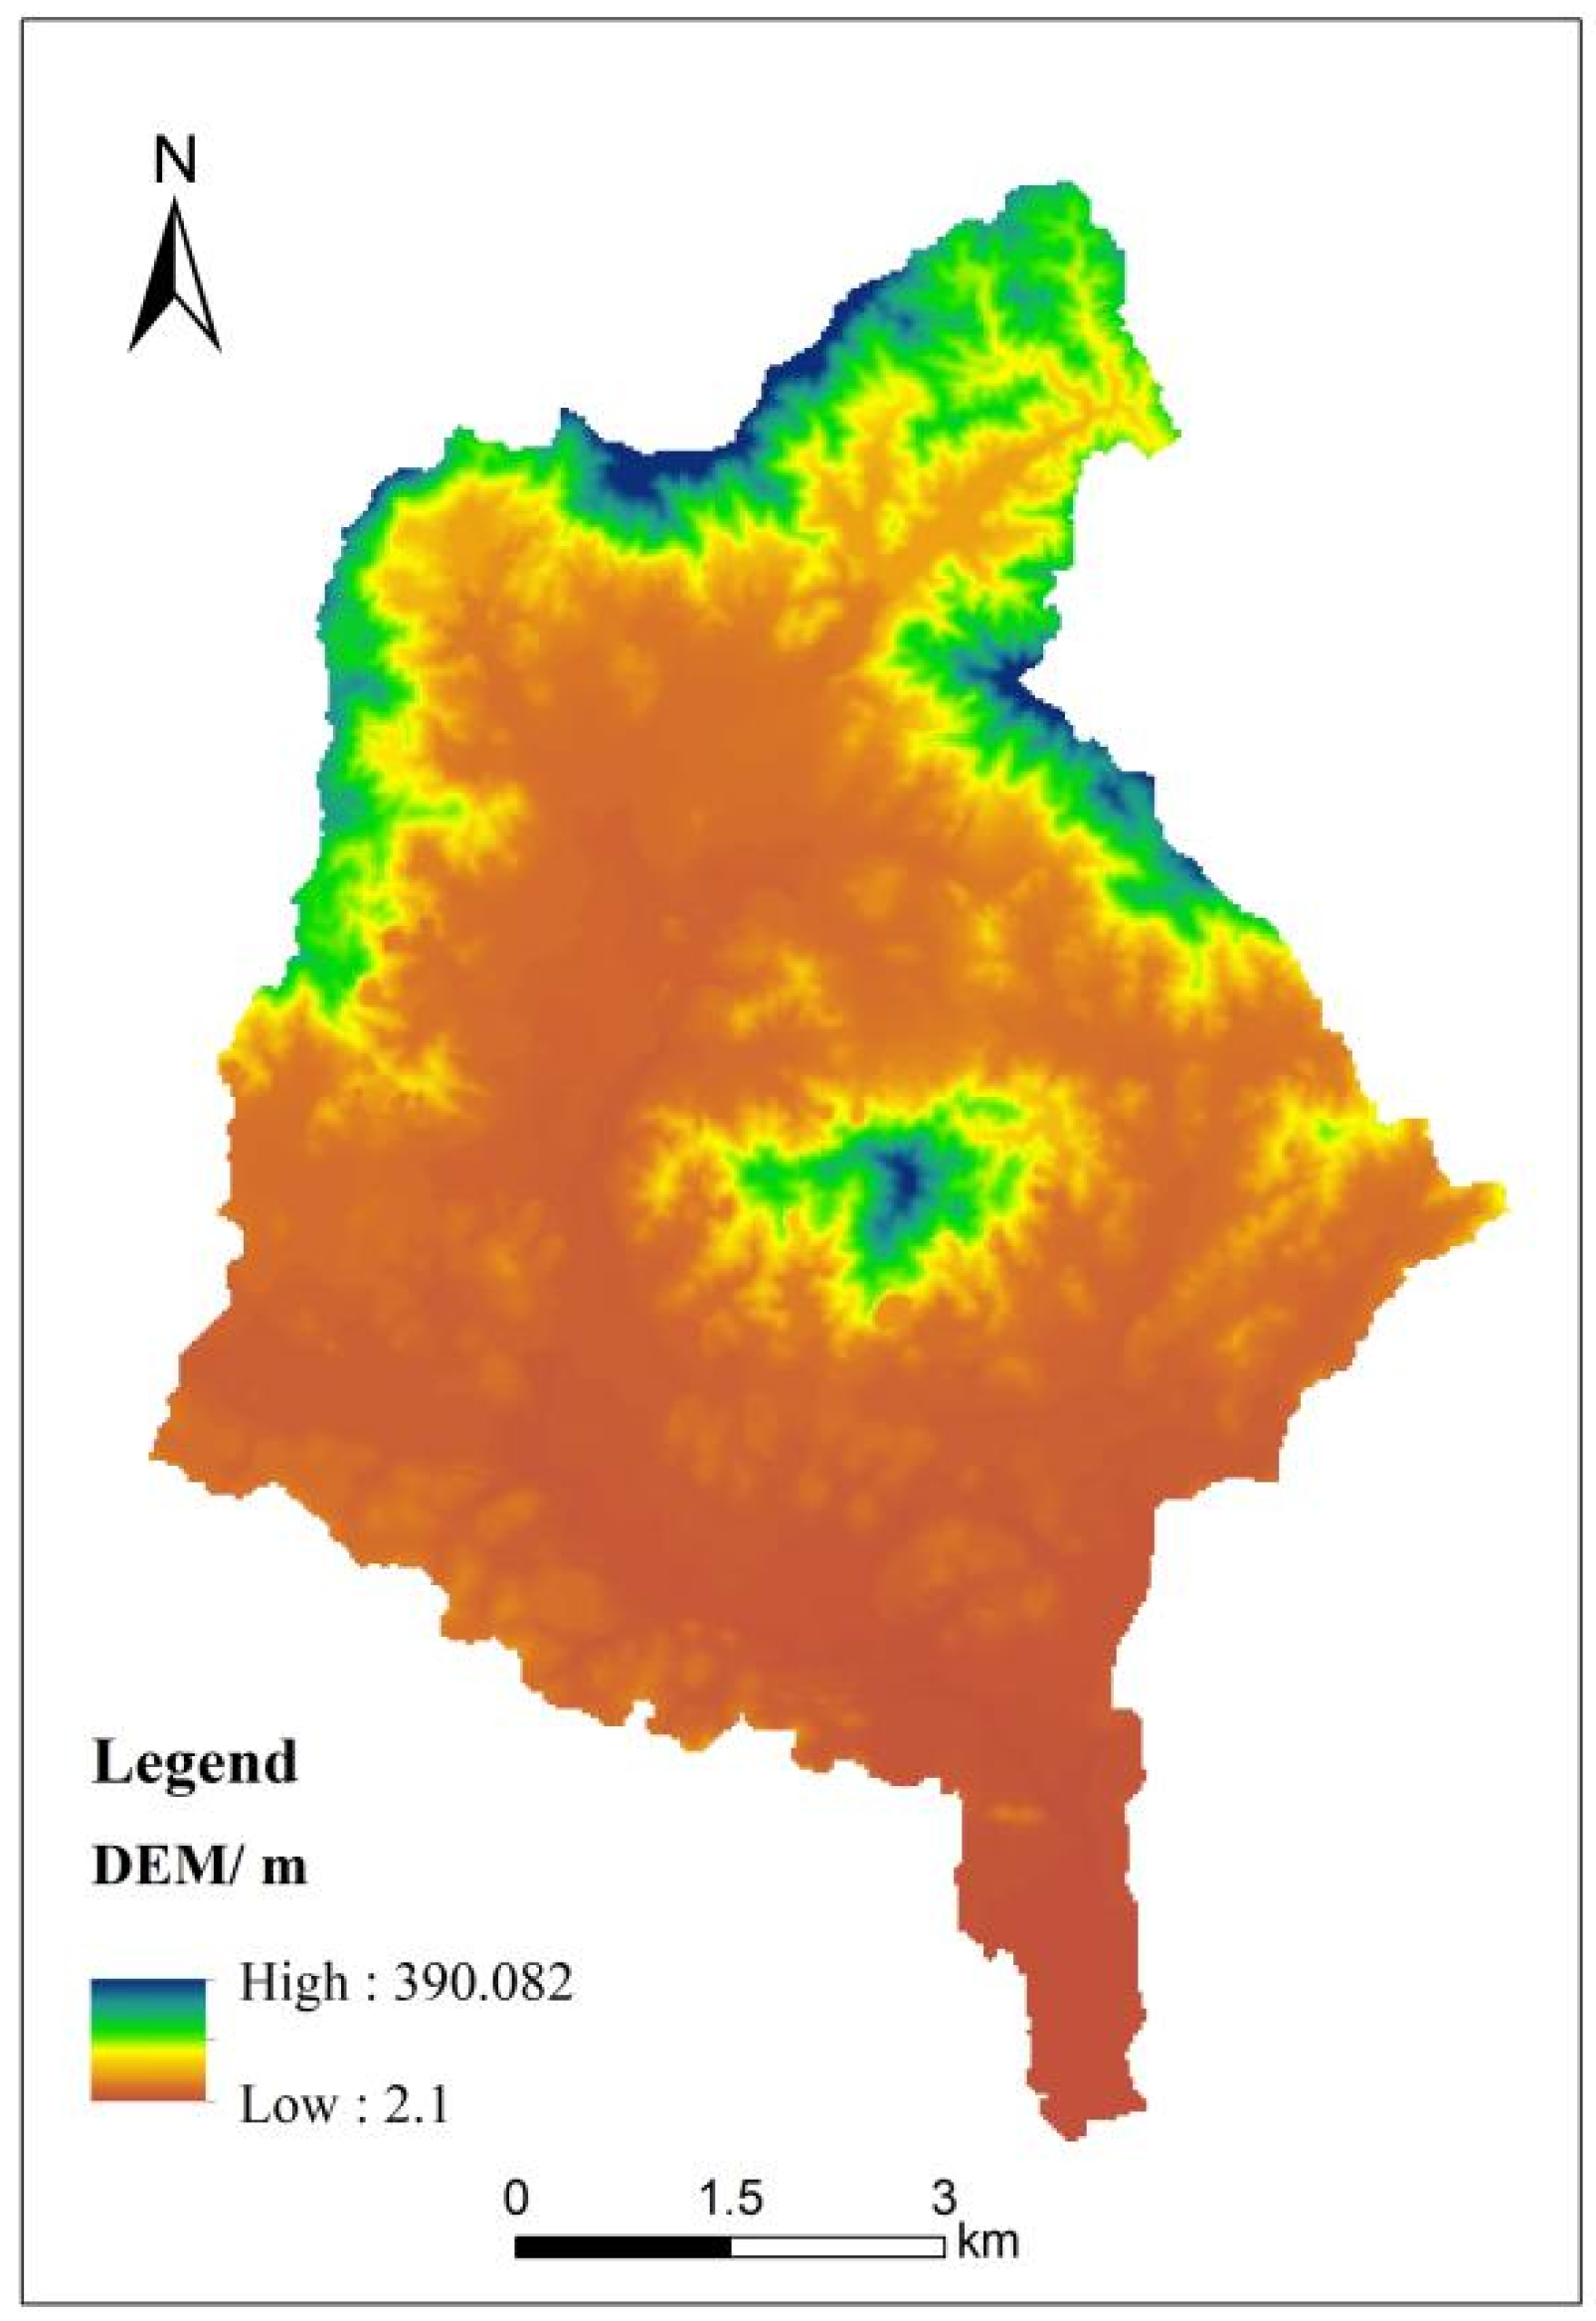
2.3.1. Digital Elevation Model Data
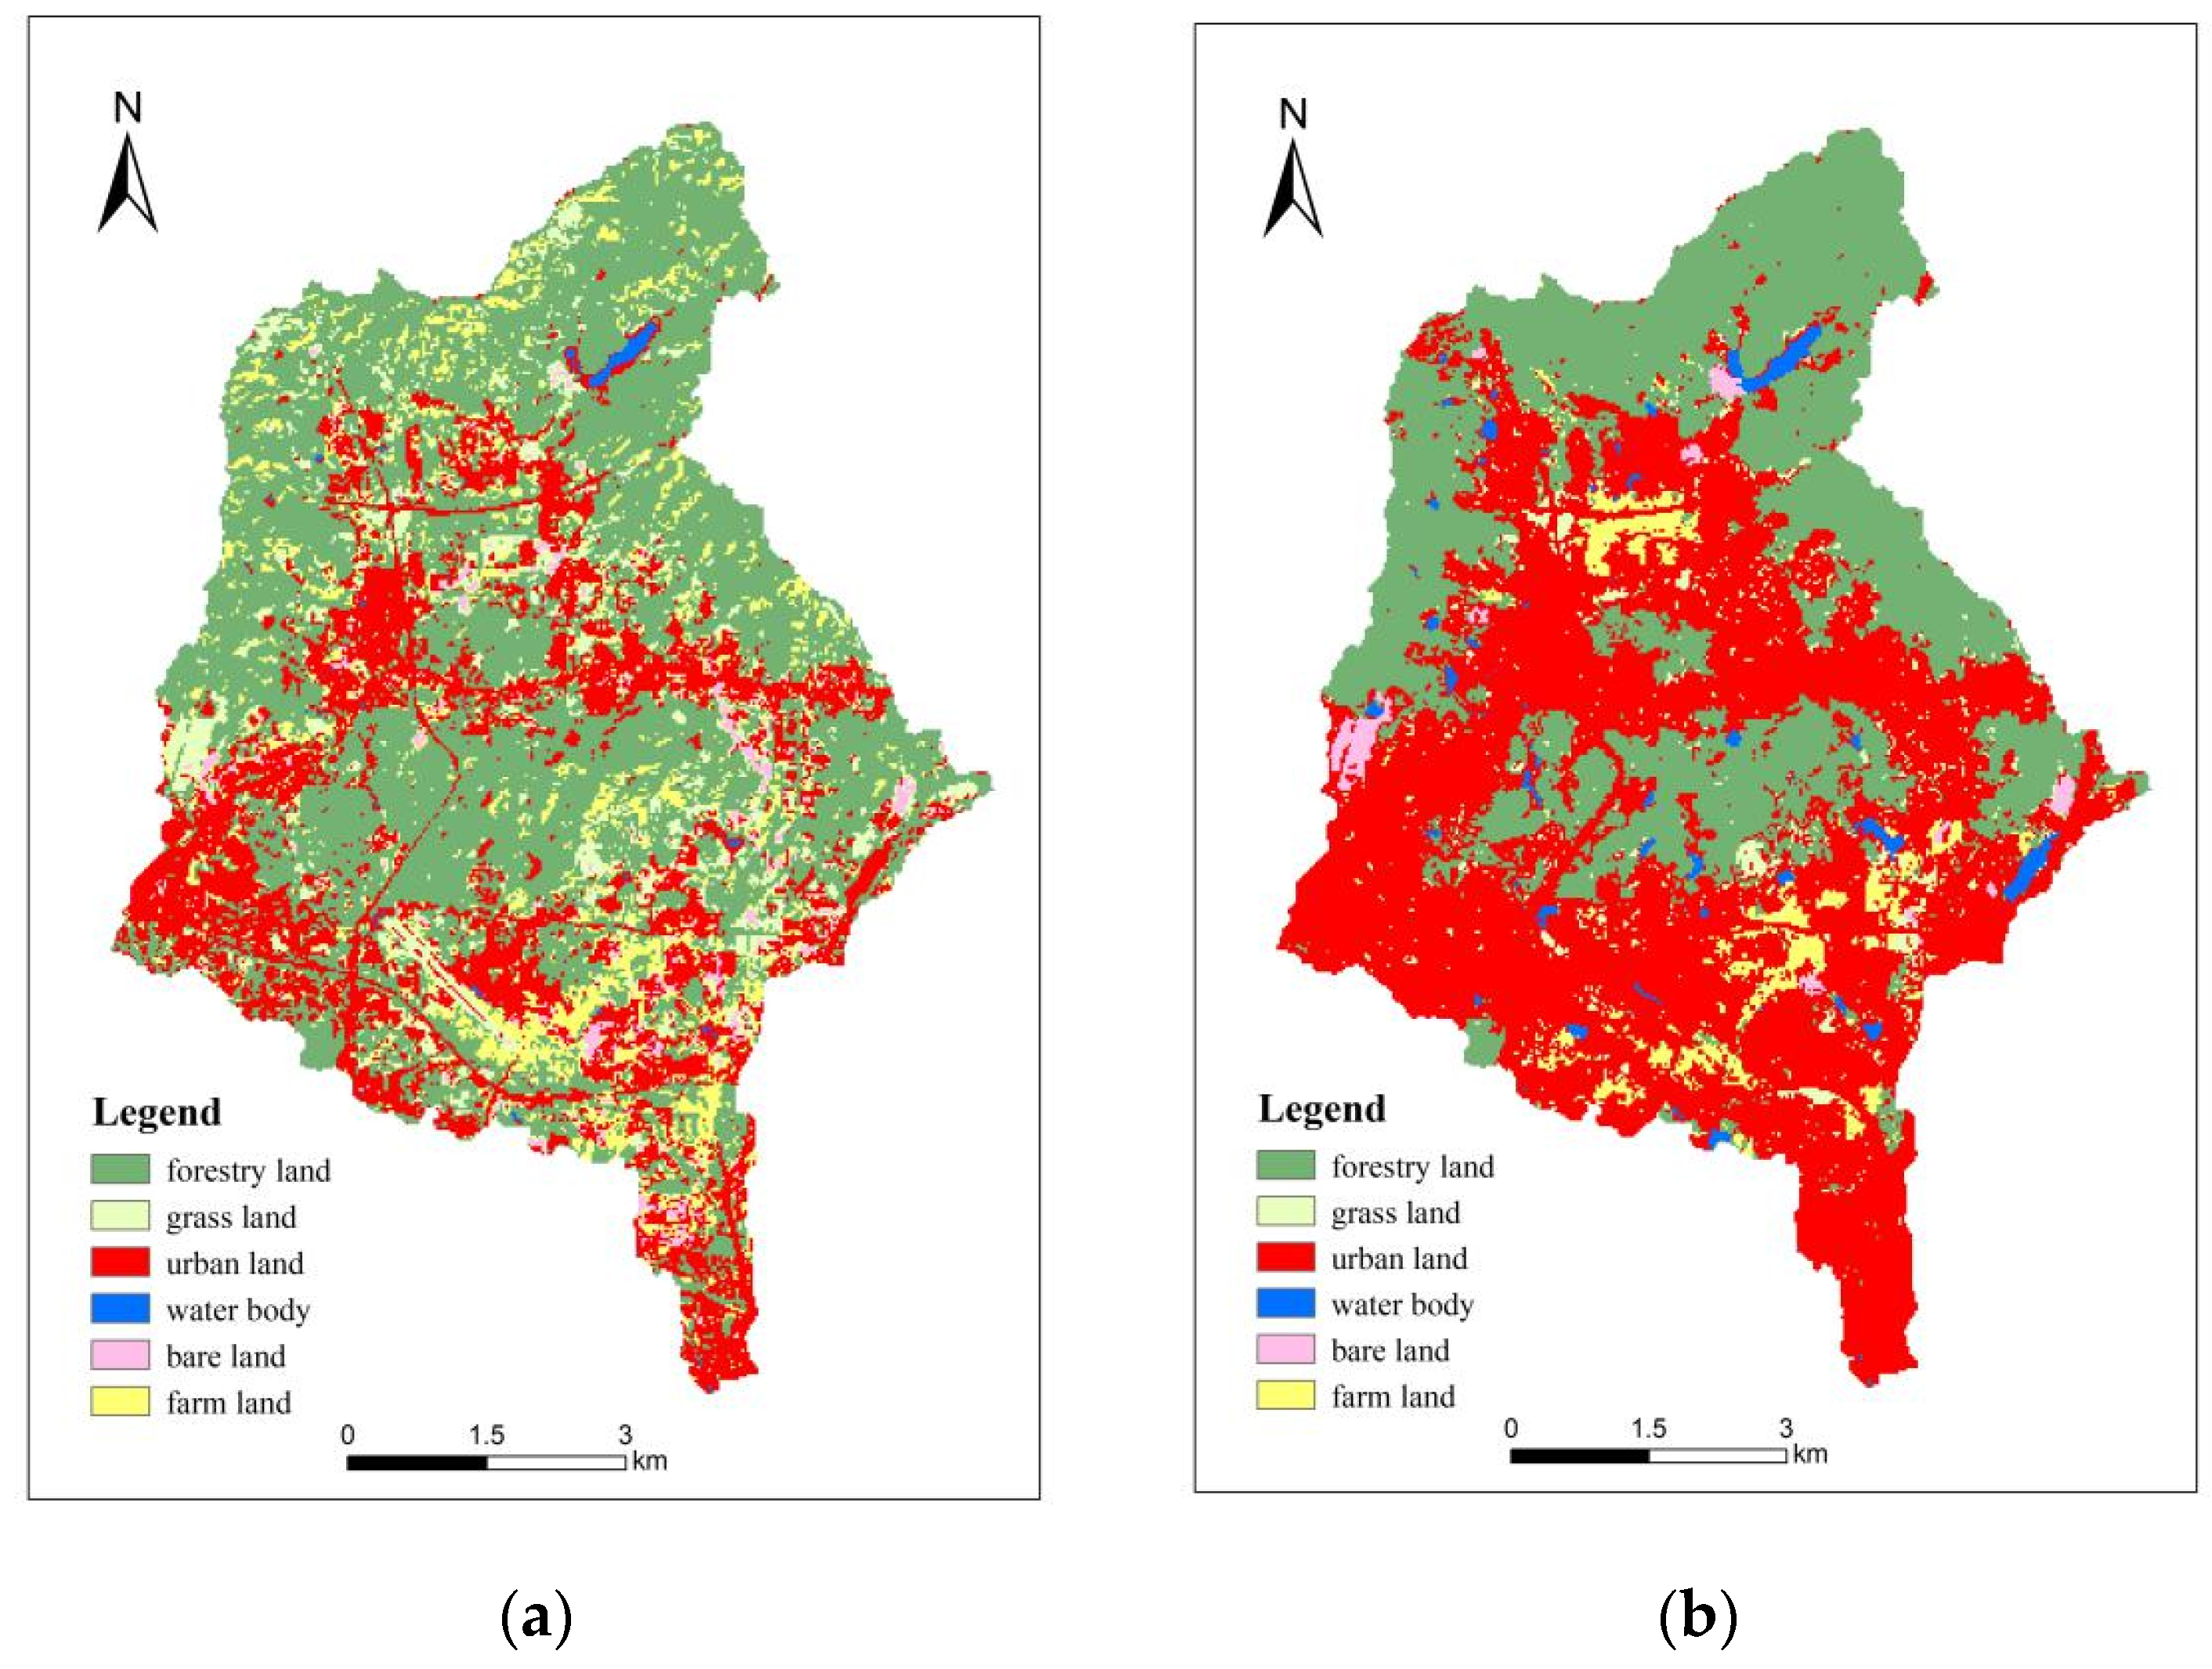
2.3.2. Land Use/Cover Data
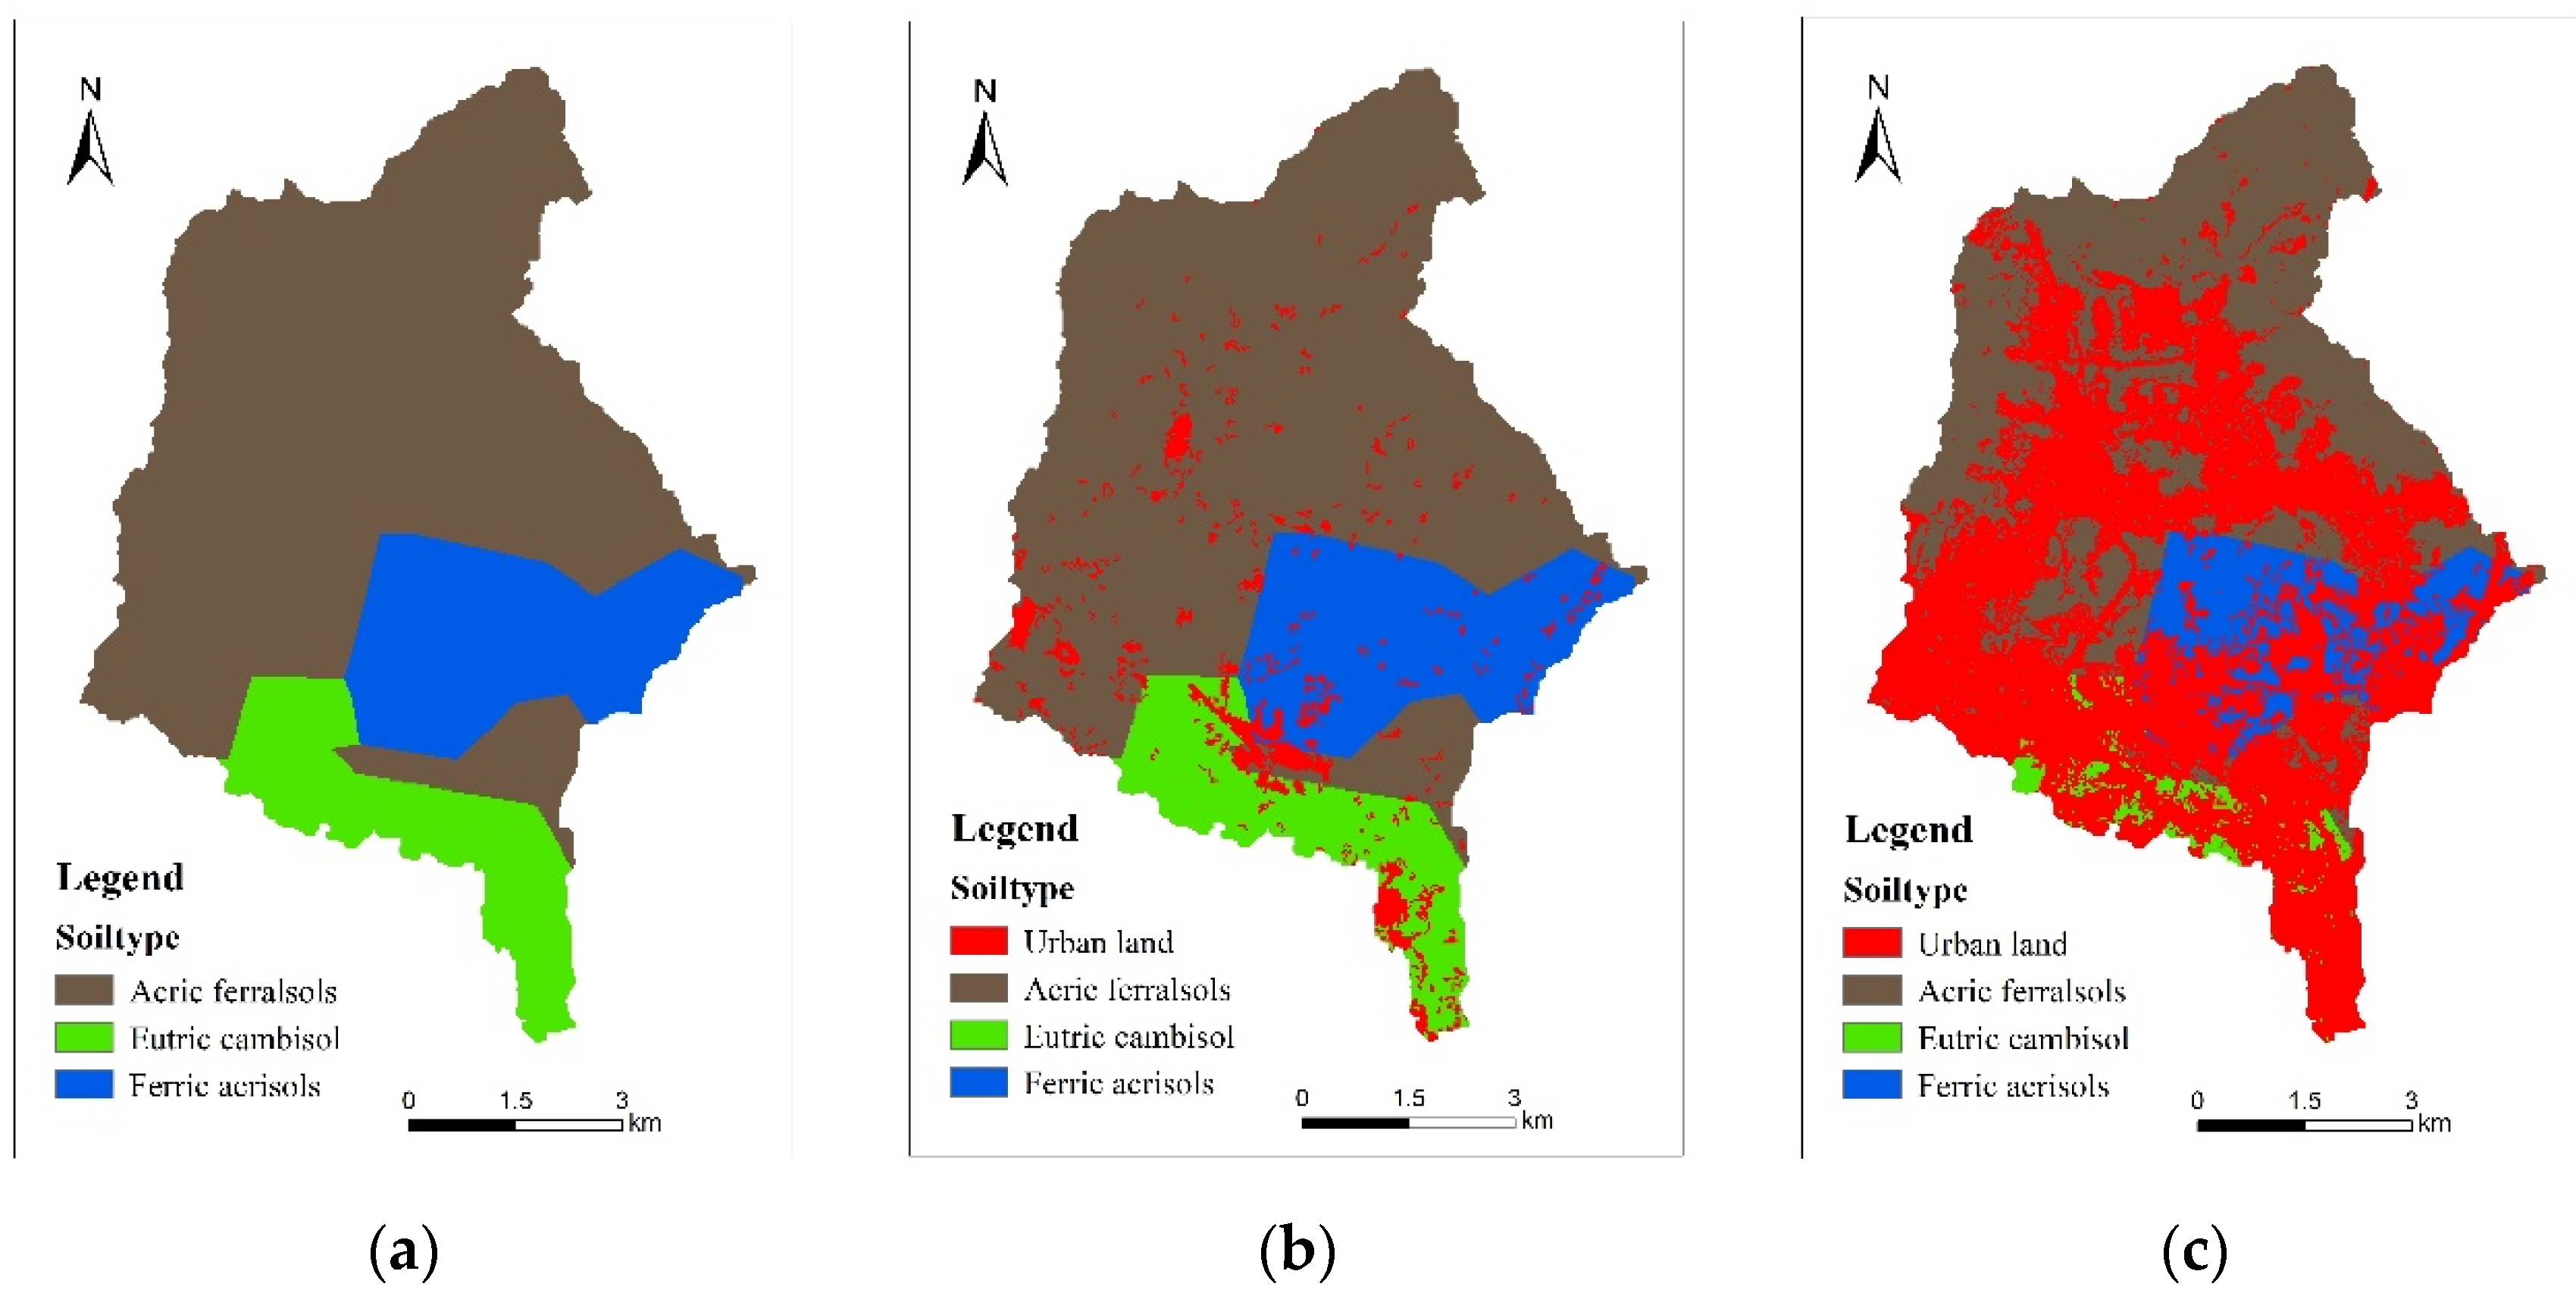
2.3.3. Soil Type Data
2.4. Hydrological Data
3. Model Implementation
3.1. Liuxihe Model Setup
3.2. Liuxihe Model Parameters
3.3. Parameter Optimization of the Liuxihe Model
3.4. Flood Simulation Results and Analysis
4. Results
4.1. Flood Forecasting in an Urbanized Watershed Using the Liuxihe Model
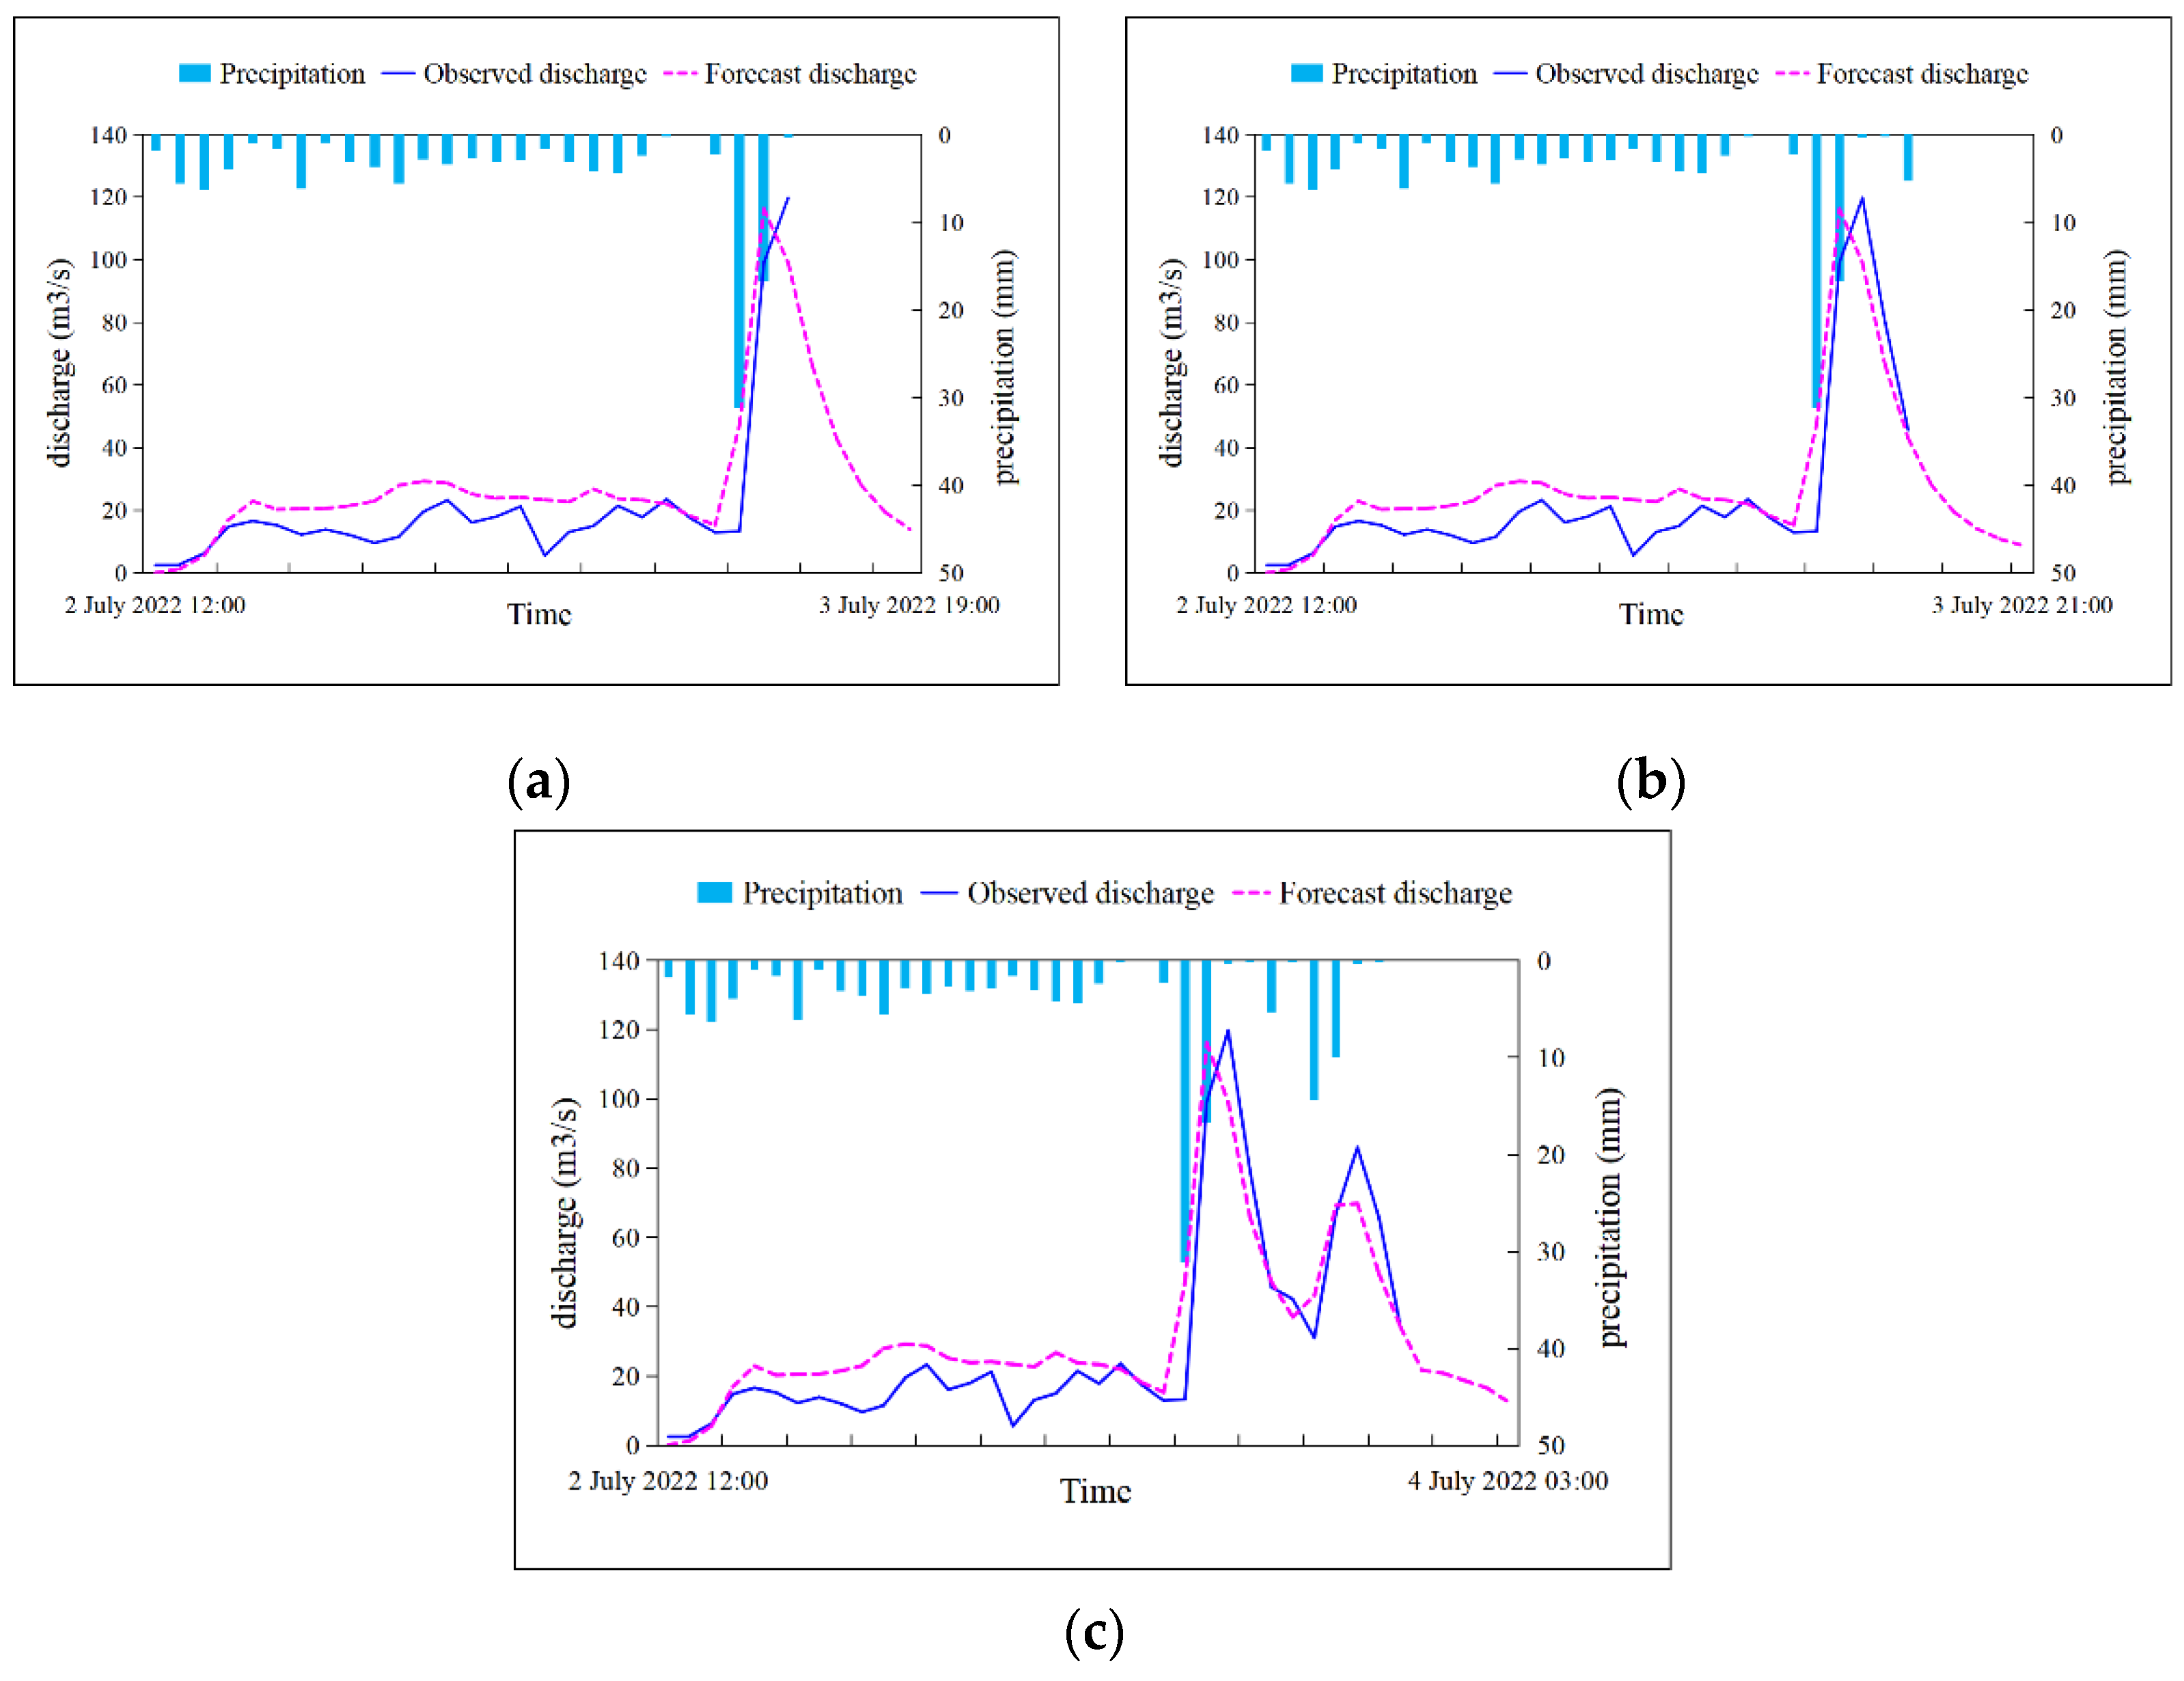
4.1.1. Forecast of the 15 June 2022 Flood
4.1.2. Forecast of the 2 July 2022 Flood
5. Discussion
- (i)
- As noted above, real-time flood forecasting in an urbanized watershed requires timely and stable rainfall station data. A problem with the station data will greatly reduce the accuracy of forecasts.
- (ii)
- Although the PBDHM and refined underlying surface data of the watershed were prepared, real-time flood forecasting still relied on a cloud computing platform with a powerful calculation ability. In addition, the timely mobilization and deployment of operators is key to real-time flood forecasting.
- (iii)
- Real-time flood forecasting requires the consistent maintenance of rainfall station equipment. Rainfall stations in urbanized watersheds are generally powered by solar energy to maintain equipment operation. However, a heavy rainstorm in an urbanized watershed, particularly one in which rainfall continues for a long time, may affect the normal operation of the equipment and the stability of the data transmission signal.
6. Conclusions
- The flood process in the watershed at different rainfall intensities was simulated. Using the optimized parameters, three floods (large, medium, and small) were simulated. From the simulation results, areas with a high degree of urbanization had a flood peak duration of only 1 h, and the flood water level line showed a sharp rising and falling pattern. These findings will improve flood modeling and forecasting in urbanized areas.
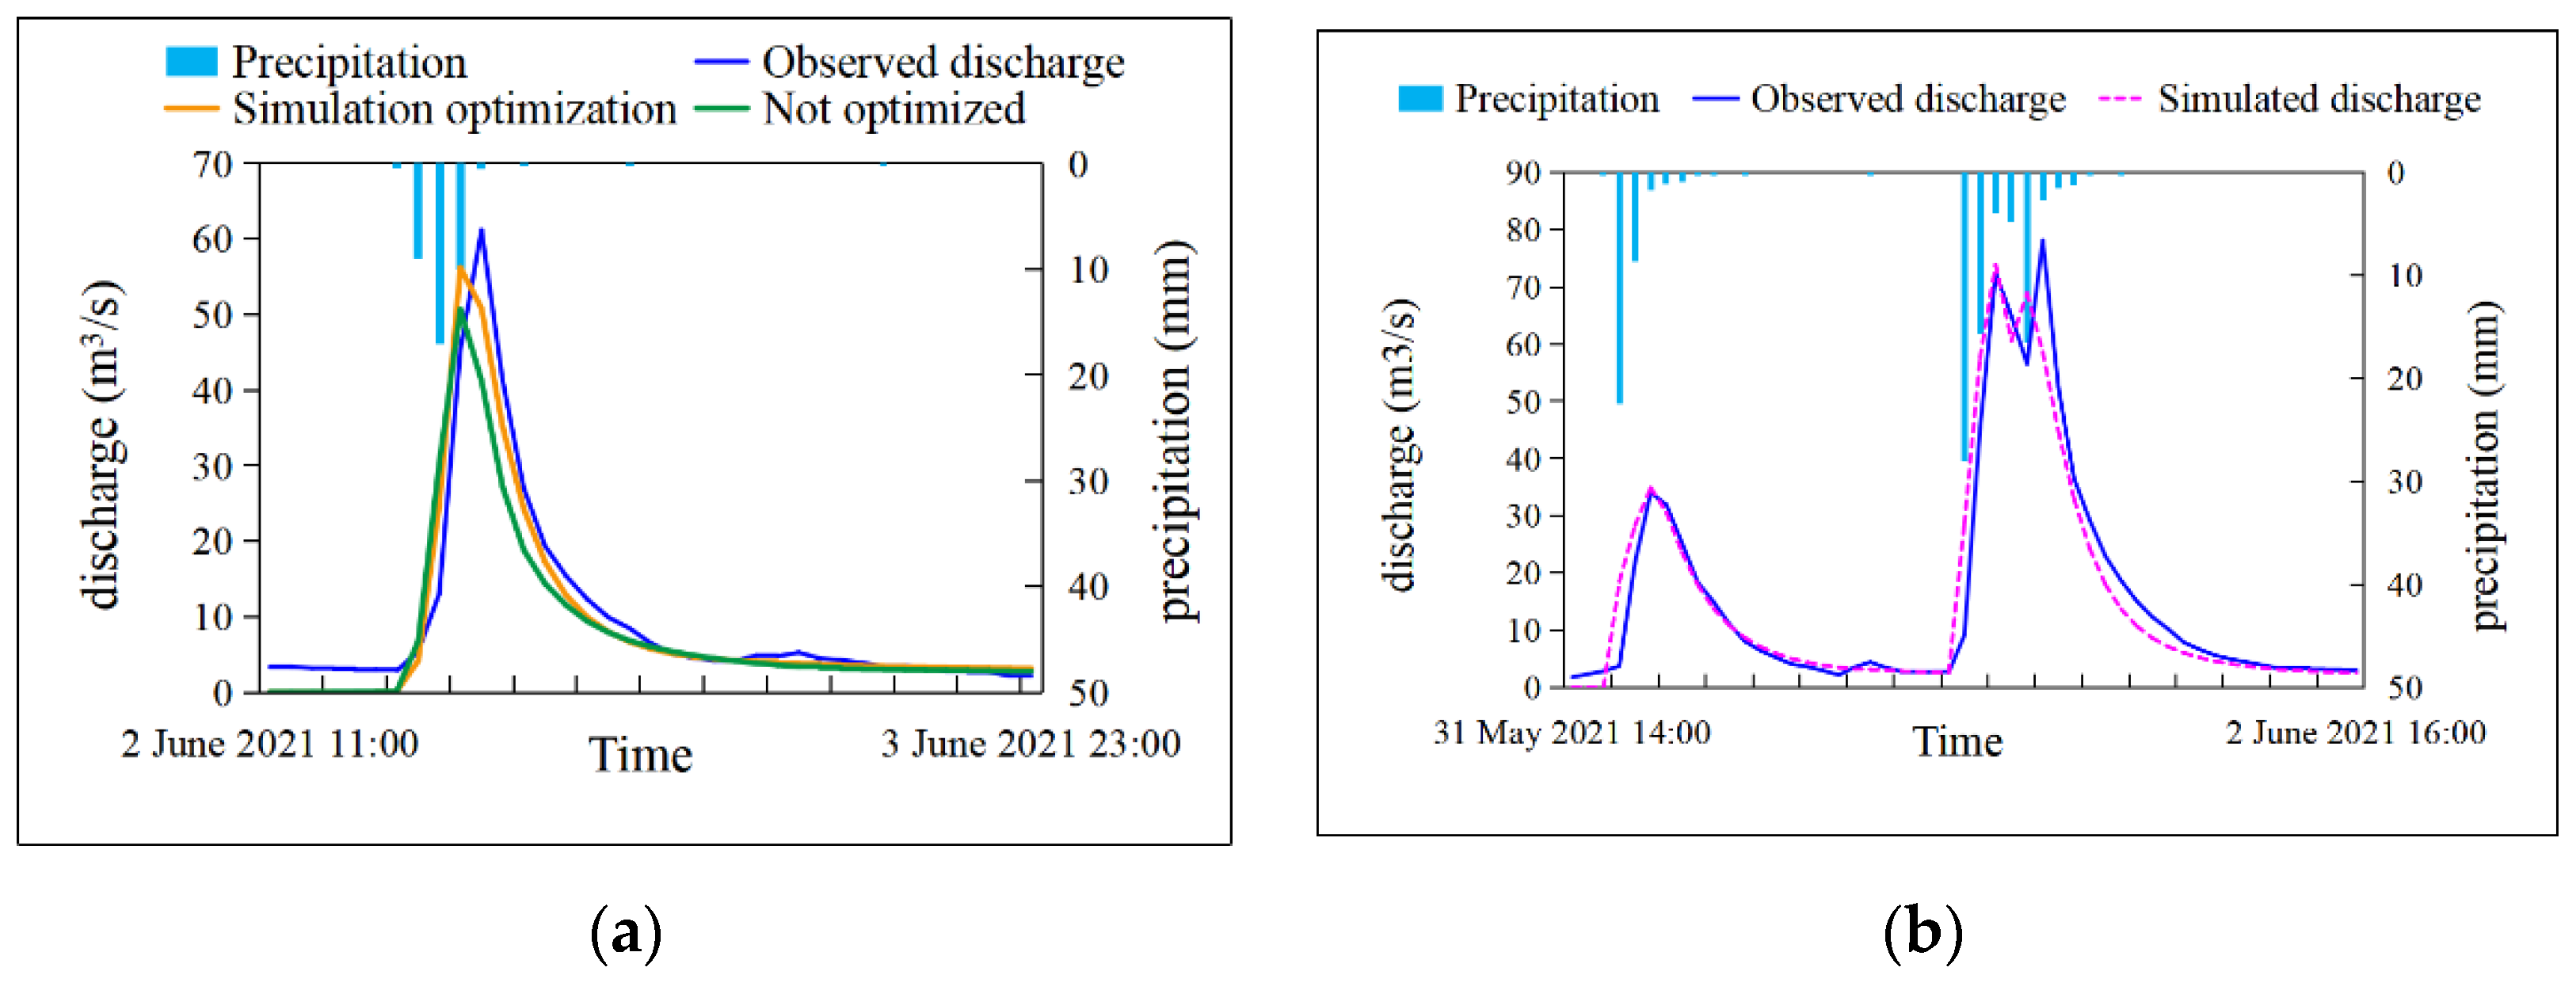
- The 15 June 2022 flood was the first flood in the Chebei Creek River Basin in 2022. The flood rose and fell sharply, complicating forecasting. Rain continued after the observed flood peak of this flood, when the observed flow had begun to fall. In addition, during this forecast, Shaojiwo station, one of three rainfall stations in the Chebei Creek watershed, experienced a failure and produced no data, which undoubtedly affected the forecast accuracy. The Liuxihe model had a forecast accuracy of 83.95% for the peak flow of this flood.
- The 2 July 2022 flood was the second one. It also rose and fell sharply and showed two peaks, further hampering forecasting efforts. The observed flow of the flood rose from less than 20 m3/s to nearly 100 m3/s in less than an hour. After reaching the flood peak, it quickly fell, and a second flood peak appeared, which increased the difficulty of forecasting. The model had a forecast accuracy of 97.06%, and the peak was 1 h ahead of the observed peak.
- The Liuxihe model is a PBDHM that can meet the accuracy requirements for flood flow forecasting to support reservoir flood control operations. It requires the optimization of its parameters. Model parameters derived from physical data have uncertainty, and the performance of the model can be significantly improved through optimization. The two flood forecasting results presented in this study achieved a high accuracy, demonstrating the excellent performance of the Liuxihe model for real-time flood forecasting in urbanized watersheds such as Chebei Creek.
Author Contributions
Funding
Data Availability Statement
Conflicts of Interest
References
- United Nations Population Division (UNPD). World Population Prospects, the 2010 Revision. New York: United Nations. Available online: http://esa.un.org/wpp (accessed on 25 November 2022).
- Rounsevell, M.; Reginster, I.; Araújo, M.; Carter, T.; Dendoncker, N.; Ewert, F.; House, J.; Kankaanpää, S.; Leemans, R.; Metzger, M.; et al. A coherent set of future land use change scenarios for Europe. Agric. Ecosyst. Environ. 2006, 114, 57–68. [Google Scholar] [CrossRef]
- Jedwab, R.; Christiaensen, L.; Gindelsky, M. Demography, urbanization and development: Rural push, urban pull and urban push? J. Urban Econ. 2017, 98, 6–16. [Google Scholar] [CrossRef]
- Hollis, G.E. The effect of urbanization on floods of different recurrence interval. Water Resour. Res. 1975, 11, 431–435. [Google Scholar] [CrossRef]
- Poff, N.L.; Bledsoe, B.P.; Cuhaciyan, C.O. Hydrologic variation with land use across the contiguous United States: Geomorphic and ecological consequences for stream ecosystems. Geomorphology 2006, 79, 264–285. [Google Scholar] [CrossRef]
- Yira, Y.; Diekkrüger, B.; Steup, G.; Bossa, A. Modeling land use change impacts on water resources in a tropical West African catchment (Dano, Burkina Faso). J. Hydrol. 2016, 537, 187–199. [Google Scholar] [CrossRef]
- Luo, P.; Zheng, Y.; Wang, Y.; Zhang, S.; Yu, W.; Zhu, X.; Huo, A.; Wang, Z.; He, B.; Nover, D. Comparative Assessment of Sponge City Constructing in Public Awareness, Xi’an, China. Sustainability 2022, 14, 11653. [Google Scholar] [CrossRef]
- Shen, L.; Kyllo, J.M.; Guo, X. An Integrated Model Based on a Hierarchical Indices System for Monitoring and Evaluating Urban Sustainability. Sustainability 2013, 5, 524–559. [Google Scholar] [CrossRef]
- Luo, P.; Liu, L.; Wang, S.; Ren, B.; He, B.; Nover, D. Influence assessment of new Inner Tube Porous Brick with absorbent concrete on urban floods control. Case Stud. Constr. Mater. 2022, 17, e01236. [Google Scholar] [CrossRef]
- Zha, X.; Luo, P.; Zhu, W.; Wang, S.; Lyu, J.; Zhou, M.; Huo, A.; Wang, Z. A bibliometric analysis of the research on Sponge City: Current situation and future development direction. Ecohydrology 2021, 14, e2328. [Google Scholar] [CrossRef]
- Shaw, S.B.; Marrs, J.; Bhattarai, N.; Quackenbush, L. Longitudinal study of the impacts of land cover change on hydrologic response in four mesoscale watersheds in New York State, USA. J. Hydrol. 2014, 519, 12–22. [Google Scholar] [CrossRef]
- Zhu, W.; Zha, X.; Luo, P.; Wang, S.; Cao, Z.; Lyu, J.; Zhou, M.; He, B.; Nover, D. A quantitative analysis of research trends in flood hazard assessment. Stoch. Environ. Res. Risk Assess. 2022. [Google Scholar] [CrossRef]
- Hu, Y.; Duan, W.; Chen, Y.; Zou, S.; Kayumba, P.M.; Qin, J. Exploring the changes and driving forces of water footprint in Central Asia: A global trade assessment. J. Clean. Prod. 2022, 375, 134062. [Google Scholar] [CrossRef]
- Karlsson, I.B.; Sonnenborg, T.O.; Refsgaard, J.C.; Trolle, D.; Børgesen, C.D.; Olesen, J.E.; Jeppesen, E.; Jensen, K.H. Combined effects of climate models, hydrological model structures and land use scenarios on hydrological impacts of climate change. J. Hydrol. 2016, 535, 301–317. [Google Scholar] [CrossRef]
- Hurkmans, R.T.W.L.; Terink, W.; Uijlenhoet, R.; Moors, E.J.; Troch, P.A.; Verburg, P.H. Effects of land use changes on streamflow generation in the Rhine basin. Water Resour. Res. 2009, 45, W06405. [Google Scholar] [CrossRef]
- Crawford, N.H.; Linsley, R.K. Digital Simulation in Hydrology’Stanford Watershed Model 4; Technical Report No. 39; Department of Civil Engineering, Stanford University: Stanford, CA, USA, 1966. [Google Scholar]
- Zhao, R.-J. Watershed Hydrological Simulation—Xinanjiang Model and Northern Shaanxi Model; Electric Power Press: Beijing, China, 1983. [Google Scholar]
- Lørup, J.K.; Refsgaard, J.C.; Mazvimavi, D. Assessing the effect of land use change on catchment runoff by combined use of statistical tests and hydrological modelling: Case studies from Zimbabwe. J. Hydrol. 1998, 205, 147–163. [Google Scholar] [CrossRef]
- Hundecha, Y.; Bárdossy, A. Modeling of the effect of land use changes on the runoff generation of a river basin through parameter regionalization of a watershed model. J. Hydrol. 2004, 292, 281–295. [Google Scholar] [CrossRef]
- Shi, P.-J.; Yuan, Y.; Zheng, J.; Wang, J.-A.; Ge, Y.; Qiu, G.-Y. The effect of land use/cover change on surface runoff in Shenzhen region, China. Catena 2007, 69, 31–35. [Google Scholar] [CrossRef]
- Ashagrie, A.G.; de laat, P.J.M.; de Wit, M.J.M.; Tu, M.; Uhlenbrook, S. Detecting the influence of land use changes on discharges and floods in the Meuse River Basin—The predictive power of a ninety-year rainfall-runoff relation? Hydrol. Earth Syst. Sci. 2006, 10, 691–701. [Google Scholar] [CrossRef]
- Saghafian, B.; Farazjoo, H.; Bozorgy, B.; Yazdandoost, F. Flood Intensification due to Changes in Land Use. Water Resour. Manag. 2007, 22, 1051–1067. [Google Scholar] [CrossRef]
- Suriya, S.; Mudgal, B. Impact of urbanization on flooding: The Thirusoolam sub watershed—A case study. J. Hydrol. 2012, 412–413, 210–219. [Google Scholar] [CrossRef]
- Zhou, F.; Xu, Y.; Chen, Y.; Xu, C.-Y.; Gao, Y.; Du, J. Hydrological response to urbanization at different spatio-temporal scales simulated by coupling of CLUE-S and the SWAT model in the Yangtze River Delta region. J. Hydrol. 2013, 485, 113–125. [Google Scholar] [CrossRef]
- Miller, J.D.; Kim, H.; Kjeldsen, T.R.; Packman, J.; Grebby, S.; Dearden, R. Assessing the impact of urbanization on storm runoff in a pen-urban catchment using historical change in impervious cover. J. Hydrol. 2014, 515, 59–70. [Google Scholar] [CrossRef]
- Baker, T.J.; Miller, S.N. Using the Soil and Water Assessment Tool (SWAT) to assess land use impact on water resources in an East African watershed. J. Hydrol. 2013, 486, 100–111. [Google Scholar] [CrossRef]
- Huang, H.; Cheng, S.; Wen, J.; Lee, J. Effect of growing watershed imperviousness on hydrograph parameters and peak discharge. Hydrol. Process. 2008, 22, 2075–2085. [Google Scholar] [CrossRef]
- Du, J.; Qian, L.; Rui, H.; Zuo, T.; Zheng, D.; Xu, Y.; Xu, C.-Y. Assessing the effects of urbanization on annual runoff and flood events using an integrated hydrological modeling system for Qinhuai River basin, China. J. Hydrol. 2012, 464, 127–139. [Google Scholar] [CrossRef]
- Duan, W.; Maskey, S.; Chaffe, P.L.; Luo, P.; He, B.; Wu, Y.; Hou, J. Recent Advancement in Remote Sensing Technology for Hydrology Analysis and Water Resources Management. Remote. Sens. 2021, 13, 1097. [Google Scholar] [CrossRef]
- Bai, H.; Li, Z.; Guo, H.; Chen, H.; Luo, P. Urban Green Space Planning Based on Remote Sensing and Geographic Information Systems. Remote Sens. 2022, 14, 4213. [Google Scholar] [CrossRef]
- Chen, K.-S. Principles of Synthetic Aperture Radar Imaging: A System Simulation Approach; CRC Press: Boca Raton, FL, USA, 2016; Volume 2. [Google Scholar]
- Jackson, C.R.; Apel, J.R. Synthetic Aperture Radar: Marine User’s Manual; NOAA: Washington, DC, USA, 2004.
- Treitz, P.M.; Howarth, P.J.; Gong, P. Application of satellite and GIS technologies for land-cover and land-use mapping at the rural-urban fringe: A case study. Photogramm. Eng. Remote Sens. 1992, 58, 439–448. [Google Scholar]
- Irons, J.R.; Dwyer, J.L.; Barsi, J.A. The next Landsat satellite: The Landsat Data Continuity Mission. Remote. Sens. Environ. 2012, 122, 11–21. [Google Scholar] [CrossRef]
- Cao, Z.; Zhu, W.; Luo, P.; Wang, S.; Tang, Z.; Zhang, Y.; Guo, B. Spatially Non-Stationary Relationships between Changing Environment and Water Yield Services in Watersheds of China’s Climate Transition Zones. Remote. Sens. 2022, 14, 5078. [Google Scholar] [CrossRef]
- Pal, M.; Mather, P.M. An assessment of the effectiveness of decision tree methods for land cover classification. Remote. Sens. Environ. 2003, 86, 554–565. [Google Scholar] [CrossRef]
- Kavzoglu, T.; Mather, P.M. The use of backpropagating artificial neural networks in land cover classification. Int. J. Remote. Sens. 2003, 24, 4907–4938. [Google Scholar] [CrossRef]
- Mazzoni, D.; Garay, M.J.; Davies, R.; Nelson, D. An operational MISR pixel classifier using support vector machines. Remote Sens. Environ. 2007, 107, 149–158. [Google Scholar] [CrossRef]
- Nigam, K.; McCallum, A.K.; Thrun, S.; Mitchell, T. Text Classification from Labeled and Unlabeled Documents using EM. Mach. Learn. 2000, 39, 103–134. [Google Scholar] [CrossRef]
- Yang, C.; Bruzzone, L.; Sun, F.; Lu, L.; Guan, R.; Liang, Y. A Fuzzy-Statistics-Based Affinity Propagation Technique for Clustering in Multispectral Images. IEEE Trans. Geosci. Remote Sens. 2010, 48, 2647–2659. [Google Scholar] [CrossRef]
- Biggio, B.; Fumera, G.; Roli, F. Multiple classifier systems for robust classifier design in adversarial environments. Int. J. Mach. Learn. Cybern. 2010, 1, 27–41. [Google Scholar] [CrossRef]
- Chen, Y.; Dou, P.; Yang, X. Improving Land Use/Cover Classification with a Multiple Classifier System Using AdaBoost Integration Technique. Remote Sens. 2017, 9, 1055. [Google Scholar] [CrossRef]
- Freeze, R.; Harlan, R. Blueprint for a physically-based, digitally-simulated hydrologic response model. J. Hydrol. 1969, 9, 237–258. [Google Scholar] [CrossRef]
- Im, S.; Kim, H.; Kim, C.; Jang, C. Assessing the impacts of land use changes on watershed hydrology using MIKE SHE. Environ. Earth Sci. 2008, 57, 231–239. [Google Scholar] [CrossRef]
- Abbott, M.; Bathurst, J.; Cunge, J.; O’connell, P.; Rasmussen, J. An introduction to the European Hydrological System—Systeme Hydrologique Europeen,“SHE”, 2: Structure of a physically-based, distributed modelling system. J. Hydrol. 1986, 87, 61–77. [Google Scholar] [CrossRef]
- Liang, X.; Lettenmaier, D.P.; Wood, E.F.; Burges, S.J. A simple hydrologically based model of land surface water and energy fluxes for general circulation models. J. Geophys. Res. Atmos. 1994, 99, 14415–14428. [Google Scholar] [CrossRef]
- Wigmosta, M.S.; Vail, L.W.; Lettenmaier, D.P. A distributed hydrology-vegetation model for complex terrain. Water Resour. Res. 1994, 30, 1665–1679. [Google Scholar] [CrossRef]
- Wang, Z.-M.; Batelaan, O.; De Smedt, F. A distributed model for water and energy transfer between soil, plants and atmosphere (WetSpa). Phys. Chem. Earth 1996, 21, 189–193. [Google Scholar] [CrossRef]
- Chormanski, J.; Van de Voorde, T.; De Roeck, T.; Batelaan, O.; Canters, F. Improving Distributed Runoff Prediction in Urbanized Catchments with Remote Sensing based Estimates of Impervious Surface Cover. Sensors 2008, 8, 910–932. [Google Scholar] [CrossRef] [PubMed]
- Yang, D.; Herath, S.; Musiake, K. Development of a geomorphologic properties extracted from DEMs for hydrologic modeling. Annu. J. Hydraul. Eng. JSCE 1997, 47, 49–65. [Google Scholar]
- Jia, Y.; Ni, G.; Kawahara, Y.; Suetsugi, T. Development of WEP model and its application to an urban watershed. Hydrol. Process. 2001, 15, 2175–2194. [Google Scholar] [CrossRef]
- Kavvas, M.L.; Chen, Z.Q.; Dogrul, C.; Yoon, J.Y.; Ohara, N.; Liang, L.; Aksoy, H.; Anderson, M.L.; Yoshitani, J.; Fukami, K.; et al. Watershed Environmental Hydrology (WEHY) Model Based on Upscaled Conservation Equations: Hydrologic Module. J. Hydrol. Eng. 2004, 9, 450–464. [Google Scholar] [CrossRef]
- Chen, Y.; Ren, Q.; Huang, F.; Xu, H.; Cluckie, I. Liuxihe Model and Its Modeling to River Basin Flood. J. Hydrol. Eng. 2011, 16, 33–50. [Google Scholar] [CrossRef]
- Beven, K. 12 Equifinality and uncertainty in geomorphological modelling. In The Scientific Nature of Geomorphology: Proceedings of the 27th Binghamton Symposium in Geomorphology, Held 27–29 September 1996; John Wiley & Sons: Hoboken, NJ, USA, 1996. [Google Scholar]
- Wang, H.; Chen, Y. Identifying Key Hydrological Processes in Highly Urbanized Watersheds for Flood Forecasting with a Distributed Hydrological Model. Water 2019, 11, 1641. [Google Scholar] [CrossRef]
- Siriwardena, L.; Finlayson, B.; McMahon, T. The impact of land use change on catchment hydrology in large catchments: The Comet River, Central Queensland, Australia. J. Hydrol. 2006, 326, 199–214. [Google Scholar] [CrossRef]
- Zheng, J.; Fang, W.; Shi, P.; Zhuo, L. Modeling the impacts of land use change on hydrological processes in fast urbanizing region—A case study of the Buji watershed in Shenzhen city. J. Nat. Resour. 2009, 24, 1560–1572. [Google Scholar]
- Hejazi, M.I.; Markus, M. Impacts of Urbanization and Climate Variability on Floods in Northeastern Illinois. J. Hydrol. Eng. 2009, 14, 606–616. [Google Scholar] [CrossRef]
- Olivera, F.; DeFee, B.B. Urbanization and Its Effect On Runoff in the Whiteoak Bayou Watershed, Texas1. JAWRA J. Am. Water Resour. Assoc. 2007, 43, 170–182. [Google Scholar] [CrossRef]
- Li, Y.; Wang, C. Impacts of Urbanization on Surface Runoff of the Dardenne Creek Watershed, St. Charles County, Missouri. Phys. Geogr. 2009, 30, 556–573. [Google Scholar] [CrossRef]
- Grove, M.; Harbor, J.; Engel, B.; Muthukrishnan, S. Impacts of urbanization on surface hydrology, Little Eagle Creek, Indiana, and analysis of LTHIA model sensitivity to data resolution. Phys. Geogr. 2001, 22, 135–153. [Google Scholar] [CrossRef]
- Getachew, H.E.; Melesse, A.M. The impact of land use change on the hydrology of the Angereb Watershed, Ethiopia. Int. J. Water Sci. 2012, 1, 4. [Google Scholar]
- Luo, P.; Xu, C.; Kang, S.; Huo, A.; Lyu, J.; Zhou, M.; Nover, D. Heavy metals in water and surface sediments of the Fenghe River Basin, China: Assessment and source analysis. Water Sci. Technol. 2021, 84, 3072–3090. [Google Scholar] [CrossRef]
- Cao, Z.; Wang, S.; Luo, P.; Xie, D.; Zhu, W. Watershed Ecohydrological Processes in a Changing Environment: Opportunities and Challenges. Water 2022, 14, 1502. [Google Scholar] [CrossRef]
- Luo, P.; Mu, Y.; Wang, S.; Zhu, W.; Mishra, B.K.; Huo, A.; Zhou, M.; Lyu, J.; Hu, M.; Duan, W.; et al. Exploring sustainable solutions for the water environment in Chinese and Southeast Asian cities. Ambio 2021, 51, 1199–1218. [Google Scholar] [CrossRef]
- Duan, W.; Zou, S.; Chen, Y.; Nover, D.; Fang, G.; Wang, Y. Sustainable water management for cross-border resources: The Balkhash Lake Basin of Central Asia, 1931–2015. J. Clean. Prod. 2020, 263, 121614. [Google Scholar] [CrossRef]
- Chen, Y. Liuxihe Model; Science Press: Beijing, China, 2009; p. 198. [Google Scholar]
- Chen, Y.; Dong, Y.; Zhang, P. Study on the method of flood forecasting of small and medium sized catchment. In Proceedings of the 2013 Meeting of the Chinese Society of Hydraulic Engineering, Guangzhou, China, 26–28 November 2013; pp. 26–28. [Google Scholar]
- Chen, Y.; Li, J.; Xu, H. Improving flood forecasting capability of physically based distributed hydrological models by parameter optimization. Hydrol. Earth Syst. Sci. 2016, 20, 375–392. [Google Scholar] [CrossRef]
- Deng, H.; Pepin, N.C.; Chen, Y.; Guo, B.; Zhang, S.; Zhang, Y.; Chen, X.; Gao, L.; Meibing, L.; Ying, C. Dynamics of Diurnal Precipitation Differences and Their Spatial Variations in China. J. Appl. Meteorol. Clim. 2022, 61, 1015–1027. [Google Scholar] [CrossRef]
- Yi-yang, X.I.E.; Da-ming, L.I.; Pei-yan, L.I.; Shu-qin, S.H.E.N.; Jian-min, Y.I.N.; Su-qin, H.A.N.; Ming-jian, Z.E.N.G.; Xiao-qing, G.U. Research and application of numerical model for urban storm urban flooding. Adv. Water Sci. 2005, 16, 384–390. [Google Scholar]
- Zhou, H.; Wang, C. Guangdong Dongguan city urban flooding causes analysis and prevention measures. China Flood Drought Manag. 2013, 23, 70–71. [Google Scholar]
- Luo, P.; Luo, M.; Li, F.; Qi, X.; Huo, A.; Wang, Z.; He, B.; Takara, K.; Nover, D.; Wang, Y. Urban flood numerical simulation: Research, methods and future perspectives. Environ. Model. Softw. 2022, 156, 105478. [Google Scholar] [CrossRef]
- Duan, W.; Zou, S.; Christidis, N.; Schaller, N.; Chen, Y.; Sahu, N.; Li, Z.; Fang, G.; Zhou, B. Changes in temporal inequality of precipitation extremes over China due to anthropogenic forcings. npj Clim. Atmos. Sci. 2022, 5, 33. [Google Scholar] [CrossRef]
- O’Callaghan, J.F.; Mark, D.M. The extraction of drainage networks from digital elevation data. Comput. Vis. Graph. Image Process. 1984, 28, 323–344. [Google Scholar] [CrossRef]
- Jenson, S.K.; Domingue, J.O. Extracting topographic structure from digital elevation data for geographic information system analysis. Photogramm. Eng. Remote Sens. 1988, 54, 1593–1600. [Google Scholar]
- Strahler, A.N. Quantitative analysis of watershed geomorphology. Eos Trans. Am. Geophys. Union 1957, 38, 913–920. [Google Scholar] [CrossRef]
- Wei, X.; Yang, J.; Luo, P.; Lin, L.; Lin, K.; Guan, J. Assessment of the variation and influencing factors of vegetation NPP and carbon sink capacity under different natural conditions. Ecol. Indic. 2022, 138, 108834. [Google Scholar] [CrossRef]
- Huiquan, C.; Shimin, M. Calculation and verification of an universal water surface evaporation coefficient formula. Adv. Water Sci. 1995, 6, 116–120. [Google Scholar]
- Zhang, S.; Xu, D.; Li, Y.; Cai, L. An optimized inverse model used to estimate Kostiakov infiltration parameters and Manning’s roughness coefficient based on SGA and SRFR model:(I) establishment. J. Hydraul. Eng. 2006, 37, 1297–1302. [Google Scholar]
- Shaohui, Z.; Di, X.U.; Yinong, L.I.; Lingen, C.A.I. Optimized inverse model used to estimate Kostiakov infiltration parameters and Manning’s roughness coefficient based on SGA and SRFR model: Ⅱ Application. J. Hydraul. Eng. 2007, 38, 402–408. [Google Scholar]
- Guo, H.; Han, Y.; Bai, X. Hydrological Effects of Littet on Different Forest Stands and Study about Surface Roughness Coefficient. J. Soil Water Conserv. 2010, 24, 179–183. [Google Scholar]
- Li, Y.; Zhang, J.; Ru, H.; Li, M.; Wang, D.; Ding, Y. Effect of Different Land Use Types on Soil Anti-scourability and Roughness in Loess Area of Western Shanxi Province. J. Soil Water Conserv. 2013, 27, 1–6, 28. [Google Scholar]
- Anderson, A.N.; McBratney, A.B.; FitzPatrick, E.A. Soil Mass, Surface, and Spectral Fractal Dimensions Estimated from Thin Section Photographs. Soil Sci. Soc. Am. J. 1996, 60, 962–969. [Google Scholar] [CrossRef]
- Qiong, S.; Shuanghe, S.; Ze, G.U. Conversion Coefficient between Small Evaporation Pan and Theoretically Calculated Water Surface Evaporation in China. J. Nanjing Inst. Meteorol. 2007, 30, 561–565. [Google Scholar]
- Zhang, H.; Chen, Y.; Zhou, J. Assessing the long-term impact of urbanization on run-off using a remote-sensing-supported hydrological model. Int. J. Remote Sens. 2015, 36, 5336–5352. [Google Scholar] [CrossRef]
- Arya, L.M.; Paris, J.F. A Physicoempirical Model to Predict the Soil Moisture Characteristic from Particle-Size Distribution and Bulk Density Data. Soil Sci. Soc. Am. J. 1981, 45, 1023–1030. [Google Scholar] [CrossRef]
- Wang, Z.; Luo, P.; Zha, X.; Xu, C.; Kang, S.; Zhou, M.; Nover, D.; Wang, Y. Overview assessment of risk evaluation and treatment technologies for heavy metal pollution of water and soil. J. Clean. Prod. 2022, 379, 134043. [Google Scholar] [CrossRef]
- Tang, Z.; Deng, G.; Hu, G.; Zhang, H.; Pan, H.; Sang, G. Satellite observed spatiotemporal variability of snow cover and snow phenology over High Mountain Asia from 2002 to 2021. J. Hydrol. 2022, 613, 128438. [Google Scholar] [CrossRef]
- Tang, Z.; Wang, X.; Wang, J.; Wang, X.; Li, H.; Jiang, Z. Spatiotemporal Variation of Snow Cover in Tianshan Mountains, Central Asia, Based on Cloud-Free MODIS Fractional Snow Cover Product, 2001–2015. Remote Sens. 2017, 9, 1045. [Google Scholar] [CrossRef]
- Deng, G.; Tang, Z.; Hu, G.; Wang, J.; Sang, G.; Li, J. Spatiotemporal Dynamics of Snowline Altitude and Their Responses to Climate Change in the Tienshan Mountains, Central Asia, during 2001–2019. Sustainability 2021, 13, 3992. [Google Scholar] [CrossRef]
- Wang, S.; Cao, Z.; Luo, P.; Zhu, W. Spatiotemporal Variations and Climatological Trends in Precipitation Indices in Shaanxi Province, China. Atmosphere 2022, 13, 744. [Google Scholar] [CrossRef]
- Zhu, Y.; Luo, P.; Zhang, S.; Sun, B. Spatiotemporal Analysis of Hydrological Variations and Their Impacts on Vegetation in Semiarid Areas from Multiple Satellite Data. Remote. Sens. 2020, 12, 4177. [Google Scholar] [CrossRef]
- Tang, Z.; Ma, J.; Peng, H.; Wang, S.; Wei, J. Spatiotemporal changes of vegetation and their responses to temperature and precipitation in upper Shiyang river basin. Adv. Space Res. 2017, 60, 969–979. [Google Scholar] [CrossRef]
- Zhu, W.; Wang, S.; Luo, P.; Zha, X.; Cao, Z.; Lyu, J.; Zhou, M.; He, B.; Nover, D. A Quantitative Analysis of the Influence of Temperature Change on the Extreme Precipitation. Atmosphere 2022, 13, 612. [Google Scholar] [CrossRef]
- Qin, J.; Duan, W.; Chen, Y.; Dukhovny, V.A.; Sorokin, D.; Li, Y.; Wang, X. Comprehensive evaluation and sustainable development of water-energy-food-ecology systems in Central Asia. Renew. Sustain. Energy Rev. 2022, 157, 112061. [Google Scholar] [CrossRef]


| Vegetation Type | Range of Evaporation Coefficient (mm/d) | Recommended Evaporation Coefficient (mm/d) | Range of Roughness | Recommended Roughness |
|---|---|---|---|---|
| Forestry land | 0.5–0.8 | 0.7 | 0.1–0.8 | 0.55 |
| Grass land | 0.5–0.7 | 0.6 | 0.01–0.4 | 0.18 |
| Urban land | 0.7–1.3 | 1.0 | 0.001–0.2 | 0.01 |
| Bare land | 0.2–0.6 | 0.4 | 0.005–0.3 | 0.12 |
| Farm land | 0.4–0.7 | 0.55 | 0.02–0.5 | 0.36 |
| Soil Type | Soil Water Content under Saturated Conditions (%) | Soil Water Content under Field Conditions (%) | Soil Hydraulic Conductivity at Saturation (mm/h) | Soil Layer Thickness (mm) |
|---|---|---|---|---|
| Urban land | 0.070 | 0.010 | 0.010 | 1 |
| Acric Ferralsols | 0.458 | 0.353 | 2.794 | 850 |
| Eutric Cambisol | 0.447 | 0.194 | 41.148 | 400 |
| Ferric Acrisols | 0.446 | 0.240 | 21.844 | 670 |
| Parameters | Soil Saturated Hydraulic Conductivity (Ks) | Slope Roughness (n) | Manning Coefficient (Mann) | Soil Layer Thickness (Zs) | Soil Characteristic Coefficient (b) | River Bottom Slope (Bs) |
| 0.54 | 0.501 | 1.175 | 1.457 | 1.497 | 0.583 | |
| River bottom width (Bw) | Saturated water content (Csat) | Field capacity (Cfc) | Evaporation coefficient (v) | Wilting percentage (Cw) | Side slope grade (Ss) | |
| 1.393 | 1.492 | 0.505 | 1.327 | 1.378 | 1.46 |
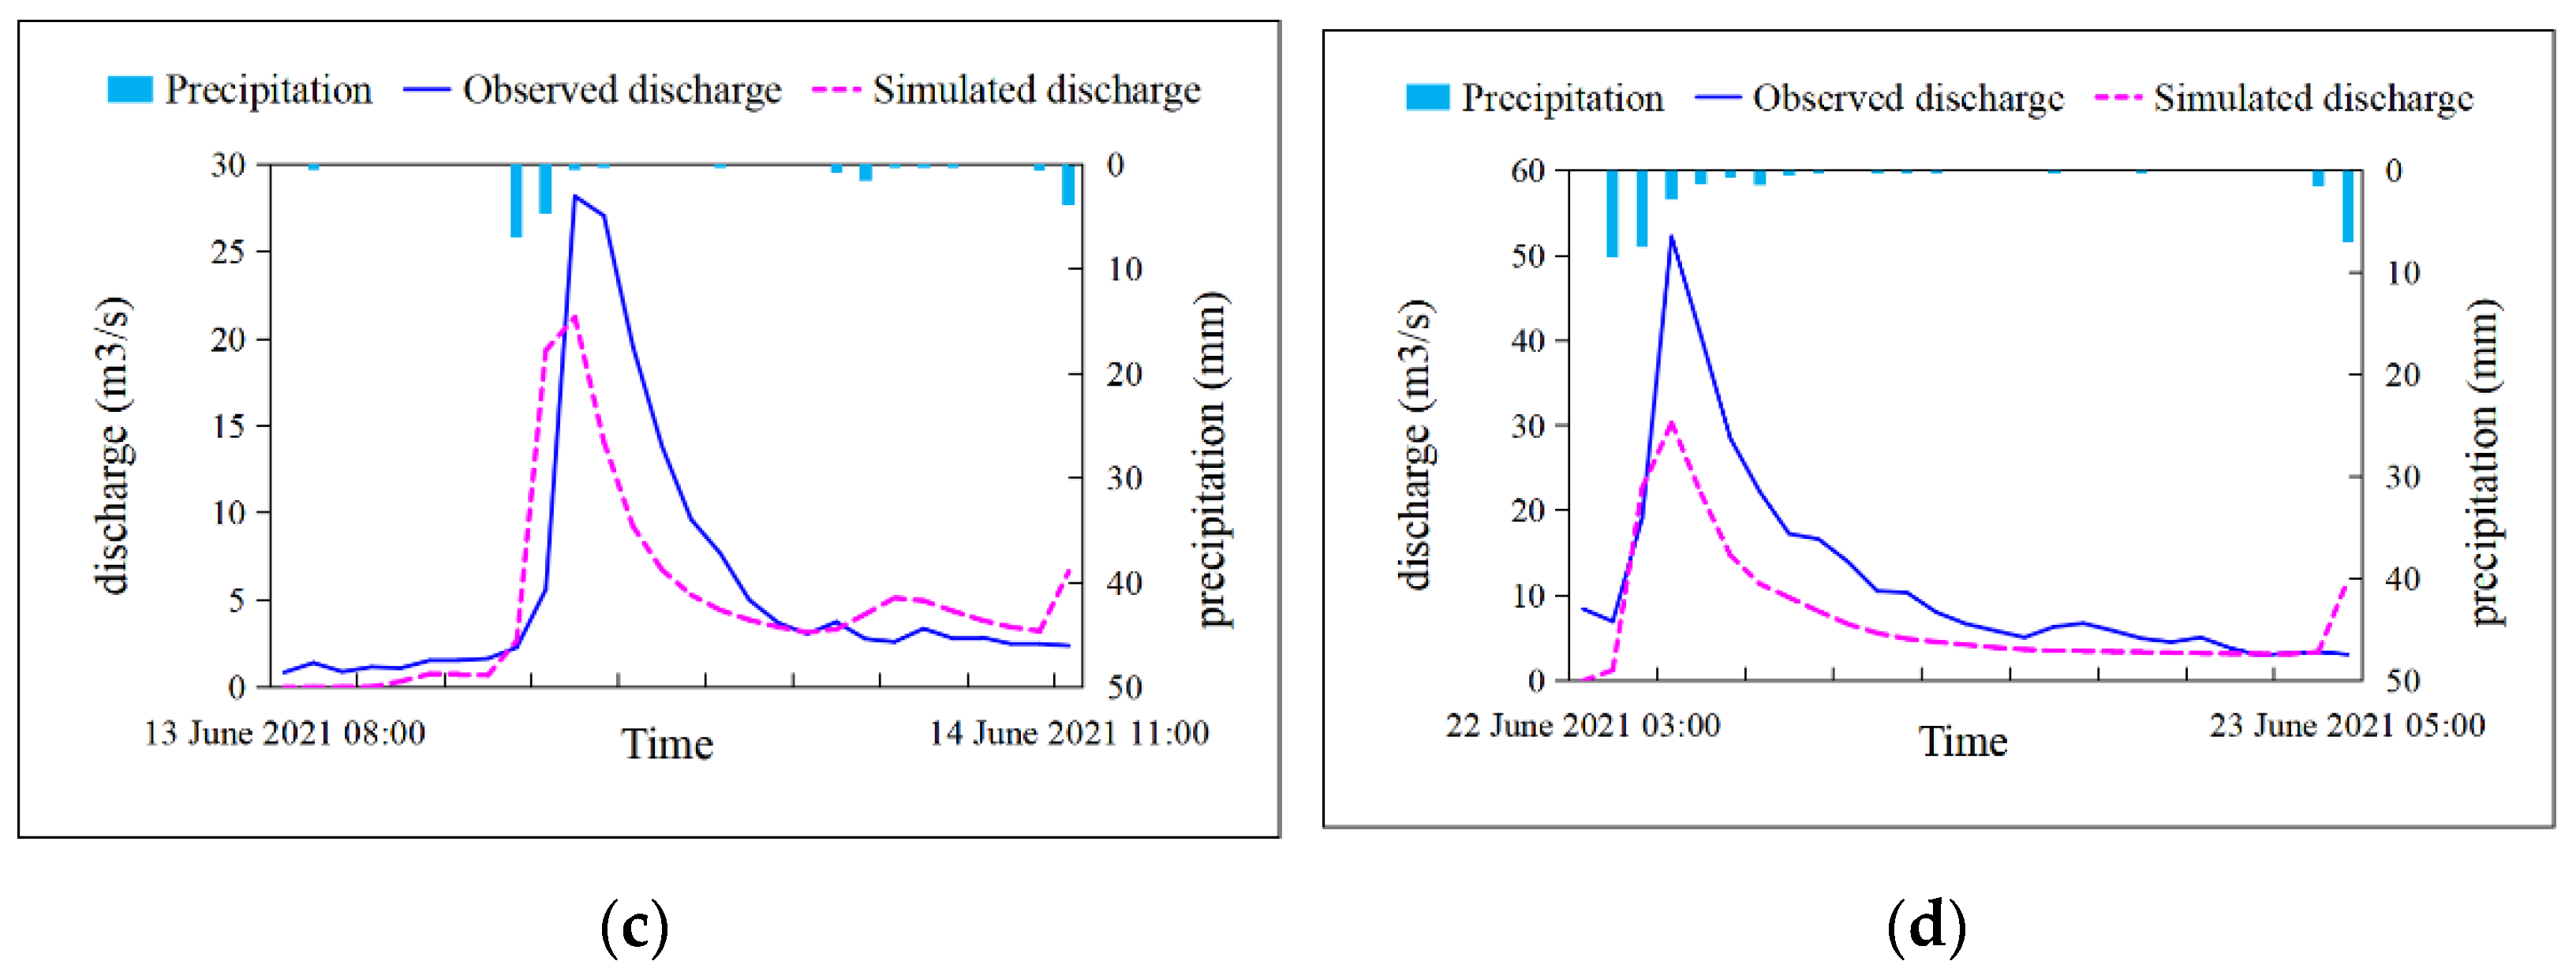
| Flood Event No. | Start Time (yyyymmddhh) | End Time (yyyymmddhh) | Duration (h) | Total Rainfall (mm) | Peak Flow (m3/s) |
|---|---|---|---|---|---|
| 2021053114 | 2021053114 | 2021060216 | 51 | 110.83 | 78.088 |
| 2021060211 | 2021060211 | 2021060323 | 37 | 36.77 | 61.206 |
| 2021061308 | 2021061308 | 2021061411 | 28 | 20.47 | 28.169 |
| 2021062203 | 2021062203 | 2021062305 | 27 | 31.90 | 52.207 |
| Flood Event No. | Nash–Sutcliffe Coefficient | Water Balance Coefficient | Peak Flow Relative Error (%) | Peak Flow Duration Difference (h) |
|---|---|---|---|---|
| 2021053114 | 0.918 | 0.987 | 5.4 | −3.0 |
| 2021060211 | 0.920 | 0.909 | 8.2 | −1.0 |
| 2021061308 | 0.576 | 0.838 | 24.6 | 0.0 |
| 2021062203 | 0.565 | 0.615 | 41.9 | 0.0 |
Publisher’s Note: MDPI stays neutral with regard to jurisdictional claims in published maps and institutional affiliations. |
© 2022 by the authors. Licensee MDPI, Basel, Switzerland. This article is an open access article distributed under the terms and conditions of the Creative Commons Attribution (CC BY) license (https://creativecommons.org/licenses/by/4.0/).
Share and Cite
Gu, Y.; Chen, Y.; Sun, H.; Liu, J. Remote Sensing-Supported Flood Forecasting of Urbanized Watersheds—A Case Study in Southern China. Remote Sens. 2022, 14, 6129. https://doi.org/10.3390/rs14236129
Gu Y, Chen Y, Sun H, Liu J. Remote Sensing-Supported Flood Forecasting of Urbanized Watersheds—A Case Study in Southern China. Remote Sensing. 2022; 14(23):6129. https://doi.org/10.3390/rs14236129
Chicago/Turabian StyleGu, Yu, Yangbo Chen, Huaizhang Sun, and Jun Liu. 2022. "Remote Sensing-Supported Flood Forecasting of Urbanized Watersheds—A Case Study in Southern China" Remote Sensing 14, no. 23: 6129. https://doi.org/10.3390/rs14236129
APA StyleGu, Y., Chen, Y., Sun, H., & Liu, J. (2022). Remote Sensing-Supported Flood Forecasting of Urbanized Watersheds—A Case Study in Southern China. Remote Sensing, 14(23), 6129. https://doi.org/10.3390/rs14236129