Article

Reverse Thinking: The Logical System Research Method of Urban Thermal Safety Pattern Construction, Evaluation, and Optimization

1
School of Geographic Mapping and Urban Planning, Jiangsu Normal University, Xuzhou 221116, China
2
School of Architecture and Urban Planning, Huazhong University of Science and Technology, Wuhan 430074, China
3
Hubei Engineering and Technology Research Center of Urbanization, Wuhan 430074, China
*
Author to whom correspondence should be addressed.
Remote Sens. 2022, 14(23), 6036; https://doi.org/10.3390/rs14236036
Submission received: 21 October 2022 / Revised: 25 November 2022 / Accepted: 27 November 2022 / Published: 29 November 2022
(This article belongs to the Special Issue Geographical Analysis and Modeling of Urban Heat Island Formation)

Abstract

:
The acceleration of urbanization has significantly impacted the changing regional thermal environment, leading to a series of ecological and environment-related problems. A scientific evaluation of the urban thermal security pattern (TSPurban) strongly benefits the planning and layout of sustainable development and the construction of comfortable human settlements. To analyze the characteristics of the TSPurban under cross-regional differences and provide targeted solutions to mitigate the urban heat island effect in later stages, the logical system research framework of the TSPurban based on the “construction–evaluation–optimization” model was explored using reverse thinking. This study selected the Wuhan metropolitan area in China as the research object. First, a morphological spatial pattern analysis (MSPA) model was used to extract the top 30 core heat island patches, and Conefor 2.6 software was used for connection analysis to evaluate their importance. Second, based on the characteristics of various land cover types, the friction (cost) map of surface urban heat island (SUHI) diffusion was simulated. The spatial attributes of the heat island resistance surface were examined using a standard deviation ellipse and hot spot analysis. Finally, this paper used circuit theory to find 56 low-cost heat island links (corridors) and circuit scape software to find widely distributed vital nodes. The optimization of the TSPurban network was then investigated using a reverse thinking process. Heat island patches, corridors, and vital nodes are among the crucial components of the TSPurban. By obstructing corridor links and disturbing important nodes, it is possible to appropriately and proficiently reduce the TSPurban network’s connection efficiency and stability, which will have a positive influence on regional climate mitigation and the heat island effect.

1. Introduction

As the world urbanizes, impervious surfaces such as cement, asphalt, and concrete are replacing the natural surface [1]. Heat builds up in metropolitan areas due to built structures and human activity. This build-up leads to a significant temperature difference between urban and suburban areas, resulting in the urban heat island (UHI) effect [2], which Howard originally discovered in 1833 [3]. Subsequently, numerous scholars have carried out a considerable number of studies on the form and structure [4,5], evolution and change [6,7], and mechanism and simulation [8,9] of UHIs. Relevant studies have considered the UHI effect to be one of the most critical issues influencing urban public health and sustainable development [10,11], regional climate [12], biodiversity [13], vegetation phenology [14], and quality of air and water [15]. Even human morbidity and mortality are impacted by UHIs [6].
The thermal environment security of urban agglomerations is facing unprecedented problems, particularly in light of the growing worldwide UHI intensity, the rapid expansion of urban development land, the ongoing growth in city populations, and the effects of global warming [7]. Academic research on heat mitigation is becoming increasingly important [5]. Therefore, it is extremely relevant for regional climate research to study the characteristics and optimization of the urban thermal security pattern model (TSPurban). Generally, atmospheric UHIs (AUHIs) and surface UHIs (SUHIs) are the two major types of UHIs [16]. We can calculate SUHIs by observing the land surface temperature (LST), which can be retrieved from satellite observations [17]. Additionally, we understand that SUHIs have convenient data acquisition characteristics and ranges of observable coverage [18]. Therefore, this study focuses on SUHIs.
Regarding how to effectively mitigate the security of the urban thermal environment, studies have shown that blue and green spaces play a significant role in cooling the Earth’s surface compared to the surrounding thermal environment. Urban green infrastructure (UGI) can influence urban climate by increasing transpiration [19], providing shading or water features, and supporting heat exchange through the selective absorption and reflection of solar radiation [20,21]. However, these studies have mainly used forward thinking to reduce UHIs by directly selecting negative correlates that counteract the thermal environment. Furthermore, they have mainly focused on isolated spatial patches; less consideration has been given to the holistic and connected nature of the UHI mitigation effect [22,23].
Due to its abstract character, the term “reverse thinking” necessitates a thorough conceptual understanding before it can be properly applied to the text’s internal logic. From the perspective of the term’s connotation, “reverse thinking” refers to thinking backward to solve problems that are difficult to solve by conventional thinking. From the perspective of the TSPurban, we don’t use large-scale cooling measures. Instead, we focus on correctly locating the important nodes and corridors of SUHIs and stopping nodes from connecting. This keeps a network of heat island patches from forming, which can do a lot of damage to the thermal environment in the region. Therefore, we choose to address the heat island patch problem in the real world and use “reverse thinking” to consider how to make an effective breakthrough based on the current TSPurban. In this paper, we will examine “reverse thinking” as a way to deal with TSPurban from two points of view: theoretical research and practical exploration. We’ll talk about how reverse thinking works and what it means in real life.
In terms of theoretical research, on the one hand, studies have shown that the connectivity of heat island patches potentially enhances the regional UHI effect [24,25]. In this case, it is important to effectively block the connectivity between heat island patches, and this connectivity needs to be reflected at the specific spatial level of the targeted situation [26,27,28]. However, these studies have not received sufficient attention [29]. On the other hand, other researchers have focused on spatial connectivity, such as Peng et al. (2022), who focuses on enhancing the connectivity of future “cool islands” (CIs) by constructing a network, which is typical of forward positive thinking [30]. Based on the current situation, the heat island patch network problem in the TSPurban urgently needs an effective breakthrough. At the same time, since the connectivity of heat island patches has the function of enhancing the UHI effect [31,32], a new method to mitigate the UHI effect by interrupting the connectivity of heat island patch corridors is proposed for later stages.
On the one hand, in terms of practical exploration and due to real environmental costs, especially in the past, many investments have been made to mitigate the regional thermal environment [33]. Among them, urban blue/green landscape space is characterized by limited development and high investment costs [34]; with the overall economic slowdown, it is challenging to break through the limited funds available for mitigating urban thermal safety patterns. On the other hand, due to China’s territorial spatial planning control, too many projects to mitigate the regional thermal environment will involve encroachment on many permanent basic agricultural land and construction development control areas [35,36]. Therefore, it will be more difficult to coordinate these projects under realistic conditions, which in turn will reduce the operability of regional thermal environment mitigation projects.
Therefore, constructing a specific distribution of heat island networks at the spatial level is an important technical point. Based on the analysis based on previous research, it was found that circuit theory, although it first originated as a related concept in physics, was gradually introduced to identify important heat island corridors and critical nodes related to heat exchange based on LST data. Studies have already been done that apply circuit theory to these networks, mainly by defining heat source areas and connecting corridors to build networks [30,32]. On the one hand, these corridors and critical nodes are similar to the effects of electric currents in that they have a random, “wandering” nature. On the other hand, this approach can assist us in pinpointing the key nodes and corridors of the SUHI. Thus, it is possible to identify important patch corridors and nodes in the TSPurban based on the movement patterns in complex cost resistance.
This paper constructed a regional heat island network based on the circuit theory simulation, i.e., the final construction of the three major elements of the TSPurban, namely, the heat source, the resistance surface, and the corridor. In the evaluation of the TSPurban, the heat source analyzed patch fragmentation through connectivity, the resistance surface revealed spatial directional characteristics via the standard deviation ellipse, and the corridor analyzed hot and cold spot clustering regions via spatial autocorrelation. The corridor also thought about how important it was and figured out where the most important heat flow nodes were. In the optimization of the TSPurban, this paper mainly relies on “reverse thinking” to mitigate the heat island effect through the following three dimensions: the first dimension is to weaken the heat source role of the main heat island patches; the second is to disrupt the linking effect by reducing the role of links in the heat island corridors; the last is to use the key areas identified on the corridor for targeted engineering projects that can mitigate the heat island effect. In this way, the current UHI effect can be alleviated through gradual weakening. In summary, precisely locating the key nodes and corridors in the urban heat island (SUHI) at the spatial level is the basis for the effective mitigation of SUHIs. We use “reverse thinking” to efficiently and accurately “block” or “destroy” the critical nodes and corridors in the network to effectively decrease the regional heat island effect.
Additionally, the administrative boundaries of cities determined by anthropogenic rules should not bind the natural heat island network. However, most current research on heat island networks lacks a cross-regional perspective [37], so it is difficult to fully consider the spatial organization of heat islands. The inspiration for regional TSPurban governance and optimization is limited. Even from a cross-regional perspective, the research mainly focuses on China’s Yangtze River Delta, Pearl River Delta, and other open coastal city clusters [38]. Relevant research has not paid enough attention to the central metropolitan area. Therefore, taking the Wuhan urban agglomeration as the research object, this paper reveals the locational characteristics of urban heat island patches and the spatial pattern of collaborative optimization. Then, we look at the main problems caused by the urban heat island effect, and finally, we suggest ways to improve transregional efforts to reduce urban heat islands. Specifically, this paper proposes and attempts to explore the following research objectives: (1) to investigate the characteristics of the TSPurban in the context of cross-regional differences; (2) to accurately identify corridors and key nodes in the TSPurban and then propose targeted solutions; (3) to provide strong theoretical support for the construction of regionally integrated urban heat island effect mitigation solutions.

2. Research Overview

2.1. Research Area

As shown in Figure 1, the Wuhan Urban Agglomeration (Central China) refers to the area around Wuhan with a radius of approximately 100 km. The total area of Wuhan, Huangshi, Ezhou, Xiaogan, Huanggang, Xianning, Xiantao, Tianmen, and Qianjiang is 579 × 104 hm2, accounting for 31.09% of the total area of Hubei Province. In 2021, the total resident population of the region exceeded 33 million, and the GDP exceeded 3 trillion. The Wuhan Urban Agglomeration is located at latitudes 29°02′~31°51′N and longitudes 112°33′~116°07′E. It belongs to the midlatitude zone. Solar radiation varies seasonally, and the area is far from the ocean. It has a typical subtropical East Asian continental climate, with four clear seasons and substantial amounts of light, heat, and rain.

2.2. Research Framework and Data Sources

2.2.1. Research Framework

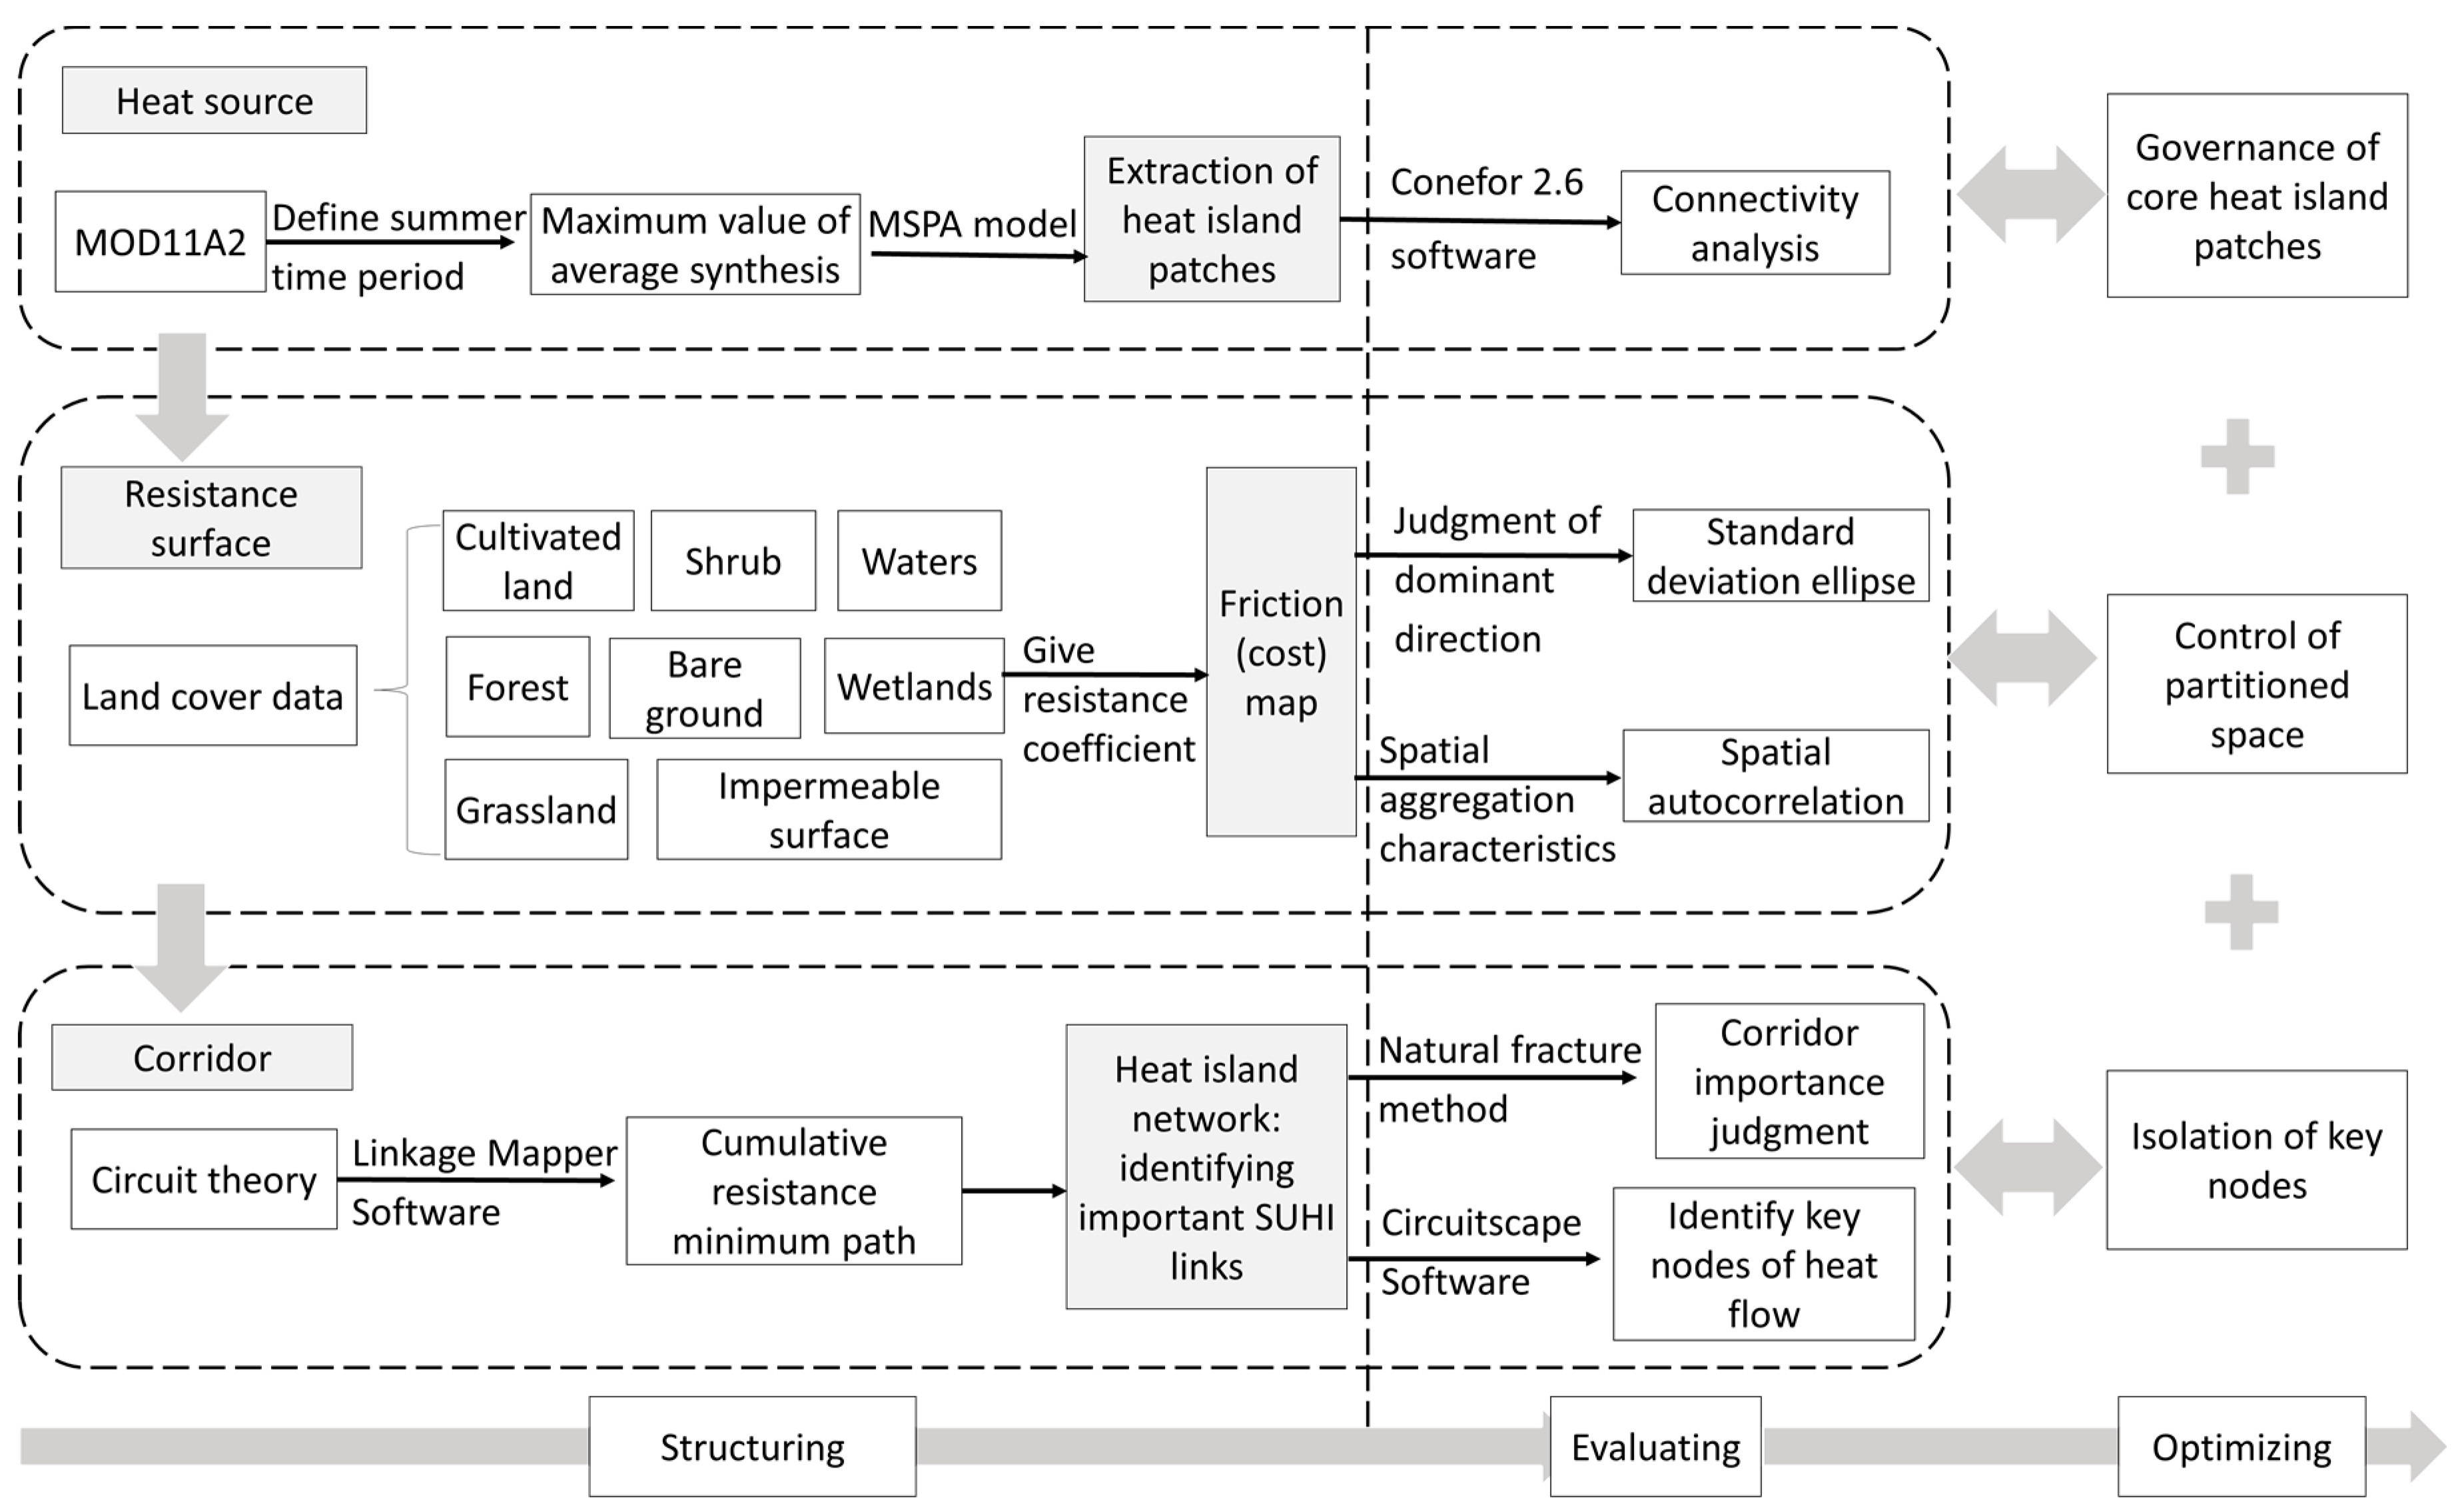
Some scholars have explored mitigation strategies for the UHI effect from the perspective of constructing spatial networks. For example, Yu et al. (2021) identified the critical nodes in a UHI network and then broke the network to effectively mitigate SUHI [32]. To reflect the contributory nature of the article in examining the overall logic of the TSPurban, in this research, as shown in Figure 2, we propose a TSPurban based on the new paradigm of “heat source–resistance surface–corridor” and alleviate the UHI effect by blocking connectivity. Finally, we creatively develop the research framework of the TSPurban’s “construction–evaluation–optimization” logic system.
First, in terms of construction, the heat source was mainly defined by the climate characteristics of the Wuhan metropolitan area. Then, the average maximum value of that period was synthesized, and the morphological spatial pattern analysis (MSPA) model was used to further extract the core heat island patches. Surface resistance mainly combines different land use cover characteristics in the region and generates a friction (cost) map by giving a differential resistance coefficient. The corridor mainly uses circuit theory to identify the path with the least cumulative resistance by sharing random “wandering” attributes and finally identifies the important SUHI links and key nodes related to heat flow, forming a regional heat island network.
Second, in the evaluation, Conefor software can quantitatively evaluate the connectivity of important patches as the basis for later maintenance or connectivity improvement [39,40]. Therefore, the heat source mainly uses Conefor 2.6 software to analyze the connectivity of the extracted core heat island patch. To measure the directional and element aggregation characteristics of the resistance surface, the standard deviation ellipse is used to judge the dominant direction, and the spatial autocorrelation is used to analyze the spatial aggregation characteristics. At the same time, in terms of corridor evaluation, the natural fracture method is used to judge the importance of corridors. In the circuit model, the random walk of electrons in the circuit is used to simulate the process of heat flow in regional diffusion [41,42]. Therefore, Circuitscape software can be employed to find the most important nodes, setting the stage for more precise heat island mitigation.
Finally, we investigate the precise and efficient mitigation strategies from the three aspects of heat islands (heat source, resistance surface, and heat corridor) based on the aforementioned construction and evaluation via a reverse thinking method. Then, we control the space between the partitions, manage the core heat island patches, and isolate the important nodes from the corridor.

2.2.2. Data Sources

MODIS remote sensing data are used as the data source for SUHIs in this project. The MOD11A2 remote sensing image is a 1 km2 resolution image of the Earth’s surface temperature in 2020 synthesized over eight days. The data can be obtained from NASA’s official website (https://ladsweb.modaps.eos.dis.nasa.gov/search, accessed on 1 June 2022). The data sensor is on board the Terra satellite.
GlobeLand30 data (http://www.globallandcover.com/, accessed on 15 June 2022), developed by the National Basic Geographic Information Center, provided the land use data for this study. The data are multispectral images at 30 m resolution that use the POK method based on pixel classification, object extraction, and knowledge verification [37]. According to China’s standard for land use classification, the study area is divided into eight categories: farmland, forest, grassland, shrubland, wetland, waters, construction land, and bare land.
In this study, all the spatial data are projected into the WGS_1984_UTM_Zone_50N coordinate system. We also use tools for resampling to turn the data into uniform raster data with a 30 m spatial resolution.

3. Method

3.1. Seasonal Division and Calculation of Land Surface Temperature (LST)

With an annual mean temperature of 17 °C and an annual temperature difference of 16 °C, the area has a typical subtropical monsoon humid climate. In most areas, the annual daily temperature exceeds 35 °C for approximately 10–30 days. The maximum temperature is above 30 °C for 60 to 80 days out of the year. The minimum temperature is below 0 °C for 80 to 110 days out of the year in most areas, decreasing from north to south. June, July, August, and September (defined as the summer months) are the four hottest successive months of the year, with average temperatures exceeding 22 °C. Therefore, we will calculate the average maximum of the 6- to 9-month LST composition.

3.2. Division of Urban Heat Island Intensity

Due to the difference in time and environment, the surface temperatures cannot be directly compared. However, the distribution of the relative intensity of the thermal field is not affected by other factors, so to analyze the relative spatiotemporal changes in the surface thermal environment, the urban surface thermal field is classified based on the surface temperature [12].
This study uses the mean-standard deviation method to classify the land surface thermal field. This method calculates the land surface temperature by multiple combinations of the mean and standard deviation and defines the urban thermal environment. The standard deviation reflects the deviation of the surface temperature from the mean temperature. Compared with the common method of equidistant density segmentation, the standard deviation can better reflect the classification characteristics of the urban heat island [11]. Based on the above theory, the surface heat field of the Wuhan Urban Agglomeration is divided into five grades with μ (mean), 0.5 std (standard deviation), and 1 std as the cutoff points. To analyze the heat island state, the high-temperature and medium-high-temperature areas are taken as the heat island range. Table 1 shows the specific rules for dividing the LST intensity by using the mean value and standard deviation.

3.3. MSPA-Based SUHI Mode

The morphological spatial pattern analysis method (MSPA) proposed by Vogt and other scholars can accurately classify grid images’ spatial pattern function types [40]. It can identify patches that play an essential role in regional landscape connectivity at the pixel level [43] and provide a more scientific basis for the selection of ecological sources and ecological corridors [44]. According to the needs of the MSPA method, ArcGIS is used to convert the land use classification data after remote sensing interpretation into 30 m × 30 m binary TIFF grid data [45]. The foreground and background are two categories of research objects in the MSPA method. Therefore, to identify the types of heat island patches important for maintaining connectivity, the extracted heat island area is set as the foreground data (set to 2), and other areas are the background data (set to 1). We used GuidosToolbox2.8 software to analyze the landscape pattern. After a series of mathematical calculations, such as skeleton extraction and corrosion calculation, seven landscape types with different functions are obtained. Next, we count the analysis results for MSPA. The core area is basically a large heat island patch within the research area, which may be the primary locus where solar radiation is absorbed. From here, we can select the source of the core heat island.

3.4. Connectivity Analysis

Connectivity analysis was initially applied to the landscape field, which refers to the comprehensive effect of the ecological processes of energy, material exchange, and migration among landscape elements and the movement rate of patches [46]. Therefore, connectivity analysis can also measure the connectivity and importance of heat island patches. In this paper, the “core” SUHI patches in MSPA are extracted, and the patch importance index dPC is analyzed using Conefor 2.6 software to measure the degree of connectivity between the core heat island patches in the study area. The higher connectivity index of the heat island patches indicates that they are essential to the heat sources of SUHIs. The calculation formula is as follows:
P C = i = 1 n j = 1 n a i × a j × p i j * A L 2
dPC = P C P C remove   P C × 100 %
where i j ; n represents the number of patches in the core area; a i and a j represent the areas of patches i and j , respectively; and p i j * represents the maximum product of all path probabilities between patch i and patch j . The value range of PC is 0 to 1. The larger the PC value is, the higher the connectivity between patches;   P C remove   indicates the possible connectivity index of the remaining patches after removing a patch.

3.5. Building the Friction (Cost) Map

Previous studies have fully demonstrated the ability of land cover elements (such as forest, water, and grassland) to reduce temperature [37,47]. The resistance scores of different land use types in the heat island diffusion pathway are determined, and the larger the resistance scores are, the greater the heat island blocking force, patch migration, and diffusion.
Because of their large heat capacities, low heat conductivities, and slow rate of temperature rise, wetland and water areas typically have the lowest temperatures [48]; hence, the resistance of the wetland and water areas is 100, ranking first.
Forestland also plays essential roles in lowering the surface temperature, collecting dust, minimizing wind, fixing soil fixation, beautifying the area, and greening cities [49]. Forestland is thought to play a large part in maintaining the stability of the urban environment; hence, its resistance value is 75, ranking second.
Irrigation of arable land has the potential to reduce regional temperatures. Water evaporation can absorb a large amount of heat from the air via a phenomenon called the “irrigation cooling effect” [50]. Additionally, crops grown on the cultivated land create high levels of vegetation coverage, reducing the bare surface area. As a result, the surface temperature is significantly reduced [51]. Therefore, the resistance value of arable land is set at 50, ranking third. Additionally, the effect of shrubs on plant coverage was less than that of woodlands; hence, the value of resistance for shrubs is also 50.
The results show that the mean temperature of grassland is the highest among the vegetation types, which indicates that the effect of grassland on urban heat islands is not pronounced [52]. Hence, the resistance value of grassland is 25, ranking fourth.
In general, the average temperature of construction land is very high, mainly because of the high density of buildings within the land area, which is not conducive to air circulation. Building materials such as bricks, tiles, and cement have low thermal capacity and inertia, but their thermal conductivity and diffusivity are large. After receiving solar radiation, these materials diffuse heat quickly into the surrounding atmosphere, resulting in the surrounding temperature being higher than that of the vegetated areas [53,54]. Therefore, the resistance value of construction land is 5, ranking fifth.
The high surface temperature of unused land is due to the characteristics of bare land. Because there is no plant growth on bare land and solar radiation impacts bare land directly, the temperature changes considerably [55,56]. Therefore, we set the bare ground resistance value at 1, ranking it sixth.

3.6. Standard Deviation Ellipse and Spatial Autocorrelation Analysis

The standard deviation ellipse can measure the concentration, dispersion, and direct distribution of geographical elements, explore the distribution and development trend of geographical elements, and visualize the spatial pattern of geographical elements. Lefever first proposed this method in 1926, and it is widely used in many fields and studies, such as population, economy, and sociology [57,58]. Based on the analysis of the standard deviation ellipse of the heat island friction (cost) map for the Wuhan urban agglomeration, the direction and trend of the heat island resistance patch in the study area are reflected. Among them, the shape of the ellipse can, to some extent, reflect the characteristics of the geographical element distribution. It mainly includes the directional angle, center, ellipse X and Y axes, and standard deviation. The formulas are as follows:
H x = i = 1 n ( x i x ¯ ) 2 n
H y = i = 1 n ( y i y ¯ ) 2 n
where H x and H y represent the calculated ellipse variance, x i and y i are the coordinates of geographical element i , x ¯ and y ¯ are the arithmetic average centers of geographical elements, and n is the number of elements. The directional angle of an ellipse is calculated by:
tan θ = i = 1 n x ˜ i 2 i = 1 n y ˜ i 2 + ( i = 1 n x ˜ i 2 i = 1 n y ˜ i 2 ) 2 + 4 ( i = 1 n x ˜ i y ˜ i ) 2 2 i = 1 n x ˜ i y ˜ i
where θ is the angle that starts at 0° due north and rotates clockwise to the x-axis; x ˜ i , and y ˜ i is the mean center deviation. The standard deviation of the x- and y-axes can be determined:
σ x = 2 i = 1 n ( x ˜ i cos θ y ˜ i cos θ ) 2 n σ y = 2 i = 1 n ( x ˜ i sin θ + y ˜ i cos θ ) 2 n }
where σ x and σ y are the standard deviations of the x- and y-axes, respectively.
Global spatial autocorrelation and local spatial autocorrelation are two aspects of spatial autocorrelation analysis. Moran’s I index, derived from global spatial autocorrelation analysis, can comprehensively describe the spatial average correlation degree, spatial distribution pattern, and significance of specific variables or attributes of each unit in the region [59]. The formula is expressed as:
I = n i = 1 n j = 1 n W i j ( x i X ¯ ) ( x j X ¯ ) ( i = 1 n j = 1 n w i j ) i = 1 n ( x i X ¯ ) 2
where x i and x j denote the spatial position of unit i and unit j , respectively, and i j ; X ¯ denotes the average value of the corresponding attribute values of n position units; W i j denotes the spatial weight matrix, and n represents the number of cells. The significance of spatial autocorrelation was tested by the Z statistic of a normal distribution [60]. The value of Moran’s I index is distributed between ±1; the absolute value indicates the strength of the spatial correlation of variables, the positive sign and the negative sign indicate the positive and negative correlation of variables in the region, respectively, and the trend to 0 indicates the noncorrelation and the random distribution.
Although the global Moran’s I index can judge the global correlation degree of an attribute value in the region, it cannot determine the specific location of the aggregation. Due to spatial heterogeneity, the spatial autocorrelation degree of each location in the study area can be different, so local Getis-OrdGi* hot spot analysis is carried out to locate the specific location of the spatial aggregation of heat island resistance. Hot spot analysis is used to identify statistically significant high-value and low-value aggregation areas, that is, hot and cold spots [61]. It is expressed as:
G i * = j = 1 n W i j x j X ¯ j = 1 n W i j S n j = 1 n W i j ( j = 1 n W i j ) 2 n 1
where S is the standard deviation of the corresponding attributes of n units; the others are the same as in Formula (7). To facilitate comparison and research, G i * is normalized and expressed as:
Z ( G i * ) = 1 E ( G i * ) V A R ( G i * )  
where E ( G i * ) is the expected value of the local Getis-OrdGi* index and V A R ( G i * ) is the variance of the local Getis-OrdGi* index. Z ( G i * ) > 1.96 indicates a significant hot spot area; 1.65 < Z ( G i * ) < 1.96 indicates a significant hot spot area; −1.65 < Z ( G i * ) < 1.65 indicates an area with insignificant aggregation; −1.96 < Z ( G i * ) < −1.65 indicates a significant cold spot area; and Z ( G i * ) < −1.96 indicates a significant cold spot area.

3.7. Construction of a Heat Island Network Based on Circuit Theory

In circuit theory, the movement of heat island patches is analogous to current, and the friction (cost) map is defined as a resistance surface. The higher the cumulative current value is, the better the connectivity of the circuit network, and vice versa [62,63]. In the process of simulating the regional diffusion of heat island patches based on circuit theory, some patches are first grounded, 1A current is input to other patches, the friction (cost) resistance surface is constructed, the current value between each pair of patches is calculated, and the current value can represent the probability of heat island patches moving along a certain path. Therefore, different calculation methods are used to determine how well different decentralized paths in the heat island network work based on how the electrons in the circuit move around randomly.
Based on circuit theory, this study used Circuitscape software and the Linkage Mapper tool for simulations. Circuitscape software provides four methods of calculation, of which “all-to-one” (many-to-one mode) is mainly used for the identification of essential patches, and “pairwise” (pair mode) is mainly used for the identification of corridors. In this study, “all-to-one” and “pairwise” were used to simulate the connectivity between heat island sources. Regarding how to scientifically set the resistance value, on the one hand, the theoretical circuit model creates the accumulated current value of migration or diffusion between patches through different resistance values [64]. Although different resistance values will produce different current densities, connectivity between patches can be observed [41] because a higher accumulated current value indicates that the connectivity between two patches in the region is better [40]. On the other hand, this paper combines the research results of relevant circuit theory and considers the propagation distance of heat island patches to comprehensively determine the resistance value [65,66]. The Linkage Mapper tool is used to construct the UGI network, and the search radius of the barrier Mapper tool is set to 500 m to identify obstacles in the network.

4. Results

4.1. Construction of the Urban Thermal Security Pattern

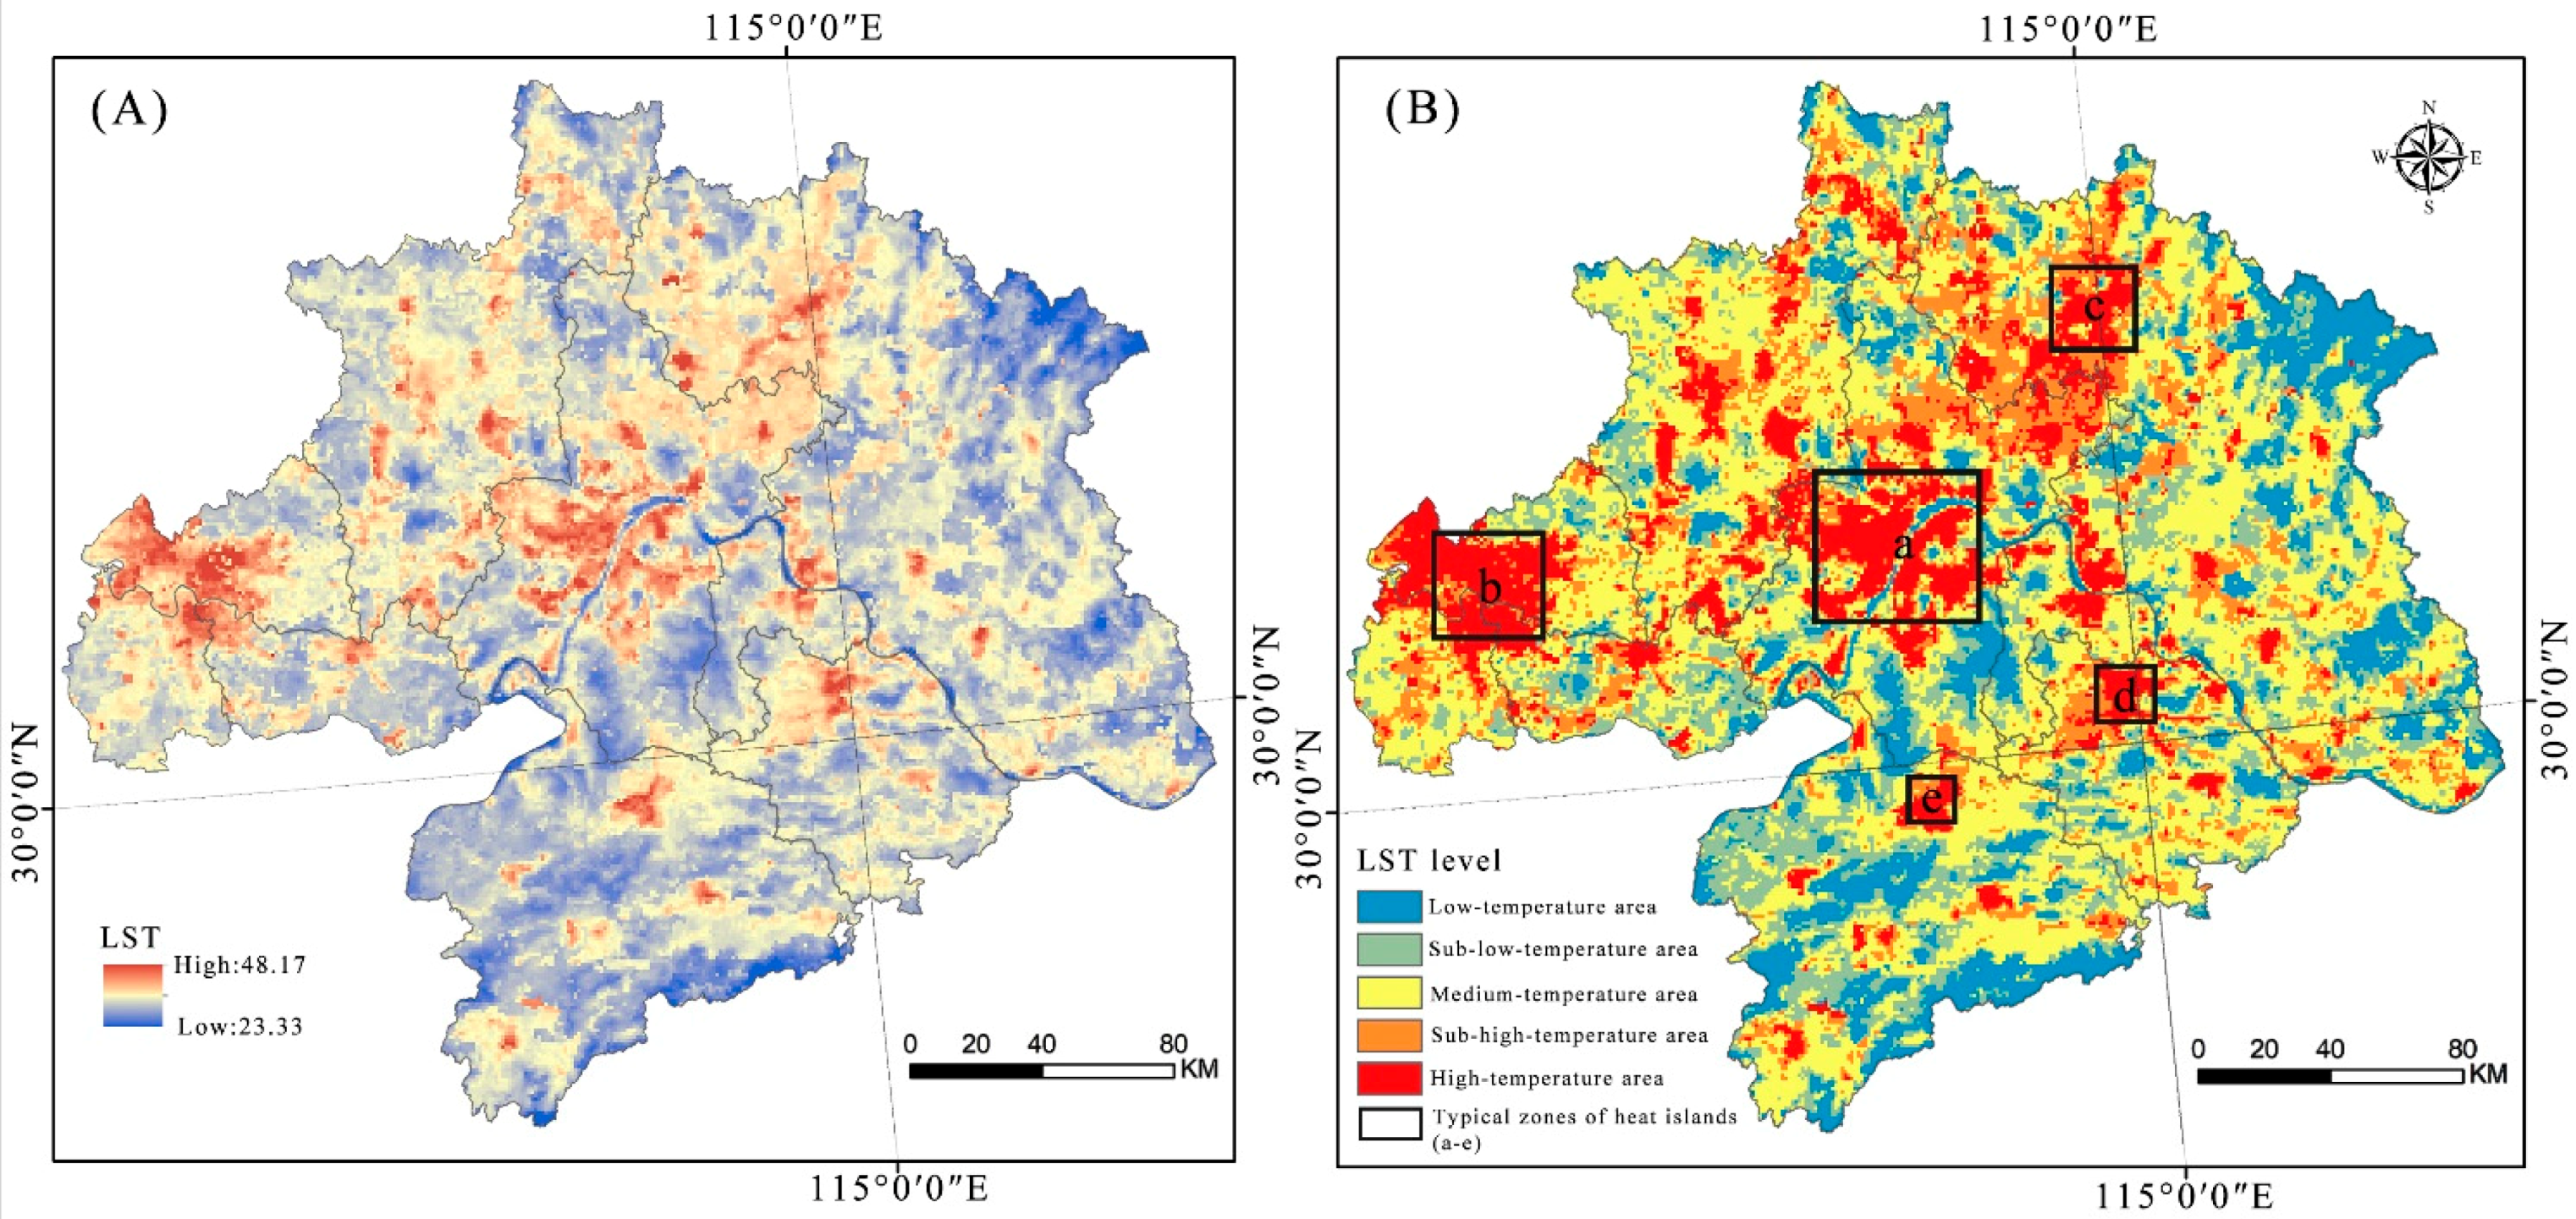
Figure 3A shows the average maximum value of LST synthesis in the Wuhan Urban Agglomeration from June to September 2020, where the minimum temperature was 23.33 °C, the maximum temperature was 48.17 °C, the mean value was 33.76 °C, and the standard deviation was 2.31. The LST showed an extensive range of changes or fluctuations. Five grades of heat island intensity in the Wuhan Urban Agglomeration are divided using the mean standard deviation. Figure 3B depicts the spatial distribution of heat island intensity change. The high-temperature area was 7774.29 km2, accounting for 13.41% of the total study area. The area of the medium- and high-temperature areas was 8462.14 km2, accounting for 14.59% of the total study area, indicating that the heat island covered 28.00% of the total study area. The proportion of the medium-temperature zone was as high as 40.09%, that of the medium- and low-temperature zones was 18.28%, and that of the low-temperature zone was 13.63%. Specifically, from the perspective of spatial distribution, the heat island patches in the Wuhan metropolitan area were mainly concentrated in the area of Wuhan’s main urban regions. However, they tended to spread to the surrounding areas. In addition, the “1 + 8” urban circle of Tianmen (Zone b), Huanggang (Zone c), Huangshi (Zone d), Xianning (Zone e), and other urban centers also had apparent heat islands. The spatial pattern of the heat island was consistent with the urban spatial distribution. The background areas were rich in water and forests; thus, they were mainly low-temperature and medium-low-temperature areas.
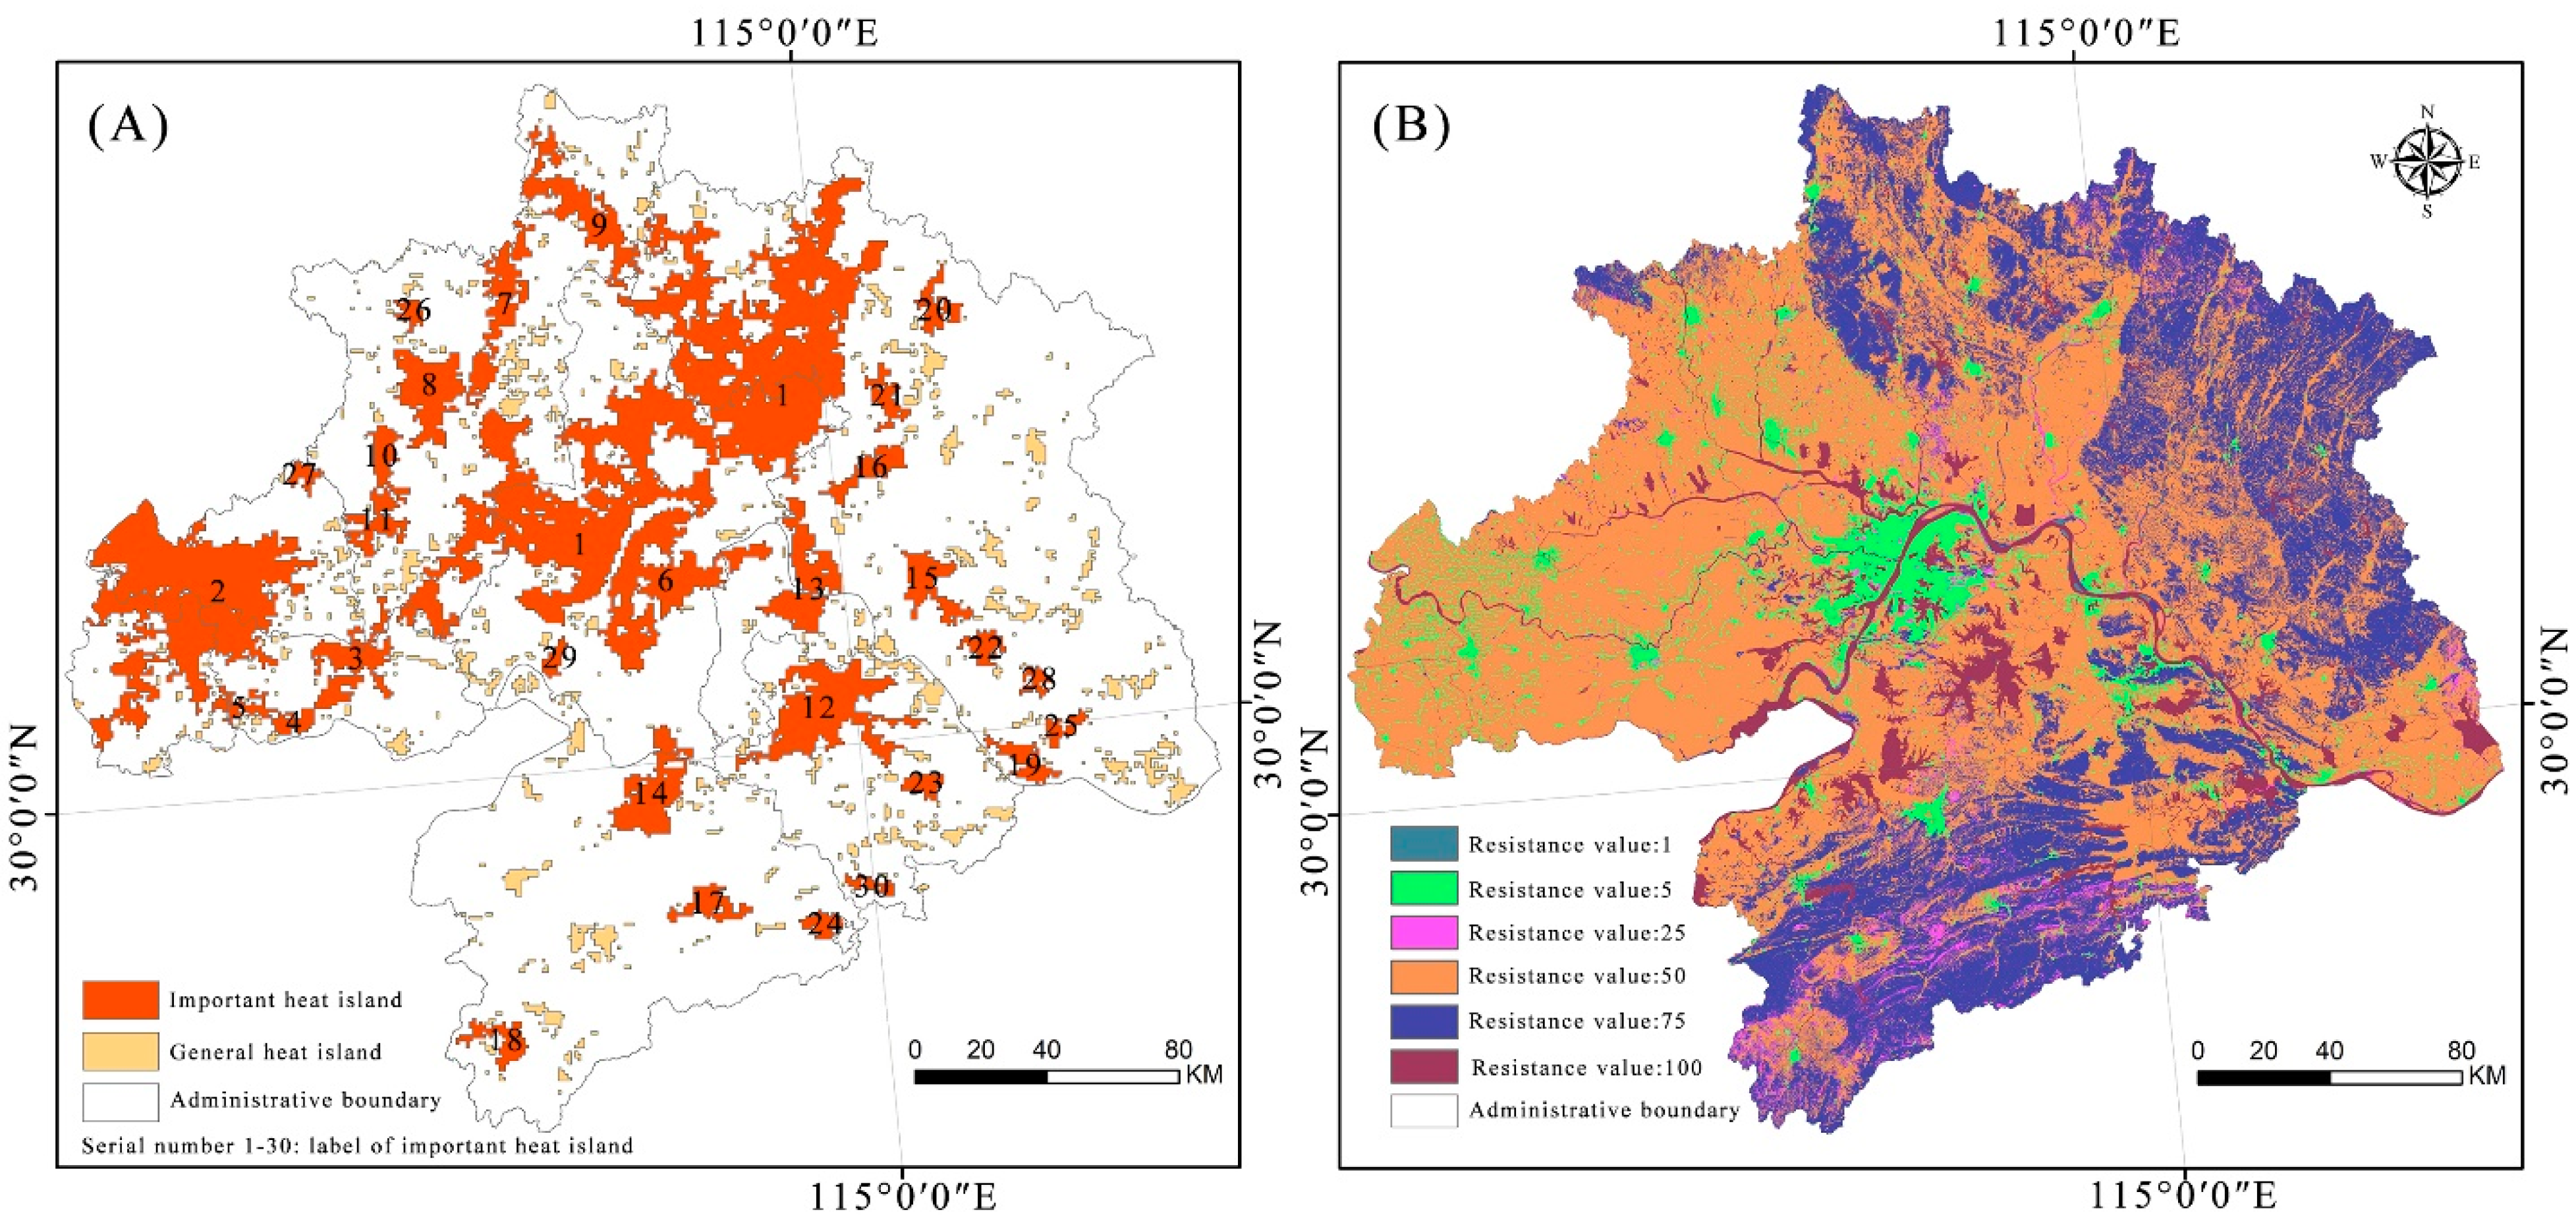
The prospective data area for MSPA analysis was 16,236.4356 km2, as shown in Table 2 and Figure 4A, accounting for approximately 27.999912% of the total area of the study area. In the foreground data, the heat island area in the core area was the largest, accounting for 97.59243% of the total foreground area. In addition, as the transition patch between the core heat island area and the outside background area, the marginal area accounts for 2.25766% of the foreground area. The porosity was along the inner edge of the core region, which had the same edge effect as the edge region. The porosity accounted for 0.14583% of the foreground area, indicating that the core heat island region had a specific edge effect. Moreover, the rest of the measurement indicators accounted for less.
Through the analysis of land cover resistance factors, Figure 4B shows the resistance surface of heat island propagation and diffusion in the Wuhan Urban Agglomeration. The study area’s spatial distribution of heat island resistance generally presented a “high in the east, low in the west, low in the middle, and high in the north and south” pattern. The terrain significantly influenced the heat island resistance distribution. The resistance value was low on the riverside plain in eastern Hubei and the Hanjiang plain west of the circle. The resistance values in the vast northern, northeastern, and southern low mountain and hilly areas were generally on the high side. In addition, the dense distribution of construction land led to the distribution of low-value resistance, which promoted the flow of heat island energy and led to the better connectivity of regional heat islands.
Figure 5A depicts the study area’s minimum cumulative resistance distribution map. The areas with larger cumulative resistance values were mainly distributed in the low mountain and hilly regions of the northeast and south. The distribution pattern was mainly related to the trend of the valleys. Therefore, a “depression” was formed due to the complex topography, convenient transportation, flat terrain, water distribution in more areas, more human activities, and heat island expansion resistance. As shown in Figure 5B, the minimum cost path for the starting and ending points was calculated by the minimum path tool from the minimum cumulative resistance model, simulating potential diffusion corridors that interconnect between patches of heat island sources. The results showed 56 channels in the Heat Island Patch, among which the northern corridor was sparse, and the eastern and southern corridors were more densely distributed, indicating that the exchange of matter and energy was more unimpeded in the Heat Island Patch.

4.2. Evaluation of the Urban Thermal Safety Pattern

Table 3 measures the significance of the 30 heat sources selected in the previous stage using dPC. The total area of the heat island source area was 13,023.2295 km2, which was distributed widely in space. The source area with a sequence number of 1 in the north was 5227.9668 km2, and the patch importance index (dPC) was 87.1181, indicating that the well-connected source area was conducive to the exchange of heat islands. It was located at the source of the heat island with serial numbers 2–7 in the north, and its patch importance index (dPC) was greater than 10, so its connectivity was better than that of other areas. The heat island source with serial numbers 8–11 had a patch importance index (dPC) greater than one and medium connectivity; however, the connectivity of heat island patches with other serial numbers was small. In the Wuhan urban agglomeration, heat island sources were not connected in the same way, and there was considerable patch fragmentation.
To reveal the spatial characteristics of the heat island friction (cost) map of the Wuhan urban agglomeration, this paper measured the center of gravity shift and ellipse distribution of the standard deviation ellipse. The center of gravity of the heat island friction (cost) map corresponded to the center of mass of this geographic plane. Table 4 shows the specific parameters of the ellipse. Combined with the ellipse shape of the heat island friction (cost) map in Figure 6, the east-west semiaxis was more significant than the south-north semiaxis, showing an obvious east-west distribution pattern. The standard deviation ellipse azimuth θ of the friction (cost) map was approximately 92.13°, which basically followed a horizontal straight line.
Based on the first-order spatial weight matrix of the Queen Standard, the global spatial autocorrelation analysis of the Wuhan urban heat island friction (cost) map was carried out. Furthermore, the global Moran’s I index results were obtained. The global Moran’s I index was 0.41, and all attributes passed the significance level test with a P value less than 0.01 and a z value greater than 2.58. The heat island friction (cost) map showed significant spatial autocorrelation. That is, the map of the Wuhan Urban Agglomeration’s heat island friction (cost) showed a very significant spatial clustering effect, and counties with high (or low) heat island friction (cost) were close to each other.
To better understand the local spatial aggregation characteristics of the heat island friction (cost) map, the hot spots and cold spots of the heat island friction map were explored using the Getis-OrdGi* hot spot analysis method. Compared with the local spatial autocorrelation, the hot spot analysis was more evident for the aggregation state of heat island friction (cost). According to the hot spot analysis, as shown in Figure 6, there were hot and cold spots in the friction (cost) of the heat island. The friction (cost) spatial agglomeration of the Wuhan urban heat island was characterized by “cold in the west and hot in the east”. Heat island friction (cost) hotspots were mainly located in lakes and nature reserves such as Long Lake and Hong Lake. At the same time, the eastern and southern regions contained low mountains and hills, the land use cover types were mostly woodland and grassland, the forest coverage rate was high, and the population was small, which was the secondary hot spot. The friction (cost) cold spots of heat islands were mainly found in the region’s middle and west, where there was much human disturbance.

5. Discussion

5.1. Characteristics of the Urban Thermal Safety Pattern

In summary, the distribution law of the heat island patches in the Wuhan Urban Agglomeration is consistent with the urban spatial distribution. It gradually spreads from the main urban area of Wuhan to the surrounding urban areas, and the centers of other cities in the urban circle also have a noticeable heat island effect. Generally, the effect is mainly distributed around the developed areas of cities. In particular, as the economic activities of urban areas have accelerated and the population density has grown in recent years, the number of buildings has increased, and traffic congestion and other factors have likewise increased in tandem. These results are consistent with those of previous studies [67,68].
At the same time, heat island patch spreading resistance is mainly distributed in mountains, woodlands, and water areas where human activity is minimized, such as river basins. Because of their intrinsic resistance to heat island patch spreading, the resistance value of these localities is higher. Finally, the resistance values of these regions form the characteristic spatial pattern of “middle low, four sides high”. Figure 7A shows that the corridors spatially connect the otherwise independent heat sources. Due to the limitations of geographical space and friction cost along corridors, the connection lengths between them are not the same. The total length of the corridor centerline is 1004.71 km. In the Wuhan Urban Agglomeration, a network of heat sources has grown, making it easier for each heat source to connect to other heat sources and strengthening the urban heat island as a whole.
As shown in Figure 7B, the critical nodes in the study area are located on the edge or corridor of the heat source, and more significant obstacles are found where the natural and artificial ecosystems intersect. The area of relatively small obstacles, on the other hand, appears in land use areas classified as woodland or water areas. These essential nodes, which are often tiny in size and distant from major heat sources, are thought to be crucial for the proper operation of heat island corridors. As a result, the focus of the TSPurban network optimization is the effective blocking of critical points, which plays an important role in reducing the structure and function of the regional heat island system.

5.2. Optimization of the Urban Thermal Safety Pattern

5.2.1. Comprehensive “Destruction” of Patches and Corridors

As a reverse thinking process, one should think about how to reduce the stability and connectivity of the heat island patch network under the conditions of the status quo TSPurban. The first goal, from the perspective of the heat source itself, is to weaken the heat island source site. For this purpose, we consider natural and artificial drivers: on the one hand, based on natural drivers, the reduction in heat islands via green areas is extremely obvious [69]. Therefore, we should vigorously develop green urban construction. While improving the ecological and environmental function of green spaces, we should strictly implement ecological conservation measures, such as implementing ecological protection projects, returning farmland to forests, and closing mountains for afforestation. On the other hand, to address artificial drivers, local resource advantages should be used to their fullest during regional economic development. This means gradually reducing the production of high-energy-consuming businesses, adjusting the industrial structure and layout, and reducing the entry of artificial heat sources.
The second goal, from the perspective of heat source connectivity, is to destroy heat island corridors. To this end, two options focus on nodes and corridors. First, because the number and quality of nodes dictate the formation of heat island corridors, the destruction of corridors is contingent on the continuous reduction in heat island sources. Second, integrated heat island mitigation projects should be carried out for both the corridor and its perimeter. The mitigation projects for the corridor itself should mainly focus on minimizing the corridor width to reduce the contribution to network connectivity, while the mitigation projects for the corridor perimeter need to be integrated to increase the diffusion resistance of heat flow, a process that is largely influenced by the dominant influence of land cover [47,52].
Specifically, to address the main characteristics of the Wuhan Urban Agglomeration in this study, various methods must be implemented to destroy the heat island system within the TSPurban network and block heat island corridors at the key points. On the one hand, the regional heat island resistance barrier formed by the “green veins” (forests and grasslands) and “blue veins” (waters and wetlands) of the Wuhan Urban Agglomeration should be protected. On the other hand, the construction and protection of multiple groups of ecological “isolated green wedges” are required to gradually form green isolation zones within the Wuhan Urban Agglomeration, thus reducing the heat island effect.

5.2.2. Effective “Barrier” Based on Key Point Analysis

In the reverse thinking process, when the TSPurban network is disrupted by blocking the links and key pinch points at the spatial level, the SUHI connectivity is reduced. Thus the SUHI effect can be effectively mitigated. Since we have already discussed how connected links can be broken from the point of view of heat source connectivity, we know that the next step in reducing the effects of heat islands will be to pinpoint the priority mitigation zones. This will be done by implementing effective mitigation measures at key points in the TSPurban network.
Specifically, the above analysis shows that the corridor connections between heat island patches are where most critical points are located, and these areas require the most urgent improvement. Once mitigation measures become significant, the improvement effect becomes obvious. The heat island “barrier” in this area can directly reduce the overall connectivity efficiency of the TSPurban network. In this study, the critical nodes are mainly located in the eastern and southern regions of the Wuhan urban area, and planners and policymakers should focus on these areas when implementing future climate adaptation planning and SUHI mitigation measures. If the key nodes involve regional ecological and arable land protection areas, they can be adjusted by micro-means, such as optimizing spatial layout structures and updating building materials. At the same time, because of the wide distribution of these key points, “blocking” will be a long-term investment. Effectively “blocking” a key node is the cornerstone for significantly mitigating the formation of a regional TSPurban network.

5.3. Limitations and Deficiencies

This study also has some shortcomings. First, this paper mainly focuses on the urban heat island effect formed by LST during the daytime. However, the heat island effect is more potent at night [70] because daytime solar radiation induces a warming state in the nearby ground, while the whole region enters a cooling environment when the ground emits longwave radiation at night. The greater the heat escaping the ground, the lower the LST [71]. Therefore, in future work, we can compare nighttime data features and the daytime TSPurban network. Second, the heat island friction (cost) resistance surface is subject to the superposition of both artificial and natural factors [72,73]. The focus of this paper is to measure the integrated results of land cover; the consideration of artificial resistance drivers should be enhanced at a later stage.

6. Conclusions

This study selected the Wuhan Urban Agglomeration, an important strategic place in Central China, and constructed three major elements of the TSPurban based on the MSPA model and circuit theory “heat source, resistance surface, and corridor,” and used “reverse thinking” to explore a variety of ways to optimize the TSPurban. The main conclusions were as follows: (1) regarding the heat source, heat island patches were extracted according to the MSPA model, and the patches in the top 30 important heat island source areas were evaluated using the connectivity analysis method. It was found that the spatial form of the heat island was consistent with the urban spatial distribution; (2) regarding the resistance surface, the resistance surface of heat island propagation and diffusion was constructed by combining the land cover resistance factors, and the resistance surface was evaluated by using the standard deviation ellipse and spatial autocorrelation analysis methods. It was found that the resistance surface was distributed in an “east–west” spatial pattern and that the gathering situation was characterized by “cold in the west and hot in the east”; (3) regarding the corridor, we identified the link (corridor) based on the circuit theory and used the Linkage Mapper software to connect the lowest-cost path of the SUHI “source,” thus generating 56 heat island corridors with a total length of 1004.71 km. At the same time, Circuitscape software was used to identify key nodes to effectively control key points, and the ecological regulation function for alleviating the urban heat island effect was more prominent. In terms of optimizing the TSPurban, it is necessary to weaken the interconnection between heat island sources at the spatial level by “breaking” the links and key nodes in the TSPurban network. Ultimately, the focus is on increasing the fragmentation of heat island patches and their resistance to diffusion and reducing the connections between heat islands while weakening the heat source patches themselves. This study utilizes reverse thinking to effectively mitigate the urban thermal environment.

Author Contributions

C.H.: Writing—original draft, Data curation. H.L.: Data curation, Software, Supervision. All authors have read and agreed to the published version of the manuscript.

Funding

This work was supported by the Natural Science Foundation of China under grant 41807319 and the Fundamental Research Funds for the Central Universities (YCJJ202204012).

Data Availability Statement

The original contributions presented in the study are included in the article, and further inquiries can be directed to the corresponding author.

Conflicts of Interest

The authors declare that the research was conducted without commercial or financial relationships that could be construed as a potential conflict of interest.

References

  1. Lo, C.P.; Quattrochi, D.A.; Luvall, J.C. Application of High-Resolution Thermal Infrared Remote Sensing and GIS to Assess the Urban Heat Island Effect. Int. J. Remote Sens. 1997, 18, 287–304. [Google Scholar] [CrossRef] [Green Version]
  2. O’Malley, C.; Piroozfar, P.; Farr, E.R.; Pomponi, F. Urban Heat Island (UHI) Mitigating Strategies: A Case-Based Comparative Analysis. Sustain. Cities Soc. 2015, 19, 222–235. [Google Scholar] [CrossRef] [Green Version]
  3. Howard, L. The Climate of London: Deduced from Meteorological Observations Made in the Metropolis and at Various Places around It; Harvey and Darton: London, UK, 1833; Volume 3. [Google Scholar]
  4. Stone Jr, B.; Rodgers, M.O. Urban Form and Thermal Efficiency: How the Design of Cities Influences the Urban Heat Island Effect. Am. Plan. Assoc. J. Am. Plan. Assoc. 2001, 67, 186. [Google Scholar] [CrossRef]
  5. Rizwan, A.M.; Dennis, L.Y.; Chunho, L.I.U. A Review on the Generation, Determination and Mitigation of Urban Heat Island. J. Environ. Sci. 2008, 20, 120–128. [Google Scholar] [CrossRef]
  6. Zhou, D.; Xiao, J.; Bonafoni, S.; Berger, C.; Deilami, K.; Zhou, Y.; Frolking, S.; Yao, R.; Qiao, Z.; Sobrino, J. Satellite Remote Sensing of Surface Urban Heat Islands: Progress, Challenges, and Perspectives. Remote Sens. 2018, 11, 48. [Google Scholar] [CrossRef] [Green Version]
  7. Chen, X.-L.; Zhao, H.-M.; Li, P.-X.; Yin, Z.-Y. Remote Sensing Image-Based Analysis of the Relationship between Urban Heat Island and Land Use/Cover Changes. Remote Sens. Environ. 2006, 104, 133–146. [Google Scholar] [CrossRef]
  8. Li, H.; Zhou, Y.; Wang, X.; Zhou, X.; Zhang, H.; Sodoudi, S. Quantifying Urban Heat Island Intensity and Its Physical Mechanism Using WRF/UCM. Sci. Total Environ. 2019, 650, 3110–3119. [Google Scholar] [CrossRef] [PubMed]
  9. Corburn, J. Cities, Climate Change and Urban Heat Island Mitigation: Localising Global Environmental Science. Urban Stud. 2009, 46, 413–427. [Google Scholar] [CrossRef]
  10. Gao, J.; Yu, Z.; Wang, L.; Vejre, H. Suitability of Regional Development Based on Ecosystem Service Benefits and Losses: A Case Study of the Yangtze River Delta Urban Agglomeration, China. Ecol. Indic. 2019, 107, 105579. [Google Scholar] [CrossRef]
  11. Sun, D.; Hu, C.; Wang, Y.; Wang, Z.; Zhang, J. Examining Spatio-Temporal Characteristics of Urban Heat Islands and Factors Driving Them in Hangzhou, China. IEEE J. Sel. Top. Appl. Earth Obs. Remote Sens. 2021, 14, 8316–8325. [Google Scholar] [CrossRef]
  12. Wang, Z.; Sun, D.; Hu, C.; Wang, Y.; Zhang, J. Seasonal Contrast and Interactive Effects of Potential Drivers on Land Surface Temperature in the Sichuan Basin, China. Remote Sens. 2022, 14, 1292. [Google Scholar] [CrossRef]
  13. Akbari, H.; Kolokotsa, D. Three Decades of Urban Heat Islands and Mitigation Technologies Research. Energy Build. 2016, 133, 834–842. [Google Scholar] [CrossRef]
  14. Wu, J. Urban Ecology and Sustainability: The State-of-the-Science and Future Directions. Landsc. Urban Plan. 2014, 125, 209–221. [Google Scholar] [CrossRef]
  15. Grimm, N.B.; Faeth, S.H.; Golubiewski, N.E.; Redman, C.L.; Wu, J.; Bai, X.; Briggs, J.M. Global Change and the Ecology of Cities. Science 2008, 319, 756–760. [Google Scholar] [CrossRef] [PubMed] [Green Version]
  16. Oke, T.R.; Mills, G.; Christen, A.; Voogt, J.A. Urban Climates; Cambridge University Press: Cambridge, UK, 2017; ISBN 0-521-84950-0. [Google Scholar]
  17. Li, X.; Zhou, Y.; Asrar, G.R.; Imhoff, M.; Li, X. The Surface Urban Heat Island Response to Urban Expansion: A Panel Analysis for the Conterminous United States. Sci. Total Environ. 2017, 605, 426–435. [Google Scholar] [CrossRef]
  18. Zhou, D.; Zhao, S.; Liu, S.; Zhang, L.; Zhu, C. Surface Urban Heat Island in China’s 32 Major Cities: Spatial Patterns and Drivers. Remote Sens. Environ. 2014, 152, 51–61. [Google Scholar] [CrossRef]
  19. Saaroni, H.; Amorim, J.H.; Hiemstra, J.A.; Pearlmutter, D. Urban Green Infrastructure as a Tool for Urban Heat Mitigation: Survey of Research Methodologies and Findings across Different Climatic Regions. Urban Clim. 2018, 24, 94–110. [Google Scholar] [CrossRef]
  20. Bowler, D.E.; Buyung-Ali, L.; Knight, T.M.; Pullin, A.S. Urban Greening to Cool Towns and Cities: A Systematic Review of the Empirical Evidence. Landsc. Urban Plan. 2010, 97, 147–155. [Google Scholar] [CrossRef]
  21. Zhou, W.; Wang, J.; Cadenasso, M.L. Effects of the Spatial Configuration of Trees on Urban Heat Mitigation: A Comparative Study. Remote Sens. Environ. 2017, 195, 1–12. [Google Scholar] [CrossRef]
  22. Chen, L.; Sun, R.; Lu, Y. A Conceptual Model for a Process-Oriented Landscape Pattern Analysis. Sci. China Earth Sci. 2019, 62, 2050–2057. [Google Scholar] [CrossRef]
  23. Yu, Z.; Zhang, J.; Yang, G.; Schlaberg, J. Reverse Thinking: A New Method from the Graph Perspective for Evaluating and Mitigating Regional Surface Heat Islands. Remote Sens. 2021, 13, 1127. [Google Scholar] [CrossRef]
  24. Zhou, D.; Bonafoni, S.; Zhang, L.; Wang, R. Remote Sensing of the Urban Heat Island Effect in a Highly Populated Urban Agglomeration Area in East China. Sci. Total Environ. 2018, 628–629, 415–429. [Google Scholar] [CrossRef] [PubMed]
  25. Yu, Z.; Yao, Y.; Yang, G.; Wang, X.; Vejre, H. Spatiotemporal Patterns and Characteristics of Remotely Sensed Region Heat Islands during the Rapid Urbanization (1995–2015) of Southern China. Sci. Total Environ. 2019, 674, 242–254. [Google Scholar] [CrossRef] [PubMed]
  26. Pan, J. Area Delineation and Spatial-Temporal Dynamics of Urban Heat Island in Lanzhou City, China Using Remote Sensing Imagery. J. Indian Soc. Remote Sens. 2016, 44, 111–127. [Google Scholar] [CrossRef]
  27. Santamouris, M. Cooling the Cities–a Review of Reflective and Green Roof Mitigation Technologies to Fight Heat Island and Improve Comfort in Urban Environments. Sol. Energy 2014, 103, 682–703. [Google Scholar] [CrossRef]
  28. Meerow, S.; Newell, J.P. Spatial Planning for Multifunctional Green Infrastructure: Growing Resilience in Detroit. Landsc. Urban Plan. 2017, 159, 62–75. [Google Scholar] [CrossRef]
  29. Sun, R.; Xie, W.; Chen, L. A Landscape Connectivity Model to Quantify Contributions of Heat Sources and Sinks in Urban Regions. Landsc. Urban Plan. 2018, 178, 43–50. [Google Scholar] [CrossRef]
  30. Peng, J.; Cheng, X.; Hu, Y.; Corcoran, J. A Landscape Connectivity Approach to Mitigating the Urban Heat Island Effect. Landsc. Ecol. 2022, 37, 1707–1719. [Google Scholar] [CrossRef]
  31. Peng, J.; Hu, Y.; Dong, J.; Liu, Q.; Liu, Y. Quantifying Spatial Morphology and Connectivity of Urban Heat Islands in a Megacity: A Radius Approach. Sci. Total Environ. 2020, 714, 136792. [Google Scholar] [CrossRef]
  32. Yu, Z.; Zhang, J.; Yang, G. How to Build a Heat Network to Alleviate Surface Heat Island Effect? Sustain. Cities Soc. 2021, 74, 103135. [Google Scholar] [CrossRef]
  33. Qin, Y. A Review on the Development of Cool Pavements to Mitigate Urban Heat Island Effect. Renew. Sustain. Energy Rev. 2015, 52, 445–459. [Google Scholar] [CrossRef]
  34. Guo, G.; Wu, Z.; Cao, Z.; Chen, Y.; Zheng, Z. Location of Greenspace Matters: A New Approach to Investigating the Effect of the Greenspace Spatial Pattern on Urban Heat Environment. Landsc. Ecol. 2021, 36, 1533–1548. [Google Scholar] [CrossRef]
  35. Zhang, Y.; Odeh, I.O.; Ramadan, E. Assessment of Land Surface Temperature in Relation to Landscape Metrics and Fractional Vegetation Cover in an Urban/Peri-Urban Region Using Landsat Data. Int. J. Remote Sens. 2013, 34, 168–189. [Google Scholar] [CrossRef]
  36. Gunawardena, K.R.; Wells, M.J.; Kershaw, T. Utilising Green and Bluespace to Mitigate Urban Heat Island Intensity. Sci. Total Environ. 2017, 584, 1040–1055. [Google Scholar] [CrossRef]
  37. Hu, C.; Wang, Z.; Wang, Y.; Sun, D.; Zhang, J. Combining MSPA-MCR Model to Evaluate the Ecological Network in Wuhan, China. Land 2022, 11, 213. [Google Scholar] [CrossRef]
  38. Liu, Y.; Fang, X.; Xu, Y.; Zhang, S.; Luan, Q. Assessment of Surface Urban Heat Island across China’s Three Main Urban Agglomerations. Theor. Appl. Climatol. 2018, 133, 473–488. [Google Scholar] [CrossRef]
  39. Saura, S.; Pascual-Hortal, L. A New Habitat Availability Index to Integrate Connectivity in Landscape Conservation Planning: Comparison with Existing Indices and Application to a Case Study. Landsc. Urban Plan. 2007, 83, 91–103. [Google Scholar] [CrossRef]
  40. An, Y.; Liu, S.; Sun, Y.; Shi, F.; Beazley, R. Construction and Optimization of an Ecological Network Based on Morphological Spatial Pattern Analysis and Circuit Theory. Landsc. Ecol. 2021, 36, 2059–2076. [Google Scholar] [CrossRef]
  41. McRae, B.H.; Dickson, B.G.; Keitt, T.H.; Shah, V.B. Using Circuit Theory to Model Connectivity in Ecology, Evolution, and Conservation. Ecology 2008, 89, 2712–2724. [Google Scholar] [CrossRef]
  42. Dickson, B.G.; Albano, C.M.; Anantharaman, R.; Beier, P.; Fargione, J.; Graves, T.A.; Gray, M.E.; Hall, K.R.; Lawler, J.J.; Leonard, P.B. Circuit-theory Applications to Connectivity Science and Conservation. Conserv. Biol. 2019, 33, 239–249. [Google Scholar] [CrossRef]
  43. Wang, S.; Wu, M.; Hu, M.; Fan, C.; Wang, T.; Xia, B. Promoting Landscape Connectivity of Highly Urbanized Area: An Ecological Network Approach. Ecol. Indic. 2021, 125, 107487. [Google Scholar] [CrossRef]
  44. Huang, X.; Wang, H.; Shan, L.; Xiao, F. Constructing and Optimizing Urban Ecological Network in the Context of Rapid Urbanization for Improving Landscape Connectivity. Ecol. Indic. 2021, 132, 108319. [Google Scholar] [CrossRef]
  45. Wang, T.; Li, H.; Huang, Y. The Complex Ecological Network’s Resilience of the Wuhan Metropolitan Area. Ecol. Indic. 2021, 130, 108101. [Google Scholar] [CrossRef]
  46. Zhao, S.; Ma, Y.; Wang, J.; You, X. Landscape Pattern Analysis and Ecological Network Planning of Tianjin City. Urban For. Urban Green. 2019, 46, 126479. [Google Scholar] [CrossRef]
  47. Buyantuyev, A.; Wu, J. Urban Heat Islands and Landscape Heterogeneity: Linking Spatiotemporal Variations in Surface Temperatures to Land-Cover and Socioeconomic Patterns. Landsc. Ecol. 2010, 25, 17–33. [Google Scholar] [CrossRef]
  48. Coutts, A.M.; Tapper, N.J.; Beringer, J.; Loughnan, M.; Demuzere, M. Watering Our Cities: The Capacity for Water Sensitive Urban Design to Support Urban Cooling and Improve Human Thermal Comfort in the Australian Context. Prog. Phys. Geogr. 2013, 37, 2–28. [Google Scholar] [CrossRef]
  49. Chen, W.Y.; Jim, C.Y. Assessment and Valuation of the Ecosystem Services Provided by Urban Forests. In Ecology, Planning, and Management of Urban Forests; Springer: Berlin/Heidelberg, Germany, 2008; pp. 53–83. [Google Scholar]
  50. Sacks, W.J.; Cook, B.I.; Buenning, N.; Levis, S.; Helkowski, J.H. Effects of Global Irrigation on the Near-Surface Climate. Clim. Dyn. 2009, 33, 159–175. [Google Scholar] [CrossRef] [Green Version]
  51. Shi, W.; Tao, F.; Liu, J. Regional Temperature Change over the Huang-Huai-Hai Plain of China: The Roles of Irrigation versus Urbanization. Int. J. Climatol. 2014, 34, 1181–1195. [Google Scholar] [CrossRef]
  52. Zou, Z.; Yan, C.; Yu, L.; Jiang, X.; Ding, J.; Qin, L.; Wang, B.; Qiu, G. Impacts of Land Use/Land Cover Types on Interactions between Urban Heat Island Effects and Heat Waves. Build. Environ. 2021, 204, 108138. [Google Scholar] [CrossRef]
  53. Peng, J.; Jia, J.; Liu, Y.; Li, H.; Wu, J. Seasonal Contrast of the Dominant Factors for Spatial Distribution of Land Surface Temperature in Urban Areas. Remote Sens. Environ. 2018, 215, 255–267. [Google Scholar] [CrossRef]
  54. Verbeke, S.; Audenaert, A. Thermal Inertia in Buildings: A Review of Impacts across Climate and Building Use. Renew. Sustain. Energy Rev. 2018, 82, 2300–2318. [Google Scholar] [CrossRef]
  55. Jiang, J.; Tian, G. Analysis of the Impact of Land Use/Land Cover Change on Land Surface Temperature with Remote Sensing. Procedia Environ. Sci. 2010, 2, 571–575. [Google Scholar] [CrossRef] [Green Version]
  56. Tran, D.X.; Pla, F.; Latorre-Carmona, P.; Myint, S.W.; Caetano, M.; Kieu, H.V. Characterizing the Relationship between Land Use Land Cover Change and Land Surface Temperature. ISPRS J. Photogramm. Remote Sens. 2017, 124, 119–132. [Google Scholar] [CrossRef] [Green Version]
  57. Yuill, R.S. The Standard Deviational Ellipse; an Updated Tool for Spatial Description. Geogr. Ann. Ser. B Hum. Geogr. 1971, 53, 28–39. [Google Scholar] [CrossRef]
  58. Lefever, D.W. Measuring Geographic Concentration by Means of the Standard Deviational Ellipse. Am. J. Sociol. 1926, 32, 88–94. [Google Scholar] [CrossRef]
  59. Fan, C.; Myint, S. A Comparison of Spatial Autocorrelation Indices and Landscape Metrics in Measuring Urban Landscape Fragmentation. Landsc. Urban Plan. 2014, 121, 117–128. [Google Scholar] [CrossRef]
  60. Liu, Y.; Tian, J.; Zheng, W.; Yin, L. Spatial and Temporal Distribution Characteristics of Haze and Pollution Particles in China Based on Spatial Statistics. Urban Clim. 2022, 41, 101031. [Google Scholar] [CrossRef]
  61. Li, G.; Fang, C.; Wang, S. Exploring Spatiotemporal Changes in Ecosystem-Service Values and Hotspots in China. Sci. Total Environ. 2016, 545, 609–620. [Google Scholar] [CrossRef]
  62. Xie, P.; Yang, J.; Wang, H.; Liu, Y.; Liu, Y. A New Method of Simulating Urban Ventilation Corridors Using Circuit Theory. Sustain. Cities Soc. 2020, 59, 102162. [Google Scholar] [CrossRef]
  63. Huang, J.; Hu, Y.; Zheng, F. Research on Recognition and Protection of Ecological Security Patterns Based on Circuit Theory: A Case Study of Jinan City. Environ. Sci. Pollut. Res. 2020, 27, 12414–12427. [Google Scholar] [CrossRef]
  64. Liu, Y.; Huang, T.-T.; Zheng, X. A Method of Linking Functional and Structural Connectivity Analysis in Urban Green Infrastructure Network Construction. Urban Ecosyst. 2022, 25, 909–925. [Google Scholar] [CrossRef]
  65. Hathway, E.A.; Sharples, S. The Interaction of Rivers and Urban Form in Mitigating the Urban Heat Island Effect: A UK Case Study. Build. Environ. 2012, 58, 14–22. [Google Scholar] [CrossRef] [Green Version]
  66. Wu, Z.; Zhang, Y. Water Bodies’ Cooling Effects on Urban Land Daytime Surface Temperature: Ecosystem Service Reducing Heat Island Effect. Sustainability 2019, 11, 787. [Google Scholar] [CrossRef] [Green Version]
  67. Xiong, Y.; Zhang, F. Effect of Human Settlements on Urban Thermal Environment and Factor Analysis Based on Multi-Source Data: A Case Study of Changsha City. J. Geogr. Sci. 2021, 31, 819–838. [Google Scholar] [CrossRef]
  68. Meng, Q.; Zhang, L.; Sun, Z.; Meng, F.; Wang, L.; Sun, Y. Characterizing Spatial and Temporal Trends of Surface Urban Heat Island Effect in an Urban Main Built-up Area: A 12-Year Case Study in Beijing, China. Remote Sens. Environ. 2018, 204, 826–837. [Google Scholar] [CrossRef]
  69. Xiao, X.D.; Dong, L.; Yan, H.; Yang, N.; Xiong, Y. The Influence of the Spatial Characteristics of Urban Green Space on the Urban Heat Island Effect in Suzhou Industrial Park. Sustain. Cities Soc. 2018, 40, 428–439. [Google Scholar] [CrossRef]
  70. Sarrat, C.; Lemonsu, A.; Masson, V.; Guédalia, D. Impact of Urban Heat Island on Regional Atmospheric Pollution. Atmos. Environ. 2006, 40, 1743–1758. [Google Scholar] [CrossRef]
  71. Oke, T.R.; Johnson, G.T.; Steyn, D.G.; Watson, I.D. Simulation of Surface Urban Heat Islands under ‘Ideal’Conditions at Night Part 2: Diagnosis of Causation. Bound.-Layer Meteorol. 1991, 56, 339–358. [Google Scholar] [CrossRef]
  72. Ulpiani, G. On the Linkage between Urban Heat Island and Urban Pollution Island: Three-Decade Literature Review towards a Conceptual Framework. Sci. Total Environ. 2021, 751, 141727. [Google Scholar] [CrossRef]
  73. Wang, Z.; Meng, Q.; Allam, M.; Hu, D.; Zhang, L.; Menenti, M. Environmental and Anthropogenic Drivers of Surface Urban Heat Island Intensity: A Case-Study in the Yangtze River Delta, China. Ecol. Indic. 2021, 128, 107845. [Google Scholar] [CrossRef]
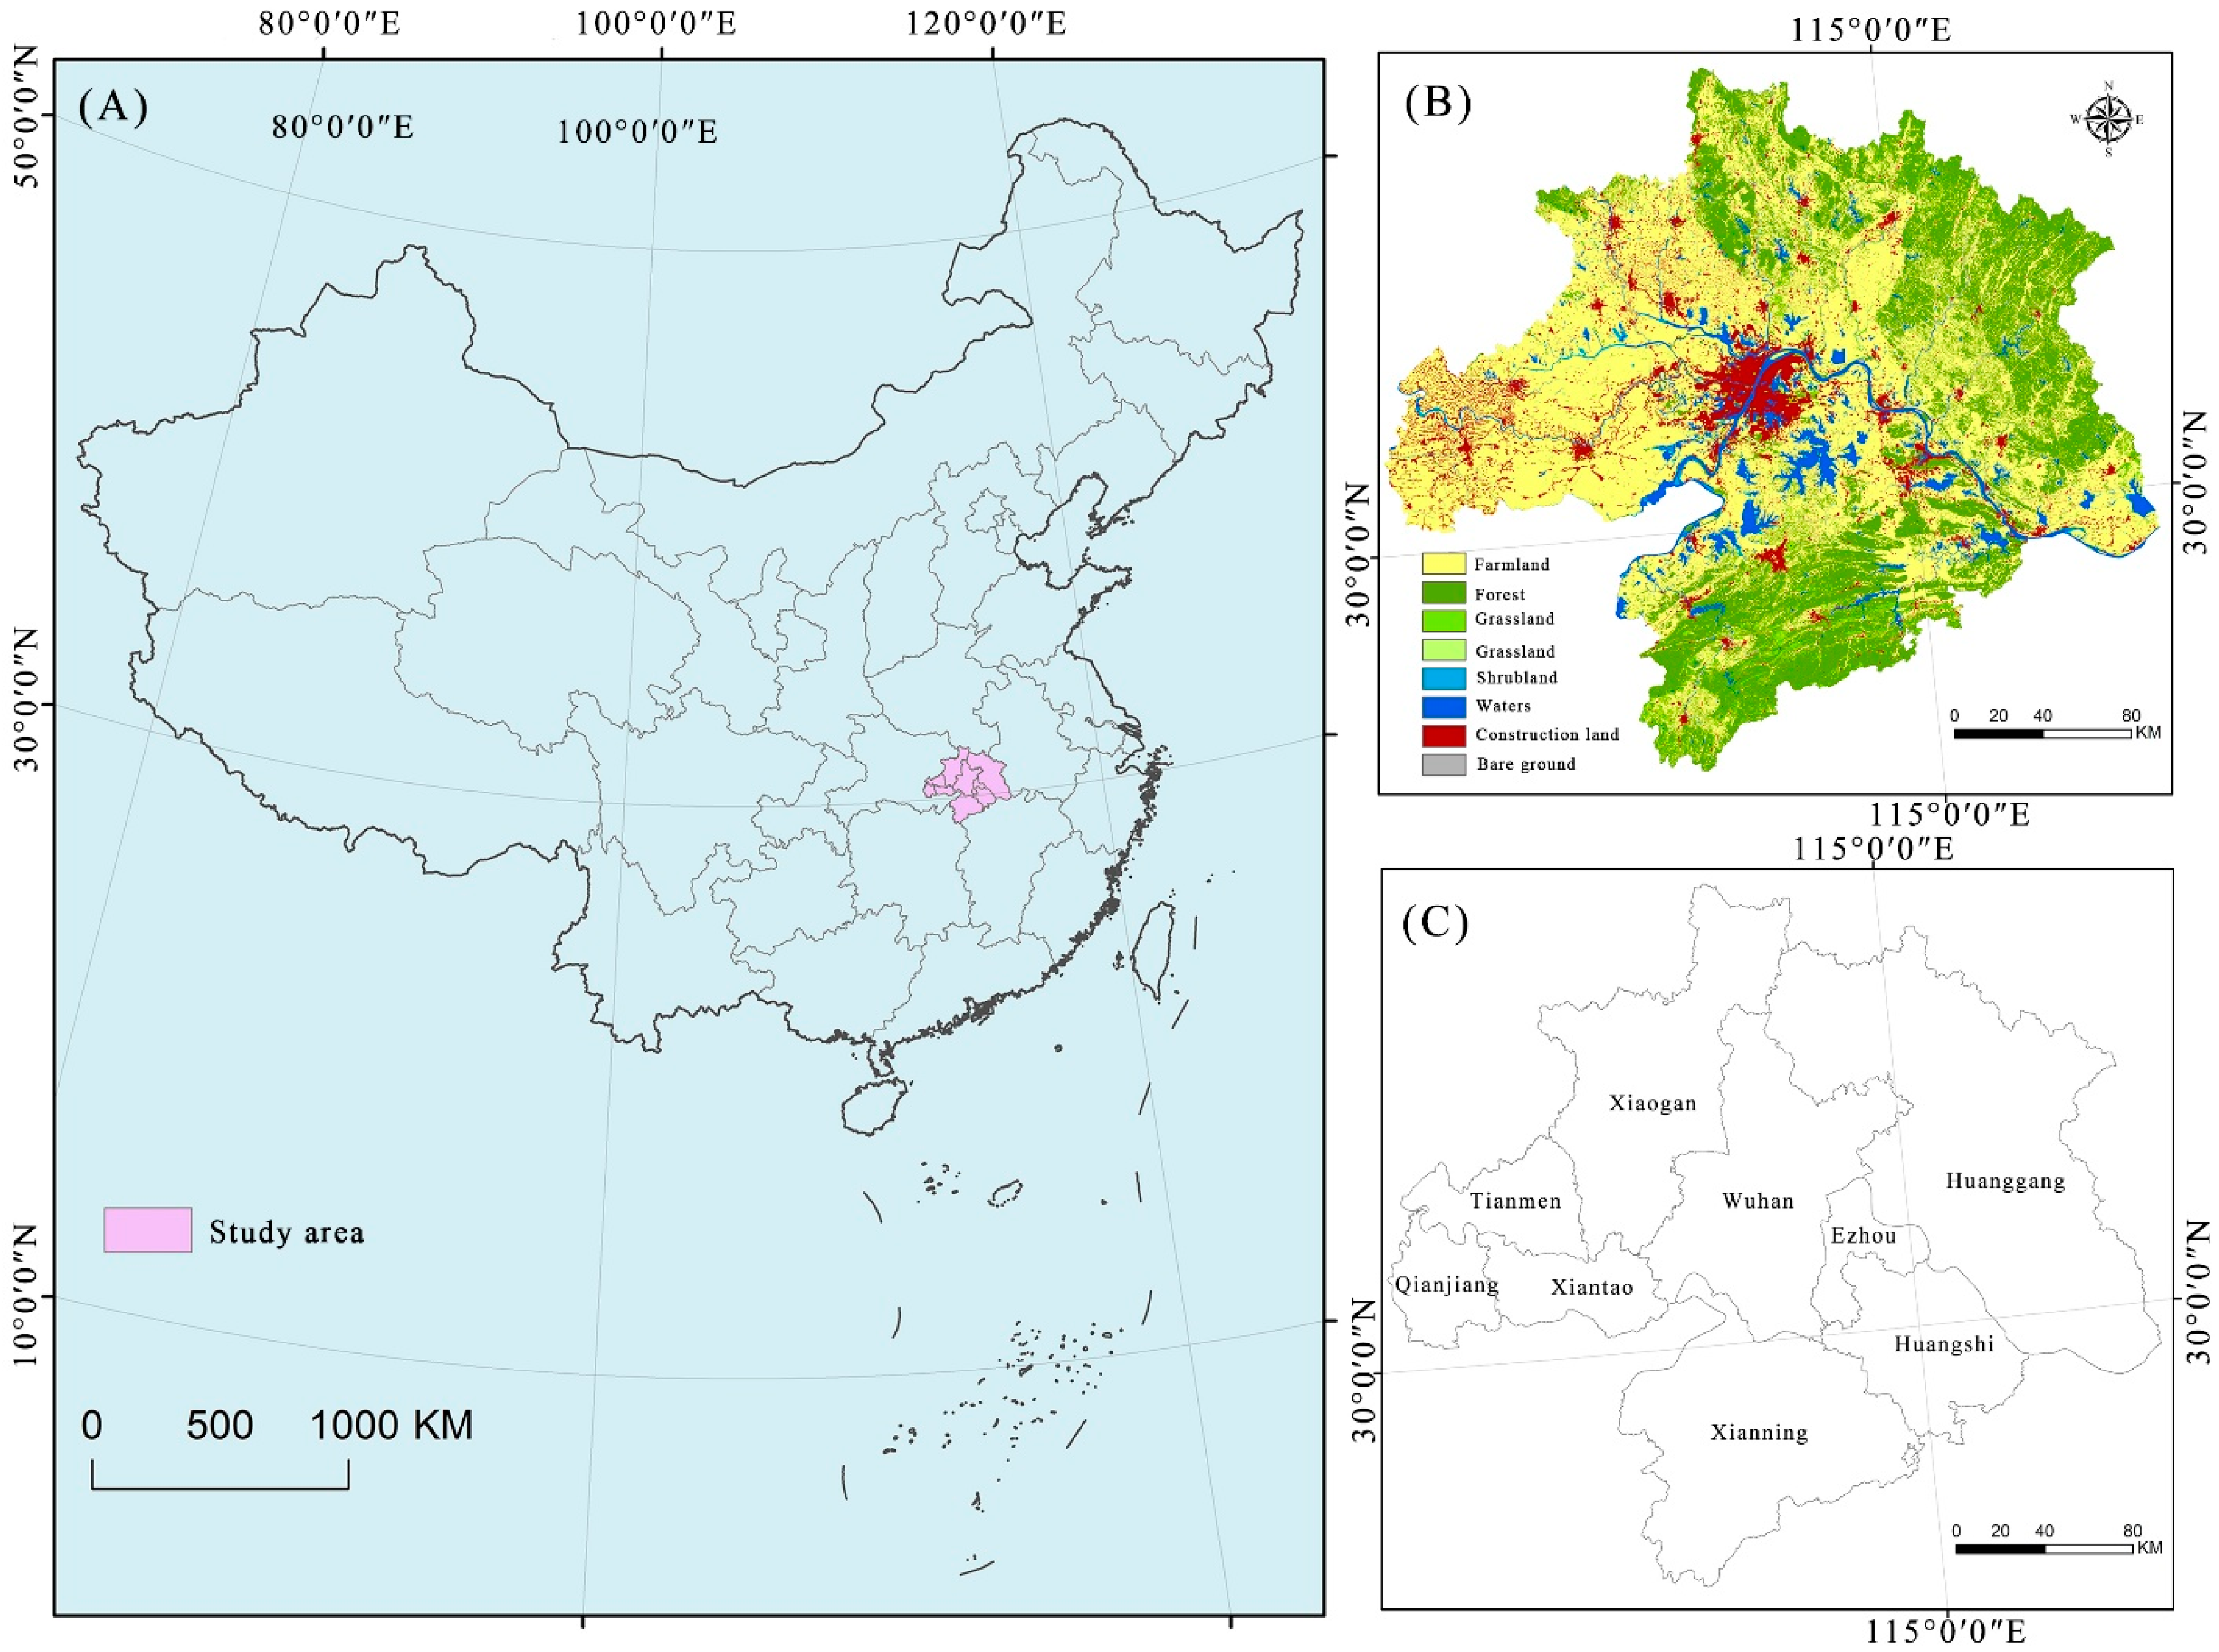
Figure 1. Location of the study area (A), land cover (B), and administrative division (C).
Remotesensing 14 06036 g001
Figure 2. TSPurban’s logical framework of “construction–evaluation–optimization”.
Remotesensing 14 06036 g002
Figure 3. Study area LST (A) and LST level (B).
Remotesensing 14 06036 g003
Figure 4. Heat island map (A) and friction (cost) map (B) in the study area.
Remotesensing 14 06036 g004
Figure 5. Distribution of minimum cumulative resistance (A) and the thermal corridor (B).
Remotesensing 14 06036 g005
Figure 6. Standard deviation ellipse and local spatial autocorrelation analysis in the study area.
Remotesensing 14 06036 g006
Figure 7. Locations of the heat island network (A) and key nodes (B) in the study area.
Remotesensing 14 06036 g007
Table 1. Division method of the mean-standard deviation thermal field.
Temperature ClassDivision Method of Thermal Field
High-temperature zoneTs > μ + std
Medium-high temperature zoneμ + 0.5 std ≤ Ts ≤ μ + std
Middle-temperature zoneμ − 0.5 std ≤ Ts ≤ μ + 0.5 std
Medium-low temperature zoneμ − std ≤ Ts ≤ μ − 0.5 std
Low-temperature zoneTs ≤ μ − std
Table 2. MSPA classification statistics.
TypesArea/km2Percent in Foreground Area/%Percent in Total Area/%
Core15,845.532397.59243%27.325795%
Loop0.13770.00085%0.000237%
Bridge0.48960.00302%0.000844%
Edge366.56372.25766%0.632143%
Islet0.00270.00002%0.000005%
Branch0.03240.00020%0.000056%
Perforation23.67720.14583%0.040832%
Table 3. Importance of heat source dPC value.
Serial NumberArea/km2dPC Value
15227.966887.1181
22124.295223.8945
3314.827222.0948
468.155218.6799
590.625518.2483
6793.956617.1256
7352.350010.6279
8366.72036.7918
9434.91696.6787
10120.98432.2007
11163.97281.3063
12713.19600.7596
13384.53220.2208
14373.03110.2078
15207.67140.0644
16149.64570.0334
17136.69380.0279
18124.47720.0231
19120.07080.0215
20116.49150.0203
21108.67860.0176
2285.70340.0110
2369.70500.0073
2468.16960.0069
2562.83620.0059
2651.46110.0040
2751.11010.0039
2848.07260.0035
2946.65240.0033
3046.26000.0032
Note: The above serial numbers are consistent with the serial numbers in Figure 4A.
Table 4. Standard deviation ellipse parameters for friction (cost) maps.
The Circumference of an Ellipse/kmThe Area of an Ellipse/km2Center Point X CoordinatesCenter Point Y CoordinatesThe Length of the X-Axis of an Ellipse/kmThe Length of the Y-Axis of the Ellipse/kmAzimuth/(°)
635.3227,922.31114°6′33″30°24′4″114.5477.6092.13
Publisher’s Note: MDPI stays neutral with regard to jurisdictional claims in published maps and institutional affiliations.