1. Introduction
Soil salinization is a matter of concern in agriculture, as the excess salt hinders crop growth by obstructing the ability to uptake water. In another sense, it causes a loss in soil fertility and leads to the desertification of cropland [
1,
2]. According to the estimation released by the Food and Agriculture Organization (FAO), there are more than 424 million hectares of topsoil (0–30 cm) and 833 million hectares of subsoil (30–100 cm) are salt-affected around the globe (8.7% of the planet) [
3]. Most of them can be found in naturally arid or semi-arid environments in Africa, Asia and Latin America [
4]. Soils are easily affected by salt in arid and semi-arid regions where low rainfall and high evapotranspiration lead to the concentration of salts such as sodium, magnesium and calcium to form saline soils [
5,
6,
7,
8]. FAO launched the Global Map of Salt-Affected Soils in 2021, although the salt-affected soil of China has not been included in that. Nonetheless, estimates show that 20 to 50% of irrigated soils across all continents are too salty, implying that over 1.5 billion people face significant challenges in meeting rising food demand due to severe cropland salinity and cropland degradation [
9].
Saline cropland is an essential part of reserve cropland in the Inner Mongolia Autonomous Region in China and is an integral part of the cropland restoration program [
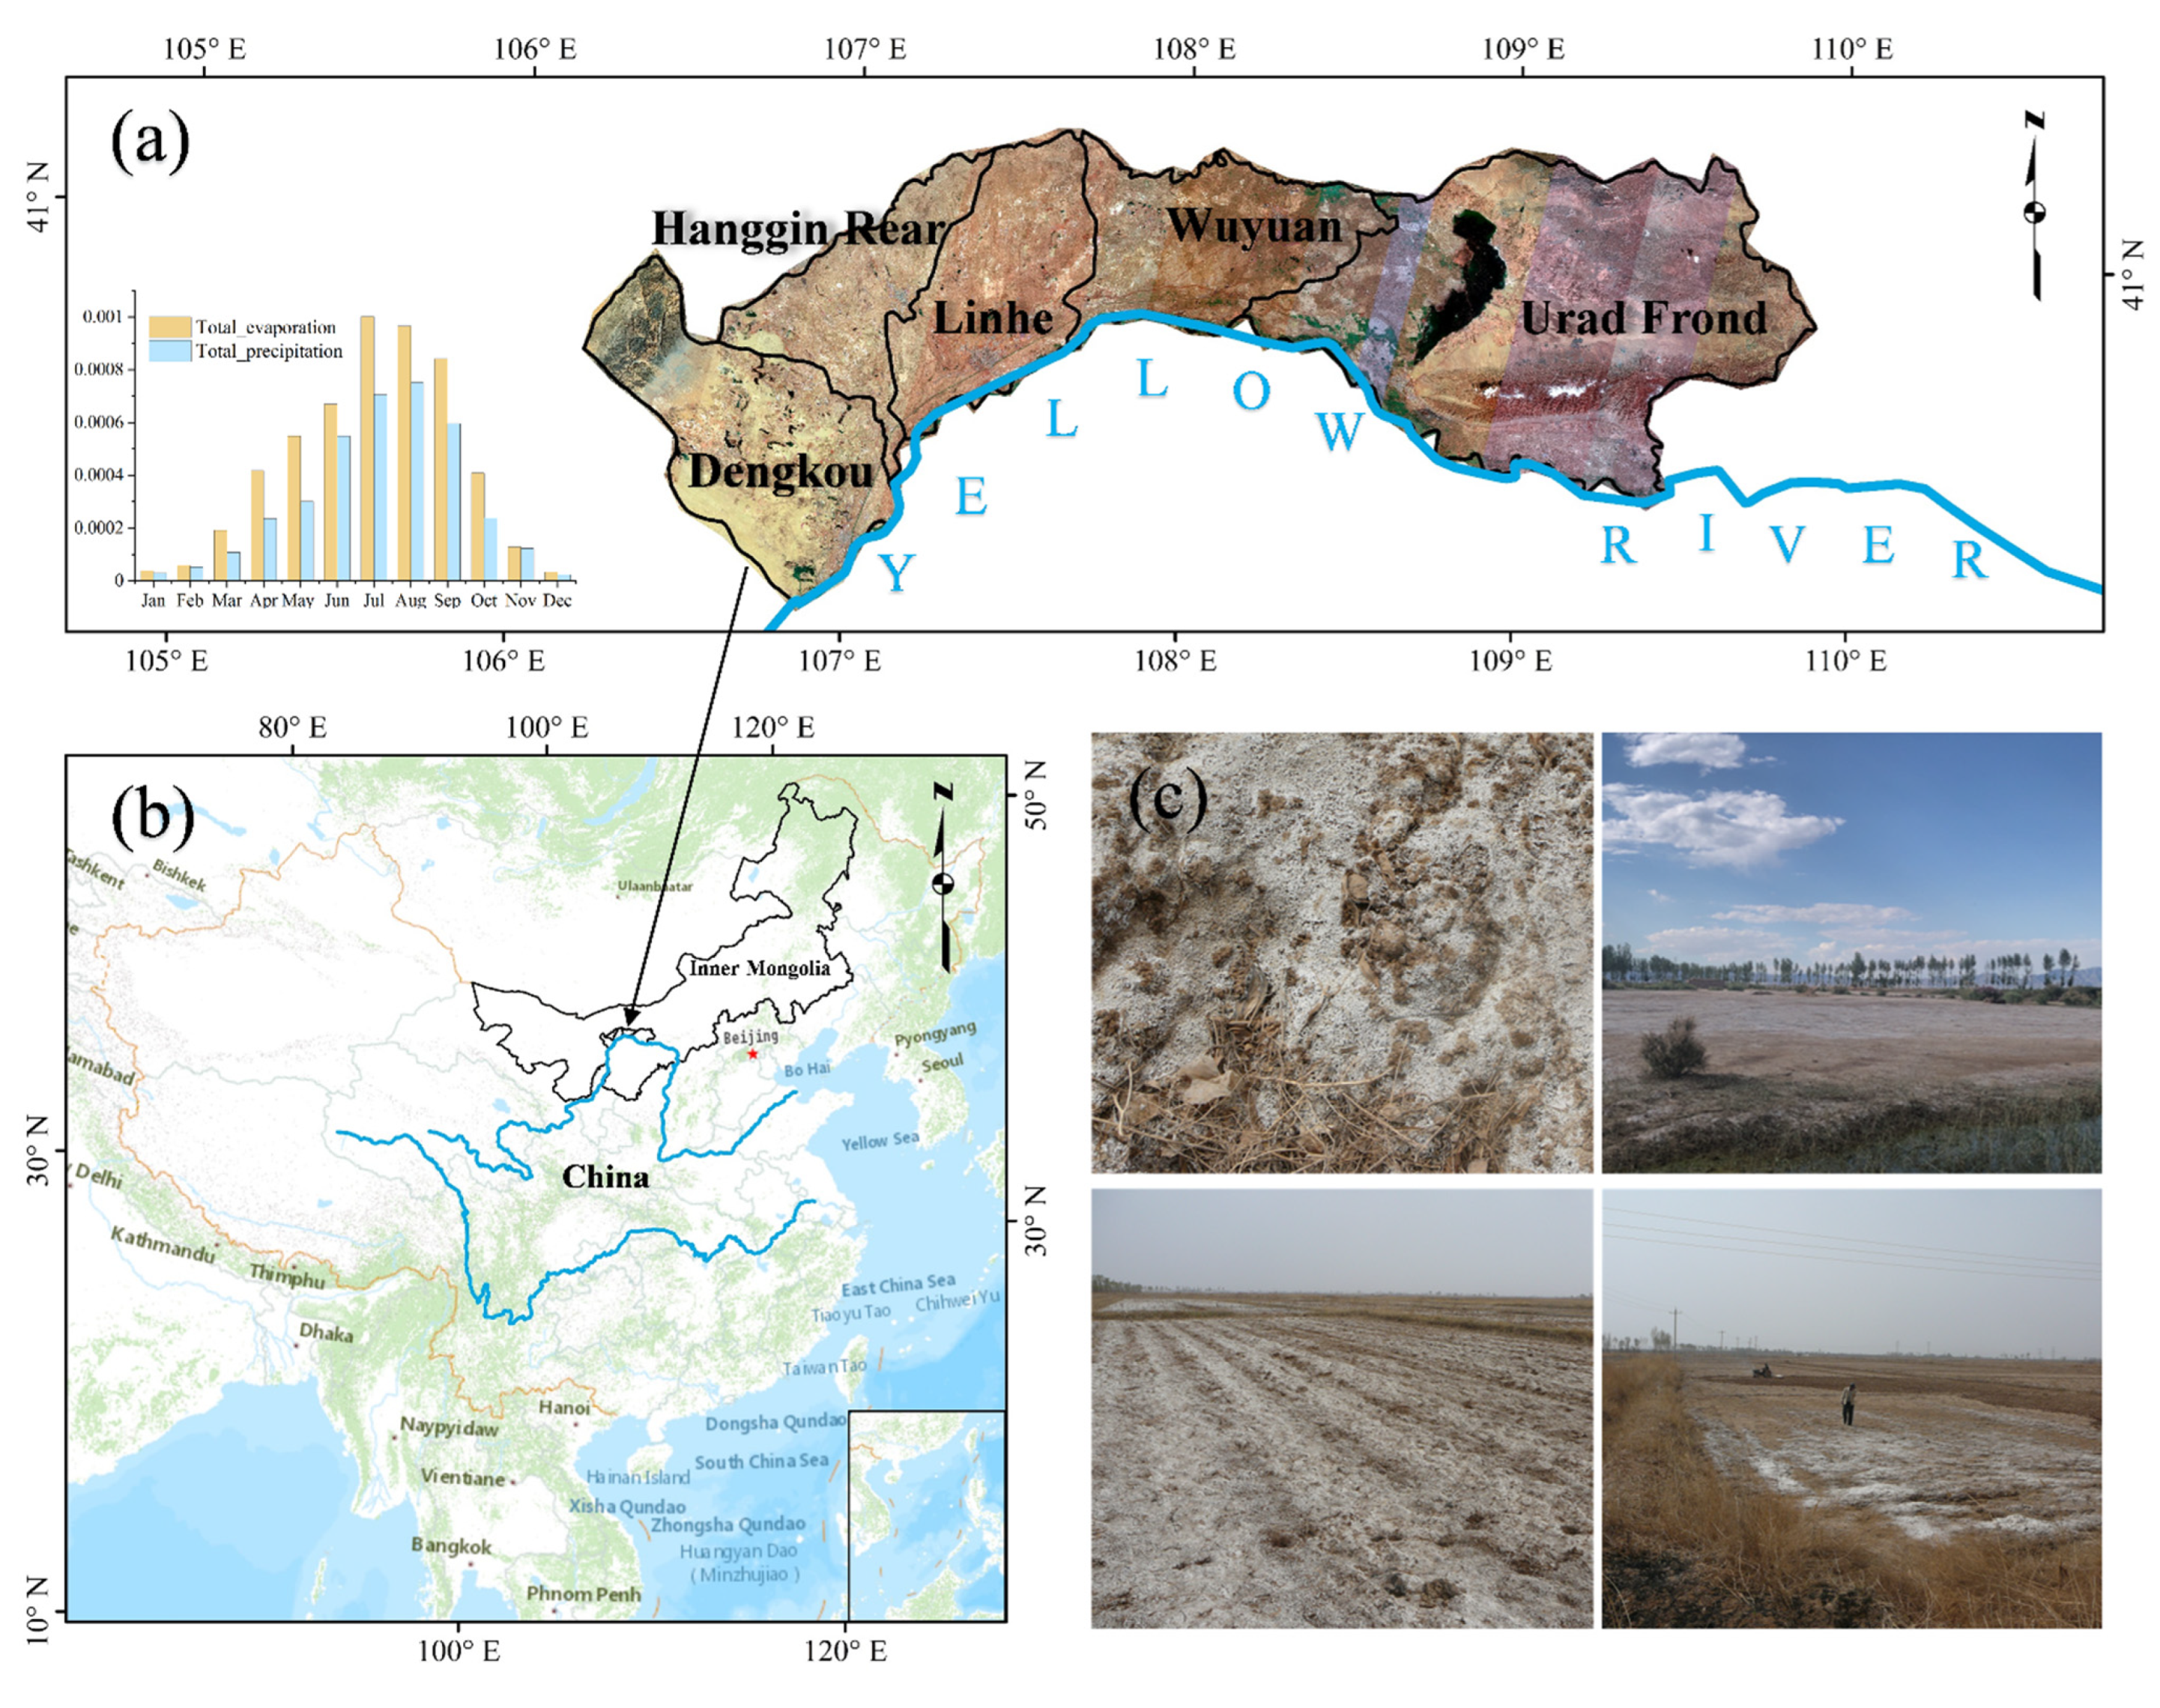
10]. The salt-affect soil in the Inner Mongolia Autonomous Region is mainly disturbed in the Xiliao River Plain in the east and Hetao Irrigation District (HID) in the west. The cropland of HID is dominated by saline soil and accounts for 30.5% of the saline cropland in Inner Mongolia [
10]. In the early stage of the reclamation HID, flood irrigation without drainage facilities caused the secondary salinization of the field soil. For now, cropland salinization has gradually evolved into the main factor restricting the sustainable development of agriculture in HID. Therefore, the severe salinity cropland is a typical area for the agricultural management department’s soil rehabilitation program, which has attracted the interest of many academics [
11,
12].
The cropland soil salinity in HID is mainly adapted from the irrigation water of the Yellow River. Only 20% of the initial salt can be discharged through drainage, while 80% of the salt is kept in the soil of the irrigation area, showing a salinization trend [
13]. Soil salinity will adversely affect plant growth, crop yields, and underground water quality, leading to soil erosion and land degradation [
14]. The hazard of soil salinity is not limited to the environment but also includes the economy. For example, for the secondary salinization of the land in the Sultanate of Oman, the direct economic loss from mild to moderate salinity is about 1604 US dollars per hectare, and the direct economic loss from mild to severe salinity is as high as 4352 US dollars per hectare [
15]. Thus, knowing the spatial distribution of salt-affected cropland is an urgent need to alleviate the contradiction between humans and land [
16,
17], which is also vital for promoting the high-quality development of the national agricultural economy [
18]. At the same time, the eradicate because of dynamic and accessible restress from salinization after agricultural activities seriously endangers the sustainable development of agriculture and its productivity, which makes the timely detection of salt-affected cropland within HID with limited cropland resources particularly urgent [
19,
20,
21].
Traditionally, soil salinity was measured by collecting soil samples and analyzing them in a laboratory to determine their solute concentration or electronic conductivity [
22]. However, due to intensive sampling being time-consuming and expensive, the spatial variability of soil salinity is hardly fully characterized traditionally in a large area. Remote sensing data and techniques can more effectively provide economic and rapid tools and methods for mapping soil salinity [
23]. Remote sensing data and its analyzing processes have gradually become the most convenient method of mapping soil salinity since black-and-white and color aerial photographs were used to describe salinity-stressed soils in the 1960s. Multispectral imagery such as Landsat [
24], Sentinel [
25], IKONOS [
26], QuickBird [
27] and UAV-Borne [
28] are highly suitable for evaluating soil salinity. In the last three decades of research on monitoring saline soils, multispectral sensors have been mainly used. In addition, some researchers have emphasized the importance of ground sample data [
29,
30].
In practical applications, multispectral sensors also show limitations, as their spectral resolution and fewer bands affect the quality and quantity of information provided. Many current studies pointed out this limitation, thus monitoring the salinity using hyperspectral [
31] and thermal infrared data [
32], even Synthetic Aperture Radar (SAR) data [
33] in the last few years. Nevertheless, the broad acquisition capability of Sentinel data, high spatial resolution (10 m), and the combination of active and passive remote sensing data can compensate for the deficiencies of multispectral data widely available for free. Remote sensing data with meter-level high resolution or sub-meter-level resolution (IKONOS, QuickBird, WroldView-2, GF series) have also been gradually introduced into salinity mapping research and have become indispensable data sources. Mapping the salinity of cropland combining high spatial resolution images and ground sampling data using machine learning algorithms is mainly carried out at the field scale or farm scale [
34]. However, the validity and reliability of such a method need to be assessed in a larger area.
Recent years have seen an increase in nonparametric machine learning techniques, particularly Random Forest (RF), to calculate soil salinity [
35,
36]. Since it can manage the high dimensionality and multicollinearity of remote sensing data with excellent classification accuracy and insensitivity to overfitting, RF is one of the most extensively used algorithms in land cover classification. Additionally, it has been stated that RF in the Google Earth Engine (GEE) platform provides unassailable benefits in the remote sensing classification of land cover in a large area [
37,
38]. Some researchers have demonstrated that RF outperforms other popular nonparametric machine learning algorithms, which can significantly increase soil salinity mapping accuracy [
25,
39].
However, many scholars have shown that using remote sensing technology to map cropland salinity in arid and semi-arid regions is challenging [
23,
24,
40]. It is mainly because the bare ground and other sparse vegetation are easily confused with saline soil in spectral reflectance [
33,
41]. Alternatively, the method based on spectral reflectance may lead to unreliable results when the soil is moisturizing or the soil salts are not exposed on the soil surface in crystalline form but mixed with other soil components [
42]. In this case, SAR data, frequently employed in detecting soil salinity, can capture information that is challenging to acquire using multispectral imagery. Various remote sensing data have already been used to study saline soil in HID. Nonetheless, the majority of these studies have focused on single sensors rather than multi-sensor images. Therefore, to comprehend the main mechanism causing agricultural salinization and degradation, a salt-affected map using a wide range of remote sensing data must be acquired in almost real time.
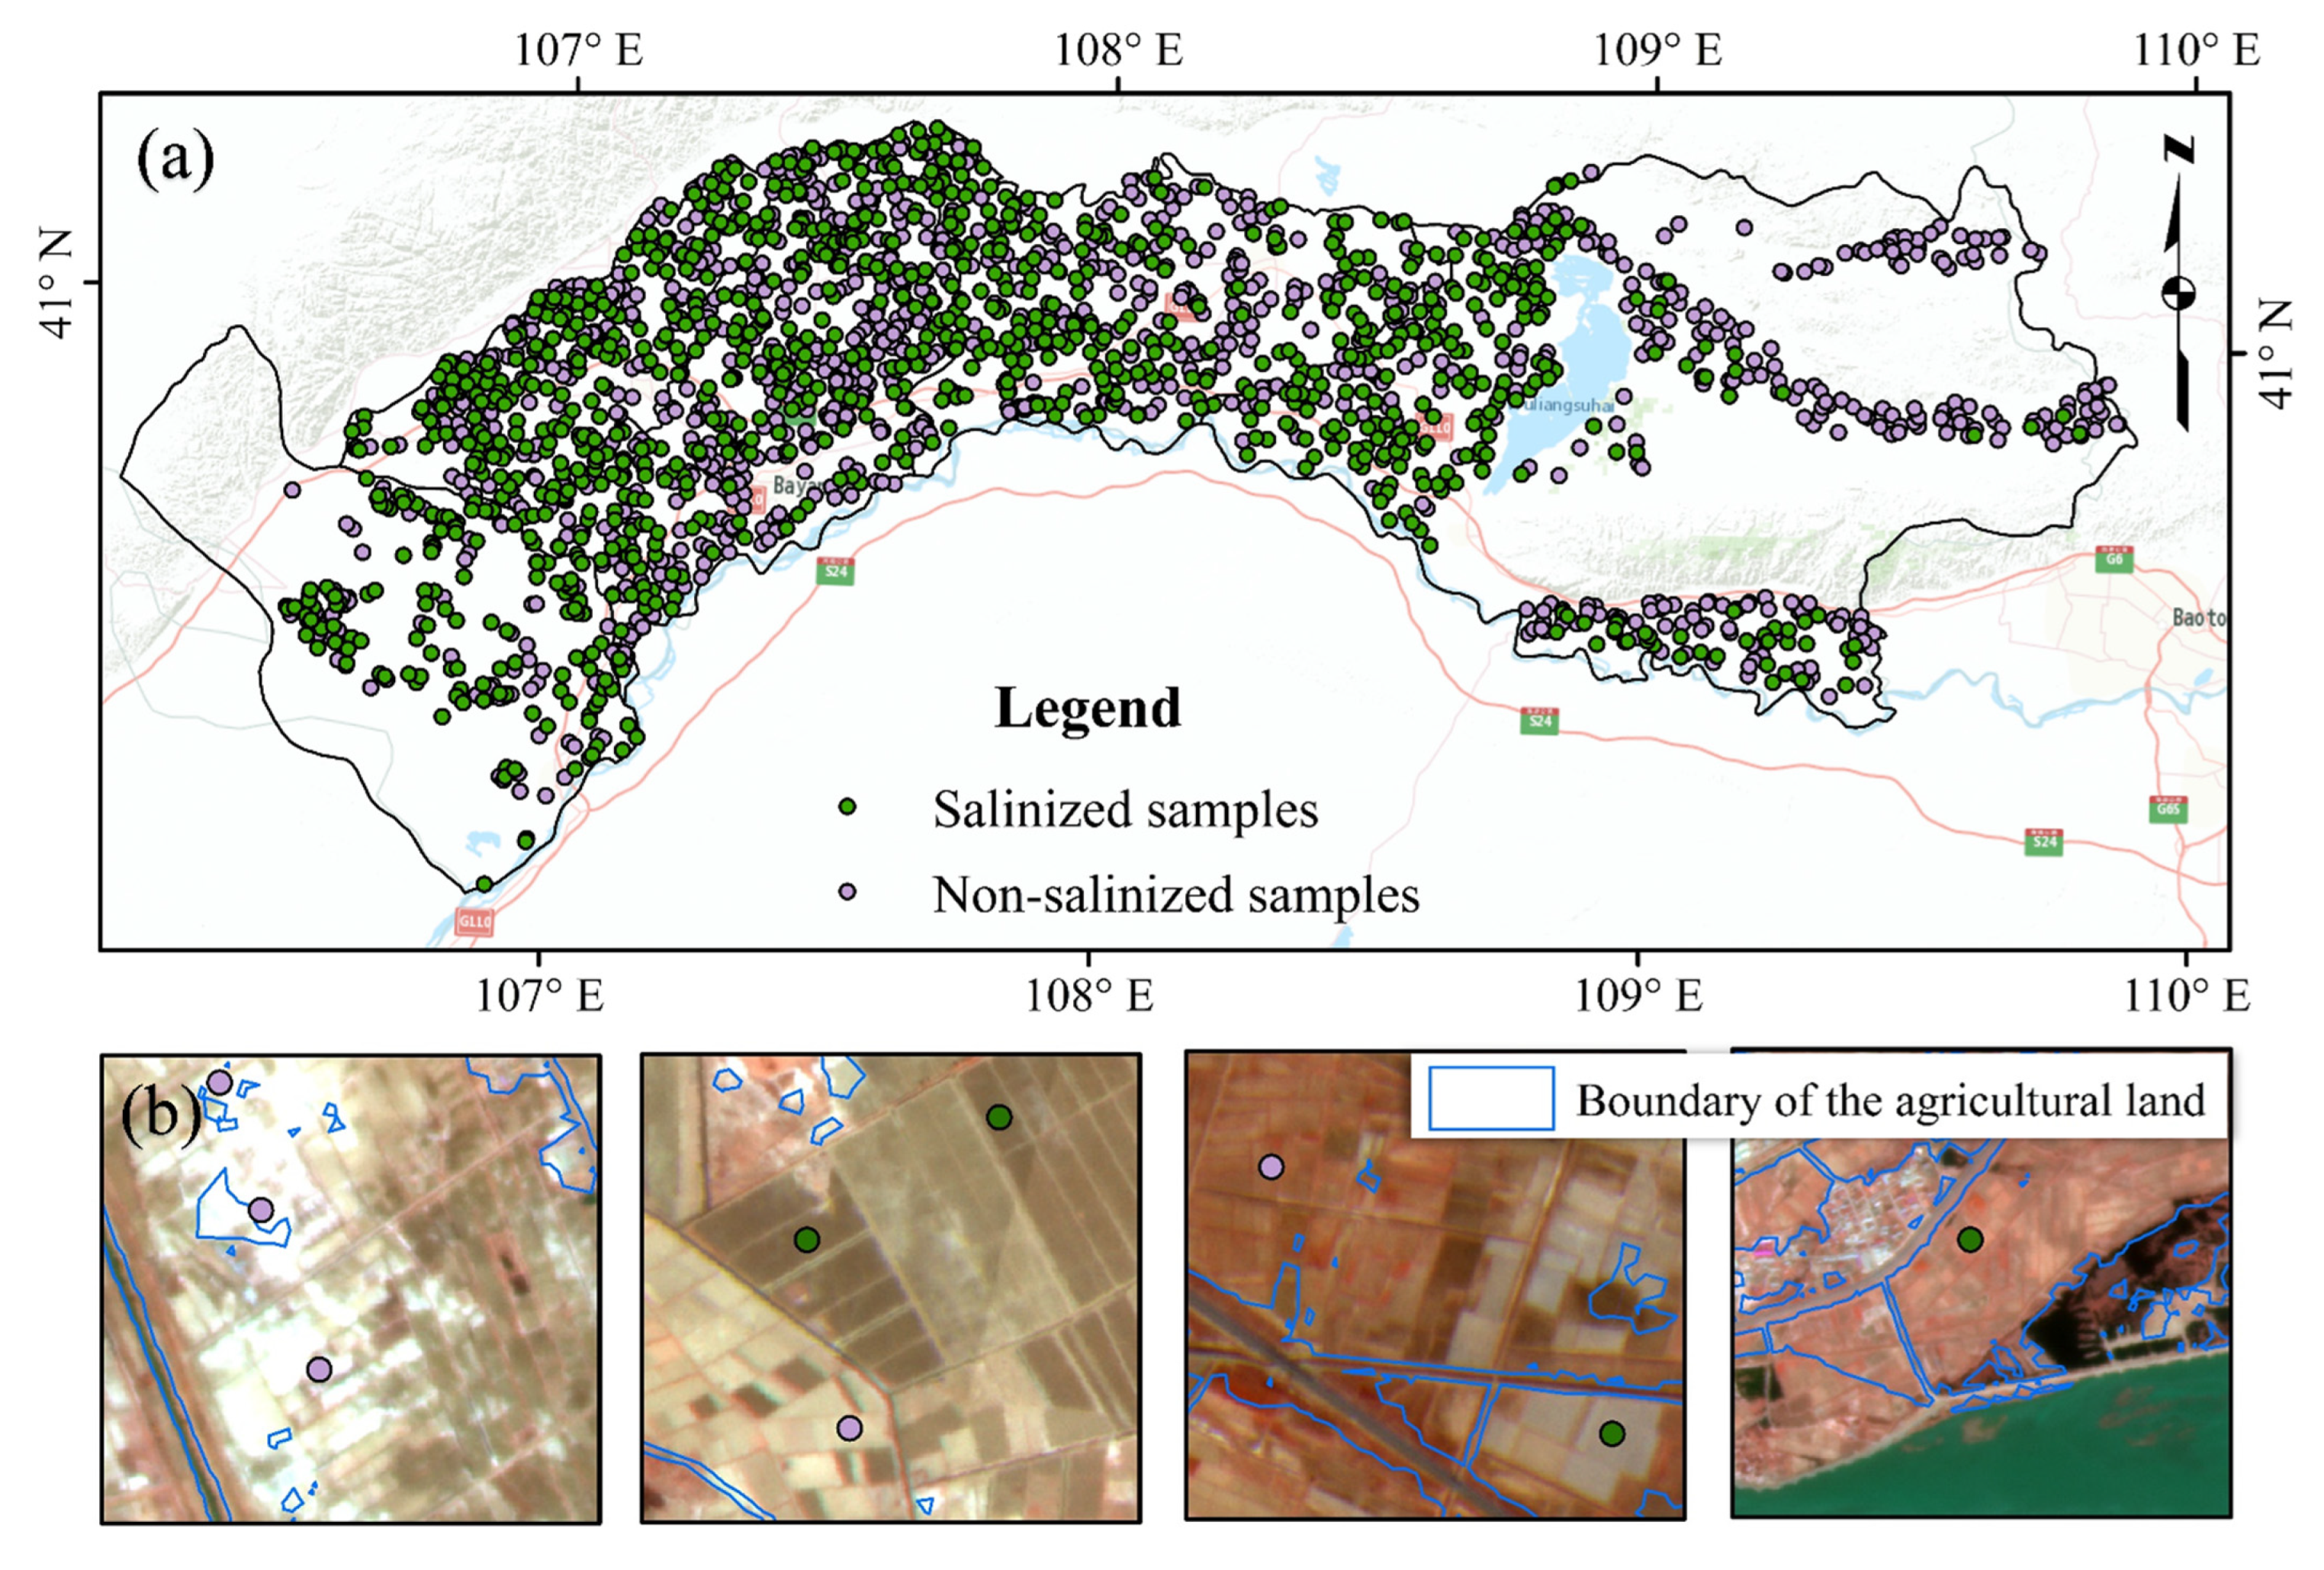
To fill this gap, the following questions will be addressed in this study: Is the PlanetScope image of April appropriate for sample collection employing the Visual Interpretation strategy? If so, how can the samples’ validity—which includes cropland that is both saline and non-saline—be estimated? How to quickly and efficiently map salinized cropland using Sentinel-1 and Sentinel-2 data freely available in GEE? These questions are unavoidable in multi-sensor data-based mapping of salinized cropland, and addressing them is the primary goal of the current study.
The specific objectives of this research are to:
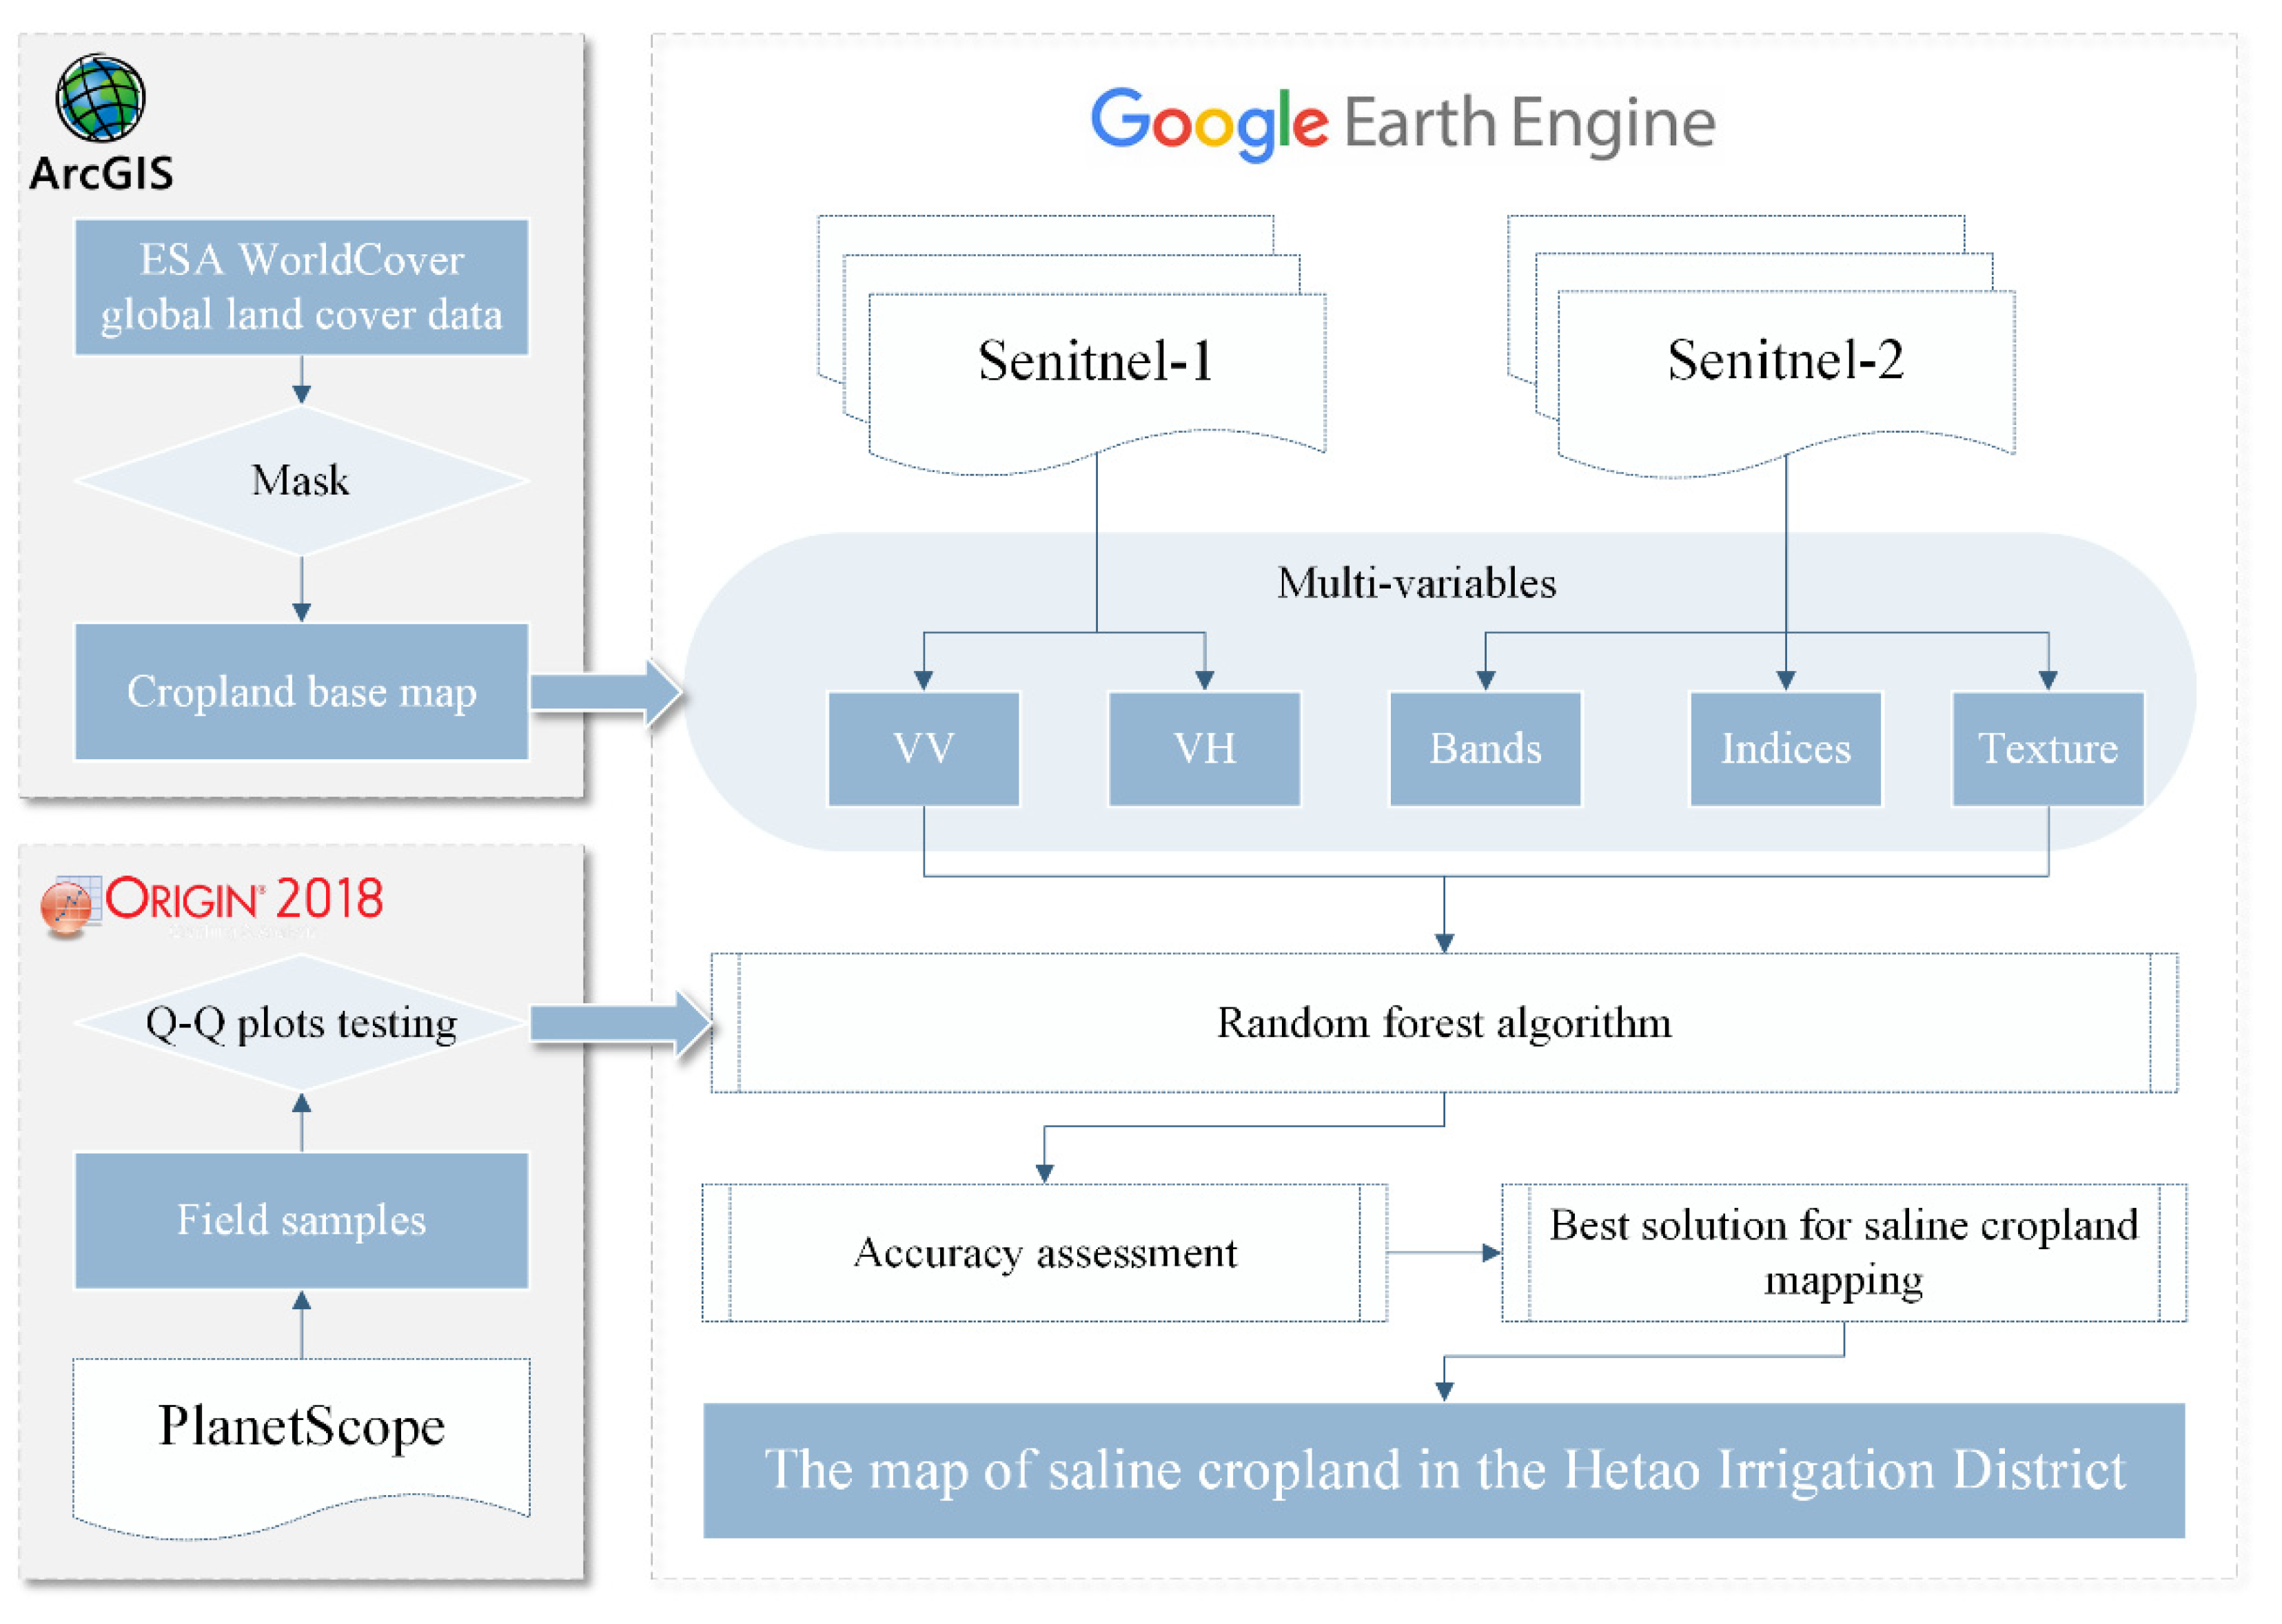
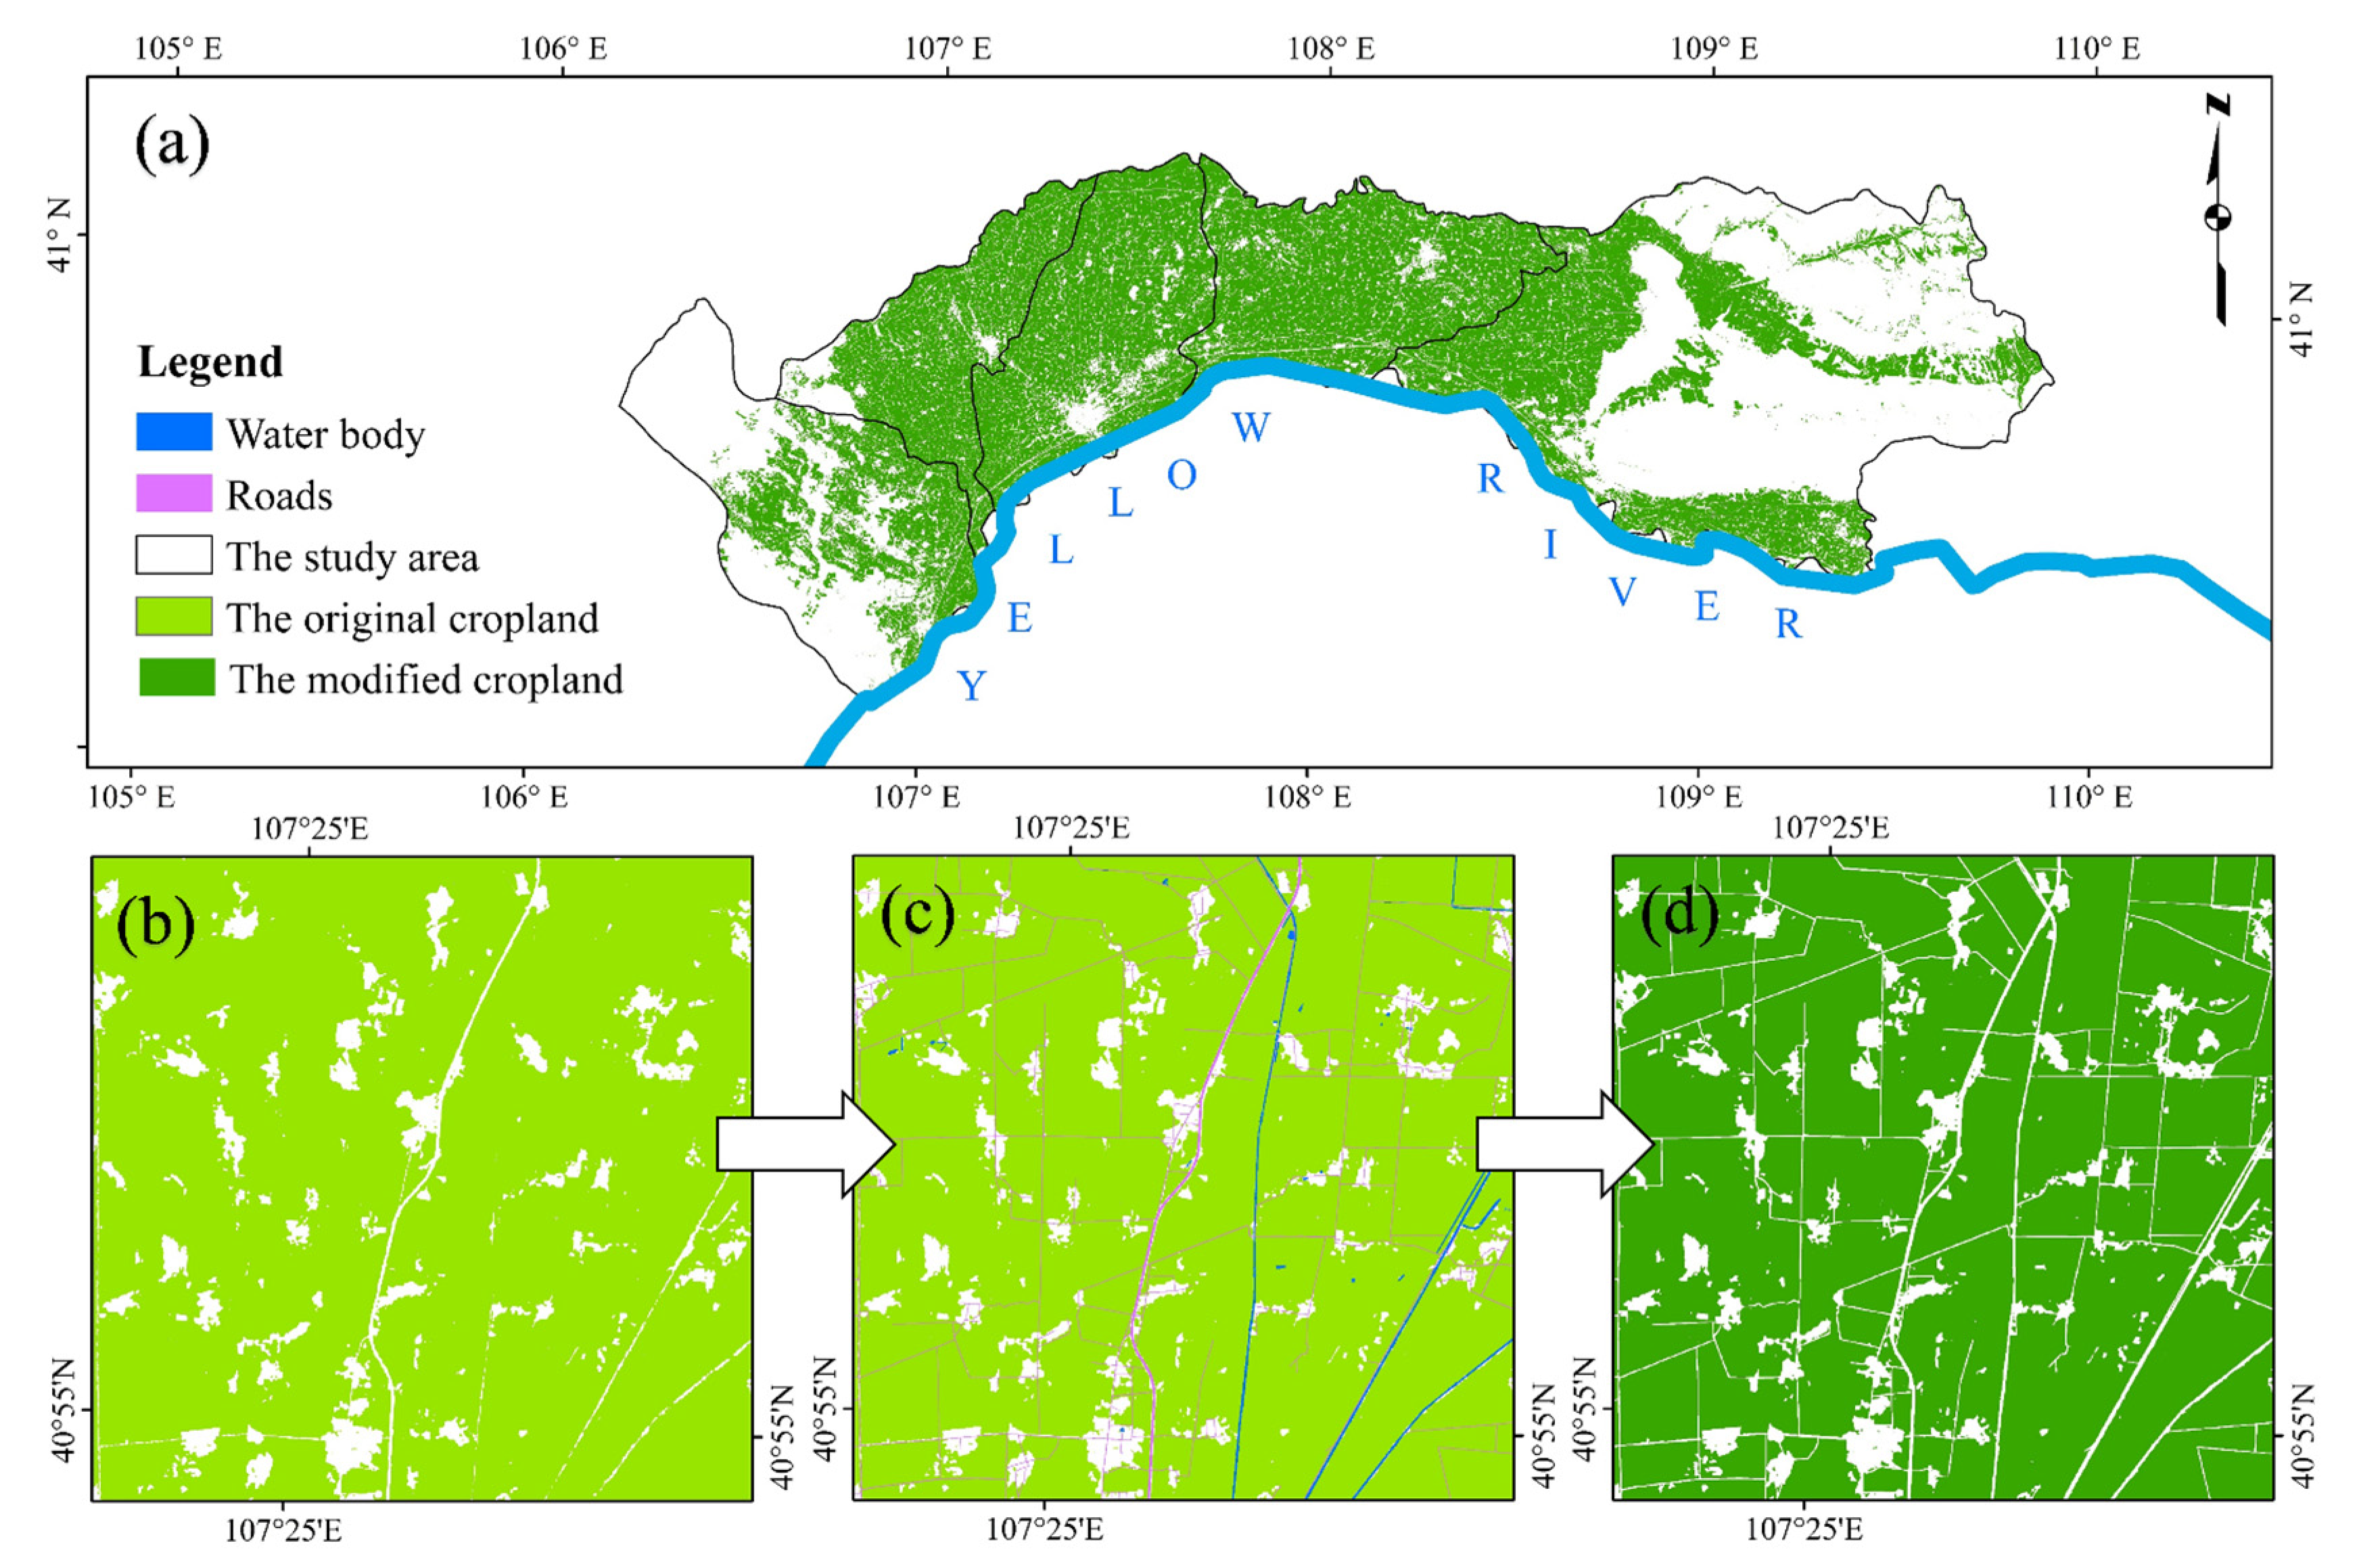
Create a cropland base map using global land cover data from ESA WorldCover while masking off roads and irrigation ditches collected from the electronic map of HID;
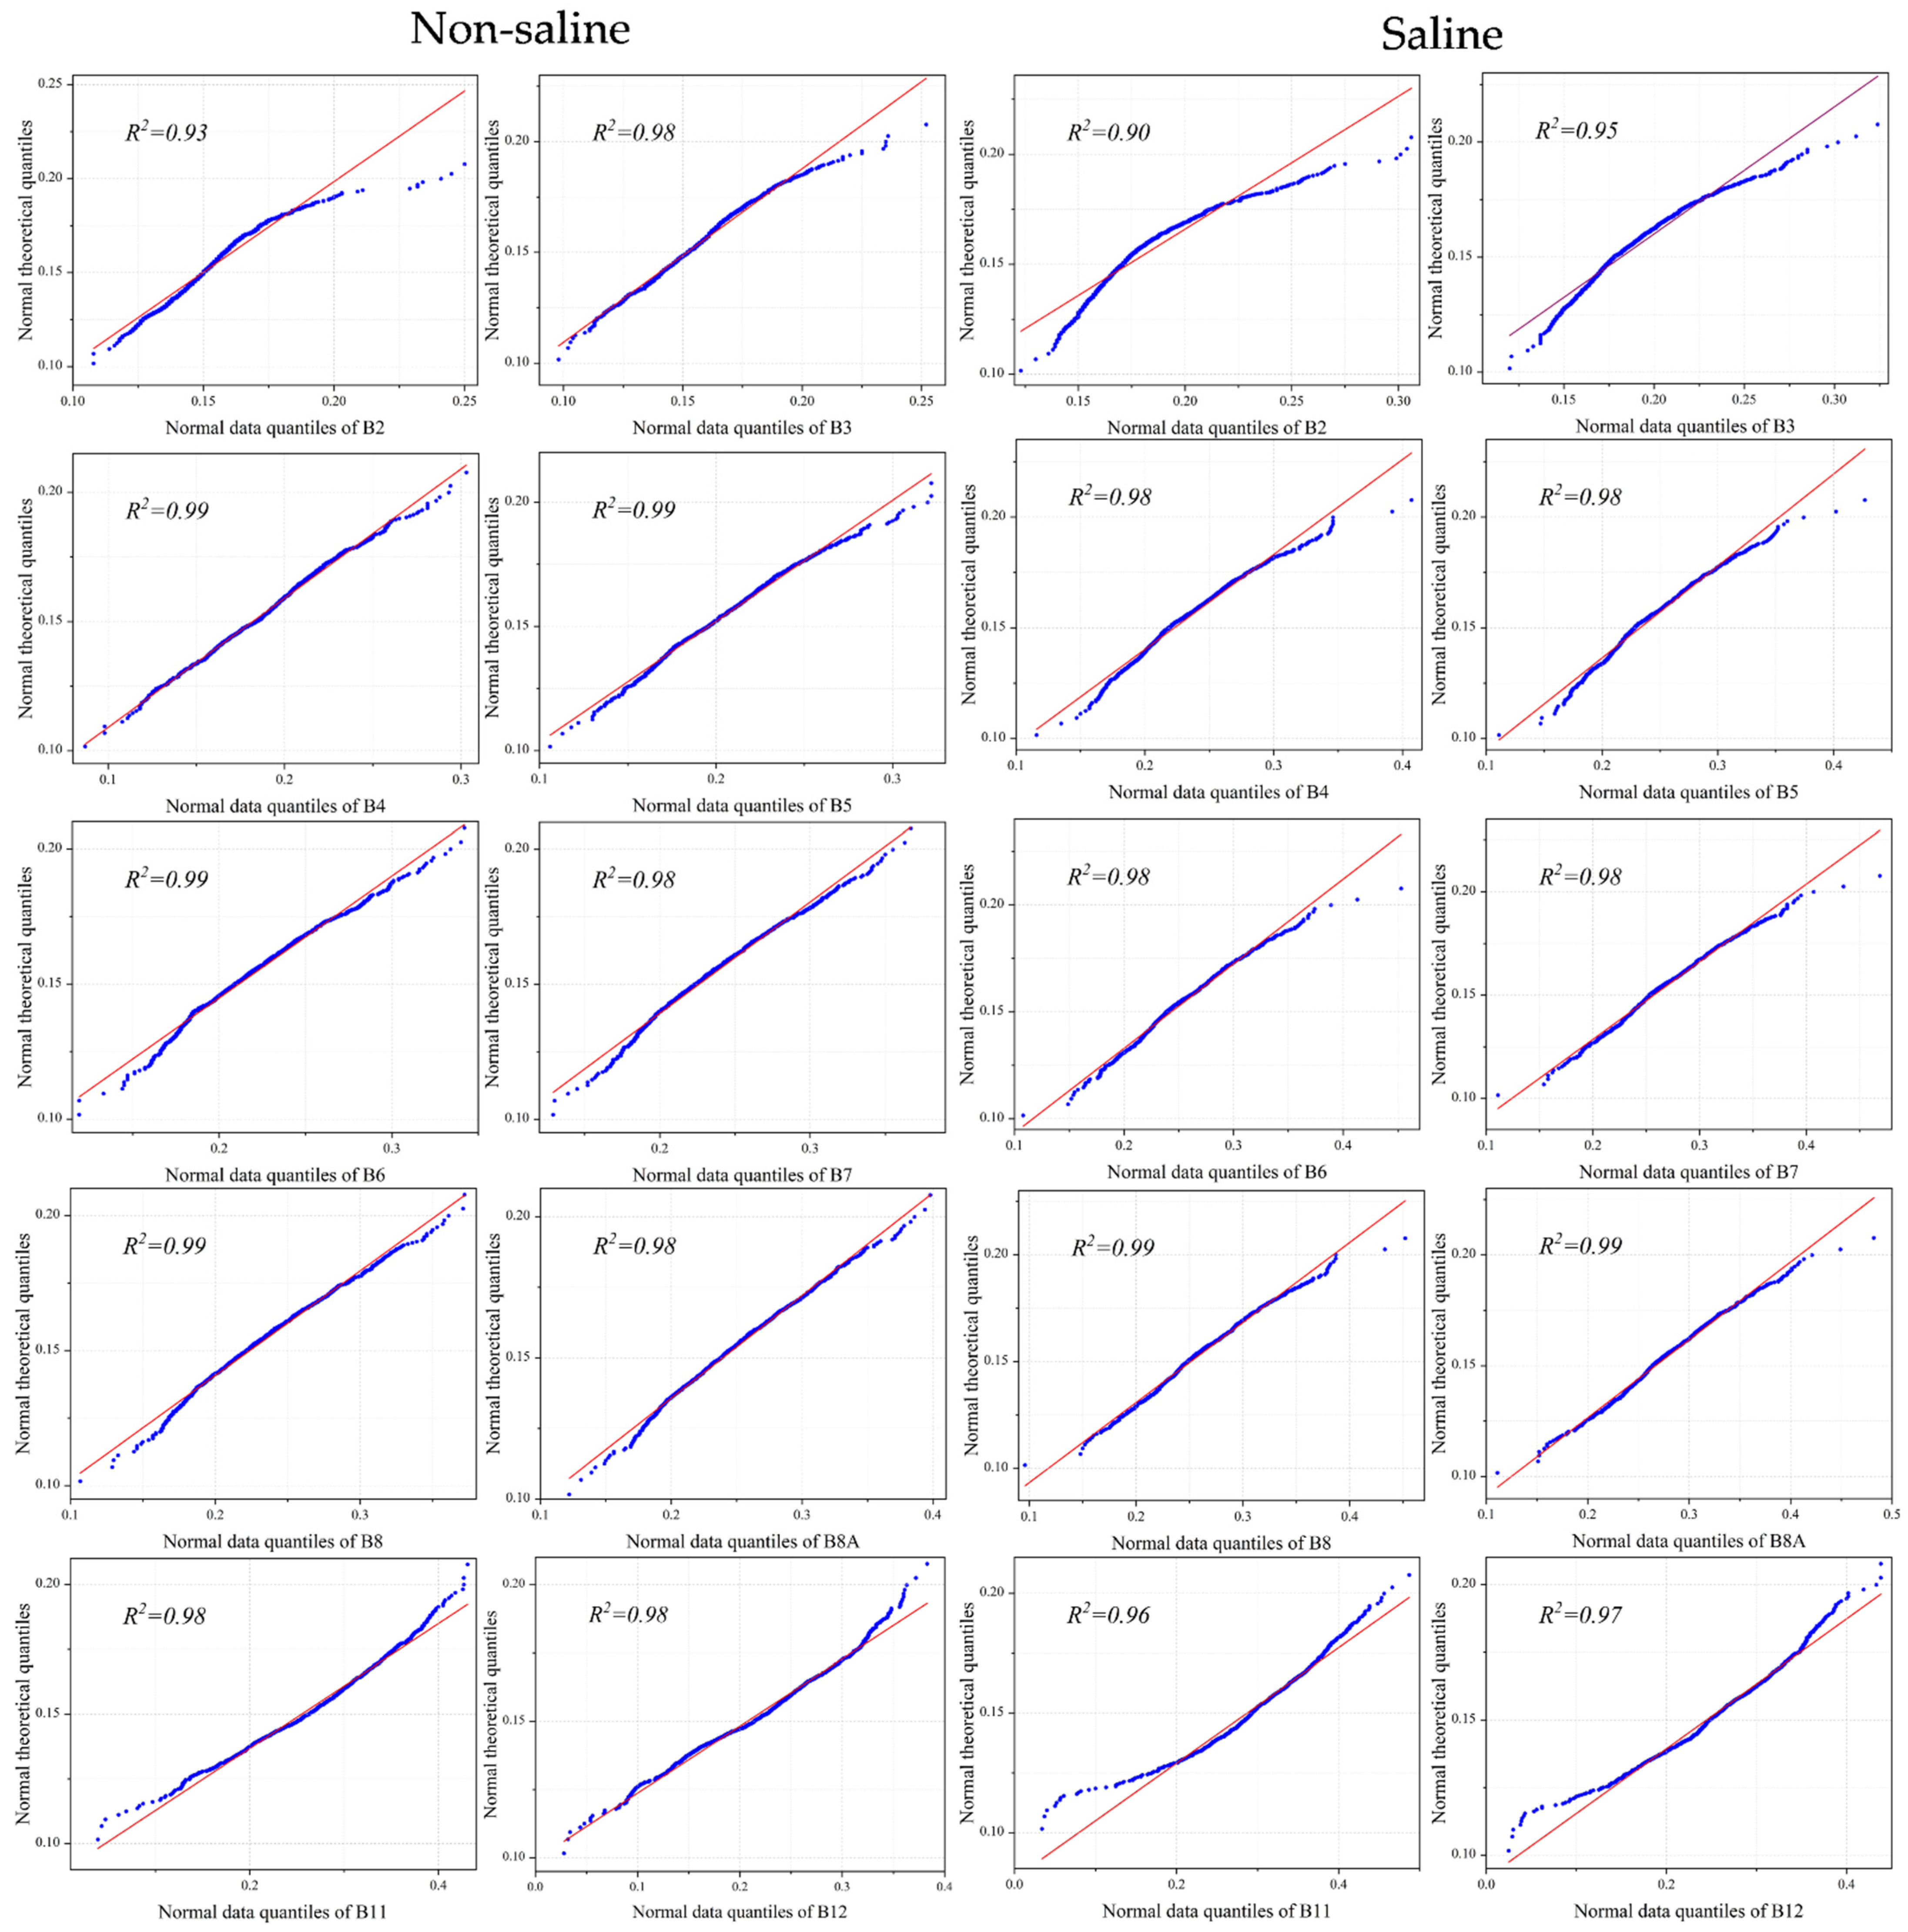
Evaluate the validity of samples, comprising both saline and non-saline cropland, using the quantile and quantile plots testing method;
Create a multi-variable dataset for salt-affected cropland identification using VV + VH dual polarization, reflectance bands, and vegetation indices;
Determine the best solution for mapping salt-affected cropland in dry and wet seasons using the overall accuracies and indicators from the confusion matrix of various datasets.
4. Discussion
4.1. Indices in Salt-Affected Cropland Mapping
Index variables were important in previous research on salt-affected soil monitoring and inversion. The analysis based on SI-MSAVI is the most renowned among them and has been shown to invert soil salinity [
56,
57,
58] accurately. Likewise, NDVI and DVI, commonly used to monitor vegetation status, are also widely used in land salinization monitoring research and are critical indicators [
59,
60,
61].
A mapping methodology for salinized cropland was developed in this study using several variables based on two bands (see
Table A2 for details). The Red and NIR bands produce all other indices besides the SI.
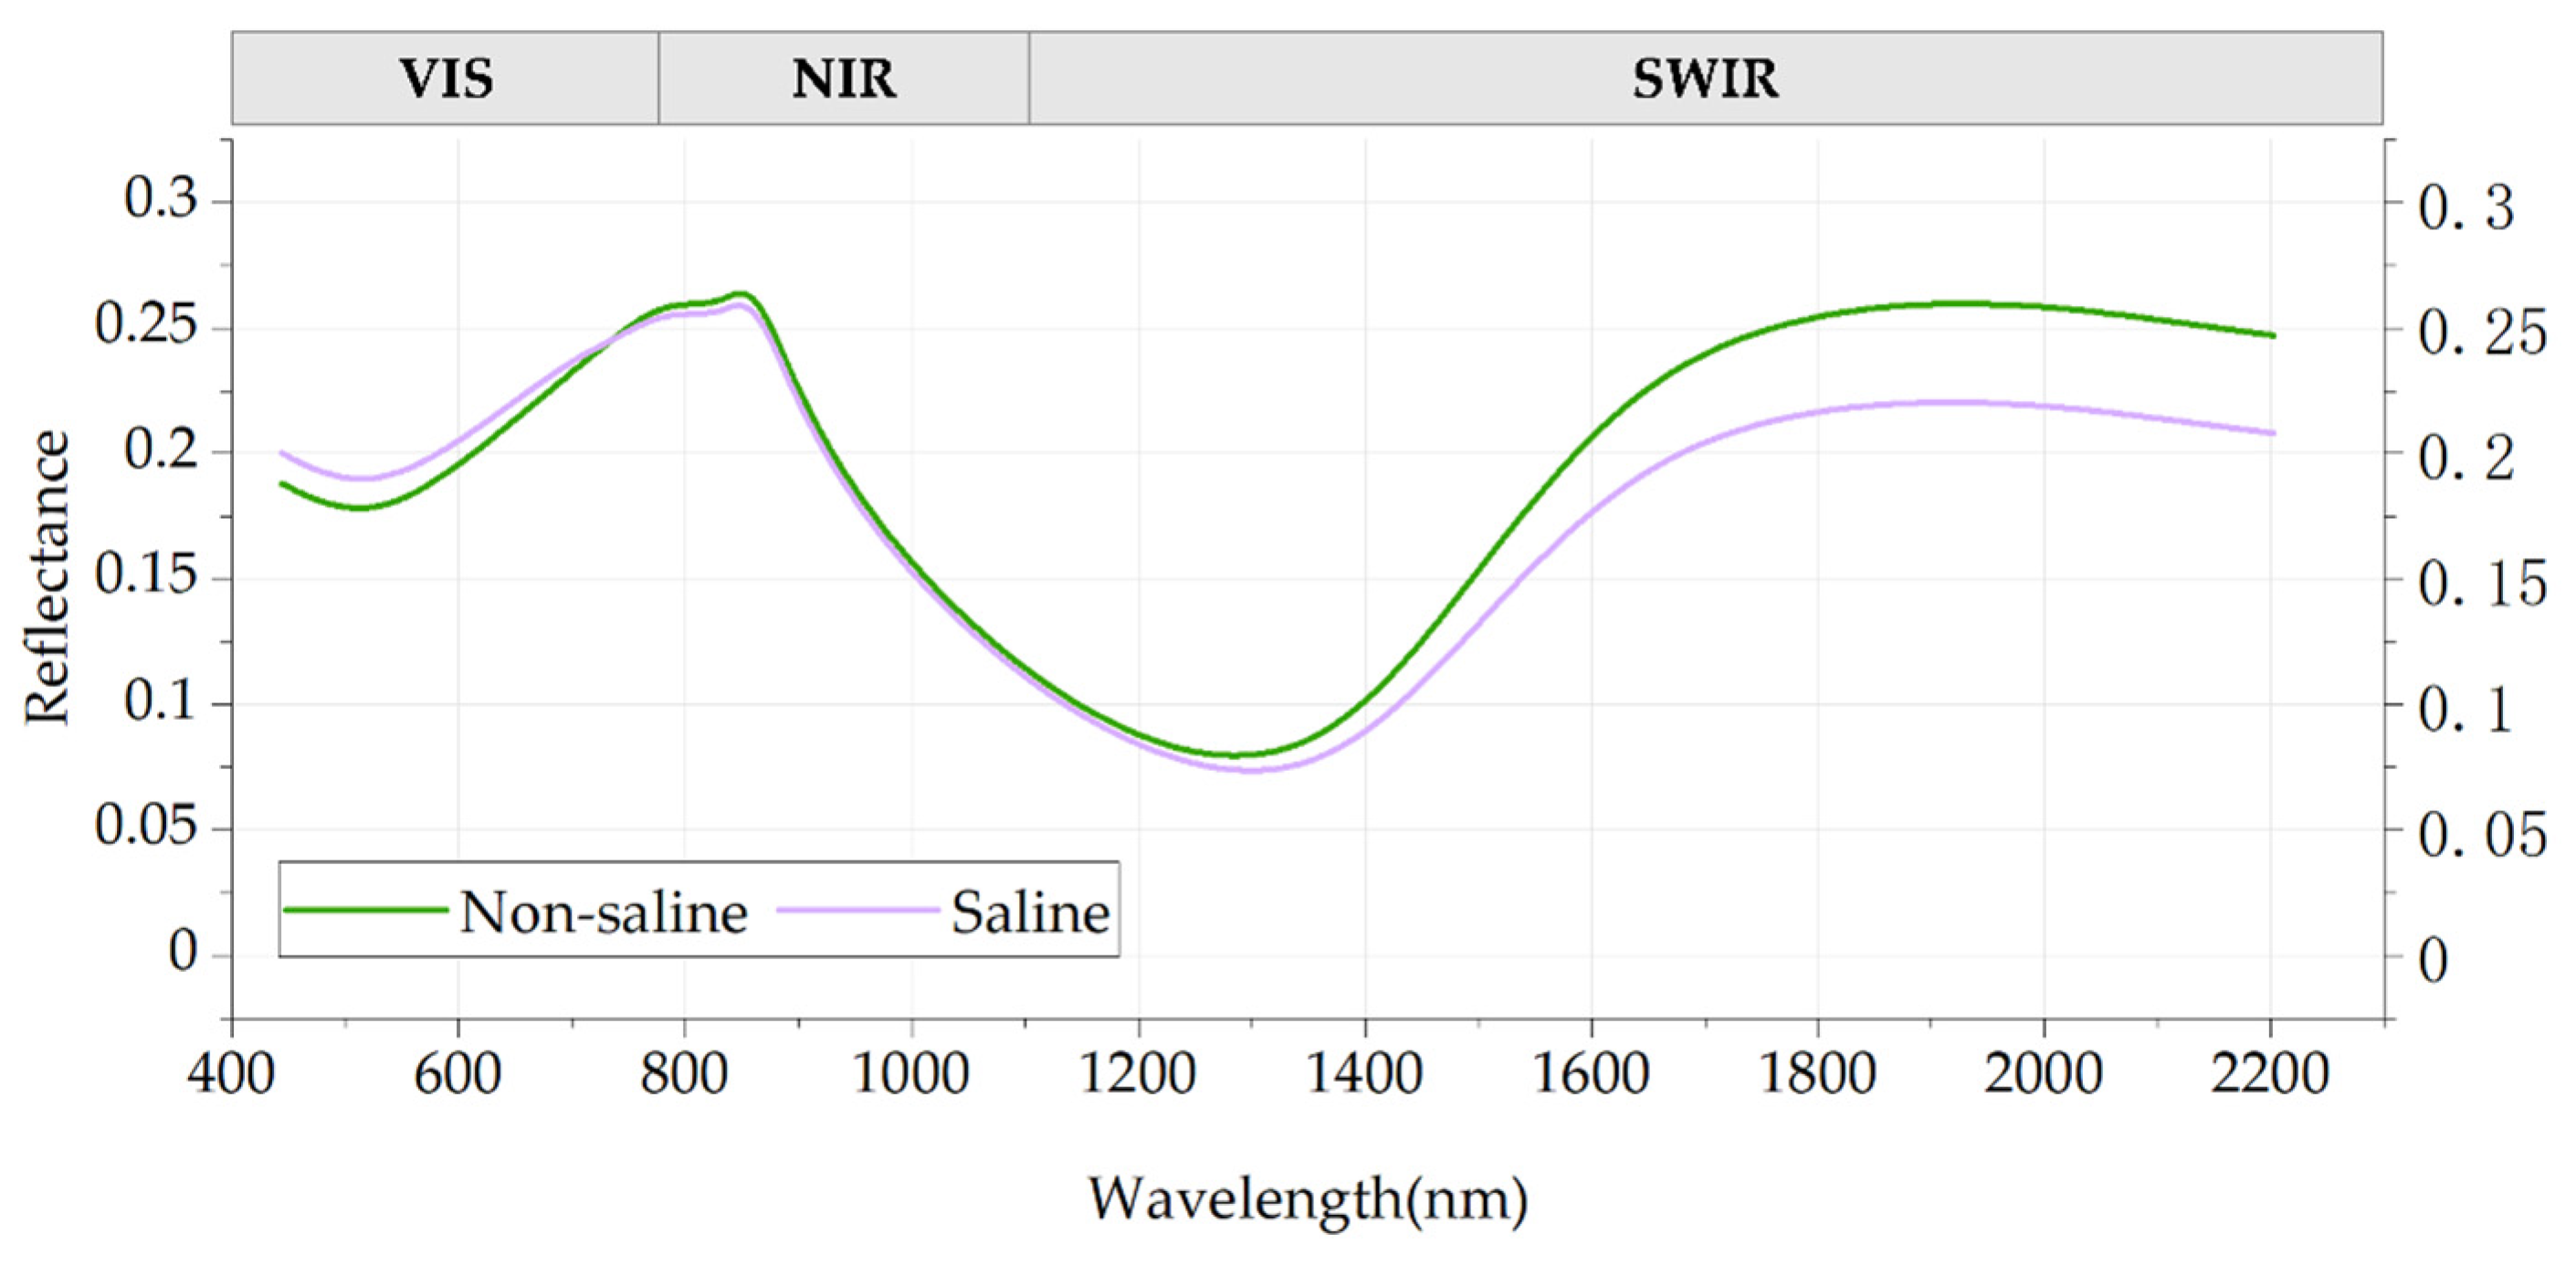
Figure 7 shows that even though the saline and non-saline samples have clear absorption valleys in the visible wavelength range, their reflectance values significantly differ. In comparison, the reflectance value in the NIR wavelength range is relatively high, but no clear difference has been observed. Near the two bands of water vapor (945 nm) and cirrus (1375 nm) of the Sentinel-2 image, there are more wide absorption valleys but practically overlapping curves in the SWIR wavelength range; however, near the SWIR1 and SWIR2 bands, the difference becomes more evident. Nevertheless, when employing a single SWIR band for accuracy assessment, the result does not achieve the high accuracy of the visible band due to the SWIR band’s resolution of 20 m.
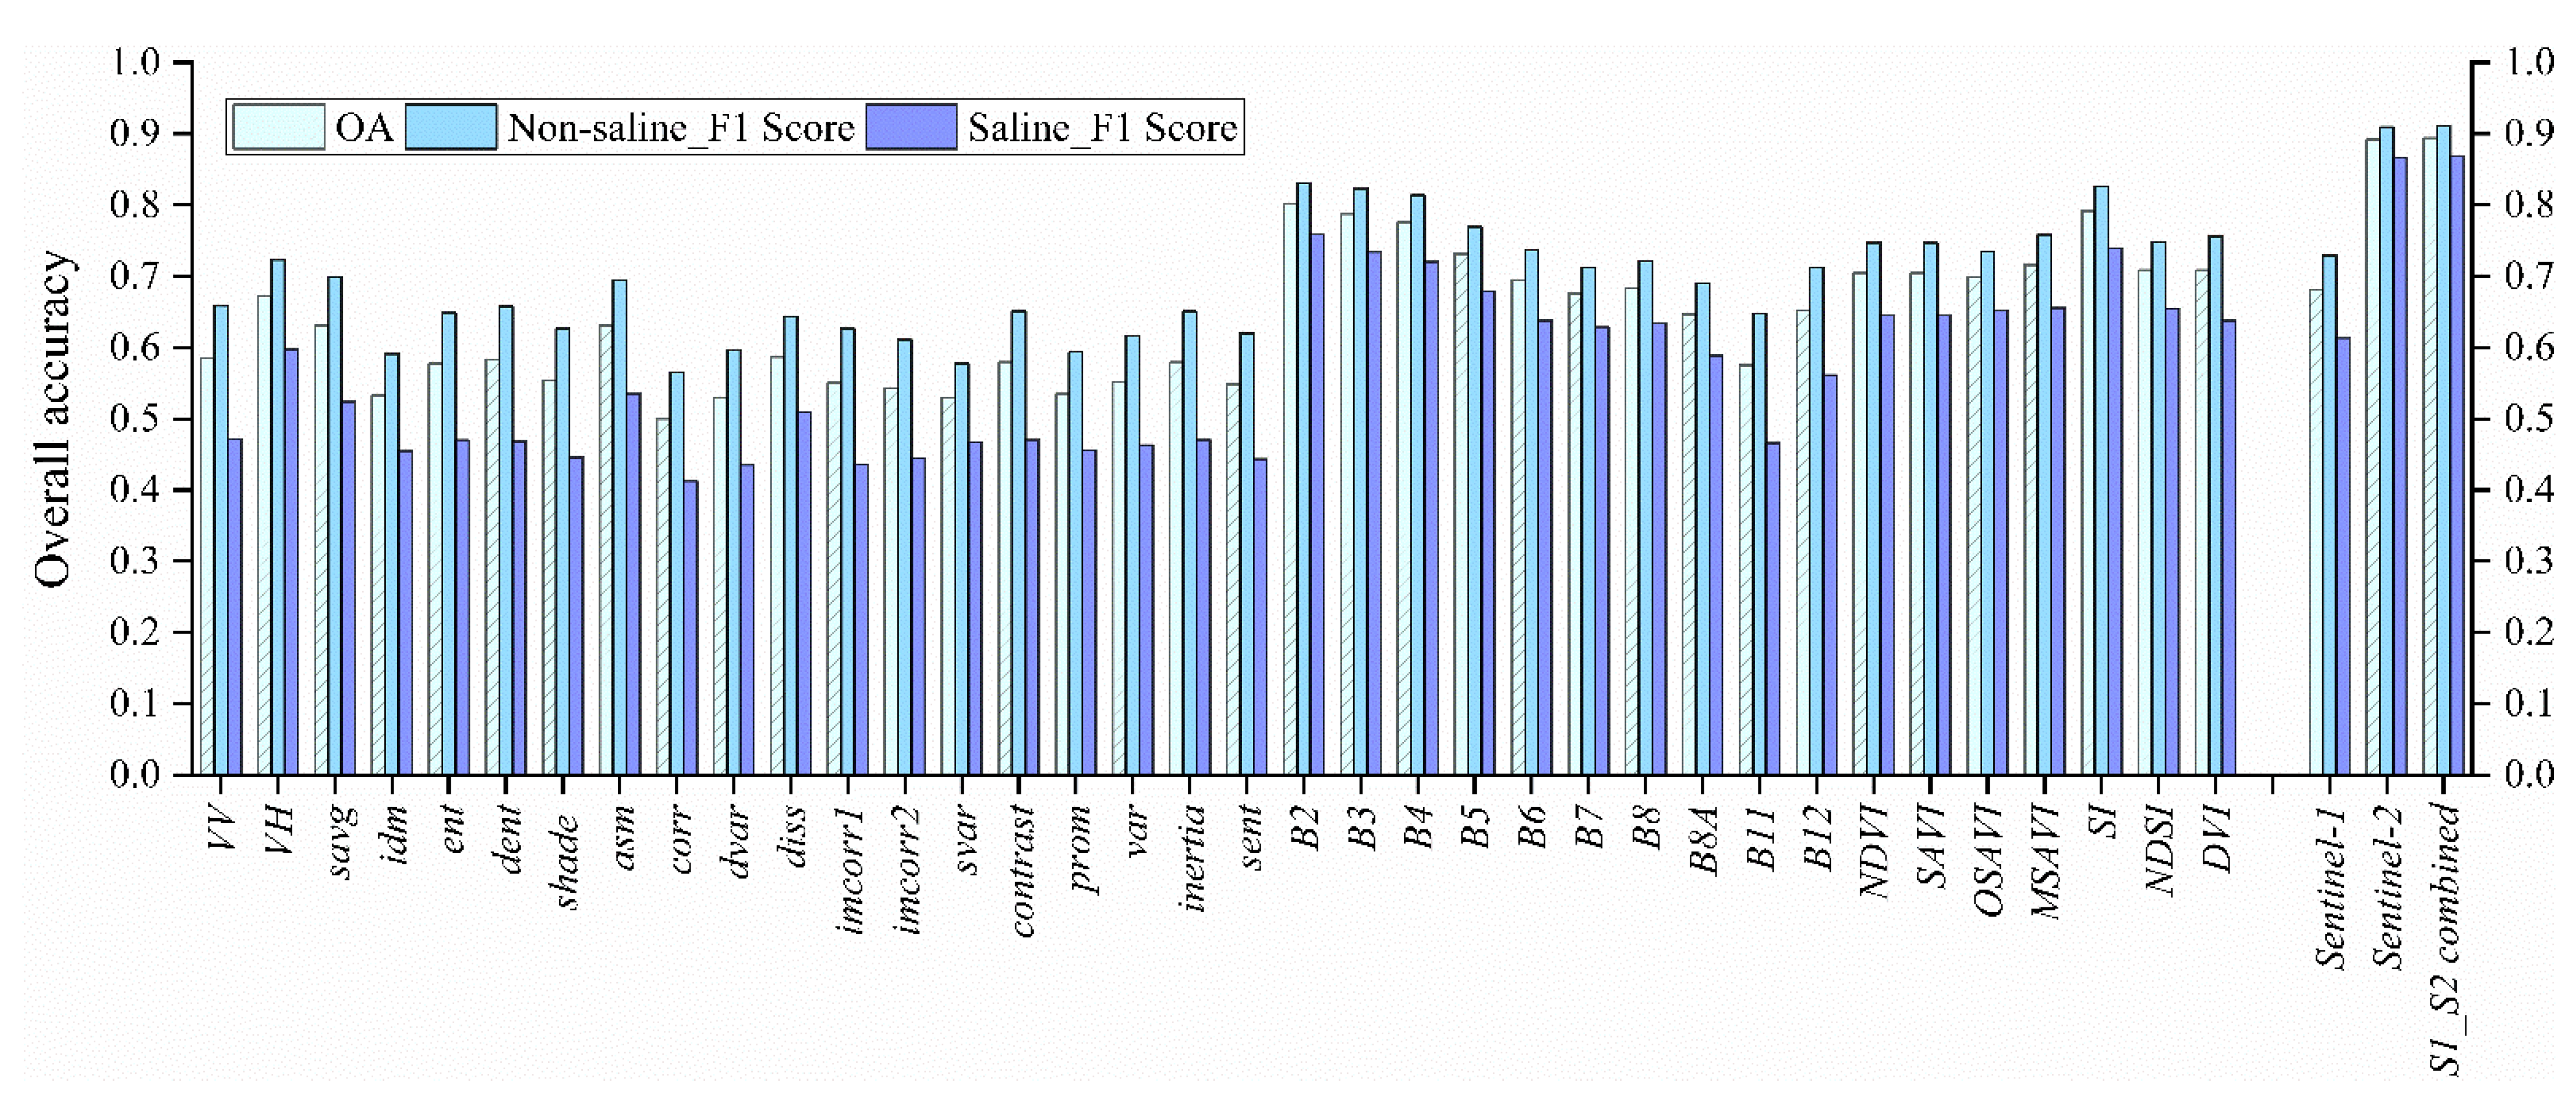
Commonly, SI measures the direct relationship between Electrical Conductivity (EC) and moisture. This ratio shows the salinity concentration in the available water [
62]. By utilizing the more pronounced differences between the two cropland sample types in the Blue and Red bands, the SI index based on the visible band in this study was the variable with the highest contribution and achieved higher classification accuracy. However, other indices have similar classification accuracy since they are both constructed from red and NIR bands.
While NDVI and NDSI represent normalized differences between the Red and NIR bands of the Sentinel-2 image, NDVI is the NIR minus the Red and NDSI is the inverse. Thus, a positive value of NDVI and a negative value of NDSI at the same pixel are equivalent. However, when NDVI or NDSI are not employed, the overall accuracy of the salt-affected cropland mapping slightly decreases (the accuracy decreases by 0.0019 when NDVI is removed, and the accuracy drops by 0.0058 when NDSI is removed). Consequently, NDVI and NDSI have equal correlation coefficients with the sample data, which means positive correlation coefficients for NDVI and negative correlation coefficients for NDSI). Additionally, NDSI was found to be more sensitive for detecting saline cropland in the wet season with OA at 0.66, which is slightly higher than the accuracy that NDVI can achieve in the wet season with OA at 0.65.
4.2. Multi-Sensor Data Application in Saline Cropland Mapping
Soil salinization is a severe problem faced by land worldwide, and the affected area is vast [
18]. However, there is no exact standard for monitoring solutions due to different data sources and statistical methods. Unlike non-salt-affected land and other ground features, soil salinization has distinct and unique spectral reflectance characteristics and tends to show higher reflectance on spectral images [
40,
63,
64,
65]. Satellite remote sensing technology has irreplaceable advantages (near real-time and covering a large area) and good application prospects for observing soil salinity. Therefore, using multispectral remote sensing images to monitor the soil-affected cropland in an area with complex land surface objects is feasible.
On the other hand, microwave remote sensing has been widely used in the inversion of surface soil moisture and salinity for a long time [
66,
67]. Since the C-band polarization radar data of the Sentinel-1 satellite was introduced into civilian use, some breakthroughs have been made in soil moisture inversion research at the beginning [
68,
69]. However, the salinity change in the soil surface will affect the soil dielectric properties and thus will change the microwave emissivity of the land surface. Therefore, in addition to considering the impact of soil moisture alone, soil salinity has to be considered in areas with severe soil salinization [
70,
71,
72]. As a result, the study of monitoring soil salinity using microwave remote sensing data has gradually attracted extensive attention [
73,
74].
The method combining the optical and microwave remote sensing data has been discussed preliminary in this study. However, many studies have shown that the identification ability of the backscattering coefficient will be significantly enhanced after the polarization decomposition of radar data. Nevertheless, the importance of radar data in this study is still minimal, which may be because the eigenvalues after polarization decomposition are more advantageous for identifying salt on the soil surface than the original backscattering coefficient. The GRD data provided in GEE do not have phase information, so it is impossible to realize GEE’s polarization decomposition. Hence, it is difficult to establish the eigenvalues after polarization decomposition in a large area to extract saline cropland.
The application of remote sensing to earth observation is an essential means to understand the earth and study various natural phenomena in the future. Remote sensing technology is constantly developing, including many commercial satellite programs. As a result, the earth will be observed without a dead angle. In addition, the data volume will increase in geometric multiples; managing and using data efficiently and reasonably will be both a challenge and an opportunity for developing various algorithms and applications for salt-affected cropland monitoring.
4.3. Strongly Saline Cropland Abandonment in HID
The ESA WorldCover global land cover data did not recognize some fields with severe salinization as cropland. However, it is a minor error, because these have been abandoned for many years. On the other hand, a few severely salinized croplands have been planted late for sunflower seeds because of their salt tolerance [
75]. In either case, it points to the severely salinized cropland in HID under the high potential abandonment stress.
Soil salinization has become an essential topic of global change research. The latest research shows that global soil salinization will be characterized by regional prominence, global intensification, and the coexistence of local salinization and intensification. Severely salinization is one of the most hazardous reasons why cropland is removed from production and then causes the abandonment globally of 0.3–1.5 million hectares per year [
76]. It is generally recognized that a large proportion of salt-affected soils in irrigated areas occurs on land inhabited by smallholder farmers. However, salt-affected cropland degradation’s social and economic dimensions have received little attention compared to its biophysical aspects [
77].
Well-known examples of salt-induced land degradation include the Aral Sea Basin (Amu-Darya and Syr-Darya River Basins) in Central Asian countries, the Indo-Gangetic Basin in India, the Indus Basin in Pakistan, the Yellow River Basin in China, the Euphrates Basin in Syria and Iraq, the Murray-Darling Basin in Australia, and the San Joaquin Valley in the United States. Severe salinity also reduces paddy yields in many previously productive land areas; many paddy fields in Jaffna Peninsula, Sri Lanka, have been abandoned and are currently becoming shrubland [
78]. Nevertheless, there has been no comprehensive study on the contribution of soil salinity to reduced agricultural productivity and the abandonment of paddy lands in a region. A study based on the analysis of the spatiotemporal variation in cropland expansion and loss in Xinjiang over 20 years found that the abandonment was the primary reason for the loss of cropland, with soil salinization playing an increasingly major role in the cropland abandonment [
79]. Furthermore, Wu et al. [
80] found widespread abandonment of reclaimed land and tillage in Xinjiang. A major reason for this abandonment was soil salinization with as much as 12,680 km
2 of cropland being affected.
There was a strong sense of expansion in the land use pattern of humanity with a poor understanding of sustainable development in the last few decades in Inner Mongolia. As a result, the saline bare land in northeast China has been utilized to a certain extent. However, due to the lack of protective technology, paddy fields’ abandonment and salinization reappearance have also occurred in some areas after the high-intensity utilization of cropland. The extensive area saline cropland treatment was also implemented in 2022 with the government’s support since the abandoned cropland is an essential reserve in China. The efficient utilization of salinized land is vital to ensure national food security, especially under the current COVID-19 pandemic and the global background of frequent disasters; it is imminent to utilize the reserve cropland and control the salinity.


 ,
, 