Article

Analyzing Driving Factors of Drought in Growing Season in the Inner Mongolia Based on Geodetector and GWR Models

1
College of Earth Science, Chengdu University of Technology, Chengdu 610059, China
2
State Environmental Protection Key Laboratory of Synergetic Control and Joint Remediation for Soil & Water Pollution, Chengdu University of Technology, Chengdu 610059, China
3
Geological Engineering Department, Montana Technological University, Butte, MT 59701, USA
4
College of Tourism and Urban-Rural Planning, Chengdu University of Technology, Chengdu 610059, China
*
Author to whom correspondence should be addressed.
Remote Sens. 2022, 14(23), 6007; https://doi.org/10.3390/rs14236007
Submission received: 15 October 2022 / Revised: 18 November 2022 / Accepted: 23 November 2022 / Published: 27 November 2022
(This article belongs to the Topic Water Management in the Era of Climatic Change)

Abstract

:
As an important ecological security barrier in northern China, the Inner Mongolia Autonomous Region (hereinafter referred to as Inner Mongolia) is seriously affected by drought. It is of great significance to characterize the spatial distribution of drought and identify the influencing factors of drought. Due to complex interactions among drought driving factors, it is difficult to quantify the contribution of each driving factor to drought using linear correlation analysis alone. In this study, we used the Standardized Precipitation Evapotranspiration Index (SPEI) as a quantitative indicator of drought to discuss the spatiotemporal variation of drought during growing seasons in the Inner Mongolia from 2000 to 2018. We quantitatively characterized mode, scope, and intensity of changes in SPEI caused by drought-influencing factors such as weather, water, topography, soil, and human activities using the Geodetector and Geographically Weighted Regression (GWR) models. We concluded that about 20.3% of the region showed a downward trend in SPEI, with the fastest rate of decline in the central and western Inner Mongolia. Air temperature, precipitation, elevation, and distance to rivers are the main controlling factors in drought change, and the factor interactions showed nonlinear enhancement. The drought driving effect was obvious in Alxa League, Wuhai City, Ulanqab City, and Baotou City. The results will help us to understand the effects of the driving factors on drought and eventually help policymakers with water-resource management.

1. Introduction

As one of the most serious meteorological and environmental disasters, drought can severely impact the natural environment, crop production, social economy, and human life, but its impact mode is not easy to be quantified [1]. The Sixth Assessment Report (AR6) of the Intergovernmental Panel on Climate Change (IPCC) points out that in the past 30 years, the global average temperature has increased by 1.5 °C, extreme climate events occur frequently, and the degree of drought will continue to increase in the future. Drought impacts species and structure of vegetation. It is an important factor affecting vegetation growth, vegetation restoration, and soil desertification [2,3,4]. Changes in hydrothermal conditions can lead to biomass loss and ecosystem destruction. Therefore, investigating the spatiotemporal variation of drought during the growing season (from April to September) in Inner Mongolia, identifying causes of drought, and separating and quantifying relative contributions of the controlling factors of drought are of practical significance for drought remediation and ecosystem restoration.
Due to uncertainties in starting and ending times, spatial scale, time lag effects, and other factors of drought events, researchers mainly monitor and analyze drought effects through a series of drought indicators [1,5]. The Palmer Drought Severity Index (PDSI) is the most widely used water-balance-based meteorological drought index, which comprehensively considers water supply and demand. However, it has limitations in judging short-term droughts [6]. The Standardized Precipitation Index (SPI) calculates the probability of precipitation distribution; however, it is difficult to handle the task of meteorological drought monitoring under the context of global change [7]. The Standardized Precipitation Evapotranspiration Index (SPEI) leverages the advantages of PDSI and SPI [8,9]. It not only considers the balance of water and energy, but also reflects the deficit and accumulation process of surface water. Therefore, it is widely used in climate studies [7,10], agriculture [11], hydrology [12,13], and so on. At the same time, SPEI can be calculated at multiple time scales. SPEI-3, used to characterize drought in a seasonal scale, reflects short-term regional meteorological drought. It has a direct correlation with grassland biomass and vegetation growth [14,15], and is an important index of vegetation to study drought in a growing season.
The China-Mongolia Arid and Semiarid Area (CMASA) is one of the eight major arid regions in the world, and it is also an inland arid region with the highest latitude. Inner Mongolia is located in the transition region between the arid and semi-arid areas in the east of CMASA. Due to the perennial influence of the westerly wind system, atmospheric circulation, and pressure field of Qinghai-Tibet Plateau, temperature rise in the west of Inner Mongolia is significantly higher than that in the inland and surrounding areas of China, and is particularly sensitive to climate change [16,17]. Inner Mongolia is China’s main grassland for pasture and agriculture. It is an important ecological barrier to the North of China. For a long time, Inner Mongolia has suffered from frequent regional and local droughts, which have significantly impacted the local economy. The intensification of desertification caused by droughts has become the primary ecological and environmental concern in Inner Mongolia [18]. There are many research activities on long-term drought monitoring in Inner Mongolia: An et al. [19] analyzed the spatiotemporal variation of droughts in Inner Mongolia in the past 60 years; Pei et al. [20] compared the differences and applicability of SPI and SPEI drought indexes at different time scales; Tong et al. [21] used linear regression and wavelet analysis to identify drought changes and drought patterns; however, few studies have quantitatively explained the causes of the droughts. In the past, drought analysis and regional water resource planning were mainly based on linear correlation between factors [22,23,24]. However, drought is a complex regionalization event. It is generally hard to refine intensity and interaction among various factors in different regions using just the traditional linear regression analysis [25,26]. At the same time, drought is closely related to natural conditions, human activities, and their interactions. However, interactions among these factors have not been well-investigated [27]. Different land cover types, soil conditions, topography, and other factors may cause spatial differentiation of local drought. Geodetector and GWR are statistical models considering spatial nonstationarity and the modeling process is simple but intuitive. A combination of the two can accurately describe the action, path, and intensity of the influencing factors and has a good application prospect [28,29,30].
In this study, the seasonal SPEI-3 index (SPEI for short) was calculated based on the data at the meteorological stations in Inner Mongolia; the spatiotemporal variation trend of SPEI in the growing season from 2000 to 2018 was obtained using univariate linear trend analysis. The main controlling factors of drought change were identified through Geodetector. The GWR model was used to quantitatively evaluate the effect of various driving factors on SPEI change during the growing season, and to explain the interaction between the main controlling factors for spatial heterogeneity.

2. Materials and Methods

2.1. Study Area

Inner Mongolia is located in the northern border of China, spanning three major regions of northwest, north, and northeast, spreading along a long and narrow belt. The region covers a total area of about 1.183 million km2 that accounts for about 12.1% of China’s total area. The region is rich in resources, with grasslands, forests, and arable land per capita ranking first in China. The Greater Khingan Range runs through the east of the study area in the north-south orientation. The Yin Mountains extend east-west in the south. Large deserts such as the Badain Jaran Desert, Tengger Desert, and Mu Us Desert are located in the west. The study area has an average altitude of about 1000 m. The climate in the region varies from arid-semiarid monsoon climate to humid-semi humid climate. It is often affected by cyclones on the Mongolian Plateau with strong wind in spring and by Lake Baikal, the world’s largest freshwater lake by volume containing 22–23% of the world’s fresh surface water. The climate is often controlled by prevailing westerlies belts or subtropical high-pressure belts, with high temperature and little rain in summer. Annual rainfall showed a decreasing trend from east to west and from north to south [22,31].

2.2. Data Sources and Preprocessing

2.2.1. Meteorological Data

Daily mean air temperature, monthly cumulative precipitation, daily mean wind speed, and daily mean sunshine duration at 110 meteorological stations (Figure 1a) in and around Inner Mongolia from 2000 to 2018 were selected as meteorological data, which were provided by the China Meteorological Data Service Centre (http://data.cma.cn/). A homogeneity test of the meteorological data was carried out to fill in unavailable data. A statistical analysis on the mean air temperature (°C), accumulated precipitation (mm), mean wind speed (m·s−1), and mean sunshine duration (h) at stations was performed for the growing seasons from 2001 to 2018. Spatial resolution for ordinary Kriging interpolation was set to 1 km × 1 km; the geographic reference was set as WGS84/UTM zone 48°N.

2.2.2. DEM Data

DEM (Digital Elevation Model) was the Shuttle Radar Topography Mission (SRTM) data with a resolution of 90 m downloaded from the United States Geological Survey (USGS) data portal (http://earthexplorer.usgs.gov). After preprocessing, such as mosaicking and void-filling, the accuracy of the input topographic data had a standard error of 1 m. The DEM data were resampled to 1 km × 1 km and slope and aspect were then derived from the DEM data.

2.2.3. Other Data Sets

Population density data was from the population dataset produced by the Landscan Global team (https://landscan.ornl.gov/), with a spatial resolution of 0.01° × 0.01° (about 1 km). The data were produced according to the community standard of global population distribution data constructed from multivariable geographic dasymetric modeling and remote sensing image analysis [32]. Land use conversion type can effectively reflect intensity of human activities [33]. It is also an important surface condition for drought research. The land cover data in 2000 and 2018 were from the Resource and Environment Science Data Center of Chinese Academy of Sciences (http://www.resdc.cn). The data set was obtained by visual interpretation of Landsat TM/ETM+ images for different periods and was widely used [25]. Land cover was classified into six basic categories: cultivated land, forest, grassland, water area, construction land, and unused land. A land use conversion map from 2000 to 2018 was generated. Soil sediment contents were from the 1:1 million soil type map and the soil profile data was obtained from the second soil survey (http://www.resdc.cn). Soil texture was classified according to the content of sand, silt, and clay. The content of particles in different soils was shown as a percentage. Spatial data of main rivers and county stations were derived from the 1:4 million vector database provided by the National Geographic Center of China (http://ngcc.sbsm.gov.cn). Distance to Rivers (DTR) and Distance to Cities (DTC) were obtained through buffer zone analysis, and the spatial resolution was set to 1 km × 1 km. The 1:1 million vegetation type data released by the Resource and Environment Science Data Center of the Chinese Academy of Sciences (http://www.resdc.cn) were used. The vegetation in Inner Mongolia was reclassified into 8 classes: coniferous forest, broad-leaved forest, shrub, grassland, meadow, swamp, desert, and cultivated vegetation.

2.3. Methods

2.3.1. Calculation of the Standard Precipitation Evapotranspiration Index (SPEI)

The difference between precipitation and potential evapotranspiration (PET), PD, is a key parameter for SPEI calculation. PET was calculated using the Thornthwaite method because fewer meteorological elements are required [9], as follows:
P D i = P i     P E T i
P E T = 16.0 × ( 10 T i H ) A
A = 6.75 × 10 7 H 3 7.71 × 10 5 H 2 + 1.79 × 10 2 H + 0.492
where Pi is the monthly precipitation of the i-th month, PETi the monthly evapotranspiration, A a constant, and H the annual heat index. The log-logistic function based on three parameters (α, β, γ) was used to perform the normal fitting to the time series of PDi and compute the probability distribution function F(x). The log-logistic probability distribution function is given as below:
F ( x ) = [ 1 + ( α x γ ) β ] 1
where α is the scale parameter, β the shape parameter, and γ the position parameter; all are obtained by the linear-moment method.
The probability distribution function was standardized to obtain the cumulative probability Q (Equation (5)):
Q = 1 F ( x )
and the SPEI value was then calculated as:
S P E I = { w a 0 + a 1 w + a 2 w 2 1 + d 1 w + d 2 w 2 + d 3 w 3   , w = 2 ln ( Q ) ( Q 0.5 ) ( w a 0 + a 1 w + a 2 w 2 1 + d 1 w + d 2 w 2 + d 3 w 3 ) , w = 2 ln ( 1 - Q ) ( Q 0.5 )
where the constants a0 = 2.515517, a1 = 0.802853, a2 = 0.010328, d1 = 1.432788, d2 = 0.189269, and d3 = 0.001308. The degree of drought (Table 1) was classified according to the local climate conditions [21,34].

2.3.2. Trend Analysis

The univariate linear regression equation (Equation (7)) was used for trend analysis to calculate the variation trend of SPEI during the growing seasons from 2000 to 2018:
θ s l o p e = n × i = 1 n ( i × S P E I i ) i = 1 n i i = 1 n S P E I i n × i = 1 n i 2 ( i = 2 n i ) 2
where n (n = 19) is the length of time series and θslope is the slope in the linear regression equation. θslope > 0 indicates that the drought trend is reduced; otherwise, the drought is aggravated. The variation trend of SPEI was divided into five levels based on the standard deviation (STD), i.e., significant degradation (θslope < −STD), slight degradation (−STD < θslope < −0.5STD), substantially unchanged (−0.5STD < θslope < 0.5STD), slight improvement (0.5STD < θslope < STD), and significant improvement (θslope > STD).

2.3.3. Geodetector

Geodetector is a spatial statistical model based on spatial autocorrelation theory to reveal the spatial differentiation of geographic elements and their driving factors [30]. We mainly used the factor detector, ecological detector, and interactive detector within the model. The factor detector quantifies the contribution of influencing factors to dependent variables, and it is calculated as follows:
q = 1 S S W S S T
S S W = h = 1 l N h σ h 2 , S S T = N σ 2
where SSW is the sum of factor variances over all layers and SST is the total sum of variance, where h = 1,… l is the number of strata of the dependent variable or independent variable; Nh and N are the number of units in class h and the whole region, respectively; and σh2 and σ2 are the variances of the dependent variable for the units in class h and the whole region, respectively. The larger the q-value is, the stronger the explanatory power of the factor to the drought phenomenon. The effective range of q is [0, 1].
The ecological detector uses an F test to measure the significant difference of the impact of different influencing factors on the spatial distribution of drought. The F value is determined as follows:
F = N n = 1 ( N n = 2 1 ) σ n 1 2 N n = 2 ( N n = 1 1 ) σ n 2 2
where Nn=1 and Nn=2 refer to the sample size of two random factors, and F reflects the significance level.
The interaction detector was used to identify whether two driving factors, x1 and x2, increase or decrease the explanatory power of the drought index SPEI when they work together (Table 2).
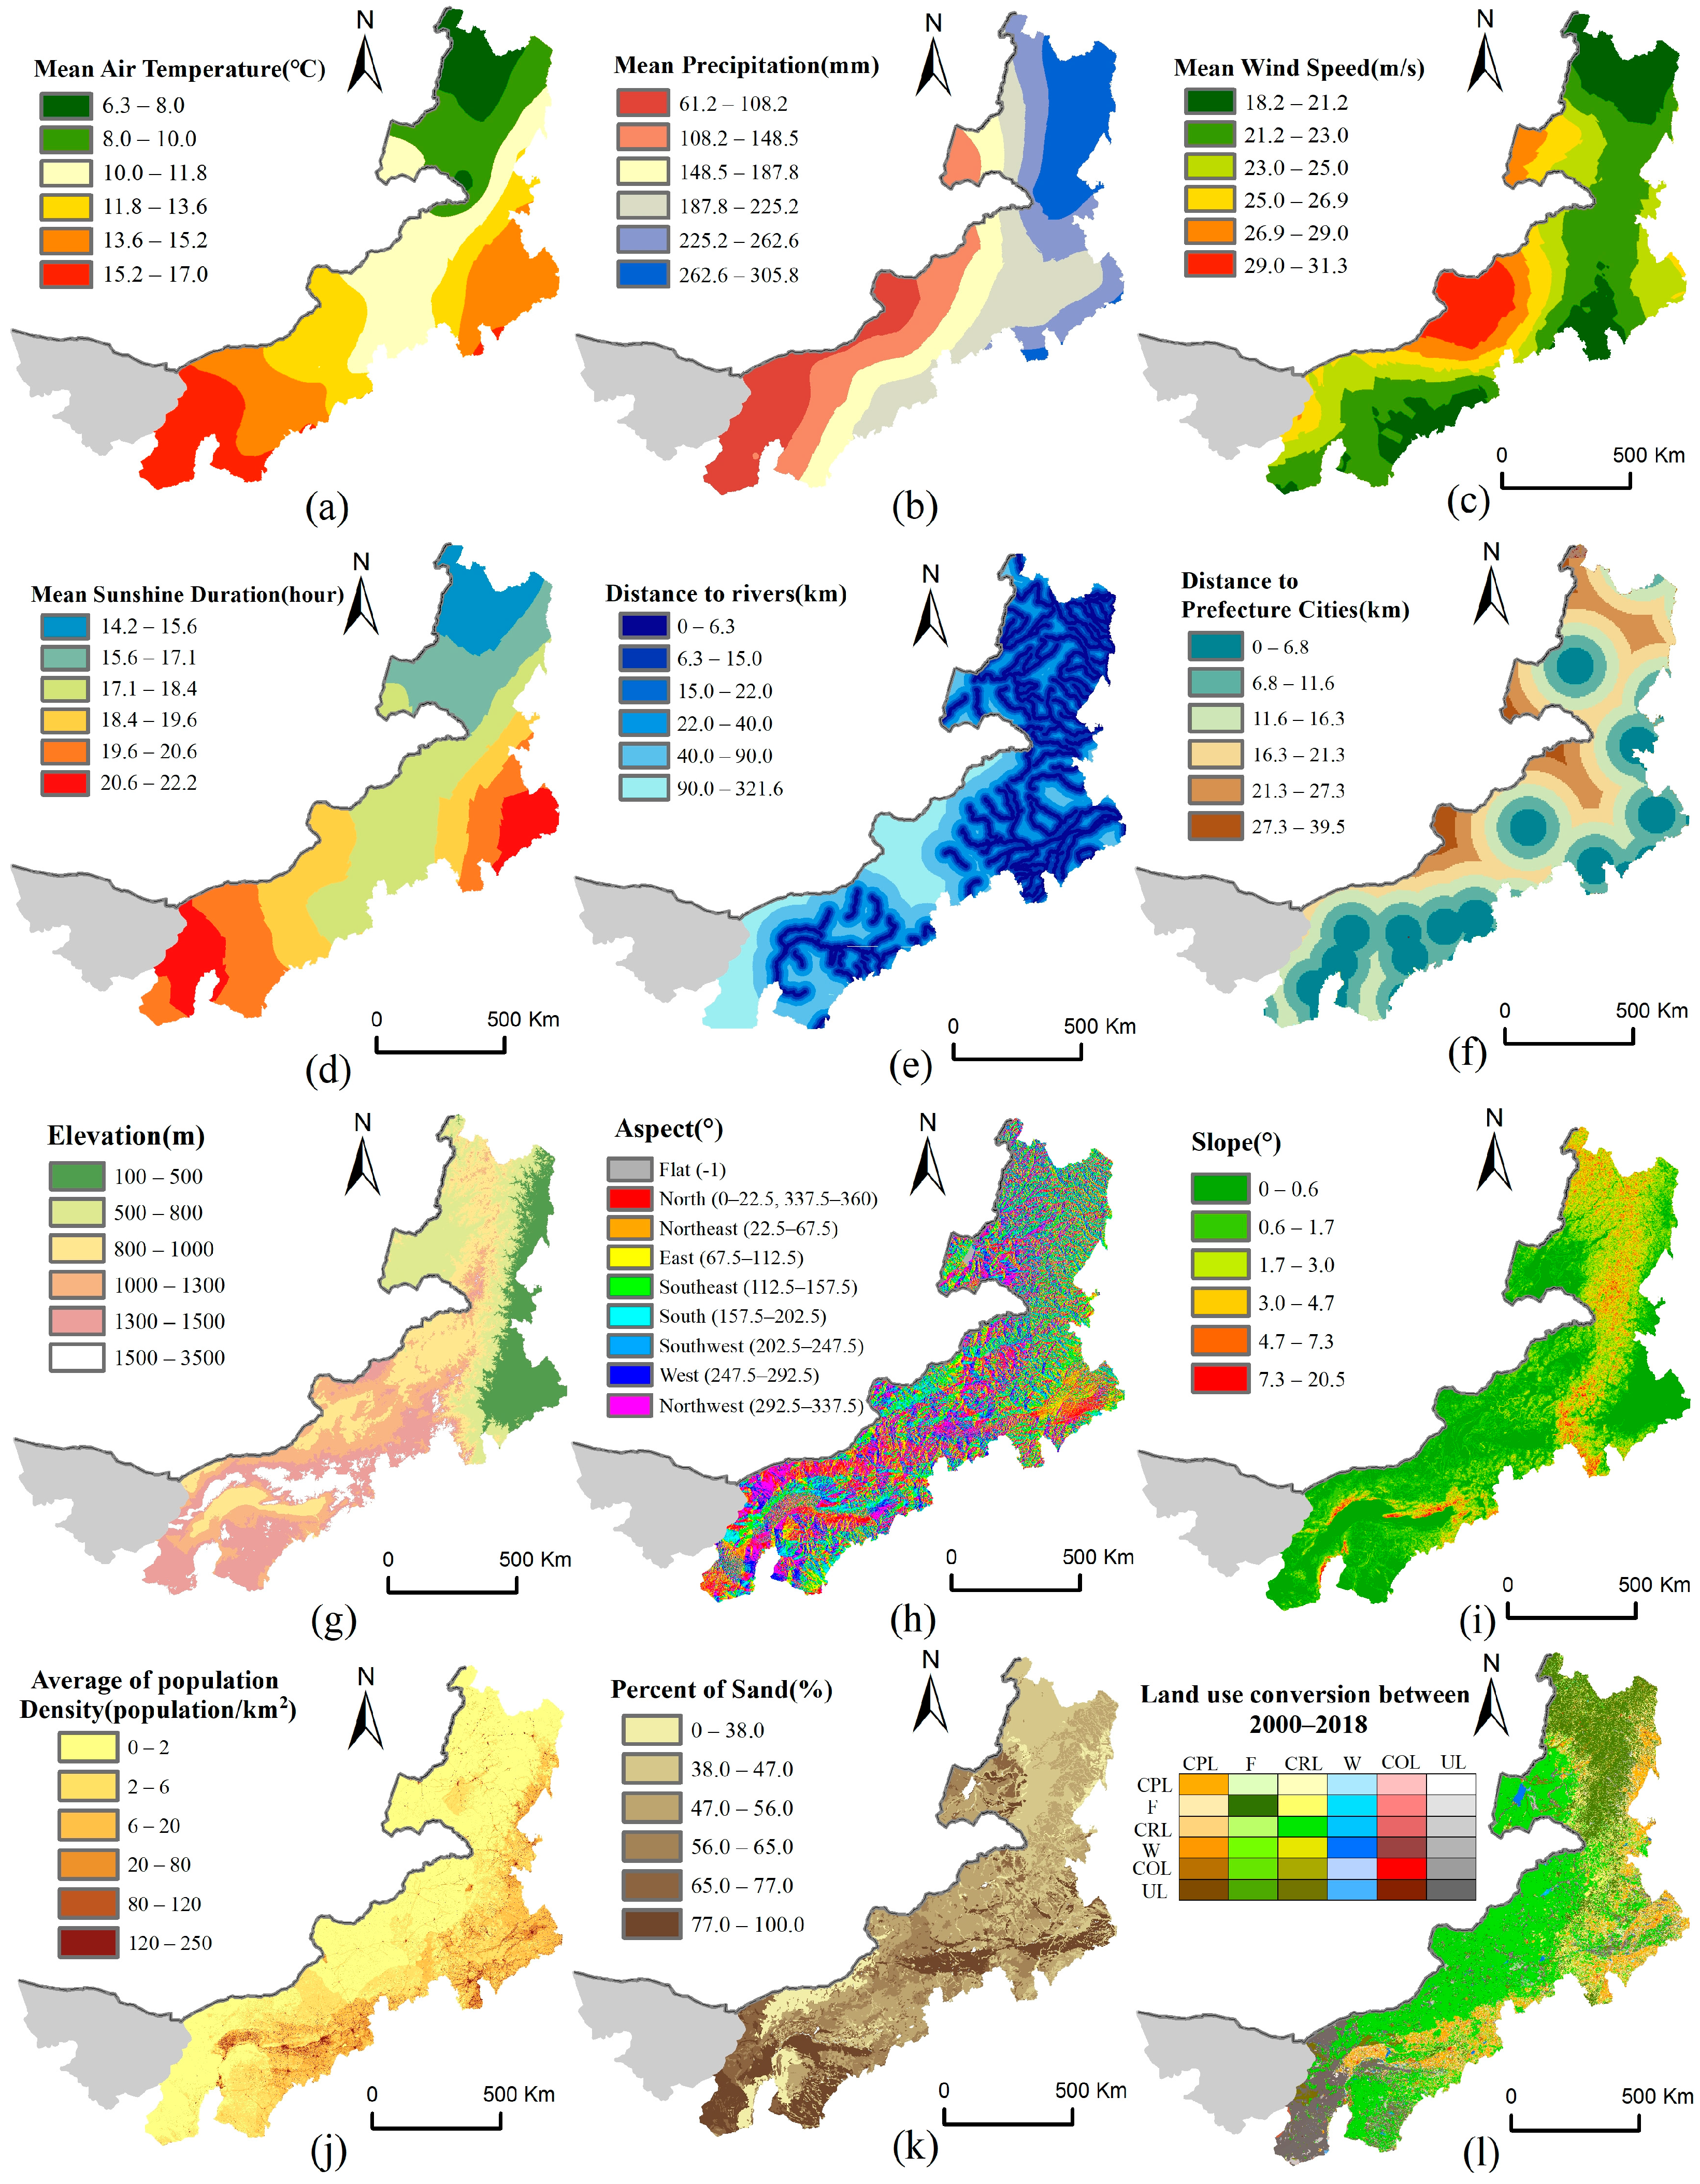
In addition to the influences of meteorological variables, droughts are also affected by other factors including geographic location, topography, soil, land cover type, human activities, etc. Land cover type affects runoff, infiltration, and evapotranspiration of surface water through water absorption [35]. We selected 12 potential drought driving factors as follows: Mean Air Temperature (MAT), Mean Precipitation (MP), Mean Wind Speed (MWS), and Mean Sunshine Duration (MSD) during the growing season, representing the meteorological conditions; Percent of Sand (POS) in soil, representing soil texture; elevation, slope, and slope aspect, representing topographic conditions; Distance to rivers (DTR), representing potential water availability; Distance to Prefecture Cities (DTC), Land-Use and Land-Cover Change (LUCC), and Average of population Density (AOPD), representing human factors that can transform and regulate the local environment [36]. These factors are easy to be quantified [25,37,38]. Since Geodetector can only handle discrete variables, the 12 variables need to be discretized individually. The LUCC factors were divided into 36 grades according to the land use type conversion maps from 2000 to 2018, the slope and aspect were divided into 9 grades, and each of the other 10 factors was divided into 6 grades by the Jenks Natural Breaks Classification Method (Figure 2).

2.3.4. The GWR Model

The GWR model is an extension of the ordinary linear regression analysis method [39], which can effectively estimate the data with spatial autocorrelation and reflect the spatial heterogeneity of parameters in different regions. The multi-variate linear regression equation is given by:
y i = β 0 ( u i , v i ) + j = 1 n β j ( u i , v i ) x i j + ε i
where β0 represents the intercept; (ui, vi) represent the coordinates of the i-th sampling point; βj (ui, vi) the j-th regression parameter on the i-th sampling point, which has geographic significance; xi1, xi2, xi3, , xin are n regression variables at this point; and ε represents random error. Finally, the revised Akaike Information Criterion (AIC) was compared with the ordinary least squares (OLS) results. AIC is defined as:
A I C = 2 I n L ( e ^ L , y ) + 2 c
where y represents the sample set of the fitting value of the dependent variable SPEI, L(êL, y) is the likelihood function, êL is the maximum likelihood estimate of eL, and c is the number of unknown parameters. The smaller the AIC is, the higher the fitting degree will be.

3. Results and Analysis

3.1. Spatiotemporal Variation Characteristics of SPEI

The result of SPEI interpolation cross-validation shows a Pearson correlation coefficient of r = 0.85 and root-mean-square error RMSE = 1.15, indicating that the SPEI interpolation result has high accuracy. The statistical results of SPEI in the study area over the years show that (Table 3) the average annual SPEI of the growing season in Inner Mongolia from 2000 to 2018 is −0.03, representing a mild drought. The area in mild drought during the growing season reached 532,600 km2, accounting for 52.39% of the total study area. The area in mild drought was the largest in 2000, accounting for 99.60% of the total, followed by 2001 and 2017, and that in 2012 was the smallest, accounting for only 6.01% of the total. Among the various types of droughts, the average annual area of mild drought accounted for about 74.34%, the highest proportion. The largest areas of moderate drought and severe drought occurred in 2000 and 2005, accounting for 73.10% and 36.17%, respectively.
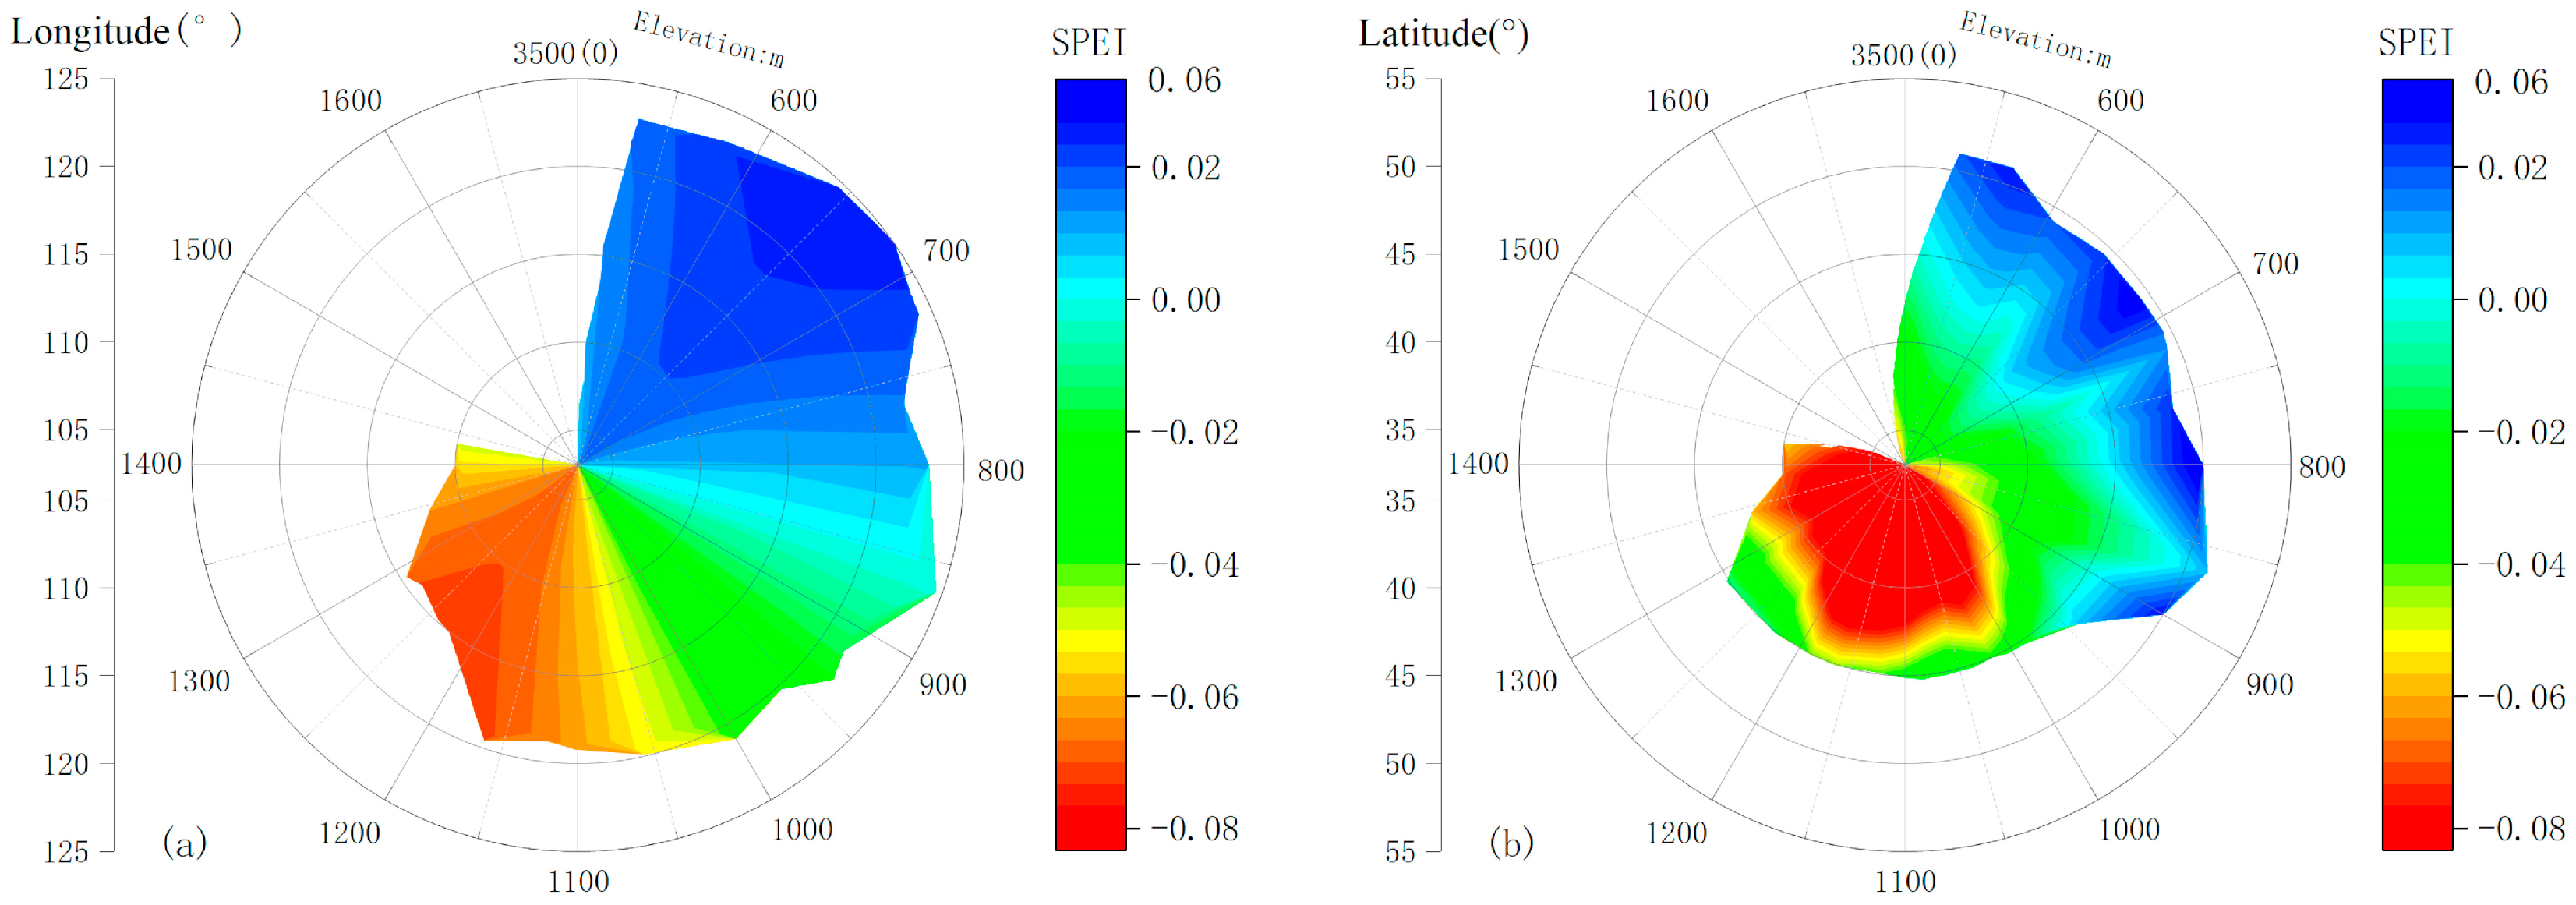
The study area has high elevation in the west and low in the east (Figure 1a), and high in the south and low in the north. The spatial distribution of SPEI shows an increasing pattern from west to east with a rate of change of 0.008/degree and an increase of 0.01/degree from south to north (Figure 3). SPEI is highly sensitive to elevation gradients. Areas with high SPEI were mainly distributed in the 40~52°N area below 800 m in elevation, including Hinggan League, Hulunbuir City, Bairin Left Banner of Chifeng City, and other areas (Figure 1b); low SPEI appeared in areas with elevation between 1100 m~1400 m, in longitude between 105~115°E, and latitude between 40~45°N, mainly including Bayannur City, Baotou City, Ulanqab City, and West Ujimqin Banner of Xilingol League. In the Banner area, land covers are mainly grasslands, meadows, and deserts (Figure 1b).
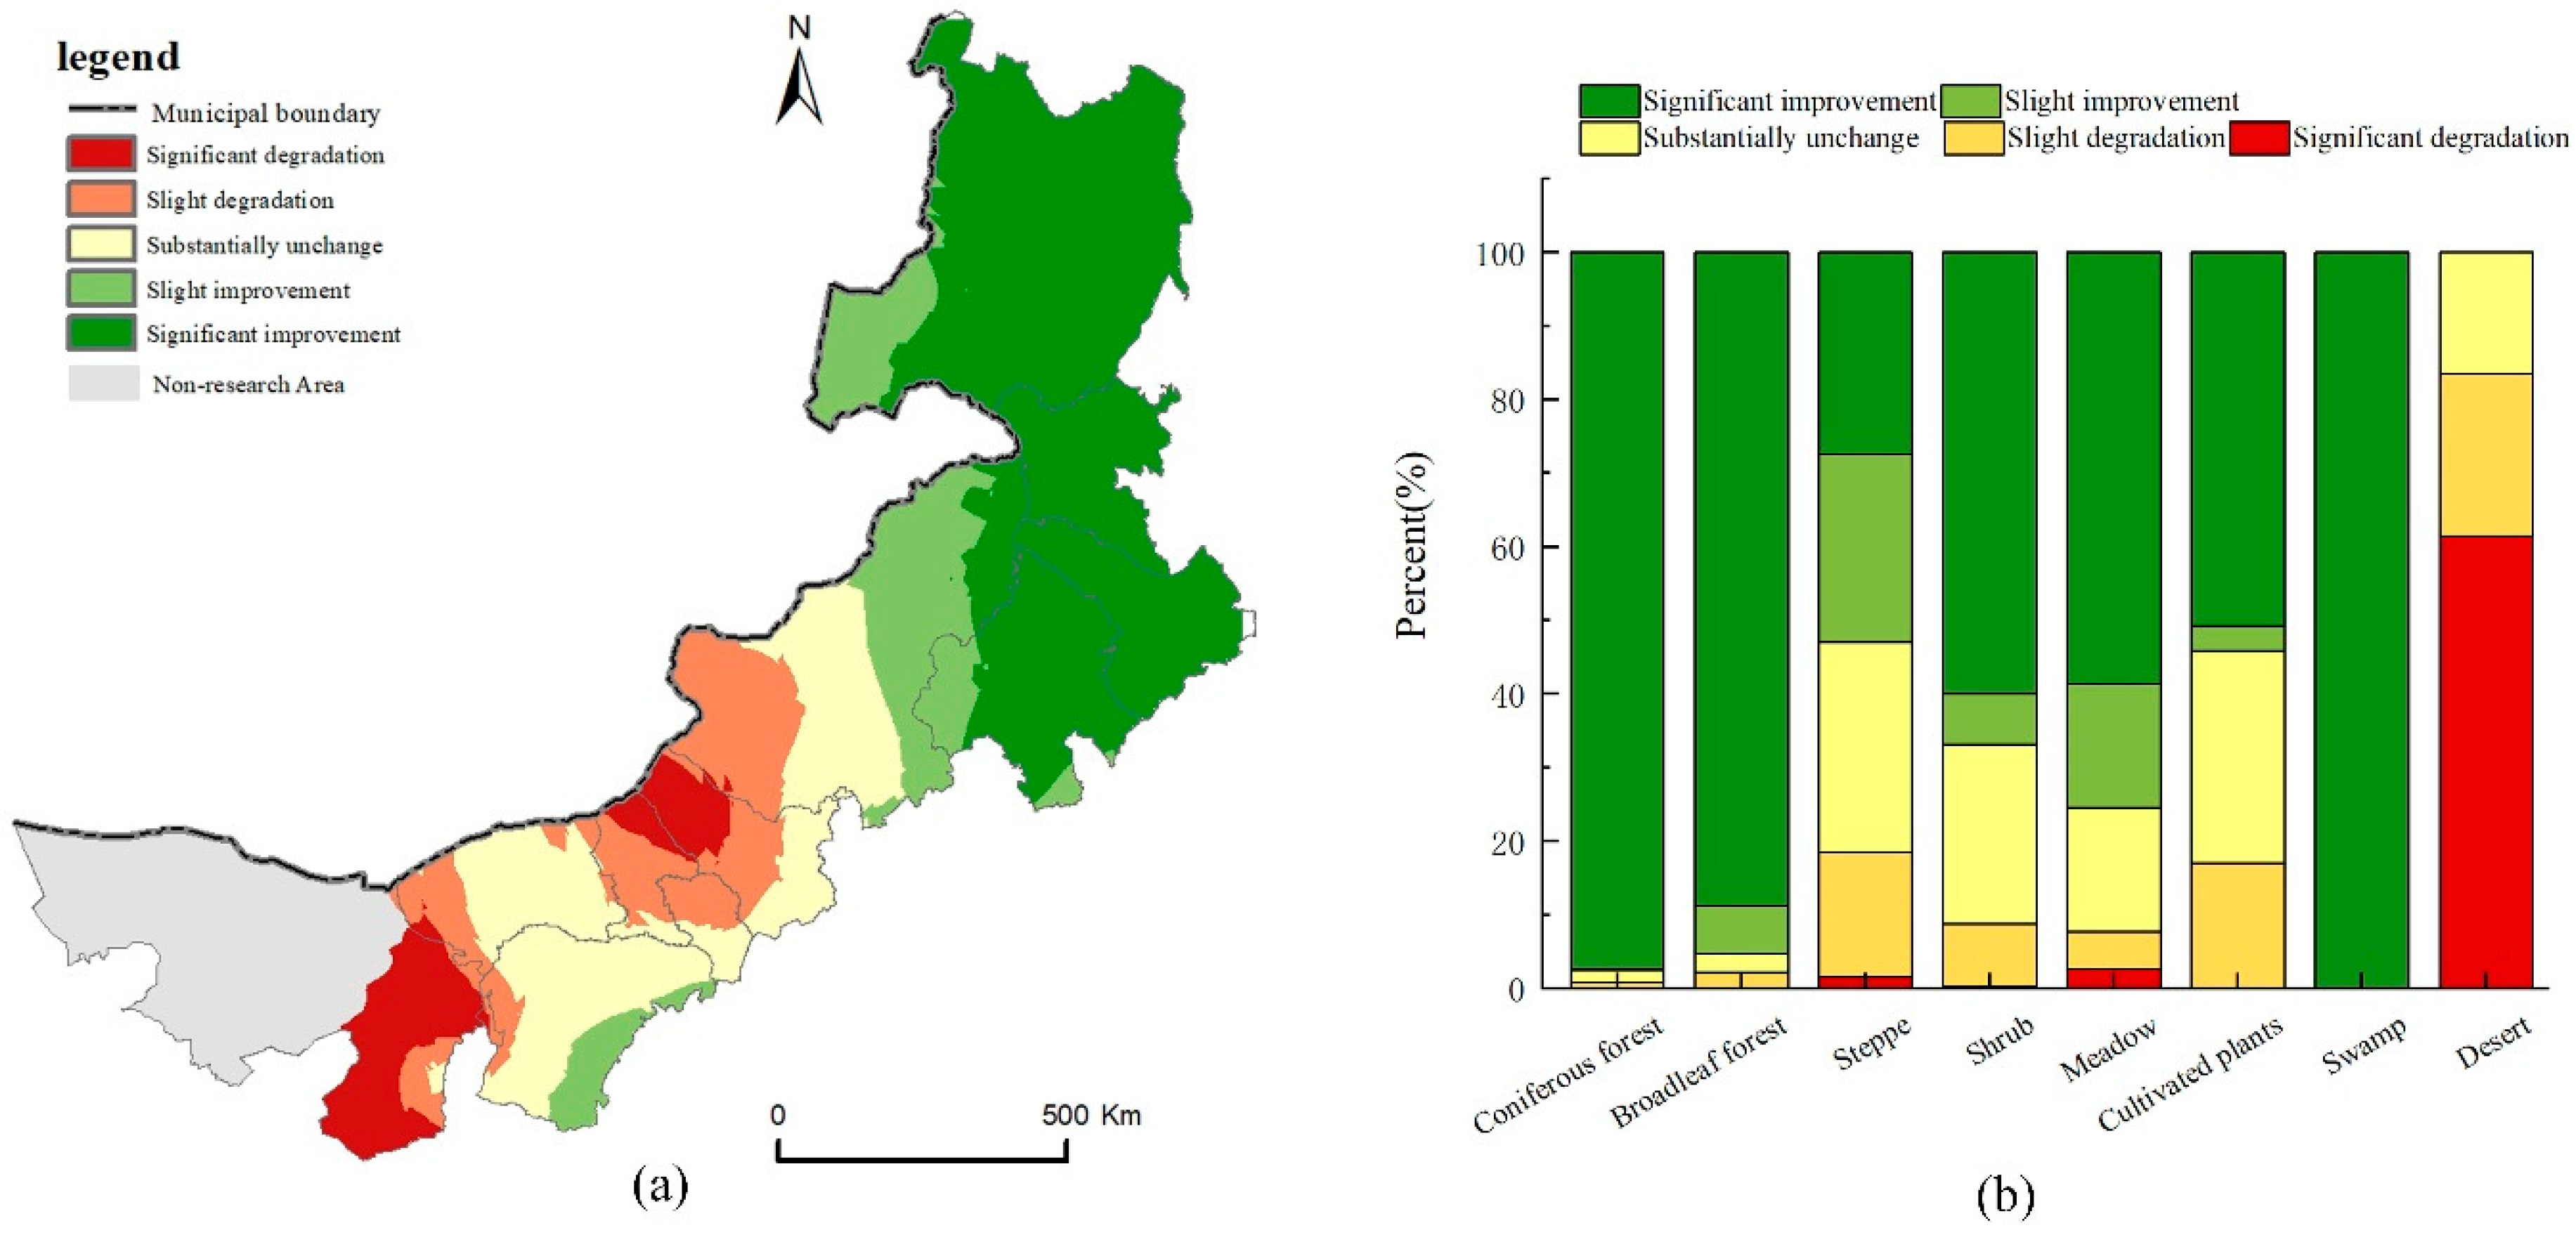
Trend analysis results show that (Figure 4a) there are significant differences in SPEI changes between the east and west of the study area. SPEI decreased with time significantly at a rate of −0.40~−0.25·(10a−1) in the west including Alxa Left Banner in Alxa League, Dorbod Banner in Ulanqab City, Darhan Muminggan United Banner in Baotou City, and Wuhai City, while SPEI increased significantly with time at a rate of change of 0.25~0.75·(10a−1) in Hulunbuir City, Hinggan League, Tongliao City, and the eastern part of Xilingol League. On the whole, the area with elevated SPEI was about 819,190 km2, accounting for 79.70% of the study area. The land cover in the study area was relatively high in grassland, desert, and cultivated vegetation, reaching 43.68%, 11.94%, and 11.07%, respectively. The area of marsh was the smallest, accounting for only 3.69%. There are significant differences in the spatial distribution of vegetation (Figure 4b). The results of the SPEI variation trend in different land cover types showed that the area with a significantly higher SPEI (SPEI > STD) accounted for about 44.10% of the study area. The increasing trends of SPEI in swamp, coniferous forest, and broad-leaved forest were the most obvious, accounting for more than 85%. These land covers were located in a high-latitude, low-altitude forest area. The area has a large amount of precipitation, abundant water resource, and a low probability of drought. About 93.12% of the area where SPEI dropped significantly was located in the desert, accounting for about 61.53% of the total desert area. In the past 20 years, the mean annual precipitation in the desert areas of Inner Mongolia was less than 150 mm. Under the high-temperature and high-evaporation climatic conditions, water loss became severe and terrestrial carbon productivity was restricted, leading to an increased risk of drought [40].

3.2. Identification of Main Control Factors

The factor detection and ecological detection show that (Table 4) precipitation was the most explanatory factor (q = 0.73). From the q-values (Table 4), we can see the top four impact factors in decreasing order were MP > Elevation > MAT > DTR, and all passed the significance test (p < 0.05). Slope, aspect, LUCC, AOPD, and DTC have lower explanatory power for drought.
SPEI rates of change (θslope) versus factor level for various factors were shown in Figure 5. We can see that θslope shows a decreasing trend (Figure 5a), with increasing factor level for factors MAT (X1), MSD (X4), DTR (X5), and elevation (X7). The elevation factor has the greatest influence on θslope when the factor level is low (≤2), while factors MAT and MSD have a larger impact at a high factor level (>4). The elevation increases from the first level (100~500 m) to the fifth level (1500~3500 m), and the θslope decreases from 0.58·(10 yr−1) to −0.02·(10 yr−1). Compared with other factors, the influence of DTR on θslope is approximately linear, and θslope drops to the lowest value (0.08·(10 yr−1)) in the DTR interval of 90~321.6 km. On the contrary, θslope shows an increasing trend (Figure 5c) with the increasing factor level of MP (X2), MWS (X3), and Slope (X9). Precipitation has the greatest impact on θslope. The amount of precipitation increases from level 1 (61.2~108.2 mm) to level 5 (262.6~305.8 mm), and θslope rises from −0.075·(10 yr−1) to 0.53·(10 yr−1). The relationship between θslope and any of the following factors, DTC (X6), aspect (X8), AOPD (X10), and POS (X11), does not show a significant linear trend (Figure 5b). When POS is at the second level (38~47%), θslope reaches a peak value. This may imply that appropriate amount of sand is conducive to the respiration of plant roots, retaining soil moisture, and transportation of nutrients. However, a percentage of sand that is too high can easily cause surface degradation, soil moisture loss, and soil erosion. DTC, aspect, and AOPD have much smaller variation ranges of θslope, which indicates that these factors have little influence on the change of SPEI rate. SPEI over most land cover types (X12) increased from 2000 to 2018, and SPEI decreased over only two land covers, in which cases water area was converted to construction area and unused land (Figure 5d). The θslope of the two land covers was −0.09·(10 yr−1) and −0.03·(10 yr−1), accounting for 0.1% and 11.5% of the study area, respectively. Among all land conversion types, the SPEI of unaltered forest land increased at the fastest rate 0.51·(10 yr−1).
Overall, the factors with strong explanatory power in the factor detector have a larger fluctuation range of θslope. The θslope values of factors such as MP, elevation, MAT, and DTR are in four ranges of −0.07~0.55, −0.02~0.58, −0.04~0.53, and −0.09~0.44·(10 yr−1), respectively. The change range of SPEI rate influenced by natural factors, such as meteorology and topography in the study area, was larger than that influenced by human factors.
The ranking of the influence by interacting pair of factors was given in Table 5. Only the precipitation ∩ DTC (X2X7) and wind speed ∩ elevation (X1X2) pairs of the first 15 interacting pairs showed nonlinear enhancement; the others were dual-factor enhancement. Among them, the influence by the interaction between precipitation and elevation is the strongest, with a q-value of 0.870, followed by that between temperature and precipitation; the interaction between wind speed and elevation has the lowest explanatory power, with a q-value of 0.686. As expected, precipitation is an important source of water and a crucial driving factor in the process of drought changes. The difference in precipitation between the east and west of Inner Mongolia contributes mainly to the spatial differentiation of drought condition. Elevation also has a strong explanatory power for drought. It is an important topographical factor for driving drought in Inner Mongolia, and it is also an important factor in combining other factors to form a drought spatial pattern.

3.3. Spatial Difference of Main Control Factors

The GWR model was used to perform spatial regression analysis on the four main controlling factors, i.e., MAT, MP, Elevation, and DTR, and local adjusted R2 and Akaike Information Criterion (AIC) as the evaluation indexes of the model fitting. Results show that the adjusted R2 of the GWR model is 0.88, and the AIC value is −540.58. The action direction of the factor is reflected by the sign of the coefficient of the fitting equation. A negative coefficient in an area and the absolute value of the coefficient indicate that the area is drought-stricken and the strength of the driving effect, respectively.
The effects of the two meteorological factors, i.e., temperature and precipitation, have significant spatial differences. The overall fluctuation ranges of the two are relatively large, and the regression coefficient intervals are (−1.20, 0.60) and (−1.4, 0.55), respectively. The area in drought driven by temperature accounted for about 70.2%, of which the areas with strong temperature driving (−0.6~−1.20) were mainly located in Alxa Left Banner of Alxa League, Wuhai City, Hanggin Banner and Otog Banner of Ordos City, Urad Rear Banner of Bayannur City, and parts of Xilingol League (Figure 6a). Due to the large temperature difference between the east and west of the study area (up to 12.7 °C), the surface vegetation in the western hot area had strong transpiration and respiration, and the dry matter consumption and soil water loss were larger, which further expanded the arid area [41,42]. The difference of the driving results between precipitation and temperature factors is mainly in the semi-arid grasslands (Figure 6b), such as Xilinhot City, West Ujimqin Banner and East Ujimqin Banner in Xilingol League. The average precipitation in the growing season in this region was greater than 150 mm, which was enough for the growth of vegetation such as grassland, shrubs, and other vegetation [43].
The influence of elevation mainly reflects the effect of the terrain. The GWR regression coefficient interval is (−1.25, 1.2), with the Great Khingan Range-Yin Mountains-Helan Mountains range as the boundary, and the SPEI driving coefficients on both sides are obviously different (Figure 6c). The central and western regions of Inner Mongolia (Alxa Left Banner, Dalate Banner, Zhungeer Banner, etc.) dominated by the Mongolian Plateau are generally higher than 1000 m in elevation, which has a significant effect on drought. The average GWR coefficient is −0.75. The eastern foothills of the Great Khingan Range-Yin Mountains and the southern foothills of Helan Mountains have lower average elevations, ranging from 100 to 500 m, and the average GWR coefficient is 0.5. The DTR factor reflects the water conservation within the basin, and the range of coefficient is the smallest (−0.17, 0.12). Due to low water conservation in Alxa League, Wuhai City, Ordos City, and Erguna in Hulunbuir City, the impact by DTR is shown in Figure 6d: the drought mitigation area driven by DTR is mainly located at the tributary of the Yellow River in Ordos City in the southwest of Inner Mongolia, Tabu River in Ulanqab City, and Dahei River (River inflow area), and the areas where Liaohe River, Songhua River, Nenjiang River, and other rivers adjacent to the Northeast Plain flow through.

4. Discussion

4.1. Driving Analysis of Drought in the Inner Mongolia

Drought is mainly caused by the imbalance of regional precipitation and evapotranspiration. We found that the change rate of SPEI during the growing season in Inner Mongolia from 2000 to 2018 ranged from −0.4 to 0.75·(10 yr−1), and the area with decreasing SPEI accounted for 20.3% of the total area. The areas where the SPEI increased significantly (θslope is between 0.25 and 0.75·(10 yr−1)) are mainly located in Hulunbuir City, Hinggan League, and Tongliao City. The distribution characteristics of SPEI shown in this study are similar to the results of previous drought monitoring based on long-term series [19,20]. The differences are mainly manifested in the areas such as Hinggan League and Tongliao City, where drought changes increased significantly. Around 2000, the SPEI time series of the Mongolian Plateau showed a significant turning point from increasing to decreasing [34,44]. The results of the Geodetector modeling showed that the SPEI change was driven by four main controlling factors: air temperature, precipitation, DTR, and elevation (Table 4) during the growing season in the study area. Precipitation is a direct factor in drought (q = 0.73). Relevant studies have shown that in arid and semi-arid areas, vegetation growth and ecosystem health status depend directly on atmospheric precipitation [45]. The interaction detection results show that the joint effect of precipitation and elevation has the most explanatory power (q = 0.87). Conclusions about attribution analysis of drought agreed with a previous study [36]. However, we considered the special climatic background of Inner Mongolia in this study of meteorological drought. The impact of elevation reflects the influence of topography on mass and energy transportation and distribution of temperature and water availability that affect regional ecosystems through altering vegetation species and distribution and the formation and evolution of regional climate [46]. According to the drought trend (Figure 4a) and the spatial distribution of the regression coefficient of SPEI with GWR model factors (Figure 6), it was found that significantly reduced SPEI at a rate of −0.40~−0.25·(10 yr−1) occurred in Alxa Left Banner in Alxa League, Dorbod Banner chain Ulanqab City, Darhan Muminggan United Banner in Baotou City, and Wuhai City in the western part of the study area. The drought in Alxa League and Wuhai City was caused by a synergy of hot air temperature, lack of precipitation, high elevation, and high DTR, while the drought in Ulanqab City and Baotou City was mainly caused by hot air temperature, lack of precipitation, and high elevation.

4.2. Variation of Explanatory Power of Factors in Different Elevations

Due to the large and high terrain environment of the Qinghai-Tibet Plateau in the region of the China-Mongolia Arid and Semiarid Area (CMASA), the lack of water vapor transported over the central and western Inner Mongolia has resulted in scarce precipitation [47]. The central and western part of the study area is dominated by plateaus and mountains. Due to the barrier and uplifting effects of the Great Khingan Range-Yin Mountains-Helan Mountains on water vapor, the eastern and southern piedmont of the mountains are the East Asian monsoon zone (elevation is about 150~500 m) and the west piedmont of the mountains is the non-monsoon zone (the elevation is generally higher than 1000 m).
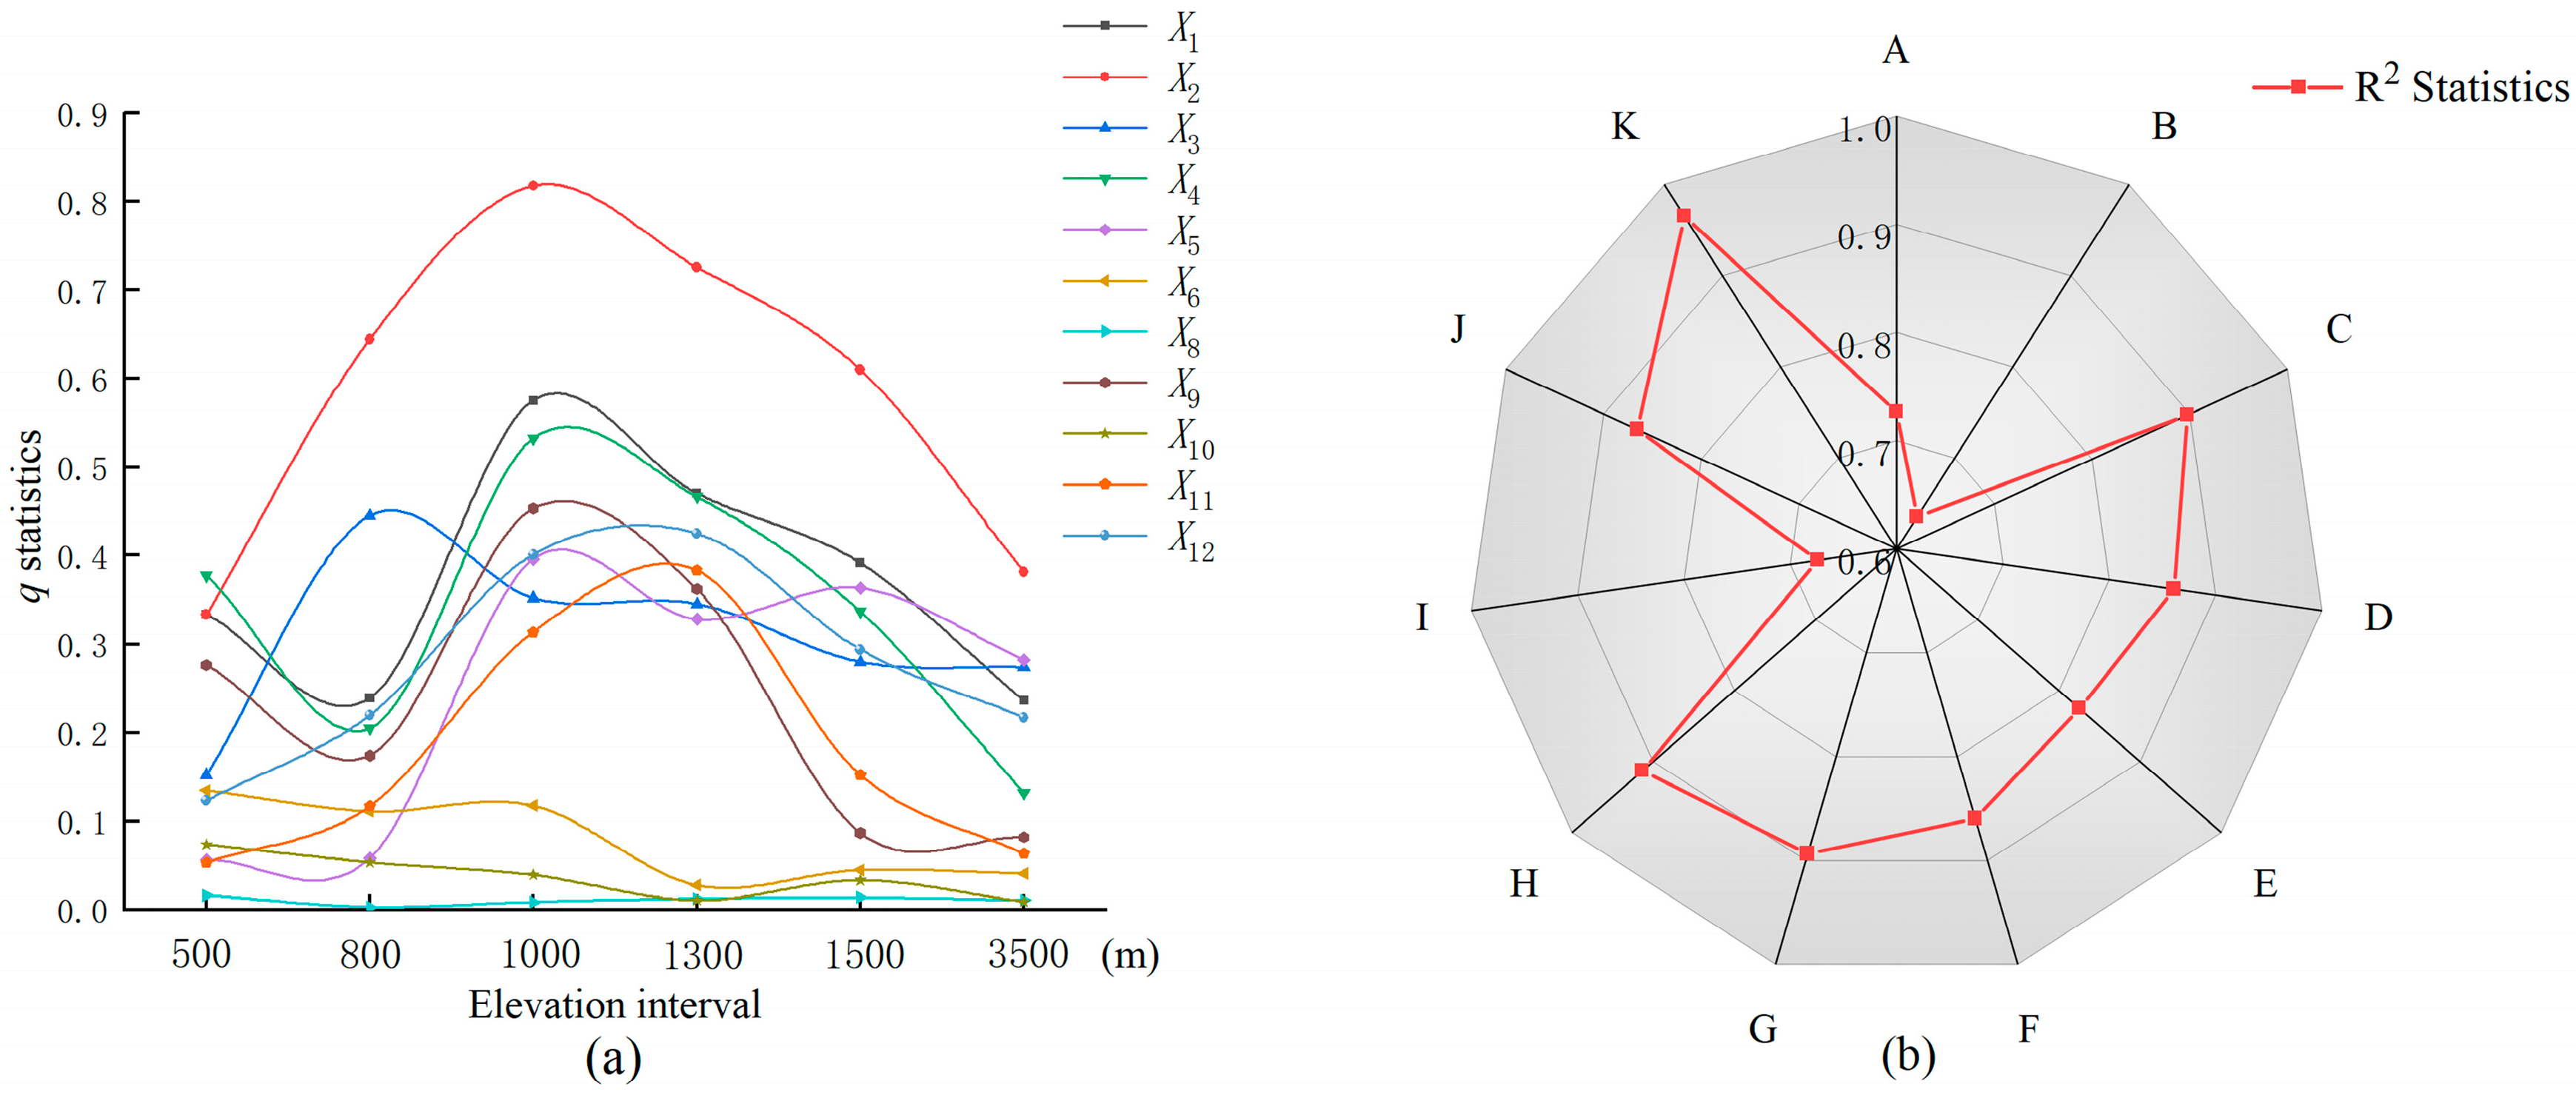
As an important terrain factor, elevation has a significant impact on the spatial correlation of factors. We found an interesting pattern to speculate the relative importance of environmental and anthropogenic factors in our study area by elevation gradients. As the statistical results of q-values of various factors in different elevation intervals (Figure 7a), in the 100–500 m elevation interval, the average precipitation (X1) in the growing season is 261.5 mm, and the q-value is the smallest. When the precipitation reaches a certain level, the impact of precipitation on SPEI decreases [48]. For the forest area, the ecological water storage is sufficient and the correlation between SPEI and sunshine duration (X4) is stronger. In the elevation range of 800~1000 m, the q-values of factors such as air temperature (X1), precipitation (X2), sunshine duration (X4), slope (X9), POS (X11), and LUCC (X12) increased significantly, indicating that the change in SPEI was mainly affected by natural factors and some human activities. When the elevation increases to 1000~1300 m, the q-values of POS (X11) and LUCC (X12) reach the maximum of 0.38 and 0.42, respectively, and the q-values of other factors show a downward trend. In the area above 1300 m in elevation, the explanatory power of all factors decreases significantly with increasing elevation.
It is worth mentioning that the conversion of land use types is an important influencing factor reflecting human activities, as well as an important explanatory factor for drought changes (Table 3). Between 2000 and 2018, in the 800~1300 m elevation interval, SPEI was significantly enhanced by the land use conversion. According to statistics, the land use types that account for the largest area in this elevation interval are unaltered woodland and unaltered grassland (Table 6), which account for 48.3% and 15.5% of the total area of the region, respectively. The growth rates of SPEI are 0.52·(10 yr−1) and 0.018·(10 yr−1), respectively, indicating that the series of ecological restoration projects such as “closing hills for afforestation and reforestation, retiring grazing and raising grass” implemented by the Chinese government in Inner Mongolia since 2000 have played an important role [49]. In addition, in the conversion of land use from unused land to grassland and from farmland to grassland, SPEI increased by 0.24 and 0.58, respectively, which alleviated the drought conditions in the area to a large extent (Figure 5d). The SPEI of the unchanged farmland increased by 0.57, and the SPEI growth rate was 0.019·(10 yr−1). This may be related to improvement in irrigation. Modern irrigation technology has improved the utilization rate of water resources and increased the field water holding capacity [50]. At the same time, grassland degradation caused by overgrazing and long-term abandonment of land aggravated the degree of drought [51,52]. For example, the grassland in the 800~1300 m elevation range was converted to unused land; as a result, the SPEI decreased by 0.42, while the SPEI of unaltered unused land decreased by 0.21.

4.3. Advantages and Limitations of GWR

The adjusted R2 value from the GWR model is 0.88, and the AIC value is −540.58. Compared with the OLS model (R2 = 0.54, AIC = −504.22), the AIC value is reduced by 36.36 and the degree of fit is higher, but there are regional differences. The regional statistics of R2 shows that (Figure 7b) the largest value occurred in Wuhai City, Inner Mongolia (K) R2 = 0.96, followed by Hohhot City (H) R2 = 0.92, and the two prefecture-level cities with the smallest R2 were Hinggan League (B) and Bayan. In Bayannur City (I), R2 is 0.64 and 0.67, respectively. The difference in the accuracy of regional fitting may be related to the influence of elevation changes on the distribution of other factors in the large east-west span of the study area. Areas with small R2 (A, B, I) have an average elevation of less than 800 m, and the average single factor q-value is 0.17. The average elevation of Wuhai City (K) and Hohhot City (H) are 1193 m and 1379 m, respectively, and the average q-value is 0.32 and 0.28, respectively. On the other hand, the area of each city is quite different, so is the statistical sample size, and the collinearity of the factors within the region may be another reason for the low fit in Hinggan League (B) and Bayannur City (I) [11,53,54].

4.4. Future Directions

Compared with traditional statistical models, we quantified the non-linear responses of independent variables and their interactions to SPEI change, without input of complex parameters. Further research may include: (1) using long-term SPEI data and more accurate PET calculation methods, such as the Penman and Hargreaves–Samani formula to produce more generalizable drought-driven results; (2) refining the spatial scale both horizontally and vertically, especially in eastern Inner Mongolia and western Mongolia, to generate results at higher resolutions.

5. Conclusions

Based on the multi-source data at the 110 meteorological stations, DEM, and vegetation types in Inner Mongolia and its surrounding areas, this study investigated the spatiotemporal variation of SPEI during the growing season in Inner Mongolia from 2000 to 2018. Through the introduction of time rate of change in SPEI, we used Geodetector and GWR models to screen the main controlling factors and then effectively quantified the impact of the factors on drought changes and the results are of great significance for drought-driven research. We made the following conclusions. (1) The SPEI in the growing season from 2000 to 2018 in Inner Mongolia showed a spatial variation pattern from dry west to wet east. The area with light drought accounts for the largest proportion in the whole region. (2) The inter-annual variation of SPEI shows an upward trend and the area of elevated SPEI accounted for 79.70% of the study area. These results indicate that the drought condition became alleviated with time during the growing season in Inner Mongolia. (3) The drought changes in Inner Mongolia were generally controlled by natural factors, with nonlinear interaction between factors enhancing drought impact. The aggravated drought in the central and western regions of the study area, such as Alxa League, Ulanqab City, Baotou City, and Wuhai City, were mainly driven by a synergy of hot air temperature, scarce precipitation, and high elevation, with significant impact from soil and LUCC at an elevation of 800~1300 m. The results from this study should be helpful for decision-making and management of regional water resources.

Author Contributions

Conceptualization, B.J.; formal analysis, Y.Q.; funding acquisition, G.Y.; methodology, M.Z.; software, M.L.; supervision, T.Z. and G.Y.; validation, X.Z.; visualization, Y.Q.; writing—original draft, B.J.; writing—review & editing, Y.Q., X.Z. and T.Z. All authors have read and agreed to the published version of the manuscript.

Funding

This research was funded by the National Natural Science Foundation of China (41801099), the second Tibetan Plateau Scientific Expedition and Research Program (2019QZKK0307), and the Key Research and Development Program of Sichuan (2022YFS0491).

Data Availability Statement

The meteorological data are available at http://data.cma.cn, accessed on 12 June 2022. The DEM are available at https://earthexplorer.usgs.gov/, accessed on 11 June 2022. The Population density data are available at https://landscan.ornl.gov/, accessed on 12 June 2022. The vegetation types data, land cover data, soil texture are available at https://www.resdc.cn/, accessed on 12 June 2022. Main rivers and county stations are available at http://ngcc.sbsm.gov.cn, accessed on 13 June 2022.

Conflicts of Interest

The authors declare no conflict of interest.

References

  1. Mishra, A.K.; Singh, V.P. A review of drought concepts. J. Hydrol. 2010, 391, 202–216. [Google Scholar] [CrossRef]
  2. Liu, D.; Ogaya, R.; Barbeta, A.; Yang, X.; Peñuelas, J. Contrasting impacts of continuous moderate drought and episodic severe droughts on the aboveground-biomass increment and litterfall of three coexisting Mediterranean woody species. Glob. Chang. Biol. 2015, 21, 4196–4209. [Google Scholar] [CrossRef] [PubMed] [Green Version]
  3. Ma, X.; Zhao, C.; Yan, W.; Zhao, X. Influences of 1.5 °C and 2.0 °C global warming scenarios on water use efficiency dynamics in the sandy areas of northern China. Sci. Total. Environ. 2019, 664, 161–174. [Google Scholar] [CrossRef]
  4. Ren, S.; Yi, S.; Peichl, M.; Wang, X. Diverse Responses of Vegetation Phenology to Climate Change in Different Grasslands in Inner Mongolia during 2000–2016. Remote Sens. 2018, 10, 17. [Google Scholar] [CrossRef] [Green Version]
  5. Wang, L.; Chen, W. Applicability Analysis of Standardized Precipitation Evapotranspiration Index in Drought Monitoring in China. Plateau Meteorol. 2014, 33, 423–431. [Google Scholar] [CrossRef]
  6. Steinemann, A. Drought indicators and triggers: A stochastic approach to evaluation. JAWRA J. Am. Water Resour. Assoc. 2003, 39, 1217–1233. [Google Scholar] [CrossRef]
  7. Musei, S.K.; Nyaga, J.M.; Dubow, A.Z. SPEI-based spatial and temporal evaluation of drought in Somalia. J. Arid Environ. 2020, 184, 104296. [Google Scholar] [CrossRef]
  8. Cook, B.I.; Smerdon, J.E.; Seager, R.; Coats, S. Global warming and 21st century drying. Clim. Dyn. 2014, 43, 2607–2627. [Google Scholar] [CrossRef] [Green Version]
  9. Vicente-Serrano, S.M.; Beguería, S.; López-Moreno, J.I. A Multiscalar Drought Index Sensitive to Global Warming: The Standardized Precipitation Evapotranspiration Index. J. Clim. 2010, 23, 1696–1718. [Google Scholar] [CrossRef] [Green Version]
  10. Rodrigues, M.; Jiménez-Ruano, A.; Peña-Angulo, D.; de la Riva, J. A comprehensive spatial-temporal analysis of driving factors of human-caused wildfires in Spain using Geographically Weighted Logistic Regression. J. Environ. Manag. 2018, 225, 177–192. [Google Scholar] [CrossRef]
  11. Caetano, J.M.; Tessarolo, G.; De Oliveira, G.; Souza, K.D.S.E.; Diniz-Filho, J.A.F.; Nabout, J.C. Geographical patterns in climate and agricultural technology drive soybean productivity in Brazil. PLoS ONE 2018, 13, e0191273. [Google Scholar] [CrossRef] [PubMed] [Green Version]
  12. Vicente-Serrano, S.M.; Beguería, S.; Lorenzo-Lacruz, J.; Camarero, J.J.; Lopez-Moreno, I.; Azorin-Molina, C.; Revuelto, J.; Morán-Tejeda, E.; Sanchez-Lorenzo, A. Performance of Drought Indices for Ecological, Agricultural, and Hydrological Applications. Earth Interact. 2012, 16, 1–27. [Google Scholar] [CrossRef] [Green Version]
  13. Drumond, A.; Gimeno, L.; Nieto, R.; Trigo, R.M.; Vicente-Serrano, S.M. Drought episodes in the climatological sinks of the Mediterranean moisture source: The role of moisture transport. Glob. Planet. Chang. 2017, 151, 4–14. [Google Scholar] [CrossRef]
  14. Hao, C.; Zhang, J.; Yao, F. Combination of multi-sensor remote sensing data for drought monitoring over Southwest China. Int. J. Appl. Earth Obs. Geoinf. 2015, 35, 270–283. [Google Scholar] [CrossRef]
  15. Jin, L.; Wang, Y. The Impact of Drought on Biomass of Forage Grass in Hulunbuir Grassland. Chin. J. Grassl. 2020, 42, 80–90. [Google Scholar] [CrossRef]
  16. Li, J.; He, Q.; Yao, J.; Hu, W. The characteristics of climate change and the impact factors analysis in the western part of Inner Mongolia. J. Arid. Land Resour. Environ. 2014, 28, 186–191. [Google Scholar] [CrossRef]
  17. Tang, Q.; Liu, Y.; Zhang, C.; Su, F.; Li, Y.; Gao, Y.; Li, W.; Chen, D. Research progress on moisture source change of precipitation over the Tibetan Plateau and its surrounding areas. Trans. Atmos. Sci. 2020, 43, 1002–1009. [Google Scholar] [CrossRef]
  18. Bailing, M.; Zhiyong, L.; Cunzhu, L.; Lixin, W.; Chengzhen, J.; Fuxiang, B.; Chao, J. Temporal and spatial heterogeneity of drought impact on vegetation growth on the Inner Mongolian Plateau. Rangel. J. 2018, 40, 113. [Google Scholar] [CrossRef]
  19. An, Q.; He, H.; Nie, Q.; Cui, Y.; Gao, J.; Wei, C.; Xie, X.; You, J. Spatial and Temporal Variations of Drought in Inner Mongolia, China. Water 2020, 12, 1715. [Google Scholar] [CrossRef]
  20. Pei, Z.; Fang, S.; Wang, L.; Yang, W. Comparative Analysis of Drought Indicated by the SPI and SPEI at Various Timescales in Inner Mongolia, China. Water 2020, 12, 1925. [Google Scholar] [CrossRef]
  21. Tong, S.; Lai, Q.; Zhang, J.; Bao, Y.; Lusi, A.; Ma, Q.; Li, X.; Zhang, F. Spatiotemporal drought variability on the Mongolian Plateau from 1980–2014 based on the SPEI-PM, intensity analysis and Hurst exponent. Sci. Total. Environ. 2018, 615, 1557–1565. [Google Scholar] [CrossRef] [PubMed]
  22. Qin, Y.; Zhang, T.; Yi, G.; Wei, P.; Yang, D. Remote sensing monitoring and analysis of influencing factors of drought in Inner Mongolia growing season since 2000. J. Nat. Resour. 2021, 36, 459–475. [Google Scholar] [CrossRef]
  23. Yang, Z.; Ning, L.; Jidong, W. Analysis of Drought and its Possible Causes in Inner Mongolia Region for Nearly 30 Years. J. Catastrophol. 2013, 28, 67–73. [Google Scholar]
  24. Psilovikos, A.; Tzimopoulos, C. Comparison of quadratic and non-linear programming (QP and NLP) optimization models in groundwater management. J. Hydroinformatics 2004, 6, 175–185. [Google Scholar] [CrossRef] [Green Version]
  25. Zhu, L.; Meng, J.; Zhu, L. Applying Geodetector to disentangle the contributions of natural and anthropogenic factors to NDVI variations in the middle reaches of the Heihe River Basin. Ecol. Indic. 2020, 117, 106545. [Google Scholar] [CrossRef]
  26. Wen, Q.; Sun, P.; Zhang, Q.; Yao, R. A multi-scalar drought index for global warming: The non-stationary stand-ardized precipitation evaporation index (NSPEI) and spatio-temporal patterns of future drought in China. Acta Geogr. Sin. 2020, 75, 1465–1482. [Google Scholar] [CrossRef]
  27. Zhu, X.; Huang, C.; Wu, B.; Su, H.; Jiao, W.; Zhang, L. Research on remote sensing drought monitoring by considering spatial non-stationary characteristics. Natl. Remote Sens. Bull. 2019, 23, 487–500. [Google Scholar] [CrossRef]
  28. Zhang, P.; Yang, D.; Zhang, Y.; Li, Y.; Liu, Y.; Cen, Y.; Zhang, W.; Geng, W.; Rong, T.; Liu, Y.; et al. Re-examining the drive forces of China’s industrial wastewater pollution based on GWR model at provincial level. J. Clean. Prod. 2020, 262, 121309. [Google Scholar] [CrossRef]
  29. Yang, Y.; Yang, X.; He, M.; Christakos, G. Beyond mere pollution source identification: Determination of land covers emitting soil heavy metals by combining PCA/APCS, GeoDetector and GIS analysis. CATENA 2019, 185, 104297. [Google Scholar] [CrossRef]
  30. Wang, J.; Xu, C. Geodetector: Principle and prospective. Acta Geogr. Sin. 2017, 73, 219–231. [Google Scholar] [CrossRef]
  31. He, D.; Yi, G.; Zhang, T.; Miao, J.; Li, J.; Bie, X. Temporal and Spatial Characteristics of EVI and Its Response to Climatic Factors in Recent 16 years Based on Grey Relational Analysis in Inner Mongolia Autonomous Region, China. Remote Sens. 2018, 10, 961. [Google Scholar] [CrossRef]
  32. Dobson, J.E.; Bright, E.A.; Coleman, P.R.; Durfee, R.C.; Worley, B.A. LandScan: A Global Population Database for Estimating Populations at Risk. Photogramm. Eng. Remote Sens. 2000, 66, 849–857. [Google Scholar]
  33. Yin, H.; Pflugmacher, D.; Li, A.; Li, Z.; Hostert, P. Land use and land cover change in Inner Mongolia—Under-standing the effects of China’s re-vegetation programs. Remote Sens. Environ. 2018, 204, 918–930. [Google Scholar] [CrossRef]
  34. Ming, B.; Guo, Y.; Tao, H.; Liu, G.; Li, S.; Wang, P. SPEIPM-based research on drought impact on maize yield in North China Plain. J. Integr. Agric. 2015, 14, 660–669. [Google Scholar] [CrossRef]
  35. Luong, N.; Hiep, N.; Bui, T. Investigating the Spatio-Temporal Variation of Soil Moisture and Agricultural Drought towards Supporting Water Resources Management in the Red River Basin of Vietnam. Sustainability 2021, 13, 4926. [Google Scholar] [CrossRef]
  36. Yang, S.; Quan, Q.; Liang, W.; Liu, T. Characteristics of Agricultural Droughts and Spatial Stratified Heterogeneity and Dependence of Dominant Factors in Inner Mongolia Autonomous Region, China. Atmosphere 2021, 12, 1249. [Google Scholar] [CrossRef]
  37. Reiche, M.; Funk, R.; Zhang, Z.; Hoffmann, C.; Reiche, J.; Wehrhan, M.; Li, Y.; Sommer, M. Application of satellite remote sensing for mapping wind erosion risk and dust emission-deposition in Inner Mongolia grassland, China. Grassl. Sci. 2012, 58, 8–19. [Google Scholar] [CrossRef]
  38. Jia, Y.; Cui, X.; Liu, Y.; Liu, Y.; Xu, C.; Li, T.; Ran, Q.; Wang, Y. Drought vulnerability assessment in Inner Mongolia. Acta Ecol. Sin. 2020, 40, 9070–9082. [Google Scholar] [CrossRef]
  39. Fotheringham, A.S.; Charlton, M.E.; Brunsdon, C. Geographically Weighted Regression: A Natural Evolution of the Expansion Method for Spatial Data Analysis. Environ. Plan. A 1998, 30, 1905–1927. [Google Scholar] [CrossRef]
  40. Alsafadi, K.; Al-Ansari, N.; Mokhtar, A.; Mohammed, S.; Elbeltagi, A.; Sammen, S.S.; Bi, S. An evapotranspiration deficit-based drought index to detect variability of terrestrial carbon productivity in the Middle East. Environ. Res. Lett. 2022, 17, 014051. [Google Scholar] [CrossRef]
  41. Piao, S.; Friedlingstein, P.; Ciais, P.; Zhou, L.; Chen, A. Effect of climate and CO2 changes on the greening of the Northern Hemisphere over the past two decades. Geophys. Res. Lett. 2006, 33, L23402. [Google Scholar] [CrossRef] [Green Version]
  42. Zhang, R.; Zhao, X.; Zuo, X.; Degen, A.A.; Li, Y.; Liu, X.; Luo, Y.; Qu, H.; Lian, J.; Wang, R. Drought-induced shift from a carbon sink to a carbon source in the grasslands of Inner Mongolia, China. CATENA 2020, 195, 104845. [Google Scholar] [CrossRef]
  43. Qiu, G.Y.; Xie, F.; Feng, Y.C.; Tian, F. Experimental studies on the effects of the “Conversion of Cropland to Grassland Program” on the water budget and evapotranspiration in a semi-arid steppe in Inner Mongolia, China. J. Hydrol. 2011, 411, 120–129. [Google Scholar] [CrossRef]
  44. Jin, L.; Zhang, J.; Wang, R.; Bao, Y.; Guo, E. Analysis for Spatio-Temporal Variation Characteristics of Droughts in Different Climatic Regions of the Mongolian Plateau Based on SPEI. Sustainability 2019, 11, 5767. [Google Scholar] [CrossRef] [Green Version]
  45. Brueck, H.; Erdle, K.; Gao, Y.; Giese, M.; Zhao, Y.; Peth, S.; Lin, S. Effects of N and water supply on water use-efficiency of a semiarid grassland in Inner Mongolia. Plant Soil. 2010, 328, 495–505. [Google Scholar] [CrossRef]
  46. Pan, T.; Wu, S.; He, D.; Dai, E.; Liu, Y. Ecological Effects of Longitudinal Range-Gorge Land Surface Pattern and Its Regional Differentiation. Acta Geogr. Sin. 2012, 67, 13–26. [Google Scholar] [CrossRef]
  47. An, C.-B.; Chen, F.-H.; Barton, L. Holocene environmental changes in Mongolia: A review. Glob. Planet. Chang. 2008, 63, 283–289. [Google Scholar] [CrossRef] [Green Version]
  48. Ukkola, A.M.; Prentice, I.C.; Keenan, T.F.; Van Dijk, A.I.; Viney, N.R.; Myneni, R.B.; Bi, J. Reduced streamflow in water-stressed climates consistent with CO2 effects on vegetation. Nat. Clim. Chang. 2016, 6, 75–78. [Google Scholar] [CrossRef] [Green Version]
  49. Mu, S.; Li, J.; Chen, Y.; Gang, C.; Zhou, W.; Ju, W. Spatial Differences of Variations of Vegetation Coverage in Inner Mongolia during 2001–2010. Acta Geogr. Sin. 2012, 67, 1255–1268. [Google Scholar]
  50. Shi, H.; Yang, S.; Li, R.; Li, X.; Li, W.; Yan, J.; Miao, Q.; Li, Z. Water-Saving Irrigation and Utilization Efficiency of Water and Fertilizer in Hetao Irrigation District of Inner Mongolia: Prospect for Future Research. J. Irrig. Drain. 2020, 39, 1–12. [Google Scholar] [CrossRef]
  51. Dregne, H.E. Desertification of Arid Lands. Econ. Geogr. 1977, 53, 322–331. [Google Scholar] [CrossRef]
  52. Julich, S.; Moorcroft, M.-A.; Feger, K.; van Tol, J. The impact of overgrazing on water fluxes in a semi-arid watershed—The suitability of watershed scale modeling in a data scarce area. J. Hydrol. Reg. Stud. 2022, 43, 101178. [Google Scholar] [CrossRef]
  53. Shrestha, A.; Luo, W. Analysis of Groundwater Nitrate Contamination in the Central Valley: Comparison of the Geodetector Method, Principal Component Analysis and Geographically Weighted Regression. ISPRS Int. J. Geo-Inf. 2017, 6, 297. [Google Scholar] [CrossRef]
  54. Zhao, R.; Zhan, L.; Yao, M.; Yang, L. A geographically weighted regression model augmented by Geodetector analysis and principal component analysis for the spatial distribution of PM2.5. Sustain. Cities Soc. 2020, 56, 102106. [Google Scholar] [CrossRef]
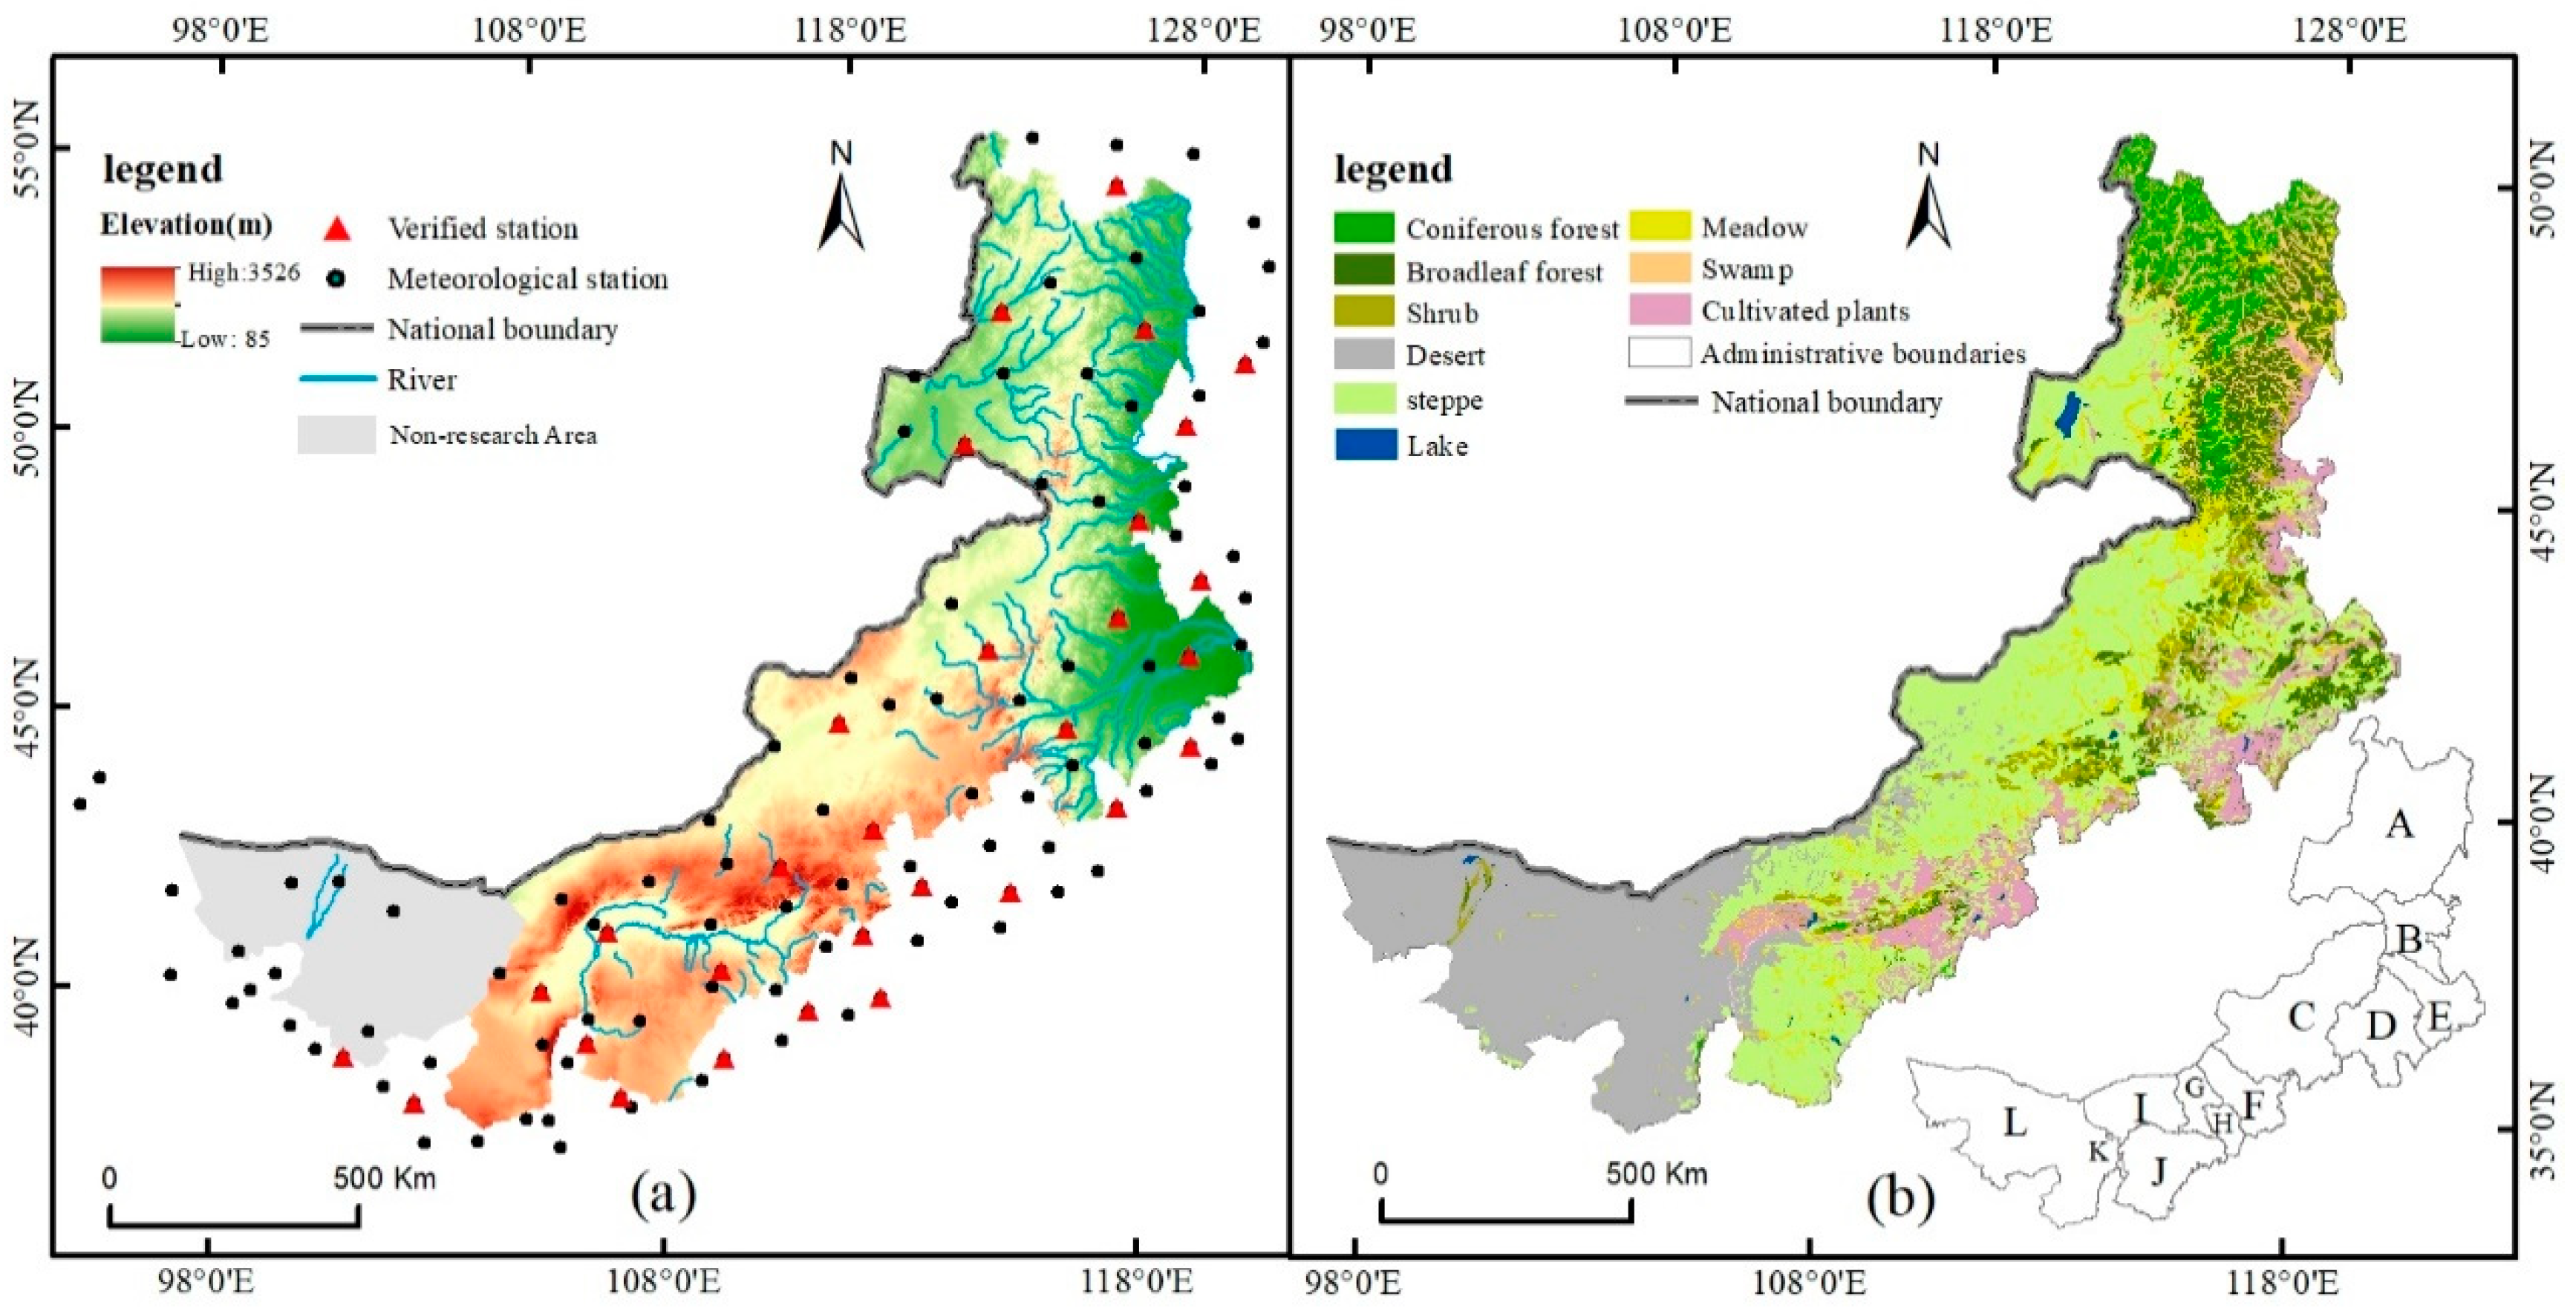
Figure 1. (a) The Digital Elevation Model (DEM) and meteorological station distribution, and (b) the vegetation types in Inner Mongolia (A—Hulunbuir, B—Hinggan League, C—Xilingol League, D—Chifeng, E—Tongliao, F—Ulangab League, G—Baotou, H—Hohhot, I—Bayannur League, J—Erdos, K—Wuhai, L—Alxa League).
Remotesensing 14 06007 g001
Figure 2. Factor grading (MAT(a), MP (b), MWS (c), MSD (d), DTR (e), DTC (f), Elevation (g), Aspect (h), Slope (i), AOPD (j), POS (k), LUCC (l) (CPL: CropLand; F: Frost; CRL: Crass Land; W: Water Area; COL: Construction Land; UL: Unused Land)).
Remotesensing 14 06007 g002
Figure 3. Spatial distribution of multi-year mean values of SPEI during the growing season in the study area from 2000 to 2018. (a) Longitude and elevation statistics. (b) Latitude and elevation statistics.
Remotesensing 14 06007 g003
Figure 4. (a) The distribution of SPEI trend and (b) area percent in different land cover type.
Remotesensing 14 06007 g004
Figure 5. SPEI’s variation trend with the influence of (a) MAT (X1), MSD (X4), DTR (X5), Elevation (X7); (b) DTC (X6), Aspect (X8), AOPD (X10), POS (X11); (c) MP (X2), MWS (X3), Slope (X9); (d) LUCC (X12) with their levels. The meanings of the land cover and land use codes for land use conversion types can be found in Figure 2.
Remotesensing 14 06007 g005
Figure 6. Distribution of the regression coefficient of SPEI with (a) MAT, (b) MP, (c) Elevation, and (d) DTR.
Remotesensing 14 06007 g006
Figure 7. The change in q statistics of influencing factors on SPEI along the gradient of Elevation (a) and R2 statistics of prefecture cities (b).
Remotesensing 14 06007 g007
Table 1. Drought classification based on SPEI.
SPEI ValueDrought
>1Severe wet
(0.5, 1]Moderate wet
(0, 0.5]Light wet
(−0.5, 0]Light drought
(−1, −0.5]Moderate drought
<−1Severe drought
Table 2. Independent variable interaction type.
Judgement ConditionInteraction
q ( x 1 x 2 ) < M i n ( q ( x 1 ) , q ( x 2 ) ) Non-linearly weaken
M i n ( q ( x 1 ) , q ( x 2 ) ) < q ( x 1 x 2 ) < M a x ( q ( x 1 ) , q ( x 2 ) ) Non-linearly weaken by one factor
q ( x 1 x 2 ) > M a x ( q ( x 1 ) , q ( x 2 ) ) Mutually enhanced
q ( x 1 x 2 ) = q ( x 1 ) + q ( x 2 ) Independent effect
q ( x 1 x 2 ) > q ( x 1 ) + q ( x 2 ) Non-linearly enhanced
Table 3. Change of drought area and proportion of various types of drought area in the study area from 2000 to 2018.
YearDrought Area
(Ten Thousand Km2)
Percentage of Study AreaPercentage of Light DroughtPercentage of Moderate DroughtPercentage of Severe DroughtSPEI
2000101.2599.6%23.28%73.10%3.62%−0.62
200196.4994.98%20.44%68.36%11.21%−0.68
200255.6054.79%73.00%20.60%6.39%−0.01
20037.747.62%100%000.66
200451.4050.59%60.17%39.82%0.02%0.03
200569.7468.65%33.45%30.38%36.17%−0.43
200665.5564.52%98.63%1.37%0−0.06
200784.1282.80%25.98%40.67%33.35%−0.59
200816.7416.48%96.58%3.42%00.29
200973.5972.43%35.96%53.26%10.78%−0.39
201066.5965.54%99.68%0.32%0−0.03
201162.5761.59%69.74%30.26%0−0.16
20126.116.01%90.94%9.06%00.77
201329.3228.86%52.46%26.51%21.03%0.51
201411.1911.02%100%000.36
201517.8717.59%99.99%0.01%00.37
201634.3733.80%100%000.19
201788.2786.88%28.08%49.06%22.86%−0.61
201873.4672.31%68.36%31.64%0−0.21
Annual average53.2652.39%74.34%18.89%6.7%0.03
Table 4. q statistics and ecological detector.
FactorTagp Value q-ValueRank
MATX10.050.433
MPX20.050.731
MWSX30.050.13
MSDX40.050.22
DTRX50.050.424
DTCX60.050.03
ElevationX70.050.532
AspectX8>0.10.01
SlopeX90.050.11
AOPDX10>0.10.06
POSX110.050.23
LUCCX120.050.26
Table 5. Influence of the interacting pairs of factors.
q = A B Results ComparisonInteraction TypeRank
X1 X2 = 0.852X1 + X2 > Max(X1, X2)Double-factor Enhance2
X1 X7 = 0.753X1 + X7 > Max(X1, X7)Double-factor Enhance8
X2 X3 = 0.846X2 + X3 > Max(X2, X3)Double-factor Enhance3
X2 X4 = 0.836X2 + X4 > Max(X2, X4)Double-factor Enhance4
X2 X5 = 0.742X2 + X5 > Max(X2, X5)Double-factor Enhance11
X2 X6 = 0.770X2 + X6 < X2 X6Nonlinear Enhance5
X2 X7 = 0.870X2 + X7 > Max(X2, X7)Double-factor Enhance1
X2 X9 = 0.745X2 + X9 > Max(X2, X9)Double-factor Enhance10
X2 X10 = 0.756X2 + X10 > Max(X2, X10)Double-factor Enhance7
X2 X11 = 0.751X2 + X11 > Max(X2, X11)Double-factor Enhance9
X2 X12 = 0.762X2 + X12 > Max(X2, X12)Double-factor Enhance6
X3 X7 = 0.686X3 + X7 < X3 X7Nonlinear Enhance15
X4 X7 = 0.737X4 + X7 > Max(X4, X7)Double-factor Enhance12
X5 X7 = 0.695X5 + X7 > Max(X5, X7)Double-factor Enhance14
X7 X10 = 0.703X7 + X10 > Max(X7, X10)Double-factor Enhance13
Note: Only the first 15 combinations are ranked.
Table 6. The area of specific land use conversion in 800~1300 m.
2000/2018
Unit: Km2
CroplandsForestsGrasslandsWater
Areas
Construction LandsUnused Lands
Croplands14,143.289
(3.5)
948.394
(0.2)
7180.634
(1.8)
464.368
(0.1)
1530.627
(0.4)
1758.953
(0.4)
Forests1357.162
(0.3)
61,982.534
(15.5)
17,312.724
(4.3)
00811.536
(0.2)
Grasslands5566.708
(1.4)
5677.182
(1.4)
193,072.543
(48.3)
1278.544
(0.3)
735.711
(0.2)
13,980.681
(3.5)
Water areas477.401
(0.1)
0952.564
(0.2)
2410.992
(0.6)
0986.008
(0.2)
Construction lands1372.649
(0.3)
159.97
(0.1)
1920.498
(0.5)
01092.653
(0.3)
492.902
(0.1)
Unused lands626.973
(0.2)
3200.702
(0.8)
14,295.369
(3.6)
871.862
(0.2)
117.173
(0.1)
43,698.632
(10.9)
Note: The numbers in parentheses are the percentage of specific land use conversion to the total area (%).
Publisher’s Note: MDPI stays neutral with regard to jurisdictional claims in published maps and institutional affiliations.