Abstract
The Taklamakan Desert and the Gobi Desert in East Asia constitute the second-largest sources of dust in the world. In particular, dust originating from the Gobi Desert is more susceptible to long-range transport, with consequent impacts in downwind Asian countries and the Northwest Pacific region. Two intensive dust events (the 3·15 dust event and the 3·28 dust event) were experienced in North China in March 2021. The 3·15 dust process was rated as the most intensive dust process in China in the past 10 years. In this study, by using a combination of spaceborne remote sensing datasets from geostationary and polar-orbiting satellites, ground-based columnar observations of aerosol optical parameters, meteorological reanalysis data, and backward trajectory simulations of air masses, the transport pathways and the three-dimensional structure characteristics of dust aerosols during the transport of the two dust events in March 2021 were cross-validated. The results of the study indicated that the two dust events were induced by the Mongolian cyclone. Due to the different configurations of the ground meteorological system conditions, a backflow process occurred during the 3·15 dust event transmission process. After passing over North China and the Bohai Sea, the direction of transport of the dust plume was reversed. The wind deflected from northwest to northeast, and the dust reached the eastern coastal areas of China and was finally deposited on land. The 3·28 dust event exhibited aerosol stratification in the transport path, the higher pure dust layer reached up to 9 km height, and the lower layer underwent aerosol mixing and became a polluted dust aerosol. This study implies that the investigation of dust aerosol transport and the deposition processes, the impact on the ocean, and the impact of marine aerosols on land also needs to be taken into consideration; the integration of advanced satellites and ground-based remote sensing data, the meteorological reanalysis data and the backward trajectories simulation, which complemented and verified each other, can enhance the ability to delineate the transport pathways and the three-dimensional structural characteristics of dust events.
1. Introduction
Dust storms are an essential manifestation of desertification and land degradation, contributing to significant environmental impacts [1]. According to estimates from various numerical models, about 2000 Mt of dust is emitted into the atmosphere each year, with approximately 75% being deposited on land and 25% deposited in the ocean [2,3,4,5,6,7]. Dust aerosols directly affect the radiation budget of the Earth system by scattering and absorbing solar radiation. Furthermore, as cloud condensation nuclei, dust also participates in the aerosol–cloud interaction and indirectly affects the climate system [8,9]. Thus, a better understanding of the aerosol properties of dust can reduce the uncertainty of aerosol radiative forcing. Another focus of dust research is to understand the effects of dust deposits on the new productivity of marine biomass and associated atmospheric-ocean carbon exchange [10]. The iron-containing dust is transported mainly from the great deserts through the atmosphere to the oceans, modifying the marine biogeochemical cycle and hence creating feedback on the climate and dust production [11]. Scientists have established the concept of the dust cycle in the context of the global biochemical cycle, where dust is one of the climate indicators. With the improved technology of dust monitoring and numerical simulation, understanding of the dust cycle’s physical mechanism is deepening, associated with the establishment of the quantitative analysis from the global perspective of the dust cycle [12].
Dust storms occur depending on the combined effects of surface conditions and meteorological factors [13]. Surface conditions, vegetation cover [14], soil, and topography [15] were the main factors affecting dust emission. Meteorological conditions such as wind speed, which is the essential factor, affect both the initial and transport process of the dust [16]. Other factors such as temperature, precipitation, and soil moisture [17,18,19] indirectly affect dust emissions by changing the surface condition of the dust source regions. The Taklimakan Desert (TD) and Gobi Desert (GD) are two major dust source regions in East Asia [20], acting as the second largest contributor to global dust aerosols [21]. The GD covers parts of northern China, northwestern China, and southern Mongolia, which are semi-arid regions. The strongly high-level northwestern flow over the GD and the loose surface are advantageous for ejecting and transporting the GD dust over East Asia [15]. Spring is the season with the highest dust frequency in East Asia; the main dust transport height is distributed at 2~4 km, the wind field at 700 hPa shows a pattern from northwest to southeast, and the dust plume forms a sand belt toward the east [22]. Dust and sand originating in the GD often pass through the Loess Plateau, North China, and, finally, extend to the Western Pacific [23].
Some large-scale field experiments in East Asia were also conducted, such as the 2001 ACE-Asia (Asian Pacific Regional Aerosol Characterization Experiment) [24,25,26,27,28,29,30], the East Asian Study of Tropospheric Aerosols and their Impact on Regional Climate (EAST-AIRC) in 2005 [31,32], The 2008 China–U.S. joint field experiment [33], and the Intercontinental Chemical Transport Experiment, Phase B (INTEX-B) during the spring of 2006 over the eastern Pacific Ocean. Through these field experiments, researchers carried out plenty of studies focusing on the transport and evolution of dust in East Asia [15,32,34,35,36,37,38,39], dust aerosol optical properties [33,40,41,42,43], the relationships between Asian aerosols and their climatic impacts [31,44,45], and the physicochemical characteristics of Asian dust [27,46,47,48]. On the other hand, the long-scale continuous satellite observations complement detailed (but sparse) in situ observations [49], and a complementary synergistic observation pattern has been established.
Satellite datasets were widely used to investigate the tempo-spatial distribution, vertical structures of dust aerosols [23,24,42], and the long-distance transport of Asian dust [23,39,50]. Active remote sensing measurements such as the Cloud-Aerosol Lidar with Orthogonal Polarization (CALIOP) onboard the Cloud-Aerosol Lidar and Infrared Pathfinder Satellite Observations (CALIPSO) satellite provide aerosol types and vertical structures on a global scale [51,52]. Analysis of the particulate depolarization ratio of CALIOP over a five-year period from 2007 to 2011 showed that the optical properties of the dust particles might change during the transport from the dust source region in East Asia to the Pacific Ocean due to mixing with pollutants or other types of aerosols from developed industrial regions [50]. By a synergetic analysis of space-borne CALIOP, ground-based Mie backscatter lidar observations, and Regional Atmospheric Modeling System (RAMS), springtime outflow of Asian dust and air pollutants patterns associated with different meteorological systems in East Asia were determined [53]. FY-4A (the first satellite in the FengYun-4 geostationary series) [54,55] and Himawari-8 [56,57,58] are both the new generation geostationary meteorological satellites. Continuous observations can provide new levels of capacity for identifying, tracking, and monitoring rapidly changing weather events. The dust test product from Fengyun-4A [59], 500 nm Aerosol Optical Depth (AOD), and Ångström exponent (AE) products based on Himawari-8 visible and near-infrared during the daytime are used to monitor Asian dust [58,60]. The recent boom in satellite-based observations (both polar-orbiting satellites and geostationary satellites) has provided ideal tools for identifying the distribution of dust aerosols with extensive spatial and temporal coverage [61].
The AErosol RObotic NETwork (AERONET) program provides highly accurate aerosol optical and physical properties for an increasingly extensive geographic distribution; the accuracy of the quality-assured point observation is considered a “ground truth” for most satellite and model comparison purposes [62,63,64,65,66,67]. Based on 12 AERONET site observations in China, aerosols are categorized into dust, mixture, strongly-scattering fine-mode particles, slightly absorbing fine-mode particles, moderate absorbing fine-mode particles, and high absorbing fine-mode particles [68]. Combined with the AERONET observation data and meteorological data, the variation in aerosol optical properties showed that a high AOD in Yulin was mostly from the Mu Us desert and deserts of West China and Mongolia in spring, and the impacts of anthropogenic pollutant particles from the middle part of China in the other seasons [69].
These previous efforts provided valuable and varying perspectives with satellite datasets, ground-based observations, or modeling results. However, every single observation system could only provide a partial picture of the tempo-spatial distributions, the transport characteristics, and the optical properties of the dust aerosol. A combination of ground-based observation and space-borne remote sensing is an effective method for studying aerosols’ spatial and temporal distribution characteristics. There is plenty of research focused on the characters and transport of Asian dust, which raised the question: What could we find that was new?
This study investigated two strong dust events that significantly influenced North China in March 2021. Scholars have carried out some research works on the weather dynamics [19], the transport process and optical properties [70,71], and an assessment of the impact produced on the environment [72] of these two intensive dust events. In our previous work, we studied the important role and impacts of transport paths on the growth of marine phytoplankton in northweastern Pacific [73], but the detailed examination of the three-dimensional characteristics of these dust events is lacking. In this study, we aim to reveal the full aspects of the occurrence and transport processes of the two spring dust events in East Asia. To achieve this goal, our strategy to integrate the observations was as follows: we used continuous observations from Himawari-8 geostationary satellites to obtain the spatial and temporal variation characteristics of dust aerosols; we used AERONET in situ observations as validation to obtain the distribution characteristics of dust aerosol optical properties along the dust transport pathway; the aerosol vertical profile products provided by CALIPSO polar-orbiting satellite were used to perform the variations in vertical structures of dust aerosols at the source region and the transport pathways; and finally, the weather dynamics features of dust events were analyzed using ERA-5 meteorological reanalysis datasets, and cross-validated using HYSPLIT backward trajectory simulations. As the object of the study was dust aerosols, we made full use of the depolarization ratio, which was a crucial indicator in identifying dust aerosols and other types of aerosols. Based on the above research strategy, the three-dimensional tempo-spatial distributions of the dust aerosol optical properties and transport processes of the two dust events were investigated.
Integrating multi-source observation datasets, which complemented and verified each other, and portraying the whole picture of the dust process as carefully as possible will provide a research basis for quantitative estimation of dust aerosols for further studies. Moreover, it can improve our understanding of the relationship between dust aerosols and the climate, atmosphere, and marine environment, as well as human health effects in East Asia.
2. Materials and Methods
2.1. AERONET Data
The AERONET uses the CE318 series of automatic sun photometers that could provide direct solar radiation observations, including 440, 675, 865, 940, and 1020 nm. In addition to 940 nm for the inversion of the column water vapor content, solar direct radiation observations in other bands are used to calculate AOD. It can also be combined with almucantar and main plane scanning observations to derive aerosol volume size distribution, Single Scattering Albedo (SSA), and other parameters [63,64,74]. The accuracy of AOD is 0.01~0.02 [40], and the inversion accuracy of SSA is approximately 0.03 [64]. The AERONET Level 1.5 database was defined as near-real-time automatic cloud screening and automatic instrument anomaly quality controls data. Cloud-screening procedures are designated to remove or reduce cloud-contaminated AOD measurements. After data quality control, the two principal threshold criteria (triplet stability criterion and smoothness criteria) were applied to identify the cloud. The procedure has been tested in different geographical and optical conditions, and results show that the algorithm eliminates from ~20% to 50% of the initial data depending on cloud conditions [75]. Thus, the Level 1.5 database was used in the study.
The daily averaged AOD, Fine Mode Fraction (FMF), Ångström Exponent, and SSA in four AERONET sites (Dalanzadgad, Beijing, Gwangju, and Osaka), as shown in Figure 1, were used to analyze the variations in the dust aerosol optical properties along with the transport pathways of the two dust events. AOD is a crucial parameter measuring the amount of aerosol extinction on a vertical column through the atmosphere. The Ångström exponent (AE) used for aerosol characterization and apportionment studies describes the dependence between AOD and wavelength. It is estimated from AOD measurements at two different wavelengths using Formula (1):
where and are the optical depth at wavelength and , respectively, and the has come to be widely known as the Ångström exponent. AE is inversely related to the average size of the particles in the aerosol: the smaller the particles, the larger the exponent, and vice versa. Therefore, the AE is often used as a qualitative indicator of aerosol distribution; values of indicate that the coarse-mode aerosols () were predominant, typically associated with dust and sea salt; and values of indicate that the fine-mode aerosols (0.5 ) were the predominant, usually associated with urban pollution or biomass burning [76,77]. SSA is the ratio of aerosol scattering to aerosol extinction (the sum of absorption and scattering). The closer the SSA value to 1, the greater the proportion of aerosol scattering to extinction, and vice versa.
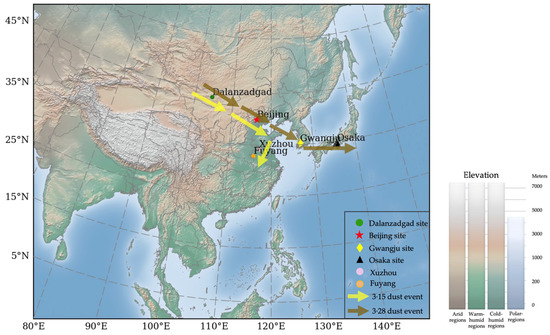
Figure 1.
Illustration of the two dust events in March 2021. The yellow arrows represent the pathway of the 3·15 dust event, and the brown arrows represent the pathway of the 3·28 dust event.
Aerosol particle volume size distribution () is an inversion product provided by AERONET. It is a function of particle size that can be expressed by a bimodal lognormal distribution as follows:
where index denotes fine () and coarse () modes of aerosol, the particle volume concentration, is the particle radius, is the median or geometric mean radius, is the standard deviation of each different mode, and is the number of lognormal aerosol modes [78].
2.2. Satellites Observations: Himawari-8, FY-4A, and CALIOP
Himawari-8 is a geostationary meteorological satellite that was successfully launched in 2014 by the Japan Meteorological Agency (JMA). By loading the Advanced Himawari Imager (AHI) sensor with 16 spectral channels, it can provide near-real-time observations over the East Asia and Western Pacific regions with high temporal resolution of 10 min for full disk scanning [56]. Considering that a wide range of cloud systems often accompanies dust events, high-resolution AOD products will experience a greater lack of pixels due to cloud contamination. We chose the AHI Level 2 daily average 500 nm AOD products with a spatial resolution of 5 km × 5 km. The full scene of AHI measurement was 80°E~160°W, 60°N~60°S. The JAXA (Japan Aerospace Exploration Agency) Himawari Monitor P-Tree System provides a data download service for registered users.
The FY-4A, launched on 11 December 2016, is a new generation of Chinese geostationary meteorological satellites. FY-4 has improved the weather and environmental monitoring capabilities, including having an Advanced Geosynchronous Radiation Imager (AGRI). The FY-4A Dust Test product (DSD) combines 12 widely used dust detection indices with the radiative properties measured by AGRI/FY-4A [55,79]. The probability density function and cumulative probability density function are calculated for different backgrounds, including clouds, dust, vegetation, and desert. A reliability index is attached to each dust index according to its threshold. The spatial and temporal resolution of the DSD product is 4 km × 4 km and 5 min, respectively. The National Satellite Meteorological Center provides a data download service for registered users.
The CALIOP is the primary instrument onboard the CALIPSO satellite; it is a dual-wavelength (1064 nm and 532 nm), polarization-sensitive elastic back-scatter lidar that measures vertical profiling of aerosols and clouds in the troposphere and low stratosphere [80]. The depolarization measurement enabled the discrimination between ice clouds and water clouds and the identification of non-spherical aerosol particles. The particulate depolarization ratio is a post-extinction quantity calculated from the ratio of the layer-integrated perpendicular and parallel polarization components of the particulate backscatter coefficient using Formula (3):
where and are perpendicular and parallel components of the particulate backscatter coefficient at 532 nm, respectively. The CALIPSO Lidar Level 2 Aerosol Profile V3-41 was used in this study. The Earth Science Data Systems Program provides open access to NASA’s collection of Earth science data.
2.3. ERA5 Meteorological Reanalysis Data
The ERA5 reanalysis dataset is the fifth generation of global atmospheric reanalysis published by the European Centre for Medium-Range Weather Forecasts (ECMWF). The ERA5 data assimilation system uses the current version of the Integrated Forecasting System (IFS Cycle 41r2), with several added features developed explicitly for reanalysis [81]. The conventional grid resolution is 0.25° × 0.25°, and the temporal resolution is one hour. The dataset can provide various atmospheric parameters at pressure levels and single levels. The assimilation of more probing data improves ERA5 reanalysis product accuracy, and higher spatial and temporal resolution weather field data can capture details of weather processes.
Geopotential at 500 hPa, vertical velocity, and divergence was accessed from the “ERA5 hourly data on pressure levels from 1959 to present” dataset; 10 m wind vector and mean sea level pressure was accessed from the “ERA5 hourly data on single levels from 1959 to present” dataset.
2.4. HYSPLIT Model
The online Hybrid Single-Particle Lagrangian Integrated Trajectory (HYSPLIT), model developed by NOAA’s Air Resources Laboratory was used to investigate the pathways of dust plumes. In order to investigate the sources and transport of dust plumes, 48 h back trajectories were calculated at 500 m, 1500 m, and 3000 m above ground level (AGL) for the two dust events. On the other hand, 48 h back trajectories ending on 17 March were calculated at 500 m, 1000 m, and 1500 m AGL for the 3·15 backflow process. The gridded data of the Global Data Assimilation System (GDAS) with a horizontal resolution of 1° × 1° provided by the National Centers for Environmental Prediction (NCEP) were used in the calculation.
3. Results and Discussion
3.1. Aerosol Optical Properties
3.1.1. In Situ Observations
In March 2021, the vast area of northern China experienced two strong dust events on 14–18 March (3·15 dust event) and on 26–30 March (3·28 dust event). According to the analysis in Section 3.3, the two dust events were generated and developed led by the Mongolian cyclone. Seven AERONET sites from four cities were alone with the trail of the Mongolian cyclone: Dalanzadgad (43.58N, 104.42E) in the Republic of Mongolia, three stations in Beijing, China (Beijing (39.98N, 116.38E); Beijing-CAMS (39.933N, 116.317E); Beijing_RADI (40.005N, 116.379E)), Gwangju_GIST (35.23N, 126.84E) in South Korea, and Osaka (34.65N, 135.59E) in Japan. Due to the backflow process of the 3·15 dust event, the weather service reported that dust was observed in Xuzhou (34.26N, 117.20E), Jiangsu province, and Fuyang (32.89N, 115.81E), Anhui province. Therefore, these two sites were selected to monitor the properties of the dust backflow. The locations of these monitoring sites are shown in Figure 1.
Figure 2 presents the aerosol optical properties of AERONET from 13 to 31 March 2021. The red and blue blocks in the figure correspond to the two dust events. The Dalanzadgad site is located south of Ulaanbaatar, which is the capital of the Republic of Mongolia. The Dalanzadgad site is near the northern edge of the GD. Thus, the aerosol composition was mainly sand and dust at the site. The FMF values were below 0.4 except on 20 March, indicating that the coarse-mode particles were predominant. The AE values were almost below 0.6, significantly lower than the average AE of the other three sites.
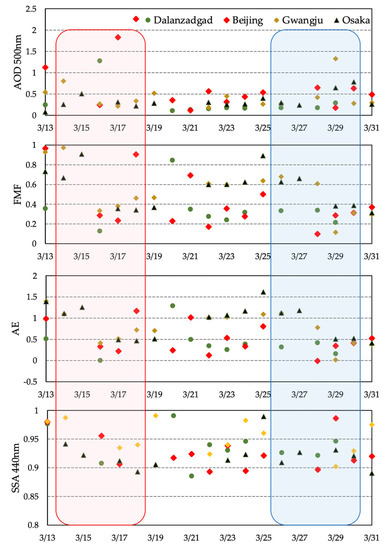
Figure 2.
Time series of aerosol optical properties at four AERONET sites from 13 March to 31 March 2021. Optical parameters from top to bottom: 500 nm AOD; FMF; AE; and SSA 440 nm.
On 13 March (before Beijing was impacted by dust), the AOD, FMF, and AE values at the Beijing site were approximately 1.09, 0.95, and 0.99, respectively, which indicated that fine-mode particles were predominant. This was also confirmed by the volume size distribution in Figure 3b. On 17 March, the AOD value increased to 1.82, the FMF value was only 0.24, and the AE value was 0.22, indicating that dust coarse-mode particles were predominant. From 14 to 15 March, the dust in Beijing was accompanied by the cloud layer, and the AERONET data were unavailable. During the 3·15 dust event, maximum (minimum) values of AOD (AE) were 0.80 (0.41) and 0.51 (0.46) at the Gwangju site and Osaka site, respectively; FMF values dropped from 0.98 to 0.34 (Gwangju site) and 0.90 to 0.34 (Osaka site). Compared with the aerosol optical parameters at the Beijing site, AOD values were lower, and the size of aerosol particles was smaller. However, increases in dust aerosol loading were also significant in Gwangju and Osaka during the 3·15 dust event.
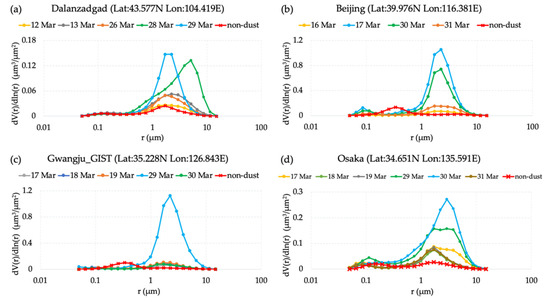
Figure 3.
Aerosol volume size distribution at four AERONET sites: (a) Dalanzadgad site; (b) Beijing site; (c) Gwangju site; and (d) Osaka site during the two dust events. Lines with a solid circle are dust days, and red lines with an “×” label are non-dust days.
During the 3·28 dust event, AOD, FMF, and AE at the Beijing site were approximately 0.50, 0.10, and −0.01 on 28 March, respectively. The negative AE is due to a higher AOD in the longer wavelengths, indicating the presence of dust particles. Substantial increases in the AOD were also observed; the maxima of the AOD reached 1.33 on 29 March and 0.78 on 30 March at the Gwangju site and Osaka site, respectively. The FMF and AE of the two sites decreased after 28 March. The AE (FMF) value decreased from 1.11 (0.68) on 26 March to 0.01 (0.12) on 29 March at the Gwangju site and from 1.17 (0.66) on 27 March to 0.56 (0.39) on 30 March at the Osaka site, which indicated that coarse-mode dust particles were predominant.
Table 1 shows the average values of the AOD, AE, and SSA during the two dust events and the other days of March 2021. Compared with the other days of March, the SSA showed a lower value during the dust period. As for the daily average value of SSA, it decreased from 0.98 on 13 March (non-dust) to 0.90 on 17 March (dust) at the Beijing site, from 0.98 on 24 March (non-dust) to 0.90 on 29 March (dust) at the Gwangju site, and from 0.99 on 25 March (non-dust) to 0.92 on 30 March at the Osaka site. The decrease was caused by the absorption of dust aerosol at the ultra-violet and blue bands.

Table 1.
Average values of AOD AE and SSA during dust period and other days in March at four AERONET sites.
Figure 3 shows the daily average volume size distribution at four sites during the two dust events (lines with a solid circle). Meanwhile, the volume size distribution on the non-dust day (red line with an “×” label) was used as a comparison. During the two dust events (14–18 March, 26–30 March), the volume concentration of the coarse-mode aerosol (particle radius greater than 1μm) increased significantly, corresponding to a peak radius of aerosol particle volume size distribution centered at 4~5 μm at the Beijing, Gwangju and Osaka sites, and even as high as 7 μm at Dalanzadgad site.
3.1.2. Satellite Observations
AE was calculated from the spectral dependence of the AOD and influenced by aerosol particle size. One criterion used to determine dust and no-dust over the land by using the AOD and AE from MODIS deep blue retrievals was as follows: for dust over the land, pixels with dust were defined as an AOD greater than 0.5 and AE less than 0.5; for no-dust over the land, the AOD had to be less than 0.2, and AE had to be greater than 1.0 [82]. Combined with AHI/Himawari-8 500 nm AOD and AE products (Figures S1 and S2), the high AOD value (AOD > 1.2) regions in red boxes corresponding the low AE value (AE < 0.8) regions were identified as the dust aerosol in the source regions and the transport pathways.
Based on the location of the dust over time during the two dust events, it can be seen that both of the two dust events were originated in the Gobi Desert and transported in a southeasterly direction, affecting northern China and the Huanghuai regions and East China. However, there are also some differences in the transport pathways of the two dust processes. Compared with the 3·15 dust event, the 3·28 dust event showed a southeastward transport pathway from Mongolia to China, but the dust extended to the Yellow Sea, the Korean Peninsula, and the Sea of Japan and reached the vicinity of Honshu Island in Japan. The dust plume was observed in the Northwest Pacific region within the range of 120°E to 150°E.
Considering that dust was transported from northwest to southeast, a 25-point moving average (5 × 5 points) of the AOD was calculated in the sections of latitude at 40°N and 35°N in the two dust events (Figure 4). The red dash boxes in Figure 4 indicate areas affected by dust plumes, including North China and the Northwest Pacific. Figure 4a shows that the AOD at 40°N latitude on 15 March varied between 1.0 and 3.0 in the region of 110°E to 120°E (northern Shanxi Province–central Hebei Province–Beijing–northeastern Hebei Province). On 16 March (Figure 4b), the AOD values on the cross-section of 35°N latitude fluctuated from 0.5 to 1.0 between 125°E and 140°E (central and Eastern Yellow Sea–southern Korea–Honshu, Japan), with a small peak of 1.4 near 133°E. On 28 March (Figure 4c), the AOD ranged from 1.5 to 4.5 between 117°E and 127°E (Beijing–northern Bohai Sea–southern Liaoning Province). On 29 March (Figure 4d), a high value of AOD (AOD > 1.0) was observed in the region of 125°E~135°E (Yellow Sea–southern Korea–Honshu, Japan). It was found that the dust plumes of 3·28 dust event reached the Yellow Sea and the Sea of Japan on 29 March.
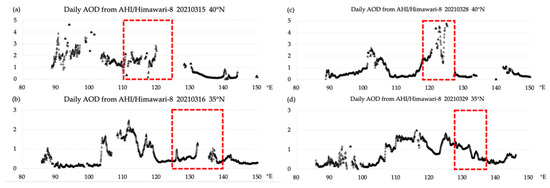
Figure 4.
Daily average 500 nm AOD from AHI/Himawari-8. AOD values were 25-point moving average on cross-section of (a) 15 March at 40°N, (b) 16 March at 35°N, (c) 28 March at 40°N, (d) 29 March at 35°N.
3.2. Three-Dimensional Characteristics of the 3·28 Dust Event
Figure 5 illustrates the 3D structure of the 3·28 dust event using cross-sections of the aerosol subtype products, depolarization ratio products, and extinction coefficient 532 nm obtained by CALIOP on 26, 27, 29, and 30 March 2021. According to the dust component in the subtype cross-section (full figures were shown in Figure S3), the schematic diagram of the 3·28 dust event transport path could be plotted (yellow arrow on Figure 5a).
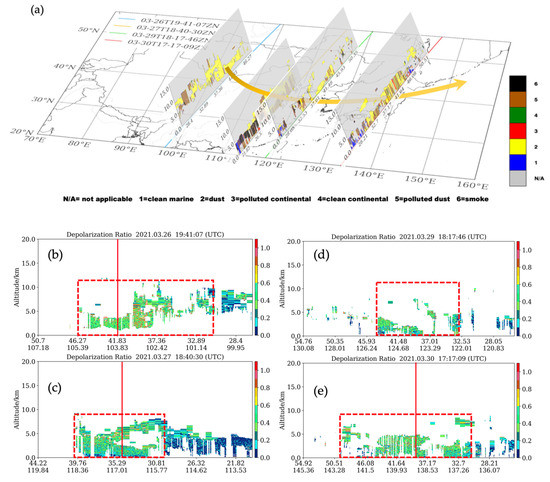
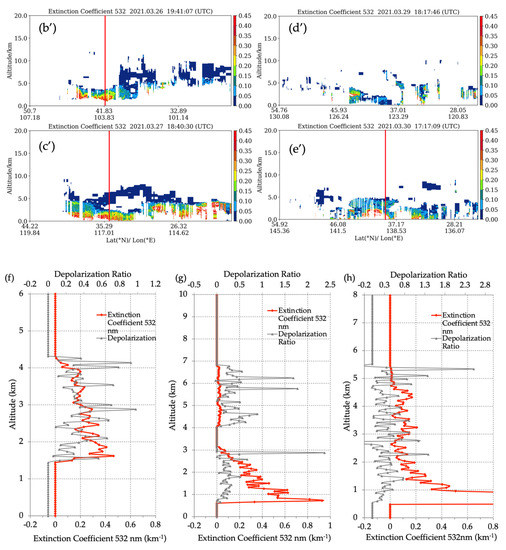
Figure 5.
Illustration of 3·28 dust event transport path, originating in GD on 26 March and transported to the Sea of Japan on 30 March. (a) The vertical cross-section of the aerosol subtype overlapping the CALIPSO orbit; (b–e) The cross-section of the CALIOP depolarization ratio on 26, 27, 29, and 30 March 2021, respectively; (b’–e’) The cross-section of the CALIOP extinction coefficient 532 nm on 26, 27, 29, and 30 March 2021, respectively; (f–h) The vertical profile distribution of the extinction coefficient 532 nm and the depolarization ratio for the three positions labeled by red line, position correspondence: (f–b,b’), (g–c,c’), (h–e,e’).
According to Figure 6a, the cross-section of the aerosol subtype on 26 March showed that the source of the 3·28 dust event was the GD. Dust was detected in the GD region in the south of the Republic of Mongolia and the northeast of Qinghai Province, the Qilian Mountains, the Hexi Corridor in central Gansu, and the Badain Jalan Desert in Alxa league of Inner Mongolia in China. As the topography of Qinghai Province and the Qilian Mountains is above 2000 m, the height of the dust layer was much higher than that in Inner Mongolia and the Republic of Mongolia.
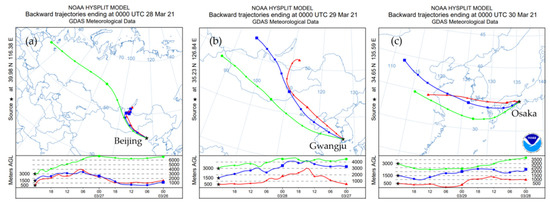
Figure 6.
Backward trajectories from HYSPLIT model at different locations during 28 to 30 March 2021: (a) 48 h back trajectories ending at Beijing on 28 March; (b) 48 h back trajectories ending at Gwangju on 29 March; (c) 48 h back trajectories ending at Osaka on 30 March.
The depolarization ratio of dust aerosols was high due to the non-sphericity of dust particles. The mean dust particulate depolarization ratio was ~0.25 [52]. Figure 5b–e shows the altitude–orbit cross-section of the depolarization ratio, and Figure 5b’–e’ show the extinction coefficient of the CALIPSO. We selected three positions on the 3·28 dust transport pathway and calculated the depolarization ratio and the extinction coefficient vertical profile to reveal the variations in the dust structure during transmission. Figure 5b,c,e illustrates the location of the three positions with a red line, and Figure 5f–h shows the vertical profiles at the three positions.
From Figure 5f, the position is in the GD area; the pure dust aerosol distributed from the surface (the elevation of the dust source region was above 1 km) to 4.3 km. The near-surface extinction coefficient was higher than 0.4 km−1 and decreased with height. Values of the depolarization ratio of pure dust ranged from 0.3 to 0.6.
From Figure 5g, at the position located in North China, aerosols over this position were divided into two layers. From the surface to 3 km, the polluted dust was a mixture of pure dust and smoke particles generated from biomass burning. The depolarization ratio values of the polluted dust layer were concentrated in the range of 0.2–0.3. The near-surface extinction coefficient values were higher than 0.9 and decreased rapidly with height. The pure dust layer in the upper air was from 4 to 7 km. The depolarization ratio values were concentrated in the range of 0.2–0.6, and the extinction coefficient values were concentrated in the range of 0.01–0.02 km−1. The extinction coefficient values decreased significantly, indicating that only a small amount of dust from the source region could be transported to North China.
From Figure 5h, the position located in the north of Japan, aerosols mixed with pure dust, polluted dust, and polluted continental subtype. The mixture was distributed from the surface to 5.5 km. The extinction coefficient values decreased with height, and the depolarization ratio values concentrated in the range of 0.2–0.4 because the dust mixing with other types of aerosols resulted in a reduced non-sphericity of particles.
As can be seen from Figure 5a, the dust was generated from the source region (GD) on 26 March. After being transported to North China, aerosols stratified into a pure dust layer and polluted dust layer on 27 March. On 29 March, the dust plume passed over Liaoning province, the Bohai Sea, and the Yellow Sea, and the dust appeared below 5 km. On 30 March, pure dust and polluted dust could be found at a height of 0–5 km in the Sea of Japan and Honshu Island.
According to the analysis of aerosol subtype products, the depolarization ratio, the extinction coefficient, and the vertical profiles provided by CALIPSO, the path starting from the dust source region and transport direction can be illustrated in Figure 5a by the yellow arrow.
The Beijing, Gwangju, and Osaka sites were selected to conduct backward trajectory simulation with HYSPLIT. From Figure 6a, the air mass originated from the vicinity of Lake Baikal and traveled from northwest to southeast, across through the Mongolian Plateau, the Gobi region in southern Mongolia, and the Loess Plateau before arriving at Beijing. At the Gwangju site in Korea and the Osaka site in Japan, the air mass movement showed good consistency with that in Beijing from 26 March to 30 March, which showed a similar path to that indicated by the dust transport arrows by CALIPSO products in Figure 5a.
3.3. Synoptic Features
According to data from National Climate Center, China Meteorological Administration, the average temperature in Mongolia and northern China was 1–2 °C higher than the climatical mean from early January to March 2021 [19]. The rank of the precipitation amount was the second (third) most minor during 2011/12–2020/21 (1979/80–2020/21), and there was no effective precipitation in the entire period from 1 December 2020 to 15 March 2021, which resulted in dry soil [19]. In addition, in the past 20 years, the vegetation has decreased significantly in the southern part of Mongolia, and large areas of bare land provided favorable sand source conditions for the generation of dust weather. The vigorous development of the Mongolian cyclone provided powerful dynamic conditions for the dust weather, and the dry and loose surface provided an abundant source of dust aerosols. Therefore, severe dust events in March generated and developed in the GD, and dust particles were transported into North China.
The sea level pressure (SLP) overlapped with the 10-m wind vector and the 500 hPa geopotential height (GH) during the 3·15 dust event. The 3·15 and 3·28 dust events are shown in Figure 7a–d and Figure 8a–d, respectively. Figure 7e–j and Figure 8e–j present the cross-sections of vertical velocity and divergence on the dust path during the two dust events. Before the dusty weather formed, there was an apparent trough at 500 hPa in west Mongolia (Figure 7a and Figure 8a). At the same time, there were two low-pressure centers on the surface, located at 110°E, 50°N (Figure 7a) and 95°E, 50°N (Figure 8a). The pressures of the lowest centers were approximately 990 hPa in the 3·15 dust event (Figure 7a) and 995 hPa in the 3·28 dust event (Figure 8a). The 10-m wind speed exceeded 10 m/s around the low-pressure center. Strong wind is supposed to be one of the essential conditions of dust uplift. The divergence is the horizontal divergence of velocity. The solid black contour represents the positive divergence for air that is spreading out; the dashed contour represents the negative divergence for air that is converging. From the cross-sections in Figure 7e, the vertical velocity was positive in the slice of 94°E~96°E, which means that the airflow exhibited a downward motion. Furthermore, at the height of 775 hPa of this downdraft, positive divergence occurred in the lower levels, and negative divergence occurred in the upper levels; the vertical structure of the air mass was “convergence aloft, divergence below” which resulted in a downward vertical motion of air. In contrast, in front of the moving path of the low-pressure center, an updraft appeared in pairs with the previously mentioned downdraft in the slice of 95°E–97°E. The “convergence below, divergence aloft” at the height of 650 hPa resulted in strong updrafts. Dust in the source region was lifted to a high altitude by the strong upward airflow and transported southeastward under the prevailing northwest winds.
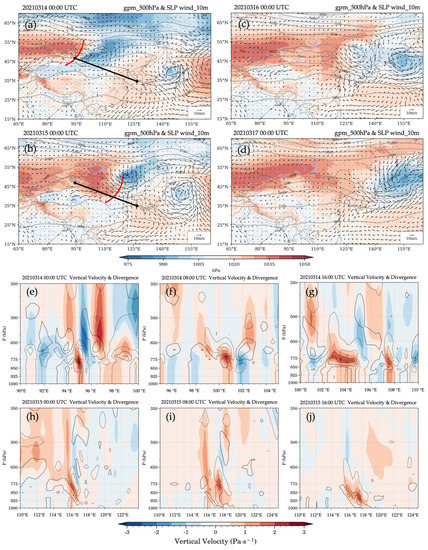
Figure 7.
(a–d) The sea level pressure (shading) overlapped by 500 hPa geopotential height contours (gray contours) and 10-m horizontal wind vectors (arrow) at (a) 00:00 UTC on 14 March 2021; (b) 00:00 on 15 March 2021; (c) 00:00 on 16 March 2021; and (d) 00:00 on 17 March 2021. (e–j) The cross-sections of vertical velocity (shading) and the divergence (black contours) along the dust path (dark line in panel (a)), including at (e) 00:00UTC on 14 March 2021; (f) 08:00 on 14 March 2021; (g) 16:00 on 14 March 2021; (h) 00:00 on 15 March 2021; (i) 08:00 on 15 March 2021; and (j) 16:00 on 15 March 2021, for the 3·15 event.
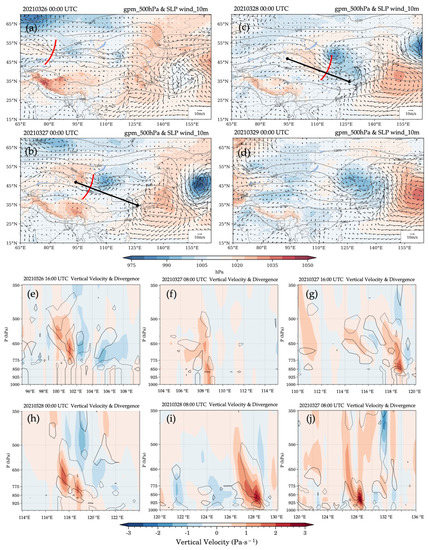
Figure 8.
(a–d) The sea level pressure (shading) overlapped by 500 hPa geopotential height contours (gray contours) and 10-m horizontal wind vectors (arrow). (e–j) The cross-sections of vertical velocity (shading) and the divergence (black contours) along the dust path (dark line in panel (b)) for the 3·28 event.
In addition, the low-pressure centers were followed by cold high pressures, leading to positive and negative vertical velocities in the upper air, as shown in Figure 7e–h and Figure 8e,h–j. It is important to note that, on the one hand, the updrafts carry different types of aerosols emitted from the surface into the upper air, and on the other hand, the downdrafts transport aerosols from the upper air down to the surface. Due to the weight of the dust itself, gravitational subsidence is also ongoing. Since uplift and deposition occur at the same time, the composition of aerosols should be regarded as a dynamic changing process during the transport process. The upper-air aerosol was pure dust (subtype = yellow) in the dust source region (Figure 5a). After long-distance transport, the aerosol subtype changed to polluted dust (subtype = brown) when reaching the populated areas of North China.
The Mongolian cyclone had taken its full shape, and the center of the GH contours was closed (Figure 8b) at 00:00UTC on 15 March after experiencing a 24-h development. This process took 48 h for the 3·28 dust event, and the cyclone strength was also weaker than that of the 3·15 dust event.
3.4. Backflow during the 3·15 Dust Event
There was an obvious backflow process in the 3·15 dust event. At 00:00UTC on 16 March (Figure 7c), the Mongolian cyclone met with low pressure over the Northwest Pacific at 45°N, and there was the Northwest Pacific Subtropical High in the south. Then, these two low-pressure centers tended to merge. The evolution of the 10-m wind field with an interval of 8 h (Figure 9a–c) exhibited a reversal of the airflow direction (solid black arrows). The original southeastward transport changed and reversed to westward and northwestward. In this case, Jiangsu and Anhui provinces in eastern China suffered floating dusty weather. Therefore, the two sites, Fuyang in Anhui province and Xuzhou in Jiangsu province, were selected, and HYSPLIT was used to simulate the backward trajectory for 48 h. The air mass above these two cities came from North China and the border between China and Mongolia, and the moving direction of the air mass was consistent with the change in the wind field.
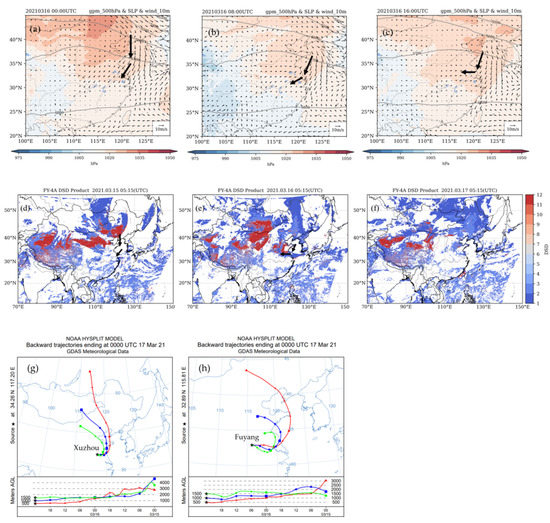
Figure 9.
Dust backflow process analysis on 16 and 17 March 2021. (a–c) The sea level pressure (shading) overlapped by 10-m wind vectors (arrow) and 500 hPa geopotential height contours (gray line) at (a) 00:00 on 16 March 2021; (b) 08:00 on 16 March 2021; (c) 16:00 UTC on 16 March 2021; (d–f) Dust test product from FY-4A (red dash); (d) 05:15 UTC on 15 March 2021; (e) 05:15 on 16 March 2021; (f) 13:15 UTC on 17 March 2021; (g) 48 h backward trajectories ending at Fuyang; (h) and Xuzhou on 16 March.
Figure 9d–f shows the dust test (DSD) products from FY-4A/AGRI during the backflow process. Starting from 00:00UTC on 16 March, the dust plumes covered China’s Huanghuai and Jianghuai regions with a changing wind direction. In addition, it rained in the North China Plain on 18 March; thus, most of the dust particles in the 3·15 event were trapped and deposited on the land. However, the 3·28 dust event pathway had always been from northwest to southeast, and it passed through North China and South Korea and finally reached the south coast of Japan. Part of the dust particles was deposited in the Northwest Pacific Ocean.
4. Conclusions
Two strong dust events originated in GD and were driven by the Mongolian cyclone across Eastern Asia in March 2021, which influenced most areas of North China. In this study, the AOD and DSD products from Himawari-8 and FY-4A geostationary satellites were used to monitor the tempo-spatial distributions of dust events. The dust aerosol optical characteristics on the transport paths were analyzed using ground-based AERONET observations. The vertical structure of the dust event was from the CALIPSO satellite. The ERA5 meteorological field data and HYSPLIT backward trajectory simulation were used to analyze the synoptic dynamic characteristics of the two dust events and the backflow process of the first dust event. The main conclusions are as follows:
- During the dust periods, aerosol optical parameters at four AERONET sites on the dust transport path showed that the 500 nm AOD values exceeded 0.50, with the maximum value at 2.18. The FMF was less than 0.40, and the AE was below 0.50. The peak radius of coarse-mode aerosol was approximately 4 μm, and even as high as 7 μm in the dust source region. At the same time, due to the strong absorption of dust aerosol at UV and near-UV bands, SSA showed a decreasing trend when the dust reached a specific site (from 0.99 to 0.91 in Dalanzadgad; from 0.98 to 0.90 in Beijing; from 0.96 to 0.93 in Gwangju; and from 0.99 to 0.90 in Osaka). The appearance of dust can be determined according to the change in aerosol optical parameters.
- The Himawari-8500 nm AOD combined with the results of the HYSPLIT backward trajectory model showed that the two dust events originated in the GD, and dust plumes passed through North China, the East coast of China, the Bohai Sea, and the Yellow Sea. Compared with the 3·15 dust event, the dust plume of the 3·28 dust event was transported eastward to the Sea of Japan and Honshu Island on 30 March, finally reaching the Northwest Pacific Ocean.
- The altitude of the dust layer was from the surface to 4 km in the source region, and the aerosol type was pure dust. Along with the transport pathway from the GD to the southeast, the dust layer was divided into two layers. The upper layer was pure dust and reached 9 km. The low-layer aerosol subtype changed to polluted dust in North and East China. The values of the particulate depolarization ratio of pure dust varied from 0.3 to 0.6, while the depolarization ratio values of polluted dust varied from 0.2 to 0.4. The extinction coefficient values of the upper pure dust layer concentrated in the range of 0.01–0.02 km−1, with a sharp decrease indicating that only a small amount of dust from the source region could be transported to North China. The backward trajectory simulation results were consistent with the dust transport pathway revealed by CALIOP data.
- The two dust events were induced by the Mongolian cyclone, which was the main driving factor of dusty spring weather in East Asia. At the same time, there were differences in the transport pathways between the two dust processes. On 16 March, the wind direction at 00:00 UTC shifted from northwest to northeast over East China and the coastal areas, and the wind direction changed to the east at 08:00UTC and then to the southeast at 16:00 UTC. The dust plume over North China was transported to the inland of East China due to the wind direction change, resulting in dust weather in Jiangsu and Anhui Province. The FY-4A satellite DSD product successfully recorded the process of dust backflow in East China. Comparison of the diversity between the two dust event transport pathways provides us with a new perspective on the circulation and transmission of the natural aerosols. In addition to aerosol transport and the deposition processes, the impact on the ocean and the impact of marine aerosols on land also need to be taken into consideration.
Supplementary Materials
The following supporting information can be downloaded at: https://www.mdpi.com/article/10.3390/rs14235967/s1, Figure S1: Himawari-8 daily average AOD distribution (left column a–c) and AE distribution (right column a’–c’) during 3·15 dust event. High AOD values (AOD > 1.2) in red boxes correspond to the low AE values (AE < 0.8). Figure S2. Himawari-8 daily average AOD distribution (left column a–c) and AE distribution (right column a’–c’) during 3·28 dust event. High AOD values (AOD > 1.2) in red boxes correspond to the low AE values (AE < 0.8). Figure S3. (a–d) The cross-sections of the CALIOP subtype product on 26, 27, 29, 30 March 2021, respectively.
Author Contributions
X.S.: data curation, investigation, methodology, visualization, writing—original draft; X.F.: conceptualization, methodology, supervision, validation, writing—review and editing; T.Z.: data curation, investigation, methodology; Y.W. (Yinan Wang) investigation, methodology; Y.W. (Yuntao Wang) validation, supervision, writing—review and editing; M.Z.: validation, supervision, writing—review and editing; D.L.: conceptualization, supervision, writing—review and editing. All authors have read and agreed to the published version of the manuscript.
Funding
This research was supported by the National Natural Science Foundation of China, grant number 42030708, Opening Foundation of Key Laboratory of Atmosphere Sounding, China Meteorological Administration and CMA Research Centre on Meteorological Observation Engineering Technology (U2021Z03), and the Strategic Priority Research Program of the Chinese Academy of Sciences (XDA17040511).
Data Availability Statement
The AERONET Level 1.5 data (http://aeronet.gsfc.nasa.gov, accessed on 22 September 2021). The Himawari-8 AOD data (https://www.eorc.jaxa.jp/ptree/index.html, accessed on 15 April 2021). The FY-4A DSD product (http://satellite.nsmc.org.cn/PortalSite/Data/Satellite.aspx, accessed on 19 March 2021). The CALIPO Level 2 Aerosol Profile product (https://search.earthdata.nasa.gov/, accessed on 6 June 2021). ERA5 hourly data on pressure levels (https://cds.climate.copernicus.eu/cdsapp#!/dataset/reanalysis-era5-pressure-levels?tab=form, accessed on 6 June 2021). ERA5 hourly data on single levels dataset (https://cds.climate.copernicus.eu/cdsapp#!/dataset/reanalysis-era5-single-levels?tab=form, accessed on 6 June 2021). HYSPLIT (https://www.ready.noaa.gov/HYSPLIT.php, accessed on 22 September 2021).
Acknowledgments
We would like to thank the following agencies for providing data: ERA5 meteorological reanalysis datasets from ECMWF, the aerosol products were provided by AERONET networks, the CALIOP data were obtained from the NASA Langley Atmospheric Science Data Center (ASDC), Himawari-8 aerosol data from Japan Aerospace Exploration Agency (JAXA), FY-4A data from the National Satellite Meteorological Center (NSMC), China Meteorological Administration (CMA), and the HYSPLIT modeling results developed by the NOAA Air Resource Laboratory (ARL) mission.
Conflicts of Interest
The authors declare no conflict of interest.
References
- Goudie, A.S.; Middleton, N.J. The Changing Frequency Of Dust Storms Through Time. Clim. Chang. 1992, 20, 29. [Google Scholar] [CrossRef]
- Prospero, J.M.; Ginoux, P.; Torres, O.; Nicholson, S.E.; Gill, T.E. Environmental characterization of global sources of atmospheric soil dust identified with the nimbus 7 total ozone mapping spectrometer (TOMS) absorbing aerosol product. Rev. Geophys. 2002, 40, 2-1–2-31. [Google Scholar] [CrossRef]
- Werner, M.; Tegen, I.; Harrison, S.P.; Kohfeld, K.E.; Prentice, I.C.; Balkanski, Y.; Rodhe, H.; Roelandt, C. Seasonal and interannual variability of the mineral dust cycle under present and glacial climate conditions. J. Geophys. Res. Atmos. 2002, 107, AAC-2. [Google Scholar] [CrossRef]
- Luo, C. Sensitivity study of meteorological parameters on mineral aerosol mobilization, transport, and distribution. J. Geophys. Res. 2003, 108. [Google Scholar] [CrossRef]
- Bian, H.; Zender, C.S. Mineral dust and global tropospheric chemistry: Relative roles of photolysis and heterogeneous uptake. J. Geophys. Res. Atmos. 2003, 108, 4672. [Google Scholar] [CrossRef]
- Ginoux, P.; Prospero, J.; Torres, O.; Chin, M. Long-term simulation of global dust distribution with the GOCART model: Correlation with North Atlantic Oscillation. Environ. Model. Softw. 2004, 19, 113–128. [Google Scholar] [CrossRef]
- Miller, R.L.; Tegen, I.; Perlwitz, J. Surface radiative forcing by soil dust aerosols and the hydrologic cycle. J. Geophys. Res. Atmos. 2004, 109, 4203. [Google Scholar] [CrossRef]
- Boucher, O.; Randall, D.; Artaxo, P.; Bretherton, C.; Feingold, G.; Forster, P.; Kerminen, V.-M.; Kondo, Y.; Liao, H.; Lohmann, U.; et al. Clouds and Aerosols. In Climate Change 2013: The Physical Science Basis. Contribution of Working Group I to the Fifth Assessment Report of the Intergovernmental Panel on Climate Change; Stocker, T.F., Qin, D., Plattner, G.-K., Tignor, M., Allen, S.K., Boschung, J., Nauels, A., Xia, Y., Bex, V., Midgley, P.M., Eds.; Cambridge University Press: Cambridge, UK; New York, NY, USA, 2013; pp. 571–658. [Google Scholar]
- Ramanathan, V.; Ramana, M.V.; Roberts, G.; Kim, D.; Corrigan, C.; Chung, C.; Winker, D. Warming trends in Asia amplified by brown cloud solar absorption. Nature 2007, 448, 575–578. [Google Scholar] [CrossRef] [PubMed]
- Maher, B.A.; Prospero, J.M.; Mackie, D.; Gaiero, D.; Hesse, P.P.; Balkanski, Y. Global connections between aeolian dust, climate and ocean biogeochemistry at the present day and at the last glacial maximum. Earth-Sci. Rev. 2010, 99, 61–97. [Google Scholar] [CrossRef]
- Jickells, T.D.; An, Z.S.; Andersen, K.K.; Baker, A.R.; Bergametti, G.; Brooks, N.; Cao, J.J.; Boyd, P.W.; Duce, R.A.; Hunter, K.A.; et al. Global Iron Connections Between Desert Dust, Ocean Biogeochemistry, and Climate. Science 2005, 308, 67–71. [Google Scholar] [CrossRef]
- Shao, Y.; Wyrwoll, K.-H.; Chappell, A.; Huang, J.; Lin, Z.; McTainsh, G.H.; Mikami, M.; Tanaka, T.Y.; Wang, X.; Yoon, S. Dust cycle: An emerging core theme in Earth system science. Aeolian Res. 2011, 2, 181–204. [Google Scholar] [CrossRef]
- Li, J.; Hao, X.; Liao, H.; Yue, X.; Li, H.; Long, X.; Li, N. Predominant type of dust storms that influence air quality over northern China and future projections. Earth’s Future 2022, 10, e2022EF002649. [Google Scholar] [CrossRef]
- Zou, X.; Zhai, P. Relationship between vegetation coverage and spring dust storms over northern China. J. Geophys. Res. Atmos. 2004, 109, D03104. [Google Scholar] [CrossRef]
- Chen, S.; Huang, J.; Kang, L.; Wang, H.; Ma, X.; He, Y.; Yuan, T.; Yang, B.; Huang, Z.; Zhang, G. Emission, transport, and radiative effects of mineral dust from the Taklimakan and Gobi deserts: Comparison of measurements and model results. Atmos. Chem. Phys. 2017, 17, 2401–2421. [Google Scholar] [CrossRef]
- Xu, C.; Guan, Q.; Lin, J.; Luo, H.; Yang, L.; Tan, Z.; Wang, Q.; Wang, N.; Tian, J. Spatiotemporal variations and driving factors of dust storm events in northern China based on high-temporal-resolution analysis of meteorological data (1960–2007). Environ. Pollut. 2020, 260, 114084. [Google Scholar] [CrossRef]
- Liu, X.; Yin, Z.; Zhang, X.; Yang, X. Analyses of the spring dust storm frequency of northern China in relation to antecedent and concurrent wind, precipitation, vegetation, and soil moisture conditions. J. Geophys. Res. 2004, 109. [Google Scholar] [CrossRef]
- Yao, W.; Gui, K.; Wang, Y.; Che, H.; Zhang, X. Identifying the dominant local factors of 2000–2019 changes in dust loading over East Asia. Sci. Total Environ. 2021, 777, 146064. [Google Scholar] [CrossRef]
- Yin, Z.; Wan, Y.; Zhang, Y.; Wang, H. Why super sandstorm 2021 in North China? Natl. Sci. Rev. 2022, 9, nwab165. [Google Scholar] [CrossRef]
- Sun, J.; Zhang, M.; Liu, T. Spatial and temporal characteristics of dust storms in China and its surrounding regions, 1960–1999: Relations to source area and climate. J. Geophys. Res. 2001, 106, 8. [Google Scholar] [CrossRef]
- Zhang, X.Y.; Gong, S.L.; Zhao, T.L.; Arimoto, R.; Wang, Y.Q.; Zhou, Z.J. Sources of Asian dust and role of climate change versus desertification in Asian dust emission. Geophys. Res. Lett. 2003, 30, 6–9. [Google Scholar] [CrossRef]
- Xu, C.; Ge, J.M.; Huang, J.P.; Fu, Q.; Liu, H.Y.; Chen, B. Observations of Dust Aerosol over China Based on CALIPSO Spaceborne Liadr. J. Desert Res. 2014, 34, 10. [Google Scholar] [CrossRef]
- Huang, J.; Minnis, P.; Chen, B.; Huang, Z.; Liu, Z.; Zhao, Q.; Yi, Y.; Ayers, J.K. Long-range transport and vertical structure of Asian dust from CALIPSO and surface measurements during PACDEX. J. Geophys. Res. 2008, 113, 23212. [Google Scholar] [CrossRef]
- Shimizu, A. Continuous observations of Asian dust and other aerosols by polarization lidars in China and Japan during ACE-Asia. J. Geophys. Res. 2004, 109, D19S17. [Google Scholar] [CrossRef]
- Zhang, X.Y.; Gong, S.L.; Shen, Z.X.; Mei, F.M.; Xi, X.X.; Liu, L.C.; Zhou, Z.J.; Wang, D.; Wang, Y.Q.; Cheng, Y. Characterization of soil dust aerosol in China and its transport and distribution during 2001 ACE-Asia: 1. Network observations. J. Geophys. Res. Atmos. 2003, 108. [Google Scholar] [CrossRef]
- Gong, S.L.; Zhang, X.Y.; Zhao, T.L.; McKendry, I.G.; Jaffe, D.A.; Lu, N.M. Characterization of soil dust aerosol in China and its transport and distribution during 2001 ACE-Asia: 2. Model simulation and validation. J. Geophys. Res. Atmos. 2003, 108, 4262. [Google Scholar] [CrossRef]
- Matsumoto, K. Chemical properties and outflow patterns of anthropogenic and dust particles on Rishiri Island during the Asian Pacific Regional Aerosol Characterization Experiment (ACE-Asia). J. Geophys. Res. 2003, 108. [Google Scholar] [CrossRef]
- Zhao, T.L. Modeled size-segregated wet and dry deposition budgets of soil dust aerosol during ACE-Asia 2001: Implications for trans-Pacific transport. J. Geophys. Res. 2003, 108. [Google Scholar] [CrossRef]
- Kim, K.W. Physicochemical characteristics and radiative properties of Asian dust particles observed at Kwangju, Korea, during the 2001 ACE-Asia intensive observation period. J. Geophys. Res. 2004, 109. [Google Scholar] [CrossRef]
- Huebert, B.J.; Bates, T.S.; Russell, P.B.; Shi, G.Y.; Kim, Y.J.; Kawamura, K.; Carmichael, G.R.; Nakajima, T. An overview of ACE-Asia: Strategies for quantifying the relationships between Asian aerosols and their climatic impacts. J. Geophys. Res. 2003, 108. [Google Scholar] [CrossRef]
- Li, Z.; Li, C.; Chen, H.; Tsay, S.C.; Holben, B.; Huang, J.; Li, B.; Maring, H.; Qian, Y.; Shi, G.; et al. East Asian Studies of Tropospheric Aerosols and their Impact on Regional Climate (EAST-AIRC): An overview. J. Geophys. Res. 2011, 116. [Google Scholar] [CrossRef]
- Li, C.; Krotkov, N.A.; Dickerson, R.R.; Li, Z.; Yang, K.; Chin, M. Transport and evolution of a pollution plume from northern China: A satellite-based case study. J. Geophys. Res. 2010, 115. [Google Scholar] [CrossRef]
- Ge, J.M.; Su, J.; Ackerman, T.P.; Fu, Q.; Huang, J.P.; Shi, J.S. Dust aerosol optical properties retrieval and radiative forcing over northwestern China during the 2008 China-U.S. joint field experiment. J. Geophys. Res. 2010, 115. [Google Scholar] [CrossRef]
- Yumimoto, K.; Uno, I.; Sugimoto, N.; Shimizu, A.; Satake, S. Adjoint inverse modeling of dust emission and transport over East Asia. Geophys. Res. Lett. 2007, 34. [Google Scholar] [CrossRef]
- Uno, I.; Yumimoto, K.; Shimizu, A.; Hara, Y.; Sugimoto, N.; Wang, Z.; Liu, Z.; Winker, D.M. 3D structure of Asian dust transport revealed by CALIPSO lidar and a 4DVAR dust model. Geophys. Res. Lett. 2008, 35. [Google Scholar] [CrossRef]
- Liu, Z.; Omar, A.; Vaughan, M.; Hair, J.; Kittaka, C.; Hu, Y.; Powell, K.; Trepte, C.; Winker, D.; Hostetler, C.; et al. CALIPSO lidar observations of the optical properties of Saharan dust: A case study of long-range transport. J. Geophys. Res. 2008, 113. [Google Scholar] [CrossRef]
- Liu, J.; Zheng, Y.; Li, Z.; Flynn, C.; Welton, E.J.; Cribb, M. Transport, vertical structure and radiative properties of dust events in southeast China determined from ground and space sensors. Atmos. Environ. 2011, 45, 6469–6480. [Google Scholar] [CrossRef]
- Nagashima, K.; Suzuki, Y.; Irino, T.; Nakagawa, T.; Tada, R.; Hara, Y.; Yamada, K.; Kurosaki, Y. Asian dust transport during the last century recorded in Lake Suigetsu sediments. Geophys. Res. Lett. 2016, 43, 2835–2842. [Google Scholar] [CrossRef]
- Zhu, Q.; Liu, Y.; Shao, T.; Tang, Y. Transport of Asian aerosols to the Pacific Ocean. Atmos. Res. 2020, 234, 104735. [Google Scholar] [CrossRef]
- Eck, T.F.; Holben, B.N.; Ward, D.E.; Dubovik, O.; Reid, J.S.; Smirnov, A.; Mukelabai, M.M.; Hsu, N.C.; O’Neill, N.T.; Slutsker, I. Characterization of the optical properties of biomass burning aerosols in Zambia during the 1997 ZIBBEE field campaign. J. Geophys. Res. Atmos. 2001, 106, 3425–3448. [Google Scholar] [CrossRef]
- Howell, S.G.; Clarke, A.D.; Shinozuka, Y.; Kapustin, V.; McNaughton, C.S.; Huebert, B.J.; Doherty, S.J.; Anderson, T.L. Influence of relative humidity upon pollution and dust during ACE-Asia: Size distributions and implications for optical properties. J. Geophys. Res. 2006, 111. [Google Scholar] [CrossRef]
- Zheng, Y.; Liu, J.; Wu, R.; Li, Z.; Wang, B.; Tamio, T. Seasonal statistical characteristics of aerosol optical properties at a site near a dust region in China. J. Geophys. Res. 2008, 113. [Google Scholar] [CrossRef]
- Liu, Y.; Yang, D.; Chen, W.; Zhang, H. Measurements of Asian dust optical properties over the Yellow Sea of China by shipboard and ground-based photometers, along with satellite remote sensing: A case study of the passage of a frontal system during April 2006. J. Geophys. Res. 2010, 115. [Google Scholar] [CrossRef]
- Huang, J.; Wang, T.; Wang, W.; Li, Z.; Yan, H. Climate effects of dust aerosols over East Asian arid and semiarid regions. J. Geophys. Res. Atmos. 2014, 119. [Google Scholar] [CrossRef]
- Song, H.; Zhang, K.; Piao, S.; Wan, S. Spatial and temporal variations of spring dust emissions in northern China over the last 30 years. Atmos. Environ. 2016, 126, 117–127. [Google Scholar] [CrossRef]
- Li, Z.Q.; Xu, H.; Li, K.T.; Li, D.H.; Xie, Y.S.; Li, L.; Zhang, Y.; Gu, X.F.; Zhao, W.; Tian, Q.J.; et al. Comprehensive Study of Optical, Physical, Chemical, and Radiative Properties of Total Columnar Atmospheric Aerosols over China: An Overview of Sun–Sky Radiometer Observation Network (SONET) Measurements. Bull. Am. Meteorol. Soc. 2018, 99, 739–755. [Google Scholar] [CrossRef]
- Zhang, Q.; Zheng, Y.; Tong, D.; Shao, M.; Wang, S.; Zhang, Y.; Xu, X.; Wang, J.; He, H.; Liu, W.; et al. Drivers of improved PM2.5 air quality in China from 2013 to 2017. Proc. Natl. Acad. Sci. USA 2019, 116, 24463–24469. [Google Scholar] [CrossRef]
- Seinfeld, J.H.; Carmichael, G.R.; Arimoto, R.; Conant, W.C.; Brechtel, F.J.; Bates, T.S.; Cahill, T.A.; Clarke, A.D.; Doherty, S.J.; Flatau, P.J.; et al. ACE-ASIA: Regional Climatic and Atmospheric Chemical Effects of Asian Dust and Pollution. Bull. Am. Meteorol. Soc. 2004, 85, 367–380. [Google Scholar] [CrossRef]
- Dubovik, O.; Schuster, G.L.; Xu, F.; Hu, Y.; Bösch, H.; Landgraf, J.; Li, Z. Grand Challenges in Satellite Remote Sensing. Front. Remote Sens. 2021, 2, 619818. [Google Scholar] [CrossRef]
- Liu, Z.; Fairlie, T.; Uno, I.; Huang, J.; Wu, D.; Omar, A.; Kar, J.; Vaughan, M.; Rogers, R.; Winker, D.; et al. Transpacific transport and evolution of the optical properties of Asian dust. J. Quant. Spectrosc. Radiat. Transf. 2013, 116, 24–33. [Google Scholar] [CrossRef]
- Powell, K.A.; Hu, Y.; Omar, A.; Vaughan, M.A.; Winker, D.M.; Liu, Z.; Hunt, W.H.; Young, S.A. Overview of the CALIPSO Mission and CALIOP Data Processing Algorithms. J. Atmos. Ocean. Technol. 2009, 26, 2310–2323. [Google Scholar] [CrossRef]
- Liu, D.; Wang, Z.; Liu, Z.; Winker, D.; Trepte, C. A height resolved global view of dust aerosols from the first year CALIPSO lidar measurements. J. Geophys. Res. 2008, 113. [Google Scholar] [CrossRef]
- Itahashi, S.; Yumimoto, K.; Uno, I.; Eguchi, K.; Takemura, T.; Hara, Y.; Shimizu, A.; Sugimoto, N.; Liu, Z. Structure of dust and air pollutant outflow over East Asia in the spring. Geophys. Res. Lett. 2010, 37. [Google Scholar] [CrossRef]
- Yang, J.; Zhang, Z.; Wei, C.; Lu, F.; Guo, Q. Introducing the New Generation of Chinese Geostationary Weather Satellites, Fengyun-4. Bull. Am. Meteorol. Soc. 2017, 98, 1637–1658. [Google Scholar] [CrossRef]
- Zhang, P.; Zhu, L.; Tang, S.; Gao, L.; Chen, L.; Zheng, W.; Han, X.; Chen, J.; Shao, J. General Comparison of FY-4A/AGRI With Other GEO/LEO Instruments and Its Potential and Challenges in Non-meteorological Applications. Front. Earth Sci. 2019, 6, 224. [Google Scholar] [CrossRef]
- Bessho, K.; Date, K.; Hayashi, M.; Ikeda, A.; Imai, T.; Inoue, H.; Kumagai, Y.; Miyakawa, T.; Murata, H.; Ohno, T.; et al. An Introduction to Himawari-8/9— Japan’s New-Generation Geostationary Meteorological Satellites. J. Meteorol. Soc. Japan Ser. II 2016, 94, 151–183. [Google Scholar] [CrossRef]
- Yumimoto, K.; Nagao, T.M.; Kikuchi, M.; Sekiyama, T.T.; Murakami, H.; Tanaka, T.Y.; Ogi, A.; Irie, H.; Khatri, P.; Okumura, H.; et al. Aerosol data assimilation using data from Himawari-8, a next-generation geostationary meteorological satellite. Geophys. Res. Lett. 2016, 43, 5886–5894. [Google Scholar] [CrossRef]
- Yumimoto, K.; Kajino, M.; Tanaka, T.Y.; Uno, I. Dust Vortex in the Taklimakan Desert by Himawari-8 High Frequency and Resolution Observation. Sci. Rep. 2019, 9, 1209. [Google Scholar] [CrossRef]
- Zhang, P.; Wang, C.J.; Chen, L. Current Status of Satellite Based Dust Aerosol Remote Sensing and Some Issues to Be Concerned. Meteorol. Mon. 2018, 44, 12. [Google Scholar] [CrossRef]
- Uesawa, D. Aerosol Optical Depth Product Derived from Himawari-8 Data for Asian Dust Monitoring. 2016. No. 61. pp. 59–63. Available online: https://www.data.jma.go.jp/mscweb/technotes/msctechrep61-6.pdf (accessed on 22 September 2021).
- Ginoux, P.; Deroubaix, A. Space Observations of Dust in East Asia. In Air Pollution in Eastern Asia: An Integrated Perspective; 2017; pp. 365–383. Available online: https://link.springer.com/book/10.1007/978-3-319-59489-7 (accessed on 22 September 2021).
- Holben, B.N.; Kim, J.; Sano, I.; Mukai, S.; Eck, T.F.; Giles, D.M.; Schafer, J.S.; Sinyuk, A.; Slutsker, I.; Smirnov, A.; et al. An overview of mesoscale aerosol processes, comparisons, and validation studies from DRAGON networks. Atmos. Chem. Phys. 2018, 18, 655–671. [Google Scholar] [CrossRef]
- Holben, B.N.; Eck, T.F.; Slutsker, I.; Tanré, D.; Buis, J.P.; Setzer, A.; Vermote, E.; Reagan, J.A.; Kaufman, Y.J.; Nakajima, T.; et al. AERONET—A Federated Instrument Network and Data Archive for Aerosol Characterization. Remote Sens. Environ. 1998, 66, 1–16. [Google Scholar] [CrossRef]
- Dubovik, O.; Smirnov, A.; Holben, B.N.; King, M.D.; Kaufman, Y.J.; Eck, T.F.; Slutsker, I. Accuracy assessments of aerosol optical properties retrieved from Aerosol Robotic Network (AERONET) Sun and sky radiance measurements. J. Geophys. Res. Atmos. 2000, 105, 9791–9806. [Google Scholar] [CrossRef]
- Torres, O.; Bhartia, P.K.; Herman, J.R.; Sinyuk, A.; Ginoux, P.; Holben, B. A Long-Term Record of Aerosol Optical Depth from TOMS Observations and Comparison to AERONET Measurements. J. Atmos. Sci. 2002, 59, 16. [Google Scholar] [CrossRef]
- Omar, A.H.; Winker, D.M.; Tackett, J.L.; Giles, D.M.; Kar, J.; Liu, Z.; Vaughan, M.A.; Powell, K.A.; Trepte, C.R. CALIOP and AERONET aerosol optical depth comparisons: One size fits none. J. Geophys. Res. Atmos. 2013, 118, 4748–4766. [Google Scholar] [CrossRef]
- Xu, W.; Wang, W.; Chen, B. Comparison of hourly aerosol retrievals from JAXA Himawari/AHI in version 3.0 and a simple customized method. Sci. Rep. 2020, 10, 20884. [Google Scholar] [CrossRef]
- Hao, C.; Xingfa, G.; Tianhai, C.; Tao, Y.; Zhengqiang, L. Characteristics of Aerosol Types over China. J. Remote Sens. 2013, 17, 13. [Google Scholar] [CrossRef]
- Che, H.; Zhang, X.; Alfraro, S.; Chatenet, B.; Gomes, L.; Zhao, J. Aerosol optical properties and its radiative forcing over Yulin, China in 2001 and 2002. Adv. Atmos. Sci. 2009, 26, 564–576. [Google Scholar] [CrossRef]
- Gui, K.; Yao, W.; Che, H.; An, L.; Zheng, Y.; Li, L.; Zhao, H.; Zhang, L.; Zhong, J.; Wang, Y.; et al. Record-breaking dust loading during two mega dust storm events over northern China in March 2021: Aerosol optical and radiative properties and meteorological drivers. Atmos. Chem. Phys. 2022, 22, 7905–7932. [Google Scholar] [CrossRef]
- Wang, F.; Yang, T.; Wang, Z.; Cao, J.; Liu, B.; Liu, J.; Chen, S.; Liu, S.; Jia, B. A Comparison of the Different Stages of Dust Events over Beijing in March 2021: The Effects of the Vertical Structure on Near-Surface Particle Concentration. Remote Sens. 2021, 13, 3580. [Google Scholar] [CrossRef]
- Li, G.; Lu, D.; Yang, X.; Zhang, H.; Guo, Y.; Qu, G.; Wang, P.; Chen, L.; Ruan, T.; Hou, X.; et al. Resurgence of Sandstorms Complicates China’s Air Pollution Situation. Environ. Sci. Technol. 2021, 55, 11467–11469. [Google Scholar] [CrossRef] [PubMed]
- Zhang, T.; Zheng, M.; Sun, X.; Chen, H.; Wang, Y.; Fan, X.; Pan, Y.; Quan, J.; Liu, J.; Wang, Y.; et al. Environmental impacts of three Asian dust events in the northern China and the northwestern Pacific in spring 2021. Sci. Total Environ. 2022, 859, 160230. [Google Scholar] [CrossRef]
- Dubovik, O.; King, M.D. A flexible inversion algorithm for retrieval of aerosol optical properties from Sun and sky radiance measurements. J. Geophys. Res. Atmos. 2000, 105, 20673–20696. [Google Scholar] [CrossRef]
- Smirnov, A.; Holben, B.N.; Eck, T.F.; Dubovik, O.; Slutsker, I. Cloud-Screening and Quality Control Algorithms for the AERONET Database. Remote Sens. Environ. 2000, 73, 337–349. [Google Scholar] [CrossRef]
- Westphal, D.L.; Toon, O.B. Simulations of microphysical, radiative, and dynamical processes in a continental-scale forest fire smoke plume. J. Geophys. Res. Atmos. 1991, 96, 22379–22400. [Google Scholar] [CrossRef]
- Eck, T.F.; Holben, B.N.; Reid, J.S.; Dubovik, O.; Smirnov, A.; O’Neill, N.T.; Slutsker, I.; Kinne, S. Wavelength dependence of the optical depth of biomass burning, urban, and desert dust aerosols. J. Geophys. Res. Atmos. 1999, 104, 31333–31349. [Google Scholar] [CrossRef]
- Schuster, G.L.; Dubovik, O.; Holben, B.N. Angstrom exponent and bimodal aerosol size distributions. J. Geophys. Res. 2006, 111. [Google Scholar] [CrossRef]
- Chen, H.; Fan, X.; Xia, X. Review of Satellite Remote Sensing of Atmospheric Aerosols and Its Applications in Climate and Environment Studies. Chin. J. Atmos. Sci. 2018, 42, 13. [Google Scholar] [CrossRef]
- Huang, J.; Minnis, P.; Yi, Y.; Tang, Q.; Wang, X.; Hu, Y.; Liu, Z.; Ayers, K.; Trepte, C.; Winker, D. Summer dust aerosols detected from CALIPSO over the Tibetan Plateau. Geophys. Res. Lett. 2007, 34. [Google Scholar] [CrossRef]
- Hersbach, H.; Bell, B.; Berrisford, P.; Hirahara, S.; Horányi, A.; Muñoz-Sabater, J.; Nicolas, J.; Peubey, C.; Radu, R.; Schepers, D.; et al. The ERA5 global reanalysis. Q. J. R. Meteorol. Soc. 2020, 146, 51. [Google Scholar] [CrossRef]
- Hsu, N.C.; Tsay, S.C.; King, M.D.; Herman, J.R. Deep Blue Retrievals of Asian Aerosol Properties During ACE-Asia. IEEE Trans. Geosci. Remote Sens. 2006, 44, 3180–3195. [Google Scholar] [CrossRef]
Publisher’s Note: MDPI stays neutral with regard to jurisdictional claims in published maps and institutional affiliations. |
© 2022 by the authors. Licensee MDPI, Basel, Switzerland. This article is an open access article distributed under the terms and conditions of the Creative Commons Attribution (CC BY) license (https://creativecommons.org/licenses/by/4.0/).