Article

Ionospheric Oscillation with Periods of 6–30 Days at Middle Latitudes: A Response to Solar Radiative, Geomagnetic, and Lower Atmospheric Forcing

1
Electronic Information School, Wuhan University, Wuhan 430072, China
2
Beijing Institute of Applied Meteorology, Beijing 100029, China
*
Author to whom correspondence should be addressed.
Remote Sens. 2022, 14(22), 5895; https://doi.org/10.3390/rs14225895
Submission received: 24 October 2022 / Revised: 17 November 2022 / Accepted: 18 November 2022 / Published: 21 November 2022

Abstract

:
This research studies the medium timescale (6–30 days) ionospheric response over the Wuhan area to solar radiative, recurrent geomagnetic, and lower atmospheric forcing. The ionospheric response is examined by wavelet analysis of the total electron content (TEC) over the Wuhan area from 2001 to 2020. Ionospheric oscillations with periods centering at the harmonic oscillations of the 27-day solar rotation (e.g., 27 days, 13.5 days, 9 days, and 6.75 days) are focused upon. The results show that the quasi-27-day TEC oscillations at the middle latitude have a better overall correlation with solar radiation than recurrent geomagnetic activity, but the correlation between TEC and recurrent geomagnetic activity has a significant increase at the solar minimum stage. As for ionospheric oscillations with periods shorter than 15 days, these oscillations correlate better with recurrent geomagnetic activity. Moreover, a quasi-27-day TEC oscillation event at the middle latitude caused by convective activity from the lower atmosphere was studied. This suggests that lower atmospheric forcing is also an important factor causing ionospheric oscillations. In addition, the ionospheric oscillations over the Wuhan area also show unique regional characteristics, as the regional ionosphere does not respond well to the Kp oscillation with periods shorter than 20 days, particularly, 13.5 days.

1. Introduction

Medium timescale quasi-periodic oscillations (6–27 days) are typical responses of the ionosphere. Among these temporal variations in the ionosphere, ionospheric oscillations with periods centering at the harmonic oscillations of the 27-day solar rotation are the most prominent. The solar rotation leads to active regions and special structures of the Sun (e.g., sunspot groups and coronal holes) that can regularly affect the ionosphere. Generally speaking, such influences are mainly through solar radiation and magnetospheric energy input to the ionosphere–thermosphere atmosphere [1]. With solar rotation, periodic energy from the Sun could be input to the earth and thus periodically affects the ionosphere. Therefore, these periodicities may be the harmonics of the solar rotation cycle.
Photoionization and light absorption caused by solar radiation directly affects the ionosphere’s plasma concentration. Many papers have been devoted to studying the effects of solar activity on the ionosphere and upper atmosphere over a solar rotation cycle [2,3,4,5]. The solar 10.7 cm radio flux (F10.7) is commonly used as a proxy for the effect of solar radiation on earth [5]. Min et al. [6] studied the 27-day modulation of the low-latitude ionosphere during periods of maximum solar activity. They also revealed a clear periodic variation in the F region ionosphere with a period of about 27 days and shows a good correlation between ionospheric variations and F10.7. Xu et al. [7] showed that the 27-day oscillations in the thermosphere–ionosphere region are mainly caused by the 27-day solar rotational modulation of solar radiation in the extreme ultraviolet (EUV) band.
High-speed solar wind streams (HSS) from solar coronal holes lasting more than one solar rotation cycle can cause recurrent activity between the solar wind and the interplanetary magnetic field, and HSS streams from coronal holes can periodically encounter the Earth’s magnetosphere. They can also interact with low-speed solar wind to produce a co-rotating interaction region (CIR) [8,9]. CIRs that strike the Earth’s magnetosphere deposit energy into the magnetosphere–ionosphere–thermosphere (MIT) system [1,9]. This process can cause recurrent global geomagnetic activity, with the deposition of momentum energy from Joule heating and high-energy particle heating, and these periodic geomagnetic events can recurrently disturb the ionosphere and thermosphere at a global scale [9]. When multiple coronal holes appear on the Sun and last for more than one solar rotation cycle, the associated CIR occurs frequently and periodically to drive periodic magnetic storms with a harmonic period of solar rotation [10,11].
This type of oscillation occurs mainly during the declining phase of solar activity [9]. The response to such recurrent geomagnetic activity can be observed in the ionospheric plasma temperature and TEC [10,12]. The influence of geomagnetic activity is also found in the lower ionosphere–thermosphere region [13]. Yu et al. [14] studied 27-day and 13.5-day periodic oscillations in the ionospheric sporadic E (Es) layer, and found that the 27-day and 13.5-day oscillations in the high-latitude Es layer are closely related to the Dst and Ap indices that represent the geomagnetic activity. Jiang et al. [15] found that the geomagnetic oscillations can penetrate to an altitude of about 105 km above the ground and the amplitude of the oscillations is greater at high latitudes than at low latitudes.
In addition to periodic solar activity and geomagnetic activity, dynamical processes within the lower atmosphere are also capable of causing periodic changes in the ionosphere. Although the atmosphere can respond to the periodic variations in solar radiation, the dynamic changes within the atmosphere itself can also produce quasi-27-day oscillations [16]. Researchers using the Chemical Climate Model (CCM) and the Whole Atmosphere Community Climate Model (WACCM) have shown that models can still output quasi-27-day variations even without the forcing conditions of solar radiation, implying that quasi-27-day variations in the atmospheric wind field and temperature are inherent features of the atmosphere [17,18]. Quasi-27-day oscillations propagating from below to above can also affect the ionosphere. Von Savigny, Peters, and Entzian [4] found that the amplitude of the standard phase height of the 27-day feature is greater during solar minima than solar maxima, suggesting that the feature is not only driven by photoionization of NO. The authors identified statistical evidence for the influence of ultra-long planetary waves on the standard phase height of the quasi-27-day feature during the winter months of the solar minimum. De Abreu et al. [19] studied the modulation of the ionospheric perturbation of planetary waves (PWs) by traveling waves (TPWID) in the F region. They found that the approximately 27-day TPWID long-period oscillations show distinct features in the equatorial region and at low latitudes.
In this study, we investigated the variations in TEC in the Wuhan area from 2001 to 2020. There have been few studies of middle latitudes over such a long period of time before. The solar F10.7 index and the geomagnetic Kp index were also used in this research. Through statistical analysis of these three data sets, the correlation between the ionospheric oscillations over Wuhan and the variations in solar and geomagnetic activity will be addressed. Moreover, a quasi-27-day ionospheric oscillation induced by internal atmospheric dynamical processes is also studied. This article fully reveals the formation mechanism of the ionospheric quasi-27-day oscillation and the unique properties of the ionospheric oscillations related to the harmonic oscillations of solar rotation at mid-latitudes.
The paper is organized as follows: Section 2 presents the data sets and the analysis method. Section 3 focuses on the correlation between the ionospheric oscillations with periods of 6–30 days and the corresponding periodic perturbations in the solar F10.7 index and geomagnetic activity Kp index. Section 3.3 presents a quasi-27-day ionospheric oscillation event induced by internal atmospheric dynamics. The discussion and summary are given in Section 4 and Section 5, respectively.

2. Data and Methods

For studies on the correlations between the variations in solar radiation or geomagnetic activity and the ionospheric oscillations, the F10.7 flux and Kp index were used.
The ionospheric response of the Wuhan area to solar and geomagnetic forcing was characterized by the TEC data from the International Global Navigation Satellite Systems Service (IGS) from 2001 to 2020. The IGS TEC, with geographic coordinates of 115°E and 30°N, was used to represent the Wuhan ionospheric variation. IGS-TEC data are well-known data that combines model data with observations from around the world to form a globally complete and consistent dataset using the laws of physics. The continuity and timescale of IGS-TEC provides an excellent opportunity to study ionospheric oscillations over a 20-year period.
TEC data derived by the BeiDou geostationary orbit (GEO) satellite receiver is superior to other GNSS observations in the study of regional ionospheric variation due to their spatial stability and continuity of observations [20,21,22]. However, due to the completion time of the BeiDou network, GEO-TEC is currently not up to the task of long-term regional ionospheric research. Therefore, the hourly ground-based GEO-TEC observations were used to examine the accuracy of the IGS-TEC for regional ionospheric variation studies. Figure 1 shows a comparison of IGS-TEC data and the GEO-TEC data during 2017. Figure 1a,b show the annual variation in IGS-TEC and GEO-TEC, respectively. It can be seen that IGS-TEC and GEO-TEC demonstrate a consistent seasonal variation. For an in-depth study of ionospheric oscillations, spectral analysis of TEC data is necessary. Before the spectral analysis, the short-period variations in TEC data were removed. A low-pass filter was utilized to smooth the TEC data and retain the fluctuation components with periods over 5 days. Filtered TEC data are shown in Figure 1c,d. Moreover, we analyzed the Filtered TEC data using the Morlet wavelet analysis technique. The Morlet wavelet was selected because it is widely used in the study of the ionosphere system and has a good performance in the analysis of oscillations [3,22,23]. Figure 1e–h showed the period–time variations in ionospheric oscillations from IGS-TEC and GEO-TEC, respectively. Similarly, the spectral analysis of the IGS-TEC and GEO-TEC demonstrate consistent variation. This means that IGS-TEC data can be applied to study regional ionospheric oscillations on medium timescales.
In this paper, the specified dynamics Whole Atmosphere Community Climate Model with thermosphere and ionosphere extension (SD-WACCM-X) was used to study atmospheric fluctuations at different altitudes. WACCM-X is a comprehensive atmospheric numerical model established by the National Center for Atmospheric Research (NCAR). This extended model version has a top boundary height ranging from 500 to 700 km. WACCM-X operates as the atmospheric component of the Community Earth System Model (CESM), which also includes land, ocean, sea ice, and land ice components. The WACCM-X model has been extensively utilized to study atmospheric waves (planetary waves, gravity waves, and tides), and agrees well with other model simulations and observations [24,25]. SD-WACCM-X data, constrained by the Modern-Era Retrospective Analysis for Research and Applications Version 2 (MERRA-2), were used in this work [26,27]. The temporal resolution of the numerical simulation results used to extract the PWs in the neutral atmosphere and ionosphere in this work is 1 day.
Moreover, the specific humidity and outgoing longwave radiation (OLR) were used as proxies of convective activity over the tropical region. We expect to explore the origin of the atmospheric oscillations by analyzing the OLR variations.
The least squares fitting was used to analyze the atmospheric oscillations, and the specific equation is as follows:
y = Acos 2 π     t T s λ + Bsin 2 π     t T s λ + C
where A, B, and C are coefficients; t represents the universal time; T represents the period of atmospheric oscillations (both units are converted to hours in the calculation); s is the zonal wavenumber, in which positive values represent the eastward direction; and λ   is the longitude (in radians) normalized by 2 π . Moreover, the total amplitude R is calculated from the in-phase and quadrature components A and B as follows:
R 2 T = A 2 T + B 2 T

3. Results

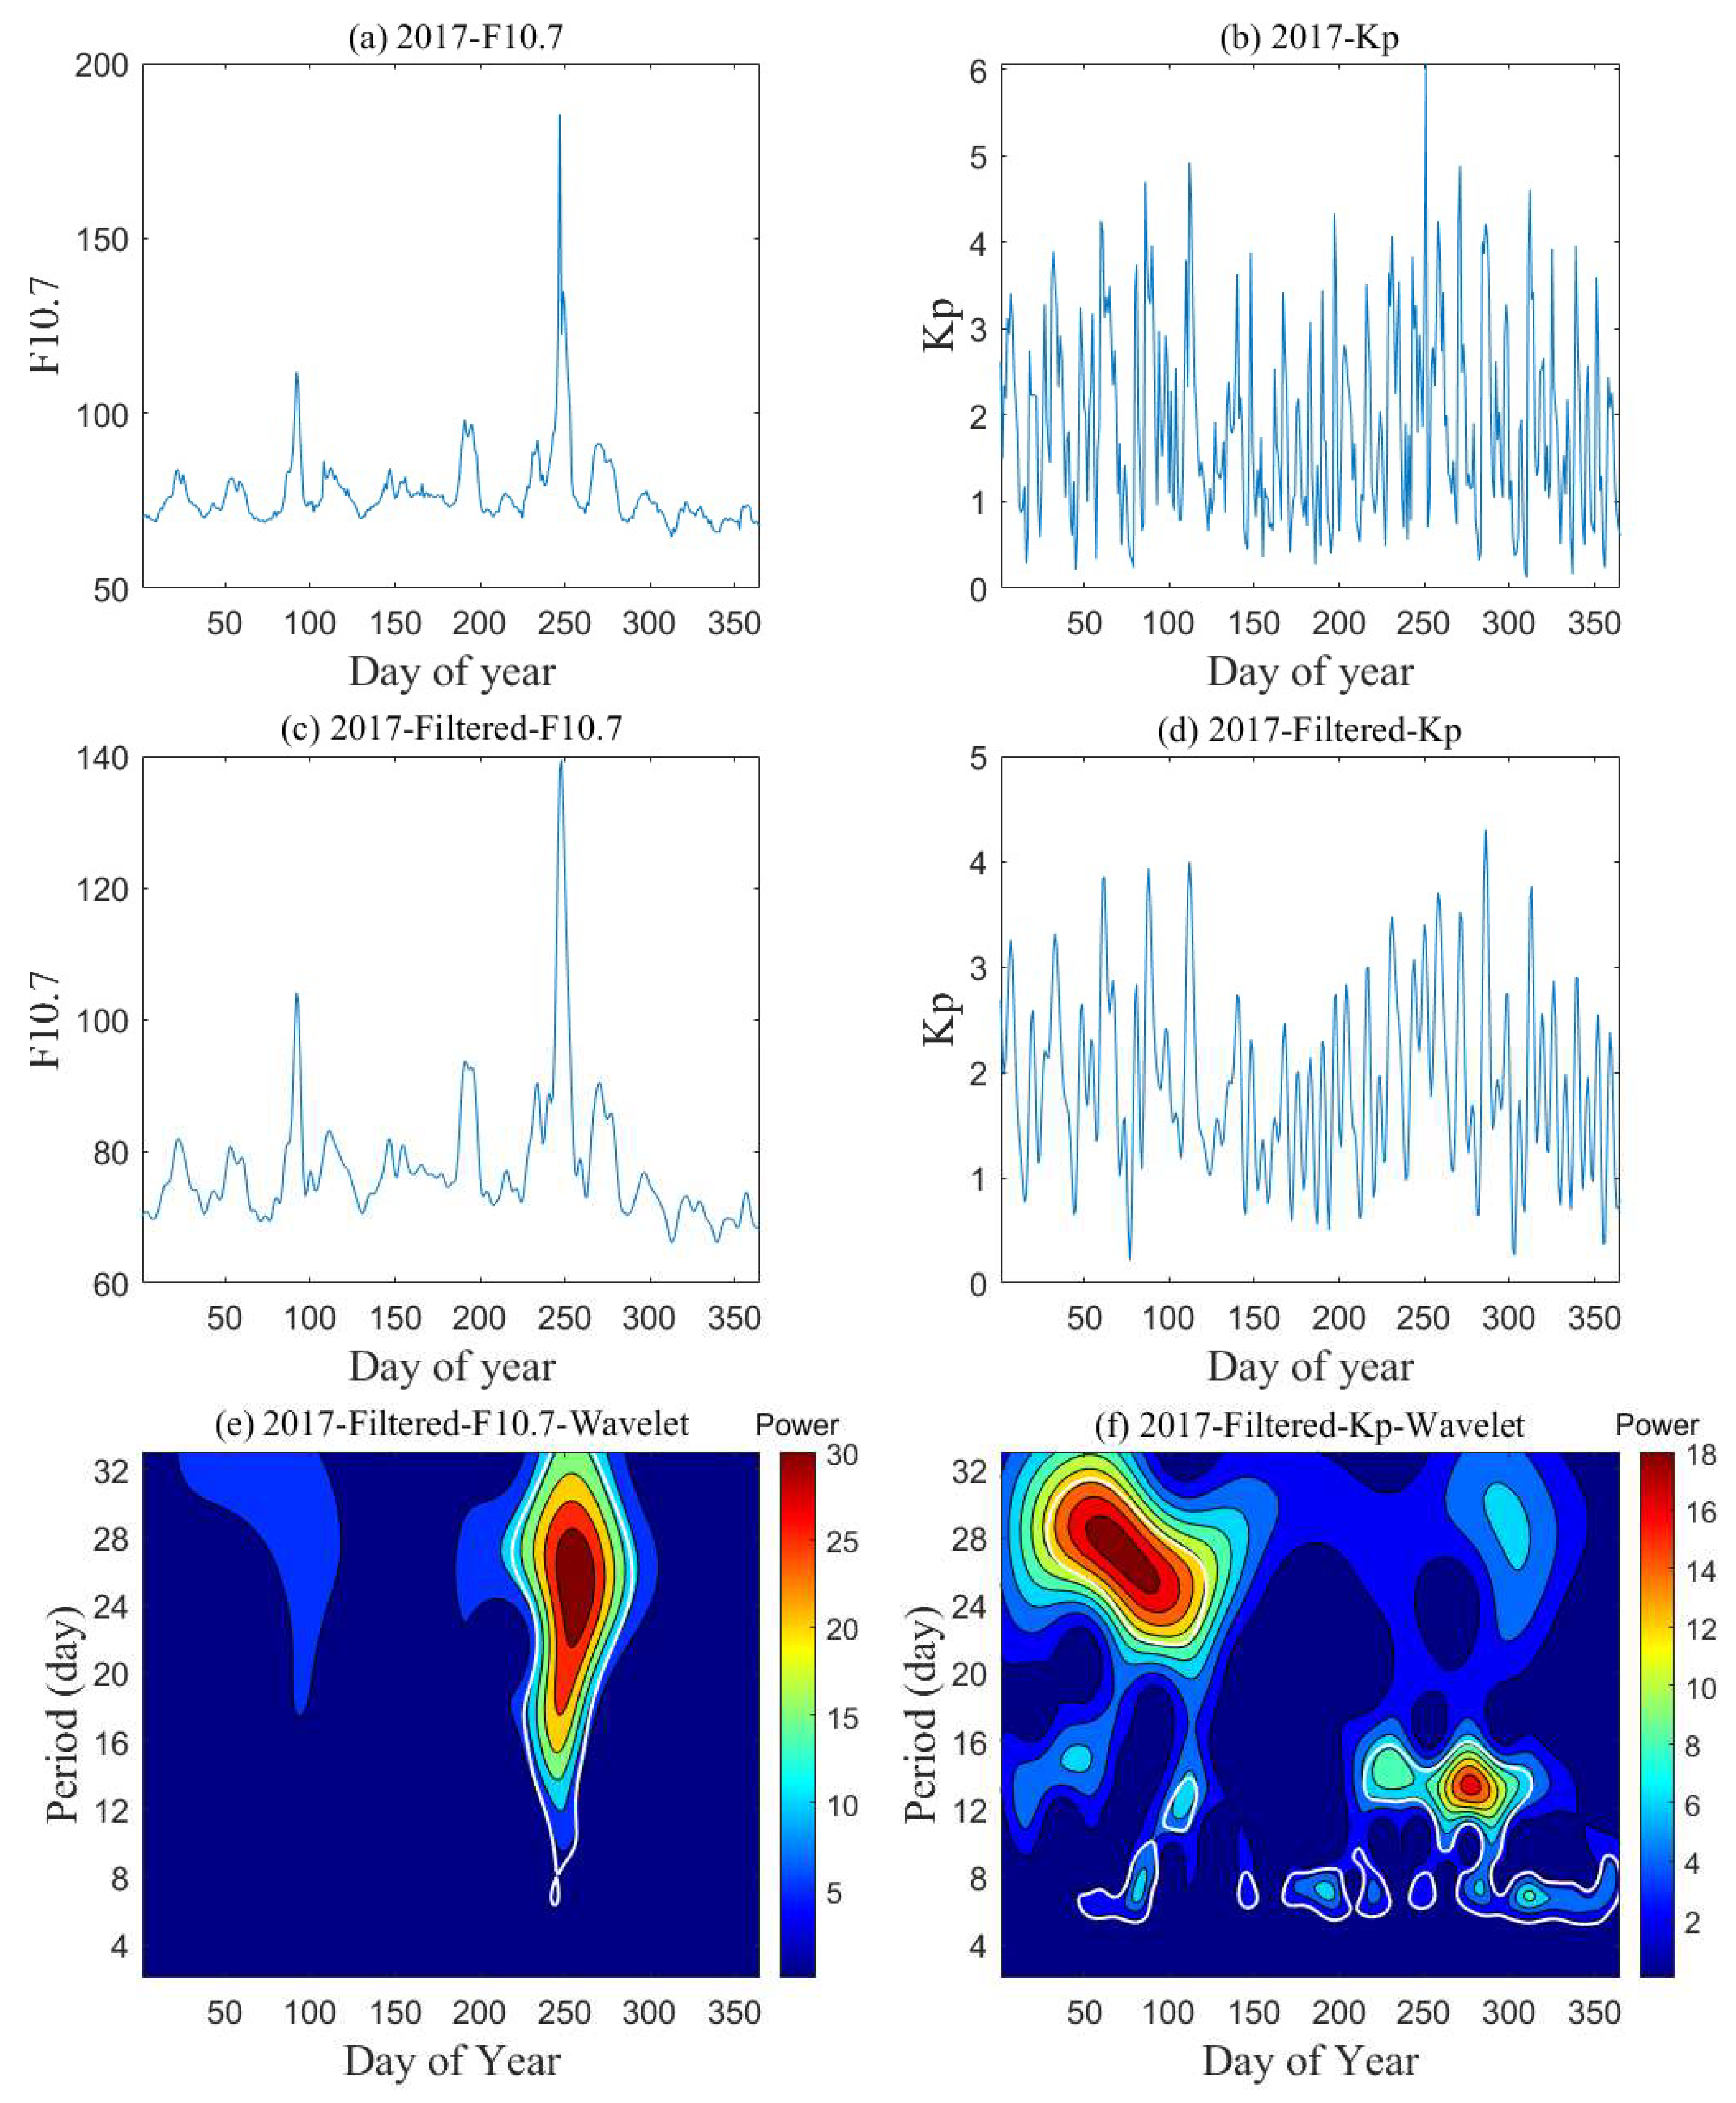
3.1. Periodic Variations in Solar and Geomagnetic Activity

In this section, we focus on the ionospheric oscillation in the Wuhan region from 2001 to 2020. Before analyzing the statistical results, we first examine multiday periodic oscillations in solar radiation and geomagnetic activity during the same period from 2001 to 2020.
In order to bring out the spectral features of the solar radiation and geomagnetic activity, we have applied the power spectral analysis technique, as shown in Figure 2. Figure 2 illustrates the Lomb-Scargle (LS) periodogram of the F10.7 and Kp indexes from 2001 to 2020. The blue curve represents the periodogram of F10.7 and the red curve represents the periodogram of Kp. The green vertical dash lines represent the four harmonic periods of solar rotation (27 days, 13.5 days, 9 days, and 6.75 days). The periodic oscillations in F10.7 have a prominent peak near 27 days. Similarly, the Kp index also has a peak at around 27 days. However, the periodic oscillations in the Kp index are not totally the same as in the F10.7 index. There are three other spectral peaks in the Kp index; the prominent peaks are around 9 days, not 27days, and the other weaker peaks are around 13.5 and 6.75 days. These peaks, with a period centering at the harmonic period of solar rotation, indicate that periodic energy from the Sun can strongly influence the Earth as it rotates. It is important to note that the solar rotation period is approximately 25 days at the solar equator and increases towards the solar poles. Since the Earth moves ahead in its orbit around the Sun by about a day and a half during a solar rotation, the solar rotation period as seen from Earth is approximately 27 days. Hence the observed solar period of more than 27 days (about 27 to 30 days) can be attributed to higher solar latitudes. Moreover, the end of a particular active solar region or the local variations of a dominant radiance from an activity solar region can also cause the observed solar period to be slightly less than 27 days [28]. The small variation in solar period is also reflected in the F10.7 and Kp indices. For clarity of presentation, we still use 27 days, 13.5 days, 9 days, and 6.75 days as the four harmonic periods of solar rotation in the following.
As an example, Figure 3 shows filter processing and wavelet analysis for the indices Kp and F10.7 for 2017. The filtering method for the Kp and F10.7 indices is the same as in Figure 1. The period ranges of the wavelet spectra are between 0 and 32 days. Both F10.7 and Kp exhibit strong oscillations, with a dominant period around 27 days. It is clear that the variation in solar and geomagnetic activities have a prominent period near 27 days, which is associated with solar rotation. However, during the year, the strong variations in solar radiation and geomagnetic activity occur at different times. Variation in F10.7 with a period centered at 27 days exhibit a weaker increase around DoY (Day of Year) 50–100 and a maximum increase around DoY 250, while the influence of recurring geomagnetic activities is centered around Days 50–100 and has a weaker increase near Day 300. Smaller amplitudes with periods around 13.5, 9 and 6.75 days can also be distinguished in the Kp wavelet spectra while there were no similar oscillations in the F10.7 spectra.
Figure 1e,g show the wavelet spectra of IGS-TEC in the Wuhan area for the same year (2017). The ionosphere exhibits two strong responses with periods near 27 days around DoY 100 and around DoY 260. Comparing Figure 1 and Figure 3, the ionospheric oscillation around DoY 100 is forced by a combination of solar and geomagnetic effects, the dominant forcing factor is the geomagnetic effect, and the ionospheric oscillation around DoY 260 is mainly forced by solar activity. Moreover, some short-period ionospheric responses can also be found to correspond to perturbations in the Kp spectra, such as the oscillation near DoY 150 and the oscillation near DoY 270. It is worth noting that the ionosphere does not respond to the geomagnetic oscillation each time, such as the oscillation between DoY 250 and 300 with a period of around 13.5 days. This is an interesting phenomenon and will be discussed in the subsequent presentation. In fact, there are many more ionospheric oscillations associated with the harmonic oscillations of the 27-day solar rotation (e.g., 27 days, 13.5 days, 9 days, and 6.75 days) between 2001 and 2020. Examples of ionospheric oscillations with different periods are shown in Figure 4. It is very meaningful to count these oscillations and reveal the laws of physics in them.

3.2. The Relationship between Solar or Geomagnetic Activity and Ionospheric Oscillation

The number of ionospheric oscillations with periods centering at the harmonic oscillations of solar rotation during 2001–2020 was counted first. We treated each local maximum in the time-period wavelet spectrum as an oscillation event, and the oscillation maximum value must be greater than one-quarter of the maximum annual variation in the wavelet spectrums. Moreover, due to the small variation in the solar period, oscillations with a local maximum of 25–30 are counted as 27-day oscillations, oscillations with a local maximum of 12.5–15 are counted as 13.5-day oscillations, oscillations with a local maximum of 8.3–10 are counted as 9-day oscillations, and oscillations with a local maximum of 6.25–7.5 are counted as 6.75-day oscillations. The statistical results are shown in Figure 5a. The ionospheric oscillations with a period of 27 days dominated the statistics, which is an expected result, as the 27-day oscillations dominated both spectra of the F10.7 and Kp indexes. Moreover, the ionospheric oscillations with a period of 9 days had the second-highest statistical placing, which also corresponds to the spectral results of the Kp index in Figure 2. However, the number of oscillations with a period of 13.5 days did not reach the third placing, which do not correspond to the spectral results of the Kp index in Figure 2. It seems that the response of the ionosphere in the Wuhan area is not very sensitive to geomagnetic oscillations with a period of 13.5 days. The LS periodogram of IGS-TEC in Wuhan from 2001 to 2018 are shown in Figure 5b, where the green vertical dash lines represent the four harmonic periods of solar rotation. As the IGS-TEC data for late 2019 was missing for ten days, the periodogram was analyzed over the range 2001 to 2018. Different from the dominant peak around 27-day, the other three types of ionospheric oscillations did not have a clear peak. It seems that the ionosphere does not respond well to the Kp oscillation with periods shorter than 20 days. To figure out the 6–16 days ionospheric oscillations, an LS periodogram with a period range of 6–16 days is shown in Figure 5c. Similar to the spectral result of the Kp index, the TEC have a dominant peak at around 9 days and a small peak at around 6.75 days. However, the TEC does not show a clear peak at around 13.5. In addition, the comparison in Figure 1g and Figure 3h above also illustrates the poor response of the ionosphere in the Wuhan area to the geomagnetic oscillation with a period shorter than 20 days, particularly 13.5 days.
The interannual distribution of the ionospheric oscillations with four different periods was counted in Figure 6. First, the interannual variation in solar activity is shown, as shown in Figure 6a. Earth experienced two solar maxima between 2001 and 2020, near 2002 and 2014, respectively. As for the ionospheric oscillations with a period of 27 days, as shown in Figure 6b, the number of oscillations occurring per year is relatively average. Figure 6c shows the ionospheric oscillations with a period of 13.5 days, although the overall number of oscillations is small, the vast majority of oscillations occur during the declining phase of solar activity. The interannual distribution of the ionospheric oscillations with a period of 9 days is shown in Figure 6d; the oscillation activity increases significantly with decreasing solar activity and reaches a peak at the deep solar minimum stage (2008 and 2019). As for the ionospheric oscillations with a period of 6.75 days, most oscillations also occur during periods of weaker solar activity, but there is no clear trend in the interannual distribution. Overall, for the three types of short-period oscillations, these ionospheric oscillations occur mostly in years near the solar minima.
The relationships between ionospheric oscillations and solar activity and geomagnetic activity were statistically determined. The relationships are divided into four types: (1) forced by both solar-geomagnetic activities; (2) forced by solar activity only; (3) forced by geomagnetic activity only; and (4) unforced by both solar and geomagnetic activities. As shown in Figure 7, the four type of relationships are indicated by blue, red, yellow, and purple, respectively. According to the statistics, 60% of the 27-day ionospheric oscillations are influenced by both solar-geomagnetic activities; 20% of the ionospheric 27-day oscillations are influenced by solar activity only; 12% of the ionospheric 27-day oscillations are influenced by solar geomagnetic only; and 8% of the ionospheric 27-day oscillations are unaffected by both solar and geomagnetic activities. This suggests that most of the 27-day ionospheric oscillations are caused by EUV radiation. A small amount is caused by geomagnetic activity, and a tiny number of uncorrelated oscillations may be caused by PWs induced by the lower atmosphere. It is worth mentioning that the 27-day ionospheric oscillations, which were only forced by geomagnetic activities, mostly occurred at the solar minimum stage. For the other three types of ionospheric oscillations, the vast majority of these ionospheric oscillations were forced by geomagnetic activity only.
Figure 8a shows the TEC variations of the 27-day oscillation over the Wuhan region (red solid line) and the 27-day oscillations in the F10.7 index (blue solid line) between 2001 and 2018. The oscillations in TEC show good agreement with the 27-day oscillation of F10.7; the overall correlation coefficient reached 0.789. Figure 8b shows the TEC variations of the 27-day oscillation over the Wuhan region (red solid line) and the 27-day oscillations in the Kp index (green solid line) between 2001 and 2018. It can be seen that the TEC phase differs largely from the Kp oscillation curve, especially during periods of high solar activity, with an overall correlation coefficient of only 0.046. However, during the low solar activity phase, the TEC and Kp curves become more consistent. This can be more clearly seen in Figure 8c, which gives the yearly correlation coefficients between the 27-day variations in the IGS-TEC and Kp index (blue solid line) and those for the F10.7 index (red solid line). The correlation between TEC and F10.7 has remained at a high level every year, and has a small drop at the solar minimum stage. However, the correlation between TEC and Kp is low in years of high solar activity, which cause the low overall coefficient but rises to a high level of correlation in years of low solar activity. Similar to Figure 8a–c, Figure 8d–f show the correlation coefficients between TEC variations over the 6–15 days oscillation for the Wuhan region and the 6–15 days oscillations in the F10.7 index or those for the Kp index from 2001 to 2018. The overall correlation between TEC and Kp is higher than the correlation between TEC and F10.7, which is consistent with the statistics in Figure 7, although only 0.29, which may be due to the fact that this cycle of TEC oscillations contains a lot of information on atmospheric fluctuations. In the yearly correlation coefficient curve, the TEC-Kp correlation increases significantly in low solar activity years, suggesting that most of the 6–15-day ionospheric oscillations in low solar activity years are caused by geomagnetic activity. Similar to Figure 5, the IGS-TEC in 2019 is missing ten days of data; therefore, given the continuity of the data, the correlations among the 2019 to 2020 TEC, Kp, and F10.7 were not examined.

3.3. A Quasi-27-Day Oscillation Forced by Lower Atmospheric Dynamics

According to the above statistics, the vast majority of the ionospheric oscillations with periods centering at the harmonic oscillations of solar rotations are caused by solar or geomagnetic activity. However, dynamical processes within the lower atmosphere are also capable of causing periodic oscillations in the ionosphere. Ignoring such effects, the generation mechanism of the ionospheric oscillations would be incomplete. Therefore, we analyzed a quasi-27-day ionospheric oscillation in 2002, which was considered in the statistical phase to be unforced by both solar and geomagnetic activities.
This event occurred around DoY 145 of 2002—an apparent quasi-27-day ionospheric oscillation that appears in the wavelet analysis of TEC. However, wavelet analysis of F10.7 and Kp was quiet during this time. To ensure that the quasi-27-day ionospheric oscillation was not caused by weak solar or geomagnetic activity, data from DoY 100 to 200 of 2002 (including TEC, F10.7, and Kp) were extracted for wavelet analysis, as shown in Figure 9. From Figure 9a, a quasi-27-day ionospheric oscillation does occur at around DoY 145. As for the F10.7 index, the solar activity was quiet during this time, with only some disturbance shown around DoY 190, as shown in Figure 9b. As for the Kp index, a geomagnetic oscillation occurs at around DoY 110, as shown in Figure 9c; however, there is a delay of about 35 days between the geomagnetic oscillation and the ionospheric oscillation. Past studies have shown that the ionosphere responds to solar or geomagnetic activity with a delay of less than 2 days [3,29,30], which suggests that geomagnetic oscillations are not the cause of the quasi-27-day ionospheric oscillation.
Having ruled out the solar and geomagnetic activity as the cause of the event, internal atmospheric dynamical process emerged as a possible cause. Using the neutral winds model data from SD-WACCM-X built by NCAR, the zonal winds at the latitude of the Wuhan area (31°N) were studied. A 90 km height was selected for the model data, to represent the variation in the zonal wind field in the mesosphere lower thermosphere (MLT) region. As shown in Figure 10a, the zonal winds over 31°N reveal quasi-27-day oscillations with a wave number of 0 around 90 km height. Variations in the quasi-27-day oscillation in the zonal winds are further fitted with a least-square fitting method at each altitude. The evolution is fitted using a sliding window with a 54-day length and a 1-day step. The quasi-27-day oscillation occurred in the MLT region, suggesting that the source of this oscillation is possibly to be in the lower atmosphere. Similarly, the temporal variation in the quasi-27-day oscillations at 90 km was extracted from zonal winds, as shown in Figure 10b. During DoY 140–160, significant quasi-27-days oscillations were observed in the zonal wind fields at the MLT region, and the oscillation is consistent in time with the quasi-27-day ionospheric oscillation in Figure 9a. This means that the oscillations in the MLT region and the ionospheric oscillations should be from the same excitation source.
The spatial structure of the quasi-27-day oscillation in atmospheric zonal wind is shown in Figure 10c. The result indicates that the oscillation is present throughout the northern hemisphere at 10–300 km. The wave amplitudes reach a peak above 70–90 km at 30°N–80°N latitude, and relatively weak oscillations occur in the thermosphere. The weaker oscillations in the thermosphere indicate that this quasi-27-day oscillation is not caused by solar or geomagnetic activity. The peak height of the quasi-27-day oscillation occurs in the MLT region, implying that the source of the oscillation is indeed from the lower atmosphere and that quasi-27-day atmospheric PWs are responsible for this oscillation.

4. Discussion

In this paper, we presented the medium timescale quasi-periodical ionospheric TEC response over Wuhan with solar (F10.7), geomagnetic (Kp), and internal atmospheric dynamics origin. The number of quasi-27-day oscillations in TEC was very evenly distributed between 2001 and 2020. Approximately 80% of the quasi-27-day oscillation in TEC correlates well with the 27 days variation in F10.7. As far as F10.7 is a proxy of the solar radiation intensity, it is clear that direct photochemistry contributes significantly to the medium timescale variation in the ionosphere. However, there are also some quasi-27-day oscillations forced by geomagnetic activity, which all occur at the minimum solar stage. The yearly correlation coefficients also reflect this phenomenon, with a significant increase in the correlation between the quasi-27-day oscillations of TEC and Kp during the low solar activity phase and, conversely, a small decrease in the correlation between TEC and F10.7 during this time. Therefore, the 27-day variation in the ionosphere is mainly the combined effects of variation in solar EUV radiation and recurrent geomagnetic activity associated with the high-speed streams/CIRs. Moreover, during the solar maximum, the moderate harmonic periods of 13.5-, 9-, and 6.75-day oscillations in the TEC are quite rare. However, during the solar minimum, this type of ionospheric oscillation occurs more frequently, and, according to the statistical results, most of these oscillations are possibly forced by geomagnetic activity. The overall correlation coefficients of 5–16-day oscillations between TEC and the Kp index also have a larger value than F10.7. Furthermore, the yearly correlation coefficients of the 5–16-day oscillations between TEC and the Kp index showed a significant increase during the low solar activity phase, which indicate that these oscillations are caused by the recurrent geomagnetic activity associated with the high-speed streams/CIRs. Therefore, we can conclude that during the solar minimum stage, the recurrent geomagnetic activity associated with the high-speed streams/CIRs becomes important. These results are consistent with previous studies [11,14,15,31].
Moreover, the TEC over the Wuhan area also exhibits some unique regional characteristics that do not respond well to the Kp oscillation with periods below 20 days. Past studies have indicated that the high-latitude energy input during geomagnetic storms primarily causes variation around the auroral oval as a result of Joule heating. The lower-middle latitudes and lower altitudes are changed, in turn, by the propagation and dissipation of large-scale waves generated near the auroral zone [32]. Therefore, the oscillation of the neutral component is weaker at mid-latitudes than at high latitudes. Then, electrodynamic oscillations in the ionosphere caused by a neutral atmosphere may be weaker at mid-latitudes, leading to the TEC over the Wuhan area not responding well to the Kp oscillation with periods below 20 days. Moreover, the lack of a significant 13.5-day periodicity may be related to many other processes, such as electrodynamic processes, planetary waves with a period of 10–16 days, and their non-linear interactions, and are present in the ionospheric region of mid-latitudes. These processes may obscure the effects of recurrent geomagnetic disturbances on the ionosphere.
The internal dynamics of the atmosphere are also an important factor in the generation of ionospheric oscillations. This reflects the complexity of the ionospheric oscillation mechanism. It is known that the PW-modulated tides can transfer the PW variability from the lower to the upper atmosphere and then affect the ionosphere [33]. Moreover, according to the linear wave theory [34], there is a quasi-27-day normal mode in the atmosphere. Therefore, the quasi-27-day ionospheric oscillation event during 2002, which was not forced by solar and geomagnetic activity, was studied. The activity of tropospheric convection in the atmosphere was revealed to be an important excitation source of oscillations in previous studies [22,35,36,37]. Convective activity can excite gravity waves to propagate upwards, and the gravity waves can be modulated by the quasi-27-day oscillation of the zonal wind in the troposphere [23,38]. As the gravity wave propagates upwards and breaks up, the momentum and energy deposited in the MLT region can induce quasi-27-day oscillations [23,39]. OLR is usually used to characterize convective activity [40]. Takahashi [41] found that, for the maximum years of solar activity, the yearly spectra of OLR are characterized by two peaks. One is in the period range of 40–60 days, and the other one with a period of about 27 days. This quasi-27-day oscillation event occurred exactly in 2002 and was the solar maximum of the 23rd solar cycle. Therefore, we analyzed the periodic variation of the OLR at 31°N. Similarly, the evolution is fitted using a sliding window with a 54-day length and a 1-day step, the same as in Figure 10. From Figure 11, the OLR clearly exhibits a quasi-27-day period, and there is a clear peak in the amplitude of the quasi-27-day oscillation during DoY 140–160, which is highly consistent with the quasi-27-day oscillations in the zonal wind and TEC, as shown in Figure 9a and Figure 10b. This means that this quasi-27-day oscillation may be from convective activity. Therefore, the strong 27-day oscillation from the lower atmosphere to the ionosphere may be an atmospheric response to forcing due to the convective activity for a period of around 27 days in the tropical region. Moreover, from Figure 10c, the oscillation in zonal wind have a peak region at 20°N–30°N and 10–15 km also confirms this result.

5. Conclusions

In this paper, we analyzed medium timescale TEC oscillations over the Wuhan area with periods centering at 27 days, 13.5 days, 9 days, and 6.75 days. This research is based on the IGS-TEC data set spanning 20 years (2001–2020) and the corresponding solar and geomagnetic indices (F10.7 and Kp). The correlations between the ionospheric oscillations and corresponding periodic variations in the solar F10.7 index and geomagnetic activity Kp index were studied. Moreover, the model data from SD-WACCM-X and the specific humidity and outgoing longwave radiation were used to investigate the contribution of internal atmospheric dynamics to these TEC oscillations. Different forcing mechanisms reveal complexities in the origin of medium timescale ionospheric oscillations. We have fully explored this series of mechanisms and hope to gain a clearer understanding. The main conclusions are as follows:
  • The 27-day ionospheric oscillations are strongest and have a high correlation coefficient with the solar flux index F10.7 but have a small decrease in correlation at the solar minimum stage. However, the correlation coefficients between the ionospheric oscillations and Kp index have a significant increase at the solar minimum stage. This results in a relatively even interannual distribution of the 27-day ionospheric oscillations. It indicates that the solar EUV radiations and recurrent geomagnetic activity associated with the high-speed streams/CIRs have a combined effect on the ionospheric oscillations with periods near solar rotation.
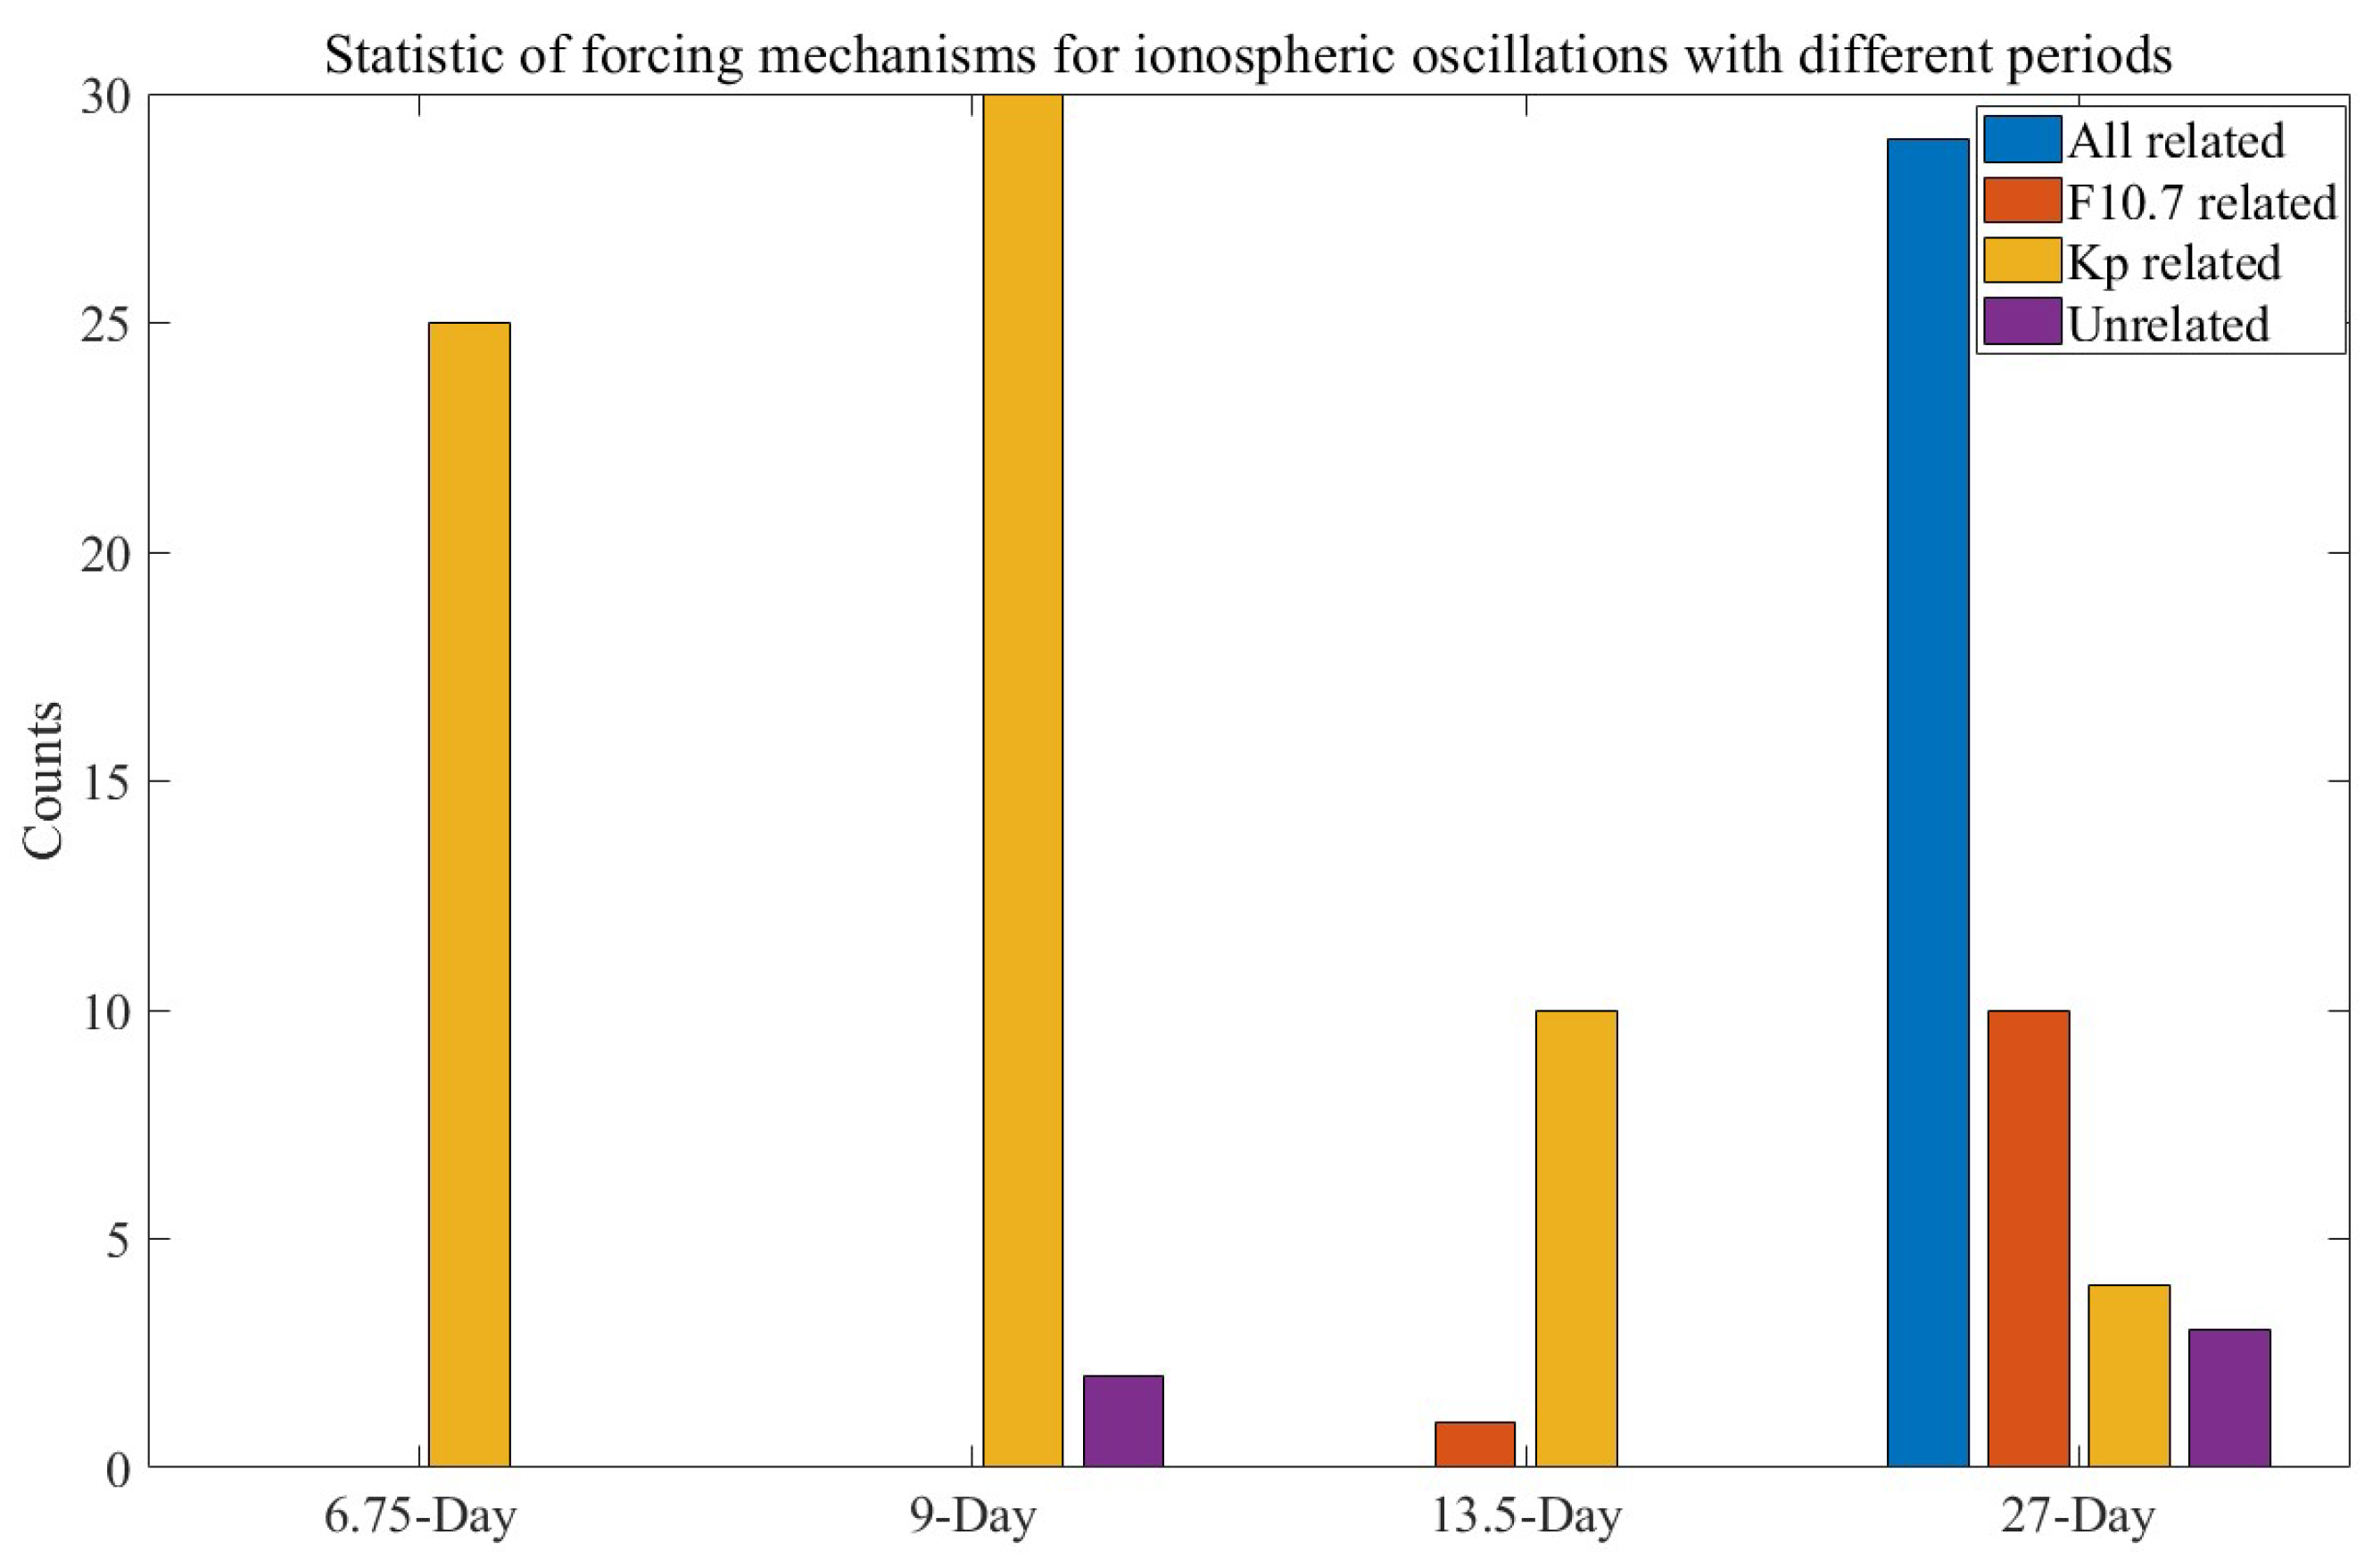
  • The ionospheric oscillations with periods shorter than 20 days correlate better with the Kp index. This type of ionospheric oscillation occurs mostly at the minimum solar stage. And the correlation coefficient between the Kp index and TEC also has a significant increase at the minimum solar stage. This indicates that these ionospheric oscillations are most likely caused by coronal hole high-speed streams and CIRs.
  • The spectral peak with periods of 27 days in TEC over the Wuhan area corresponds to the periodic variations of the F10.7 and Kp index of the corresponding periods. However, the spectral peak with periods shorter than 20 days in TEC over the Wuhan area did not have dominating spectral peaks. The mid-latitude ionosphere exhibits unique regional properties, which did not respond well to the Kp oscillation with periods shorter than 20 days.
  • A quasi-27-day ionospheric oscillation caused by variations in the lower atmosphere dynamical process was studied. According to zonal winds model data from SD-WACCM-X, the quasi-27-day oscillation event was found have a peak amplitude in the lower atmosphere (the MLT region), which indicates that this oscillation is generated by the lower atmospheric PWs and propagates upwards. Moreover, similar oscillations were also found in the OLR, which represents the convective activity, suggesting that this oscillation may be forced by convective activity.

Author Contributions

Conceptualization, Z.Y. and S.-Y.G.; methodology, Z.Y.; software, Z.Y. and C.-K.-M.T.; validation, Z.Y., Y.Q. and S.-Y.G.; formal analysis, Z.Y.; investigation, Z.Y.; resources, Z.Y. and Y.W.; data curation, Z.Y.; writing—original draft preparation, Z.Y.; writing—review and editing, Z.Y.; visualization, Z.Y.; supervision, Z.Y. and S.-Y.G.; project administration, Z.Y.; funding acquisition, X.D. All authors have read and agreed to the published version of the manuscript.

Funding

This research is funded by the National Natural Science Foundation of China (41831071, 42188101 and 41874181), the B-type Strategic Priority Program of the Chinese Academy of Sciences (Grant XDB41000000), and the Chinese Meridian Project.

Data Availability Statement

The IGS TEC products can be downloaded at https://www.igs.org/products-access/, accessed on 14 June 2022. The Beidou GEO TEC data were provided by the Beijing National Observatory of Space Environment, Institute of Geology and Geophysics Chinese Academy of Sciences through the Geophysics Center, National Earth System Science Data Center (http://wdc.geophys.ac.cn). WACCM-X is an open-source software with source code publicly available at https://escomp.github.io/CESM/; The atmospheric forcing data, which are regridded from the MERRA-2 data set and used to run SD-WACCM-X, can be dowloaded at https://rda.ucar.edu/datasets/ds313.3/. The OLR at https://www.esrl.noaa.gov/psd; The solar flux proxy data were downloaded from https://omniweb.gsfc.nasa.gov; The Kp index at https://kp.gfz-potsdam.de/en/.

Acknowledgments

The GEO-TEC data in the article were provided by Beijing National Observatory of Space Environment, Institute of Geology and Geophysics Chinese Academy of Sciences through the Geophysics center, National Earth System Science Data Center (http://wdc.geophys.ac.cn).

Conflicts of Interest

The authors declare no conflict of interest.

References

  1. Xu, J.; Wang, W.; Zhang, S.; Liu, X.; Yuan, W. Multiday thermospheric density oscillations associated with variations in solar radiation and geomagnetic activity. J. Geophys. Res. Space Phys. 2015, 120, 3829–3846. [Google Scholar] [CrossRef]
  2. Bartels, J. Twenty-seven day recurrences in terrestrial-magnetic and solar activity, 1923–1933. J. Geophys. Res. 1934, 39, 201. [Google Scholar] [CrossRef]
  3. Kutiev, I.; Otsuka, Y.; Pancheva, R.; Heelis, R. Response of low-latitude ionosphere to medium-term changes of solar and geomagnetic activity. J. Geophys. Res. Space Phys. 2012, 117. [Google Scholar] [CrossRef] [Green Version]
  4. von Savigny, C.; Peters, D.H.W.; Entzian, G. Solar 27-day signatures in standard phase height measurements above central Europe. Atmos. Chem. Phys. 2019, 19, 2079–2093. [Google Scholar] [CrossRef] [Green Version]
  5. Rich, F.J. The 27-day variations of plasma densities and temperatures in the topside ionosphere. J. Geophys. Res. 2003, 108. [Google Scholar] [CrossRef]
  6. Min, K.; Park, J.; Kim, H.; Kim, V.; Kil, H.; Lee, J.; Rentz, S.; Lühr, H.; Paxton, L. The 27-day modulation of the low-latitude ionosphere during a solar maximum. J. Geophys. Res. Space Phys. 2009, 114. [Google Scholar] [CrossRef] [Green Version]
  7. Xu, J.; Wang, W.; Lei, J.; Sutton, E.K.; Chen, G. The effect of periodic variations of thermospheric density on CHAMP and GRACE orbits. J. Geophys. Res. Space Phys. 2011, 116. [Google Scholar] [CrossRef] [Green Version]
  8. Hansen, R.T.; Hansen, S.F.; Sawyer, C. Long-lived coronal structures and recurrent geomagnetic patterns in 1974. Planet. Space Sci. 1976, 24, 381–388. [Google Scholar] [CrossRef]
  9. Tsurutani, B.T.; Gonzalez, W.D.; Gonzalez, A.L.C.; Guarnieri, F.L.; Gopalswamy, N.; Grande, M.; Kamide, Y.; Kasahara, Y.; Lu, G.; Mann, I.; et al. Corotating solar wind streams and recurrent geomagnetic activity: A review. J. Geophys. Res. 2006, 111. [Google Scholar] [CrossRef] [Green Version]
  10. Lei, J.; Thayer, J.P.; Forbes, J.; Sutton, E.; Nerem, R.S.; Temmer, M.; Veronig, A. Global thermospheric density variations caused by high-speed solar wind streams during the declining phase of solar cycle 23. J. Geophys. Res. Space Phys. 2008, 113. [Google Scholar] [CrossRef]
  11. Wang, W.; Lei, J.; Burns, A.G.; Qian, L.; Solomon, S.C.; Wiltberger, M.; Xu, J. Ionospheric Day-to-Day Variability Around the Whole Heliosphere Interval in 2008. Sol. Phys. 2011, 274, 457–472. [Google Scholar] [CrossRef] [Green Version]
  12. Sojka, J.J.; McPherron, R.L.; van Eyken, A.P.; Nicolls, M.J.; Heinselman, C.J.; Kelly, J.D. Observations of ionospheric heating during the passage of solar coronal hole fast streams. Geophys. Res. Lett. 2009, 36. [Google Scholar] [CrossRef] [Green Version]
  13. Ma, Z.; Gong, Y.; Zhang, S.; Xue, J.; Luo, J.; Zhou, Q.; Huang, C.; Huang, K.; Yu, Y.; Li, G. Study of a Quasi-27-Day Wave in the MLT Region During Recurrent Geomagnetic Storms in Autumn 2018. J. Geophys. Res. Space Phys. 2021, 126. [Google Scholar] [CrossRef]
  14. Yu, B.; Scott, C.J.; Xue, X.; Yue, X.; Chi, Y.; Dou, X.; Lockwood, M. A Signature of 27 day Solar Rotation in the Concentration of Metallic Ions within the Terrestrial Ionosphere. Astrophys. J. Lett. 2021, 916, 106. [Google Scholar] [CrossRef]
  15. Jiang, G.; Wang, W.; Xu, J.; Yue, J.; Burns, A.G.; Lei, J.; Mlynczak, M.G.; Rusell, J.M. Responses of the lower thermospheric temperature to the 9 day and 13.5 day oscillations of recurrent geomagnetic activity. J. Geophys. Res. Space Phys. 2014, 119, 4841–4859. [Google Scholar] [CrossRef]
  16. Hoffmann, C.G.; von Savigny, C. Indications for a potential synchronization between the phase evolution of the Madden–Julian oscillation and the solar 27-day cycle. Atmos. Chem. Phys. 2019, 19, 4235–4256. [Google Scholar] [CrossRef] [Green Version]
  17. Schanz, A.; Hocke, K.; Kämpfer, N. On forced and free atmospheric oscillations near the 27-day periodicity. Earth Planets Space 2016, 68, 97. [Google Scholar] [CrossRef] [Green Version]
  18. Sukhodolov, T.; Rozanov, E.; Ball, W.T.; Peter, T.; Schmutz, W. Modeling of the middle atmosphere response to 27-day solar irradiance variability. J. Atmos. Sol.-Terr. Phys. 2017, 152–153, 50–61. [Google Scholar] [CrossRef] [Green Version]
  19. de Abreu, A.J.; Fagundes, P.R.; Bolzan, M.J.A.; de Jesus, R.; Pillat, V.G.; Abalde, J.R.; Lima, W.L.C. The role of the traveling planetary wave ionospheric disturbances on the equatorial F region post-sunset height rise during the last extreme low solar activity and comparison with high solar activity. J. Atmos. Sol.-Terr. Phys. 2014, 113, 47–57. [Google Scholar] [CrossRef]
  20. Hu, L.; Yue, X.; Ning, B. Development of the Beidou Ionospheric Observation Network in China for space weather monitoring. Space Weather 2017, 15, 974–984. [Google Scholar] [CrossRef]
  21. Yang, H.; Yang, X.; Zhang, Z.; Zhao, K. High-Precision Ionosphere Monitoring Using Continuous Measurements from BDS GEO Satellites. Sensors 2018, 18, 714. [Google Scholar] [CrossRef] [Green Version]
  22. Yang, Z.; Gu, S.Y.; Qin, Y.; Teng, C.K.M.; Huang, F.; Sun, W.; Dou, X. Statistical Study of F-Region Short Period Ionospheric Disturbances Related to Convection in the Lower Atmosphere Over Wuhan, China. Space Weather 2022, 20. [Google Scholar] [CrossRef]
  23. Cheng, H.; Huang, K.; Liu, A.Z.; Zhang, S.; Huang, C.; Gong, Y. A quasi-27-day oscillation activity from the troposphere to the mesosphere and lower thermosphere at low latitudes. Earth Planets Space 2021, 73, 183. [Google Scholar] [CrossRef]
  24. Liu, H.L.; Bardeen, C.G.; Foster, B.T.; Lauritzen, P.; Liu, J.; Lu, G.; Marsh, D.R.; Maute, A.; McInerney, J.M.; Pedatella, N.M.; et al. Development and Validation of the Whole Atmosphere Community Climate Model With Thermosphere and Ionosphere Extension (WACCM-X 2.0). J. Adv. Model. Earth Syst. 2018, 10, 381–402. [Google Scholar] [CrossRef] [Green Version]
  25. Atmospheric Chemistry Observations & Modeling (ACOM)/National Center for Atmospheric Research/University Corporation for Atmospheric Research, and Climate and Global Dynamics (CGD) Division/National Center for Atmospheric Research/University Corporation for Atmospheric Research. 2018. Available online: https://escomp.github.io/CESM/ (accessed on 11 July 2022).
  26. Gelaro, R.; McCarty, W.; Suárez, M.J.; Todling, R.; Molod, A.; Takacs, L.; Randles, C.A.; Darmenov, A.; Bosilovich, M.G.; Reichle, R.; et al. The Modern-Era Retrospective Analysis for Research and Applications, Version 2 (MERRA-2). J. Clim. 2017, 30, 5419–5454. [Google Scholar] [CrossRef]
  27. MERRA2 Global Atmosphere Forcing Data [Dataset] (Updated Irregularly). Research Data Archive at the National Center for Atmospheric Research, Computational and Information Systems Laboratory. Available online: https://rda.ucar.edu/datasets/ds313.3/ (accessed on 14 June 2022).
  28. Kane, R.P. Fluctuations in the ∼27-day sequences in the solar index F10 during solar cycles 22–23. J. Atmos. Sol.-Terr. Phys. 2003, 65, 1169–1174. [Google Scholar] [CrossRef]
  29. Ren, D.; Lei, J.; Wang, W.; Burns, A.; Luan, X.; Dou, X. Does the Peak Response of the Ionospheric F 2 Region Plasma Lag the Peak of 27-Day Solar Flux Variation by Multiple Days? J. Geophys. Res. Space Phys. 2018, 123, 7906–7916. [Google Scholar] [CrossRef]
  30. Schmölter, E.; Berdermann, J.; Codrescu, M. The Delayed Ionospheric Response to the 27-day Solar Rotation Period Analyzed with GOLD and IGS TEC Data. J. Geophys. Res. Space Phys. 2021, 126. [Google Scholar] [CrossRef]
  31. Burns, A.G.; Solomon, S.C.; Qian, L.; Wang, W.; Emery, B.A.; Wiltberger, M.; Weimer, D.R. The effects of Corotating interaction region/High speed stream storms on the thermosphere and ionosphere during the last solar minimum. J. Atmos. Sol.-Terr. Phys. 2012, 83, 79–87. [Google Scholar] [CrossRef]
  32. Burns, A.G.; Wang, W.; Solomon, S.C.; Qian, L. Energetics and Composition in the Thermosphere. In Modeling the Ionosphere—Thermosphere System; American Geophysical Union: Washington, DC, USA, 2014. [Google Scholar]
  33. Pancheva, D.; Mitchell, N.; Clark, R.R.; Drobjeva, J.; Lastovicka, J. Variability in the maximum height of the ionospheric F2-layer over Millstone Hill (September 1998–March 2000); influence from below and above. Ann. Geophys. 2002, 20, 1807–1819. [Google Scholar] [CrossRef]
  34. Andrews, D.G.; Holton, J.R.; Leovy, C.B. Middle Atmosphere Dynamics; Academic Press: Cambridge, MA, USA, 1987. [Google Scholar]
  35. Liu, T.; Yu, Z.; Ding, Z.; Nie, W.; Xu, G. Observation of Ionospheric Gravity Waves Introduced by Thunderstorms in Low Latitudes China by GNSS. Remote Sens. 2021, 13, 4131. [Google Scholar] [CrossRef]
  36. Luo, W.; Xiong, C.; Xu, J.; Zhu, Z.; Chang, S. The Low-Latitude Plasma Irregularities after Sunrise from Multiple Observations in Both Hemispheres during the Recovery Phase of a Storm. Remote Sens. 2020, 12, 2897. [Google Scholar] [CrossRef]
  37. Wen, Y.; Jin, S. Traveling Ionospheric Disturbances Characteristics during the 2018 Typhoon Maria from GPS Observations. Remote Sens. 2020, 12, 746. [Google Scholar] [CrossRef] [Green Version]
  38. Huang, K.M.; Liu, A.Z.; Zhang, S.D.; Yi, F.; Huang, C.M.; Gan, Q.; Gong, Y.; Zhang, Y.H.; Wang, R. Observational evidence of quasi-27-day oscillation propagating from the lower atmosphere to the mesosphere over 20° N. Ann. Geophys. 2015, 33, 1321–1330. [Google Scholar] [CrossRef] [Green Version]
  39. Vadas, S.L. Horizontal and vertical propagation and dissipation of gravity waves in the thermosphere from lower atmospheric and thermospheric sources. J. Geophys. Res. Space Phys. 2007, 112. [Google Scholar] [CrossRef]
  40. Arkin, P.A.; Ardanuy, P.E. Estimating Climatic-Scale Precipitation from Space: A Review. J. Clim. 1989, 2, 1229–1238. [Google Scholar] [CrossRef]
  41. Takahashi, Y.; Okazaki, Y.; Sato, M.; Miyahara, H.; Sakanoi, K.; Hong, P.K.; Hoshino, N. 27-day variation in cloud amount in the Western Pacific warm pool region and relationship to the solar cycle. Atmos. Chem. Phys. 2010, 10, 1577–1584. [Google Scholar] [CrossRef]
Figure 1. (a,b) The original data from IGS (Beidou GEO)-TEC during 2017. (c,d) The filtered IGS (Beidou GEO)-TEC data during 2017 after filtering by the low-pass filter. (e,f) Wavelet spectrums of the filtered IGS (Beidou GEO)-TEC during 2017 with a period range of 16–32 days. (g,h) Same as (e,f), but the period range is 0–16 days.
Remotesensing 14 05895 g001
Figure 2. The Lomb-Scargle (LS) periodogram of the original F10.7 (Kp) index. The blue curve represents the periodogram of F10.7 and the red curve represents the periodogram of Kp. The green vertical dash lines represent the four harmonic periods of solar rotation.
Remotesensing 14 05895 g002
Figure 3. (a,b) The original data from the F10.7 (Kp) index during 2017. (c,d) The F10.7 (Kp) index during 2017 after filtering with a low-pass filter. (e,f) Wavelet spectrums of the filtered F10.7 (Kp) index during 2017.
Remotesensing 14 05895 g003
Figure 4. Examples of the ionospheric oscillations with period centering at the four harmonic periods of solar rotation.
Remotesensing 14 05895 g004
Figure 5. (a) Counts of ionospheric oscillations with periods centering at the four harmonic periods of solar rotation. (b) The Lomb-Scargle (LS) periodogram of the original IGS-TEC data during 2001–2018 with a period range of 6–30 days. The green vertical dash lines represent the four harmonic periods of solar rotation. (c) Same as (b), but the period range is 6–16 days.
Remotesensing 14 05895 g005
Figure 6. The annual variation in solar activity and ionospheric oscillations with periods centering at the four harmonic periods of solar rotation.
Remotesensing 14 05895 g006
Figure 7. Four types of relationships between the different ionospheric oscillations with solar activity and geomagnetic activity.
Remotesensing 14 05895 g007
Figure 8. (a,b) The amplitude variations of the 27 (6-15)-day oscillations in TEC (red line) and F10.7 (blue line) during 2001–2018. (c,d) The amplitude variations of the 27 (6–15)-day oscillations in TEC (red line) and Kp (green line) during 2001–2018. (e,f) The comparison of the yearly correlation coefficient of the 27 (6–15)-day oscillations in TEC-F10.7 (red line) and TEC-Kp (blue line).
Remotesensing 14 05895 g008
Figure 9. (ac) Wavelet analysis of IGS-TEC, F10.7, and Kp oscillation during Days 100–200, 2002.
Remotesensing 14 05895 g009
Figure 10. (a,b) The period–wavenumber power spectra (the period–time power spectra) of zonal wind at 90 km height during day 100–200, 2002. (c) The spatial structure of the 27-day oscillations in the zonal wind with wavenumber 0.
Remotesensing 14 05895 g010
Figure 11. The period–time power spectra of OLR during Days 100–200, 2002.
Remotesensing 14 05895 g011
Publisher’s Note: MDPI stays neutral with regard to jurisdictional claims in published maps and institutional affiliations.

