Article

Multiscale Detection and Assessment of Vegetation Eco-Environmental Restoration following Ecological Water Compensation in the Lower Reaches of the Tarim River, China

1
School of Geography, Geomatics, and Planning, Jiangsu Normal University, Xuzhou 221116, China
2
Key Laboratory of Virtual Geographic Environment (Nanjing Normal University), Ministry of Education, Nanjing 210023, China
3
State Key Laboratory of Remote Sensing Science, Aerospace Information Research Institute, Chinese Academy of Sciences, Beijing 100049, China
4
State Key Laboratory of Desert and Oasis Ecology, Institute of Xinjiang Ecology and Geography, Chinese Academy of Sciences, Urimuq 830011, China
*
Author to whom correspondence should be addressed.
Remote Sens. 2022, 14(22), 5855; https://doi.org/10.3390/rs14225855
Submission received: 22 October 2022 / Revised: 10 November 2022 / Accepted: 16 November 2022 / Published: 18 November 2022
(This article belongs to the Special Issue Environmental Stress and Natural Vegetation Growth)

Abstract

:
To protect and restore this downstream ecosystem, the Tarim River Basin Administration Bureau (TBAB) initiated the Ecological Water Compensation (EWC) project from 2000 to 2018. Revealing the mechanism of vegetation-hydroecological response processes in the lower reaches of the Tarim River before and after EWC work is conducive to water resource planning, utilization and protection. In this paper, the spatiotemporal responses of vegetation and groundwater to EWC were examined at the points, lines, and area (PLA) scale by coupling remote sensing techniques and field station observation data collected between 2000 and 2017. The findings indicated that (1) In general, the regional fractional vegetation coverage (FVC) increased significantly, and the average FVC growth rate was 3.5%/year from 2000 to 2017 (R2 > 0.84, p < 0.01, 2-tailed). (2) The regional vegetation restoration process showed obvious fluctuations and stage characteristics, but the spatial scope of the significantly increased vegetation area was limited. Plants grew rapidly within 10 km of the river, while 10 km away from the water channel, no obvious change was observed. (3) Strong coupling relationships were identified among the FVC growth, EWC volume and groundwater depth variations (p < 0.05, 2-tailed). The response times of the regional vegetation and groundwater depth to EWC indicated one-year lags. The above results imply that the regional ecological environment was significantly improved over the study period, thus confirming that the EWC project made remarkable accomplishments. However, the effect of ecological restoration is not sufficiently stable at present. Vegetation restoration has mainly been centralized around the river channel and is greatly dependent on the annual EWC volume. In addition, the local conditions begin to degrade soon after an EWC project is terminated, and vice versa; when EWC commences, the FVC immediately begins to improve. Therefore, the current EWC achievements need to be further consolidated and strengthened in the future.

1. Introduction

The Tarim River is a well-known inland river in the arid area of China, and the region containing its lower reaches has experienced serious ecosystem degradation in the last century since the 1960s, due to undue water resource utilization in the midstream and upstream regions [1,2,3]. The area of cultivated land and volume of water used for agricultural irrigation have increased significantly over the past 60 years, leading to water exhaustion in the lower reaches of the Tarim River. Specifically following the construction of the Daxihaizi Reservoir in 1972, the lower reaches below the reservoir dried up for approximately 20 years [1,4,5,6]. Consequently, the ground water declined sharply, and the local vegetation deteriorated [5,7,8]. Many policies and measures have been implemented to restore the ecological environment of the lower reaches of the Tarim River since 2000 [2,5]. Until the end of 2018, the Ecological Water Compensation (EWC) project, which transferred the upstream water to the downstream region through the Daxihaizi Reservoir, was implemented each year for 18 years, and the accumulated water volume from the Daxihaizi Reservoir reached 6.235 billion m3.
Evaluating the ecological and environmental effects of EWC is critical for guiding the water management and agriculture development scale, and many studies have evaluated effects of EWC in the fields of ecology, biology, and hydrology [9]. Monitoring environmental changes and evaluating their responses to EWC projects have become popular topics of research [1,2,9,10,11,12,13,14]. Such studies have been conducted from different perspectives, such as (1) ground water level rise, (2) biodiversity conservation, (3) Populus euphratica growth, (4) desert vegetation restoration, and (5) land cover changes. However, these previous studies mainly concentrated on evaluating the EWC project based on field observations and remote sensing technologies. The full time-series changes in vegetation cover and the linkages between vegetation restoration and hydroecological processes associated with the EWC project need further research. Moreover, the EWC project did not transfer sufficient water to the lower reach of the Tarim River due to excessive water consumption in the upstream region and climate change, leading to ecological degradation in the middle stream and a drop in the level of Bosten Lake after the 7th EWC in 2005. The annual goal of the EWC project, to achieve the planned water volume of 3.5 × 10⁸ m3 per year, usually failed [6,15,16]. Therefore, an integrated assessment of the benefits and limitations of the EWC project is necessary if we are to understand the hydrological and ecological responses of natural vegetation to water compensation efforts [5]. It is necessary to examine the ecological and hydrological response processes from a multiscale and long-time-series perspective using a variety of technical means.
Spatiotemporal vegetation coverage changes are regarded as vegetation activity and are among the most important indicators for evaluating the regional ecological environment [14]; in addition, vegetation dynamic changes in arid regions are sensitive to regional hydrological and ecological processes [3,17]. However, some studies have concentrated on field investigations of riparian forest vegetation, e.g., P. euphratica [4,13,18,19,20,21]. However, little comprehensive or continuous vegetation restoration monitoring has been performed at the regional scale [2]. For large-scale vegetation coverage surveys, remote sensing is an irreplaceable technical tool [22]. Some pioneers have attempted to monitor eco-environmental changes in the lower reaches of the Tarim River through the use of various vegetation indices (e.g., the normalized difference vegetation index (NDVI) and the enhanced vegetation index (EVI)) and the fractional vegetation coverage (FVC) using remote sensing technologies [15,23]. However, in arid regions, the NDVI values are generally higher than normal [22,24], and the existing pixel dichotomy model for estimating the FVC at the regional scale is not sufficiently sensitive to identify sparse vegetation. Moreover, the pixel dichotomy model parameters are difficult to calibrate due to the mixed-pixel phenomenon in Moderate-resolution Imaging Spectroradiometer (MODIS) imagery, especially in areas with sparse vegetation cover [25,26,27]. Therefore, accurate extractions of FVC information in arid areas with sparse vegetation and dynamic analyses of time-series changes still have some challenges.
In this study, we addressed the technical challenges of estimating FVC in arid regions using MOD13Q1 and GF-2 satellite images and analyzed the detailed ecohydrological response process of natural vegetation to water compensation over a historical period (2000–2017) in the lower reaches of the Tarim River, focusing on the following three objectives:
(1)
Develop a reliable method for retrieving FVC in arid, vegetation-sparse regions in different years while overcoming the difficulties of traditional pixel dichotomy empirical model parameters associated with parameter calibration by incorporating GF-2 submeter-scale high-spatial-resolution data.
(2)
Document the long-term vegetation coverage changes after the EWC project (2000–2017) in the lower reaches of the Tarim River from the points, lines, and area (PLA) spatial scale involving monitoring wells (points), ecological sections (lines) and the overall region (area) as well as the relationship each of these scales has with groundwater table variations induced by EWC.
(3)
Explore the spatial and temporal responses of vegetation and groundwater to the EWC project by intensively analyzing time-series remote sensing images and station observation data and by performing an integrated assessment of the ecological processes caused by EWC.

2. Materials and Study Area
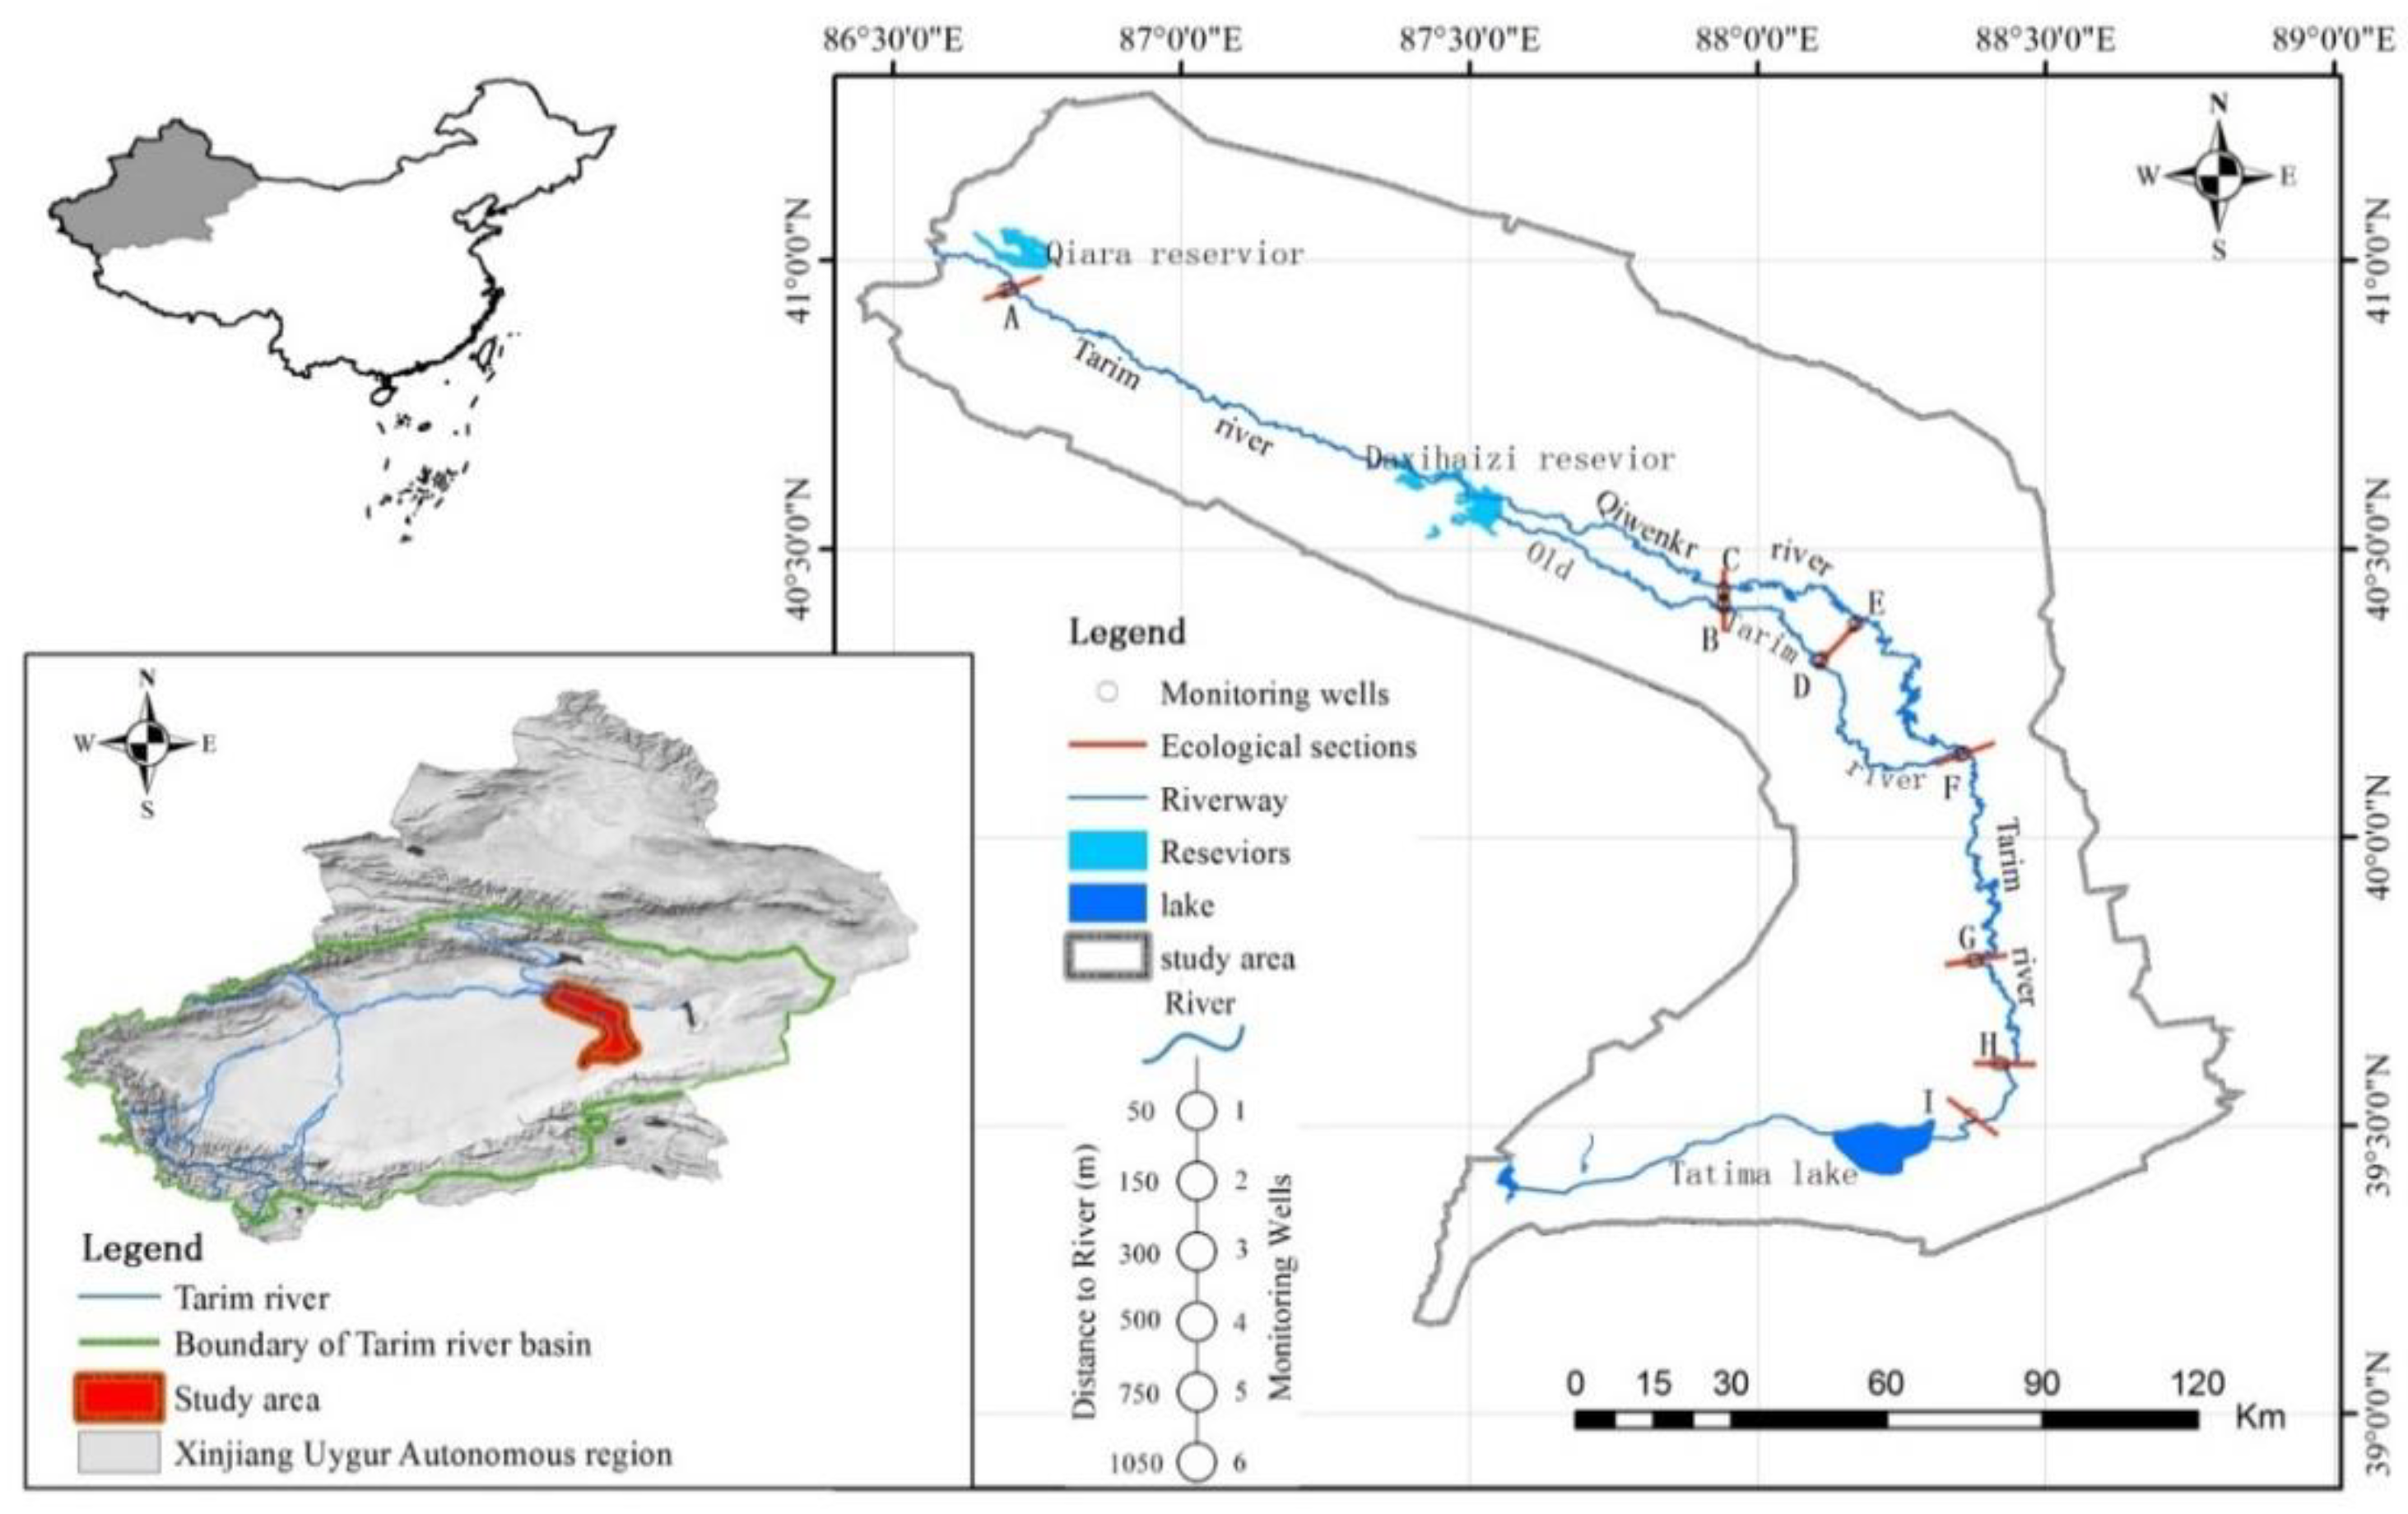
2.1. Study Area

The study area is focused mainly on the lower reaches of the Tarim River basin (with a total length of approximately 323 km from the Qiara hub to the tail of Tetma Lake) within the longitude range of 86.5–88.5° E and the latitude range of 39.5–41.5° N (Figure 1). The climate in the study area is extremely dry, and the river is surrounded by the Taklimakan and Kuluke Deserts. The annual precipitation in this area is approximately 17.4–42 mm (average 30 mm), and evaporation can reach 2500 to 3000 mm. River water is predominantly supplied (replenished) by alpine glaciers and seasonal snowmelt [2,9]. The riparian forest vegetation along the two sides of the river plays a critical role in preventing the merging of the two deserts, and the Tarim River has a reputation as a “Green Corridor” [28]. A natural barrier has formed in this region to protect communication lines and road traffic. Because of the excessive exploitation of water resources in the middle and upper reaches of the Tarim River, the fragile natural eco-environmental system of the lower reaches of the Tarim River has undergone severe degradation over recent decades. Riverbed and tail lakes were desiccated, and the groundwater level declined sharply, resulting in construction and causing the locally dominant desert riparian plant species Populus euphratica to wither and die. This Green Corridor was once in danger of being swallowed up by the desert [29]. To save the downstream eco-environment, the ECW project was implemented in 2000 by the Tarim River Basin Administration Bureau (TBAB); through this project, authorities planned to transport 3.5 108 m3 water to the downstream river channel each year.
The details of the volume and timing of EWC to the lower reaches of the Tarim River are shown in Table 1. From 2000 to 2017, through the EWC project, 18 compensation efforts were led by the TBAB. The cumulative amount of water delivered from the Daxihaizi Reservoir reached 6.235 billion m3 (21% from the Peacock River and 79% from the mainstream) [30,31]. Among the 18 years, in 14, water was provided directly to Tetme Lake. The whole ECW process between 2000 and 2017 could be divided into two stages: the first stage (2000–2004) was the emergency EWC stage. In this stage, water was mainly pumped from Bosten Lake through the Peacock River to the lower reaches of the Tarim River. The second stage (2005–today) was the normalized EWC stage. In this period, because Bosten Lake was at a low water level, water from the mainstream Tarim River replaced Bosten Lake as the main ECW water source for downstream ecological water discharge.

2.2. Data Collection

The data used in this paper include remotely sensed data (i.e., MODIS images, Gaofen-2 (GF-2) images, Enhanced Thematic Mapper plus (ETM+) images and Sentinel-2 images) and field-observed data (i.e., groundwater data, EWC volume data and etc) (see Table 2). Among the data sources, the MOD13Q1 product provided 16 days of synthetic NDVI products from Julian day of year (DOY) 81 (1 April) to 321 (17 November); NDVI is the preferred vegetation index for monitoring vegetation changes in arid desert areas [32,33,34]. The GF-2 satellite is the highest-resolution civilian land-observation satellite in China and was successfully launched on 19 August 2014. GF-2 data can be ordered from the China Center for Resource Satellite Data and Application. Sentinel-2 multispectral images were downloaded from the platform of the China Geospatial Data Cloud (http://www.gscloud.cn/ (accessed on 1 January 2019)), and data preprocessing was conducted with ENVI software. The ETM+ data (2010) and Sentinel-2 data (2017) were primarily used to validate spatially varying areas and to analyze changes in vegetation coverage from relatively fine-scale sources. The surface water and groundwater monitoring data were provided by the TBAB. The groundwater level data came from the observation data of the ecological section telemetry wells.

3. Methods

Figure 2 illustrates the framework of the FVC retrieval process and the relationship analysis between the FVC and EWC in the lower reaches of the Tarim River. The major steps include (1) MODIS NDVI data preprocessing work, including projection transformation, abnormal-value removal, and Savitzky–Golay (S–G) filtering steps; (2) FVC inversion and validation by the pixel-dichotomy mode based on the MOD13Q1 NDVI and GF-2 data (in this article, we focus on calculating the annual maximum vegetation coverage and annual average vegetation coverage by using the maximum and mean synthesis method for the annual NDVI data, respectively); and (3) spatial and temporal change process analyses at the PLA scale, i.e., a field sample plot dynamic analysis, ecological section spectral profile analysis and regional statistical analysis, including analyses of the gray-image histogram, time change trend, buffer zone and spatial migration; the changes in regional vegetation coverage restoration are comprehensively described at different angles; (4) relationship analysis among vegetation coverage recovery, ecological water transport, and the groundwater level in the lower reaches of the Tarim River over the study period with intensive time series data and a discussion of the results; in addition, the effectiveness and scope of the impacts of EWC are comprehensively assessed. The following subsections describe the remaining steps in detail.

3.1. Image Noise and Cloud Removal

Many methods have been developed for removing image noise and clouds, such as the mean value and S–G filter methods. Among them, the S–G filter has been widely used for image noise removal in data flow smoothing and abnormal noise removal applications [35,36,37]. The principle of this method is filtering based on local polynomial least squares fitting in the temporal domain. In this study, the S–G filter parameters of the left and right window widths are set to 3, the reciprocal order is set to 0, and the polynomial order is set to 2. The greatest advantage of the S–G filter is that it can ensure that the shape and width of the signal are maintained while filtering out noise (Figure 3).

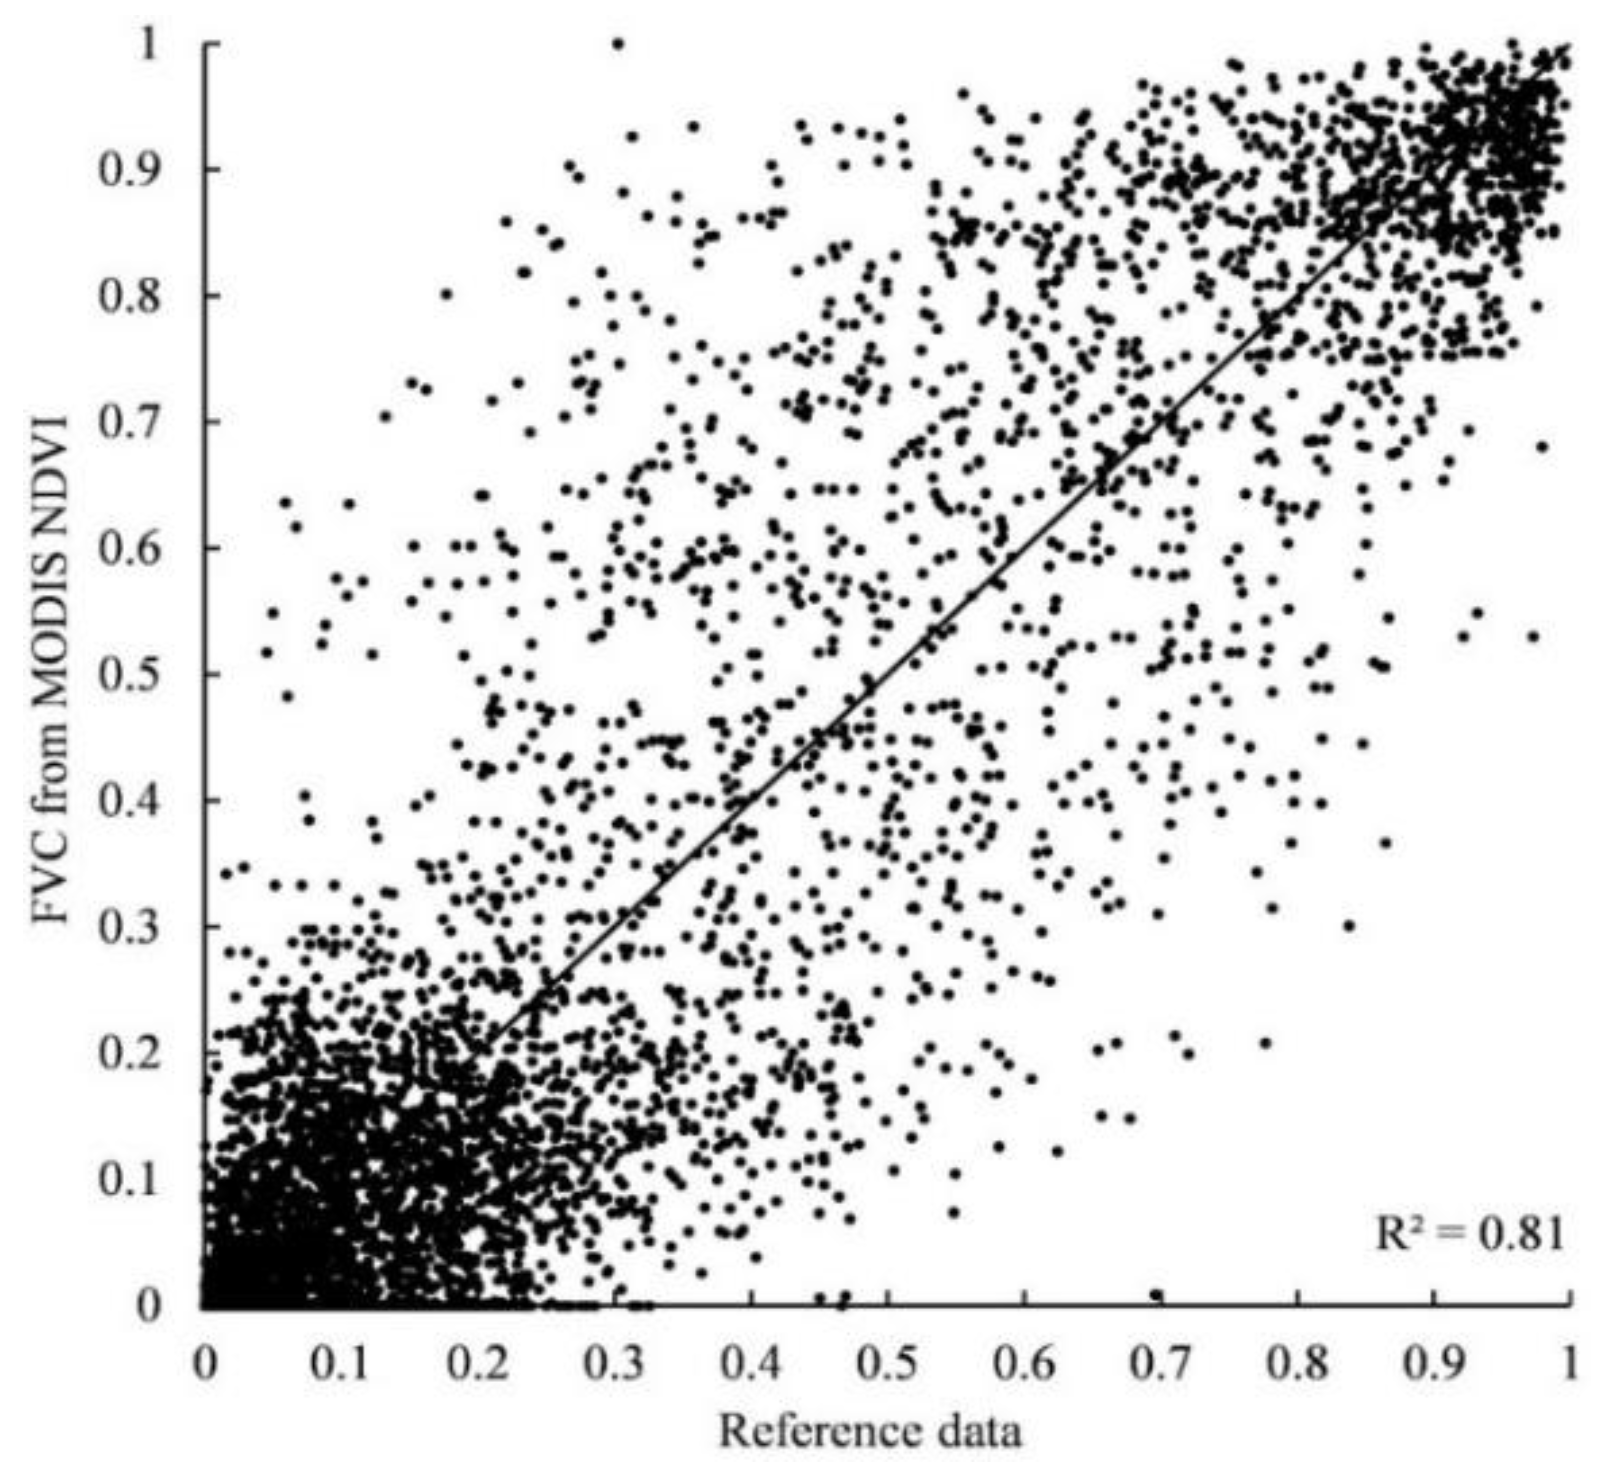
3.2. FVC Retrieval and Accuracy Assessment

The FVC was calculated by the pixel-dichotomy model based on the integration of time-series MODIS NDVI and GF-2 data. The formula used to calculate the pixel-dichotomy model can be expressed as follows (Formula (1)) [38]:
F V C = N D V I N D V I s o i l N D V I v e g N D V I s o i l
where NDVIsoil is the NDVI value of a completely bare or nonvegetation-covered area and NDVIveg represents the NDVI value of a pixel completely covered by vegetation, i.e., the pure-vegetation-pixel NDVI value.
The difficulty of this method lies in the determination of the threshold of NDVIveg and NDVIsoil parameters. The poorness of these two parameters directly affects the accuracy of the model results, causing vegetation coverage overestimations or underestimations in some places. In areas with arid and sparse vegetation, it is almost impossible to find a pure-vegetation pixel from an image with a 250-m spatial resolution. To overcome this challenge, in this paper, we first classified vegetation and nonvegetation areas from GF-2 images by density slicing with ENVI software and then set the mean MODIS NDVI values corresponding to pure vegetation areas and nonvegetation areas as the NDVIveg and NDVIsoil values, respectively. By trial and error, we finally determined that the NDVIveg value of the study area was 0.86, while the NDVIsoil value was 0.11.
The accuracy assessment is an important part of the remote sensing information extraction procedure. In this research, 2D scatterplots and quantitative statistical analysis (e.g., Pearson correlation, the coefficient of determination (R2), average error (AveErr) and root mean square error (RMSE)) were used to assess the estimation results. The FVC validation data were extracted from submeter, high-spatial-resolution images (GF-2, 0.8-m) by the hybrid method with ENVI software. The unsupervised classification approach was used to classify each whole image into 50 clusters by applying the ISODATA algorithm. Once all the spectral clusters were isolated, a close visual interpretation was performed. Hereafter, all clusters were recoded as 1, representing vegetation, or 0, representing nonvegetation. Then, a binary format of the vegetation coverage image containing the 0 and 1 values was output. Finally, the vegetation image with a 0.8-m spatial resolution was aggregated to obtain the FVC values in the reference dataset with a spatial resolution of 250 × 250 m to match the pixel size of the FVC images from the estimation model.

3.3. Slope Trends Analysis and F Test

The change trends were analyzed using slope analysis (Θ) with a significant F test. In this method, multiyear data fitting is utilized to reduce randomness and contingency errors, and the results can optimally reflect the growth status and trends of vegetation. A linear regression model was employed to express the characteristics and trends of the interannual variability in FVC. The change slope calculation formula can be expressed as follows (formula (2)):
Slope Θ = n   *   i = 1 n i   *   F V C i i = 1 n i   *   i = 1 n F V C i     n   *   i = 1 n i 2 i = 1 n i 2
where Slope(Θ) is the FVC trend slope, i is the time variable, n is the number of monitoring years, i.e., the number of independent or dependent variables in the regression model, and FVCi is the maximum FVC in year i within Julian DOYs 81 to 321. A positive Slope(Θ) value represents an increasing vegetation coverage trend; a negative value indicates a decreasing vegetation coverage trend; and a value of 0 indicates a constant trend.
The Ftest (two-tailed) was used to assess the significance of the change trend (Slope(Θ)). The p value indicates whether the FVC change process from 2000 to 2017 is significant or not significant. The calculation formula can be expressed as follows (formula (3)):
F t e s t = U / m Q / n m 1       ~     F m , n m 1
F t e s t = U Q / n 2       ~     F 1 , n 2    
U = i = 0 n ( y ^ i y ¯ ) 2
Q = i = 0 n ( y i y ^ i ) 2
where U is the sum of the regression error squares, Q is the sum of the residual squares, m is the degrees of freedom in the numerator, and nm − 1 is the degrees of freedom in the denominator. In this paper, m is equal to 1, and n is equal to 18 (the number of monitoring periods). Therefore, formula (3) can be converted to formula (4). In addition, in the above equations, y i is the maximum FVC in year i; y ^ i is the regressed FVC value in year i; and y ¯ is the average FVC among the 18 years between 2000 and 2017.
According to the Ftest, the significance-level p value can be calculated using formula (7) or (8) as follows:
P v a l u e = 1 FPS F t e s t , m , n m 1  
P v a l u e = 1 FPS F t e s t , 1 , n 2    
where FPS is used to compute the cumulative distribution function for an F distribution with defined degrees of freedom in the numerator (m) and denominator (nm − 1). If the p value is less than 0.01, the change trend is extremely significant; a p value less than 0.05 indicates a significant change trend; and a p value greater than 0.05 indicates a nonsignificant change trend.

4. Results and Analysis

4.1. Spatial Change Mapping and Analysis

4.1.1. Spatial Change Mapping

The spatial distribution of the dynamic FVC between 2001 and 2017 is shown in Figure 4. From this FVC spatial distribution map, it can be clearly seen that the vegetation was significantly restored on both sides nearby the river channel. The area with the most significant FVC increase spanned both sides of the middle and tail end of the downstream river section. At the beginning of 2000, the vegetation coverage area was very small due to the interruption of the downstream channel. However, with the replenishment of water sources, the downstream vegetation coverage gradually recovered.

4.1.2. Spatial Change Analysis

The linear regression (slope) and F test results were used to examine the pixel-level trends (Figure 5). Figure 5a shows the increase rate of the regional vegetation coverage between 2000 and 2017. In theory, a pixel with a slope greater than 0 indicates that the vegetation in that pixel has shown an increasing trend in the past. A value less than 0 indicates a declining trend, and a value equal to 0 indicates that no change occurred. From 2000 to 2017, the regional vegetation coverage generally showed a positive trend. This statistical change trend passed the significance test. Figure 5b shows the significance level of the regional vegetation changes alongside the p values. A p value less than 0.01 indicates that the change trend was highly significant; a p value less than 0.05 indicates that the change trend was significant and a p value greater than 0.05 indicates that the change trend was not statistically significant. The loss and gain areas are marked with different colors according to significant level, such as, highly significant increase, highly significant decrease, significant increase, significant decrease and insignificant change area.

4.2. Temporal FVC Change Process at the PLA Scale

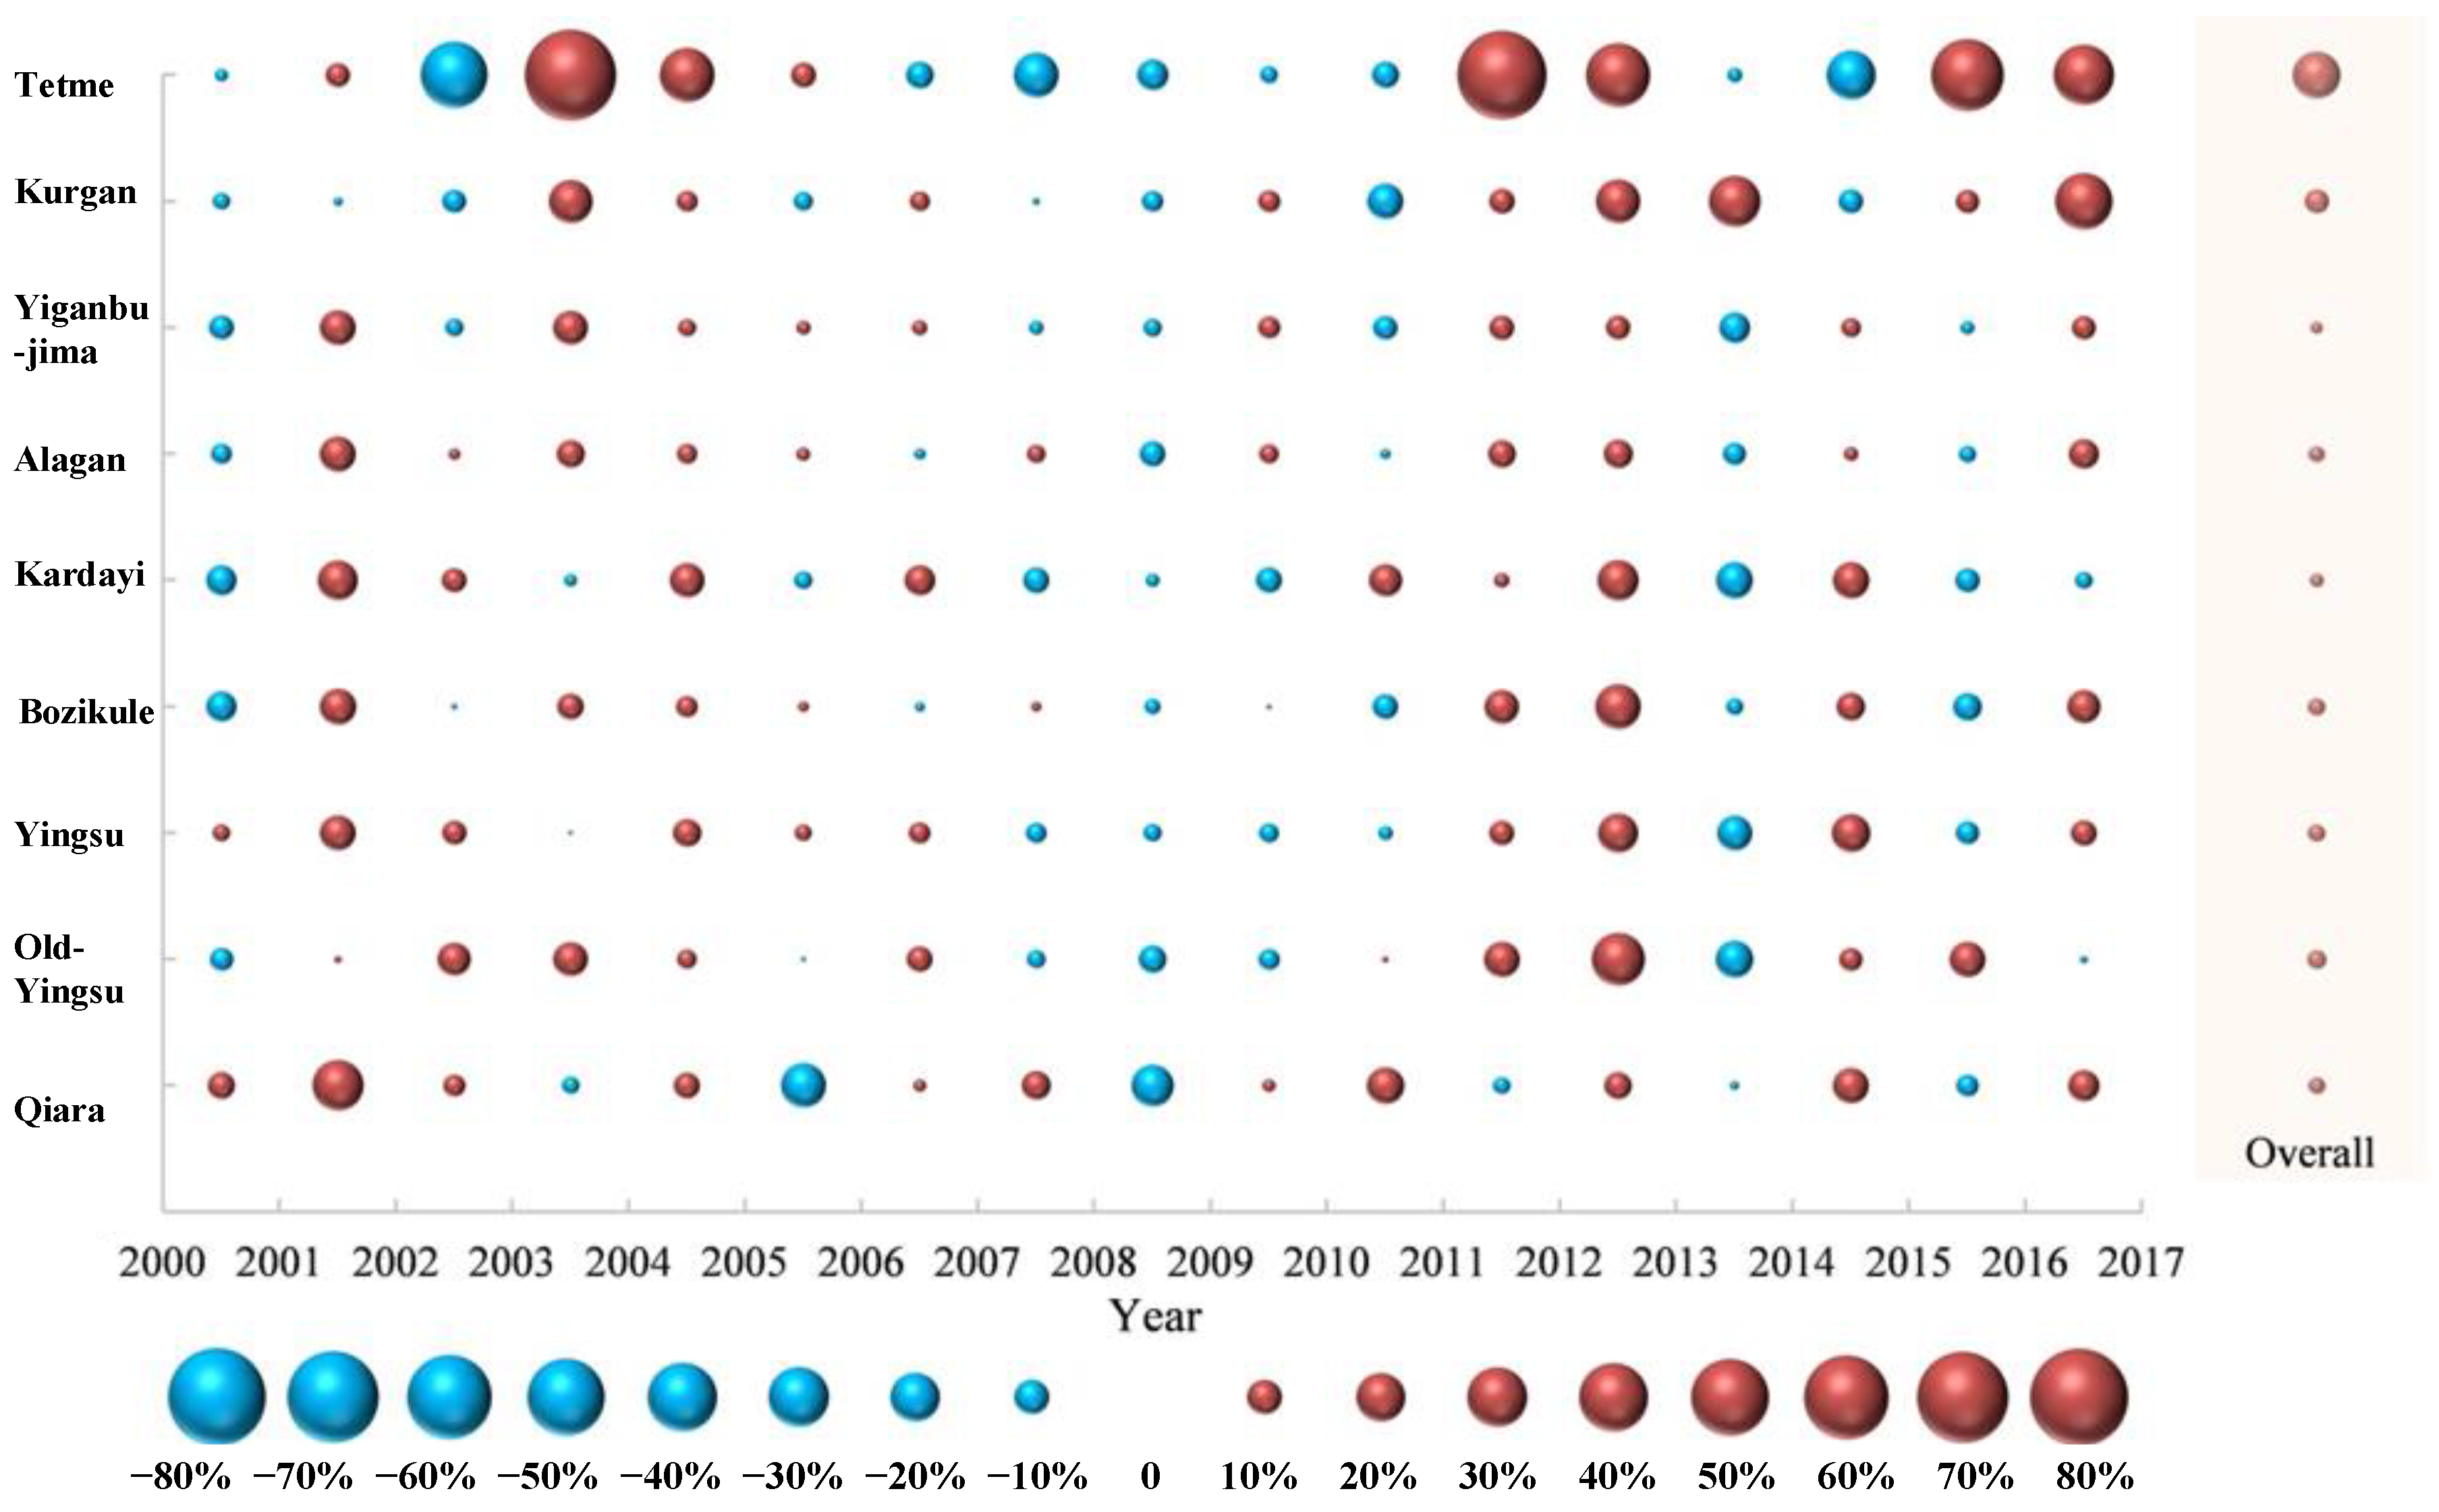
4.2.1. FVC Changes at the Nine Ecological Monitoring Sites

Table 3 shows the annual maximum FVC values at the nine vegetation sampling sites around the monitoring wells in each year of the study period (2000 to 2017). The size of each sample site is 250 × 250 m. The FVCs at different sampling sites illustrated that the plants in all monitoring plots flourished over the past decades. The change trend at each site showed a statistically significant increase. The average FVC at the sampling sites improved by 78.6%, and the FVC at the Tetme site exhibited the largest increase (340%). However, the vegetation-restoration process is not gradual but exhibits significant fluctuations and repetitions. The vegetation coverage in the study area experienced a rapid rise in the early stage of the EWC project (2000–2005). From 2006 to 2010, the vegetation coverage was mainly reduced and unchanged. An FVC inflexion point occurred in 2009 or 2010, after which the FVC again increased after falling to its minimum value.
Figure 6 shows the dynamic vegetation changes at nine ecological monitoring sites, thus reflecting the annual FVC change process at each site as well as the intensity of these changes. In terms of dynamic changes (Figure 6), it can be seen that although the vegetation dynamics increased in some years and decreased in some years (thus presenting instability), overall, the dynamics were positive from 2000 to 2017, meaning that the vegetation coverage at various ecological sites was increasing over recent decades. Among the study sites, the most obvious vegetation restoration process occurred at the Tetma Lake site, followed by the Kurgan ecological site. Moreover, the dynamic change values at most of the sites were negative from 2007 to 2008, 2008 to 2009, and 2013 to 2014, indicating that each year throughout this time period, vegetation deteriorated compared to the previous year.

4.2.2. FVC Changes at the Nine Ecological Transects

Local vegetation restoration was also examined at nine ecological transections by assessing the maximum FVC in each year of the study period (2000–2017). Along the length of each section line, approximately 15 samples were taken. The FVC changes along these nine ecological sections from 2000 to 2017 are shown by three-dimensional maps (Figure 7). Three-dimensional maps of the FVC changes in different eco-sections were also used to describe vegetation restoration from another perspective, the trend surface. From Figure 7, we can clearly see the overall vegetation distribution and dynamic process along the nine ecological sections. All trend surfaces show climbing trends. After 2000, the slopes exhibit steep increases. This shows that vegetation was recovering and increasing significantly year by year. Moreover, the ecological profiles exhibit valleys from 2006 to 2010, with the valley bottoms occurring in approximately 2009. This change characteristic implies that the vegetation along each ecological section experienced a downward and then rising fluctuation process during this time.

4.2.3. FVC Changes in the Whole Area of the Lower Reaches of the Tarim River

The total vegetation coverage area (FVC > 5%) had expanded by 1.63 times in 2017 compared to 2000. The whole-area FVC showed a statistically significant increasing trend during the entire study period (2000–1017), with the vegetation cover area increasing 3.5% year−1 (R2 > 0.84, p < 0.01). The whole FVC-increase process showed volatility. The vegetation coverage increased rapidly from 2000 to 2005, with a peak value in 2005, but from 2006 to 2009, the FVC fluctuated downward, exhibiting a minimal value in 2009. Then, the local vegetation gradually increased again after 2010. Figure 8 shows the histogram dynamic distribution of the FVC from 2000 to 2017 in the whole lower reaches of the Tarim River basin. The peak of the regional vegetation coverage histogram gradually shifted from the left side to the right side after 2000, indicating that the ECW project achieved remarkable results and that the regional vegetation coverage in the basin increased annually. From 2000 to 2017, the area of high vegetation coverage (FVC exceeding 50%) increased from 236.1 km2 to 554.3 km2; the area of moderate vegetation coverage (20% < FVC < 50%) improved from 315.1 km2 to 416.1 km2; and the area of low vegetation coverage (5% < FVC < 20%) increased from 443.5 km2 to 659.6 km2. At the same time, the nonvegetation coverage area (FVC < 5%) shrunk by 625.2 km2 from 2000 to 2017.

4.3. Coupled Relationship Analysis among the EWC Project, Groundwater Depth and FVC

4.3.1. Groundwater Dynamic Process

Thirty groundwater monitoring wells are located along the five ecological sections in the lower reaches of the Tarim River. The groundwater table changes at these different ecological monitoring wells, including the Yingsu (60 km to Daxihaizi), Kaerdayi (120 km to Daxihaizi), Arakan (60 km to Daxihaizi), Yiganbujima section (280 km to Daxihaizi) and Kurgan (328 km to Daxihaizi) wells, are displayed in Figure 8. Figure 8 shows that the groundwater levels along the water compensation river channel rose sharply after the EWC project to the lower reaches of the Tarim River began in 2000. The average groundwater level increases in all monitoring wells within 1050 m of the river in each section reached 40~50% statistically. The dynamic groundwater-variation process in the downstream sections of the Tarim River has experienced an increasing–decreasing–increasing trend over the past 18 years. Specifically, 2000 to 2005 was a stage of groundwater level uplift, followed by a stage of groundwater level decline from 2005 to 2010 and subsequent rise after 2010. However, a significant time lag was observed in the response of groundwater uplift. For example, in Figure 9, the blue line shows the minimum water delivery in each stage, while the red line shows the lowest groundwater level. Figure 9 shows that an inflection point in the groundwater uplift trend occurred one year after the ecological water transport inflection point.
Figure 10 shows the spatial distribution of the groundwater level from the river. A clear slope with an increasing distance to the river could be observed. Near the river, the groundwater level was relatively high, and far from the river, it was relatively low. However, as the distance increased, the slope decreased. The groundwater level uplift also became limited as the distance from the river increased.
The change trend of the groundwater level is closely related to that of the ecological water compensation volume. However, this correlation shows a stronger time dislocation correlation (or lag correlation) in statistics. Taking the Yingsu section as an example, Figure 11a is the direct correlation scatter plots between the mean annual groundwater depth and the volume of annual EWC water transport. Figure 11a is the time dislocation correlation map between the volume of water delivered in the previous year and the groundwater depth data of next year. Comparing Figure 11a,b, we can see that the correlation coefficient has been significantly improved. The direct correlation calculation R2 is only 0.27(p < 0.05, two-tailed), but the time dislocation correlation R2 reaches 0.59(p < 0.05, two-tailed). This finding implies that the discharge of water into the lower reaches has played a positive and significant role in raising the groundwater depth and that a time lag of one year is required for the groundwater to recover following EWC, according to mathematical statistics.

4.3.2. Riparian Vegetation Response to the EWC Volume

To further quantitatively analyze the response characteristics of vegetation to groundwater level changes and EWC, the relationships among the water delivery volume, groundwater depth and vegetation coverage in different ecological sections were constructed by Pearson correlation and significance tests. The direct correlation coefficient between the ground vegetation coverage and the volume of ecological water transferred in the lower reaches of the Tarim River was found to be 0.37 (p > 0.05, two-tailed). However, through the previous year’s water transfer data and the dislocation analysis of vegetation coverage in the following year, the correlation coefficient between the vegetation coverage and water transfer data was found to be 0.59 (p < 0.05, two-tailed), indicating that vegetation restoration was significantly related to ecological water regulation, but a time lag of one year is present.

4.3.3. Riparian Vegetation Response to the Groundwater Level

The quantitative relationships between the vegetation coverage and groundwater are shown in Figure 12. The coupling relationships of the FVC and groundwater depth along three different ecological sections and in the whole region were examined. The vegetation variations were found to be highly correlated with the groundwater level. Along the Alagan section, the coefficient of determination R2 was 0.59 (p < 0.05, two-tailed); along the Yiganbujima section, it was 0.51 (p < 0.05, two-tailed); along the Kuergan section, it was 0.44 (p < 0.05, two-tailed); and across the whole region, the R2 between vegetation changes and the groundwater level was 0.62 (p < 0.05, two-tailed). Therefore, it can be inferred that the vegetation coverage changes are highly dependent on the groundwater level.
Furthermore, to apply spatial buffer zone around the river channel to analyze the FVC spatial dynamics, we set the buffer distance to be sampled at intervals of 0–3 km, 3–5 km, 5–10 km and 10–20 km on both sides of the channel (Figure 13). The results show that the closer an area was to the river, the more the vegetation in this area increased. With an increasing distance from the river, the vegetation responsiveness gradually decreased. At a distance 10 km away from the river, almost no significant change in FVC was observed. This implies that the vegetation restoration in the lower reaches of the Tarim River in recent years was mainly concentrated on the two sides of the river (within 10 km).

5. Discussion

5.1. Reliability of FVC and Uncertain Analysis

The accuracy of the FVC results was validated by 2D scatterplots, Pearson correlation, AveErr, RMSE and other quantitative evaluation indices. Figure 14 shows the two-dimensional scatterplots derived between the references and estimates, a conventional method for testing the effectiveness of estimated algorithms. The x-axis is the reference data, and the y-axis is the estimated data. In Figure 14, the black dots are concentrated on both sides of the diagonal line. The estimated results are thus in good agreement with the reference data overall. Further quantitative statistics showed that the correlation between the verification data and the estimation results was greater than 0.9 (p < 0.01, two-tailed). The average error (AveErr) was 0.0098, and the RMSE was 0.088. These results indicate the good performance of the model applied in this article to estimate FVC in arid, vegetation-sparse zones. The FVC estimation accuracy obtained with the pixel-dichotomy model based on the MOD13Q1 NDVI and GF-2 data was highly reliable, and the experimental results were credible.
Errors mainly come from the following aspects: (1) Uncertainty of remote sensing data. Saturation of NDVI value on high-coverage vegetation area and overrating of FVC value on arid sparse vegetation areas affects its sensitivity in arid region [22,24,39,40]. (2) Spatial scale factors. In this study, 250-m spatial resolution MODIS images are used. Mixed pixel problem is inevitable [40]. There is neither good distinction between trees and grasses, nor between natural vegetation and artificial vegetation, such as farmland and riparian forest. How to distinguish the restoration of natural vegetation and the increase in artificial crops? Further research is needed in the future, with the help of high resolution, high temporal remote sensing and depth learning technology. (3) Accidental error. As the surface water level rises, some vegetation around floodplains or reservoirs was submerged, which leads to the reduction of vegetation coverage. This part is not vegetation degradation under drought stress.

5.2. Change Characteristics and Attribute Analysis

According to the temporal change characteristics of vegetation coverage in the lower reaches of the Tarim River, the whole FVC change process obviously presented three different stages: (1) From 2000 to 2005, vegetation rapidly increased; (2) from 2006 to 2009, vegetation degraded and was unstable (irregular decline); and (3) from 2010 to 2017, vegetation gradually increased (steadily increased). Through the relationship analysis performed among the vegetation, groundwater and EWC results, we found that the vegetation restoration process in the lower Tarim River reaches was closely related to the EWC project. However, there was a lag of one year in the response time of the FVC to EWC. The spatial influence range of ecological water transportation was found to be limited and was mainly dependent on the elevation of the groundwater table.
The regional FVC experienced a rapid increase in the first stage, mainly due to emergency EWC efforts and the rapid rise of the groundwater table. However, the EWC quantity has not been continuously guaranteed. First, in 2006, the volume of water delivered decreased significantly. Then, ecological water transport was not carried out normally for the next three consecutive years [6,15]. Very little ecological water was transferred/discharged in 2007 and 2009 (0.14 × 10⁸ m3 and 0.11 × 10⁸ m3, respectively). Moreover, ecological water transport was suspended in 2008. In 2010, the EWC entered the normalized stage. During this stage, the volume of water transferred was essentially effectively guaranteed. Therefore, in this stage, vegetation was mainly characterized by a steady increase. However the volume of downstream water transfer was reduced to 0.07 × 10⁸ m3 due to the a severe drought in the whole basin.
Although the regional vegetation change is mainly affected by the compensation amount of upstream ecological water transfer. However, regional climate change is also a factor that cannot be ignored. This is not to say that the increase or decrease in regional precipitation has a direct impact on vegetation, but the large water balance system of the entire Tarim River basin will lead to changes in the available ecological water delivery in the downstream and the extreme weather events. For example, 2009 was an extremely dry year [16], with drastic reductions in the amount of water incoming from the three major river sources (the Aksu, Hotan and Yark Rivers). The regional vegetation coverage fell to its lowest point in 2009. According to meteorological data, Xinjiang was extremely dry in the first half of 2014. The precipitation in southern Xinjiang was the lowest in the first six consecutive months of 2014 according to the meteorological record beginning in 1961. The reduced vegetation coverage in 2014 was a regional general phenomenon. In this year, the volume of downstream water transfer caused by the regional drought was reduced to 0.07 × 10⁸ m3. This is why the vegetation coverage showed an abnormal result in 2014.
The one-year time lag of the vegetation response to EWC can be explained by the following reasons. First, ecological water transport mainly adopts a linear water transport behavior in river channels rather than flooding behavior. The river waters that are replenished first by ecological water transport are then recharged to the nearby groundwater by infiltration. A noticeable delay occurred in this penetration process, and this delay was potentially linked to the time lag of groundwater uplift to EWC. Because precipitation is generally less than 100 mm in the hyperarid region of the Tarim River basin, the survival and regeneration of natural vegetation highly depends on renewable groundwater instead of precipitation in this area [12]. The hysteresis of groundwater level rise leads directly to a time lag in the vegetation response. This also explains why vegetation changes were found to be highly consistent with groundwater level fluctuations. Second, the water delivery times were mainly concentrated in the second half of the year, such as in autumn and winter (September–December), when less water is consumed for agriculture. Therefore, the impact on vegetation growth can be reflected only in the subsequent year. This is another reason for the one-year time lag in the vegetation response. The finding of a one-year lag in the response time is basically consistent with the results of other site-observation studies [5,41].
Relevant research has shown that the critical groundwater depth for riparian forest vegetation (e.g., Populus and Tamarix) is −9 m, while the water depth for optimal growth and reproduction is above −6 m [30,42,43,44]. Moreover, the groundwater level for grass-shrub vegetation growth, such as bell thorn, reed, and licorice species, needs to be above −4 m [16,31,45]. In other words, a groundwater level below −9 m inhibits the normal development of floodplain forests (i.e., causing withering, decaying, and dying); in areas with groundwater levels above −6 m, riverbank forests can grow and succeed. However, through the ecological well groundwater monitoring data analysis performed herein, the groundwater level in the downstream river channel area (50–1050 m) was uplifted in general after each ecological water transfer, and the water depth was basically maintained at −4~−8 m. At some ecological sections, the groundwater level even exceeds −2~−4 m. These groundwater levels can meet the basic requirements for the growth and restoration of vegetation colonies. However, the groundwater level gradually decreased in the horizontal direction. The groundwater level elevation away from the river was also found to be very limited [1,9,13,28,45,46]. This was the main reason why vegetation restoration was mainly concentrated in the near-channel region.
However, the range spatially affected by regional vegetation restoration is limited. This limited impact may be related to linear water transport and the spatial distribution of the groundwater level. In arid areas, river-controlled groundwater is the main water source for vegetation growth and regeneration rather than precipitation [12,47]. Subsequently, regional vegetation fluctuations are extremely sensitive to variations in the groundwater depth [9,20,28,46]. Due to linear water transport, the surface water of the river was first supplied to the nearshore groundwater before flowing far away from the lower-water-level zone by the hydraulic gradient (potential energy). The groundwater level then gradually declines with increasing distance to the river channel. Therefore, the groundwater table significantly improved in the near-river region, while farther away from the river, the groundwater level increased less. This may explain the limited spatial scope of vegetation restoration in the study area.

5.3. Future Countermeasures and Suggestions

Through the above discussion, we found that downstream available water is dependent on the upstream water consumption conditions and climate change. Climate change increases fluctuations and uncertainties in the total amount of regional water resources both spatially and temporally. Therefore, in arid areas where water resources are limited, policymakers and managers face the challenges of ecosystem conservation and restoration [9,48]. Stakeholders need to take a holistic view and perform comprehensive considerations rather than simply diverting water. First, it is urgent to carry out ecological value assessments and ecological water demand estimations to reasonably control the groundwater level [45,49]. In addition, efforts involving ecological protection, economic development, and regional sustainability must be addressed, and any related conflicts must be coordinated. We believe that giving priority to ecological concern and ‘fixing the crop field area with the water volume’ could be an effective countermeasure based on the water balance, further considering the balance between the amounts of water supplied and ecologically demanded. The excess water volume could be used to determine the planting area of the basin. Moreover, to consolidate the ecological restoration effect in the lower reaches of the Tarim River, it is necessary to formulate a more reasonable dispatching plan while considering factors such as the water transfer time and the duration and type of water-transfer mode. For example, considering the growth conditions and reproductive periods of Populus euphratica, the best time for EWC projects spans the period from September to October.

6. Conclusions

In this paper, we detected and evaluated the spatiotemporal response of riparian vegetation to annual EWC projects at the PLA scale using time-series MOD13Q1 and GF-2 data. Then, we address the mechanism of the vegetation-hydroecological process based on station observations and remote sensing data. On this basis, we integrate and analyze the coupling relationship among the FVC, groundwater depth and EWC volume. Finally, we assess the benefits and limitations of the EWC project. The findings of this study provided the following main conclusions:
  • A new parameter-calibration method within the pixel-dichotomy model was proposed; this method improved the accuracy of the traditional empirical model, enhanced the FVC estimation reliability in arid, vegetation-sparse areas, and increased the credibility and robustness of the outputs. The method proposed in this study could be extended to map FVC changes in other arid/semiarid sparse vegetation areas across the world.
  • The ecological environment in the lower reaches of the Tarim River has been significantly improved at all scales. From 2000 to 2017, the average growth rate of regional vegetation was 3.5% year-1 (p < 0.01, two-tailed). However, the ecological vulnerability conditions did not change fundamentally throughout the study period, as was mainly manifested in the following aspects: (1) Vegetation restoration was strongly dependent on EWC. Once EWC was halted, vegetation began to degenerate immediately, and vice versa. (2) Vegetation restoration was mainly concentrated in the area near the river channel. Linear water transportation has alleviated the decline in vegetation near the river channel, but the regional ecosystem has not been fully restored.
  • The vegetation restoration and underground water depth processes were both significantly correlated with the volume of ecological water transported (p < 0.05, two-tailed). The changes in the vegetation coverage and groundwater level were highly consistent both temporally and spatially. In addition, a one-year time lag was observed in the response time between vegetation and EWC.
Based on the above findings, we can conclude that the EWC project has provided remarkable accomplishments, allowing the eco-environment in the lower reaches of the Tarim River to improve obviously. With the rise of the groundwater level, the vegetation coverage increased significantly at PLA scale. However, the ecosystem in the lower reaches of the Tarim River is still very fragile because of the uncertainty of the water supply. The current achievements of the EWC project need to be further consolidated and strengthened. It is thus necessary to plan and optimize the allocation of water resources from the perspective of the whole river basin. Moreover, scientifically determining the water delivery timing and effective water delivery mode will require further in-depth considerations to expand the effects of the EWC project. Nevertheless, the annual average and maximum FVC in the lower reaches of the Tarim River showed statistically significant increasing trends from 2000 to 2017, indicating that the EWC project has achieved remarkable results from visual insight. The information provided in this work is critical for assessing the environmental impacts of the ECW project and of future ecological restoration efforts in the lower reaches of the Tarim River.

Author Contributions

Conceptualization, C.Z., X.Z. and J.L.; methodology, C.Z. and Q.S.; validation, C.Z. and K.Z.; formal analysis, C.Z., X.Z. and J.L.; investigation, Q.S. and K.Z.; resources, C.Z. and J.L.; writing—original draft preparation, C.Z., Q.S., K.Z. and J.L.; writing—review and editing, J.L. All authors have read and agreed to the published version of the manuscript.

Funding

This research is financially supported by the National Key Research and Development Program of China (No. 2021YFB1407004); CAS Interdisciplinary Innovation Team (JCTD-2019-20); National Natural Science Foundation of China (U203201); and the Chongqing agricultural industry digital map project (21C00346).

Data Availability Statement

Not applicable.

Acknowledgments

The authors would like to thank the anonymous reviewers for their valuable comments on the manuscript, which helped improve the quality of the paper.

Conflicts of Interest

The authors declare no conflict of interest. The funders had no role in the design of the study; in the collection, analyses, or interpretation of data; in the writing of the manuscript; or in the decision to publish the results.

References

  1. Tao, H.; Gemmer, M.; Song, Y.; Jiang, T. Ecohydrological responses on water diversion in the lower reaches of the Tarim river, China. Water Resour. Res. 2008, 44, 6186. [Google Scholar] [CrossRef]
  2. Bao, A.; Huang, Y.; Ma, Y.; Guo, H.; Wang, Y. Assessing the effect of EWDP on vegetation restoration by remote sensing in the lower reaches of Tarim river. Ecol. Indic. 2017, 74, 261–275. [Google Scholar] [CrossRef]
  3. Yang, X.; Liu, Z.; Zhang, F.; White, P.D.; Wang, X. Hydrological changes and land degradation in the southern and eastern Tarim basin, Xinjiang, China. Land Degrad. Dev. 2006, 17, 381–392. [Google Scholar] [CrossRef]
  4. Liu, G.; Kurban, A.; Duan, H.; Halik, U.; Ablekim, A.; Zhang, L. Desert riparian forest colonization in the lower reaches of Tarim river based on remote sensing analysis. Environ. Earth Sci. 2014, 71, 4579–4589. [Google Scholar] [CrossRef]
  5. Hao, X.; Li, W. Impacts of ecological water conveyance on groundwater dynamics and vegetation recovery in the lower reaches of the Tarim river in northwest China. Environ. Monit. Assess. 2014, 186, 7605–7616. [Google Scholar] [CrossRef]
  6. Deng, M.; Zhou, H.; Xu, H.; Ling, H.; Zhang, P. Research on the ecological operation in the lower reaches of Tarim River based on water conveyance. Sci. Sin. Technol. 2016, 46, 864. [Google Scholar]
  7. Han, M.; Zhao, C.; Feng, G.; Disse, M.; Shi, F.; Li, J. An eco-hydrological approach to predicting regional vegetation and groundwater response to ecological water conveyance in dryland riparian ecosystems. Quat. Int. 2015, 380–381, 224–236. [Google Scholar] [CrossRef]
  8. Huang, Y.; Li, Y.P.; Chen, X.; Bao, A.M.; Zhou, M. Simulation-based optimization method for water resources management in Tarim river basin, China. Procedia Environ. Sci. 2010, 2, 1451–1460. [Google Scholar] [CrossRef] [Green Version]
  9. Aishan, T.; Halik, Ü.; Cyffka, B.; Kuba, M.; Abliz, A.; Baidourela, A. Monitoring the hydrological and ecological response to water diversion in the lower reaches of the Tarim river, northwest China. Quat. Int. 2013, 311, 155–162. [Google Scholar] [CrossRef]
  10. Li, W.; Zhou, H.; Fu, A.; Chen, Y. Ecological response and hydrological mechanism of desert riparian forest in inland river, northwest of China. Ecohydrology 2013, 6, 949–955. [Google Scholar] [CrossRef]
  11. Ye, Z.X.; Chen, Y.N.; Li, W.H.; Yan, Y.; Wan, J.H. Groundwater fluctuations induced by ecological water conveyance in the lower Tarim river, Xinjiang, China. J. Arid. Environ. 2009, 73, 726–732. [Google Scholar] [CrossRef]
  12. Zhu, X.; Yuan, G.; Yi, X.; Du, T. Quantifying the impacts of river hydrology on riparian vegetation spatial structure: Case study in the lower basin of the Tarim river, China. Ecohydrology 2017, 10, e1887. [Google Scholar] [CrossRef]
  13. An, H.; Ye, M.; Xu, H.; Yu, P. Response of radial increment of populus euphratica to ecological water conveyance in lower reaches of the Tarim river. J. Desert Res. 2011, 31, 957–962. [Google Scholar]
  14. Wang, Y.; Shen, Y.; Chen, Y.; Guo, Y. Vegetation dynamics and their response to hydroclimatic factors in the Tarim river basin, China. Ecohydrology 2013, 6, 927–936. [Google Scholar] [CrossRef]
  15. Huang, Y.; Bao, A.; Wang, S.; Wang, Y.; Wang, S.; Duan, Y. Eco-environmental change in the lower Tarim river underthe influence of intermittent water transport. Acta Geogr. Sin. 2013, 68, 1251–1262. [Google Scholar]
  16. Jia, J.; Meng, Y.; Dai, J.; Gao, G.; Yin, Z.; Zhou, L.; Li, Z. Affect on characteristic of groundwater spatial and temporal distribution after ecological water transport in the lower reaches of Tarim river. J. Inn. Mong. Agric. Univ. Nat. Sci. Ed. 2016, 37, 81–90. [Google Scholar]
  17. Lioubimtseva, E.; Henebry, G.M. Climate and environmental change in arid central Asia: Impacts, vulnerability, and adaptations. J. Arid. Environ. 2009, 73, 963–977. [Google Scholar] [CrossRef]
  18. Zhu, C.; Chen, Y.; Li, W.; Jianxin, M.; Fu, A. Effects of groundwater decline on populus euphratica at hyper-arid regions: The lower reaches of the Tarim river in Xinjiang, China. Fresenius Environ. Bull. 2011, 20, 3326–3337. [Google Scholar]
  19. Chen, Y.; Li, W.; Liu, J.; Yang, Y. Effects of water conveyance embankments on riparian forest communities at the middle reaches of the Tarim river, northwest China. Ecohydrology 2013, 6, 937–948. [Google Scholar] [CrossRef]
  20. Ling, H.; Zhang, P.; Xu, H.; Zhao, X. How to regenerate and protect desert riparian populus euphratica forest in arid areas. Sci. Rep. 2015, 5, 81–89. [Google Scholar] [CrossRef] [Green Version]
  21. Yan, H.; Wang, Y.; Wang, Y. The influence of 10 years of water conveyances on groundwater and juvenile populus euphratica of the lower Tarim river. Environ. Earth Sci. 2014, 71, 4091–4096. [Google Scholar] [CrossRef]
  22. Jiapaer, G.; Chen, X.; Bao, A. A comparison of methods for estimating fractional vegetation cover in arid regions. Agric. For. Meteorol. 2011, 151, 1698–1710. [Google Scholar] [CrossRef]
  23. Wang, S.; Bao, A.; Wang, Y.; Huang, Y.; Liu., C. Changes of vegetation coverage under hydrological fluctuations in lower reaches of Tarim river basin. Bull. Soil Water Conserv. 2013, 33, 131–135. [Google Scholar]
  24. Xiao, J.; Moody, A. A comparison of methods for estimating fractional green vegetation cover within a desert-to-upland transition zone in central New Mexico, USA. Remote Sens. Environ. 2005, 98, 237–250. [Google Scholar] [CrossRef]
  25. Guerschman, J.P.; Hill, M.J.; Renzullo, L.J.; Barrett, D.J.; Marks, A.S.; Botha, E.J. Estimating fractional cover of photosynthetic vegetation, non-photosynthetic vegetation and bare soil in the Australian tropical savanna region upscaling the eo-1 hyperion and modis sensors. Remote Sens. Environ. 2009, 113, 928–945. [Google Scholar] [CrossRef]
  26. Song, W.; Mu, X.; Ruan, G.; Gao, Z.; Li, L.; Yan, G. Estimating fractional vegetation cover and the vegetation index of bare soil and highly dense vegetation with a physically based method. Int. J. Appl. Earth Obs. Geoinf. 2017, 58, 168–176. [Google Scholar] [CrossRef]
  27. Ding, Y.; Zheng, X.; Zhao, K.; Xin, X.; Liu, H. Quantifying the impact of NDVIsoil determination methods and NDVIsoil variability on the estimation of fractional vegetation cover in northeast China. Remote Sens. 2016, 8, 29. [Google Scholar] [CrossRef] [Green Version]
  28. Chen, Y.N.; Chen, Y.P.; Xu, C.C.; Ye, Z.X.; Li, Z.Q.; Zhu, C.G.; Ma, X.D.; Liu, C.M.; Chen, Y.N.; Xu, Z.X. Effects of ecological water conveyance on groundwater dynamics and riparian vegetation in the lower reaches of Tarim river, China. Hydrol. Process. 2010, 24, 170–177. [Google Scholar] [CrossRef]
  29. Yan, Z.; Tang, G. Remote Sensing based monitoring of vegetation recovery in lower reaches of Tarim river following implementation of emergent water transportation project. Bull. Soil Water Conserv. 2005, 25, 58–60. [Google Scholar]
  30. Deng, M.; Yang, P.; Zhou, H.; Xu, H. Water conversion and strategy of ecological water conveyance in the lower reaches of the Tarim river. Arid. Zone Res. 2017, 34, 717–726. [Google Scholar]
  31. Li, L.; Zhang, X.; Chen, C.; Shen, M. Ecological effect of water conveyanse on the lower reaches of Tarim river in recent twenty years. Arid. Land Geogr. 2018, 41, 238–248. [Google Scholar]
  32. Gutman, G.; Ignatov, A. The derivation of green vegetation fraction from NOAA/AVHRR for use in weather prediction models. Int. J. Remote Sens. 1998, 19, 1533–1543. [Google Scholar] [CrossRef]
  33. Zhang, A.B.; Liu, X.X.; Di, W.J. Derivation of the green vegetation fraction from TM data of three gorges area. Procedia Earth Planet. Sci. 2009, 1, 1152–1157. [Google Scholar] [CrossRef] [Green Version]
  34. Liu, G.; Wu, B.; Fan, W.; Li, X.; Fan, N. Extraction of vegetation coverage in desertification regions base on the dimidiate pixel model. Res. Soil Water Conserv. 2007, 14, 268–271. [Google Scholar]
  35. Arvor, D.; Jonathan, M.; Meirelles, M.S.P.; Dubreuil, V.; Durieux, L. Classification of modis evi time series for crop mapping in the state of Mato Grosso, Brazil. Int. J. Remote Sens. 2011, 32, 7847–7871. [Google Scholar] [CrossRef]
  36. Savitzky, A.; Golay, M.J.E. Smoothing and differentiation of data by simplified least squares procedures. Anal. Chem. 1964, 36, 1627–1639. [Google Scholar] [CrossRef]
  37. Chen, J.; JÖnsson, P.; Tamura, M.; Gua, Z.; Matsushita, B.; Eklundh, L. A simple method for reconstructing a high-quality NDVI time-series data set based on the savitzky–golay filter. Remote Sens. Environ. 2004, 91, 332–344. [Google Scholar] [CrossRef]
  38. Li, M.; Wu, B.; Yan, C.; Zhou, W. Estimation of vegetation fraction in the upper basin of Miyun reservior by remote sensing. Resour. Sci. 2004, 26, 153–159. [Google Scholar]
  39. Wang, Q.; Adiku, S.; Tenhunen, J.; Granier, A. On the relationship of NDVI with leaf area index in a deciduous forest site. Remote Sens. Environ. 2005, 94, 244–255. [Google Scholar] [CrossRef]
  40. Li, F.; Zeng, Y.; Li, X.; Zhao, Q.; Wu, B. Remote sensing based monitoring of interannual variations in vegetation activity in China from 1982 to 2009. Sci. China Earth Sci. 2014, 57, 1800–1806. [Google Scholar] [CrossRef]
  41. Liu, Q.; Hanati, G.; Su, L.; Zhang, Y. Response process of groundwater table to ecological water conveyance in the lower reaches of Tarim River riparian zone. Arid. Land Geogr. 2017, 40, 979–986. [Google Scholar]
  42. Chen, Y.; Wang, Q.; Li, W.; Ruan, X.; Chen, Y.; Zhang, L. Study on Reasonable Groundwater Table Characterized by Vegetation Physiological and Ecological Data—Taking the Ecological Restoration Process in the Lower Tarim River as an Example. Chin. Sci. Bull. 2006, 51, 7–13. [Google Scholar]
  43. Chen, Y.; Li, W.; Xu, H.; Liu, J.; Zhang, H.; Chen, Y. The Influence of Groundwater on Vegetation in the Lower Reaches of Tarim River, China. Acta Geogr. Sin. 2003, 58, 542–549. [Google Scholar]
  44. Fan, Z.; Ma, Y.; Zhang, H.; Wang, R.; Zhao, Y.; Zhou, H. Research of eco-water table and retional depth of groundwater of Tarim river drainage basin. Arid. Land Geogr. 2004, 27, 8–13. [Google Scholar]
  45. Wang, X.; Xu, H.; Pan, C.; Ling, H. Study on groundwater recharge amount and suitable demand amount in lower reaches of Tarim river from 2000 to 2014. Water Resour. Prot. 2017, 33, 32–40. [Google Scholar]
  46. Xu, H.; Ye, M.; Song, Y.; Chen, Y. The natural vegetation responses to the groundwater change resulting from ecological water conveyances to the lower Tarim river. Environ. Monit. Assess. 2007, 131, 37. [Google Scholar] [CrossRef]
  47. Yuan, G.; Zhang, P.; Shao, M.A.; Luo, Y.; Zhu, X. Energy and water exchanges over a riparian Tamarix spp. Stand in the lower Tarim river basin under a hyper-arid climate. Agric. For. Meteorol. 2014, 194, 144–154. [Google Scholar] [CrossRef] [Green Version]
  48. Huang, Y.; Li, Y.P.; Chen, X.; Bao, A.M.; Ma, Y.G. A multistage simulation-based optimization model for water resources management in Tarim river basin, China. Stoch. Environ. Res. Risk Assess. 2013, 27, 147–158. [Google Scholar] [CrossRef]
  49. Bai, Y.; Xu, H.; Zhang, Q.; Ye, M. Evaluation on ecological water requirement in the lower reaches of Tarim River based on groundwater restoration. Acta Ecol. Sin. 2015, 35, 630–640. [Google Scholar]
Figure 1. The study area. (The nine ecological-monitoring sections are located along transects A (Qiara), B (Old Yingsu), C (Yingsu), D (Bozikule), E (Kardayi), F (Alagan), G (Yiganbujima), H (Kurgan) and I (Tetme); these sections were established by the TBAB along the river channel to monitor groundwater depths and vegetation changes. Each section has six monitoring wells at distances of 50, 150, 300, 500, 750 and 1050 m from the river, except the Tetme Lake section, which was newly established in 2009 and has two wells at distances of 50 and 250 m from the river).
Remotesensing 14 05855 g001
Figure 2. Framework of the vegetation detection and assessment methodology of this study.
Remotesensing 14 05855 g002
Figure 3. Sketch map of the Savizky–Golay (S–G) filtering process. (1) shows the time-series NDVI image. (2) shows a profile of NDVI values (temporal spectra) on the NDVI time series. (3) shows the temporal spectra after noise removal using the S–G smoothing filter.
Remotesensing 14 05855 g003
Figure 4. The FVC distribution maps in the lower reaches of the Tarim River from 2000–2017.
Remotesensing 14 05855 g004
Figure 5. Vegetation change trend analysis significance test results. ((a) shows the increase rate of the regional vegetation coverage be-tween 2000 and 2017. (b) shows the significance level of the regional vegetation changes alongside the p values.)
Remotesensing 14 05855 g005
Figure 6. Dynamic FVC changes at nine ecological monitoring plots.
Remotesensing 14 05855 g006
Figure 7. Three-dimensional map of FVC dynamic changes along nine ecological-monitoring sections.
Remotesensing 14 05855 g007
Figure 8. Histogram of the overall FVC results in the lower reaches of the Tarim River.
Remotesensing 14 05855 g008
Figure 9. The EWC and underground water variation processes over 18 years.
Remotesensing 14 05855 g009
Figure 10. Groundwater depths at monitoring wells with different distances from the river. (The black color points represent the average groundwater depths at the five ecological sections, and the widths of the ribbons show their standard variations, representing the groundwater level variations at different ecological monitoring wells. The x-axis is the distance of the ecological monitoring wells to the river. The y-axis is the groundwater depth.).
Remotesensing 14 05855 g010
Figure 11. The relationship between the variations in groundwater depth and the ecological Water Compensation volume.
Remotesensing 14 05855 g011
Figure 12. The relationships between vegetation changes and groundwater variations in various sections and in the whole region.
Remotesensing 14 05855 g012
Figure 13. Vegetation spatial dynamic change analysis performed using buffer-zone statistics.
Remotesensing 14 05855 g013
Figure 14. Scatterplots between the FVC results from the MOD13Q1 NDVI data and the GF-2 validation data.
Remotesensing 14 05855 g014
Table 1. Volume and duration time of Ecological Water Conveyance from Daxihaizi reservior.
Time/PhaseDuration (y/m/d)
(Beginning Time–Ending Time)
Volume of Water Compensation
(108 m3)
Watering Distance
(km)
Transection for Water ReachWater Reach Taiteme Lake Time
The 1st timne14 May 2000–12 July 20000.99110Karday
The 2nd time3 November 2000–5 February 20012.27234.5Alagan
The 3rd timeI. 1 April 2001–6 July 20011.84330Yiganbujima
II. 12 September 2001–18 November 20011.98363Tetme6 November 2001
The 4th time20 July 2002–10 November 20023.31363Tetme5 October 2002
The 5th timeI. 3 March 2003–11 July 20033.40363Tetme22 March 2003
II. 4 August 2003–3 November 20032.85363Tetme18 September 2003
The 6th time23 April 2004–22 June 20041.02363Tetme24 June 2004
The 7th timeI. 18 April 2005–7 June 20050.52254Alagan
II. 30 August 2005–2 November 20052.30363Tetme28 October 2005
The 8th time25 September 2006–21 November 20061.96340Kuergan
The 9th time10 October 2007–21 October 20070.14 Karday
The 10th time5 December 200–31 December 20090.11 Karday
The 11th time25 June 2010–11 November 20103.64363Tetme12 November 2010
The 12th timeI. 7 January 2011–25 January 20113.75363Tetme25 January 2011
II. 17 April 2011–23 November 20118.15363Tetme15 May 2011
The 13th time27 April 2012–27 November 20126.67363Tetme12 June 2012
The 14th timeI. 25 April 2013–29 May 20130.14
II. 6 August 2013–5 November 20134.74363Tetme10 September 2013
The 15th time17 June 2014–26 June 20140.07172Karday
The 16th time18 August 2015—5 November 20154.61363Tetme12 September 2015
The 17th time11 August 2016–31 October 20166.76363Tetme28 August 2016
The 18th timeI. 27 April 2017–9 May 20170.16
II. 28 May 2017–4 September 20175.55363Tetme6 June 2017
Total volume63.56
Table 2. Data Collection.
Data TypeAcquisition TimeSpatial ResolutionSource
MOD13Q12000–2017250United States Geological Survey (USGS) GLOVIS website (http://glovis.usgs.gov/, accessed on 1 June 2018)
GF-220170.8China center for resources satellite data and application (http://www.cresda.com/CN/, accessed on 1 July 2018)
ETM+200015United States Geological Survey (USGS) GLOVIS website (http://glovis.usgs.gov/, accessed on 1 January 2018)
Sentinel-2201710Geospatial Data Cloud (http://www.gscloud.cn/, accessed on 1 April 2018)
Water Compensation2000–2017-Tarim river basin administration bureau (TBAB)
Groundwater depth2000–2017-Tarim river basin administration bureau (TBAB)
Table 3. FVCs on different fields ecological monitoring sites.
SiteNameTime (Year)
200020012002200320042005200620072008200920102011201220132014201520162017
AQiara0.340.370.440.460.450.480.400.400.430.370.370.420.410.430.430.470.450.49
BOld Yingsu0.140.130.140.150.160.170.170.180.170.160.150.160.170.210.190.200.220.22
CYingsu0.130.130.150.150.150.160.170.170.170.160.160.150.160.180.170.190.180.19
DBozikule0.130.120.130.130.140.140.150.140.150.140.140.130.150.170.170.180.170.18
EKardayi0.110.110.120.130.120.140.130.140.130.130.130.140.140.160.140.160.150.15
FAlagan0.130.130.140.140.150.160.160.160.160.150.160.160.170.180.170.180.170.18
GYiganbujim0.130.120.130.130.140.150.150.150.150.150.150.140.150.160.150.150.150.16
HKurgan0.120.120.120.110.130.130.130.130.130.130.130.120.130.150.180.170.180.22
ITetme0.100.100.100.070.150.190.200.190.160.150.140.130.220.300.290.240.340.44
Publisher’s Note: MDPI stays neutral with regard to jurisdictional claims in published maps and institutional affiliations.

