Abstract
The occurrence of litter in natural areas is nowadays one of the major environmental challenges. The uncontrolled dumping of solid waste in nature not only threatens wildlife on land and in water, but also constitutes a serious threat to human health. The detection and monitoring of areas affected by litter pollution is thus of utmost importance, as it allows for the cleaning of these areas and guides public authorities in defining mitigation measures. Among the methods used to spot littered areas, aerial surveillance stands out as a valuable alternative as it allows for the detection of relatively small such regions while covering a relatively large area in a short timeframe. In this study, remotely piloted aircraft systems equipped with multispectral cameras are deployed over littered areas with the ultimate goal of obtaining classification maps based on spectral characteristics. Our approach employs classification algorithms based on random forest approaches in order to distinguish between four classes of natural land cover types and five litter classes. The obtained results show that the detection of various litter types is feasible in the proposed scenario and the employed machine learning algorithms achieve accuracies superior to 85% for all classes in test data. The study further explores sources of errors, the effect of spatial resolution on the retrieved maps and the applicability of the designed algorithm to floating litter detection.
1. Introduction
Littered areas can be found all over the globe, directly damaging the ecological balance, threatening endangered species and affecting the health of the human population. Among all the waste generated by the world population, the plastic materials are of utmost concern in terms of both quantity and environmental threats. In [1], it has been estimated that in 2016, 242 million tons of plastic waste were generated at global level, accounting for 12% of the total municipal solid waste. In the same study it is shown that the limited capacities for collecting and recycling these residuals in many parts of the world, coupled with educational and economical challenges, call for improved policies as the waste generation is projected to outpace the population growth by more than double by 2050.
The plastic residuals pose a serious threat to natural ecosystems and human population. Although the plastics are designed to be resistant for long periods of time, it is not uncommon that they are used in single use products, such as grocery packages. The most worrisome characteristic of these materials is that they can last for hundreds or even thousands of years [2], and can break into pieces of smaller size until they spread in the form of nano-plastics which are extremely harmful to humans as they are far more toxicologically active than micro- and macro- plastics. The nano-plastics have the potential to directly interact with human cells due to their size and to produce severe reactions ranging from physical stress and damage to immune responses [3]. Some chemical compounds found in plastic, such as bisphenol A and phthalates, are part of a group of substances called endocrine-disrupting chemicals that can trigger metabolic, reproductive and degenerative disease and certain types of cancer [4]. The majority of nano-plastic particles enter the human body by ingestion and inhalation, thus they are mobile, carried by the wind, water or products, and cannot be treated as localized issues occurring at the dumping sites.
At a larger scale, micro- and macro-plastic waste is also affecting the environment once it enters natural circuits. Plastics dumped on land are often carried by river streams and end up in lakes, seas and oceans [5]. The mobility of plastic residuals is so high that micro-plastics have even been found in wild or rarely explored places on earth, e.g., polar regions [6], Mariana Trench [7] and Mount Everest [8]. Numerous reports document the direct, harmful effect of plastics on wildlife [9,10,11,12,13].
Following these alarming reports, a variety of mitigating measures have been proposed by legal regulators across the world, including the banning of single-use plastics, reinforcement of educational programs, raising citizen awareness and improved recycling procedures, among others [14,15,16,17,18,19,20,21].
To inform effective mitigation strategies, urgent monitoring action is needed to better understand sources, pathways, and the spatial and temporal distribution of plastic litter. It is also important to precisely locate plastic litter discarded in nature in a view to remove it as soon as possible, such that the course of pollution is interrupted before it reaches an uncontrollable stage—distribution in nature under the action of natural elements and breaking into small pieces, which is virtually impossible to spot and collect. Among the detection and monitoring techniques, the use of remote sensing imagery stands out as an excellent option due to the coverage of relatively large areas in a short period of time. The methods applied to achieve a high accuracy of plastic detection based on optical sensors cover a wide range of methods and data types. In [22], semantic segmentation is employed to detect beach litter in images freely taken by a human observer. Beach litter monitoring based on data acquired from unmanned aerial vehicles has also been studied in [23,24,25]. Deep learning methods have also been employed in aerial imagery, in combination with digital models of the surface, to estimate the volume of litter in such environments [26]. White and grey dunes, where vegetation with varying levels of abundance exists, are also affected by litter, which is often entangled with the green plants, as it is the case in beach-dune systems. This type of ecosystem has been also studied in recent works based on aerial imagery [27,28,29]. Aiming at quantifying the abundance of litter in aerial images, the authors in [30] employ various object-oriented machine learning methods and conclude that a Random Forest approach performs better than other tested approaches. A vast amount of research has also been devoted to monitoring plastic-covered crops (greenhouses) [31,32,33,34,35,36]. The remote sensing detection and monitoring of floating marine debris is now a very active field of research with several funding agencies promoting efforts in this research area (see [37,38,39] and the research initiatives therein). When targeting a global overview of debris pollution over water areas, satellite images are exploited in a wide range of methods, mostly targeting spectral classification approaches [40,41,42] for which novel indices have been developed to be used in conjunction with already known metrics and the reflectance values acquired at the respective pixel [43,44,45,46,47].
Despite the intense efforts to advance knowledge in the area of litter detection and classification, a series of challenges remain. First, the detection from satellite imagery is hampered by the relatively low spatial resolution of the sensors, while the signal-to-noise ratio (SNR) of operational sensors might also be of concern for this type of application, considering the limited coverage of plastic per pixel occurring in most of the cases [48]. The lack of training samples has also been signaled as a limitation, and efforts are being made for the production of such data [49,50]. The object-based detection methods retrieve possible areas of plastic contamination, however multiple technologies (from optics to microwaves), e.g., Synthetic Aperture Radar (SAR) [51], might be needed to perform reliable discrimination of accumulations containing plastic. Furthermore, many methods developed for plastic litter monitoring at a large or global scale make use of features computed from both the visible and near-infrared (VIS-NIR) and the short-wave infrared (SWIR) regions of the electromagnetic spectrum, while many airborne multispectral sensors do not have such extended spectral ranges, which makes these methods difficult to apply when regional/local studies are performed, e.g., with planes and drones. These studies are needed as the data can be acquired at higher spatial resolution, thus offering a more detailed monitoring of the pollution and also a chance to remove the local litter, e.g., from beaches and river-banks. While it is possible to employ airborne hyperspectral sensors covering the full electromagnetic spectrum, the data acquisition campaigns are more costly, and might involve additional legal procedures such as obtaining flight permits from civil and military aviation when piloted aircrafts are used, and the data processing is more resource-intensive in comparison to multispectral imagery. This is specifically the research problem tackled in this study: estimating the capabilities of off-the-shelf multispectral cameras having sensors with limited spectral range, in a two-fold goal. First, the main scope is to obtain a high performance related to plastic detection and estimation. Second, the study explores further the potential and limitations to discriminate between other types of litter.
The data used in this paper are multispectral images acquired by a MicaSense Red-Edge (https://support.micasense.com/hc/en-us, accessed on 15 November 2022) camera. We employ machine learning algorithms based on Random Forest (RF) approaches to train a fully supervised multi-class classifier for a total of nine classes, out of which four are natural materials and five correspond to litter materials. The algorithms perform per-pixel classification based on optimal features derived from a large initial pool of spectral metrics (indices). Training and validation datasets were acquired in two different data acquisition campaigns. Our experiments show that plastic litter can be found with high accuracy based on this approach (>88% in test and validation data). The study further shows that class confusions between litter types occur due to data errors and spectral similarities, highlighting shadows as a strong source of inaccuracy in the classification maps and exploring post-processing techniques to alleviate these limitations. Finally, we analyze the influence of spatial resolution on the quality of the retrieved maps and the limitations of the designed algorithm when applied over water areas.
2. Materials and Methods
2.1. Available Data
In this study, multispectral images acquired with a multispectral MicaSense RedEdge-M camera are employed. The sensor benefits from five spectral bands centered at 475 nm (blue—B), 560 nm (green—G), 668 nm (red—R), 717 nm (red-edge—RE) and 840 nm (near-infrared—NIR) and having bandwidths (FWHM) of 20 nm, 20 nm, 10 nm, 10 nm and 40 nm, respectively. The data are processed using VITO’s MAPEO water workflow, operational in Amazon Web Services (AWS). The application of the calibration parameters of the camera transforms the digital numbers into radiance. To calculate reflectance out of radiance, the irradiance should be taken into account. This can be done using a calibrated reflectance panel or an irradiance sensor. Under varying cloud conditions, the latter could better take into account the changing light conditions. For measurements above water, an additional sky glint correction is applied using iCOR4drones, based on VITO’s atmospheric correction toolbox iCOR. Pixels that are saturated are masked out of the end product.
Two data acquisition campaigns have been performed in two different days and at two different sites in the vicinity of Mol, Belgium.
The first campaign (Campaign1) took place on 1 June 2021, with the MicaSense camera mounted on a Remotely Piloted Aircraft System (RPAS), as shown in Figure 1a. Plastic accumulation areas have been simulated by placing a variety of plastics and other types of litter (cans, wood residuals) in the field of view of the camera, as illustrated in Figure 1b. The litter contains weathered plastic objects originating from the port of Antwerp, Scheldt River (Belgium) and Vietnamese coastal sites. In total, 335 individual images were acquired during the flight. In some of the images, the plastic accumulations are not present as they were outside the field of view of the camera.
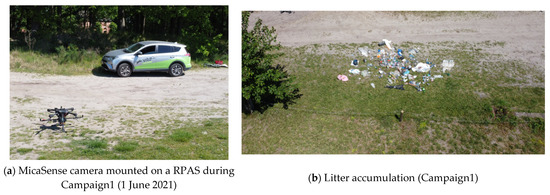
Figure 1.
RPAS carrying a multispectral camera during Campaign1 (a) and plastic accumulation (b).
The second campaign (Campaign2) took place on 8 March 2022, when the MicaSense camera was mounted on a bridge over the canal Bocholt-Herentals near the VITO facilities (Mol, Belgium). The camera is attached in a fixed way to the pedestrian railing, at a height of 7 m above ground. A plastic accumulation area has been simulated on land similarly to Campaign1. Figure 2a illustrates the setup used for data acquisition during Campaign2. Note that the plastics used during the two campaigns were different. For Campaign2, virgin plastics (placemats, plastic bottles, pure plastic samples) have also been used, next to weathered plastics previously collected from the port of Antwerp. The positions of the different plastic samples are changed during the image acquisition. A total number of 135 images are captured from this setup. In the following, this set of images will be denoted by the term “Campaign2-Land” (see Figure 2b). Once the data acquisition over land was concluded, the MicaSense camera was moved to the middle of the bridge in order to observe only the water (no land in image footprint). Floating materials were thrown on water such that they entered the field of view of the camera (Figure 2c). The field crew recollected these materials using a net maneuvered from a boat. This part of the campaign (“Campaign2-Water”) contains 143 images. The data from Campaign2-Water are only used to observe the transferability of designed algorithms from land to water areas later in the paper.
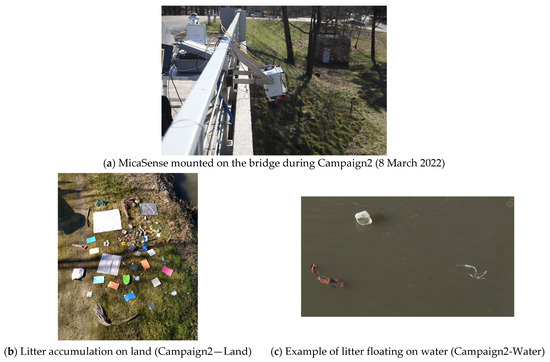
Figure 2.
Camera mounted on bridge during Campaign2 (a), litter on land (b) and floating litter on water (c).
2.2. Classes of Interest and Training Data
This work targets a multi-class classification scenario, justified by the fact that a binary classification of litter and non-litter classes is not suitable to distinguishing different litter materials, nor different classes of natural materials. While the main scope remains to spot plastic litter, a total of nine classes of interest have been identified, out of which four are natural materials: grass, tree, soil and water, and five are litter classes: cement, painted surface, oxidated metal, plastic and processed wood. While the classes were defined by observing the materials present in the available images, a few observations can be made:
- -
- The wood class is considered litter in our approach, i.e., processed wood, however wood items can have a purely natural origin (e.g., branches, dead trees fallen into rivers);
- -
- The difference between plastic and painted surfaces is only related to the origin of the training pixels: plastic pixels are extracted from plastic materials, while the painted surfaces correspond to areas such as cars, boats and reflectance tarps; however, most of the plastics can embed pigments to provide colors or can be superficially painted in practice, thus confusions between these two classes are tolerated as long as the pixels are correctly identified as plastic/painted litter;
- -
- Confusions between vegetation pixels (tree and grass) are largely tolerated and the algorithms were not tuned to obtain the best possible discrimination between these classes;
- -
- The natural materials could all be gathered in one single class as the corresponding pixels do not serve in monitoring litter pollution status nor they call for interventions (cleaning) in the area; however, it was preferred to make the distinction as it offers better insights on common class confusions between litter and non-litter materials.
It is important to note that the training/testing pixels were extracted from Campaign1 and the validation pixels were mostly extracted from Campaign2-Land. However, the images from Campaign2-Land did not contain ground-truth pixels for three classes: cement, tree and oxidated metal, thus images from Campaign1 were added to the validation set, but none of them from the set of images that served as sources of training/testing pixels. This ensures the separability of training/testing and validation data.
Once the targeted classes have been defined, a fully supervised classification approach is targeted. Specifically, a total number of 22.678 training pixels were manually extracted from 32 source images from Campaign1. As the flight has been performed at variable altitudes (between 10 m and 100 m), the spatial resolution of the images varied between 0.69 and 7 cm. The four natural classes benefit from the highest number of training points, followed by the “plastic” class. Figure 3 shows a bar plot of the available number of training pixels corresponding to each class. In this figure, the natural classes are signaled by blue color, while red color is used for the litter classes. Note that the “cement” and the “oxidated metal” classes have the lowest number of training points, which is not surprising as they are less present in the acquired images than the other materials.
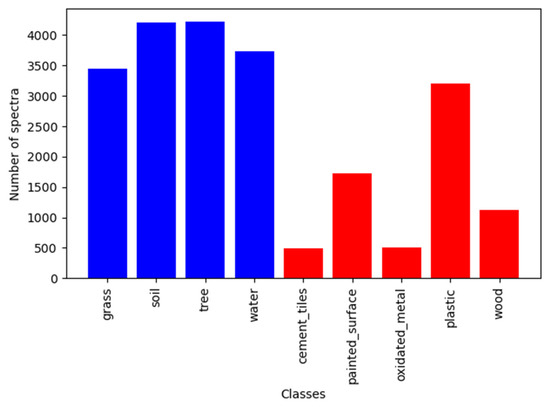
Figure 3.
Bar plot of training points distribution; blue and red bars indicate natural and litter materials, respectively.
High heterogeneity of the extracted pixels inside most of the nine classes has been observed, as shown in Figure 4, where the spectra from each class, boxplots for all spectral bands and the median spectrum of each material are plotted. The range of the y-axis in all plots is common (covering the interval [0, 1]) in order to better observe the difference in amplitude and heterogeneity of the considered materials. The different colors of the spectral signatures correspond to the color coding that will be used in the remainder of the paper to identify distinct materials. This coding is also resumed in Figure 4j. Note, in Figure 4h, that the plastic class exhibits high heterogeneity in terms of both spectral shape and spectral amplitude, which suggests that it is a difficult class to distinguish from other classes.
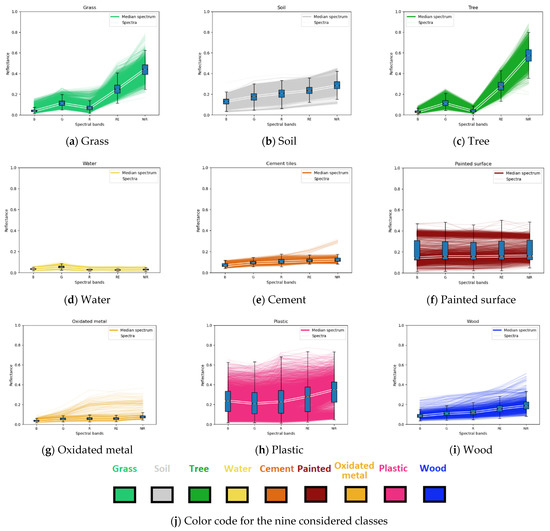
Figure 4.
Plots of spectra, boxplots and median spectra for the nine considered classes (a–i) and color coding scheme of the considered materials (j).
2.3. Classification Algorithm
2.3.1. Overall Approach
The designed classification scheme is a machine learning algorithm based on Random Forest approaches [52]. The Random Forest classifiers belong to the class of ensemble learning methods, in which multiple decision trees run separately and the outputs of the individual trees jointly contribute to a final result (label) for each input sample. The algorithm has been developed in the Python3 programming language using the Random Forest Classifier module of the Scikit-Learn machine learning library [53]. The classifier has been tuned in a two-step approach. First, a large number of spectral metrics have been derived from the reflectance values of the training points and an intermediate classifier has been tuned for optimal performance based on the complete set of features, including the original values of the spectral bands and the derived spectral metrics. A grid search approach, in which a large number of combinations of parameters was employed to evaluate the performances of the corresponding classifier architectures, has been used for this purpose. The goal in this step was to obtain a ranking of the input metrics w.r.t. their importance in the classification performance. Second, the 30 most informative spectral features of the best performing classifier in terms of overall accuracy were kept as input metrics in order to train a final classifier.
2.3.2. Metrics Selection
In multispectral data, the classification performance when solely the band reflectance values are considered, is limited due to various factors. Even if the number of spectral bands is low, they might still exhibit a certain degree of correlation. Furthermore, the reflectance values still embed the influence of external factors such as atmospheric scattering, variations in scene illumination and topographic relief. The low number of bands further limits the performance when the number of classes in the scene is large. These limitations can be alleviated when derived parameters are used. These parameters, denoted by the terms “metrics”, “spectral indices” or simply “indices” in the following, are obtained by combinations of reflectance values from distinct spectral bands.
In our study, spectral indices available in the literature have been inventoried and all the ones that were applicable to the spectral bands of the MicaSense multispectral camera were retained. A number of 76 indices were found this way. Second, another set of spectral indices has been defined by computing band differences, band ratios and normalized band ratios applied to the five available spectral bands. This second set of indices contains 30 indices and the reflectance values for the five spectral bands of the MicaSense camera were also included, thus a total of 111 indices have been employed in the first step of algorithm development. All the indices considered in this initial database are listed in the Appendix A jointly with their formulas (applied to MicaSense spectral bands) and their corresponding reference works. Note that spectral indices specifically designed for plastic detection [45,46,47] based on SWIR reflectance values cannot be applied to the MicaSense sensor due to the limited spectral range.
For illustration purposes, Figure 5 shows the median spectra of the considered training pixels for all the classes (Figure 5a) and radar plots of the indices computed from these spectra after shifting all the values to the positive quadrant and performing peak-to-peak normalization (Figure 5b–i). Each axis of a radar plot corresponds to a specific spectral index.
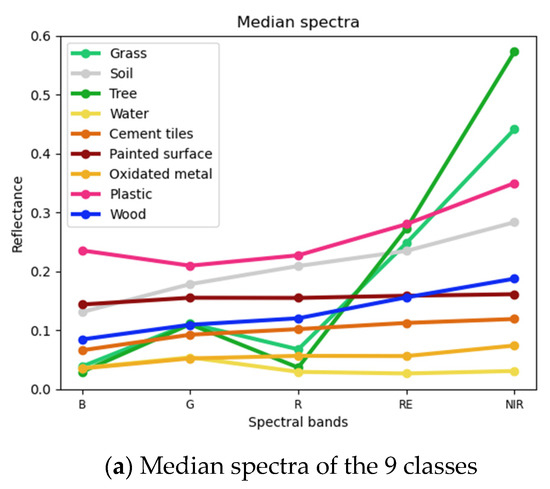
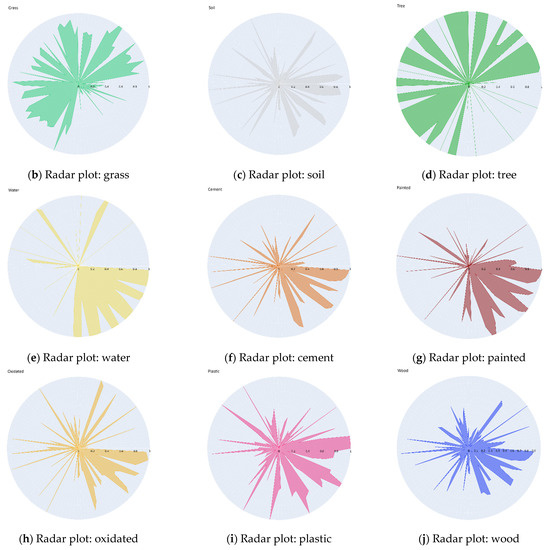
Figure 5.
Median spectra of the training pixels per class (a) and radar plots of computed indices based on the median spectrum of each individual material (b–j). In the radar plots, each angular axis corresponds to one spectral metric.
The 111 indices were computed for all pixels available in the training set and the best intermediary classification algorithm has been selected after the grid search was performed. For all the tested variants of the algorithm, the training database was further split in training and testing samples on the basis of a ratio of 70%/30% split performed on the source images, such that the sets do not contain points originating from common images.
The 30 most relevant metrics for the best performing intermediate classifier (marked in bold letters in the Appendix A) are: Near-Infrared reflectance (NIR), Browning Reflectance Index (BRI), Ashburn Vegetation Index (AVI), Differenced Vegetation Index MSS (DVIMSS), Inverse Reflectance 717 (IR717), Tasseled Cap—Non Such Index MSS (NSIMSS), RedEdge reflectance (RE), normalized Blue-NIR index (nBNIR), ratio Blue-RedEdge (rBRE), Plant Senescence Reflectance Index (PSRI), normalized Blue-Green (nBG), Adjusted Transformed Soil-Adjusted Vegetation Index (ATSAVI), ratio Blue-Green (rBG), normalized ratio Green-Red (nGR), normalized green reflectance (NormG), Coloration Index (CI), ratio Green-Red (rGR), Blue-Wide Dynamic Range Vegetation Index (BWDRVI), Chlorophyll Vegetation Index (CVI), Tasseled Cap—Soil Brightness Index MSS (SBIMSS), Anthocyanin Reflectance Index (ARI), Normalized Green-Red Difference Index (NGRDI), Difference Blue-Red (dBR), Normalized Blue-Red ratio (nBR), ratio Blue-Red (rBR), Red-Edge 2 (Rededge2), Pan Normalized Difference Vegetation Index (PNDVI), Structure Intensive Pigment Index (SIPI), difference Blue-RedEdge (dBRE) and Green Leaf Index (GLI).
2.3.3. Final Configuration
The 30 selected metrics were used in the training of the final classifier. The grid search approach has been once again employed. At the end, the parameters of the final classifier are as follows (see their significance in the online documentation of the scikit-learn implementation [54]): ‘bootstrap’: True, ‘ccp_alpha’: 0.0, ‘class_weight’: None, ‘criterion’: ‘gini’, ‘max_depth’: 125, ‘max_features’: auto’, ‘max_leaf_nodes’: None, ‘max_samples’: None, ‘min_impurity_decrease’: 0.0, min_samples_leaf’: 1, ‘min_samples_split’: 3, ‘min_weight_fraction_leaf’: 0.0, ‘n_estimators’: 25, ‘n_jobs’: None, ‘oob_score’: False, ‘random_state’: None, ‘verbose’: 0, ‘warm_start’: False.
2.3.4. Validation Data
Targeting an independent validation, ground-truth maps have been manually generated based on five validation images from Campaign2-Land. Areas (polygons) containing different materials have been digitized and assigned the corresponding labels. Only areas visually homogeneous were considered. Figure 6 shows the RGB representation of the validation images and the corresponding ground-truth maps. In this figure, the color scheme from Figure 4j applies to all ground-truth maps.
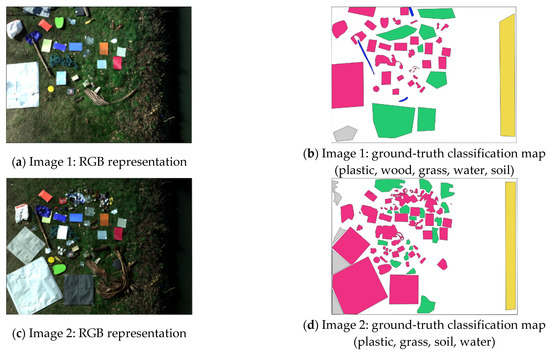
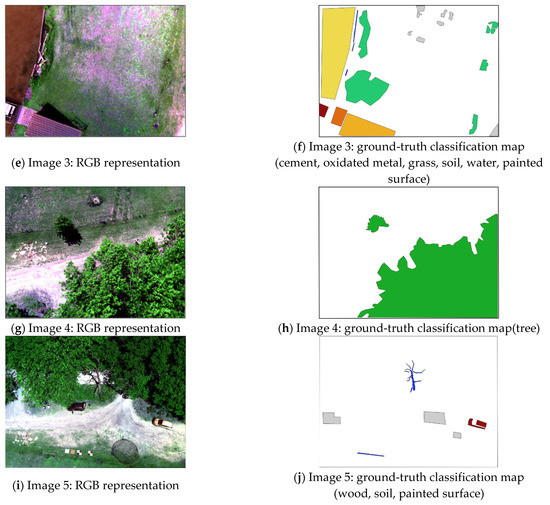
Figure 6.
Validation data: RGB representations of images (left) and ground-truth classification maps (right).
Some observations should be made before further proceeding with the results analysis. First, due to a very low or null number of validation pixels in Campaign2 for cement, oxidated metal, tree and wood classes, images from Campaign1 were also used to define validation pixels, while ensuring no overlap with the training/testing images occurred. Second, despite the fact that the data from Campaign2 were acquired by the MicaSense camera mounted on a bridge, the data processing and camera settings were not different from the ones set during Campaign1, thus the images from Campaign2 have the same spectral characteristics as the ones from Campaign1 and the obtained results are valid for aerial imagery. Third, the classification algorithm is not trained to act on shadowed pixels, thus the shadowed areas will be removed from both the ground-truth maps and the inferred maps. To this end, a threshold T = 0.11 has been empirically imposed on the pixel brightness (simply computed by the sum of the reflectance values in the R, G and B bands) to separate shadowed and non-shadowed areas. More insights on the issues induced by the presence of shadows in the imagery are given further in the discussion section. The number of independent validation points per class is shown in Table 1.

Table 1.
Number of independent validation points, per class.
3. Results
In this section, we analyze the performance achieved by the designed classifier and provide interpretations of the observed strengths and weaknesses.
3.1. Algorithm Performance
Figure 7 shows the confusion matrix (relative values) obtained for the nine classes over the test data and in Table 2 the following performance metrics are listed next to the number of corresponding supporting points:
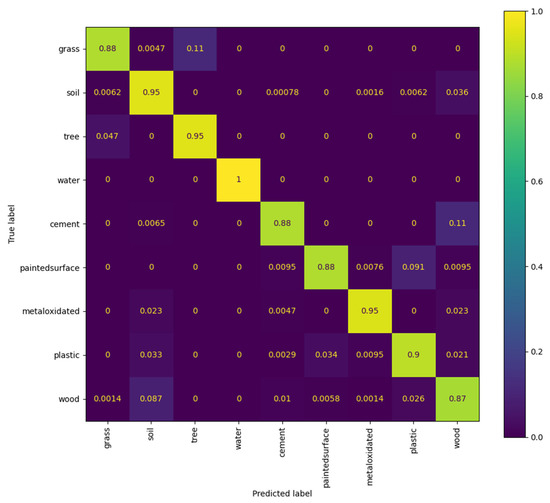
Figure 7.
Confusion matrix (relative values) computed over the test data for the designed classifier.

Table 2.
Accuracy metrics for the designed classifier, computed in test data.
- -
- Precision (P): P = TP/(TP + FP)
- -
- Recall (R): R = TP/(TP + FN)
- -
- F1-score: F1-score = (2∙P∙R)/(P + R)
- -
- Accuracy: Accuracy = (TP + TN)/(TP + FN + TN + FP),
where TP = True Positives, FP = False Positives, TN = True Negatives and FN = False Negatives.
From Table 2, it can be seen that all metrics are higher than 0.9 for plastic. Figure 7 shows that plastic pixels are most often confused with painted materials. The lowest values of the computed performance metrics are obtained for wood, however they are all above 0.85 which indicates a good performance. In test data, all water pixels are correctly identified. The highest confusion occurs between grass and trees, which is tolerable, as explained before. Another relatively high confusion is observed for wood and soil, which is explainable by the fact that their median spectra are very similar in terms of both shape and amplitude, as shown in Figure 4.
3.2. Validation Performance
In Figure 8, the confusion matrix computed for the validation data points (relative values) is displayed.
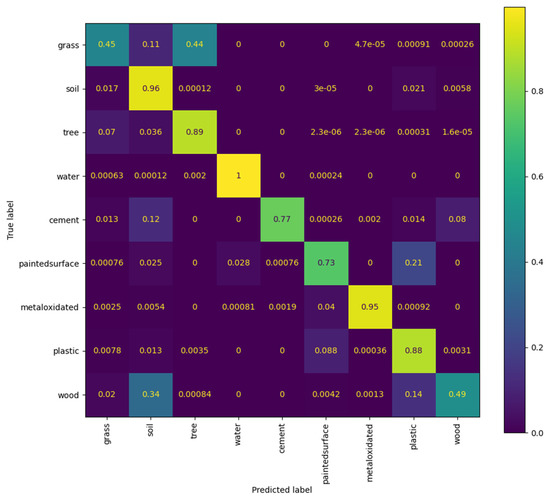
Figure 8.
Confusion matrix (relative values) computed over the validation data for the designed classifier.
In Figure 8, it can be observed that most of the classes exhibit lower accuracies in validation data than in the test data, as expected. However, most of the classes still attain a relatively high accuracy, except for the grass and the wood classes, which are very low in comparison to the training performance. Another class with a relatively high drop (more than 10%) in accuracy is the painted surface class. On the one hand, the confusion matrix suggests that the high drop in accuracy for the grass class is mainly originating in the strong confusion between this class and the tree class. This is not a worrisome issue, as both classes are green natural materials and tuning the classification for this type of materials is out of the scope of our application. The same logic applies to the confusion between painted surfaces and plastic surfaces—this confusion is embedded in the class definition. On the other hand, the wood class exhibits high confusion with the soil class, but the drop in accuracy is also partly due to the confusion with the plastic class. In order to better investigate the observed confusions, Figure 9 plots the ground-truth classification polygons defined in Figure 6 next to their counterpart classification maps retrieved by the designed classifier. In the retrieved maps, the shadowed areas were masked by enforcing a threshold T = 0.11 on the pixel intensity, computed as the sum of reflectance in the B, G and R bands. The threshold has been applied to all pixels classified as litter.
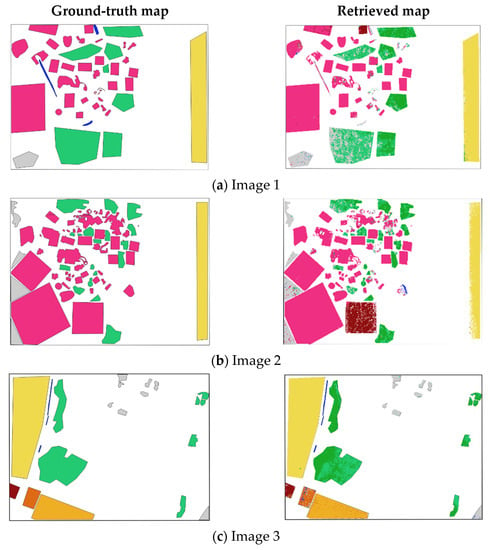
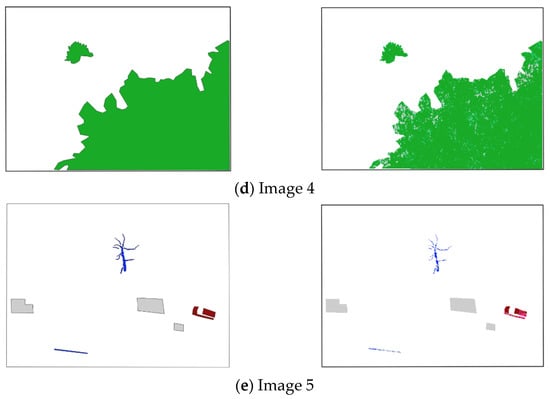
Figure 9.
Ground-truth classification maps (left) and retrieved classification maps (right) for the validation images.
Figure 9 confirms the behavior suggested by the confusion matrix. Each of the images 1 and 2 contain one plastic region that was classified as paint, which explains the observed confusion. In Image 3, the confusion between grass and tree classes is obvious. The errors are mainly observed on the grass class, for which many pixels are classified as tree. The tree class is classified with high accuracy, as illustrated by the classification maps of Image 4. The wood class suffers from confusions with more classes: in Image 1 all three wood polygons are mostly confused with soil and plastic; in Image 2, one polygon labeled as plastic is largely masked by the shadow removal approach as it is a dark material, but some pixels are also classified as wood; in Image 3, some cement pixels are classified as wood; in Image 5, wood pixels are sometimes masked by the shadow removal criterion or they are classified as soil. This shows that the wood class is difficult to correctly identify and the reasons for this behavior will be further analyzed in the discussions section.
The main class of interest, plastic, is identified with relatively high accuracy in all validation images. The confusion with painted surfaces, which is the most obvious error occurring in the retrieved maps (see Images 1 and 2) is tolerated, as explained earlier. However, the importance of distinguishing between the two materials cannot be denied as many materials can be painted without containing necessarily plastic, e.g., car bodies and roofs. It is likely that higher wavelengths are needed in order to be able to achieve this distinction with higher accuracy. The camera used in our study has the advantage of being easily accessible at a relatively low cost and easy to operate, but it does not benefit from SWIR measurement channels. From the point of view of the image pre-processing, another advantage of this camera is that it includes an irradiance sensor, which allows for the conversion of the raw data into reflectance even in the absence of a spectralon in the field. The plastic materials are shown to be identifiable from the considered data, however further distinctions, e.g., between different types of plastics, might require extended spectral range and higher spectral resolution.
4. Discussion
In this chapter we take a journey through the retrieved results and observe strengths, weaknesses, and possible improvements of the proposed approach, and we identify directions for future work.
4.1. Influence of Shadows
In shadowed areas, the classification proves to be unreliable, this issue stemming from a two-fold reason: (1) the shadowed areas suffer from distorted spectra due to the low level of radiation hitting the surface, and (2) naturally, training pixels are not selected from shadowed areas. The algorithms are thus generally not trained to deal with shadowed areas. In high resolution images such as the ones used in this work, shadows can be observed next to the tall objects, but even at a satellite level it is common to derive shadow masks from the remote sensing imagery such that caution is taken when dealing with the corresponding flagged pixels.
In this work, a simple shadow filtering method has been applied, based on the pixel intensity. As mentioned in Section 3.2, a threshold T = 0.11 has been set on the sum of reflectances in the R, G and B bands in order to separate shadowed from non-shadowed pixels. This threshold has been empirically set by finding an equilibrium between the quantity of pixels marked as shadows and the amount of useful pixels remaining in the image. Figure 10 illustrates the effect of four different threshold values on the retrieved classification map for Image 1. In this figure, it can be observed that the raw classification map is strongly affected by the occurrence of shadowed pixels. Specifically, at the transition between land and water areas a large part of the pixels is incorrectly marked as plastic, while many shadowed pixels along this transition area are classified as oxidated metal. By masking the shadowed pixels, the classification maps improve substantially. Higher thresholds lead to a more shadow-free conservative masking. However, the removal of false positives should always be in harmony with the preservation of true positives, thus the choosing of an illumination threshold should be done with caution, as dark littered pixels might also be removed. For example, the threshold applied in Figure 10f is too high as some plastic areas, correctly classified in the raw map, are masked out jointly with the true shadowed pixels. It is also likely that the shadow thresholds need tuning when different spatial scales are used, as in low resolution pixels the shadowed areas are mixed with bright areas, resulting in an intermediate brightness between the two pixel types. Efficient and accurate shadow removal approaches are needed for the post-processing of the classification maps and will be further investigated in future works.
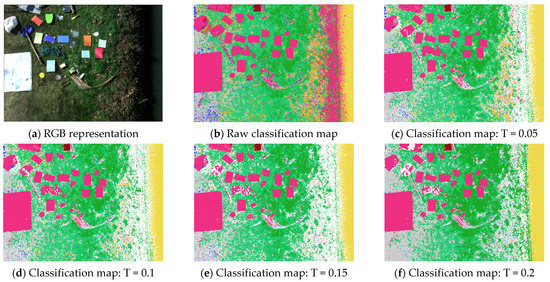
Figure 10.
Effect of shadow removal thresholds on the classification map.
4.2. Plastic Quantification and Representation
Once the classification map is produced, it is straightforward to estimate the area of plastic litter in the image, starting from the spatial resolution of the input imagery. Once more, the post-processing strategies play an important role in the accuracy. In Table 3, the ground-truth plastic area is listed next to the estimated plastic areas for the filtered maps illustrated in Figure 10b–f, respectively. For the considered image, the spatial resolution is 0.48 cm, thus each pixel occupies an area of 2.3 × 10⁻⁵ m2. Note that the true plastic area is slightly underestimated in Table 3, as very small plastic objects and transition areas between materials were not taken into account, in order to avoid contributions from mixed pixels. Furthermore, it is expected that pixels incorrectly classified as plastic are still present in the classification map after the shadow filtering. However, the table confirms without doubt that the raw classification map suffers from a strong over-estimation of plastic area, due to the shadowed pixels incorrectly classified as plastic, as previously explained. The shadow filtering significantly contributes to a better estimation of the plastic area for all considered thresholds.

Table 3.
Estimation of area covered by plastic w.r.t. the threshold employed for shadow removal.
The approach above provides an estimation of the total area occupied by plastic pixels in the considered image. However, for policy makers, another type of characterization might be relevant: the number of plastic objects (separate areas littered with plastic), their size and their location, among others. This type of detail requires an additional spatial post-processing approach. In Figure 11, we illustrate the results of a straightforward strategy to achieve this goal, applied to the plastic map extracted from Figure 10e: first, plastic regions are delimited to create spatial blobs by thresholding the smoothed classification map obtained after applying a spatial Gaussian kernel (Figure 11b—each color represents one blob or plastic region); second, these blobs are visualized as a pie chart w.r.t. to their sizes (measured in pixels; Figure 11c); third, the blobs are converted to circular regions having equal areas to the original blobs and represented on the map for easier visualization (Figure 11d—the colors mirror the ones in Figure 11b). In case the analyzed images are georeferenced, geographic coordinates can be assigned to the plastic regions to support the planning of cleaning activities. Depending on the scope, small blobs can be neglected, e.g., if the main targets are the large accumulations or if avoiding false positives is of utmost importance.
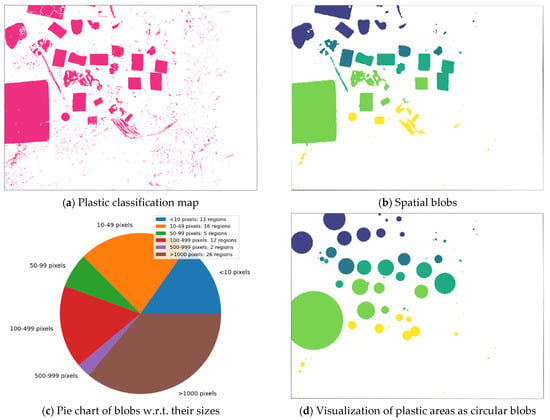
Figure 11.
Post-processing on top of shadow removal: retrieved map of plastic pollution (a), filtered map based on spatial approaches (b), characterization of littered areas w.r.t. their spatial extent (c), and conversion of blobs to equivalent circular areas for easy planning of litter cleaning actions (d).
4.3. Sources of Classification Errors
Apart from the issues identified over shadowed areas, the quality of the retrieved classification map might be influenced by other factors, such as data quality, inter-class correlations and spatial resolution.
4.3.1. Data Quality
In order to evaluate the quality of input data, reference spectra have been acquired during Campaign2-Land using an ASD FieldSpec spectrometer (https://www.malvernpanalytical.com/en/products/product-range/asd-range/fieldspec-range/fieldspec-4-standard-res-spectroradiometer, accessed on 15 November 2022) over various targets. This spectrometer covers the spectral range 350–2500 nm with a spectral resolution of 1 nm, resulting in 2151 spectral bands across VNIR and SWIR regions. In total, twelve different materials were scanned and for each material three spectra were acquired. The reference (hyperspectral) spectrum of one material is considered as the median spectrum of the individual measurements. The reference spectra were then convolved with the spectral response functions of the MicaSense camera in order to derive ground-truth multispectral signatures of all samples. Pictures of the eleven material samples are shown in Figure 12a–l and the reference (simulated, ground-truth) MicaSense spectra are shown in Figure 12m.
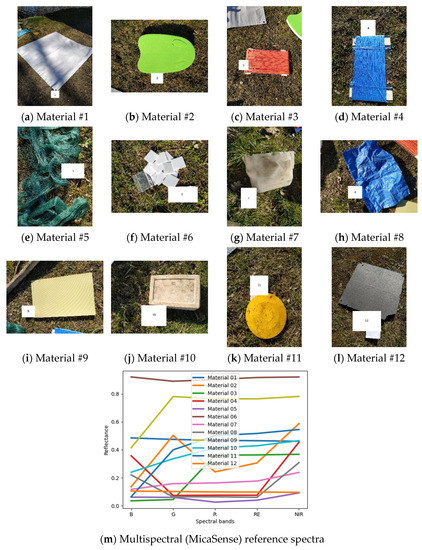
Figure 12.
Photos of 12 reference materials (a–l) and reference multispectral signatures derived from ground hyperspectral measurements (m).
In order to inspect the quality of the fitting between the reference spectra and the acquired spectra, actual spectra were extracted from polygons drawn on the corresponding regions from one image. Then, saturated pixels (e.g., the ones having reflectance larger than 1 in at least one band) and possibly shadowed pixels (based on a soft shadow threshold: T = 0.05) were excluded. Based on the remaining pixels we plot, in Figure 13, for all the considered samples, the following data: boxplots of reflectance values extracted from the actual imagery, median spectrum retrieved from the actual imagery (blue) and reference spectrum simulated from the ASD measurements by convolution with the MicaSense response functions (green).
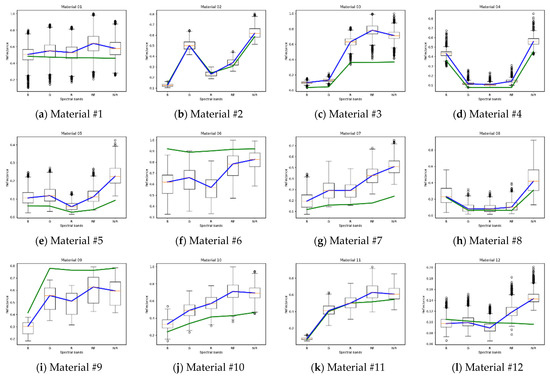
Figure 13.
Boxplots of the actual reflectance values, median spectrum of actual reflectance values (blue) and reference spectrum (green) for the 12 material samples.
For some materials, a large spread of the acquired reflectance spectra can be observed from the boxplots (see Materials #3, #6 and #9). Good fitting with the reference spectra is obtained for four materials (#2, #4, #8, #12). In general terms, the acquired spectra follow the shape of the reference spectra, however differences are clearly visible, especially in the RE and NIR bands. It is also interesting to observe that the materials with high amplitude (#6, #9) exhibit lower amplitude than expected in real data. This type of variability is regularly encountered in aerial multispectral imagery and it is expected that the performance of classification algorithms will evolve jointly with the advancements in sensor development and advanced pre-processing methods for the imagery itself. The use of spectral indices instead of absolute reflectance values partially alleviates the issue of erroneous spectra as long as a good fit is obtained between the reference and actual spectra in terms of spectral shape.
4.3.2. Inter-Class Correlations
The performances of classification algorithms are inherently influenced by the number of spectral bands sampling the electromagnetic spectrum. When the number of spectral bands decreases, the confusion between different classes also increases as distinctive features characterizing one specific class might not be captured. In the following, we analyze the degree of confusion between the nine considered classes in the experiments by measuring the minimum, maximum and mean Pearson correlation factor (C), in absolute values, over all pairs of spectra drawn from two different classes. In other words, for a pair of classes C1-C2, the absolute value of the correlation factor is computed over all possible pairs of spectra containing one spectrum from C1 and one spectrum from C2, and the minimum, maximum and mean values are extracted from the list of computed correlations. Table 4 resumes the computed inter-class correlations.

Table 4.
Inter-class correlations. For each pair, the minimum, maximum and mean Pearson correlations computed over all pairs of spectra drawn from the two classes. The values below the diagonal are greyed out due to the fact that they mirror the values above the diagonal.
Table 4 explains why some classes suffer from high confusion with other classes. For example, the wood class, whose abundance is often over-estimated in the classification maps, has maximum correlation factors of at least 0.999 with all the other classes. However, the mean correlation factor of the wood class with the plastic class is the third lowest among the correlation factors of the former (after the correlation factor with water and painted surface). This indicates that the wood class is more likely to be confused with other classes than with plastic, which is positive for the scope of our experiments as it does not lead to overestimation of plastic areas due to confusion with wood. The water class is the least correlated with the others, which explains the very high accuracy for this class in both testing and validation data. The metrics in Table 4 also confirm the large confusion between grass and tree spectra: these two classes are the only ones in which there exists at least one pair of spectra that are virtually identical in MicaSense multispectral data, resulting in a maximum correlation factor of 1.
4.4. Influence of Spatial Resolution
The training pixels in our experiments have been selected from relatively homogeneous areas in high-resolution images, such that they can be considered pure spectra of the materials of interest. The spatial resolution of the acquired imagery can be different if another sensor (with similar spectral characteristics) is employed or if the flight altitude of the sensor changes during the data acquisition flight. It is thus natural to question the abilities of the designed algorithm when, due to a degradation of the spatial resolution, the target materials jointly occupy mixed pixels.
In order to illustrate the behavior of the classification scheme for variable spatial resolution, the high-resolution imagery has been resampled using bilinear interpolation by binning the observed high-resolution pixels inside spatial windows of , and pixels. This simulates the degradation of the spatial resolution by factors of 10, 30 and 50, respectively. The classification algorithm was then applied to the lower resolution images and the set of obtained raw classification maps for two targets of interest—one plastic litter area and one car—are inspected in Figure 14. In this figure, F denotes the degradation factor applied to the original imagery, R represents the spatial resolution of the respective image measured in centimeters, and for each degradation factor it displays the RGB representation of the area of interest, the true litter map (drawn manually over the original image) and the retrieved classification maps after applying the design classification scheme.
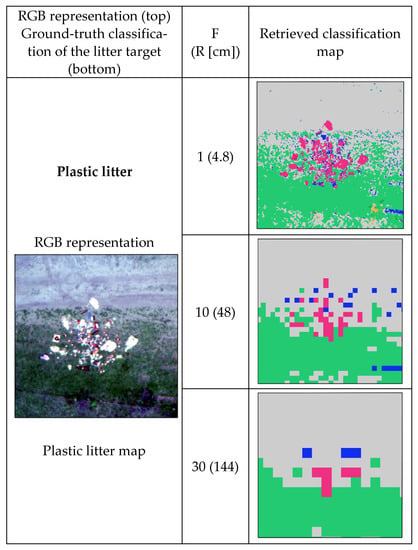
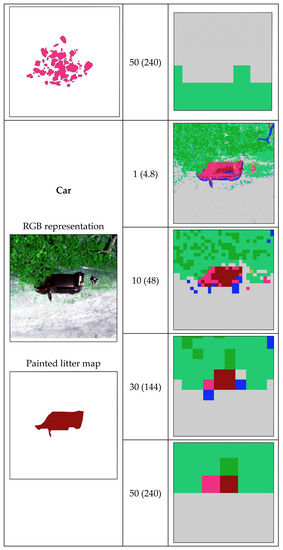
Figure 14.
Illustration of the effects of spatial resolution on the quality of the retrieved classification maps.
Figure 14 shows that the discrimination power between litter and natural materials decreases with the degradation of the spatial resolution, as expected. However, littered areas can still be spotted even if the image is degraded with a degradation factor of F = 30 in both considered cases. For lower spatial resolution, i.e., when F = 50, the car pixels are still marked as littered area, while the plastic area is entirely missed. The difference between the two cases is that the car is a continuous surface while the plastic objects are mixed with wood residuals and are more sparsely distributed over a natural background (soil and grass). When the spatial resolution degrades, more spectral mixing occurs in the area of plastic litter. The issue of mixed pixels can be tackled either by including mixed spectra in the training database during the training stage or by employing other techniques relying on pure pixels, such as sparse spectral unmixing, where the collection of pure spectra act as an external spectral library and the number of materials inside the pixel is minimized by solving a constrained sparse regression problem [55,56]. Note that all the post-processing steps (shadow removal, spatial filtering) also need tuning w.r.t. the employed thresholds when the spatial resolution changes. This results that, while a common classification framework can be followed for different spatial resolutions, the final results strongly depend on fine tuning of the employed parameters at each processing step.
4.5. A Note on Algorithm Transferability to Water Areas
One of the most important questions when referring to litter detection is the ability to spot problematic areas not only on land, but also over water. Water is a material with particular spectral characteristics in the NIR and SWIR spectral regions, i.e., the signals retrieved by a sensor over water pixels are strongly attenuated given that pure water has a very low reflectance in the NIR region and entirely absorbs the incoming radiation at wavelengths larger than 1200 nm. Moreover, litter objects in water areas can be found in different states of exposure: they can float, they can be partially/entirely submerged, and they can be dry or wet depending on their own density and weather conditions. Pixels with distorted spectral shape are also encountered in water datasets due to sun glint, introducing additional challenges despite the fact that they only contain water in nature. In [57], the authors investigated the spectral properties of various virgin and weathered plastic materials in a controlled environment in which various suspended sediment concentrations and material depths have been used. The resulting dataset (https://data.4tu.nl/articles/dataset/Hyperspectral_reflectance_of_marine_plastics_in_the_VIS_to_SWIR/12896312/2, accessed on 15 November 2022) proves a high variability of the observed spectra when these conditions vary. In this subsection, we present a limited experiment intended to investigate if a classifier designed for land areas, which is the case for the classifier described in this work, could be successfully applied to detecting litter over water areas, under these known circumstances.
During the validation campaign (Campaign2), various litter objects have been placed on the streamflow under the bridge where the camera was mounted. The camera has also been moved to cover the water area and various images were acquired. After the data acquisition, all the floating litter objects have been recollected by the VITO field crew by using a net maneuvered from a boat. The collected images were processed according to the methodology described in Section 2. Finally, the designed classifier was applied to these images.
In Figure 15, two RGB representations of images acquired over water are shown jointly with the corresponding retrieved classification maps.
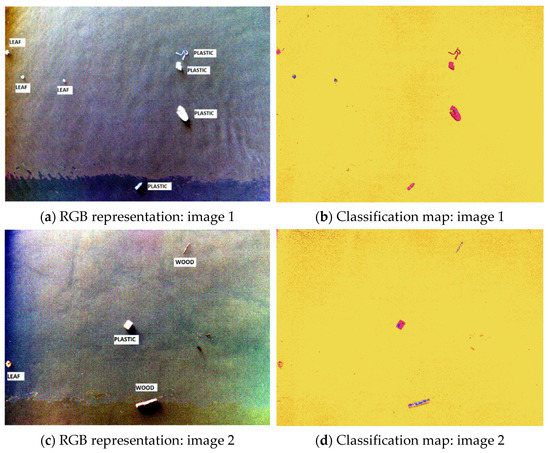
Figure 15.
Examples of classification maps obtained by the designed algorithm over water areas.
In Figure 15, the vast majority of the plastic pixels are correctly classified. The wood pixels are only partially identified correctly. For these pixels, confusions with soil and plastic occur. In image 1, two floating dry leaves are mostly classified as wood which is acceptable given the similarities and taking into account that no dry leaf class has been defined, while one leaf is mostly classified as plastic. The leaf in image 2 is mostly classified as oxidated metal, but some of its pixels are also classified as plastic. The background (water) pixels are generally correctly identified, however the confusion with oxidated metal is the most frequent, resulting in a salt-and-pepper type of noise in the classification maps. The fact that the leaf in image 2 is mostly classified as oxidated metal might be due to the fact that the leaf is partially submerged. Overall, we can observe that all the litter objects are detected in these images and the plastic objects can be inferred with high accuracy, but over-detection of plastic is common and the distinction between different types of litter (wood-soil, wood-plastic etc.) is difficult. This distinction is important as biodegradable litter is less concerning than the non-biodegradable one. The large number of points classified as oxidated metal in the background pixels could be avoided by redefining the litter classes themselves. Cement, soil and oxidated metal are not floating materials, which means that these classes might be obsolete over water areas, depending on the targeted area. We can conclude that algorithms designed for land litter detection can only be used for limited purposes over water (e.g., to detect litter objects), however water and land areas should benefit from separately trained schemes which take into account the specificity of light absorption and reflection for each of them and which account for different target classes in order to maximize the probability of success. Investigations on the differences between the land/water approaches, inference of the most useful spectral bands in the two cases, and estimation of detection limits for future sensors tailored to litter detection are all targeted subjects for our future work.
5. Conclusions
In this paper, machine learning classification algorithms based on Random Forest approaches have been designed to detect litter in aerial images acquired by affordable, off-the-shelf multispectral cameras carried by remotely piloted aircraft systems. It was shown that the main targeted pollutant represented by plastic materials can be spotted with high accuracy—higher than 0.88 in both test and validation data. The distinction between plastic and other litter materials has also been achieved with high accuracy. Among the materials considered as litter, it was shown that wood residuals are more difficult to distinguish due to their very high spectral similarity to the other classes of materials, especially with soil. However, wood is a material that does not pose the same critical threats as plastic to the environment and the human health population. Better discrimination between all considered classes could be achieved by employing spectral cameras with higher spectral resolution and extended spectral range. Nevertheless, our study was designed such that a critical component of operational exploitation of the system was highly valued: the balance between detection accuracy and operational costs.
The classification algorithm has been designed in a two-step approach: first, a large pool of spectral metrics have been used in an intermediate scheme to decide on their importance; second, the most important 30 metrics have been employed in the final classification scheme. As the classifier was not trained for shadowed areas, in which spectral distortions are common due to the limited amount of radiation hitting the surface, post-processing methods have been explored to improve the quality of the retrieved classification maps. Straightforward quantification and visualization approaches intended to ease the exploitation of the maps by interested users have also been presented.
An important part of this paper has been devoted to understanding the factors that cause classification errors. Based on ground reference targets scanned with a field spectrometer, it was shown that data errors are common in multispectral imagery, thus the use of spectral indices is highly recommended as they mitigate limitations related to spectral amplitude errors and better embed useful information related to the spectral shape of the input signatures. The high inter-class correlations encountered in multispectral data, inherently induced by the relatively low number of spectral bands, are also sources of class confusions. In an experiment considering the spatial resolution of the input imagery, we have shown that the detection of areas polluted with plastic is not only dependent on the spectral-spatial responses of the scanned pixels, but also on the spatial distribution of the contained materials. In other words, mixed pixels containing litter in images with low spatial resolution call for adaptations of the training data or for exploring methods that analyze sub-pixel compositions, such as spectral unmixing. Finally, it was shown that classification schemes trained with land pixels are not directly transferable to water areas due to the particularities of water pixels, e.g., the low signal in the NIR/SWIR spectral regions. When applied to images containing floating objects, the designed classifier was able to spot non-water areas, however the classification inside these areas suffered from more confusions than over land. This implies that classification schemes should be designed separately for land and water targets such that the employed metrics are tailored to the specific case. The considered classes should also be adapted. For instance, materials that do not naturally float (soil, oxidated metal, cement) are less concerning when monitoring water areas. All the above insights will be further exploited in our future research work, jointly with adaptations of the proposed framework to account for an extended set of classes and to ensure transferability to images acquired in different geographic areas and under different environmental conditions.
Author Contributions
Conceptualization, M.-D.I. and E.K.; methodology, M.-D.I. and E.K.; software, M.-D.I.; validation, M.-D.I.; formal analysis, M.-D.I.; investigation, M.-D.I.; resources, E.K., L.D.K., R.M. and M.-D.I.; data curation, R.M., L.D.K. and M.-D.I.; writing—original draft preparation, M.-D.I.; writing—review and editing, M.-D.I., E.K., L.D.K., R.M., M.M., P.C. and L.L.; visualization, M.-D.I.; supervision, E.K. and L.D.K.; project administration, E.K., M.M. and L.D.K.; funding acquisition, E.K. and M.M. All authors have read and agreed to the published version of the manuscript.
Funding
This research was funded by the Discovery Element of the European Space Agency’s Basic Activities, Contract No. 4000132211/20/NL/GLC (AIDMAP project) and de Blauwe Cluster (DBC), Contract No. HBC.2019.2904 (PLUXIN project).
Acknowledgments
The authors would like to express their gratitude to Gert Strackx (certified RPAS pilot, VITO) for his availability and dedication.
Conflicts of Interest
The authors declare no conflict of interest. The funders had no role in the design of the study; in the collection, analyses, or interpretation of data; in the writing of the manuscript, or in the decision to publish the results.
Appendix A. Full Set of Spectral Indices
In Table A1, the full set of 111 spectral metrics used in the first training step are listed. For each metric, the name, acronym, formula and reference works are indicated. The 30 indices selected for the final classifier are highlighted in bold letters. For compact representation, indices that are similar in terms of mathematical formula are grouped together and their formulas are represented as a generic expression. Customized indices, i.e., the ones built specifically for this work without being found in the literature, are marked by the letter “C” in the column storing reference works.

Table A1.
Full list of spectral indices. The 30 indices marked in bold letters are the ones used by the final classifier.
Table A1.
Full list of spectral indices. The 30 indices marked in bold letters are the ones used by the final classifier.
| Index Number | Index Name | Index Acronym | Index Formula | Reference Works |
|---|---|---|---|---|
| 1–5 | MicaSense blue/green/red/red-edge/NIR band reflectance | B, G, R, RE, NIR | - | - |
| 6 | Adjusted transformed soil-adjusted vegetation index | ATSAVI | [58] | |
| 7 | Anthocyanin reflectance index | ARI | [59] | |
| 8 | Ashburn vegetation index | AVI | [60] | |
| 9 | Atmospherically resistant vegetation index | ARVI | [61] | |
| 10 | Atmospherically resistant vegetation index 2 | ARVI2 | [62] | |
| 11 | Blue-wide dynamic range vegetation index | BWDRVI | [63] | |
| 12 | Browning reflectance index | BRI | [64] | |
| 13 | Canopy chlorophyll content index | CCCI | [65] | |
| 14 | Chlorophyll absorption ratio index 2 | CARI2 | , where | [66] |
| 15 | Chlorophyll index green | CIgreen | [67] | |
| 16 | Chlorophyll index red-edge | CIrededge | [67] | |
| 17 | Chlorophyll vegetation index | CVI | [68] | |
| 18 | Coloration index | CI | [69] | |
| 19 | Normalized difference vegetation index | NDVI | [61] | |
| 20 | Corrected transformed vegetation index | CTVI | [70] | |
| 21 | Datt1 | Datt1 | [71] | |
| 22 | Datt4 | Datt4 | [71] | |
| 23 | Datt6 | Datt6 | [71] | |
| 24 | Differenced vegetation index MSS | DVIMSS | [72] | |
| 25 | Enhanced vegetation index | EVI | [68] | |
| 26 | Enhanced vegetation index 2 | EVI2 | [73] | |
| 27 | Enhanced vegetation index 2 -2 | EVI22 | [74] | |
| 28 | EPI | EPI | [75] | |
| 29 | Global environment monitoring index | GEMI | [76] | |
| 30 | Green leaf index | GLI | [68] | |
| 31 | Green normalized difference vegetation index | GNDVI | [75] | |
| 32 | Green optimized soil adjusted vegetation index | GOSAVI | [76] | |
| 33 | Green soil adjusted vegetation index | GSAVI | [76] | |
| 34 | Green-blue NDVI | GBNDVI | [77] | |
| 35 | Green-red NDVI | GRNDVI | [77] | |
| 36 | Hue | H | [78] | |
| 37 | Infrared percentage vegetation index | IPVI | [79] | |
| 38 | Intensity | I | [69] | |
| 30 | Inverse reflectance 550 | IR550 | [59] | |
| 40 | Inverse reflectance 717 | IR717 | C [59] | |
| 41 | Leaf Chlorophyll index | LCI | [71] | |
| 42 | Modified chlorophyll absorption in reflectance index | MCARI | [68] | |
| 43 | Misra green vegetation index | MGVI | [80] | |
| 44 | Misra non such index | MNSI | [80] | |
| 45 | Misra soil brightness index | MSBI | [80] | |
| 46 | Misra yellow vegetation index | MYVI | [80] | |
| 47 | Modified anthocyanin reflectance index | mARI | [81] | |
| 48 | Modified chlorophyll absorption in reflectance index 1 | MCARI1 | [82] | |
| 49 | Modified simple ratio NIR/red | MSRNIR_R | [83] | |
| 50 | Modified soil adjusted vegetation index | MSAVI | [82] | |
| 51 | Modified triangular vegetation index 1 | MTVI1 | [82] | |
| 52–54 | Normalized: Green, Red, NIR reflectance | NormT | C | |
| 55–60 | Normalized difference: Green-Red, NIR-B, NIR-Red, NIR-RE, R-G, RE-R | NT1T2DI | C [69] [75] | |
| 61 | Optimized soil adjusted vegetation index | OSAVI | [82] | |
| 62 | Pan NDVI | PNDVI | [77] | |
| 63 | Plant senescence reflectance index | PSRI | [84] | |
| 64 | RDVI | RDVI | [82] | |
| 65 | Red edge 2 | Rededge2 | [85] | |
| 66 | Red-blue NDVI | RBNDVI | [77] | |
| 67 | Saturation | S | [86] | |
| 68 | Shape index | IF | [69] | |
| 69 | Soil adjusted vegetation index | SAVI | [87] | |
| 70 | Soil and atmospherically resistant vegetation index 2 | SARVI2 | [88] | |
| 71 | Soil and atmospherically resistant vegetation index 3 | SARVI3 | [88] | |
| 72 | Spectral polygon vegetation index | SPVI | [89] | |
| 73 | Tasseled Cap—Green vegetation index MSS | GVIMSS | [90] | |
| 74 | Tasseled Cap—Non such index MSS | NSIMSS | [90] | |
| 75 | Tasseled Cap—Soil brightness index MSS | SBIMSS | [90] | |
| 76 | Tasseled Cap—Yellow vegetation index MSS | YVIMSS | [90] | |
| 77 | Ratio MCARI/OSAVI | MCARI_OSAVI | [90] | |
| 78 | Transformed chlorophyll absorption ratio | TCARI | [89] | |
| 79 | Triangular chlorophyll index | TCI | [68] | |
| 80 | Triangular vegetation index | TVI | [89] | |
| 81 | Wide dynamic range vegetation index | WDRVI | [83] | |
| 82 | Structure intensive pigment index | SIPI | [89] | |
| 83–92 | Ratio: B/G, B/R, B/RE, B/NIR, G/R, G/RE, G/NIR, R/RE, R/NIR, RE/NIR | rT1T2 | C | |
| 93–101 | Normalized ratio: B-G, B-R, B-RE, B-NIR, G-R, G-RE, G-NIR, R-NIR, RE-NIR | nT1T2 | C [91] [92] | |
| 102–111 | Difference: B-G, B-R, B-RE, B-NIR, G-R, G-RE, G-NIR, R-RE, R-NIR, RE-NIR | dT1T2 | C |
References
- Kaza, S.; Yao, L.; Bhada-Tata, P.; Van Woerden, F. What a Waste 2.0: A Global Snapshot of Solid Waste Management to 2050; Urban Development Series; World Bank: Washington, DC, USA, 2018. [Google Scholar] [CrossRef]
- DiGregorio, B.E. Biobased Performance Bioplastic: Mirel. Chem. Biol. 2009, 16, 1–2. [Google Scholar] [CrossRef]
- Yee, M.S.-L.; Hii, L.-W.; Looi, C.K.; Lim, W.-M.; Wong, S.-F.; Kok, Y.-Y.; Tan, B.-K.; Wong, C.-Y.; Leong, C.-O. Impact of Microplastics and Nanoplastics on Human Health. Nanomaterials 2021, 11, 496. [Google Scholar] [CrossRef]
- Martínez-Ibarra, A.; Martínez-Razo, L.D.; MacDonald-Ramos, K.; Morales-Pacheco, M.; Vázquez-Martínez, E.R.; López-López, M.; Rodríguez Dorantes, M.; Cerbón, M. Multisystemic alterations in humans induced by bisphenol A and phthalates: Experimental, epidemiological and clinical studies reveal the need to change health policies. Environ. Pollut. 2021, 271, 116380. [Google Scholar] [CrossRef]
- Jambeck, J.R.; Geyer, R.; Wilcox, C.; Siegler, T.R.; Perryman, M.; Andrady, A.; Narayan, R.; Law, K.L. Plastic waste inputs from land into the ocean. Science 2015, 347, 768–771. [Google Scholar] [CrossRef]
- Bessa, F.; Ratcliffe, N.; Otero, V.; Sobral, P.; Marques, J.C.; Waluda, C.M.; Trathan, P.N.; Xavier, J.C. Microplastics in gentoo penguins from the Antarctic region. Sci. Rep. 2019, 9, 14191. [Google Scholar] [CrossRef]
- Jamieson, A.J.; Brooks, L.S.R.; Reid, W.D.K.; Piertney, S.B.; Narayanaswamy, B.E.; Linley, T.D. Microplastics and synthetic particles ingested by deep-sea amphipods in six of the deepest marine ecosystems on Earth. R. Soc. Open Sci. 2019, 6, 180667. [Google Scholar] [CrossRef]
- Napper, I.E.; Davies, B.F.R.; Clifford, H.; Elvin, S.; Koldewey, H.J.; Mayewski, P.A.; Miner, K.R.; Potocki, M.; Elmore, A.C.; Gajurel, A.P.; et al. Reaching new heights in plastic pollution—Preliminary findings of microplastics on Mount Everest. One Earth 2020, 3, 621–630. [Google Scholar] [CrossRef]
- Wilcox, C.; Puckridge, M.; Schuyler, Q.A.; Townsend, K.; Hardesty, B.D. A quantitative analysis linking sea turtle mortality and plastic debris ingestion. Sci. Rep. 2018, 8, 12536. [Google Scholar] [CrossRef]
- Thiel, M.; Luna-Jorquera, G.; Ãlvarez-Varas, R.; Gallardo, C.; Hinojosa, I.A.; Luna, N.; Miranda-Urbina, D.; Morales, N.; Ory, N.; Pacheco, A.S.; et al. Impacts of Marine Plastic Pollution From Continental Coasts to Subtropical Gyres-Fish, Seabirds, and Other Vertebrates in the SE Pacific. Front. Mar. Sci. 2018, 5, 238. [Google Scholar] [CrossRef]
- Mbugani, J.J.; Machiwa, J.F.; Shilla, D.A.; Kimaro, W.; Joseph, D.; Khan, F.R. Histomorphological Damage in the Small Intestine of Wami Tilapia (Oreochromis urolepis) (Norman, 1922) Exposed to Microplastics Remain Long after Depuration. Microplastics 2022, 1, 240–253. [Google Scholar] [CrossRef]
- Ryan, P.G. Entanglement of birds in plastics and other synthetic materials. Mar. Pollut. Bull. 2018, 135, 159–164. [Google Scholar] [CrossRef]
- Blettler, M.C.M.; Mitchell, C. Dangerous traps: Macroplastic encounters affecting freshwater and terrestrial wildlife. Sci. Total Environ. 2021, 798, 149317. [Google Scholar] [CrossRef]
- Mederake, L.; Knoblauch, D. Shaping EU Plastic Policies: The Role of Public Health vs. Environmental Arguments. Int. J. Environ. Res. Public Health 2019, 16, 3928. [Google Scholar] [CrossRef]
- Prata, J.C.; Silva, A.L.P.; da Costa, J.P.; Mouneyrac, C.; Walker, T.R.; Duarte, A.C.; Rocha-Santos, T. Solutions and Integrated Strategies for the Control and Mitigation of Plastic and Microplastic Pollution. Int. J. Environ. Res. Public Health 2019, 16, 2411. [Google Scholar] [CrossRef]
- Kumar, R.; Verma, A.; Shome, A.; Sinha, R.; Sinha, S.; Jha, P.K.; Kumar, R.; Kumar, P.; Shubham; Das, S.; et al. Impacts of Plastic Pollution on Ecosystem Services, Sustainable Development Goals, and Need to Focus on Circular Economy and Policy Interventions. Sustainability 2021, 13, 9963. [Google Scholar] [CrossRef]
- Alhazmi, H.; Almansour, F.H.; Aldhafeeri, Z. Plastic Waste Management: A Review of Existing Life Cycle Assessment Studies. Sustainability 2021, 13, 5340. [Google Scholar] [CrossRef]
- Onyena, A.P.; Aniche, D.C.; Ogbolu, B.O.; Rakib, M.R.J.; Uddin, J.; Walker, T.R. Governance Strategies for Mitigating Microplastic Pollution in the Marine Environment: A Review. Microplastics 2022, 1, 15–46. [Google Scholar] [CrossRef]
- Bennett, E.M.; Alexandridis, P. Informing the Public and Educating Students on Plastic Recycling. Recycling 2021, 6, 69. [Google Scholar] [CrossRef]
- Diggle, A.; Walker, T.R. Environmental and Economic Impacts of Mismanaged Plastics and Measures for Mitigation. Environments 2022, 9, 15. [Google Scholar] [CrossRef]
- Herberz, T.; Barlow, C.Y.; Finkbeiner, M. Sustainability Assessment of a Single-Use Plastics Ban. Sustainability 2020, 12, 3746. [Google Scholar] [CrossRef]
- Hidaka, M.; Matsuoka, D.; Sugiyama, D.; Murakami, K.; Kako, S. Pixel-level image classification for detecting beach litter using a deep learning approach. Mar. Pollut. Bull. 2022, 175, 113371. [Google Scholar] [CrossRef]
- Martin, C.; Parkes, S.; Zhang, Q.; Zhang, X.; McCabe, M.F.; Duarte, C.M. Use of unmanned aerial vehicles for efficient beach litter monitoring. Mar. Pollut. Bull. 2020, 131, 662–673. [Google Scholar] [CrossRef]
- Fallati, L.; Polidori, A.; Salvatore, C.; Saponari, L.; Savini, A.; Galli, P. Anthropogenic marine debris assessment with unmanned aerial vehicle imagery and deep learning: A case study along the beaches of the Republic of Maldives. Sci. Total Environ. 2019, 693, 133581. [Google Scholar] [CrossRef]
- Gonçalves, G.; Andriolo, U. Operational use of multispectral images for macro-litter mapping and categorization by Unmanned Aerial Vehicle. Mar. Pollut. Bull. 2022, 176, 113431. [Google Scholar] [CrossRef]
- Kako, S.; Morita, S.; Taneda, T. Estimation of plastic marine debris volumes on beaches using unmanned aerial vehicles and image processing based on deep learning. Mar. Pollut. Bull. 2020, 155, 111127. [Google Scholar] [CrossRef]
- Andriolo, U.; Gonçalves, G.; Bessa, F.; Sobral, P. Mapping marine litter on coastal dunes with unmanned aerial systems: A showcase on the Atlantic Coast. Sci. Total Environ. 2020, 736, 139632. [Google Scholar] [CrossRef]
- Gonçalves, G.; Andriolo, U.; Pinto, L.; Bessa, F. Mapping marine litter using UAS on a beach-dune system: A multidisciplinary approach. Sci. Total Environ. 2020, 706, 135742. [Google Scholar] [CrossRef]
- Andriolo, U.; Gonçalves, G.; Sobral, P.; Fontán-Bouzas, A.; Bessa, F. Beach-dune morphodynamics and marine macro-litter abundance: An integrated approach with Unmanned Aerial System. Sci. Total Environ. 2020, 749, 141474. [Google Scholar] [CrossRef]
- Gonçalves, G.; Andriolo, U.; Gonçalves, L.; Sobral, P.; Bessa, F. Quantifying Marine Macro Litter Abundance on a Sandy Beach Using Unmanned Aerial Systems and Object-Oriented Machine Learning Methods. Remote Sens. 2020, 12, 2599. [Google Scholar] [CrossRef]
- Jiménez-Lao, R.; Aguilar, F.J.; Nemmaoui, A.; Aguilar, M.A. Remote Sensing of Agricultural Greenhouses and Plastic-Mulched Farmland: An Analysis of Worldwide Research. Remote Sens. 2020, 12, 2649. [Google Scholar] [CrossRef]
- Feng, Q.; Niu, B.; Chen, B.; Ren, Y.; Zhu, D.; Yang, J.; Liu, J.; Ou, C.; Li, B. Mapping of plastic greenhouses and mulching films from very high resolution remote sensing imagery based on a dilated and non-local convolutional neural network. Int. J. Appl. Earth Obs. Geoinf. 2021, 102, 102441. [Google Scholar] [CrossRef]
- Shi, L.; Huang, X.; Zhong, T.; Taubenböck, H. Mapping Plastic Greenhouses Using Spectral Metrics Derived From GaoFen-2 Satellite Data. IEEE J. Sel. Top. Appl. Earth Obs. Remote Sens. 2020, 13, 49–59. [Google Scholar] [CrossRef]
- Balázs, J.; van Leeuwen, B.; Tobak, Z. Detection of Plastic Greenhouses Using High Resolution Rgb Remote Sensing Data and Convolutional Neural Network. J. Environ. Geogr. 2021, 14, 28–46. [Google Scholar] [CrossRef]
- Sun, H.; Wang, L.; Lin, R.; Zhang, Z.; Zhang, B. Mapping Plastic Greenhouses with Two-Temporal Sentinel-2 Images and 1D-CNN Deep Learning. Remote Sens. 2021, 13, 2820. [Google Scholar] [CrossRef]
- Aguilar, M.Á.; Jiménez-Lao, R.; Nemmaoui, A.; Aguilar, F.J.; Koc-San, D.; Tarantino, E.; Chourak, M. Evaluation of the Consistency of Simultaneously Acquired Sentinel-2 and Landsat 8 Imagery on Plastic Covered Greenhouses. Remote Sens. 2020, 12, 2015. [Google Scholar] [CrossRef]
- European Space Agency. The Discovery Campaign on Remote Sensing of Plastic Marine Litter. Available online: https://www.esa.int/Enabling_Support/Preparing_for_the_Future/Discovery_and_Preparation/The_Discovery_Campaign_on_Remote_Sensing_of_Plastic_Marine_Litter (accessed on 10 June 2022).
- Martínez-Vicente, V.; Clark, J.R.; Corradi, P.; Aliani, S.; Arias, M.; Bochow, M.; Bonnery, G.; Cole, M.; Cózar, A.; Donnelly, R.; et al. Measuring Marine Plastic Debris from Space: Initial Assessment of Observation Requirements. Remote Sens. 2019, 11, 2443. [Google Scholar] [CrossRef]
- Maximenko, N.; Corradi, P.; Law Kara, L.; Van Sebille, E.; Garaba, S.P.; Lampitt, R.S.; Galgani, F.; Martinez-Vicente, V.; Goddijn-Murphy, L.; Veiga, J.M.; et al. Toward the Integrated Marine Debris Observing System. Front. Mar. Sci. 2019, 6, 447. [Google Scholar] [CrossRef]
- Basu, B.; Sannigrahi, S.; Sarkar Basu, A.; Pilla, F. Development of Novel Classification Algorithms for Detection of Floating Plastic Debris in Coastal Waterbodies Using Multispectral Sentinel-2 Remote Sensing Imagery. Remote Sens. 2021, 13, 1598. [Google Scholar] [CrossRef]
- Themistocleous, K. Monitoring aquaculture fisheries using Sentinel-2 images by identifying plastic fishery rings. Earth Resour. Environ. Remote Sens. 2021, 118630, 248–254. [Google Scholar] [CrossRef]
- Maneja, R.H.; Thomas, R.; Miller, J.D.; Li, W.; El-Askary, H.; Flandez, A.V.B.; Alcaria, J.F.A.; Gopalan, J.; Jukhdar, A.; Basali, A.U.; et al. Marine Litter Survey at the Major Sea Turtle Nesting Islands in the Arabian Gulf Using In-Situ and Remote Sensing Methods. In Proceedings of the 2021 IEEE International Geoscience and Remote Sensing Symposium IGARSS, Brussels, Belgium, 11–16 July 2021; IEEE: Piscataway, NJ, USA, 2021; pp. 8582–8585. [Google Scholar] [CrossRef]
- Topouzelis, K.; Papageorgiou, D.; Suaria, G.; Aliani, S. Floating marine litter detection algorithms and techniques using optical remote sensing data: A review. Mar. Pollut. Bull. 2021, 170, 112675. [Google Scholar] [CrossRef]
- Arias, M.; Sumerot, R.; Delaney, J.; Coulibaly, F.; Cozar, A.; Aliani, S.; Suaria, G.; Papadopoulou, T.; Corradi, P. Advances on remote sensing of windrows as proxies for maline litter based on Sentinel-2/MSI datasets. In Proceedings of the 2021 IEEE International Geoscience and Remote Sensing Symposium IGARSS, Brussels, Belgium, 11–16 July 2021; IEEE: Piscataway, NJ, USA, 2021; pp. 1126–1129. [Google Scholar] [CrossRef]
- Biermann, L.; Clewley, D.; Martinez-Vicente, V.; Topouzelis, K. Finding Plastic Patches in Coastal Waters using Optical Satellite Data. Sci. Rep. 2020, 10, 5364. [Google Scholar] [CrossRef] [PubMed]
- Tasseron, P.; van Emmerik, T.; Peller, J.; Schreyers, L.; Biermann, L. Advancing Floating Macroplastic Detection from Space Using Experimental Hyperspectral Imagery. Remote Sens. 2021, 13, 2335. [Google Scholar] [CrossRef]
- Ciappa, A.C. Marine plastic litter detection offshore Hawai’i by Sentinel-2. Mar. Pollut. Bull. 2021, 168, 112457. [Google Scholar] [CrossRef] [PubMed]
- Hu, C. Remote detection of marine debris using satellite observations in the visible and near infrared spectral range: Challenges and potentials. Remote Sens. Environ. 2021, 259, 112414. [Google Scholar] [CrossRef]
- Topouzelis, K.; Papageorgiou, D.; Karagaitanakis, A.; Papakonstantinou, A.; Arias Ballesteros, M. Remote Sensing of Sea Surface Artificial Floating Plastic Targets with Sentinel-2 and Unmanned Aerial Systems (Plastic Litter Project 2019). Remote Sens. 2020, 12, 2013. [Google Scholar] [CrossRef]
- Themistocleous, K.; Papoutsa, C.; Michaelides, S.; Hadjimitsis, D. Investigating Detection of Floating Plastic Litter from Space Using Sentinel-2 Imagery. Remote Sens. 2020, 12, 2648. [Google Scholar] [CrossRef]
- Lu, L.; Tao, Y.; Di, L. Object-Based Plastic-Mulched Landcover Extraction Using Integrated Sentinel-1 and Sentinel-2 Data. Remote Sens. 2018, 10, 1820. [Google Scholar] [CrossRef]
- Breiman, L. Random Forests. Mach. Learn. 2001, 45, 5–32. [Google Scholar] [CrossRef]
- Pedregosa, F.; Varoquaux, G.; Gramfort, A.; Michel, V.; Thirion, B.; Grisel, O.; Blondel, M.; Prettenhofer, P.; Weiss, R.; Dubourg, V.; et al. Scikit-learn: Machine Learning in Python. J. Mach. Learn. Res. 2011, 12, 2825–2830. [Google Scholar] [CrossRef]
- Scikit-Learn Documentation. Available online: https://scikit-learn.org/stable/modules/ensemble.html#random-forest-parameters (accessed on 16 June 2022).
- Iordache, M.-D.; Bioucas-Dias, J.M.; Plaza, A. Sparse Unmixing of Hyperspectral Data. IEEE Trans. Geosci. Remote Sens. 2011, 49, 2014–2039. [Google Scholar] [CrossRef]
- Iordache, M.-D. A Sparse Regression Approach to Hyperspectral Unmixing. Ph.D. Thesis, Instituto Superior Técnico, Lisboa, Portugal, 2011. [Google Scholar]
- Knaeps, E.; Sterckx, S.; Strackx, G.; Mijnendonckx, J.; Moshtaghi, M.; Garaba, S.P.; Meire, D. Hyperspectral-reflectance dataset of dry, wet and submerged marine litter. Earth Syst. Sci. Data 2021, 13, 713–730. [Google Scholar] [CrossRef]
- He, Y.; Guo, X.; Wilmshurst, J. Comparison of different methods for measuring leaf area index in a mixed grassland. Can. J. Plant Sci. 2007, 87, 803–813. [Google Scholar] [CrossRef]
- Gitelson, A.A.; Merzlyak, M.N.; Zur, Y.; Stark, R.; Gritz, U. Non-destructive and remote sensing techniques for estimation of vegetation status. In Proceedings of the Third European Conference on Precision Agriculture, Montpellier, France, 18–20 June 2001; Volume 1, pp. 301–306. [Google Scholar]
- Ashburn, P.M. The vegetative index number and crop identification. In Proceedings of the Technical Session, Houston, TX, USA, 29 March 1985; pp. 843–856. [Google Scholar]
- Gitelson, A.; Kaufman, Y.J.; Stark, R.; Rundquist, D. Novel algorithms for remote estimation of vegetation fraction. Remote Sens. Environ. 2002, 80, 76–87. [Google Scholar] [CrossRef]
- Kaufman, Y.J.; Tanre, D. Atmospherically resistant vegetation index (ARVI) for EOS-MODIS. IEEE Trans. Geosci. Remote Sens. 1992, 30, 261–270. [Google Scholar] [CrossRef]
- Hancock, D.W.; Dougherty, C.T. Relationships between Blue- and Red-based Vegetation Indices and Leaf Area and Yield of Alfalfa. Crop Sci. 2007, 47, 2547–2556. [Google Scholar] [CrossRef]
- Merzlyak, M.N.; Gitelson, A.A.; Chivkunova, O.B.; Solovchenko, A.E.; Pogosyan, S.I. Application of Reflectance Spectroscopy for Analysis of Higher Plant Pigments. Russ. J. Plant Physiol. 2003, 50, 704–710. [Google Scholar] [CrossRef]
- El-Shikha, D.M.; Barnes, E.M.; Clarke, T.R.; Hunsaker, D.J.; Haberland, J.A.; Pinter Jr, P.J.; Waller, P.M.; Thompson, T.L. Remote sensing of cotton nitrogen status using the Canopy Chlorophyll Content Index (CCCI). Trans. ASABE 2008, 51, 73–82. [Google Scholar] [CrossRef]
- Kim, M.S. The Use of Narrow Spectral Bands for Improving Remote Sensing Estimation of Fractionally Absorbed Photosynthetically Active Radiation. Master’s Thesis, University of Maryland, College Park, MD, USA, 1994. [Google Scholar]
- Gitelson, A.A.; Viña, A.; Arkebauer, T.J.; Rundquist, D.C.; Keydan, G.; Leavitt, B. Remote estimation of leaf area index and green leaf biomass in maize canopies. Geophys. Res. Lett. 2003, 30, 1248. [Google Scholar] [CrossRef]
- Hunt, E.R.; Daughtry, C.S.T.; Eitel, J.U.H.; Long, D.S. Remote Sensing Leaf Chlorophyll Content Using a Visible Band Index. Agron. J. 2011, 103, 1090–1099. [Google Scholar] [CrossRef]
- Escadafal, R.; Belghit, A.; Ben-Moussa, A. Indices spectraux pour la télédétection de la dégradation des milieux naturels en Tunisie aride. In Proceedings of the Actes du 6eme Symposium International sur les Mesures Physiques et Signatures en Télédétection, Val d’Isère, France, 17–24 January 1994; ISPRS: Sophia Antipolis, France, 1994; pp. 253–259. Available online: https://goobi.tib.eu/viewer/image/830289488/8/ (accessed on 16 June 2022). (In French).
- Perry, C.R.; Lautenschlager, L.F. Functional equivalence of spectral vegetation indices. Remote Sens. Environ. 1984, 14, 169–182. [Google Scholar] [CrossRef]
- Datt, B. Remote Sensing of Water Content in Eucalyptus Leaves. Aust. J. Bot. 1999, 47, 909–923. [Google Scholar] [CrossRef]
- Richardson, A.J.; Wiegand, C.L. Distinguishing Vegetation from Soil Background Information. Photogramm. Eng. Remote Sens. 1977, 43, 1541–1552. [Google Scholar]
- Miura, T.; Yoshioka, H.; Fujiwara, K.; Yamamoto, H. Inter-Comparison of ASTER and MODIS Surface Reflectance and Vegetation Index Products for Synergistic Applications to Natural Resource Monitoring. Sensors 2008, 8, 2480–2499. [Google Scholar] [CrossRef] [PubMed]
- Jiang, Z.; Huete, A.R.; Didan, K.; Miura, T. Development of a two-band enhanced vegetation index without a blue band. Remote Sens. Environ. 2008, 112, 3833–3845. [Google Scholar] [CrossRef]
- Datt, B. Remote Sensing of Chlorophyll a, Chlorophyll b, Chlorophyll a+b, and Total Carotenoid Content in Eucalyptus Leaves. Remote Sens. Environ. 1998, 66, 111–121. [Google Scholar] [CrossRef]
- Huete, A.; Justice, C.; Liu, H. Development of vegetation and soil indices for MODIS-EOS. Remote Sens. Environ. 1994, 49, 224–234. [Google Scholar] [CrossRef]
- Wang, F.M.; Huang, J.F.; Tang, Y.L.; Wang, X.Z. New Vegetation Index and Its Application in Estimating Leaf Area Index of Rice. Rice Sci. 2007, 14, 195–203. [Google Scholar] [CrossRef]
- Glenn, E.P.; Huete, A.R.; Nagler, P.L.; Nelson, S.G. Relationship Between Remotely-sensed Vegetation Indices, Canopy Attributes and Plant Physiological Processes: What Vegetation Indices Can and Cannot Tell Us About the Landscape. Sensors 2008, 8, 2136–2160. [Google Scholar] [CrossRef] [PubMed]
- Kooistra, L.; Leuven, R.S.E.W.; Wehrens, R.; Nienhuis, P.H.; Buydens, L.M.C. A comparison of methods to relate grass reflectance to soil metal contamination. Int. J. Remote Sens. 2003, 24, 4995–5010. [Google Scholar] [CrossRef]
- Misra, P.N.; Wheeler, S.G.; Oliver, R.E. Kauth-Thomas brightness and greenness axes. Contract NASA 1977, 9-14350, 23–46. [Google Scholar]
- Gitelson, A.A.; Keydan, G.P.; Merzlyak, M.N. Three-band model for noninvasive estimation of chlorophyll, carotenoids, and anthocyanin contents in higher plant leaves. Geophys. Res. Lett. 2006, 33, L11402. [Google Scholar] [CrossRef]
- Haboudane, D.; Miller, J.R.; Pattey, E.; Zarco-Tejada, P.J.; Strachan, I.B. Hyperspectral vegetation indices and novel algorithms for predicting green LAI of crop canopies: Modeling and validation in the context of precision agriculture. Remote Sens. Environ. 2004, 90, 337–352. [Google Scholar] [CrossRef]
- Gitelson, A.A. Wide Dynamic Range Vegetation Index for remote quantification of biophysical characteristics of vegetation. J. Plant Physiol. 2004, 161, 165–173. [Google Scholar] [CrossRef] [PubMed]
- Merzlyak, M.N.; Gitelson, A.A.; Chivkunova, O.B.; Rakitin, V.Y. Non-destructive optical detection of pigment changes during leaf senescence and fruit ripening. Physiol. Plant. 1999, 106, 135–141. [Google Scholar] [CrossRef]
- Cloutis, E.A.; Connery, D.R.; Major, D.J.; Dover, F.J. Airborne multi-spectral monitoring of agricultural crop status: Effect of time of year, crop type and crop condition parameter. Int. J. Remote Sens. 1996, 17, 2579–2601. [Google Scholar] [CrossRef]
- Duveiller, G.; Weiss, M.; Baret, F.; Defourny, P. Retrieving wheat Green Area Index during the growing season from optical time series measurements based on neural network radiative transfer inversion. Remote Sens. Environ. 2011, 115, 887–896. [Google Scholar] [CrossRef]
- Huete, A.R. A soil-adjusted vegetation index (SAVI). Remote Sens. Environ. 1988, 25, 295–309. [Google Scholar] [CrossRef]
- Huete, A.R.; Liu, H.Q.; Batchily, K.; van Leeuwen, W. A comparison of vegetation indices over a global set of TM images for EOS-MODIS. Remote Sens. Environ. 1997, 59, 440–451. [Google Scholar] [CrossRef]
- Main, R.; Cho, M.A.; Mathieu, R.; O’Kennedy, M.M.; Ramoelo, A.; Koch, S. An investigation into robust spectral indices for leaf chlorophyll estimation. ISPRS J. Photogramm. Remote Sens. 2011, 66, 751–761. [Google Scholar] [CrossRef]
- Kauth, R.J.; Thomas, G.S. The Tasselled Cap—A Graphic Description of the Spectral-Temporal Development of Agricultural Crops as Seen by LANDSAT. LARS Symp. 1976, 159, 41–51. [Google Scholar]
- Rondeaux, G.; Steven, M.; Baret, F. Optimization of soil-adjusted vegetation indices. Remote Sens. Environ. 1996, 55, 95–107. [Google Scholar] [CrossRef]
- Gao, B. NDWI—A normalized difference water index for remote sensing of vegetation liquid water from space. Remote Sens. Environ. 1996, 58, 257–266. [Google Scholar] [CrossRef]
Publisher’s Note: MDPI stays neutral with regard to jurisdictional claims in published maps and institutional affiliations. |
© 2022 by the authors. Licensee MDPI, Basel, Switzerland. This article is an open access article distributed under the terms and conditions of the Creative Commons Attribution (CC BY) license (https://creativecommons.org/licenses/by/4.0/).