


Characterizing Spatiotemporal Patterns of Land Subsidence after the South-to-North Water Diversion Project Based on Sentinel-1 InSAR Observations in the Eastern Beijing Plain


Abstract
1. Introduction
2. Study Area and Dataset
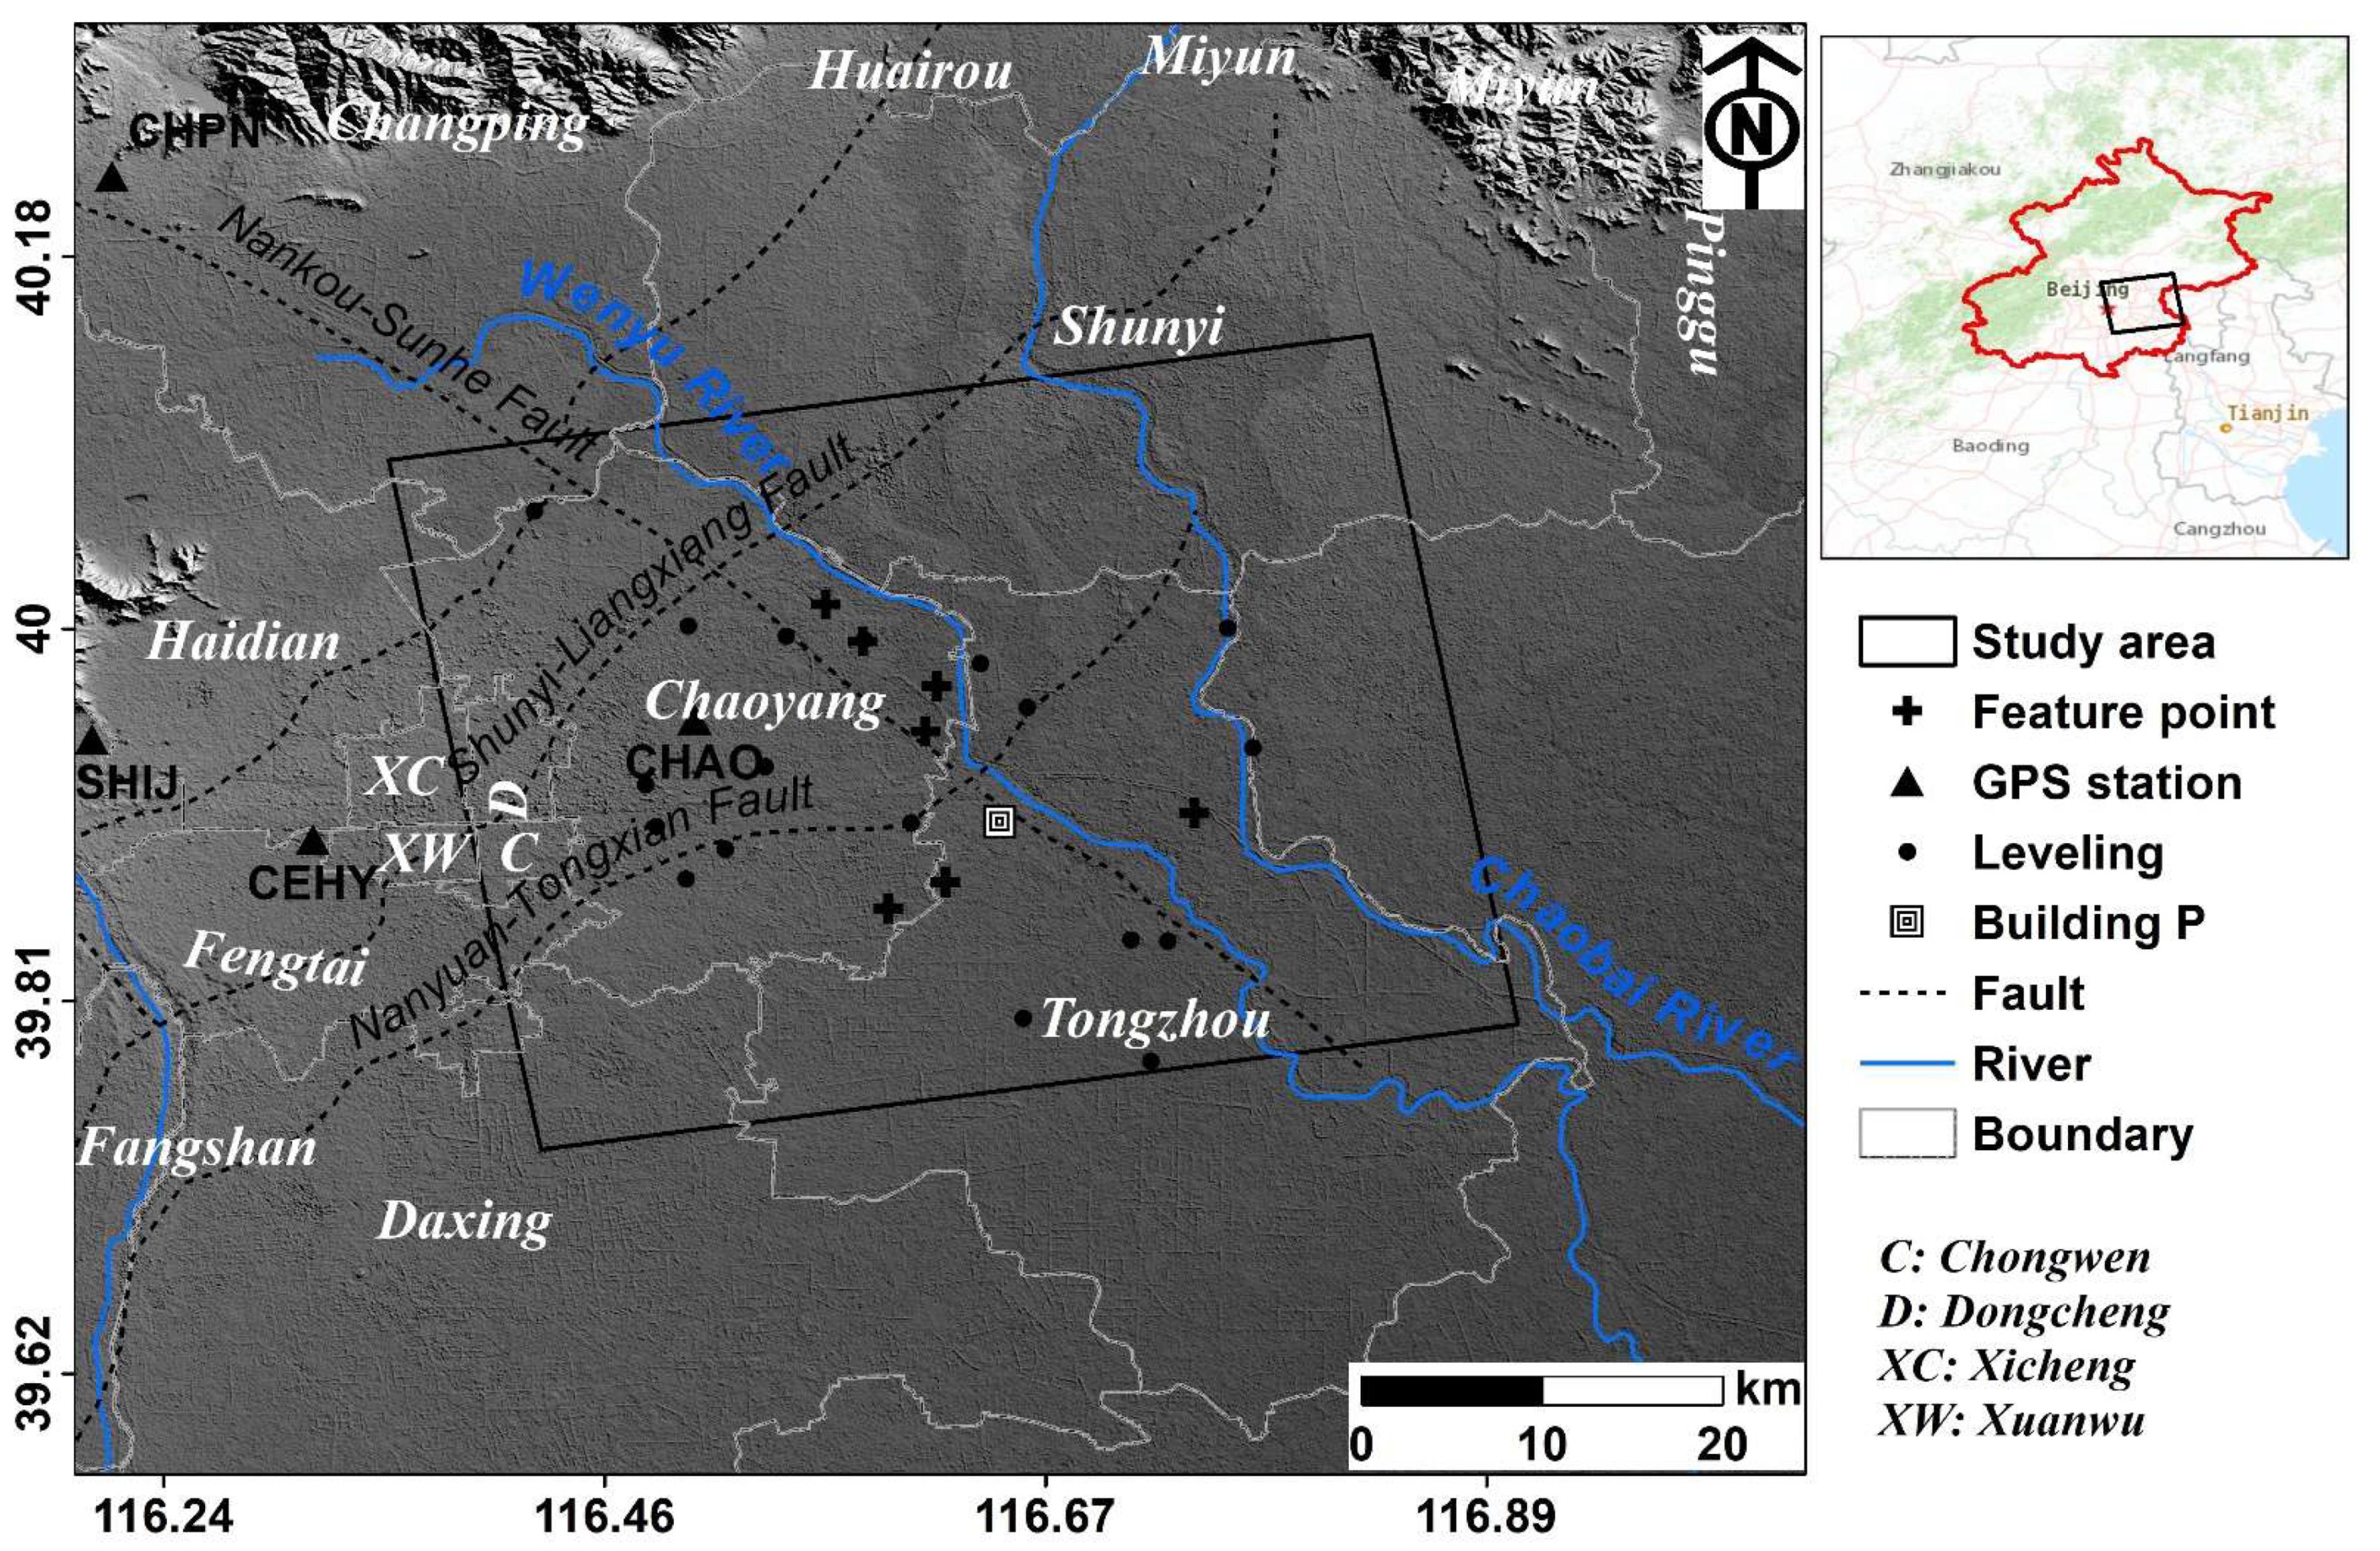
2.1. Study Area
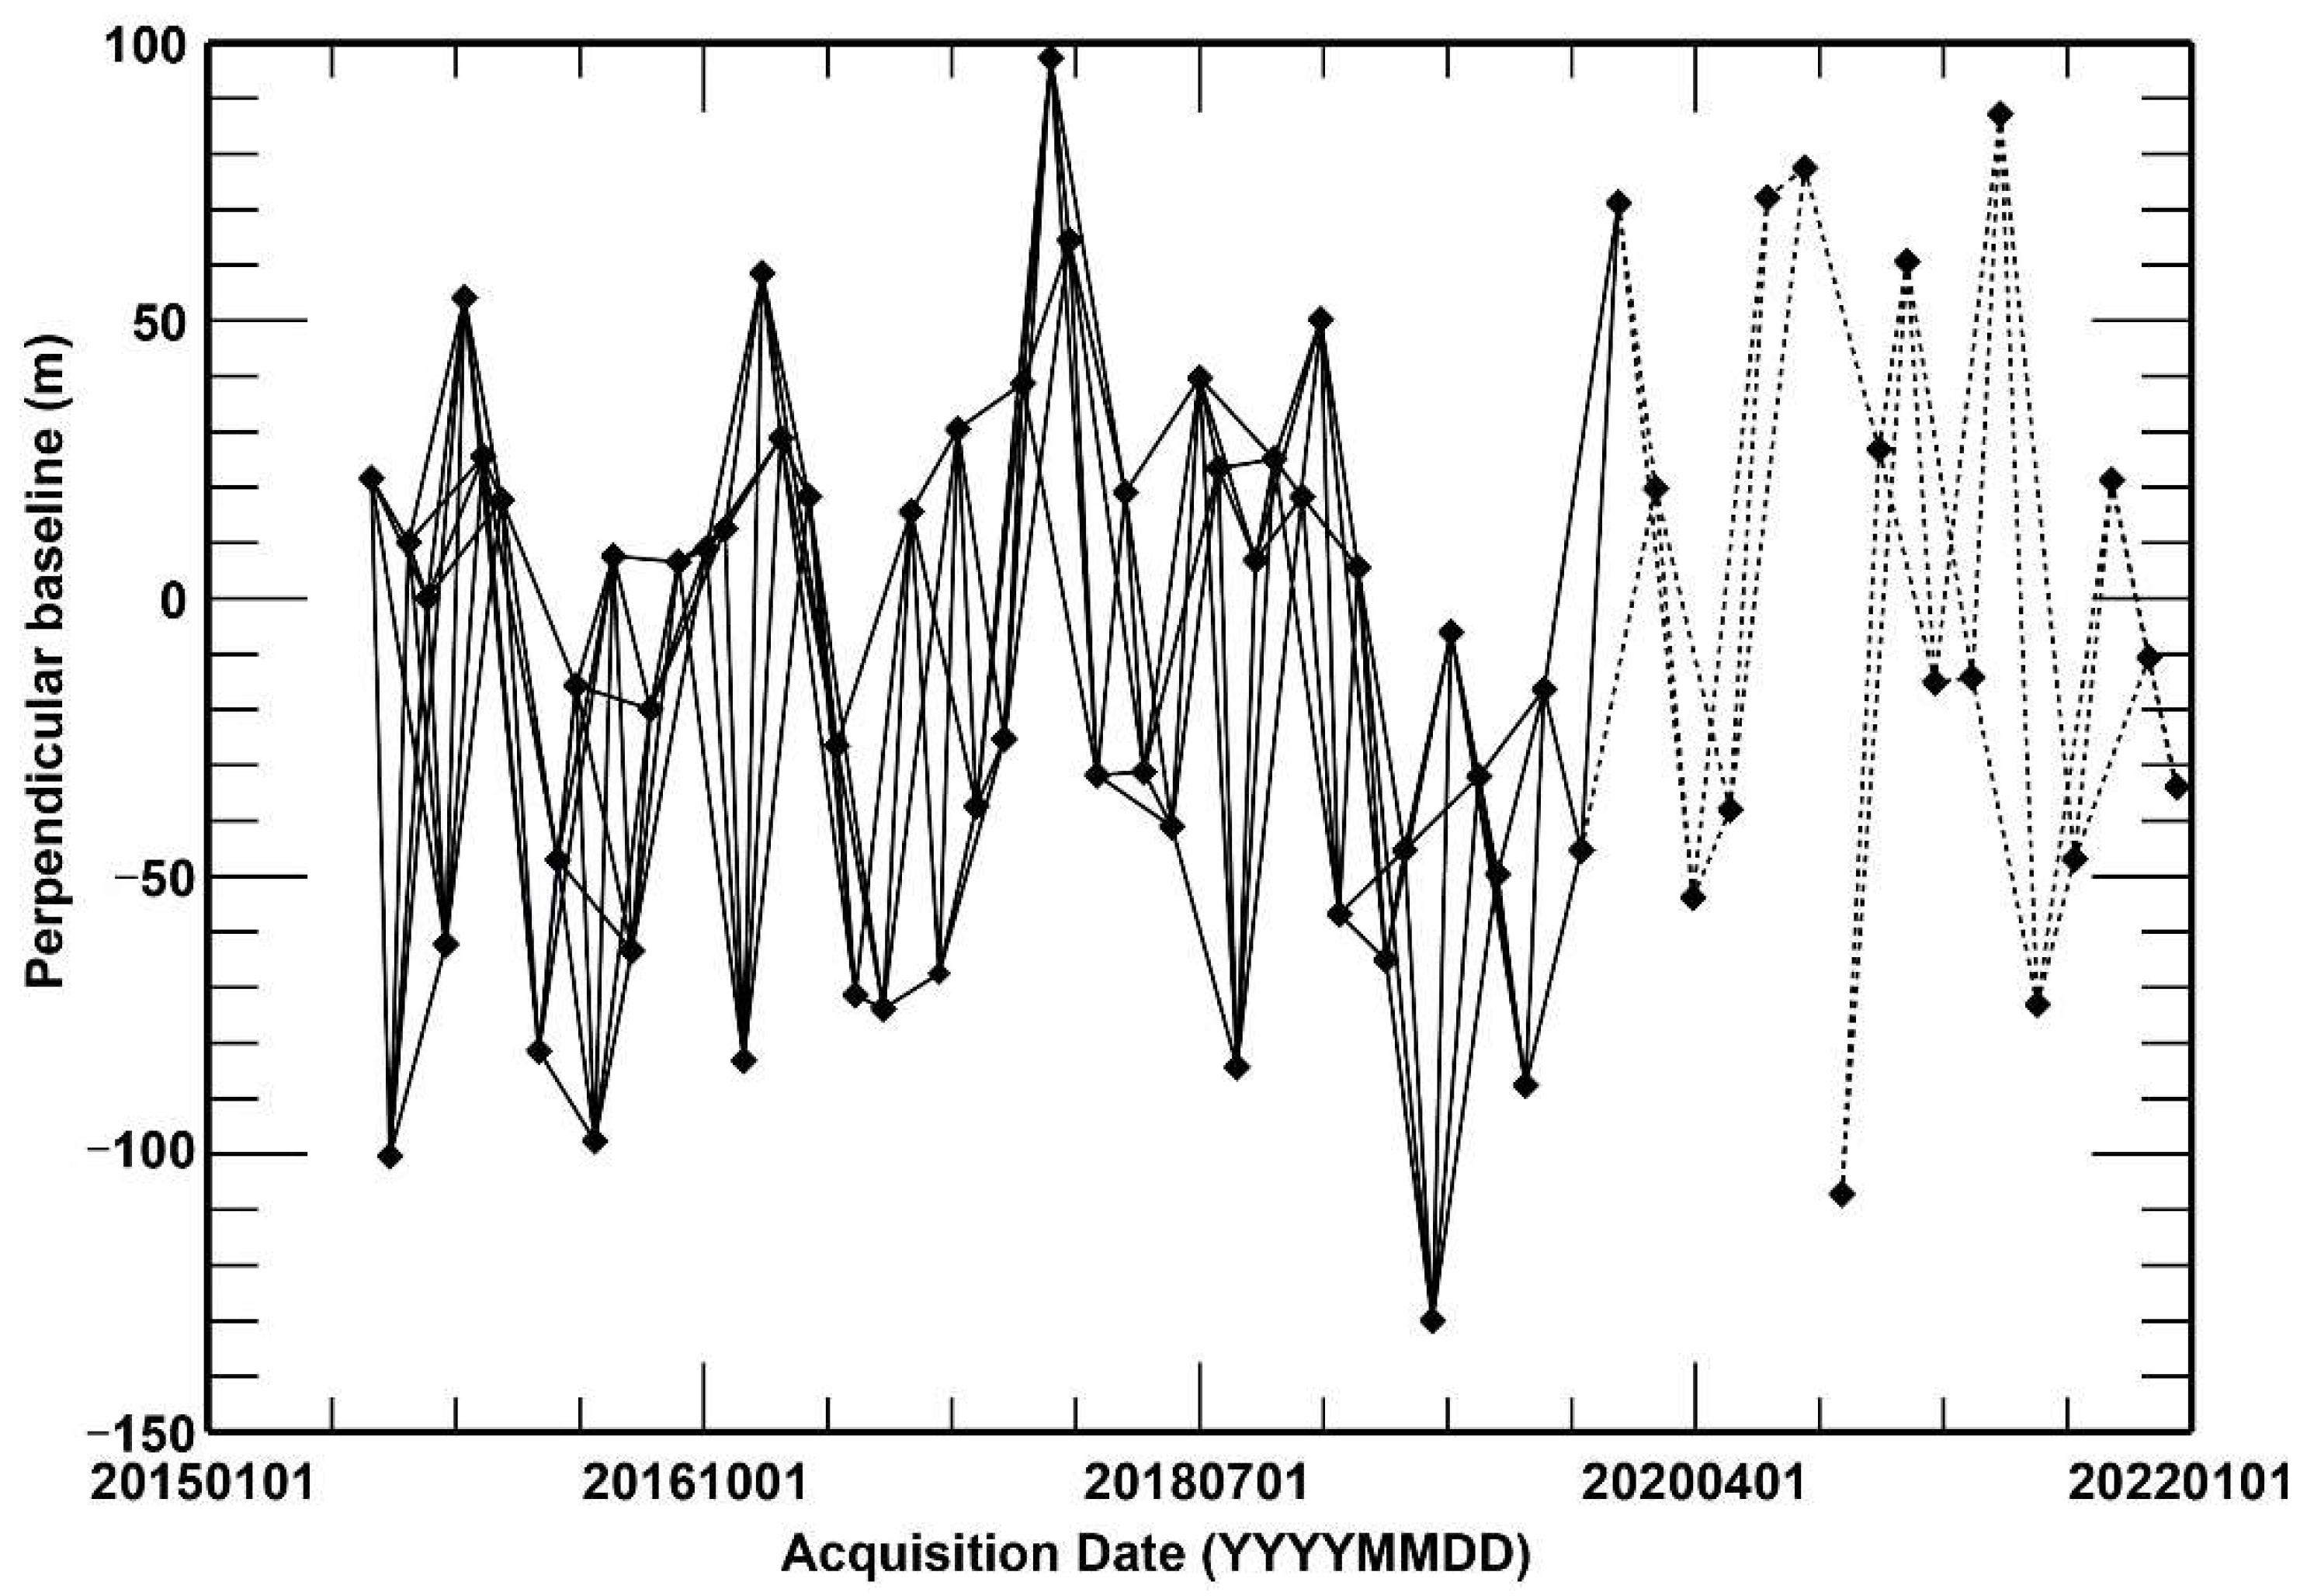
2.2. Dataset
3. Methodology
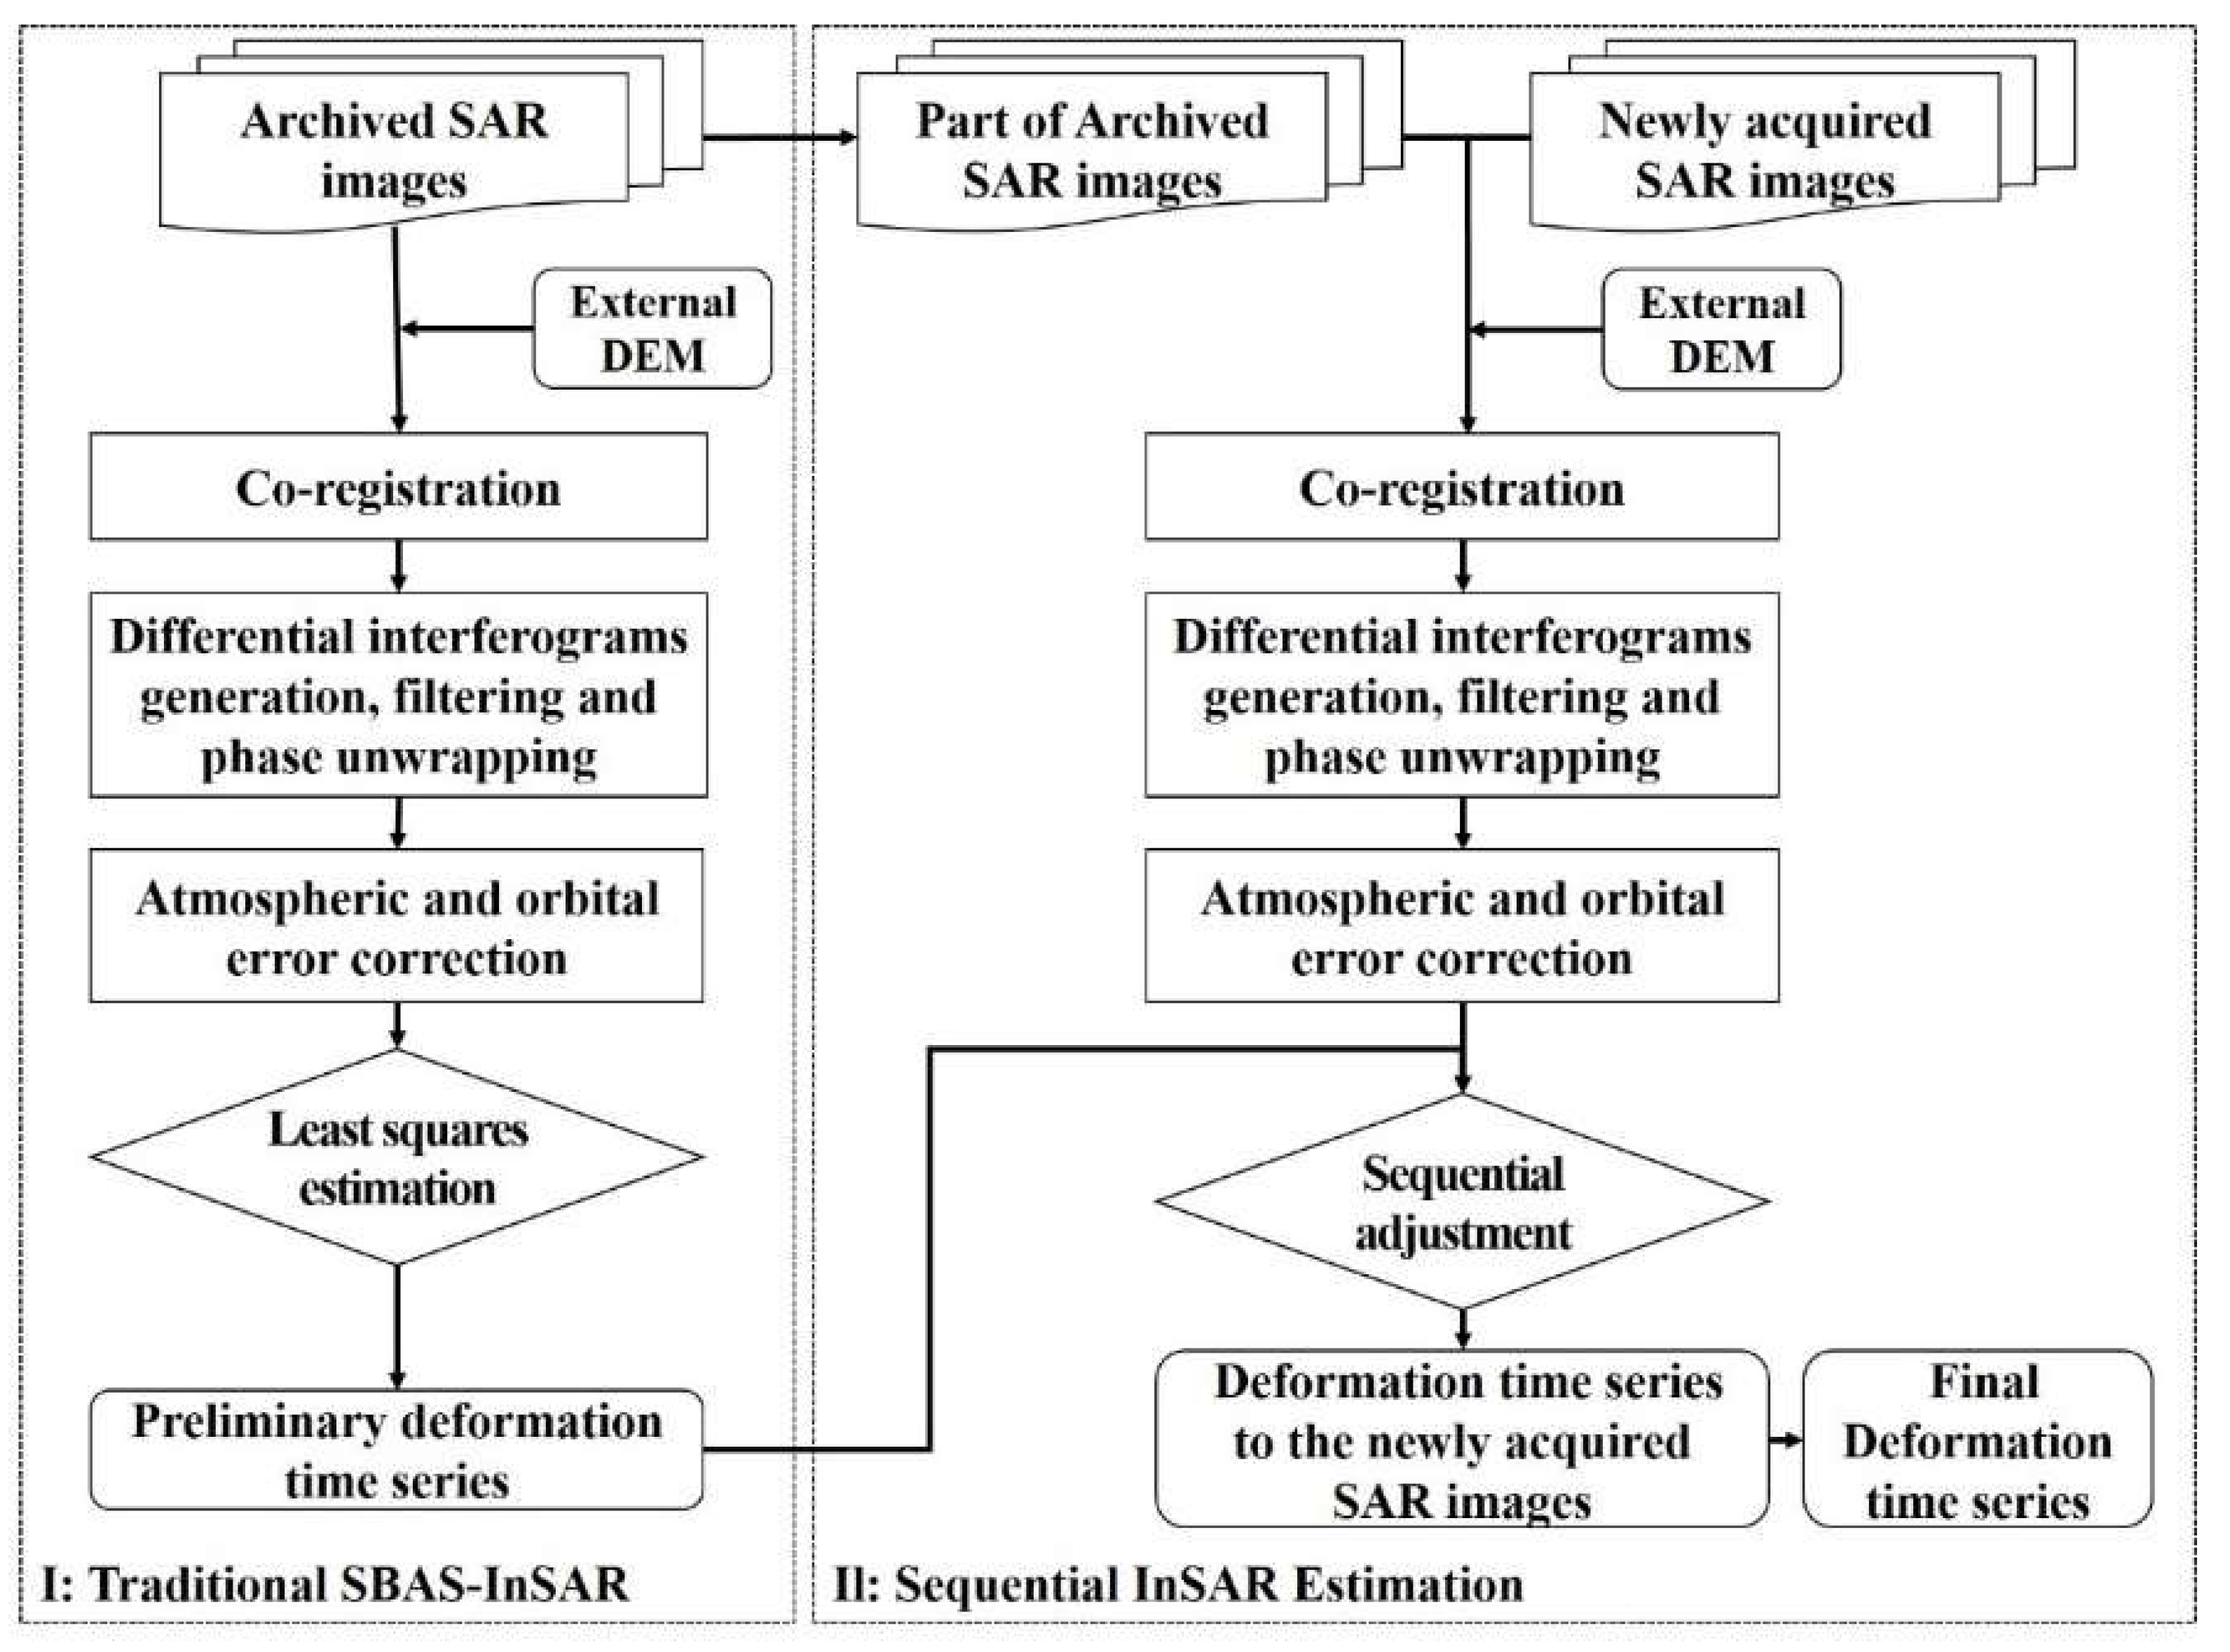
3.1. Progressive SBAS-InSAR Technique
3.1.1. Traditional SBAS-InSAR
3.1.2. Sequential InSAR Estimation
3.2. Wavelet Transform for Time Series Analysis
4. Results
4.1. Deformation Rate of Eastern Beijing Plain
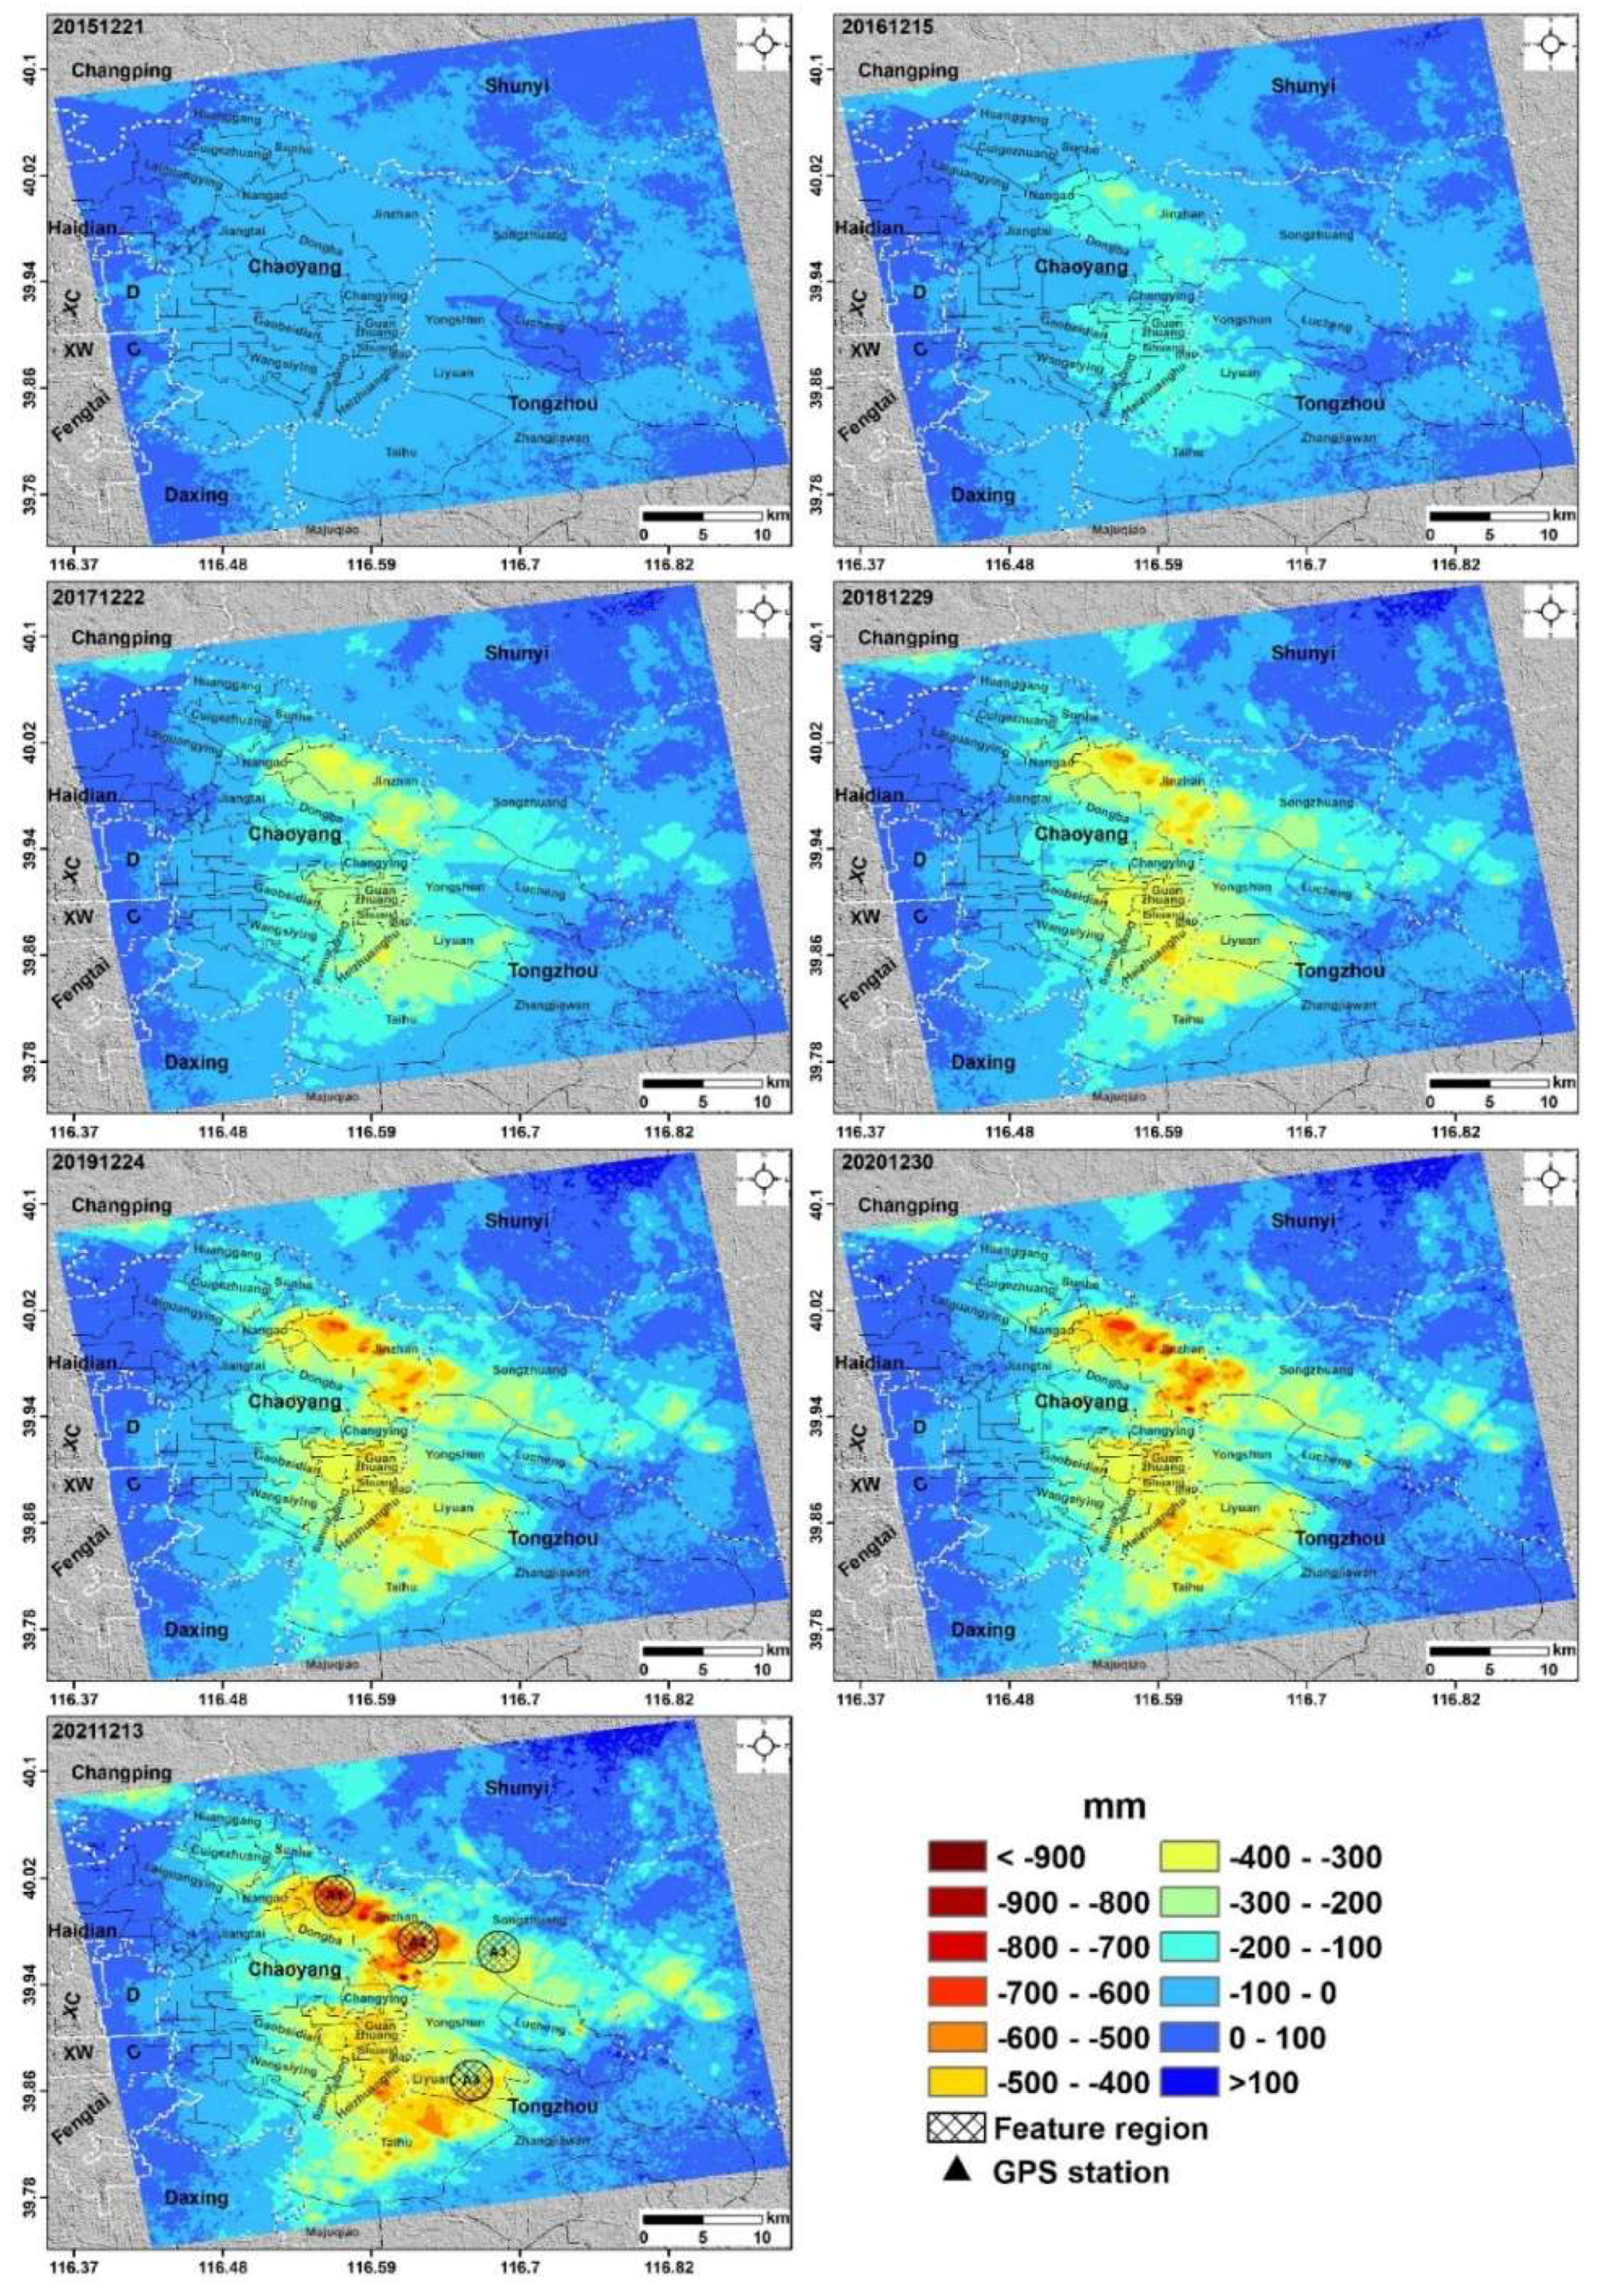
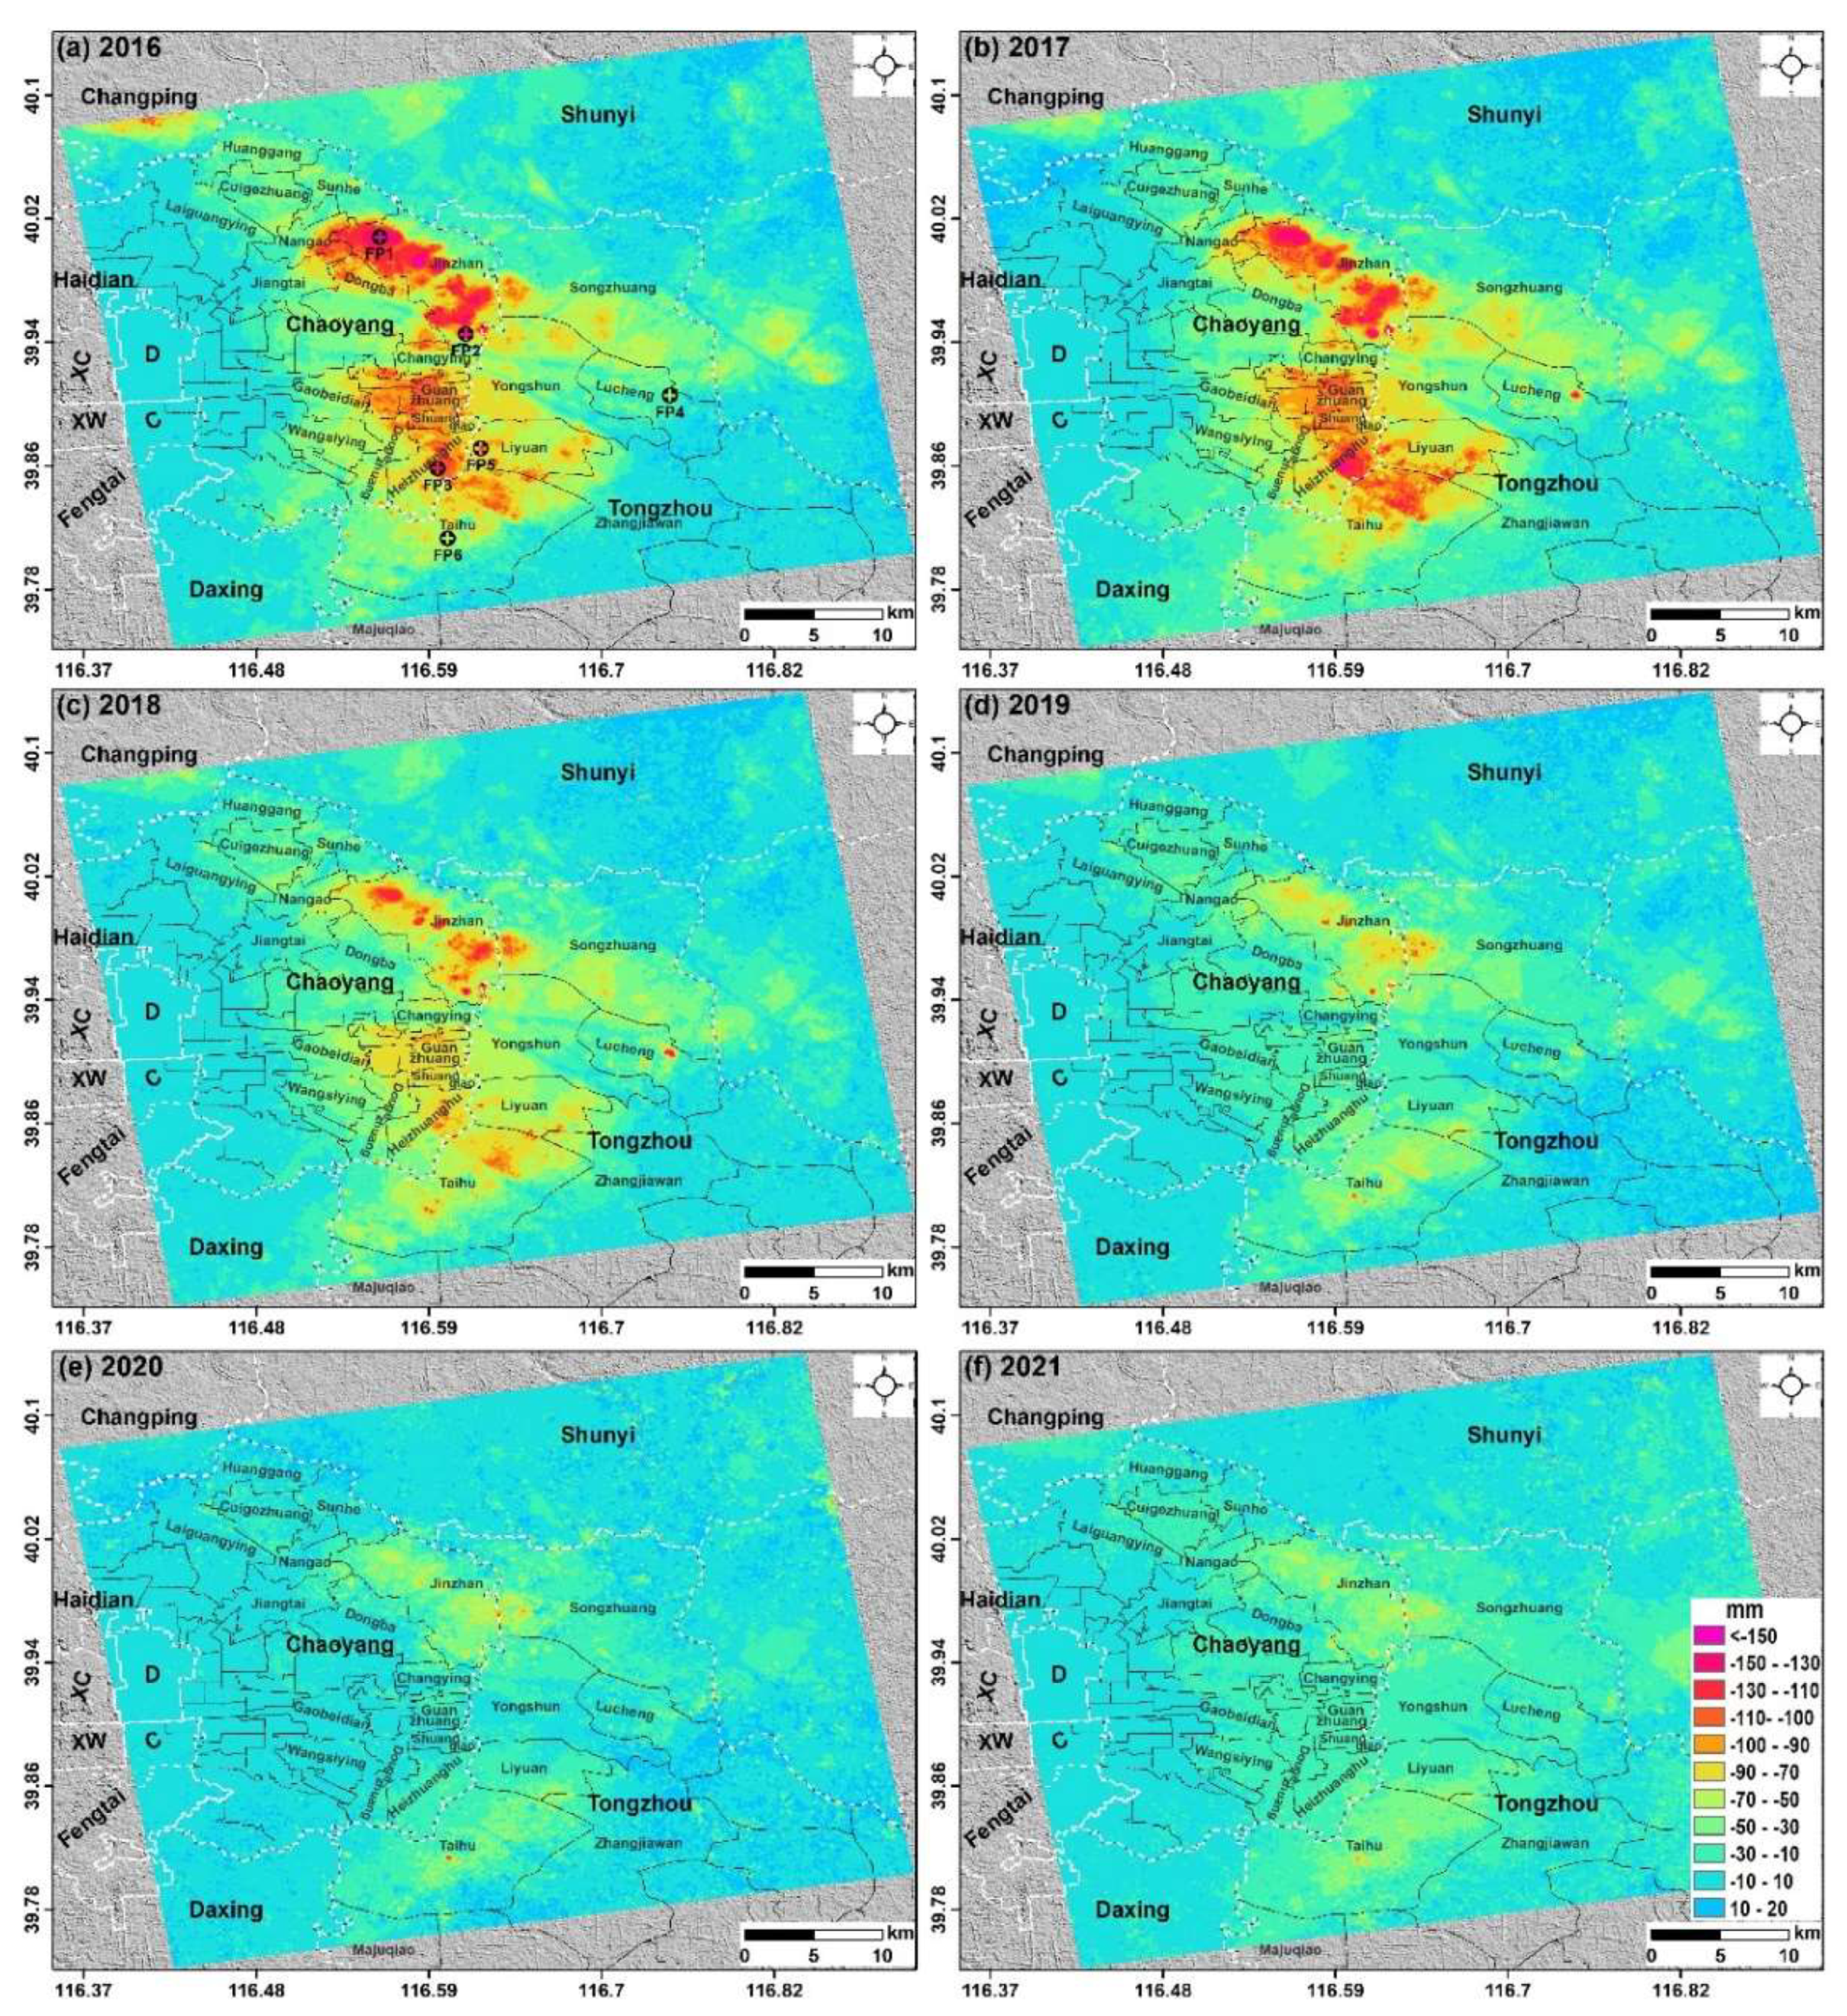
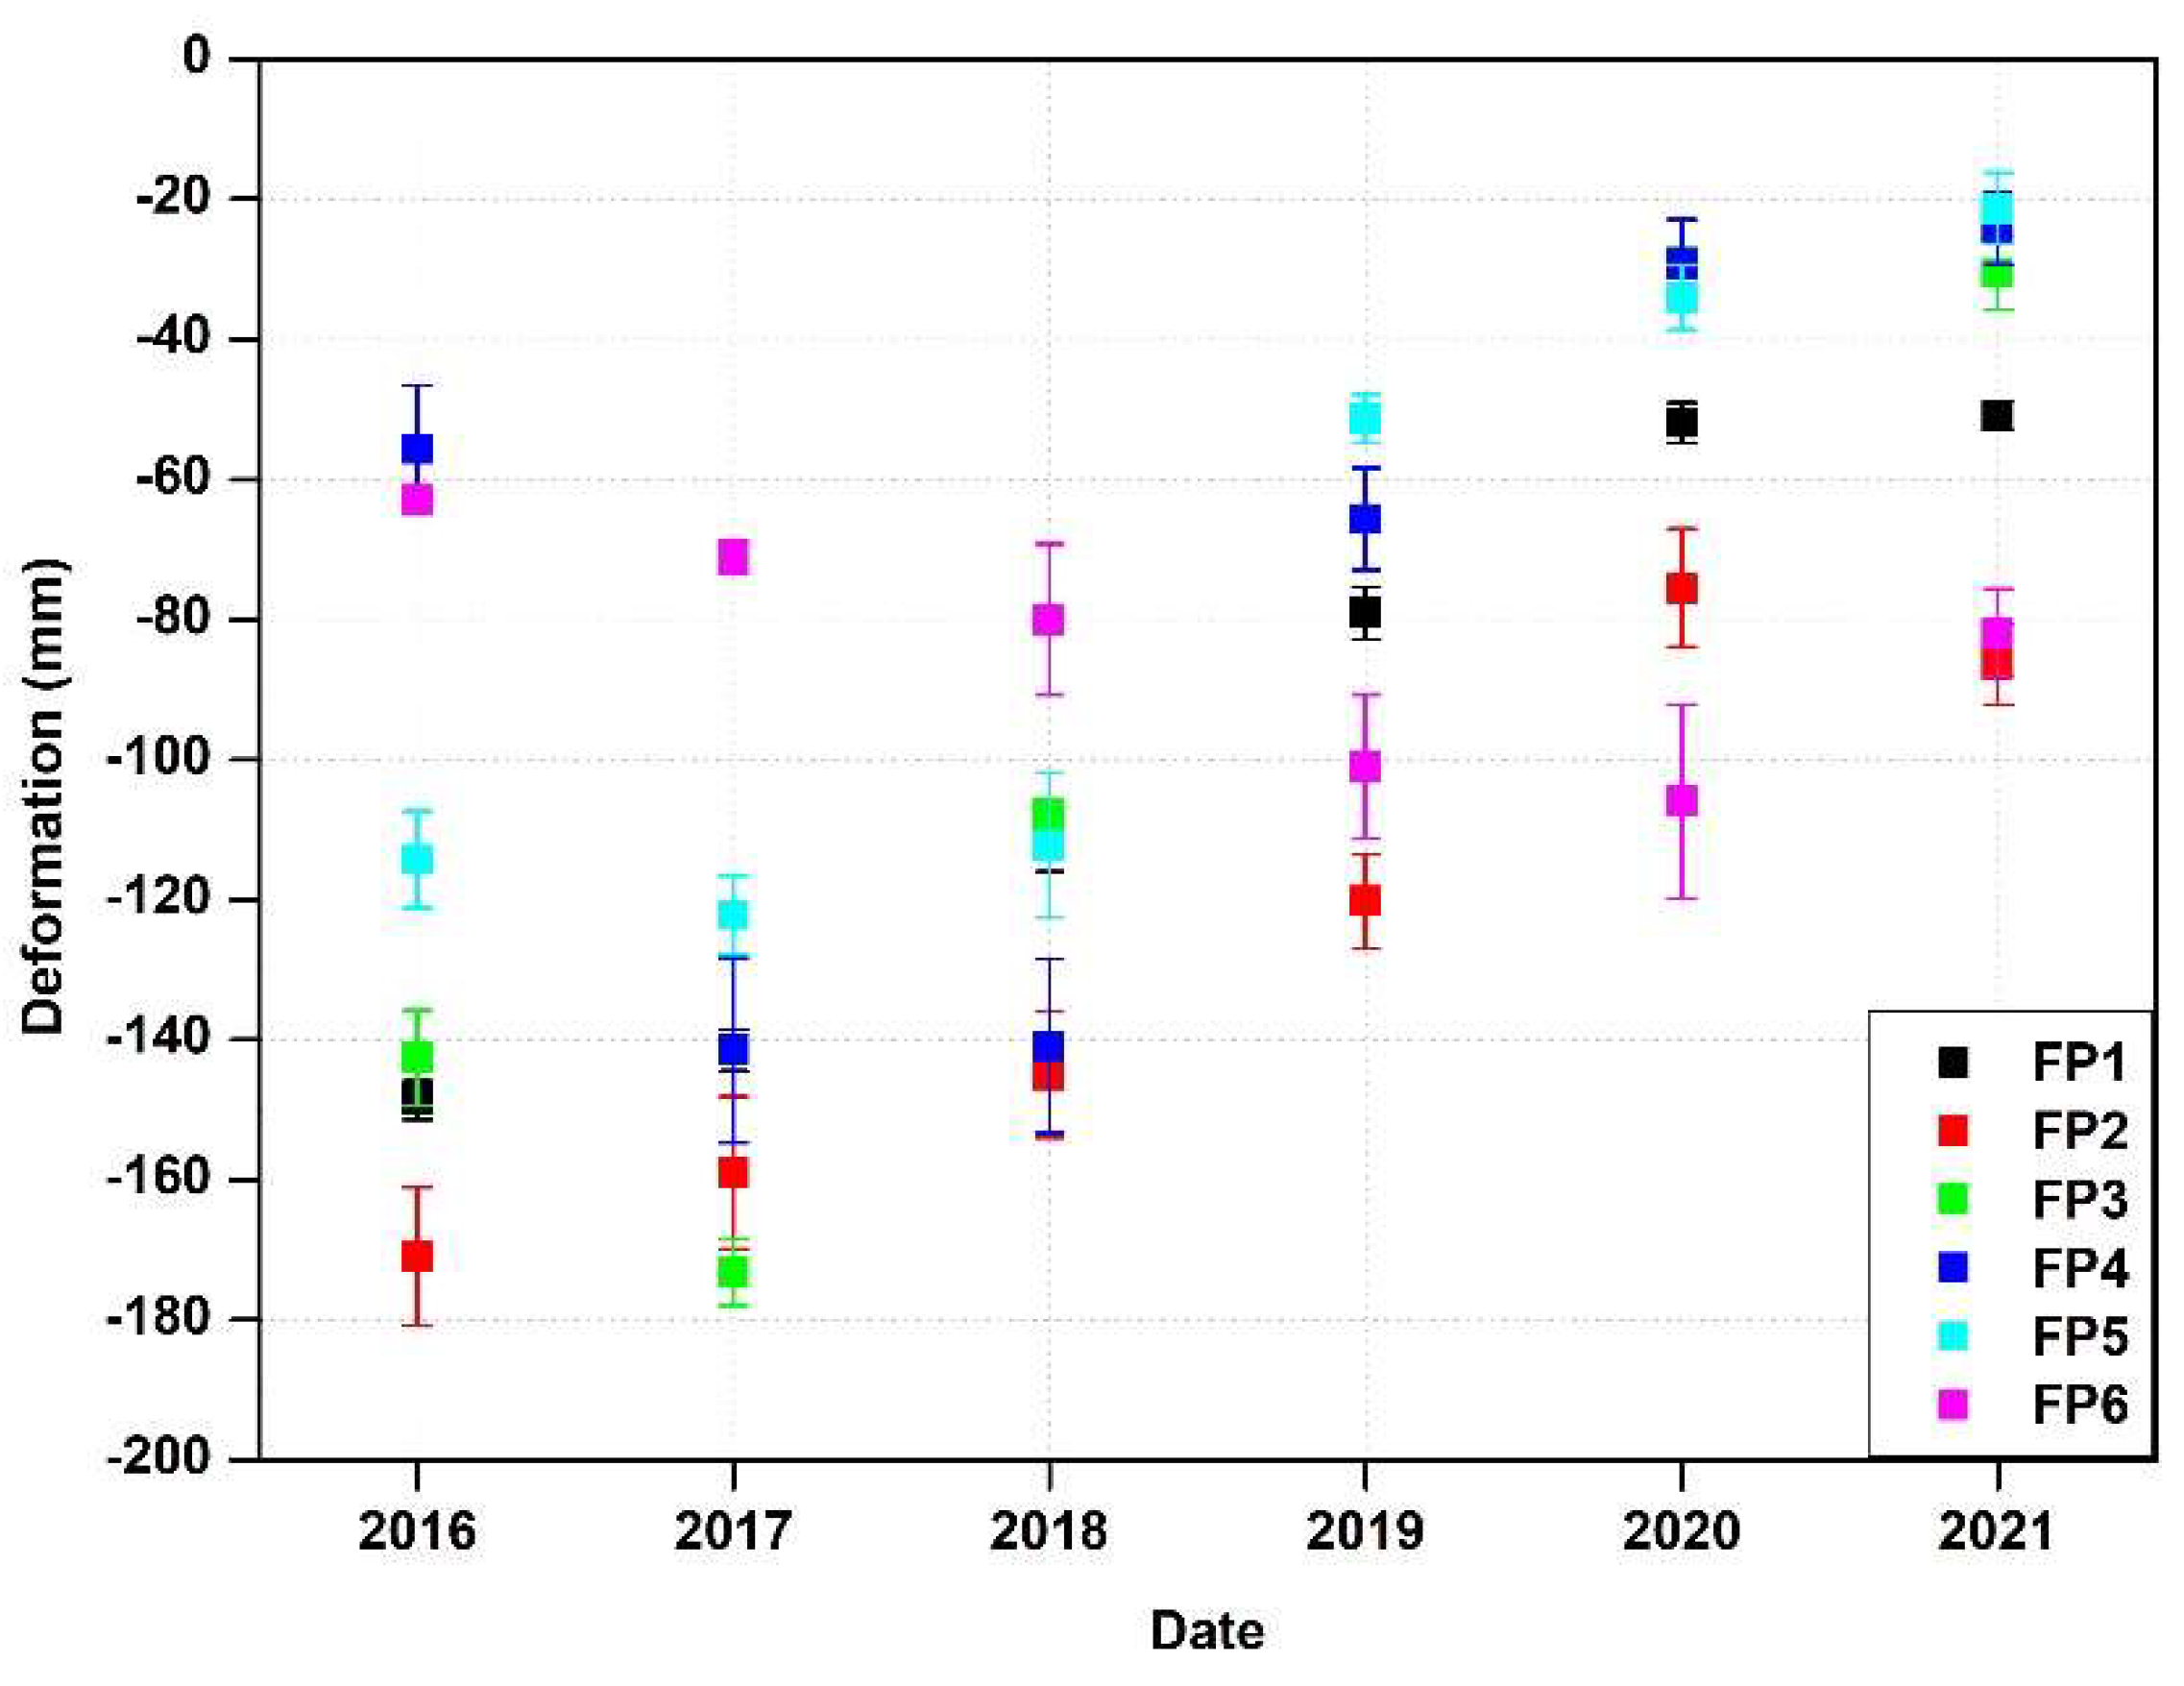
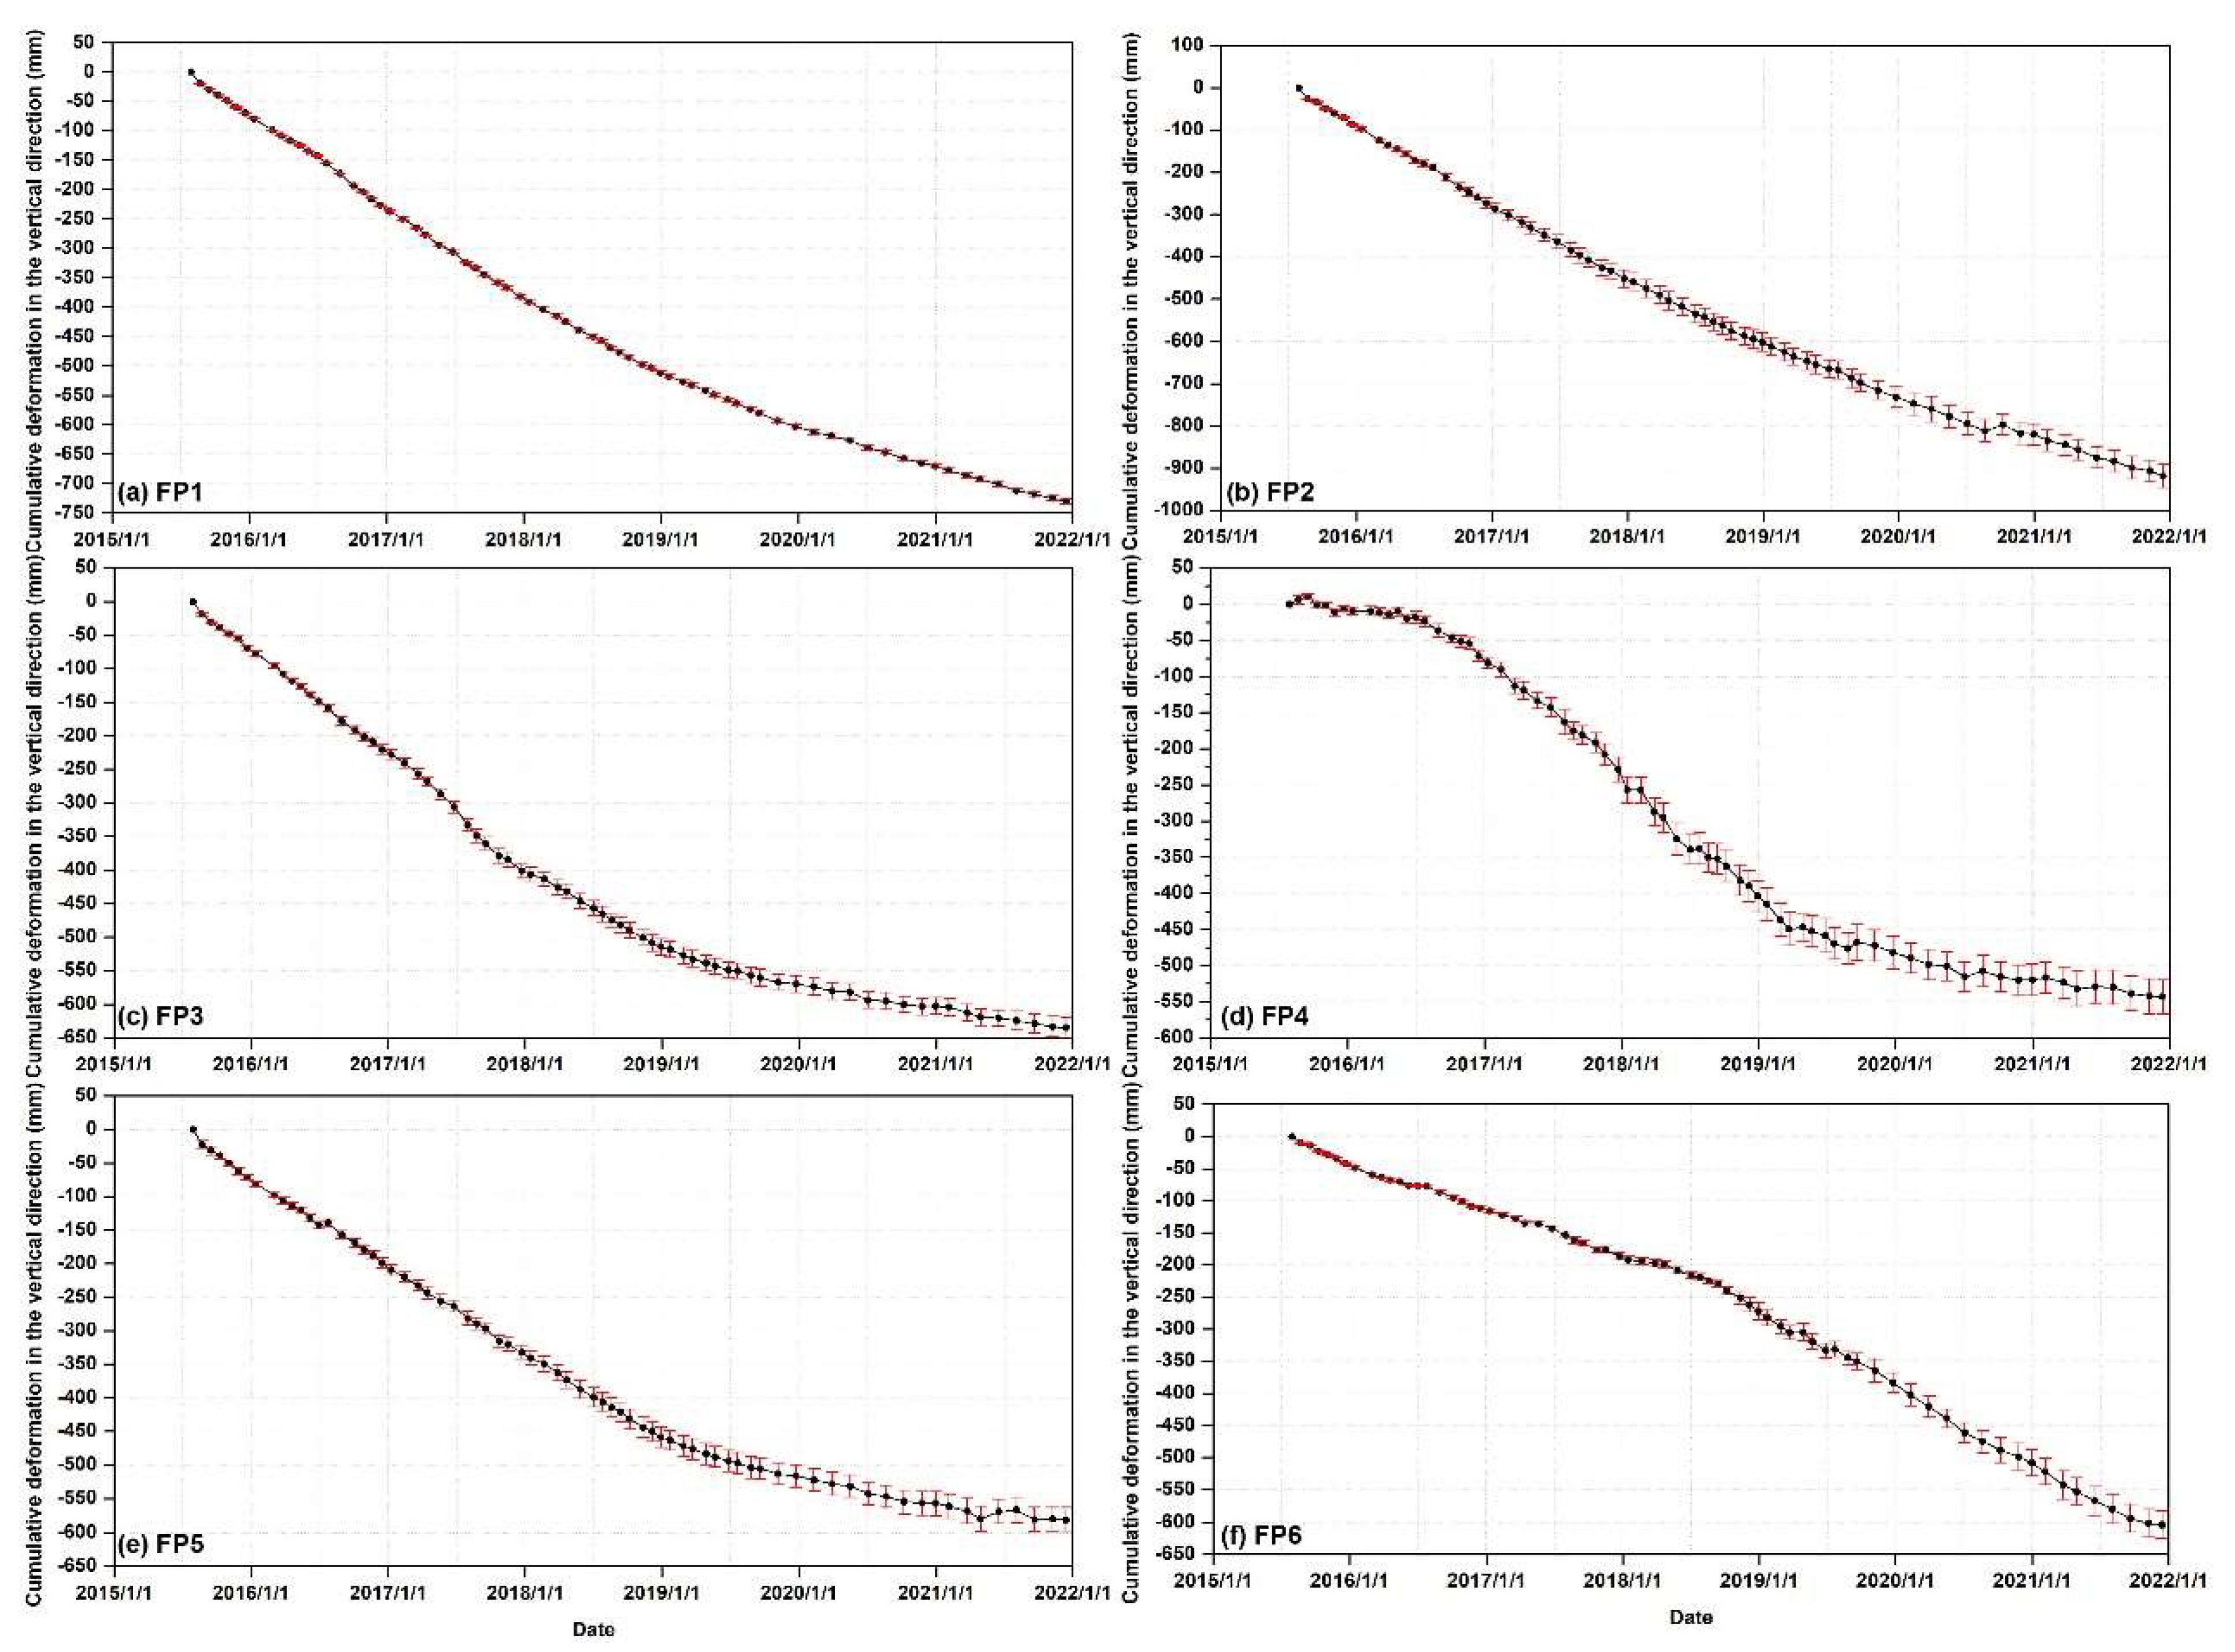
4.2. Time Series Deformation of Eastern Beijing Plain
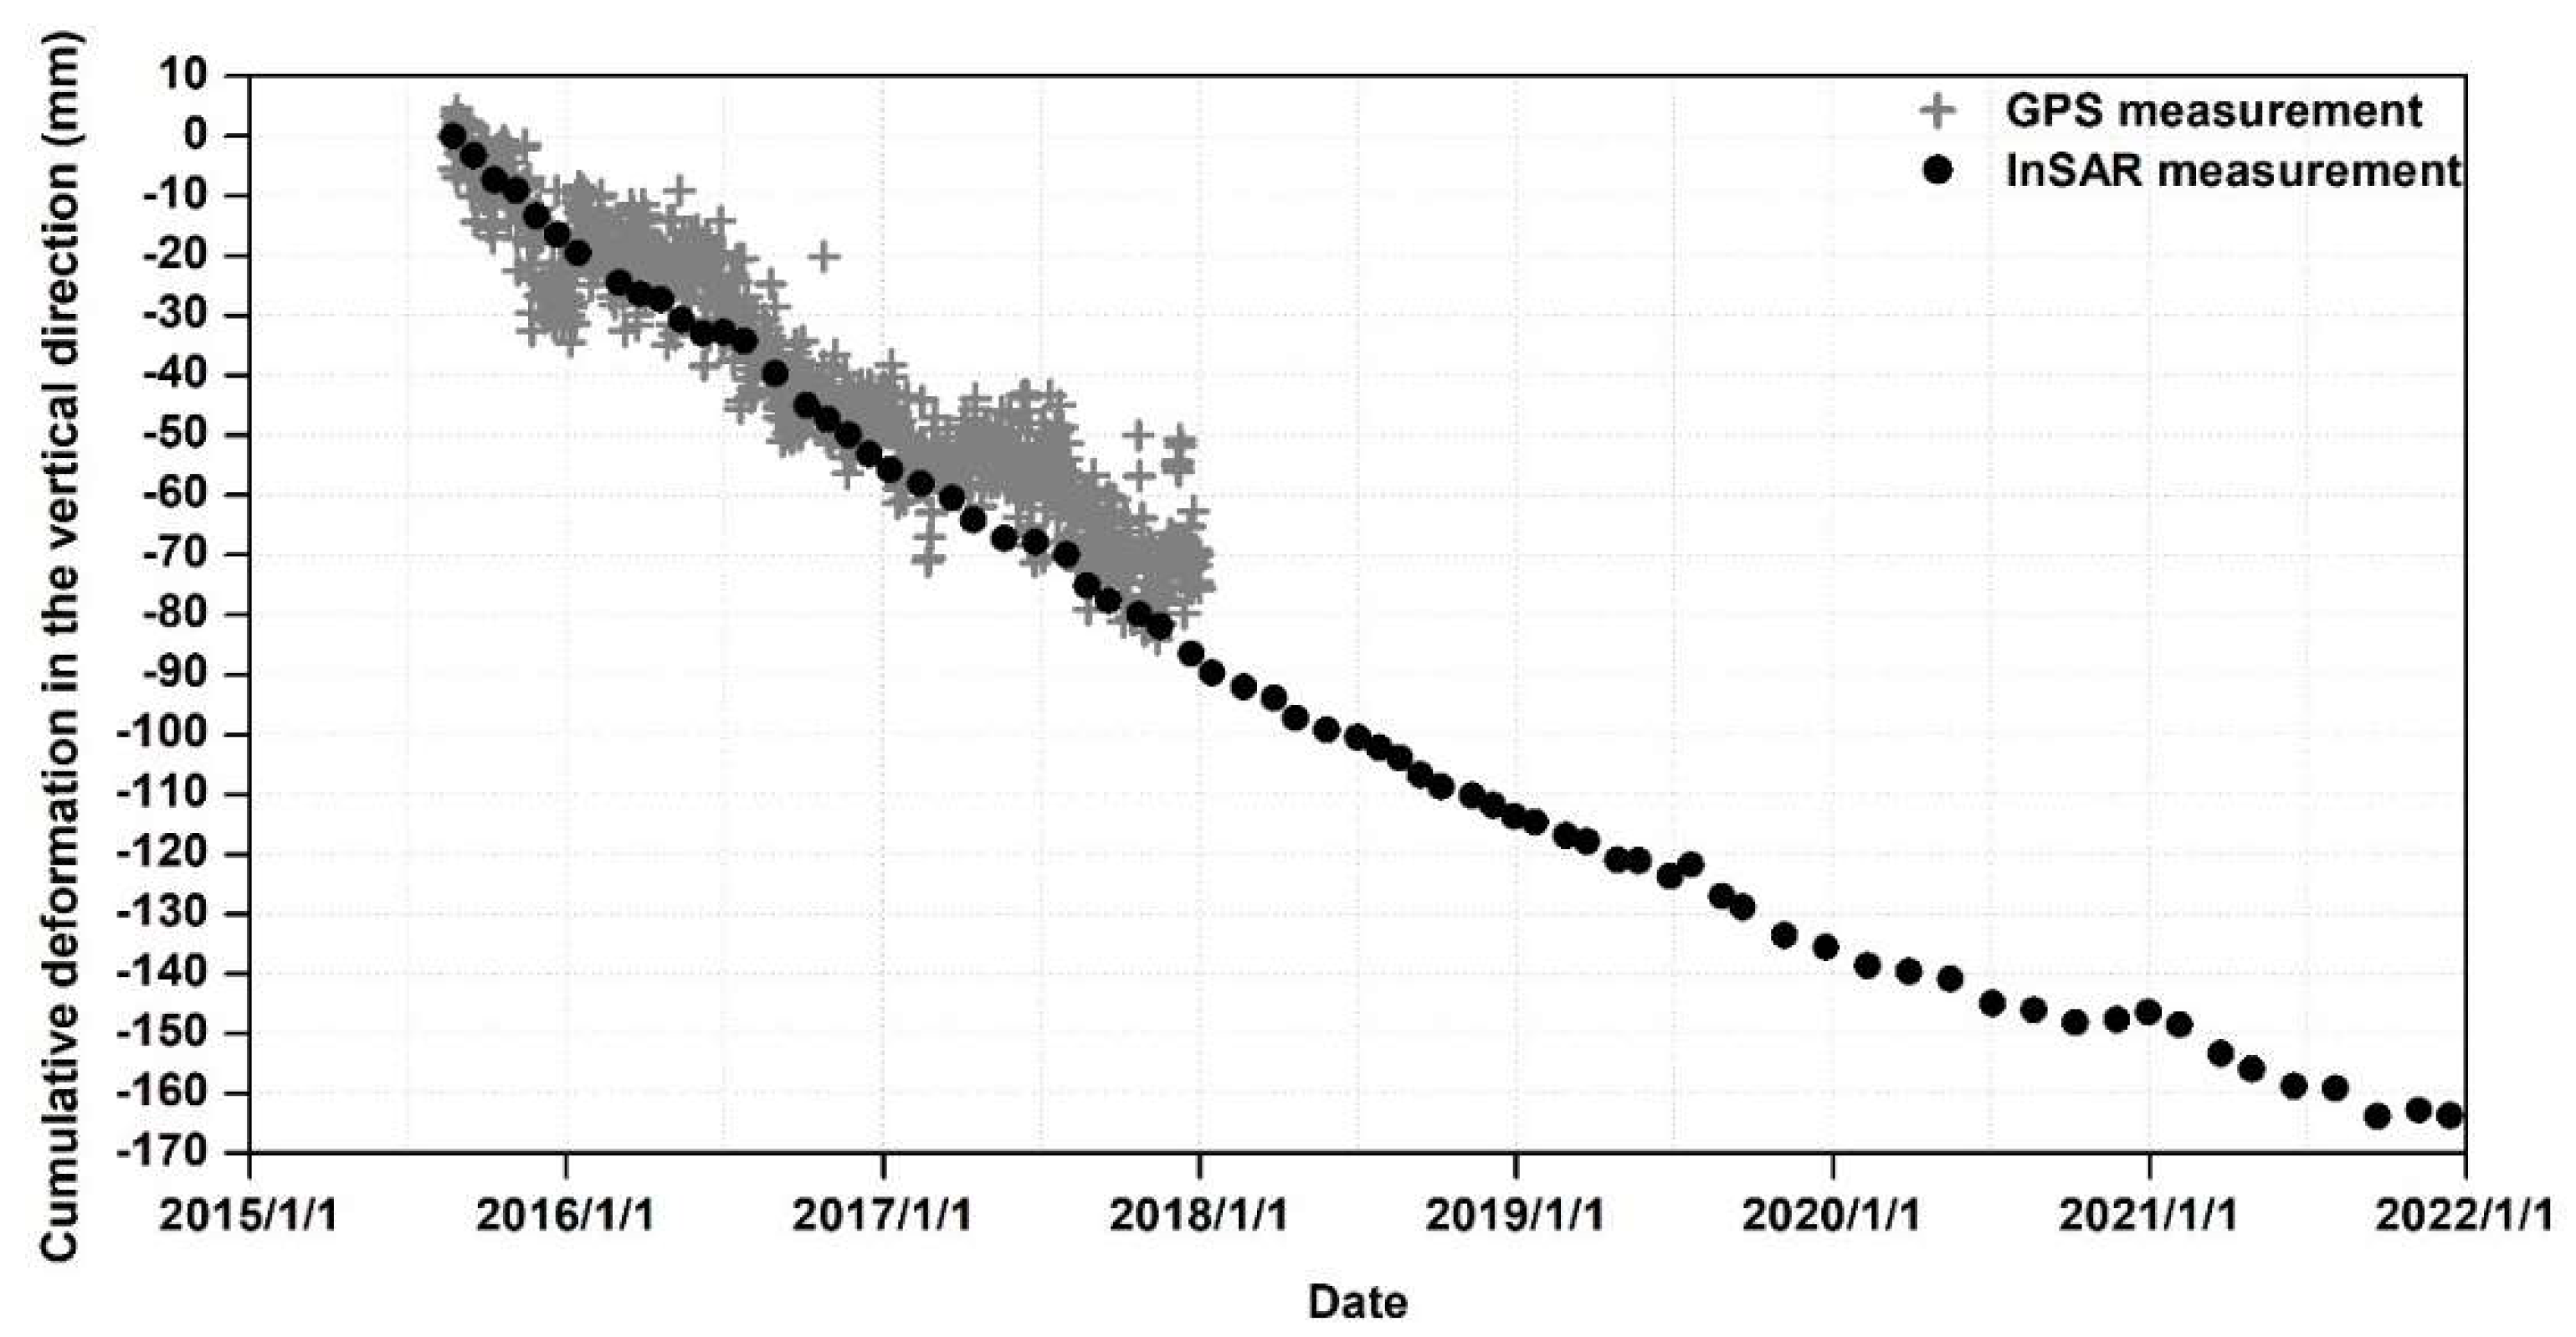
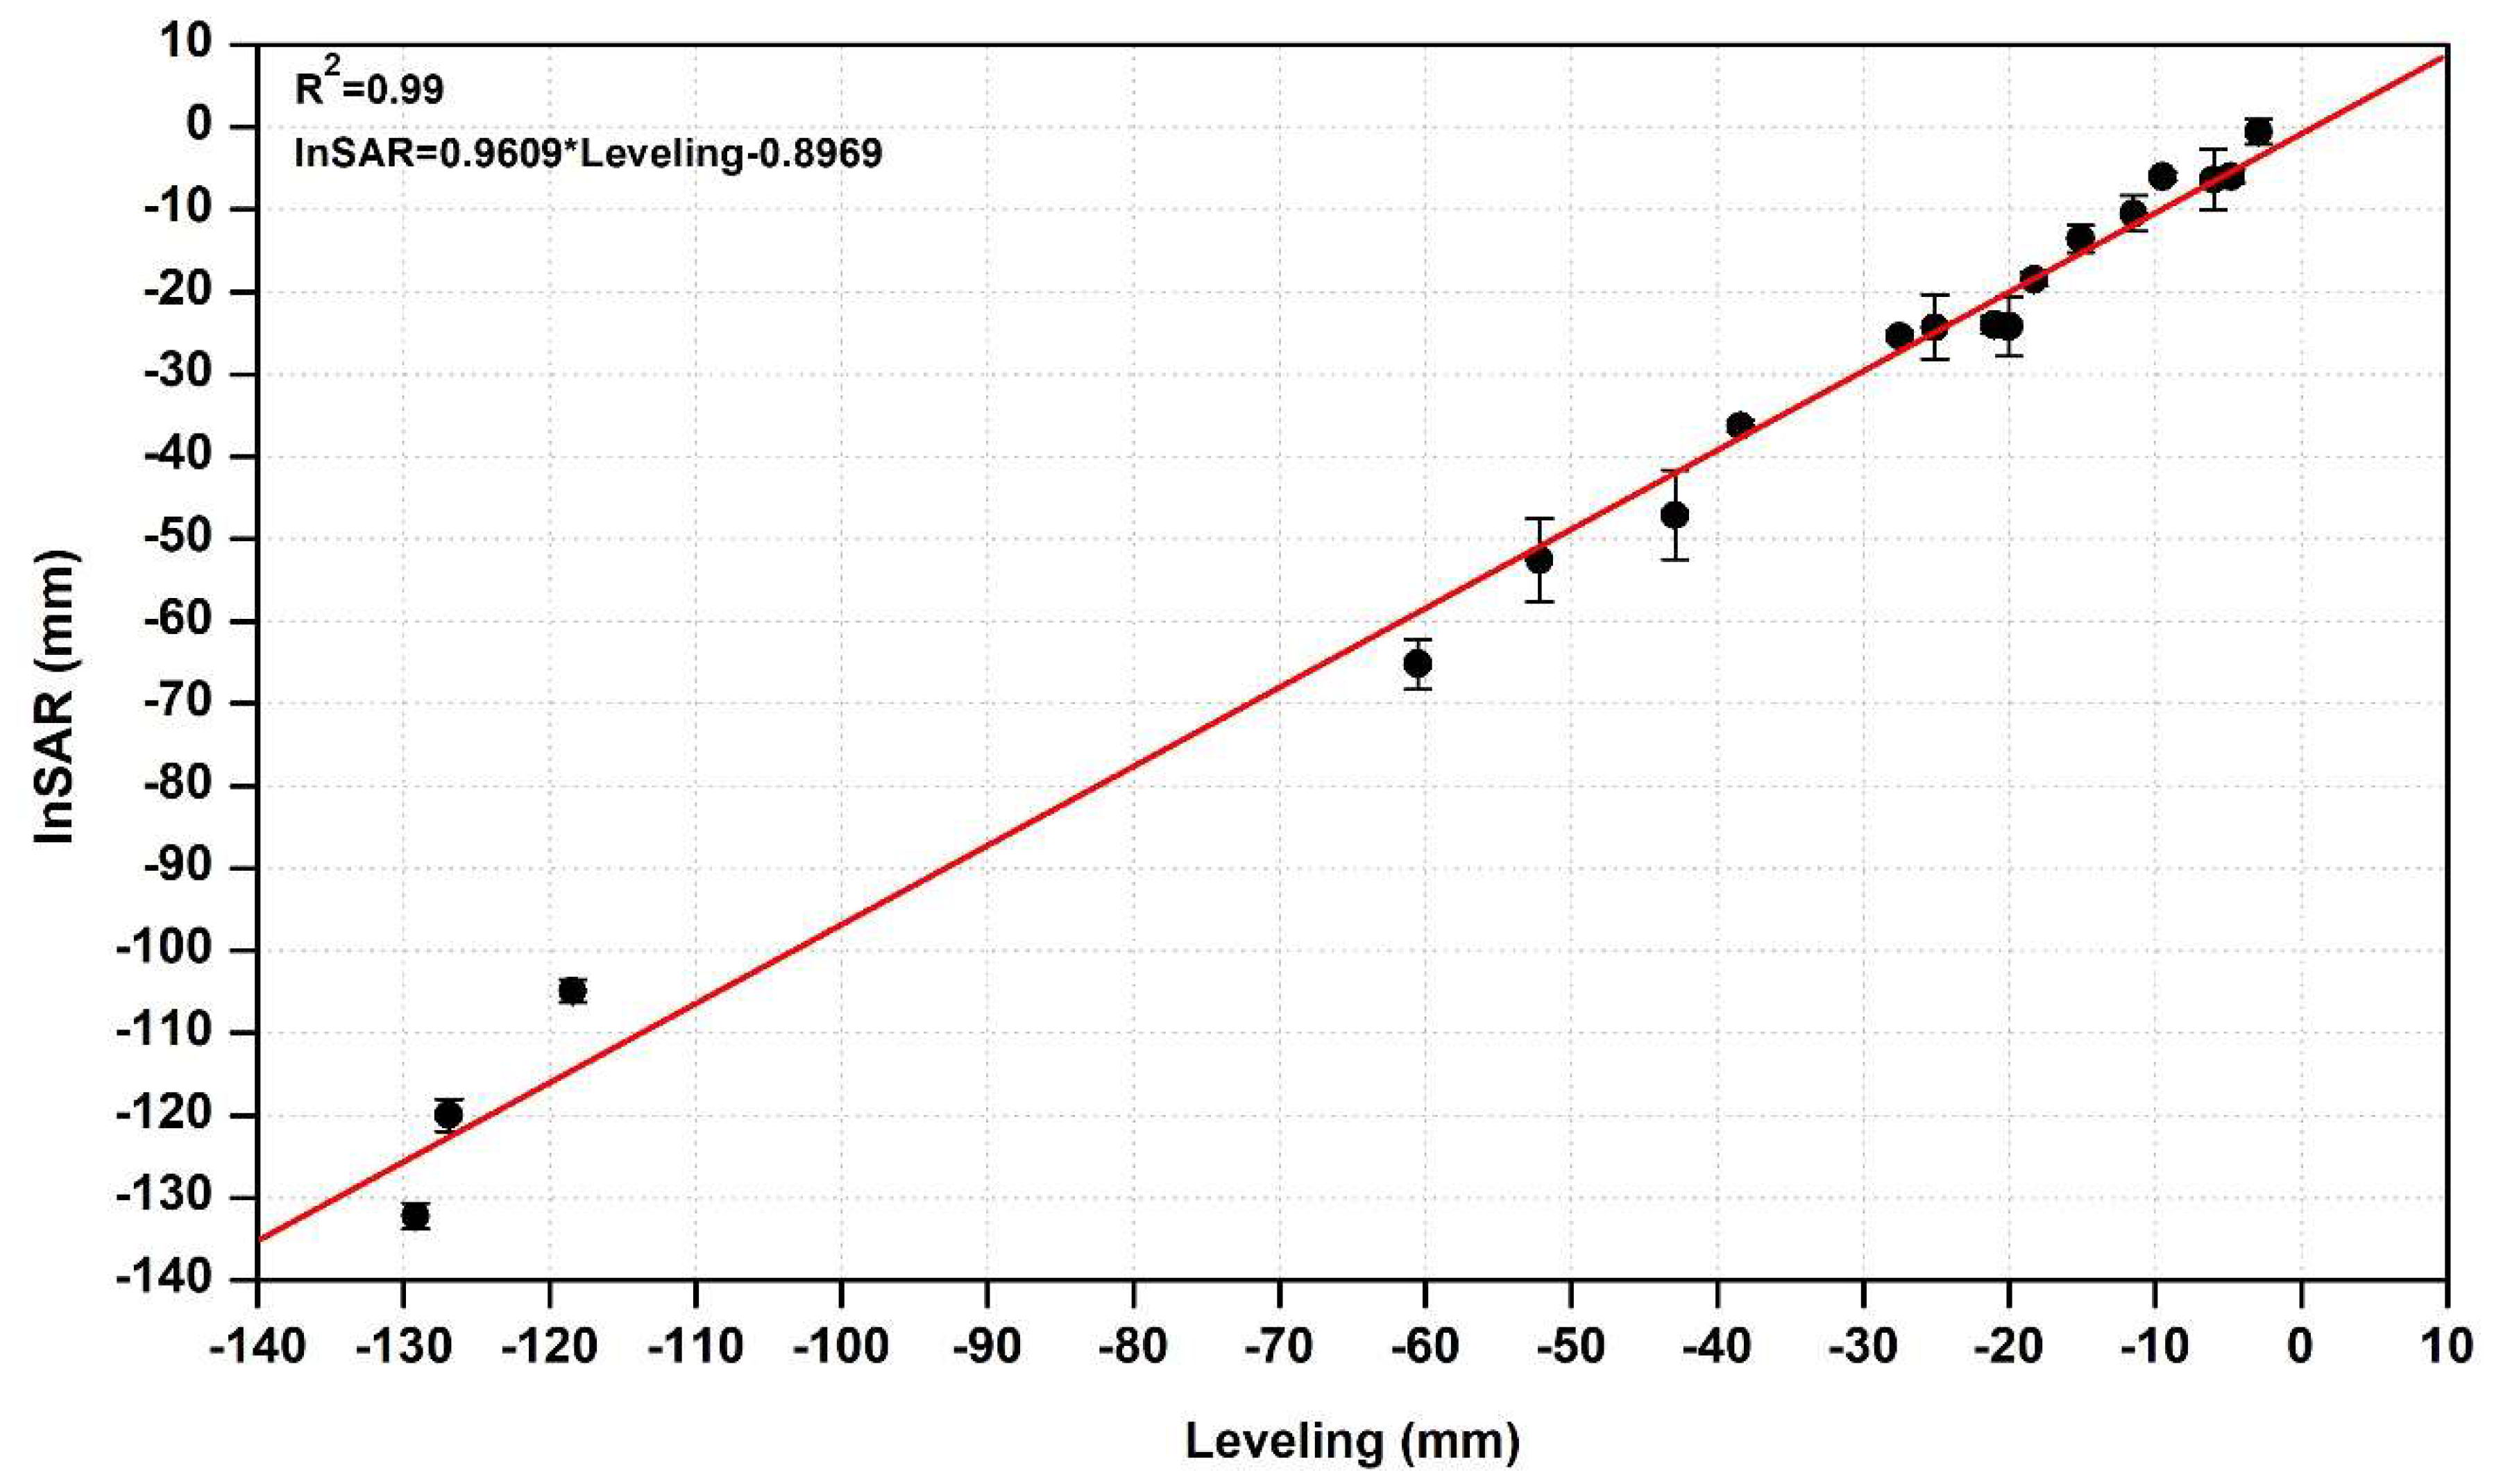
4.3. Validation of InSAR Measurements
5. Discussion
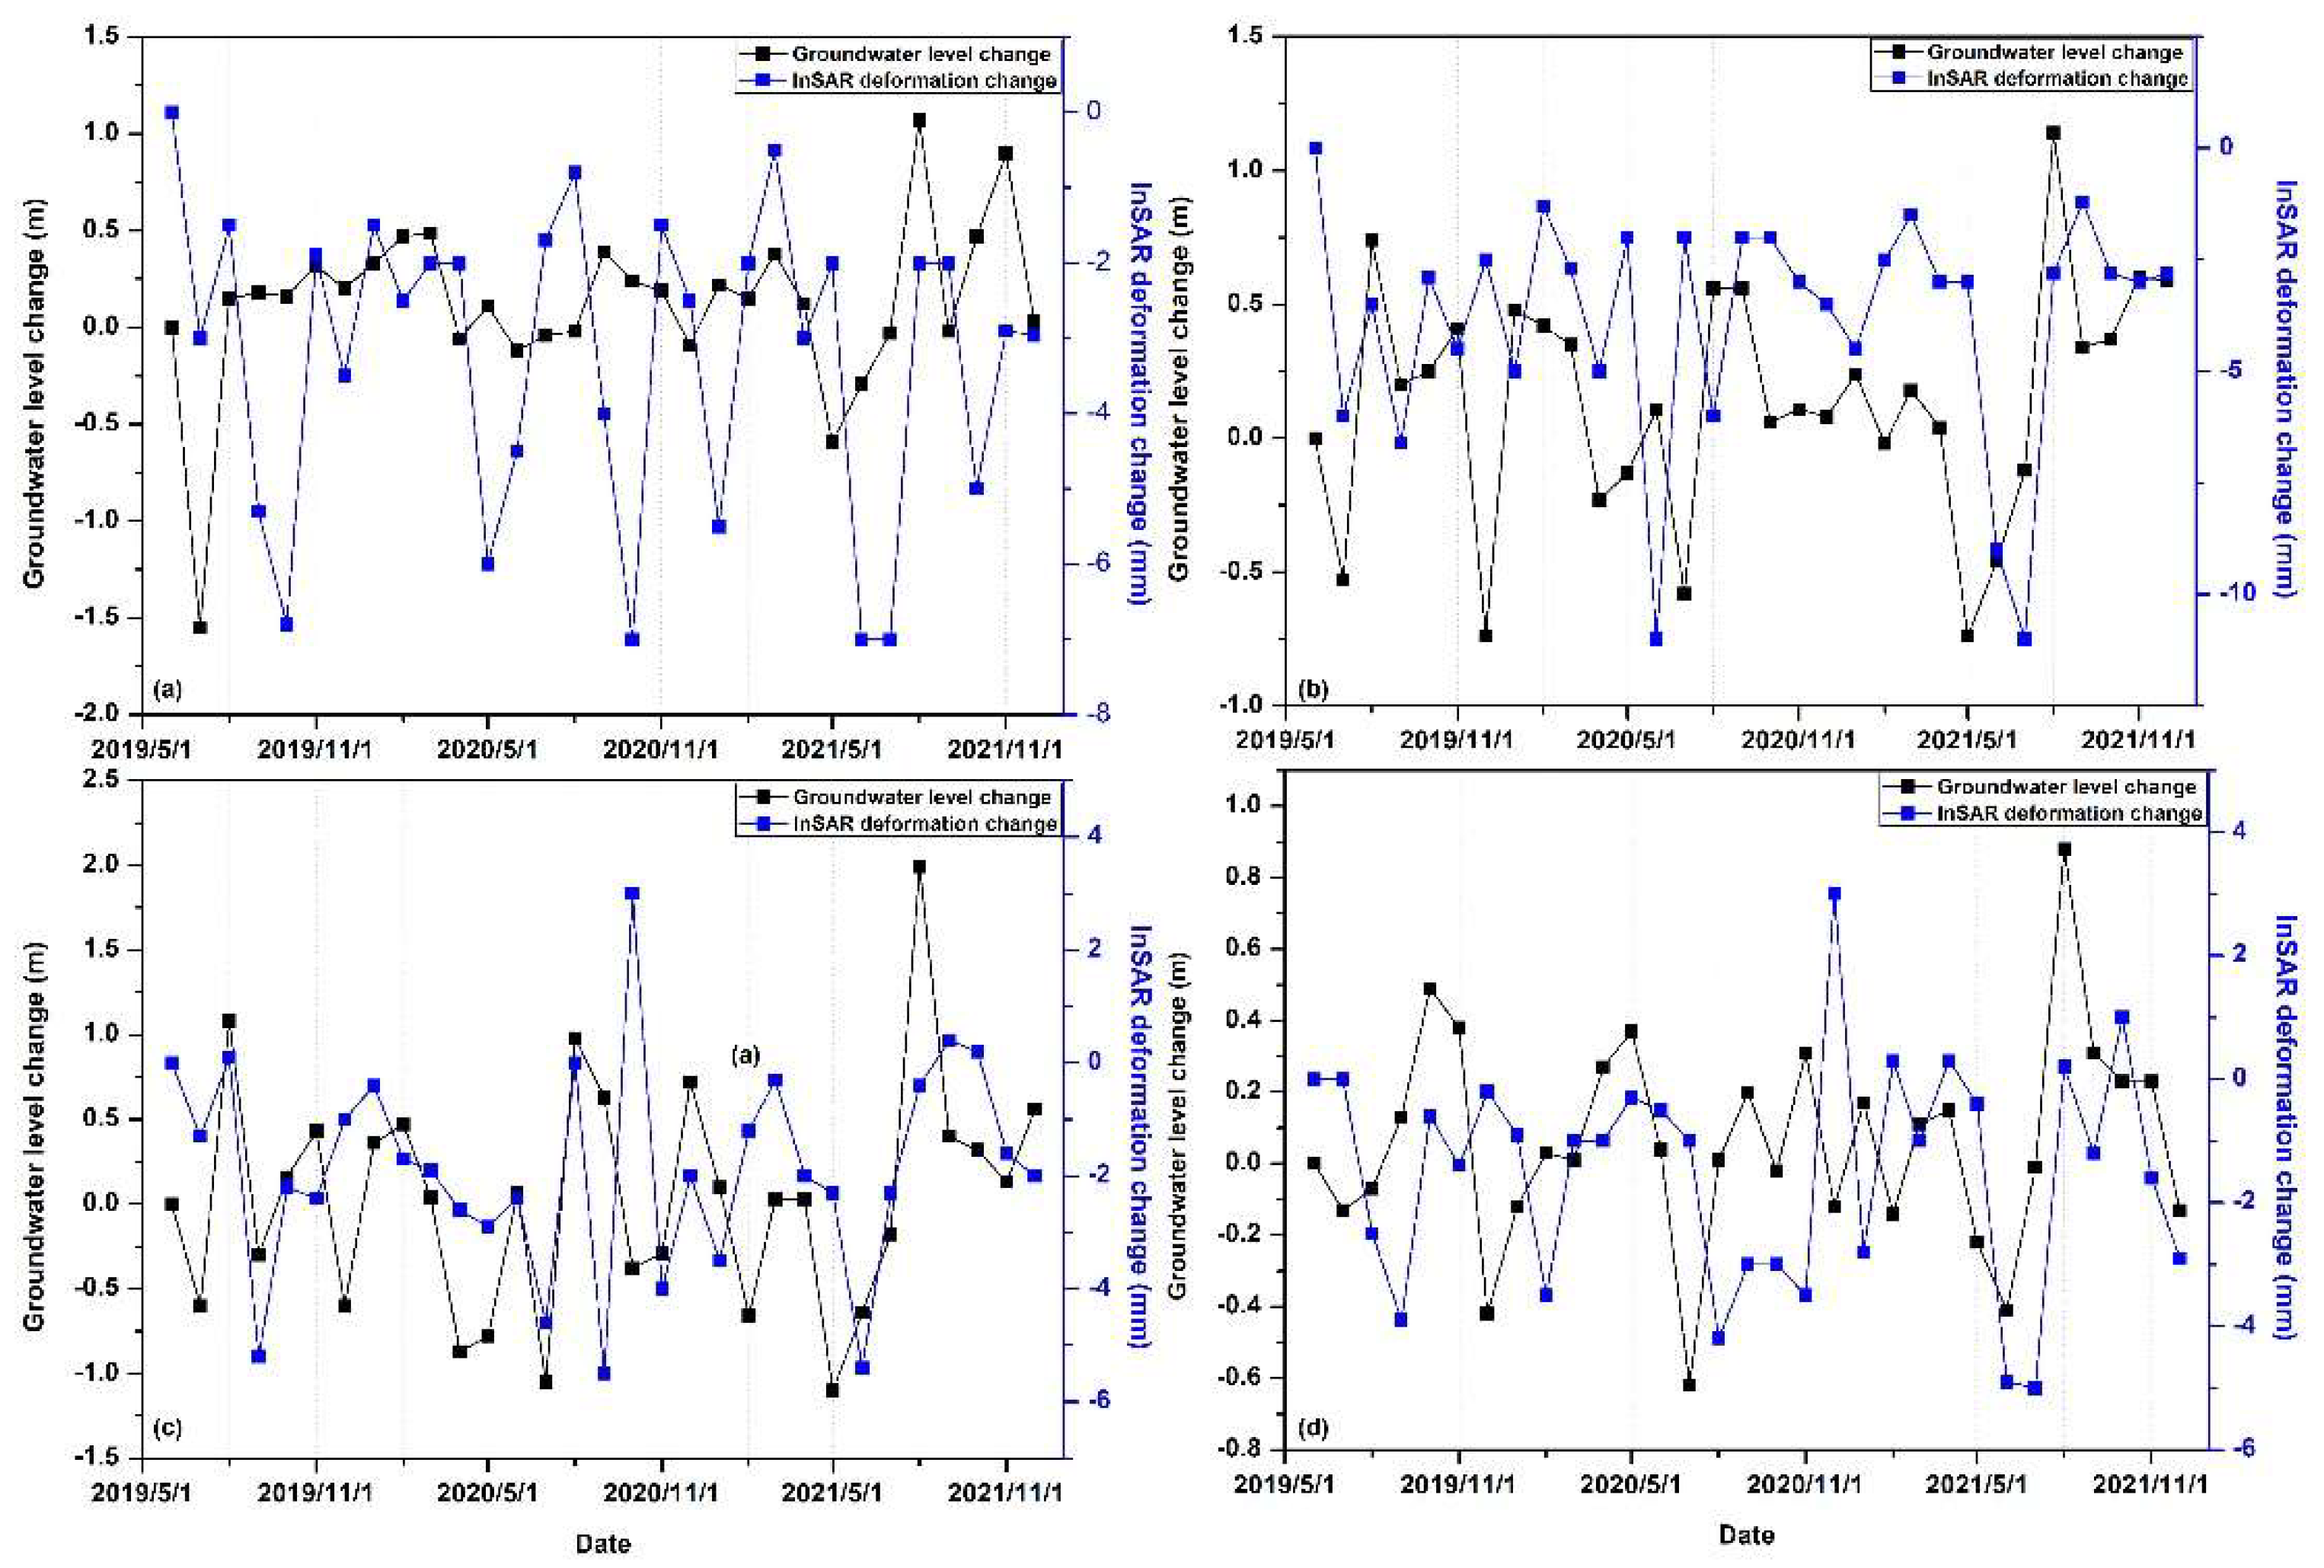
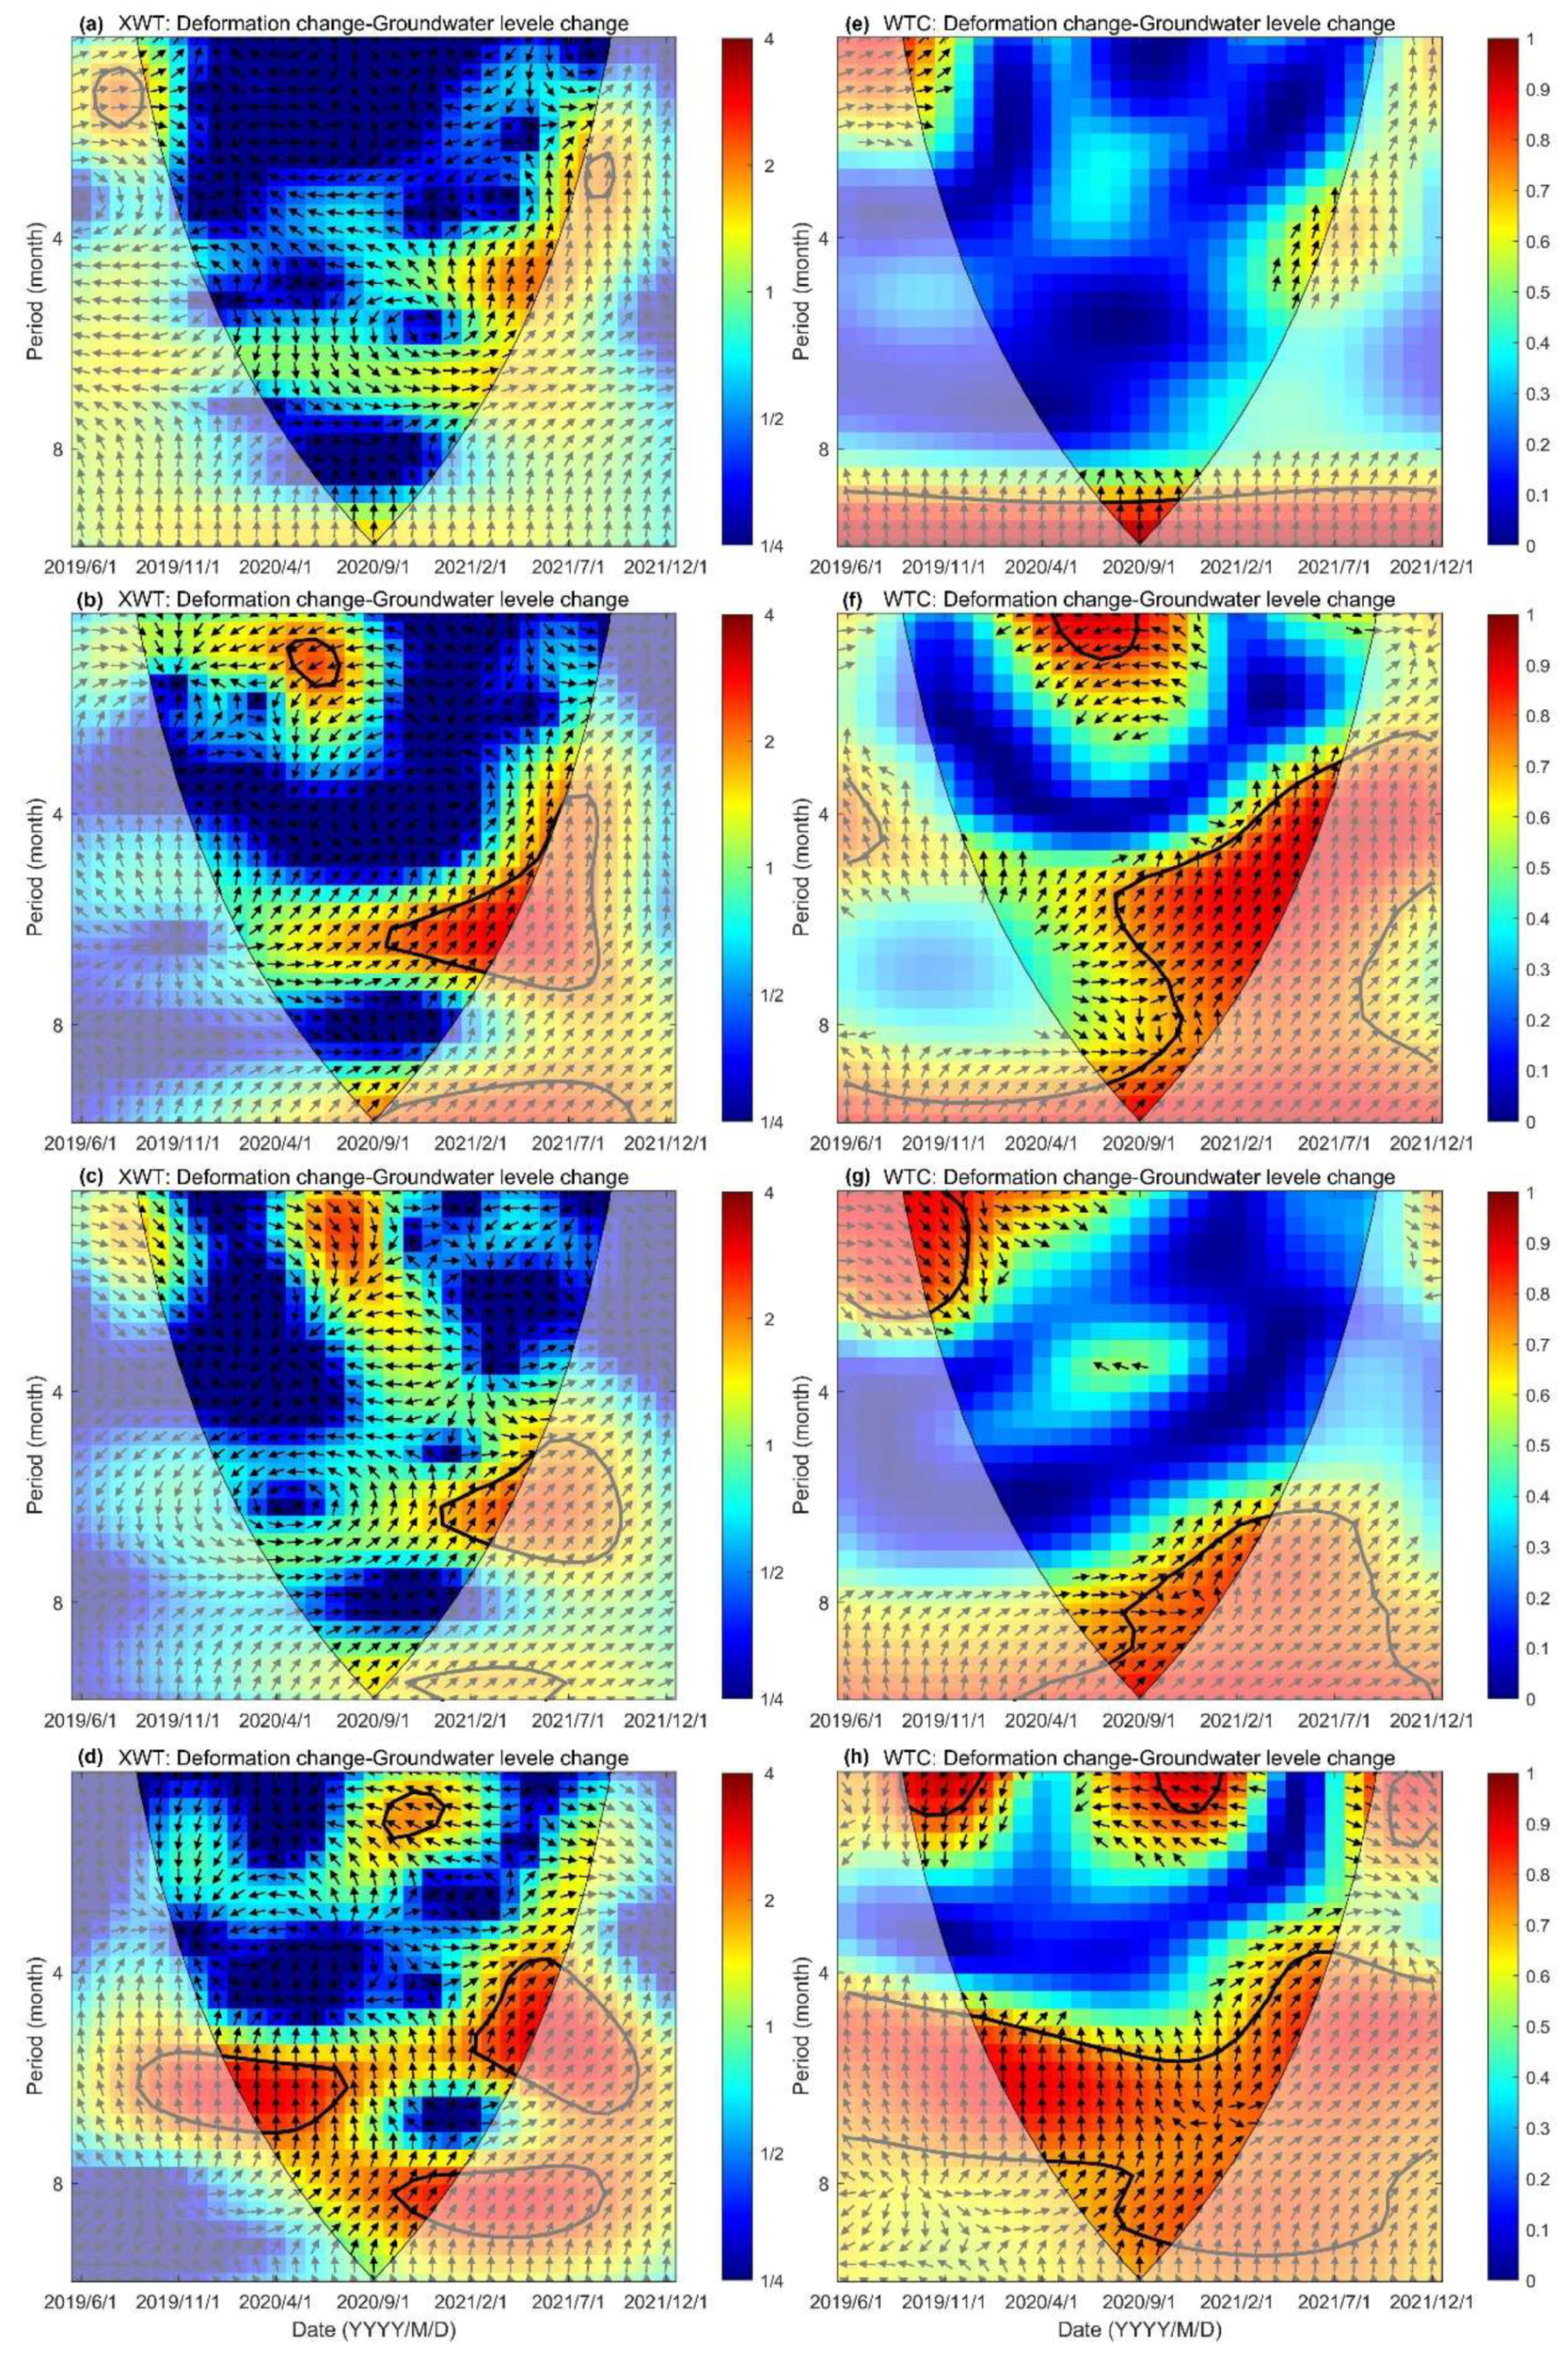
5.1. Cross Wavelet Transform (XWT) and Wavelet Transform Coherence (WTC) on Groundwater Level Change and InSAR-Derived Deformation
5.2. Correlation between Land Subsidence and Faults
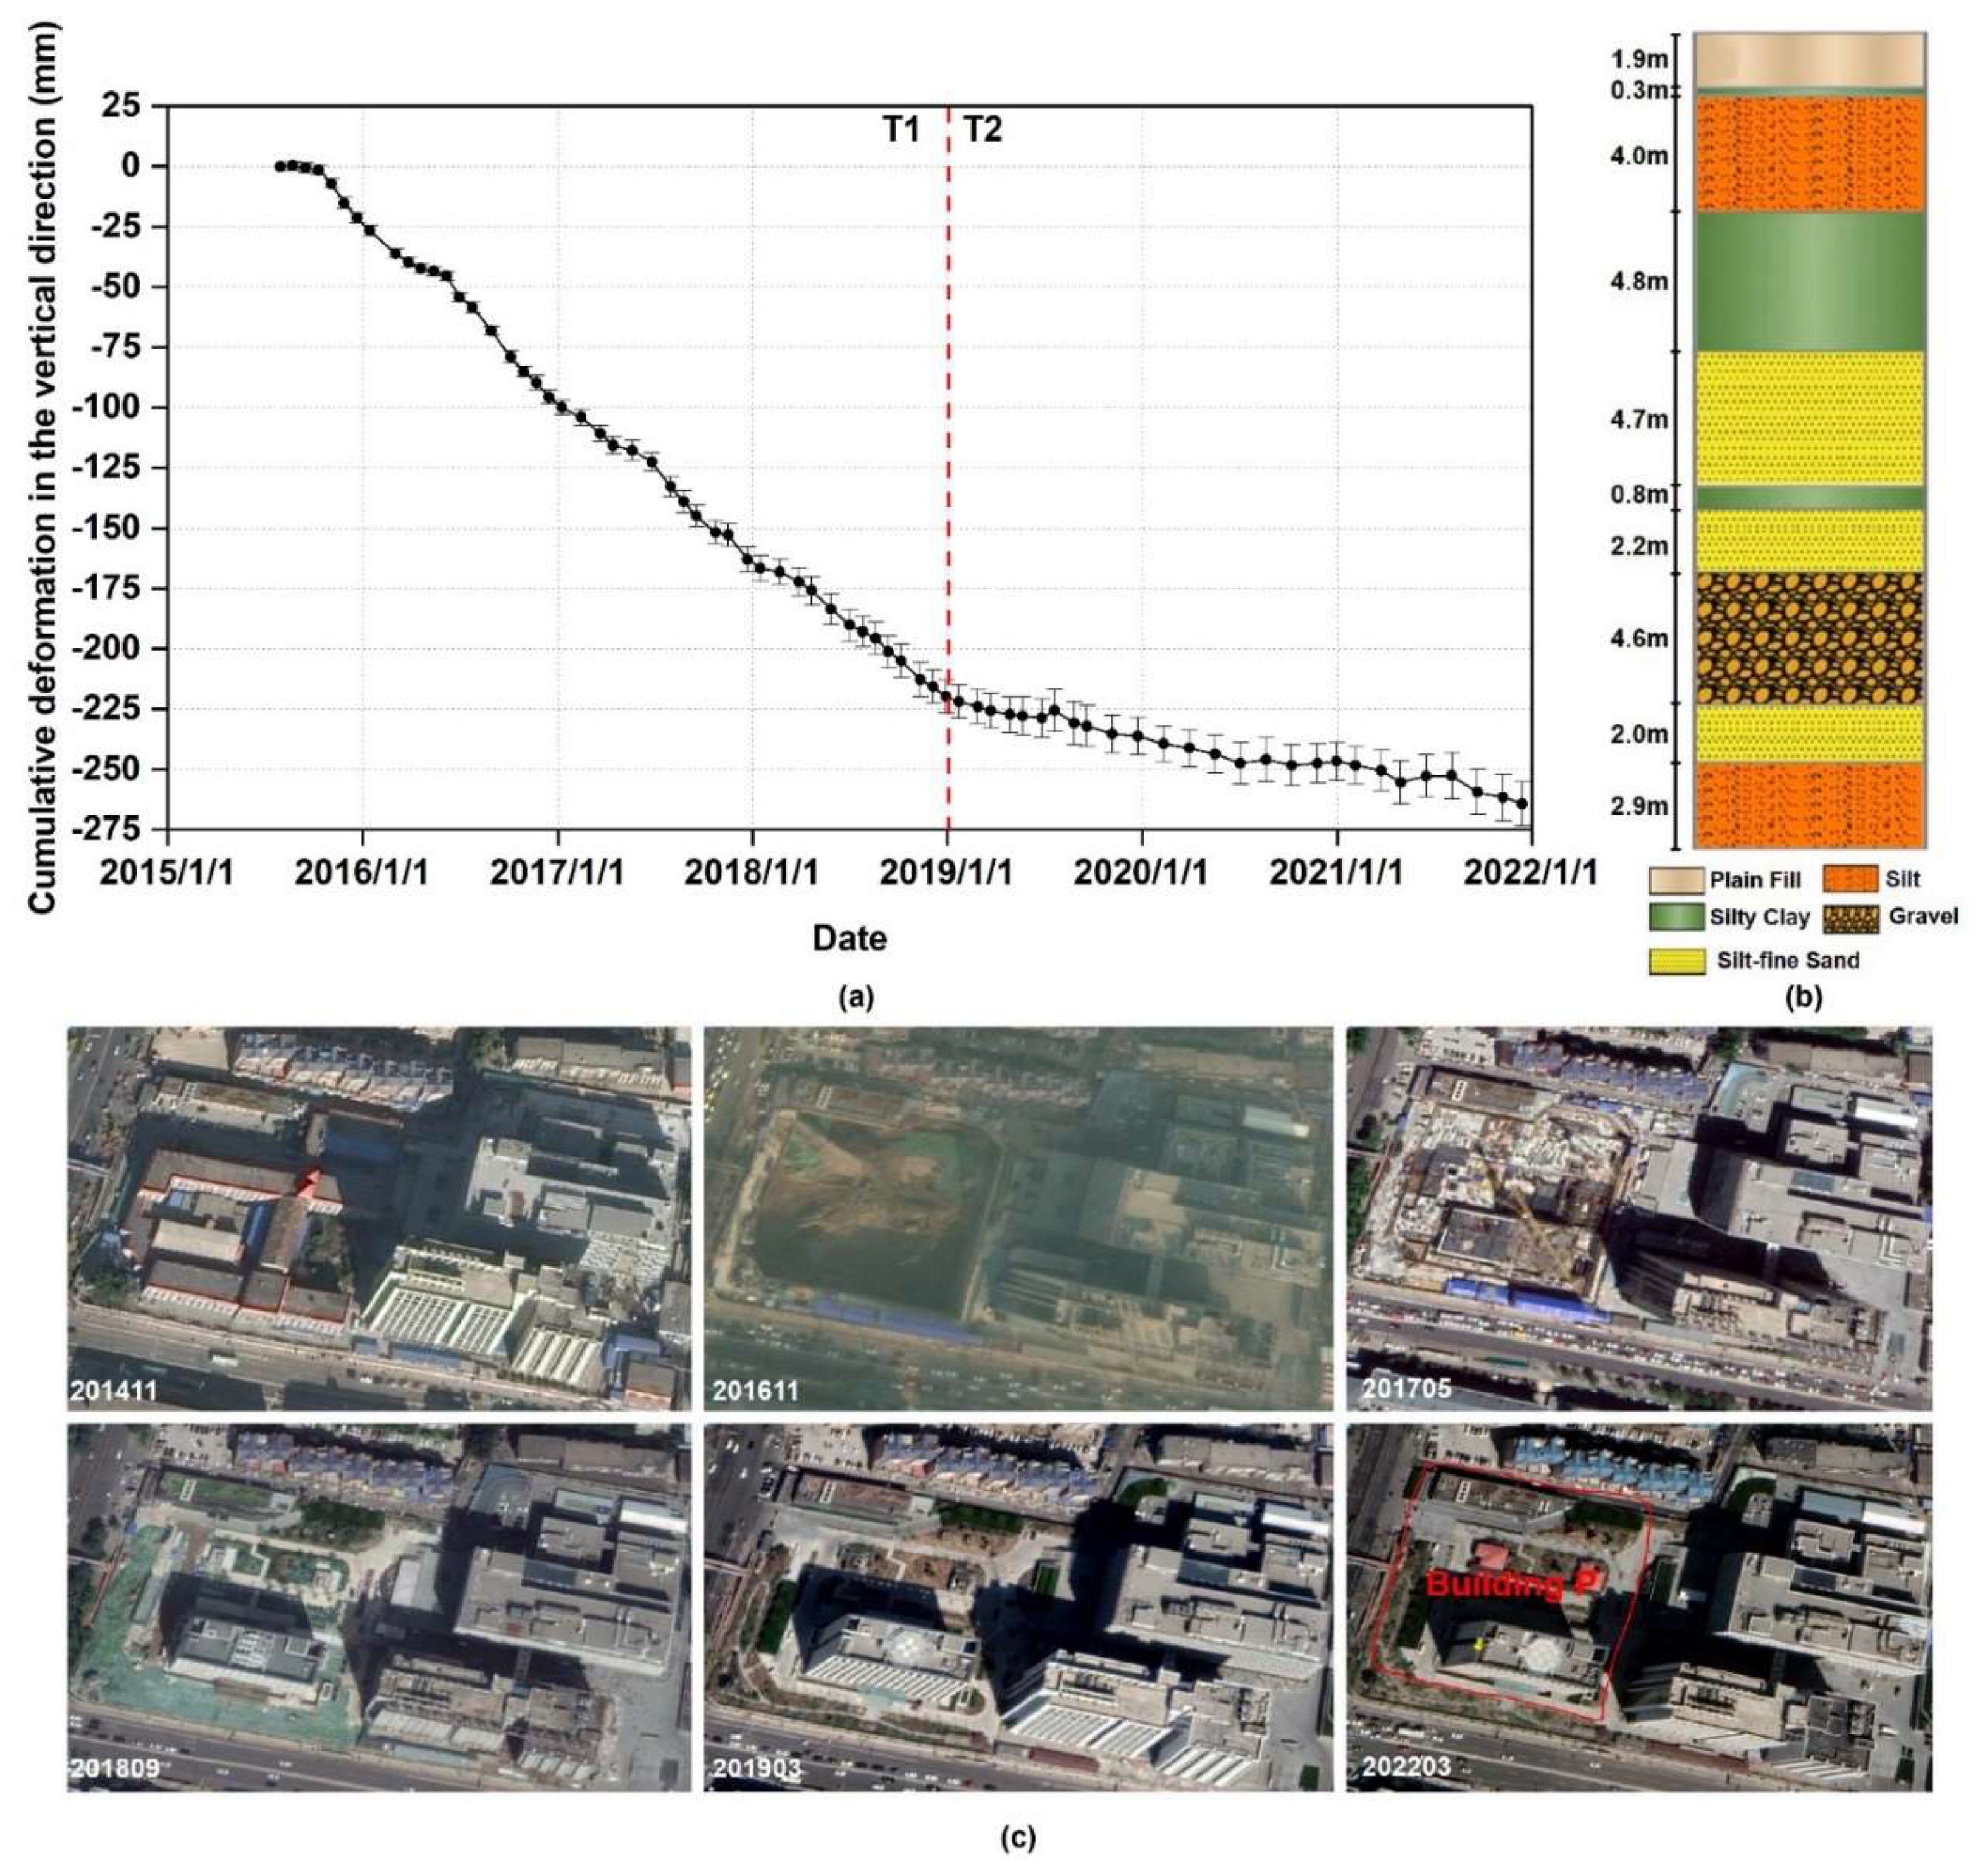
5.3. Correlation between Land Subsidence and Urban Expansion in Beijing’s Sub-Administrative Center
6. Conclusions
Author Contributions
Funding
Data Availability Statement
Conflicts of Interest
References
- Herrera-García, G.; Ezquerro, P.; Tomás, R.; Béjar-Pizarro, M.; López-Vinielles, J.; Rossi, M.; Mateos, R.M.; Carreón-Freyre, D.; Lambert, J.; Teatini, P.; et al. Mapping the global threat of land subsidence. Science 2021, 371, 34–36. [Google Scholar] [CrossRef] [PubMed]
- Cigna, F.; Tapete, D. Present-day land subsidence rates, surface faulting hazard and risk in Mexico City with 2014–2020 Sentinel-1 IW InSAR. Remote Sens. Environ. 2021, 253, 112161. [Google Scholar] [CrossRef]
- Castellazzi, P.; Arroyo-Domínguez, N.; Martel, R.; Calderhead, A.I.; Normand, J.C.L.; Gárfias, J.; Rivera, A. Land subsidence in major cities of Central Mexico: Interpreting InSAR-derived land subsidence mapping with hydrogeological data. Int. J. Appl. Earth Obs. Geoinf. 2016, 47, 102–111. [Google Scholar] [CrossRef]
- Cigna, F.; Osmanoglu, B.; Cabral-Cano, E.; Dixon, T.H.; Avila-Olivera, J.A.; Garduno-Monroy, V.H.; DeMets, C.; Wdowinski, S. Monitoring land subsidence and its induced geological hazard with Synthetic Aperture Radar Interferometry: A case study in Morelia, Mexico. Remote Sens. Environ. 2012, 117, 146–161. [Google Scholar] [CrossRef]
- Qu, F.; Lu, Z.; Zhang, Q.; Bawden, G.W.; Kim, J.W.; Zhao, C.; Qu, W. Mapping ground deformation over Houston-Galveston, Texas using multi-temporal InSAR. Remote Sens. Environ. 2015, 169, 290–306. [Google Scholar] [CrossRef]
- Peng, M.; Lu, Z.; Zhao, C.; Motagh, M.; Bai, L.; Conway, B.D.; Chen, H. Mapping land subsidence and aquifer system properties of the Willcox Basin, Arizona, from InSAR observations and independent component analysis. Remote Sens. Environ. 2022, 271, 112894. [Google Scholar] [CrossRef]
- Fiaschi, S.; Fabris, M.; Floris, M.; Achilli, V. Estimation of land subsidence in deltaic areas through differential SAR interferometry: The Po River Delta case study (Northeast Italy). Int. J. Remote Sens. 2018, 39, 8724–8745. [Google Scholar] [CrossRef]
- Yastika, P.E.; Shimizu, N.; Abidin, H.Z. Monitoring of long-term land subsidence from 2003 to 2017 in coastal area of Semarang, Indonesia by SBAS DInSAR analyses using Envisat-ASAR, ALOS-PALSAR, and Sentinel-1A SAR data. Adv. Space Res. 2019, 63, 1719–1736. [Google Scholar] [CrossRef]
- Guo, L.; Gong, H.; Li, J.; Zhu, L.; Xue, A.; Liao, L.; Sun, Y.; Li, Y.; Zhang, Z.; Hu, L.; et al. Understanding uneven land subsidence in Beijing, China, using a novel combination of geophysical prospecting and InSAR. Geophys. Res. Lett. 2020, 47, e2020GL088676. [Google Scholar] [CrossRef]
- Zhou, C.; Gong, H.; Chen, B.; Gao, M.; Cao, Q.; Cao, J.; Duan, L.; Zuo, J.; Shi, M. Land subsidence response to different land use types and water resource utilization in Beijing-Tianjin-Hebei, China. Remote Sens. 2020, 12, 457. [Google Scholar] [CrossRef]
- Zhou, C.; Gong, H.; Chen, B.; Li, J.; Gao, M.; Zhu, F.; Chen, W.; Liang, Y. InSAR time-series analysis of land subsidence under different land use types in the eastern Beijing Plain, China. Remote Sens. 2017, 9, 380. [Google Scholar] [CrossRef]
- Zhou, C.; Gong, H.; Zhang, Y.; Warner, T.; Wang, C. Spatiotemporal evolution of land subsidence in the Beijing Plain 2003–2015 using Persistent Scatterer Interferometry (PSI) with multi-source SAR data. Remote Sens. 2018, 10, 552. [Google Scholar] [CrossRef]
- Chen, M.; Tomás, R.; Li, Z.; Motagh, M.; Li, T.; Hu, L.; Gong, H.; Li, X.; Yu, J.; Gong, X. Imaging land subsidence induced by groundwater extraction in Beijing (China) using satellite radar interferometry. Remote Sens. 2016, 8, 468. [Google Scholar] [CrossRef]
- Du, Z.; Ge, L.; Ng, A.H.M.; Lian, X.; Zhu, Q.; Horgan, F.G.; Zhang, Q. Analysis of the impact of the South-to-North water diversion project on water balance and land subsidence in Beijing, China between 2007 and 2020. J. Hydrol. 2021, 603, 126990. [Google Scholar] [CrossRef]
- Gao, M.; Gong, H.; Chen, B.; Li, X.; Zhou, C.; Shi, M.; Si, Y.; Chen, Z.; Duan, G. Regional land subsidence analysis in eastern Beijing plain by InSAR time series and wavelet transforms. Remote Sens. 2018, 10, 365. [Google Scholar] [CrossRef]
- Zhu, L.; Gong, H.; Li, X.; Wang, R.; Chen, B.; Dai, Z.; Teatini, P. Land subsidence due to groundwater withdrawal in the northern Beijing plain, China. Eng. Geol. 2015, 193, 243–255. [Google Scholar] [CrossRef]
- Yang, M.; Yang, T.; Zhang, L.; Lin, J.; Qin, X.; Liao, M. Spatio-temporal characterization of a reclamation settlement in the Shanghai coastal area with time series analyses of X-, C-, and L-band SAR datasets. Remote Sens. 2018, 10, 329. [Google Scholar] [CrossRef]
- Qu, F.; Zhang, Q.; Lu, Z.; Zhao, C.; Yang, C.; Zhang, J. Land subsidence and ground fissures in Xi’an, China 2005–2012 revealed by multi-band InSAR time-series analysis. Remote Sens. Environ. 2014, 155, 366–376. [Google Scholar] [CrossRef]
- Zhao, Y.; Zhou, L.; Wang, C.; Li, J.; Qin, J.; Sheng, H.; Huang, L.; Li, X. Analysis of the spatial and temporal evolution of land subsidence in Wuhan, China from 2017 to 2021. Remote Sens. 2022, 14, 3142. [Google Scholar] [CrossRef]
- Liu, Y.; Zhao, C.; Zhang, Q.; Yang, C.; Zhang, J. Land subsidence in Taiyuan, China, monitored by InSAR technique with multisensor SAR datasets from 1992 to 2015. IEEE J. Sel. Top. Appl. Earth Obs. Remote Sens. 2018, 11, 1509–1519. [Google Scholar] [CrossRef]
- Hanssen, R.F. Radar Interferometry: Data Interpretation and Error Analysis; Kluwer Academic Publishers: Dordrecht, The Netherlands, 2001. [Google Scholar]
- Zebker, H.A.; Villasenor, J. Decorrelation in interferometric radar echoes. IEEE Trans. Geosci. Remote Sens. 1992, 30, 950–959. [Google Scholar] [CrossRef]
- Zebker, H.A.; Rosen, P.A.; Hensley, S. Atmospheric effects in interferometric synthetic aperture radar surface deformation and topographic maps. J. Geophys. Res. Solid Earth 1997, 102, 7547–7563. [Google Scholar] [CrossRef]
- Ferretti, A.; Prati, C.; Rocca, F. Nonlinear subsidence rate estimation using permanent scatterers in differential SAR interferometry. IEEE Trans. Geosci. Remote Sens. 2000, 38, 2202–2212. [Google Scholar] [CrossRef]
- Hooper, A.; Segall, P.; Zebker, H. Persistent scatterer interferometric synthetic aperture radar for crustal deformation analysis, with application to Volcán Alcedo, Galápagos. J. Geophys. Res. 2007, 112. [Google Scholar] [CrossRef]
- Zhang, L.; Ding, X.L.; Lu, Z. Modeling the PSInSAR time-series without phase unwrapping. IEEE Trans. Geosci. Remote Sens. 2011, 49, 547–556. [Google Scholar] [CrossRef]
- Berardino, P.; Fornaro, G.; Lanari, R.; Sansosti, E. A new algorithm for surface deformation monitoring based on small baseline differential SAR interferograms. IEEE Trans. Geosci. Remote Sens. 2002, 40, 2375–2383. [Google Scholar] [CrossRef]
- Hetland, E.A.; Musé, P.; Simons, M.; Lin, Y.N.; Agram, P.S.; DiCaprio, C.J. Multiscale InSAR time series (MInTS) analysis of surface deformation. J. Geophys. Res. Solid Earth 2012, 117. [Google Scholar] [CrossRef]
- Samsonov, S.V.; d’lOreye, N.; González, P.J.; Tiampo, K.F.; Ertolahti, L.; Clague, J.J. Rapidly accelerating subsidence in the Greater Vancouver region from two decades of ERS-ENVISAT-RADARSAT-2 DInSAR measurements. Remote Sens. Environ. 2014, 143, 180–191. [Google Scholar] [CrossRef]
- Ferretti, A.; Fumagalli, A.; Novali, F.; Prati, C.; Rocca, F.; Rucci, A. A New algorithm for processing interferometric data-stacks: SqueeSAR. IEEE Trans. Geosci. Remote Sens. 2011, 49, 3460–3470. [Google Scholar] [CrossRef]
- Gong, H.; Pan, Y.; Zheng, L.; Li, X.; Zhu, L.; Zhang, C.; Huang, Z.; Li, Z.; Wang, H.; Zhou, C. Long-term groundwater storage changes and land subsidence development in the North China Plain (1971–2015). Appl. Hydrogeol. 2018, 26, 1417–1427. [Google Scholar] [CrossRef]
- Chen, B.; Gong, H.; Li, X.; Lei, K.; Zhang, Y.; Li, J.; Gu, Z.; Dang, Y. Spatial-temporal characteristics of land subsidence corresponding to dynamic groundwater funnel in Beijing Municipality, China. Chin. Geogr. Sci. 2011, 21, 753–764. [Google Scholar] [CrossRef]
- Ng, A.H.-M.; Ge, L.; Li, X.; Zhang, K. Monitoring ground deformation in Beijing, China with persistent scatterer SAR interferometry. J. Geod. 2012, 86, 375–392. [Google Scholar] [CrossRef]
- Zhang, Y.; Wu, H.; Kang, Y.; Zhu, C. Ground subsidence in the Beijing-Tianjin-Hebei region from 1992 to 2014 revealed by multiple SAR stacks. Remote Sens. 2016, 8, 675. [Google Scholar] [CrossRef]
- Chen, B.; Gong, H.; Li, X.; Lei, K.; Zhu, L.; Gao, M.; Zhou, C. Characterization and causes of land subsidence in Beijing, China. Int. J. Remote Sens. 2017, 38, 808–826. [Google Scholar] [CrossRef]
- Yang, Q.; Ke, Y.; Zhang, D.; Chen, B.; Gong, H.; Lv, M.; Zhu, L.; Li, X. Multi-scale analysis of the relationship between land subsidence and buildings: A case study in an eastern Beijing urban area using the PS-InSAR technique. Remote Sens. 2018, 10, 1006. [Google Scholar] [CrossRef]
- Zhou, C.; Lan, H.; Gong, H.; Zhang, Y.; Warner, T.A.; Clague, J.J.; Wu, Y. Reduced rate of land subsidence since 2016 in Beijing, China: Evidence from Tomo-PSInSAR using RadarSAT-2 and Sentinel-1 datasets. Int. J. Remote Sens. 2020, 41, 1259–1285. [Google Scholar] [CrossRef]
- Duan, L.; Gong, H.; Chen, B.; Zhou, C.; Lei, K.; Gao, M.; Yu, H.; Cao, Q.; Cao, J. An improved multi-sensor MTI time-series fusion method to monitor the subsidence of Beijing Subway Network during the past 15 years. Remote Sens. 2020, 12, 2125. [Google Scholar] [CrossRef]
- Lyu, M.; Ke, Y.; Li, X.; Zhu, L.; Guo, L.; Gong, H. Detection of seasonal deformation of highway overpasses using the PS-InSAR technique: A case study in Beijing urban area. Remote Sens. 2020, 12, 3071. [Google Scholar] [CrossRef]
- Chen, B.; Gong, H.; Chen, Y.; Li, X.; Zhou, C.; Lei, K.; Zhu, L.; Duan, L.; Zhao, X. Land subsidence and its relation with groundwater aquifers in Beijing Plain of China. Sci. Total Environ. 2020, 735, 139111. [Google Scholar] [CrossRef]
- Chen, B.; Gong, H.; Chen, Y.; Lei, K.; Zhou, C.; Si, Y.; Li, X.; Pan, Y.; Gao, M. Investigating land subsidence and its causes along Beijing high-speed railway using multi-platform InSAR and a maximum entropy model. Int. J. Appl. Earth Obs. Geoinf. 2021, 96, 102284. [Google Scholar] [CrossRef]
- Wang, Y.; Bai, Z.; Zhang, Y.; Qin, Y.; Lin, Y.; Li, Y.; Shen, W. Using TerraSAR X-band and Sentinel-1 C-band SAR interferometry for deformation along Beijing-Tianjin Intercity Railway analysis. IEEE J. Sel. Top. Appl. Earth Obs. Remote Sens. 2021, 14, 4832–4841. [Google Scholar] [CrossRef]
- Bai, Z.; Wang, Y.; Balz, T. Beijing land subsidence revealed using PS-InSAR with long time series TerraSAR-X SAR data. Remote Sens. 2022, 14, 2529. [Google Scholar] [CrossRef]
- Zhang, X.; Chen, B.; Gong, H.; Lei, K.; Zhou, C.; Lu, Z.; Zhao, D. Inversion of groundwater storage variations considering lag effect in Beijing plain, from Radarsat-2 with SBAS-InSAR Technology. Remote Sens. 2022, 14, 991. [Google Scholar] [CrossRef]
- Mu, C. Analysis of the influence of South to North Water Transfer on land subsidence in Beijing. Hebei Dizhidaxue Xuebao 2017, 40, 22–27. [Google Scholar]
- Xu, Y.; Wu, W.; Zhang, X.; Ma, S.; Ma, W.; Yu, G.; Gu, M.; Jiang, W. Crust Newly Tectonic Deformation and Earthquake in Capital Zone; Science Press: Beijing, China, 2002. [Google Scholar]
- Lanari, R.; Mora, O.; Manunta, M.; Mallorquí, J.J.; Berardino, P.; Sansosti, E. A small-baseline approach for investigating deformations on full-resolution differential SAR interferograms. IEEE Trans. Geosci. Remote Sens. 2004, 42, 1377–1386. [Google Scholar] [CrossRef]
- Sui, L.; Liu, Y.; Wang, W. Adaptive sequential adjustment and its application. Geomat. Inf. Sci. Wuhan Univ. 2007, 32, 51–54. [Google Scholar]
- Liu, Y.; Qiu, H.; Yang, D.; Liu, Z.; Ma, S.; Pei, Y.; Zhang, J.; Tang, B. Deformation responses of landslides to seasonal rainfall based on InSAR and wavelet analysis. Landslides 2022, 19, 199–210. [Google Scholar] [CrossRef]
- Shirzaei, M. A wavelet-based multitemporal DInSAR algorithm for monitoring ground surface motion. IEEE Geosci. Remote Sens. Lett. 2013, 10, 456–460. [Google Scholar] [CrossRef]
- Tomás, R.; Li, Z.; Lopez-Sanchez, J.M.; Liu, P.; Singleton, A. Using wavelet tools to analyse seasonal variations from InSAR time-series data: A case study of the Huangtupo landslide. Landslides 2016, 13, 437–450. [Google Scholar] [CrossRef]
- Grinsted, A.; Moore, J.C.; Jevrejeva, S. Application of the cross wavelet transform and wavelet coherence to geophysical time series. Nonlinear Proc. Geoph. 2004, 11, 561–566. [Google Scholar] [CrossRef]
- Lei, K.; Ma, F.; Chen, B.; Luo, Y.; Cui, W.; Zhou, Y.; Liu, H.; Sha, T. Three-dimensional surface deformation characteristics based on time series InSAR and GPS technologies in Beijing, China. Remote Sens. 2021, 13, 3964. [Google Scholar] [CrossRef]
- Lu, Z.; Danskin, W.R. InSAR analysis of natural recharge to define structure of a ground-water basin, San Bernardino, California. Geophys. Res. Lett. 2001, 28, 2661–2664. [Google Scholar] [CrossRef]
- Cao, J.; Gong, H.; Chen, B.; Shi, M.; Zhou, C.; Lei, K.; Yu, H.; Sun, Y. Land subsidence in Beijing’s Sub-Administrative Center and its relationship with urban expansion inferred from Sentinel-1/2 observations. Can. J. Remote Sens. 2021, 47, 802–817. [Google Scholar] [CrossRef]
- Terzaghi, K.V. Theoretical Soil Mechanics; John Wiley and Sons: New York, NY, USA, 1943. [Google Scholar]


| Aquifer Group | Main Lithological Features | Burial Depth (m) |
|---|---|---|
| The unconfined aquifer (I) | silt, silty sand and sandy clay | 0~50 |
| The first confined aquifer (II) | multiple types of gravel, sand and clay soil | 80~100 |
| The second confined aquifer (III) | multiple types of gravel, sand and clay soil | 100~180 |
| The third confined aquifer (IV) | mainly sand | 180~300 |
Publisher’s Note: MDPI stays neutral with regard to jurisdictional claims in published maps and institutional affiliations. |
© 2022 by the authors. Licensee MDPI, Basel, Switzerland. This article is an open access article distributed under the terms and conditions of the Creative Commons Attribution (CC BY) license (https://creativecommons.org/licenses/by/4.0/).
Share and Cite
Liu, Y.; Yan, X.; Xia, Y.; Liu, B.; Lu, Z.; Yu, M. Characterizing Spatiotemporal Patterns of Land Subsidence after the South-to-North Water Diversion Project Based on Sentinel-1 InSAR Observations in the Eastern Beijing Plain. Remote Sens. 2022, 14, 5810. https://doi.org/10.3390/rs14225810
Liu Y, Yan X, Xia Y, Liu B, Lu Z, Yu M. Characterizing Spatiotemporal Patterns of Land Subsidence after the South-to-North Water Diversion Project Based on Sentinel-1 InSAR Observations in the Eastern Beijing Plain. Remote Sensing. 2022; 14(22):5810. https://doi.org/10.3390/rs14225810
Chicago/Turabian StyleLiu, Yuanyuan, Xia Yan, Yuanping Xia, Bo Liu, Zhong Lu, and Mei Yu. 2022. "Characterizing Spatiotemporal Patterns of Land Subsidence after the South-to-North Water Diversion Project Based on Sentinel-1 InSAR Observations in the Eastern Beijing Plain" Remote Sensing 14, no. 22: 5810. https://doi.org/10.3390/rs14225810
APA StyleLiu, Y., Yan, X., Xia, Y., Liu, B., Lu, Z., & Yu, M. (2022). Characterizing Spatiotemporal Patterns of Land Subsidence after the South-to-North Water Diversion Project Based on Sentinel-1 InSAR Observations in the Eastern Beijing Plain. Remote Sensing, 14(22), 5810. https://doi.org/10.3390/rs14225810