Article

Estimation of the Mass Concentration of Volcanic Ash Using Ceilometers: Study of Fresh and Transported Plumes from La Palma Volcano

by
Andres E. Bedoya-Velásquez
1,
Manuela Hoyos-Restrepo
1,
Africa Barreto
2,
Rosa D. García
2,3,
Pedro Miguel Romero-Campos
2,
Omaira García
2,
Ramón Ramos
2,
Reijo Roininen
4,
Carlos Toledano
5,
Michaël Sicard
6,7 and
Romain Ceolato
1,*
1
ONERA, The French Aerospace Lab, Universite de Toulouse, FR 31055 Toulouse, France
2
Izaña Atmospheric Research Center (IARC), Agencia Estatal de Meteorología (AEMET), 38001 Santa Cruz de Tenerife, Spain
3
TRAGSATEC, 28006 Madrid, Spain
4
Vaisala Oyj, 01670 Vantaa, Finland
5
Grupo de Óptica Atmosférica, Universidad de Valladolid, 47011 Valladolid, Spain
6
CommSensLab, Department of Signal Theory and Communications, Universitat Politècnica de Catalunya, 08034 Barcelona, Spain
7
Ciències i Tecnologies de l’Espai-Centre de Recerca de l’Aeronàutica i de l’Espai/Institut d’Estudis Espacials de Catalunya (CTE-CRAE/IEEC), Universitat Politècnica de Catalunya, 08034 Barcelona, Spain
*
Author to whom correspondence should be addressed.
Remote Sens. 2022, 14(22), 5680; https://doi.org/10.3390/rs14225680
Submission received: 23 September 2022 / Revised: 26 October 2022 / Accepted: 4 November 2022 / Published: 10 November 2022
(This article belongs to the Special Issue Selected Papers of the European Lidar Conference)

Abstract

:
This study presents a synergistic approach to the study of the aerosol optical and microphysical properties measured in La Palma, Spain, during the 2021 eruption of the Cumbre Vieja volcano (from 19 September to 13 December 2021). This study aims to characterize the different phases of the volcanic eruption using the spatio-temporal evolution of the event together with the mass concentration quantification of four different atmospheric layers. The impact of the plume’s pathway that reached the South of France is analyzed. Here, passive and active remote sensors were used, namely CL51 and CL61 ceilometers and AERONET sunphotometers. The attenuated backscattering ranged from 0.8 to 9.1 × 10 6 (msr) 1 and the volume depolarization ratio measured nearby the volcano was up to 0.3. The ash plume remained within the first 4 km agl, with intense episodes that reached mean aerosol optical depth values of up to 0.4. Thirteen study cases were selected where coarse mode was dominant over fine mode. For the data selection, the fine and coarse lidar ratios found were 3.9 ± 0.8 and 21.0 ± 3.8 sr in the north and 6.9 ± 1.8 and 30.1 ± 10.3 sr in the south. The ash mass concentration reached moderate levels with maximum values of up to 313.7 μ gm 3 .

1. Introduction

During a volcanic eruption, large particles with diameters of up to 2 mm and sulfate (SO 4 2 in solution with water) are continuously interacting with SO 2 molecules. When these agents interact with solar radiation, the Earth’s surface cools due to the scattering of the incoming solar radiation [1]. Additionally, due to the complex processes that involve the magma chemistry and the mechanisms of ejection and emissions, terrestrial and marine ecosystems can be affected, as well as cloud formation and human health [2,3]. Active volcanoes might affect the air quality locally, but due to regional and global wind regimes, ash aerosol can be transported over long-range distances, impacting vast regions. Lastly, one of the main hazards is to aviation because of aircraft mechanical damage and the loss of visibility, causing a reduction in maneuverability by pilots [4,5,6]. However, as stated by [7], significant events of volcanic eruptions that result in hazards to civil or military aviation are scarce compared with thunderstorms, for example. Still, it is necessary to gain knowledge of the impacts of these events in terms of intensity and concentration. By understanding the effects, decision makers can have robust information to reduce the risks and improve the safety procedures proposed mainly by the International Civil Aviation Organisation (ICAO).
To better understand the ash dispersion mechanisms and quantify their impacts on the atmosphere, singular volcanic eruptions have been studied to enrich information about the ash’s optical and microphysical properties [8,9,10]. The lidar (LIght Detection And Ranging) technique has been used to study different volcanic eruptions. However, due to the complexity of the terrain, the magnitude of the risks, and the typical robust multi-wavelength lidar systems, in most cases, only studies of the volcanic ashes transported over long-range distances have been intensely performed. As a result of these measurement campaigns, the primary radiative properties reported are the extinction, backscattering, and volume depolarization ratio profiles and the microphysical properties reported are the modal radius and backscattering/extinction to mass concentration [10,11,12,13]. During this measurement period, passive remote sensors such as sunphotometers have been used in synergy to improve the quality of the vertically retrieved lidar products.
In this work, a volcanic eruption event in the most active zones of the Canary Islands, Cumbre Vieja (La Palma), is studied. This region has been the scenario of 8 out of 17 historical eruptions during the last 600 years [14]. The fissure eruption of the recently named Tajogaite volcano (on the Cumbre Vieja rift) started on 19 September 2021 with peculiar, unexpected features such as an alternating strombolian and effusive character, a long duration (almost three months), a vast erupted volume (more than 200 Mm 3 ), and a considerably low plume injection height (typically observed between 3000 and 3500 m asl) [15,16]. The low injection height strongly impacted air quality, atmospheric chemistry, and civil aviation, as shown by Sicard et al. [13] and Milford et al. [17]. Due to the particularities of the event, a scientific collaboration without precedent between public organizations, research groups, and private companies coordinated by the State Meteorological Agency of Spain (AEMET) was established in the framework of the Aerosol, Clouds, and Trace Gases Research Infrastructure (ACTRIS) and ACTRIS-Spain [18]. Thanks to this collaboration, advanced scientific instrumentation was deployed onsite to study the characteristics of the volcanic event. Particularly, two Vaisala ceilometers (CL51 and CL61) were installed in three places on the island. These low-cost lidar systems can measure continuously and are relatively easy to transport and install, reducing missing data, considering events of such magnitude. Furthermore, these instruments can measure the attenuated backscatter—the CL61 version measures the volume depolarization ratio—in a high spatio-temporal resolution compared with typical lidar systems, allowing us to analyze the spatio-temporal evolution of the plume.
The manuscript is organized as follows. The sites and instrumentation are referred to in Section 2. Section 3 describes the methodology. Section 4 is dedicated to the results and a discussion about the columnar and integrated products from active and passive remote sensors; it also presents a detected ash transport event that reached Toulouse. Lastly, Section 5 presents the main conclusions.

2. Sites and Instrumentation

2.1. Measurement Sites Description

In this work, we analyzed the columnar-integrated and vertically-resolved aerosol optical and microphysical properties at four stations in La Palma, as shown in Figure 1. Black and purple stars, respectively, highlight the ceilometers and sunphotometers that were used. The geo-localizations of the instruments were Roque de los Muchachos high-mountain observatory (28 ° 45 16.92 N, 17 ° 53 6 W, 2423 m asl); Fuencaliente (28 ° 29 13.2 N, 17 ° 50 56.4 W, 630 m asl) on the southern flank of La Palma; La Palma Airport (28 ° 37 15.8 N, 17 ° 45 11.1 W, 56 m asl) on the eastern side of the island; and El Paso (28 ° 39 05 N, 17 ° 52 50 W, 700 m asl) in the central-northern side of La Palma, 3 km away from the volcanic vents. La Palma Island is part of the archipelago of the Canary Islands, and it is located in the subtropical eastern North Atlantic, roughly 450 km from the African coast. This region is characterized by a significantly stable and well-stratified lower troposphere [19,20]. The aerosol climatology is dominated by background marine conditions associated with the northeast trade wind regime, with Saharan dust contributing throughout the year, peaking in winter [21].
The case study of the volcanic ash trajectory was carried out in a lidar site located at ONERA, the French Aerospace Lab in Toulouse, Occitanie, France (43 ° 34 12 N, 1 ° 28 24 E, 160 m asl). Toulouse is a region with a humid subtropical climate dominated by the Autan wind, which is a south-easterly wind from the Mediterranean. Due to the Garonne river that divides the city between east and west, crossing it from south to north, Toulouse presents rather high relative humidity (around 80%) almost throughout the year, leading to hot summers and cold winters. At ONERA, the LISAR research platform (LIght-scattering by Surfaces and Aerosols for Remote-sensing) investigates the elastic light-scattering properties of aerosols for active remote-sensing instruments. In this work, as part of the instruments of the platform, a Vaisala CL51 ceilometer and a ground-based RPG-HATPRO microwave radiometer located on the rooftop of the building were used.

2.2. AERONET Sunphotometers

Aerosol optical and microphysical properties were obtained from AERONET (Aerosol Robotic Network) data version 3 level 1.5 at three sites. In Spain, we used data from La_Palma station (LP) at Fuencaliente and Roque_muchachos (RM) at Roque de Los Muchachos, whereas in France, the Toulouse_MF site was used. These measurements were carried out with two Cimel CE318-TS9 radiometers [22,23] able to perform automatic sun–sky–lunar measurements at nine spectral bands centered at 340, 380, 440, 500, 675, 870, 937, 1020, and 1640 nm (nominal wavelengths). In addition, the fine (lower than 1 μ m) and coarse (larger than 1 μ m) modes of aerosol optical depth (AOD) at 500 nm were retrieved from the spectral deconvolution algorithm (SDA) [24]; however, the cutoff radius can slightly change to improve the integration limits of the calculation. Further, version 3 level 1.5 inversion products such as the volume concentration [25,26] were also used in this study. To be consistent with the calculations, the AOD is often interpolated to the wavelength of need using the Ångström exponent within the spectral ranges of interest.

2.3. Vaisala Ceilometers

Three Vaisala ceilometers were used to study the volcanic eruption in La Palma and analyze the aerosol transport from there to France, namely CL51/CL61. Both systems use a pulsed laser diode to emit light toward the atmosphere. Light backscattering caused by clouds, precipitation, or atmospheric aerosols is analyzed and used to determine the spatio-temporal distribution of these atmospheric agents. Ceilometers are fully automatic lidar systems with field-proven operation 24 h a day, 7 days a week in all weather conditions. The wavelengths of the CL51 and CL61 ceilometers are 905 ± 10 nm and 910.55 ± 0.05 nm, respectively. The spatial resolutions used are 10 m and 4.8 m for the CL51 and CL61 respectively; the temporal resolution for the CL51 was set to 1 minute/profile and for the CL61 to 5 s/profile for backscattering and 10 s/profile for depolarization. The CL61 is a ceilometer model with extra aerosol products such as a volume depolarization ratio ( δ ) and higher spatio-temporal resolution. Further information can be obtained from the manufacturer’s manual.

3. Methodology

In this manuscript, three different ceilometers are used, two for characterizing the La Palma volcanic eruption and the other to study the volcanic plume’s transport. The data sets were treated separately to work with the three ceilometers. As can be seen in Figure 2, for the ceilometers installed at La Palma, we used the attenuated backscattering ( β a t t ) profiles (CL51 and CL61) and the volume depolarization ratio δ profiles (CL61). β a t t profiles were available since the instrument radiometric calibration constant was known with an order of magnitude of up to 10 8 . The use of β a t t allowed for the synoptic analysis of the volcanic event and quantification of the columnar and intensive aerosol radiative properties. To reduce notation, β a t t is referred to as β from here forward. The data for ONERA’s CL51 were fully processed for the dates of interest when the event was detected. The aerosol backscatter coefficient ( β a ) was calculated using the methodology proposed in [27] at the ONERA site.
Considering the volume of the data set, the synoptic analysis was carried out by taking the hourly means of the β profiles to work with the same temporal resolution among the instruments and improve the signal-to-noise ratio (SNR). As part of the data post-processing, the hourly averaged signals were used to determine the ash layer heights using the continuous Wavelet Covariance Transform (WCT) method [28,29,30]. This calculation allowed us to study the ash plume mean height variability during the event, establishing the limits of the plume height. For applying the WCT method, we followed some of the steps proposed in the structure of the atmosphere algorithm (STRAT) [30], i.e., the SNR and molecular reference zones. Then, we applied the WCT from the maximum height of the aerosol layers we considered (acting as a cloud filter) to the minimum height of the layers (always above the planetary boundary layer height). This is defined as the up-to-down method in Figure 2. These limits allowed us to center the calculations on the aerosol layers of interest.
The ash layer height (AsLH) was also used to determine the limits for the atmospheric column for which the β profiles were considered for further integration. As a result, the first 5 km of the air column was used for the β integration in order to combine with the sunphotometer products such as the AOD, AOD fine and coarse modes, and volume concentration. The AOD fine and coarse modes give us the traceability of the volcanic emission for the fine particles linked mainly with sulfate dioxide (SO 2 ) emissions and coarse ash particles. Both types of particles are always involved in a volcanic emission event and due to homogeneous and heterogeneous nucleation and coagulation processes, they can mix, travel, and be deposited on the ground by gravity.
Based on the selection made for the AOD fine and coarse modes, further properties can be retrieved such as the lidar ratio and mass concentration [31,32]. To do this, the optical columnar properties were extrapolated at 910 nm by following the well-known Ångström law. Particularly for the fine and coarse mode fractions, the outputs from the spectral deconvolution algorithm (SDA) developed by [24] combined with the Ångström law were used to roughly estimate the AOD fine and coarse modes at 910 nm [33]. The combination of the AOD 910 and the total integrated β (TIB) allowed us to roughly estimate the lidar ratio during the event, considering scenarios under the ash predominance. This quantification can be done using the following LR definition:
L R = α β = r m i n r m a x α ( r ) d r r m i n r m a x β ( r ) d r = A O D α 910 T I B 910
where the integral limits are defined by the r m i n and r m a x , which depend on the sunphotometer air column from sea level up to 10 km asl. The α coefficient refers to aerosol extinction.
One last calculation includes the mass concentration. This was quantified by implementing the method presented in [8] and considering the densities for fine and coarse ash particles up to 1.5 and 2.6 gcm 3 , respectively. The following expression was used to estimate the mass concentration for fine and coarse modes:
m o ( r ) = β ( r ) · L R · σ e x t 1 [ g · m 3 ]
LR and β (r) were obtained from the synergy between the ceilometers and sunphotometers. m 0 ( r ) is range-dependent due to beta range dependence, but LR and σ e x t 1 result from the volume-to-extinction conversion multiplied by the particle density. In our case, the m 0 ( r ) was calculated for four different air columns, i.e., 0–1, 1–2, 2–3, and 3–4 km asl, based on the results obtained from the AsLH. σ e x t 1 is defined as follows:
σ e x t 1 = C v A O D · ρ [ g · m 2 ]
σ e x t 1 involves the volume concentration C v in units of μ m 3 μ m 2 for fine and coarse modes, and the ash density ( ρ ). The σ e x t is well known as the mass-specific extinction. Equation (2) is consistent with the one used in [32] to retrieve the mass concentration of soot aggregates through the following relation:
m o ( r ) = β ( r ) σ b a c k · [ g · m 3 ]
Lastly, to analyze the transport of the volcanic plume that reached the south of France, we use the TROPOMI (TROPOspheric Monitoring Instrument) instrument [34] onboard the Sentinel-5 Precursor satellite to determine the trajectory and concentration levels of SO 2 . Additionally, we used the HYSPLIT Lagrangian model [35] with a 0.5-degree spatial resolution and 168 h of running time at the height levels of interest.

4. Results and Discussion

This section analyzes the optical and microphysical properties retrieved from the Vaisala ceilometers CL51 and CL61 located in Fuencaliente, the airport, and El Paso, and two sunphotometers located at the RM and LP AERONET stations.

4.1. Characterization of La Palma Volcanic Eruption: Integrated Optical and Microphysical Properties

The AOD 910 , AOD of the fine and coarse modes, and the volume concentration are the products that were analyzed from the sunphotometers, whereas the β integrated within the first 10 km agl was quantified from the ceilometers. Furthermore, having two sunphotometers located at different altitudes modifies the β limits of integration since the altitude of each station must be considered (2.4 km agl for RM and 56 m agl for LP).
The following three relevant aspects can be evaluated thanks to the difference in altitudes and locations of the sunphotometers sites:
  • It is expected that the AOD coarse mode decreases considerably during the days with a low frequency of volcanic particle emissions, impacting the volume concentration modes and modal radii directly. The analysis of the time series of the AOD for different sites over a region might address the conclusions about aerosol transport and the impact on radiative forcing. However, the impacts on global temperature (modifications of the thermal regime over extended areas) require that the magnitude of the event (i) reach extreme AOD values, (ii) pass high atmospheric levels to remain circulating the globe, and (iii) remains for long time periods.
  • Considering that the volcanic activity has some synchronicity at the two sites (see Figure 3), if the top height of these events remained below 2 km, the AOD coarse mode might decrease considerably at RM.
  • An indication of the aerosol transport can be obtained from the LP and RM stations since for days with high volcanic activity (intensity and height), more significant increases in the AOD coarse mode might be detected in one of the stations. Thus, conclusions about the ash transport either to the island’s center-north (RM station) or center-south (LP station) could be addressed. Nevertheless, to determine the direction of the volcanic plume transport, the magnitude and direction of local winds must be considered.
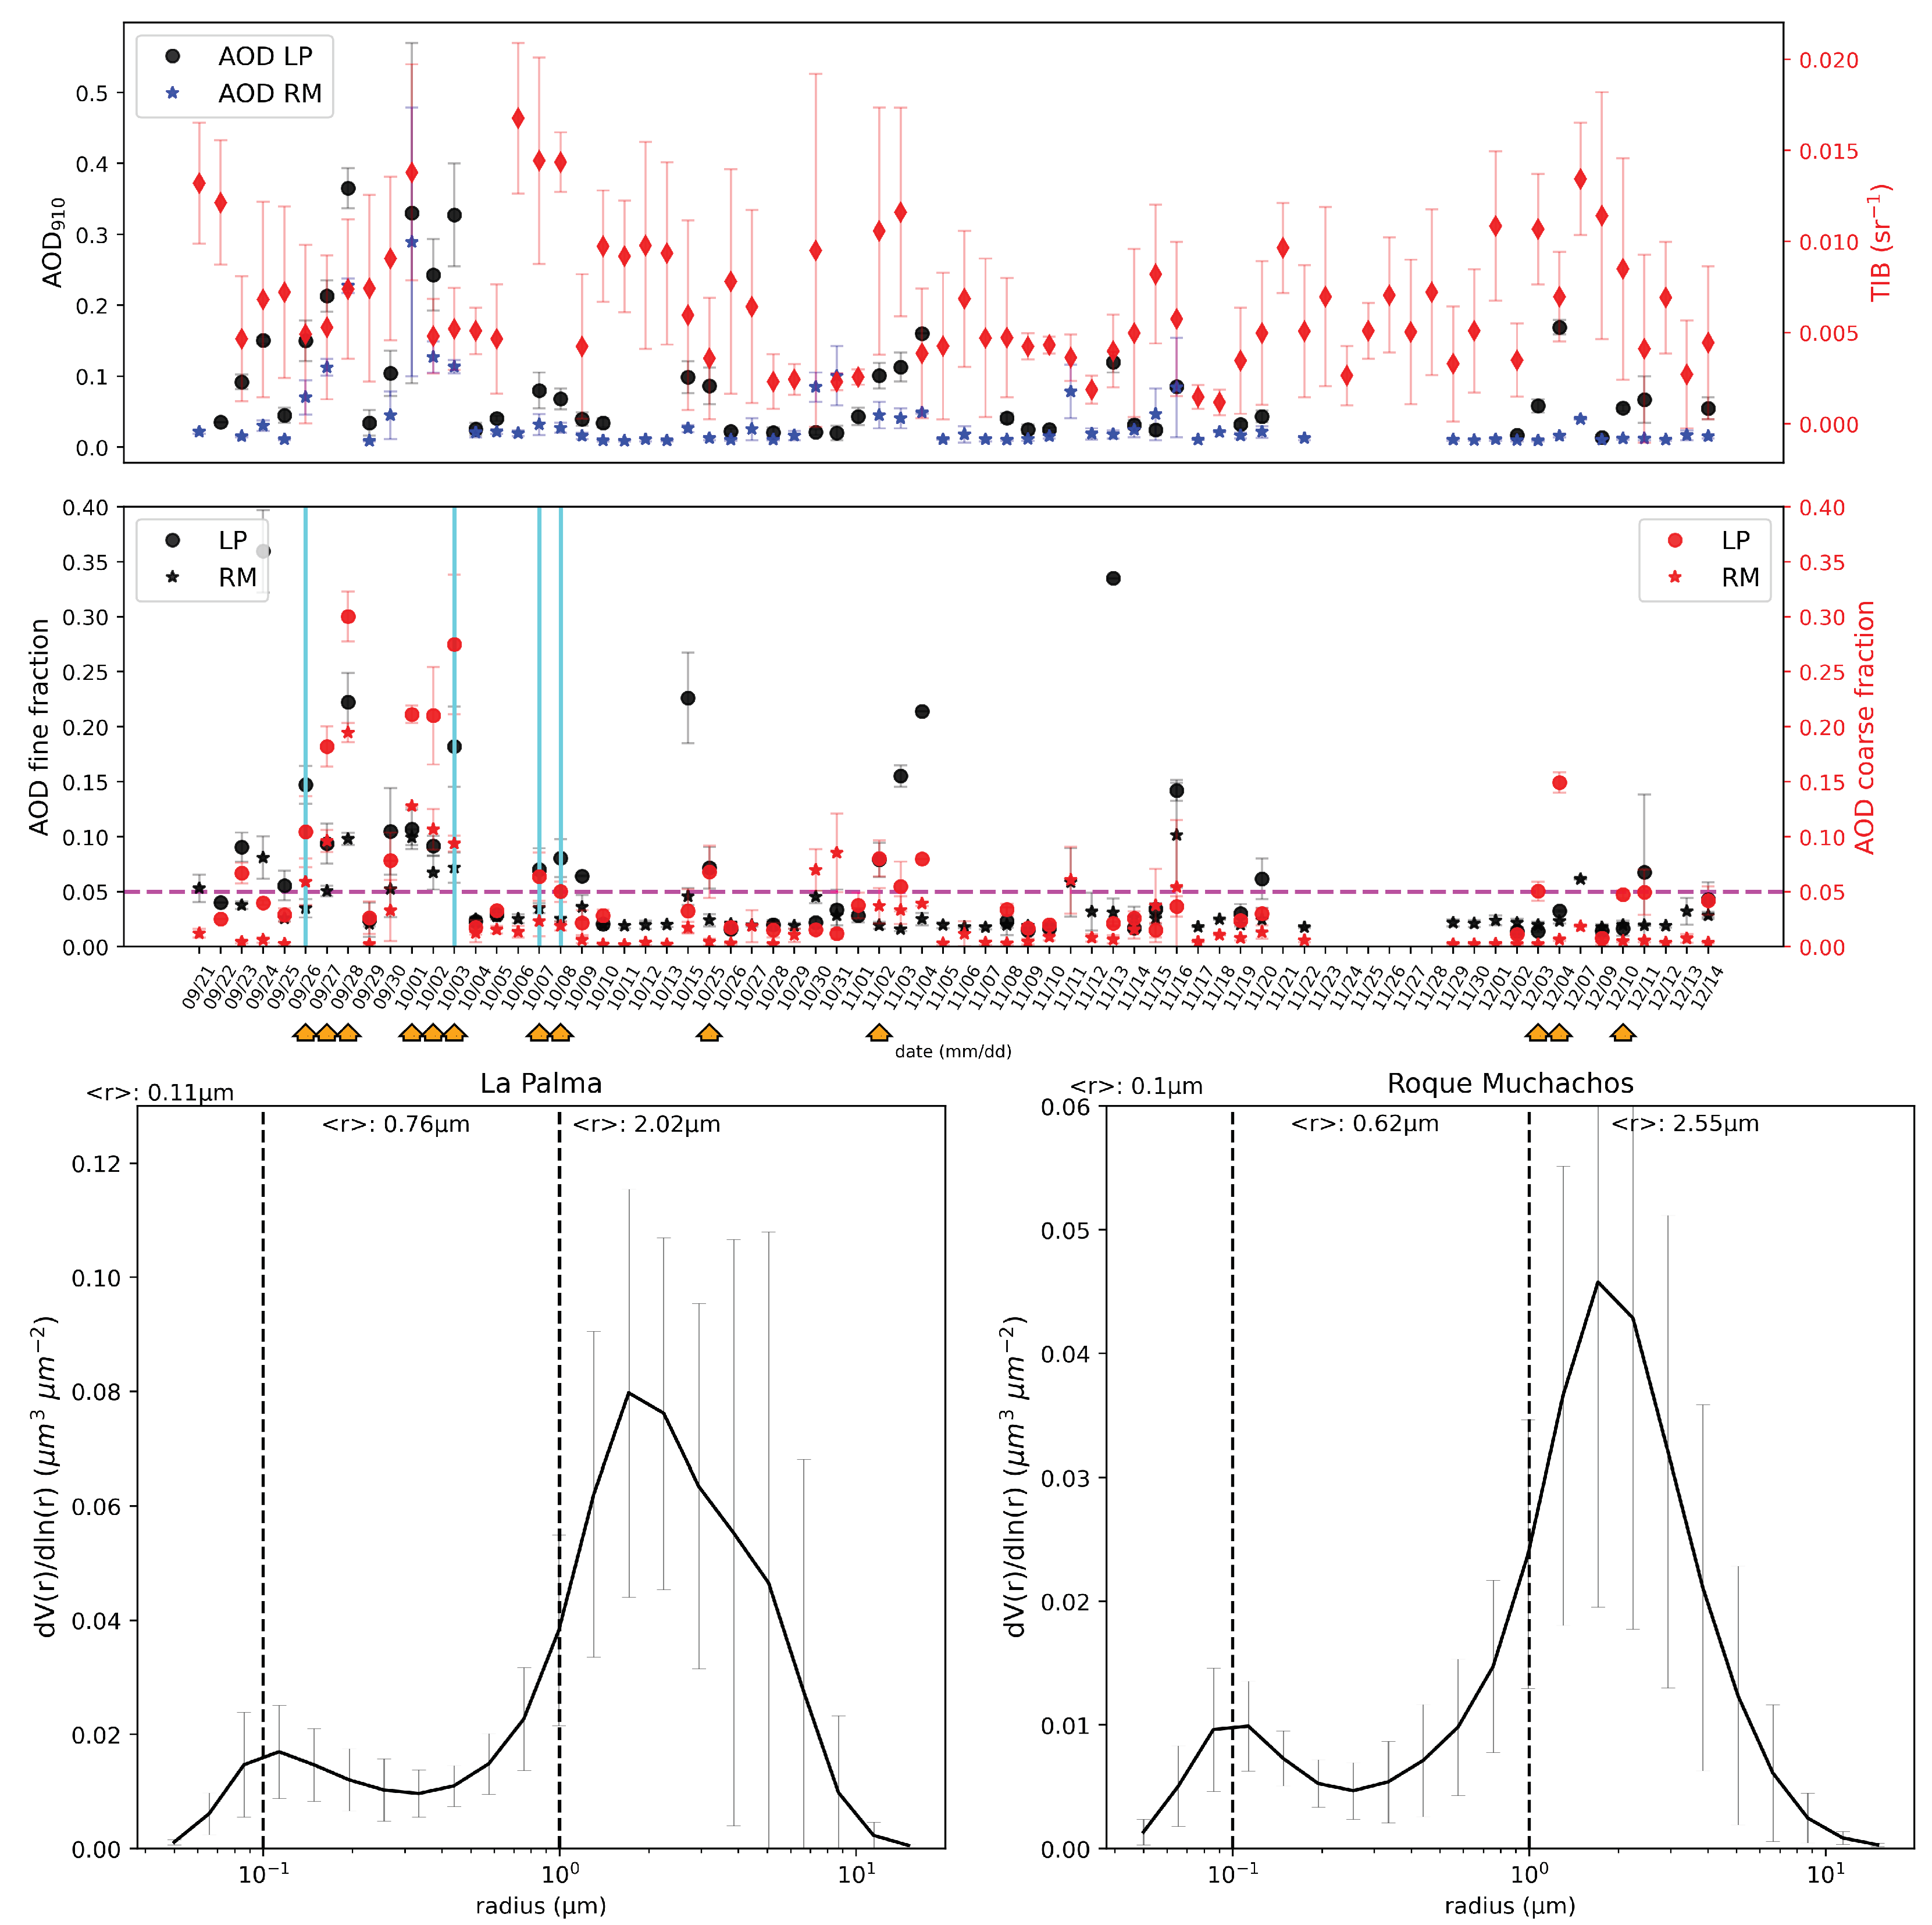
The upper part of Figure 3 presents the mean AOD 910 for the LP and RM sunphotometers in black and blue circles, respectively, together with its standard deviations. In the same panel, the mean integrated β is presented in red diamonds. Moreover, the mean AOD fine and coarse fractions are shown in the middle panel as the direct product of the spectral deconvolution algorithm (SDA) developed by [24]. This information is crucial to identifying the predominance of fine fresh emission and coarse ash particles. As established in Section 3, the hourly mean β values were calculated for each day considering the data availability. At the bottom, the mean volume concentrations are presented, differentiating the Aitken, accumulation, and coarse mean radius. To be consistent with the AOD fine and coarse fractions, the cut-off radius was also calculated. As indicated in [36], the calculation was performed by determining the inflection point for the mean volume concentration between the bin-to-radii range from 0.439 to 0.992 μ m. The cutoff radius found was 0.41 ± 0.13 μ m, which is the fine or coarse mode separation radius.
In the middle panel in Figure 3, data selections have been made, as indicated by the orange arrows. The selected days show the relative increases in the coarse mode fraction compared to the fine one, where an experimental limit was set for AOD coarse mode values larger than 0.05 (magenta dotted line) to reduce the aerosol mixing cases in the analysis. The aim was to determine the days where coarse volcanic ash predominated over fine SO 2 emissions in the atmospheric column. The data selection covered 13 days; however, the four days highlighted (straight cyan lines) are the ones where Saharan dust intrusions were detected [17]. Due to the Saharan intrusions, the analysis from here forward does not involve these particular cases since the interest is to consider only volcanic ash emissions. In the bottom panel, the volume concentrations for the selected days are presented.
From the results shown in Figure 3, it can be seen that the volcanic eruption had a period of high activity from 27 September to 2 October 2021. This finding is consistent with [37], which established that more than 50 million cubic meters of material erupted from 21 to 27 September 2021, then the eruption continued characterized by Strombolian explosions from 29 September to 5 October. In this work, higher mean AOD coarse values were obtained on 28 September reaching up to 0.30 ± 0.02 and on 1st and 2nd October reaching up to 0.21 ± 0.04 at LP. Unless the volcano was active during the whole period of the measurements, one can see from the results that coarse and fine particles were always mixed, complicating the isolation of fresh pure ash eruptions from local/injected aerosols.
On 25 October and 2 November 2021, the second largest increase in the coarse mode fraction reached values of up to 0.08 ± 0.03, 0.10 ± 0.02, but was always mixed with fine particles. The values found at RM presented a synchrony of the volcanic emissions with those found at LP; thus, Table 1 summarizes the mean values of the radiative properties of both stations extrapolated at 910 nm by following the procedure developed in Figure 2. For this second period, LP presented an increase in the coarse mode, whereas at RM it was not predominant, suggesting that ash particles were likely transported to the island’s south or too low. These findings were cross-checked with the spatio-temporal evolution of the plume retrieved from the ceilometers since the height of the ash plume is a crucial aspect to consider. From the columnar analysis, one might conclude that during the event, the volcanic ash was transported to the south (LP site) rather than to the north (RM site).
A third phase can be seen near the end of the volcanic eruption between 3 and 10 December when the AOD coarse mode reached values of 0.15 ± 0.01 at LP (on 4 December 2021). At RM, this third phase was almost not detected, since fine particles dominated as expected for a high-level mountain station.
Using the definition in Equation (1), the lidar ratio was calculated considering only the selected days, avoiding the ones highlighted in cyan and the ones where coarse and fine modes had differences lower than 0.10. For coarse mode (i.e., freshly emitted ash particles), the mean LR found at LP was 42.9 ± 6.6 sr and at RM it was 21.2 ± 3.4 sr, which are within the ranges reported by [38,39,40] for different types of volcanic eruptions and using either ground-based or satellite lidar data sets. The low values found at RM were expected due to the station altitude and the height level of the volcanic plume, but this is discussed in the next section.
The volume concentrations reinforced the fact that at the RM site, the volume mass concentration was lower than that at LP, with a clear bimodal volume concentration of the data set. At RM, the volume concentration maximum values for coarse mode were up to 0.10 μ m 3 μ m 2 , whereas for fine mode, they were up to 0.022 μ m 3 μ m 2 . The relative differences between the modes at RM were lower than 0.08 μ m 3 μ m 2 , with the two modes always presented. On the contrary, at the LP site, coarse mode was predominant for the data selection, reaching values of up to 0.27 μ m 3 μ m 2 , whereas a weak fine mode was seen, with mean values of around 0.06 μ m 3 μ m 2 .

4.2. Spatio-Temporal Evolution of the Eruption from 19 September to 14 December 2021

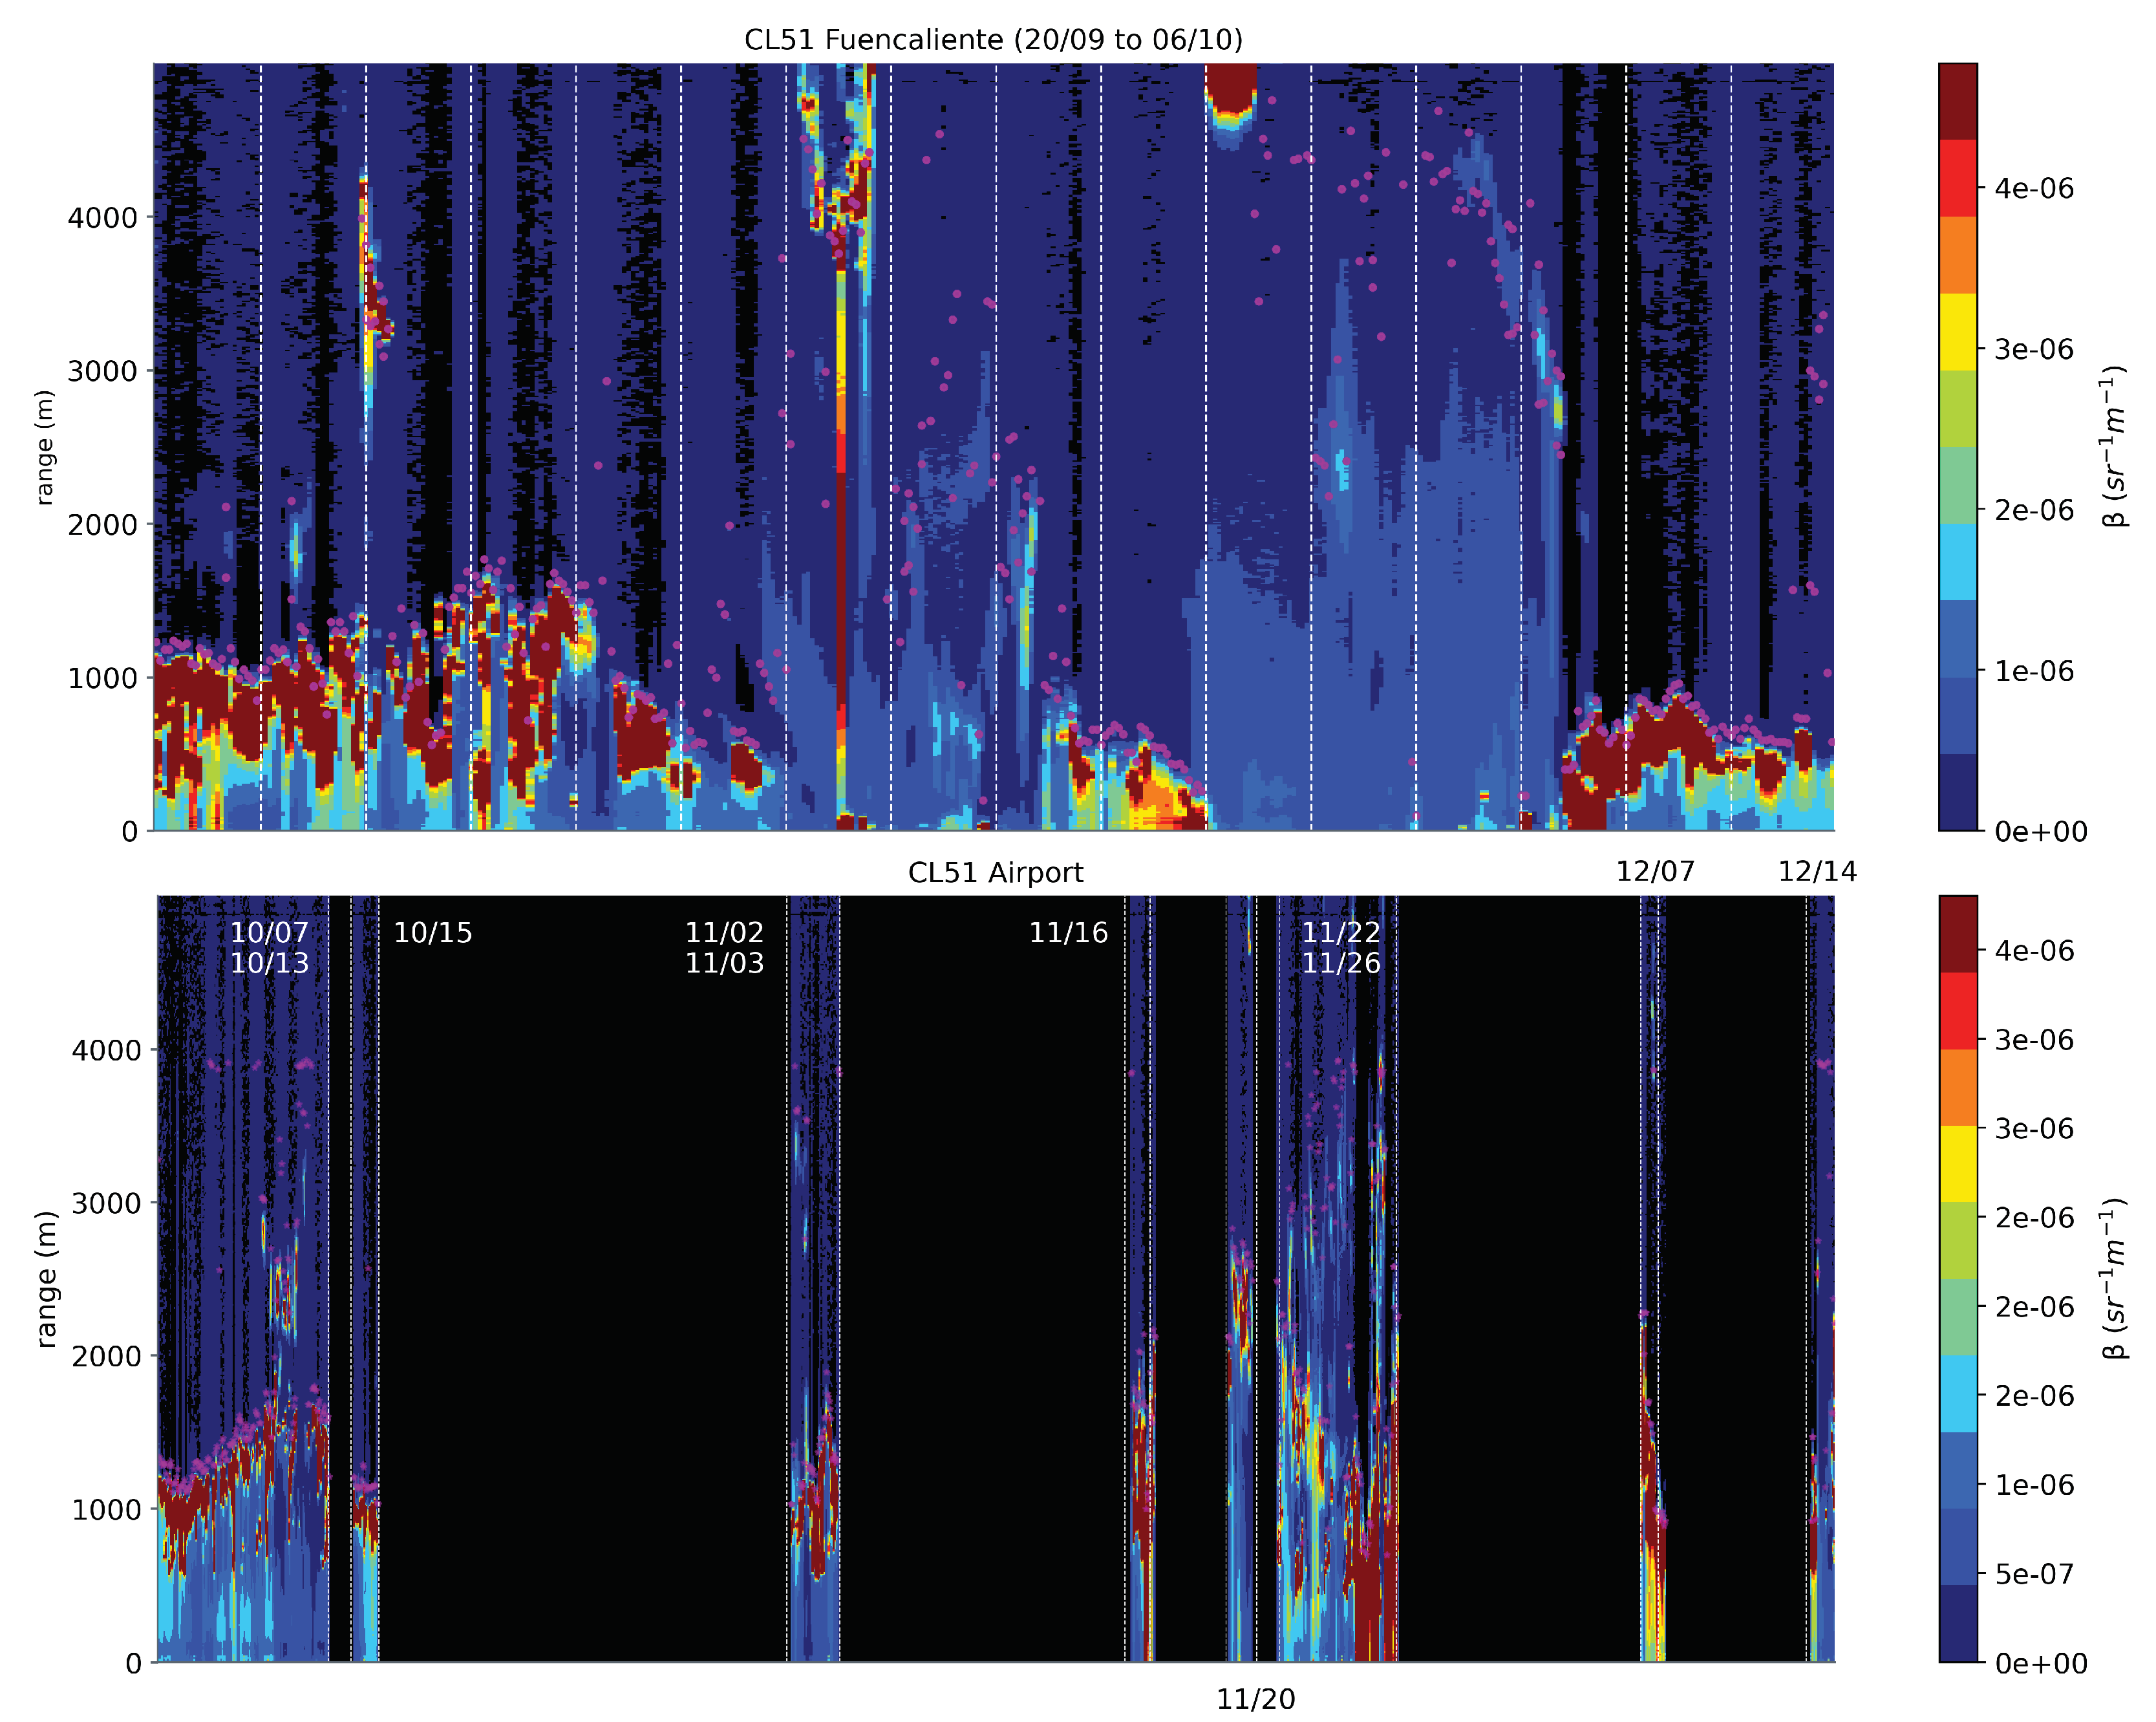
The volcanic eruption was spatio-temporally characterized using the β coefficient. The CL51 instrument was installed at the Fuencaliente site from 19 September to 6 October 2021. During these three weeks, the instrument measured continuously, reporting mean values of β ranging from 3 × 10 6 to 5 × 10 6 (msr) 1 , which are within the range reported in [13] using the MLP micro-lidar systems at Tazacorte. Based on the measurements, the first phase of the volcanic eruption can be established as being from 25 September to 28 September. The volcanic plume reached limits of up to 3 km; however, on 26 September, the Saharan dust injection provoked an increase in the β values, as can be seen in Figure 4 in the upper panel. Without considering the Saharan dust intrusion, the mean AsLH obtained ranged from 1.2 to 1.8 km agl at the beginning of the eruption from 20 to 25 September and from 4 October to the end of the event (see Figure 4, as seen in the upper and lower panels). From 27 September to 4 October, the plume’s height increased from 2 km to almost 4.2 km agl, being the maximum mean top height reported during the whole event. In Figure 4, one can notice that the WCT thresholds were less accurate for the automatic detection of the layer heights when high accumulations were seen or even under the presence of high-level cloud systems such as those observed on 26 and 30 September.
These results are consistent with the ones shown in the previous section, confirming the fact that even during the most intense part of the eruption, the volcanic ash was always injected at a low level, except for the selected days when the intensity and height of the plume allowed the ash to transport to the center-north of the island at mean altitudes of between 2.5 and 3.7 km agl, increasing the coarse mode (AOD and volume concentration) at the RM site.
The false color maps presented in Figure 4 indicate that the three weeks of measurements at the Fuencaliente site had slightly higher values of β than the ones presented in the bottom part of the CL51 installed at La Palma Airport. At the airport, the maximum mean β was up to 4 × 10 6 (msr) 1 , whereas at Fuencaliente it was up to 5 × 10 6 (msr) 1 . Regarding the data availability, at the airport, it was reduced mainly due to signal shielding, environmental conditions, and technical issues with the instrument.
Establishing a comparison with the reported values in the literature for intense episodes of volcanic eruptions below 4 km agl, e.g., [9,41], which reached values of up to 2.5 × 10 6 (msr) 1 , the reported values of β obtained here were slightly higher, indicating the magnitude of this event. Our β values are within the range of the ones reported by [13] for the La Palma eruption at 532 nm despite the instruments’ spectral differences. A second phase of the volcanic eruption started in early November according to the β , AsLH, and δ products. Notably, from 22 to 26 November, volcanic plumes ranged from 2.3 to 3.2 km agl, reaching the maximum height levels in the second phase. This phase of the eruption was cross-checked with the Tropomi S0 2 -integrated concentration that increased from 2–3 DU on 21st November to almost 16–17 DU on 22nd November.
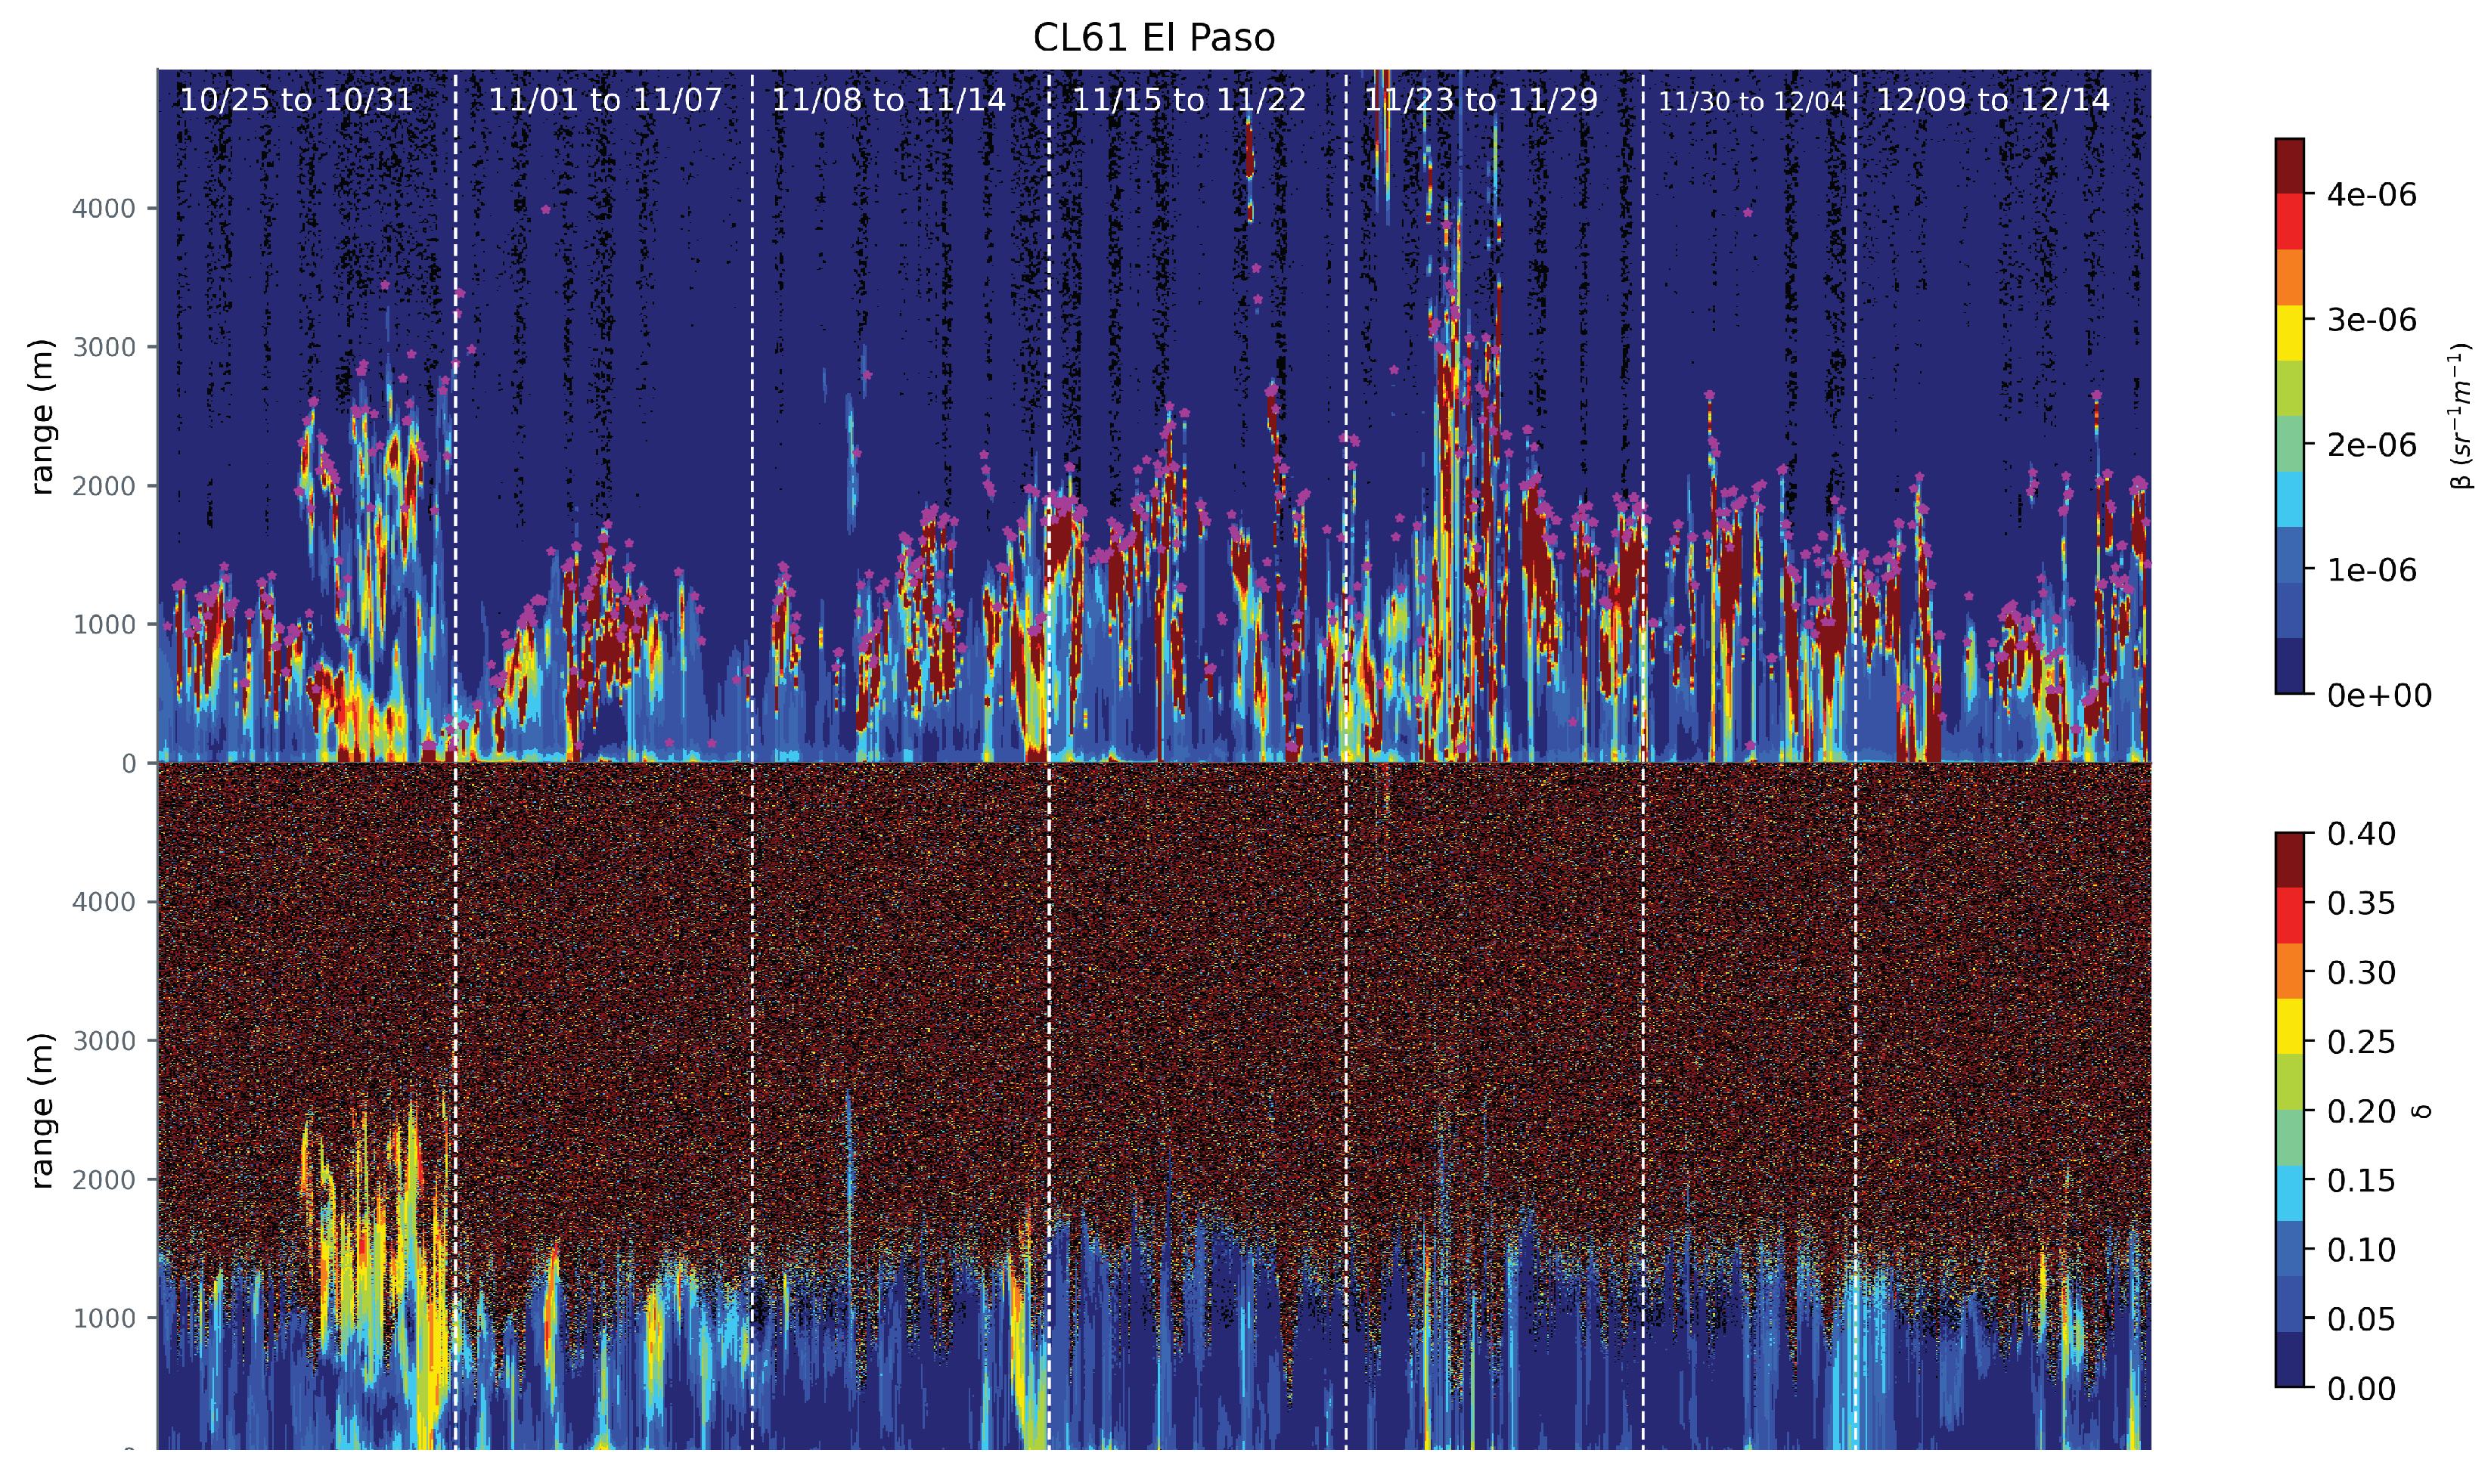
Figure 5 presents the measurements of the CL61 ceilometer, which is the Vaisala version includes polarization at 910 nm and enhanced spatio-temporal resolution. With this instrument, we improved the characterization of the freshly emitted volcanic ash including the δ aerosol property. The CL61 was continuously operative from 25 October to 14 December 2021 at the El Paso site, located next to the main source of the volcanic eruption (at about 3 km in a straight line). During this period, several ash emissions in the lower troposphere were measured.
In a volcanic eruption, the SO 2 fine particles play a crucial role, injecting into the atmosphere particles with mean radii of up to 0.8 μ m [1]; however, large fresh ash and non-spherical particles are dominant nearby the source. Particularly, the results presented in the bottom part of Figure 5 show that for non-spherical particles, δ ranged between 0.20 and 0.30, which is within the range reported in [9,13,38,39].
As discussed in Section 4.1, the columnar products indicated that on 25 October, 11 November, and 3, 4, and 10 December, the volcanic activity increased. This can be cross-checked with the results presented in Figure 5. A clear increase in the non-sphericity during these periods can be seen, where δ reached its maximum mean values between 25 and 31 October, with heights of up to 2.6 km agl. Analyzing the results by layers, the maximum δ mean values from 1 to 2 km agl reached values of up to 0.31 ± 0.02, whereas lower values were found within the first kilometer and above 2 km where the δ was up to 0.29 ± 0.02. Considering the results presented in [13] for MLP systems, our results are within the range.
Regarding the low-level height of the particles during this period, the δ and the LR values found and the freshly emitted ash particles might not be as elongated due to cooling in the atmosphere as the ones reported in [9] during the Etna volcanic eruption in December 2013, which reached a δ of up to 77 ± 19 % below 4 km agl. In this study, due to the proximity between the ceilometer and the volcano, our results might be linked with non-spherical fresh ash coarse particles like the ones reported in [39] in Puyehue, Chile, in 2011, and in [8] during some periods of the Eyjafjallajökull (Iceland) eruption in 2010.
As addressed in Section 2, as a proof of concept, the quantification of the mass concentration measured during the eruption event was performed by combining the ceilometer and sunphotometer data. To do so, Equation (2) was used to quantify the mass concentration split by layers. Based on the AsLH results, here, the first 4 km agl of the atmosphere was divided into four layers, i.e., from 0–1 km, 1–2 km, 2–3 km, and 3–4 km. The mean that β was obtained for each layer, as shown in Table 2 for the EP and FC sites, excluding the one located at the airport since, due to the low data availability, the results might drive us to wrong estimations. Then, we used the two sunphotometer sites at RM and LP to quantify the mass concentration. It is important to mention that combinations of the RM sunphotometer and FC ceilometer were not considered in order to be consistent with the discussion in this manuscript, where it has been stated that the sunphotometric stations were selected to better understand the ash transportation between the center-north and center-south of the island but that there is not a physical link between them.
In a study by [42], it was shown that the particle size distributions in coarse mode for mineral dust particles measured by AERONET (limited by a maximum radii up to 15 μ m) were 3 times lower than the ones measured on the Falcon aircraft where the radii limit was up to 50 μ m, evidencing the AERONET volume concentration underestimation under large particle sizes. For the selected cases, under the consideration that within the first 48 h there was almost no sedimentation, the assumption that a significant portion of the particles were larger than 15 μ m was highly probable. For large particles, almost a constant value of 2 was reached for the extinction efficiency, then, the C v /AOD ratio was approximated at 2/3 r e f f [8,43]. For large ash particles, a r e f f = 4 μ m was considered, as shown in the [44] experiment.
Table 2 presents the results of the mass concentrations for fine and coarse ash plumes based on the selected days from the integrated products. The mass conversion values found for RM (fine/coarse) were 0.4 ± 0.1 × 10 6 m and 0.46 ± 0.05 × 10 6 m, and for LP were 0.4 ± 0.2 × 10 6 m and 0.5 ± 0.1 × 10 6 m. The obtained mass conversion values for coarse ash at the RM and LP sites had relative differences of lower than 30% compared with [13]’s results and lower than 22 % compared with the ones found in [8]. The differences found in [13]’s study might come from the use of instantaneous values for AOD instead of the daily mean at 900 nm as we did, in addition to the classification of the data used in this manuscript. The mass concentration error was estimated by assuming a certain degree of independence of the variables presented in Equation (2); thus, the square root of the sum of magnitudes of the partial derivatives multiplied by the respective uncertainties was used.
The expected maximum values of the mass concentration were for the combination of LP and FC for 0–1 km agl since the mean β was higher compared with the rest of the retrieved values (up to 9.1 ± 0.3 × 10 6 (msr) 1 ). For 1–2 km agl for the LP-EP combination, the mass concentration was also high. The ash mass concentration for LP-FC (0–1 km agl) was up to 313.7 ± 44.3 μ g m 3 and for LP-EP (1–2 km agl) it was up to 272.3 ± 44.3 μ g m 3 , which are comparable with the estimations made by [8] in April and May 2010 during the Eyjafjallajökull eruption (ranging from 100 to 1000 μ g m 3 ). The mass concentration values found of around 100–200 μ g m 3 are similar to the ones obtained by [44] for the fresh ash plume from the Eyjafjalla volcano in May 2010 (from 20 to 100 μ g m 3 ), and by [13] in the La Palma volcanic eruption in 2021 (up to 196 μ g m 3 ). The values highlighted in orange in Table 2 are those considered moderate contamination level according to the UK Meteorological Office after the Eyjafjallajökull eruption in 2010. The ones in teal are considered low contamination level of index 2, and according to our classification, might be associated with SO 2 presence during the active period of an eruption. The values reported in parenthesis in Table 2 for coarse mode are considered to have particles larger than 15 μ m, where the values of the mass concentration can be 5.4 times larger than those obtained at the LP site and 5.8 times larger than those obtained at the RM site (the quantification was not shown in the table to retain the table format). These factors result from the ratio between the C v /AOD factors for ash particles larger than 15 μ m and ones that are lower than 15 μ m. According to the World Health Organization (WHO), the mass concentration levels reached for short-term (24 h) coarse particles (PM10) are between interim target 2 (until 100 μ g m 3 ) and interim target 1 (larger than 150 μ g m 3 ), which are classified as medium- and high-level particle contamination in terms of health risks due to long-term exposure [45].
The mass concentration for the LP-FC synergy might be considered as the reference since the sunphotometer and the ceilometer were co-located; thus, the error due to the distance between instruments could be neglected. For the LP-FC combination, fine and coarse particles remained in the first atmospheric layer (0–1 km agl); however, likely due to dispersion, only the coarse particles reached the upper layer (1–2 km agl), where the mass concentration was up to 103.4 ± 44.3 μ g m 3 . Nearby the source at the EP site, the mass concentration showed larger values from 1 to 3 km agl, with higher values for the combination of LP and EP than for the RM and EP combination. As an indicator of the plume’s dispersion regarding the position of our instruments, the mass concentration led us to conclude that the impact of the ash plume in the center-north of the island remained at around 1–3 km agl, whereas in the south, the plume remained in the first two kilometers of the atmosphere.

4.3. Example Case: Volcanic Ash Detection on 24 and 25 September 2021 at Toulouse, France

4.3.1. Synoptic Analysis

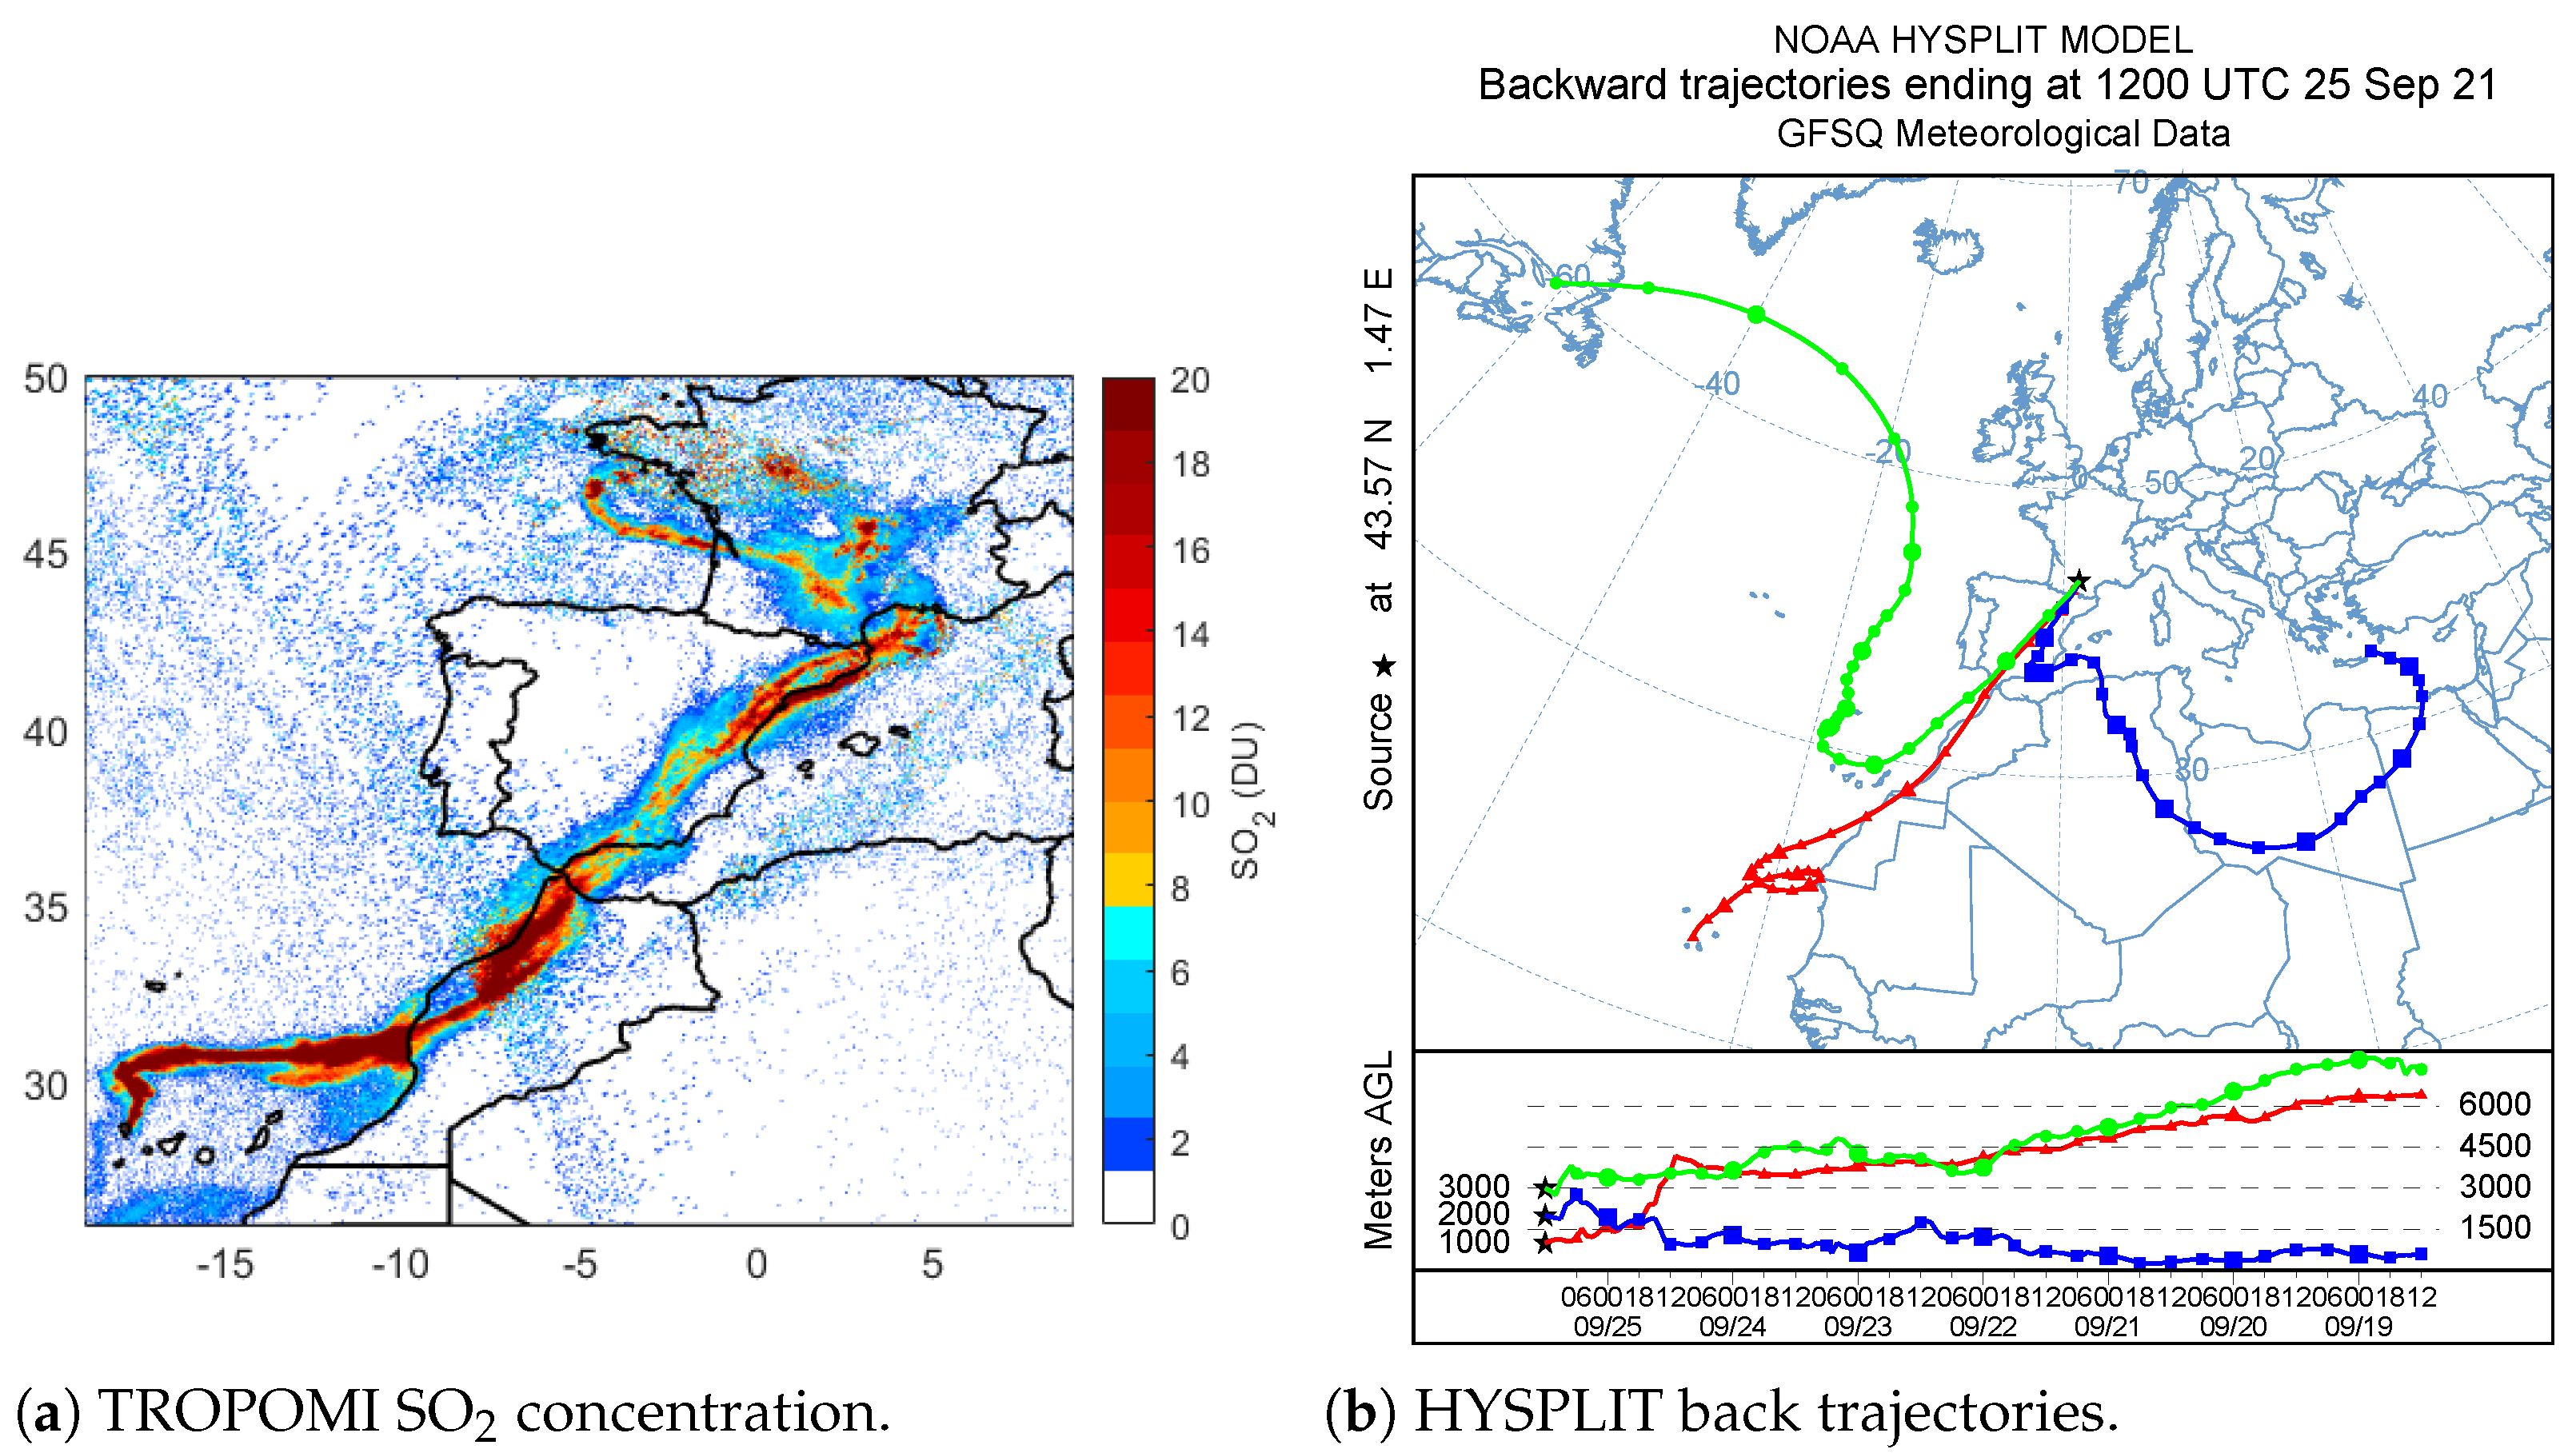
The La Palma volcanic eruption was detected at the ONERA site on 24 and 25 September 2021. The transported sulfur dioxide particles were measured by the TROPOMI instrument onboard the Sentinel 5 Precursor satellite, as can be seen in Figure 6a. TROPOMI shows the SO 2 trajectory from La Palma, crossing the south of the Iberian peninsula and dispersing in the southwest of France. At the ONERA site, values of the total column SO 2 concentration were reported from 8 to 10 DU (1 DU equals 2.69 × 10 16 molecules/cm 2 ), which are up to 10 times lower than the ones registered in La Palma (referred on [13]) but are in the ranges of those detected by [1] for transported ash particles due to the Mt. Kelut (Indonesia) eruption in 2014. The SO 2 concentration values detected at the ONERA site are likely associated with the particle mixing along the SO 2 pathway to reach France, mainly because of the homogeneous and heterogeneous nucleation together with the coagulation processed, where pure SO 2 is mixed with ash particles. Figure 6a only presents information for 25 September since it was the day when higher concentrations of SO 2 were detected.
Figure 6b presents the air mass back trajectories from 19 to 25 September 2021. Three height levels were used in the calculation based on the height of the emitted plumes in La Palma and the heights at which those plumes were detected at the ONERA site. Regarding the discussion about aerosol mixing, the back trajectories reinforce the fact that some large particles came from the northeast part of the African continent between 2 and 2.5 km agl (see blue trajectory). In the red and green back trajectories, the injection of ash particles was consistent with the SO 2 trajectory shown in Figure 6a, suggesting the presence of fine particles mostly on 25 September. The air masses at 1 and 3 km passed through the Iberian peninsula, suggesting aerosol mixing with some local sources and dust. This was validated by the TERRA/MODIS satellite in the land and ocean data sets for AOD and Ångström exponent products (not shown here). On the 24 September, fine and coarse aerosols reached the south of France. The coarse particles came from the northeast of the African continent and the fine particles came mostly from the west according to the satellite information. On the 25 September, some cloud systems were covering the south of France; however, the land AOD and Ångström exponent values from the TERRA/MODIS satellite indicated the presence of fine particles, with the Ångström exponent ranging from 1.5 to 1.7 and the AOD up to 0.25, and from the ocean products, the Ångström values ranged from 0.43 to 0.75, with the AOD up to 0.35, which are consistent with the blue back trajectory related to coarse particle transport.
The origin of the particles that arrived at the ONERA site was complemented by using sunphotometer products such as fine and coarse AOD fractions and the volume concentration. On the 24 September, the mixed aerosol was dominant in the afternoon, i.e., the fine and coarse modes of the volume concentration were nearly equally distributed until the afternoon, but at around 16h UTC, the volume concentration coarse mode and the AOD coarse fraction increased to 0.10 μ m 3 μ m 2 and 0.25 (three times larger than the one in fine mode), respectively. Those are clear signs of aerosol mixing in the morning with a predominance of coarse particles in the afternoon (in accordance with the back trajectories). This scenario drastically changed on the 25 September, where fine particles were dominant, with mean AOD fine values of up to 0.48 and volume concentration fine mode values of up to 0.10 μ m 3 μ m 2 , a sign of volcanic ash intrusion.

4.3.2. Aerosol Radiative Properties

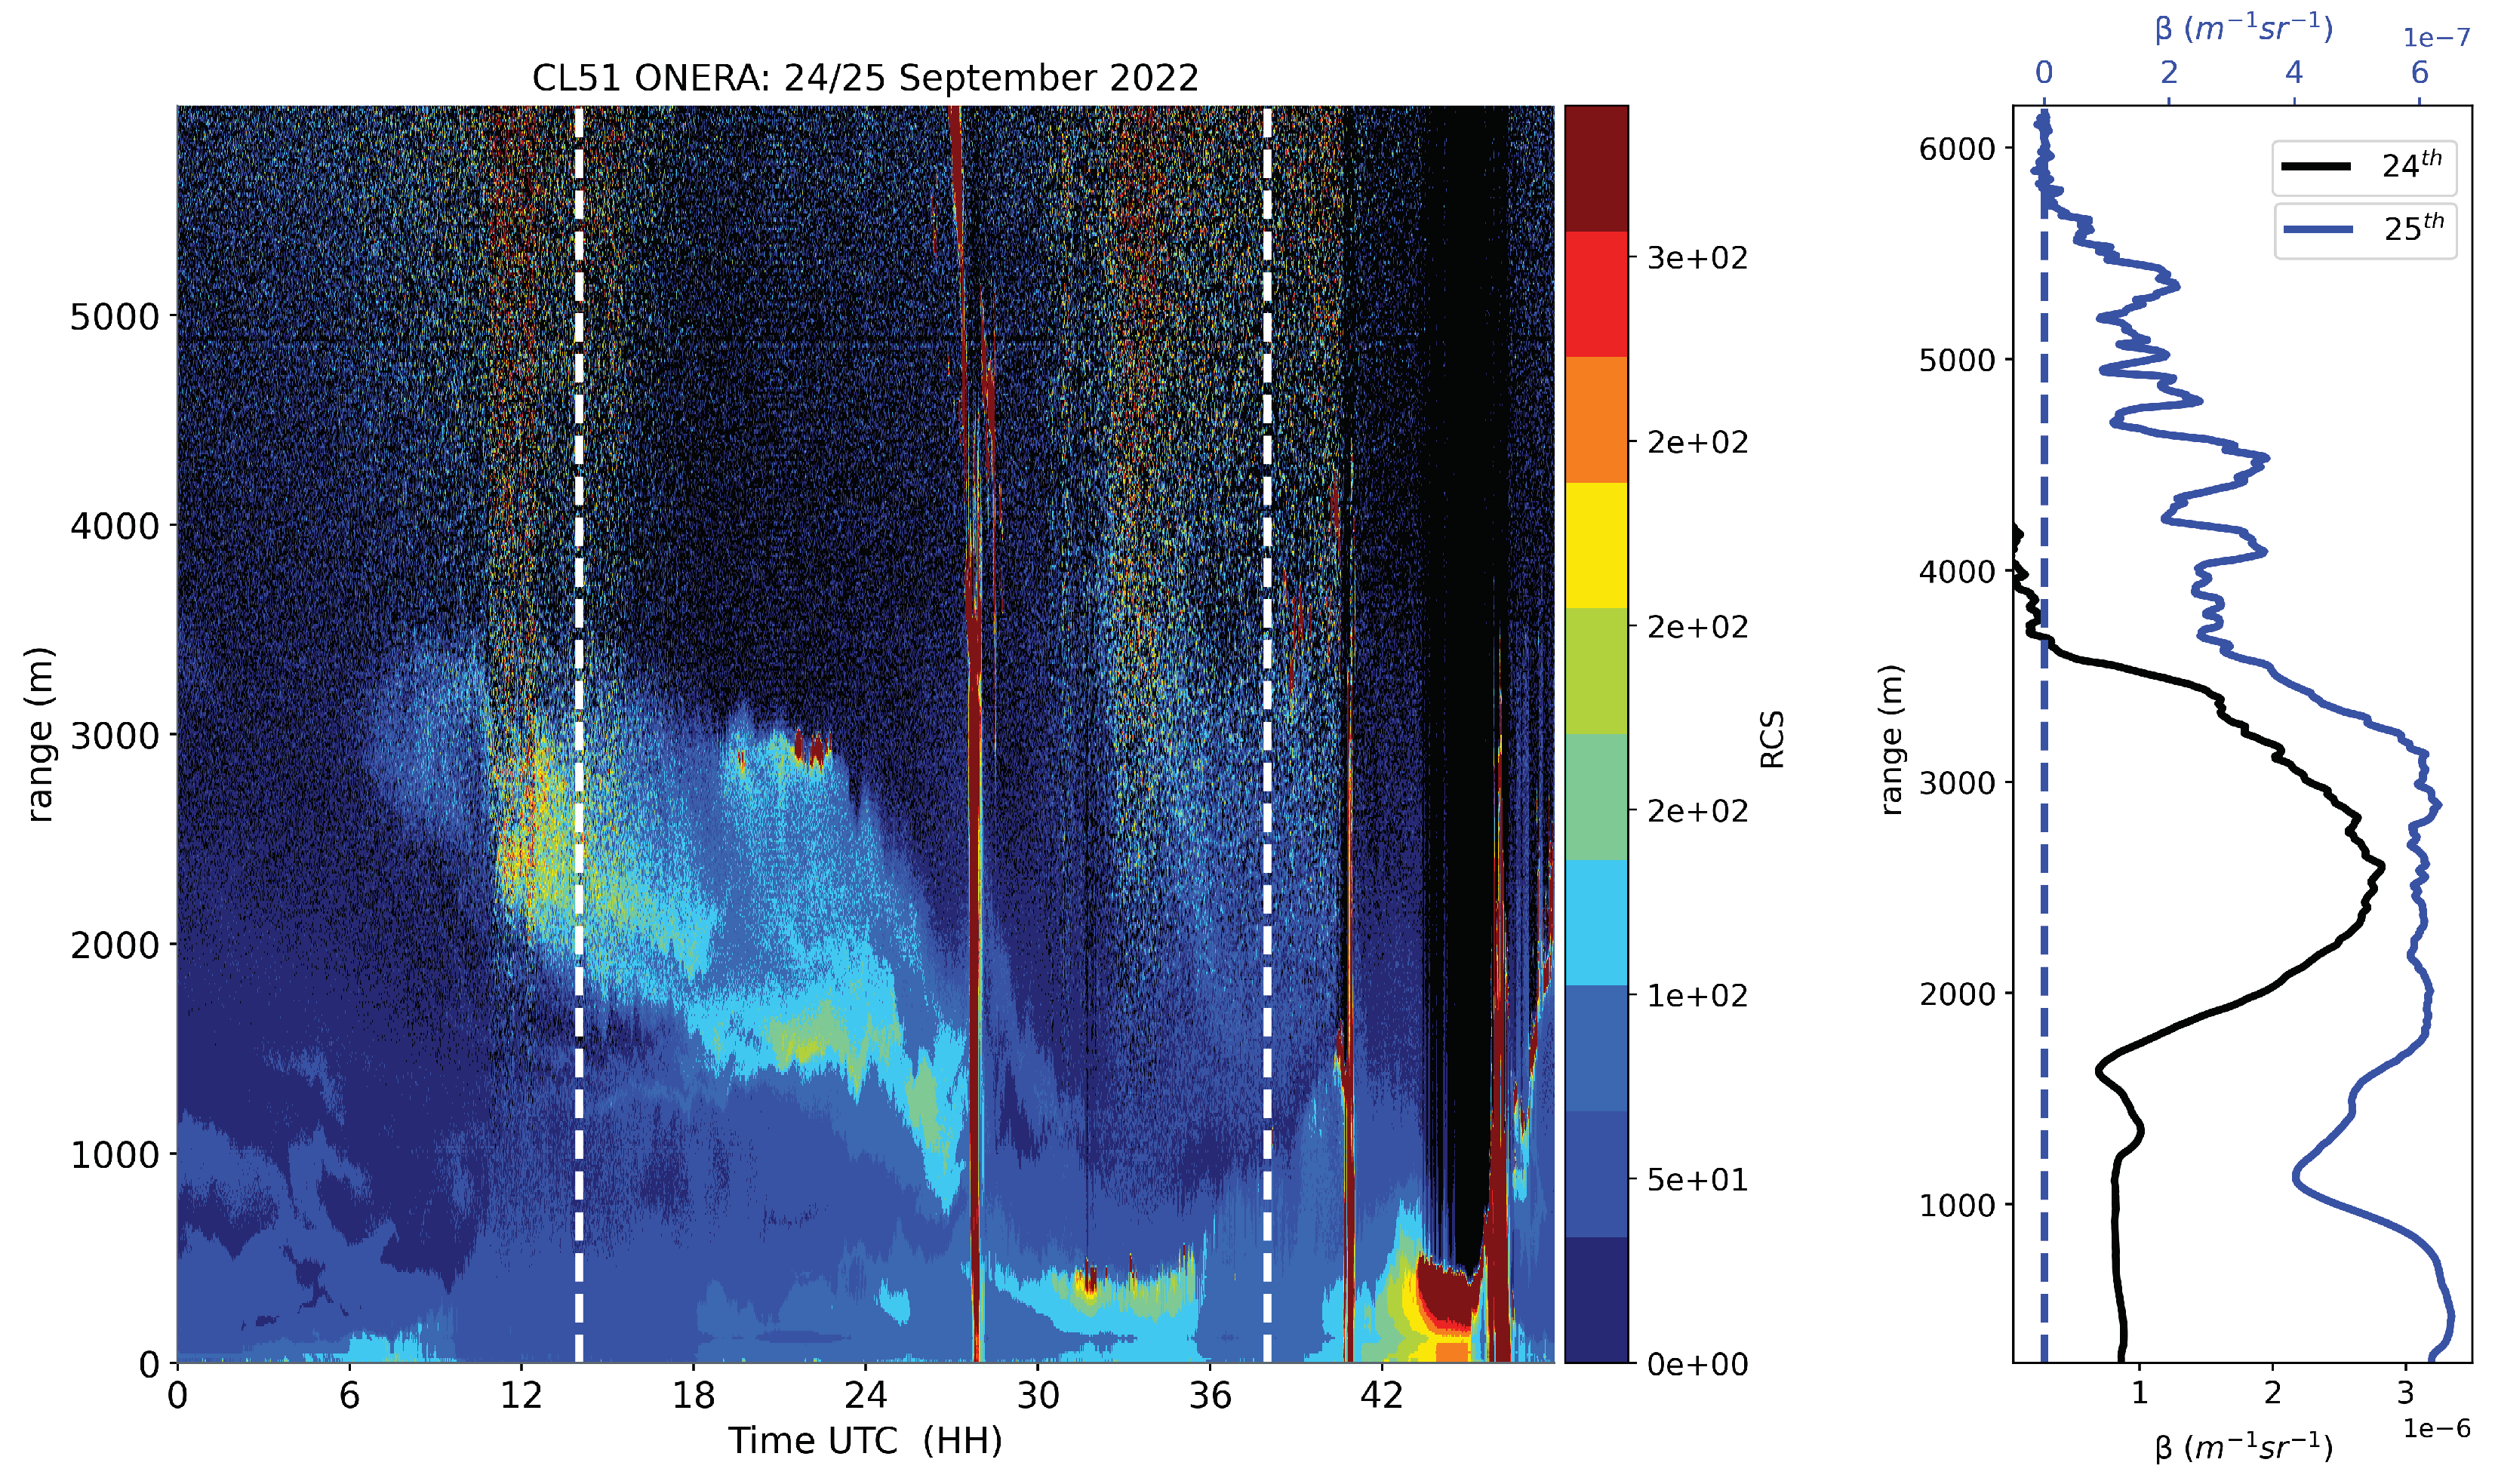
The radiative properties were characterized using the CL51 ceilometer located at the ONERA site and the sunphotometer from the Toulouse site. The main products evaluated were the extinction profiles and LR from which the aerosol backscattering was determined. In Figure 7, the false color map of the range corrected signal shows the main context of the ash particle injections over the area, focusing on the 24 and 25 September 2021. In general, the aerosol layers were stratified between a low-level layer that reached 1.5 km agl and a high-level layer that reached 3.5 km agl. On 24 September, the upper layer shows the coarse aerosol intrusion, which began at around 10 h and persisted until 25 September above 1.5 km agl. Due to the first rainfall event at around 4am on the 25 September, the atmosphere was washed, allowing us to have a relatively clean scenario to see the presence of the low-level layers between 5 h and 19 h (second rainfall event). As can be seen, the upper layer with a coarse aerosol predominance was less intense compared with the one on 24 September, but in any case, aerosol mixing was always present during these days.
Consistent with the discussion in Section 4.3.1, the low-level layers might be linked with fine particles and the upper layers with coarse particle injections. On the right side of Figure 7, the inversion on 24 September at 14 h UTC (black line) shows two well-distinguished aerosol layers below and above 1.8 km. The maximum values of β in the lower layer were up to 1 × 10 6 (msr) 1 , whereas in the upper layer they reached 3 × 10 6 (msr) 1 . In contrast to 25 September, with a relatively clean atmosphere due to the early rain event, the impact of the coarse plume measured on 24 September was less strong, being the two aerosol accumulations present in the β profile of similar magnitudes. For this day, the inversion was performed at 12 h and the β values had an order of magnitude lower than the ones on 24 September, reaching maximum values in the lower part of up to 6.5 × 10 7 (msr) 1 and 6.2 × 10 7 (msr) 1 in the upper part. The β profiles were likely selected in temporal frames where any cloud systems could impact the inversion and considering the 1 h averaging defined in Section 2. Regarding the LR, the obtained values from the iterative Klett algorithm were 46.1 and 53.6 sr on 24 and 25 September 2021, respectively. Those are within the values reported by [8,13,38] for volcanic ash transport.

5. Conclusions

This manuscript is oriented to the analysis of the 2021 eruption of the Cumbre Vieja volcano that took place at La Palma, Spain, from mid-September to mid-December 2021, and the subsequent transport of volcanic aerosols from La Palma to Toulouse, France. Here, passive and active remote sensors were used, namely sunphotometers and Vaisala ceilometers. Vaisala CL51 and CL61 ceilometers were used to characterize the aerosol radiative properties, e.g., the attenuated backscattering and volume depolarization ratio. From the sunphotometers, the AOD, particle size distribution, and AOD fine and coarse mode fractions were used. In France, at the ONERA site, we used a Vaisala CL51 ceilometer and also a sunphotometer. Through this work, we bring to the scientific community additional information in terms of the optical and microphysical properties of freshly emitted ash aerosols by using Vaisala ceilometers.
Column-integrated products were analyzed from the sunphotometers and also from the ceilometer profiles. This columnar analysis led us to determine the periodicity of the different eruption phases and their intensities. From the AOD fine and coarse fractions, we determined 14 cases where the coarse aerosols predominated over the fine ones and from this data selection, the lidar ratio was calculated. The mean values of the lidar ratio at 910 nm for La_Palma were 41.1 ± 10.6 sr and for Roque_Muchachos were 24.9 ± 4.1 sr. The lower values found at Roque_Muchachos are mainly linked to the altitude of the Roque_Muchachos station and the trajectory of the ash plumes, which were at least twice as high as those in the southernmost part of the island. This columnar analysis also allowed us to identify at least three main periods during which coarse ash particles were injected into the atmosphere.
The spatio-temporal evolution of the ash plume was studied at three different locations over the island, namely Fuencaliente, La Palma Airport, and El Paso (located 3 km from the volcano in a straight line). By using the Wavelet Covariant Transform (WCT) method, we found that the eruption had a top height layer of lower than 4 km agl so ash particles were mainly injected into the low troposphere. The results were divided into four different atmospheric layers ranging from 0 to 4 km agl. The volume depolarization found during the main phases of the event ranged from 0.20 to 0.30 depending on the degree of non-sphericity of the ash particles. We found almost three phases of high activity that occurred from 25 to 28 September, from 25 October to 11 November, and from 3 to 10 December, excluding some days due to dust outbreaks or data unavailability. The results showed that the mass concentration values were mostly within the range of low contamination levels according to the UK Meteorological Office (i.e., lower than 200 μ gm 3 ), and in some cases, as discussed in the manuscript, they reached moderate levels, with maximum values of up to 313.7 ± 44.3 μ gm 3 .
The case of ash transportation detected at the ONERA site on 24 and 25 September was characterized using satellite, back trajectories, and available remote sensing information. The backscattering values reached on 24 were up to 1 × 10 6 (msr) 1 in the lower layers, whereas in the upper layers, they were up to 3 × 10 6 (msr) 1 , with a lidar ratio of 46.1 sr. On this day there was aerosol mixing between fine and coarse particles. On 25 September 2021, the presence of fine aerosols was predominant at some times of the day. This day had two short rain events that permitted the atmosphere to be washed out and the fine particle layers were easily measured in the early morning until midday. The backscattering values reached maximum values in the lower part of up 6.5 × 10 7 (msr) 1 and 6.2 × 10 7 (msr) 1 in the upper part, with a lidar ratio of up to 53.6 sr.
In a nutshell, these three months of continuous emissions might have two immediate impacts. On the one hand, considering the radiative energy budget not only locally but also in the north of the African continent and Europe, as well as the air mass trajectories, some transported ash could reach South America or the Caribbean region [46]. On the other hand, visibility could affect aircraft safety.

Author Contributions

Data processing A.E.B.-V., M.H.-R., and R.D.G. The methodology was designed by A.E.B.-V., A.B. and R.C. A.E.B.-V., wrote the manuscript with contributions from all coauthors. A.E.B.-V. and M.H.-R., developed the software and did the formal analysis. The measurements were done by P.M.R.-C., A.B., O.G., R.D.G. and C.T. All co-authors were involved in the draft preparation. Funding acquisition, R.C. All authors have read and agreed to the published version of the manuscript.

Funding

This work was financially supported by ONERA within the framework of the PROMETE project 2017–2021; the Spanish Ministry of Science and Innovation (PID2019-103886RB-I00\AEI\10.13039\501100011033); and the H2020 program from the European Union (GA no. 654109, 778349, 871115, 101008004 and 101086690).

Data Availability Statement

The data from the different ceilometers are available upon request to the corresponding author. The data from AERONET sun photometers are at people’s disposal at https://aeronet.gsfc.nasa.gov/, accessed on 3 November 2022.

Acknowledgments

This work was financially supported by ONERA within the framework of the OPSIDIA project 2022-2025. The authors gratefully acknowledge the extraordinary effort carried out by AEMET personnel in La Palma and Canarias during the volcanic crisis. In addition, we thank the Izaña Atmospheric Research Center, and the city halls in Fuencaliente and El Paso. Thanks are also due to AERONET and E-PROFILE staff for their support in real-time data provision and to the community.

Conflicts of Interest

The authors declare no conflict of interest.

References

  1. Zhu, Y.; Toon, O.B.; Jensen, E.J.; Bardeen, C.G.; Mills, M.J.; Tolbert, M.A.; Yu, P.F.; Woods, S. Persisting volcanic ash particles impact stratospheric SO2 lifetime and aerosol optical properties. Nat. Commun. 2020, 11, 1723–2041. [Google Scholar] [CrossRef] [PubMed]
  2. Ayris, P.; Lee, A.; Wilson, K.; Kueppers, U.; Dingwell, D.; Delmelle, P. SO2 sequestration in large volcanic eruptions: High-temperature scavenging by tephra. Geochim. Cosmochim. Acta 2013, 110, 58–69. [Google Scholar] [CrossRef]
  3. Witt, V.; Ayris, P.M.; Damby, D.E.; Cimarelli, C.; Kueppers, U.; Dingwell, D.B.; Wörheide, G. Volcanic ash supports a diverse bacterial community in a marine mesocosm. Geobiology 2017, 15, 453–463. [Google Scholar] [CrossRef] [PubMed] [Green Version]
  4. Guffanti, M.; Ewert, J.W.; Gallina, G.M.; Bluth, G.J.; Swanson, G.L. Volcanic-ash hazard to aviation during the 2003–2004 eruptive activity of Anatahan volcano, Commonwealth of the Northern Mariana Islands. J. Volcanol. Geotherm. Res. 2005, 146, 241–255. [Google Scholar] [CrossRef]
  5. Weinzierl, B.; Sauer, D.; Minikin, A.; Reitebuch, O.; Dahlkötter, F.; Mayer, B.; Emde, C.; Tegen, I.; Gasteiger, J.; Petzold, A.; et al. On the visibility of airborne volcanic ash and mineral dust from the pilot’s perspective in flight. Phys. Chem. Earth Parts A/B/C 2012, 45–46, 87–102. [Google Scholar] [CrossRef] [Green Version]
  6. Song, W.; Hess, K.U.; Damby, D.E.; Wadsworth, F.B.; Lavallée, Y.; Cimarelli, C.; Dingwell, D.B. Fusion characteristics of volcanic ash relevant to aviation hazards. Geophys. Res. Lett. 2014, 41, 2326–2333. [Google Scholar] [CrossRef] [Green Version]
  7. Hirtl, M.; Arnold, D.; Baro, R.; Brenot, H.; Coltelli, M.; Eschbacher, K.; Hard-Stremayer, H.; Lipok, F.; Maurer, C.; Meinhard, D.; et al. A volcanic-hazard demonstration exercise to assess and mitigate the impacts of volcanic ash clouds on civil and military aviation. Nat. Hazards Earth Syst. Sci. 2020, 20, 1719–1739. [Google Scholar] [CrossRef]
  8. Ansmann, A.; Tesche, M.; Seifert, P.; Groß, S.; Freudenthaler, V.; Apituley, A.; Wilson, K.M.; Serikov, I.; Linné, H.; Heinold, B.; et al. Ash and fine-mode particle mass profiles from EARLINET-AERONET observations over central Europe after the eruptions of the Eyjafjallajökull volcano in 2010. J. Geophys. Res. Atmos. 2011, 116. [Google Scholar] [CrossRef]
  9. Boselli, A.; Scollo, S.; Leto, G.; Sanchez, R.Z.; Sannino, A.; Wang, X.; Coltelli, M.; Spinelli, N. First Volcanic Plume Measurements by an Elastic/Raman Lidar Close to the Etna Summit Craters. Front. Earth Sci. 2018, 6, 125. [Google Scholar] [CrossRef]
  10. Shimizu, A.; Iguchi, M.; Nakamichi, H. Seasonal Variations of Volcanic Ash and Aerosol Emissions around Sakurajima Detected by Two Lidars. Atmosphere 2021, 12, 326. [Google Scholar] [CrossRef]
  11. Mona, L.; Marenco, F. Chapter 9—Lidar Observations of Volcanic Particles. In Volcanic Ash; Mackie, S., Cashman, K., Ricketts, H., Rust, A., Watson, M., Eds.; Elsevier: Amsterdam, The Netherlands, 2016; pp. 161–173. [Google Scholar] [CrossRef]
  12. Dănilă, M.N.; Unga, F.; Cazacu, M.M.; Timofte, A.; Strat, M.; Dimitriu, D.G.; Gurlui, S. LIDAR Measurements Comparison of Two Volcanic Eruptions: Environmental Influences Upon The Romanian Territory. Ann. West Univ. Timis. Phys. 2015, 56, 68–75. [Google Scholar] [CrossRef] [Green Version]
  13. Sicard, M.; Córdoba-Jabonero, C.; Barreto, A.; Welton, E.J.; Gil-Díaz, C.; Carvajal-Pérez, C.V.; Comerón, A.; García, O.; García, R.; López-Cayuela, M.-Á.; et al. Volcanic Eruption of Cumbre Vieja, La Palma, Spain: A First Insight to the Particulate Matter Injected in the Troposphere. Remote Sens. 2022, 14, 2470. [Google Scholar] [CrossRef]
  14. Pérez, N.M.; Hernández, P.A.; Melián, G.V.; Padrón, E.; Asensio-Ramos, M.; Barrancos, J.; Padilla, G.D.; Rodríguez, F.; D’Auria, L.; Amonte, C.; et al. The 2021 Cumbre Vieja eruption: An overview of the geochemical monitoring program. In Proceedings of the EGU General Assembly 2022, Vienna, Austria, 23–27 May 2022. [Google Scholar]
  15. D’Auria, L.; Koulakov, I.; Prudencio, J.; Cabrera-Pérez, I.; Ibáñez, J.M.; Barrancos, J.; García-Hernández, R.; Martínez-VanDorth, D.; Padilla, G.D.; Przeor, M.; et al. Tomographic imaging of the magmatic system feeding the 2021 Cumbre Vieja eruption (La Palma, Canary Islands). In Proceedings of the EGU General Assembly 2022, Vienna, Austria, 23–27 May 2022. [Google Scholar]
  16. Torres-González, P.A.; Luengo-Oroz, N.; Moure-García, Á.D.; Sáez-Gabarrón, L.; Villasante-Marcos, V.; López-Díaz, R.; Rodríguez-López, C.C.; D’Alessandro, W.; Pujol, L.; Grassa, F. Geochemical monitoring of the volcanic unrest and the eruption in La Palma island (Canary Islands, Spain): The 2017–2021 dataset and first results. In Proceedings of the EGU General Assembly 2022, Vienna, Austria, 23–27 May 2022. [Google Scholar]
  17. Milford, C.; Torres, C.; Vilches, J.; Suárez, D.; García, O.E.; Prats, N.; Barreto, A.; García, R.D.; Bustos, J.J.; Marrero, C.; et al. Air quality impacts of the 2021 volcanic eruption in La Palma (Canary Islands). 2022; In preparation. [Google Scholar]
  18. ACTRIS-Spain Coordinating Unprecedented Actions for the Cumbre Vieja volcanic Emergency. 2021. Available online: https://www.actris.eu/news-events/news/actris-spain-coordinating-unprecedented-actions-cumbre-vieja-volcanic-emergency (accessed on 22 September 2022).
  19. Carrillo, J.; Guerra, J.C.; Cuevas, E.; Barrancos, J. Characterization of the Marine Boundary Layer and the Trade-Wind Inversion over the Sub-tropical North Atlantic. Bound.-Layer Meteorol. 2016, 158, 311–330. [Google Scholar] [CrossRef]
  20. Barreto, A.; Cuevas, E.; García, R.D.; Carrillo, J.; Prospero, J.M.; Ilić, L.; Basart, S.; Berjón, A.J.; Marrero, C.L.; Hernández, Y.; et al. Long-term characterisation of the vertical structure of the Saharan Air Layer over the Canary Islands using lidar and radiosonde profiles: Implications for radiative and cloud processes over the subtropical Atlantic Ocean. Atmos. Chem. Phys. 2022, 22, 739–763. [Google Scholar] [CrossRef]
  21. Barreto, A.; García, R.D.; Guirado-Fuentes, C.; Cuevas, E.; Almansa, A.F.; Milford, C.; Toledano, C.; Expósito, F.J.; Díaz, J.P.; León-Luis, S.F. Aerosol characterization in the Subtropical Eastern North Atlantic region derived from long-term AERONET measurements. Atmos. Chem. Phys. Discuss. 2022, 2022, 1–28. [Google Scholar] [CrossRef]
  22. Holben, B.; Eck, T.; Slutsker, I.; Tanré, D.; Buis, J.; Setzer, A.; Vermote, E.; Reagan, J.; Kaufman, Y.; Nakajima, T.; et al. AERONET—A Federated Instrument Network and Data Archive for Aerosol Characterization. Remote Sens. Environ. 1998, 66, 1–16. [Google Scholar] [CrossRef]
  23. Giles, D.M.; Sinyuk, A.; Sorokin, M.G.; Schafer, J.S.; Smirnov, A.; Slutsker, I.; Eck, T.F.; Holben, B.N.; Lewis, J.R.; Campbell, J.R.; et al. Advancements in the Aerosol Robotic Network (AERONET) Version 3 database–automated near-real-time quality control algorithm with improved cloud screening for Sun photometer aerosol optical depth (AOD) measurements. Atmos. Meas. Tech. 2019, 12, 169–209. [Google Scholar] [CrossRef] [Green Version]
  24. Oneill, N.T.; Eck, T.F.; Smirnov, A.; Holben, B.N.; Thulasiraman, S. Spectral discrimination of coarse and fine mode optical depth. J. Geophys. Res. Atmos. 2003, 108, 4559. [Google Scholar] [CrossRef]
  25. Dubovik, O.; Sinyuk, A.; Lapyonok, T.; Holben, B.N.; Mishchenko, M.; Yang, P.; Eck, T.F.; Volten, H.; Muñoz, O.; Veihelmann, B.; et al. Application of spheroid models to account for aerosol particle nonsphericity in remote sensing of desert dust. J. Geophys. Res. Atmos. 2006, 111. [Google Scholar] [CrossRef]
  26. Sinyuk, A.; Holben, B.N.; Eck, T.F.; Giles, D.M.; Slutsker, I.; Korkin, S.; Schafer, J.S.; Smirnov, A.; Sorokin, M.; Lyapustin, A. The AERONET Version 3 aerosol retrieval algorithm, associated uncertainties and comparisons to Version 2. Atmos. Meas. Tech. 2020, 13, 3375–3411. [Google Scholar] [CrossRef]
  27. Bedoya-Velásquez, A.; Herreras-Giralda, M.; Román, R.; Wiegner, M.; Lefebvre, S.; Toledano, C.; Huet, T.; Ceolato, R. Ceilometer inversion method using water-vapor correction from co-located microwave radiometer for aerosol retrievals. Atmos. Res. 2021, 250, 105379. [Google Scholar] [CrossRef]
  28. Brooks, I.M. Finding Boundary Layer Top: Application of a Wavelet Covariance Transform to Lidar Backscatter Profiles. J. Atmos. Ocean. Technol. 2003, 20, 1092–1105. [Google Scholar] [CrossRef]
  29. Baars, H.; Ansmann, A.; Engelmann, R.; Althausen, D. Continuous monitoring of the boundary-layer top with lidar. Atmos. Chem. Phys. 2008, 8, 7281–7296. [Google Scholar] [CrossRef] [Green Version]
  30. Morille, Y.; Haeffelin, M.; Drobinski, P.; Pelon, J. STRAT: An Automated Algorithm to Retrieve the Vertical Structure of the Atmosphere from Single-Channel Lidar Data. J. Atmos. Ocean. Technol. 2007, 24, 761–775. [Google Scholar] [CrossRef] [Green Version]
  31. Ceolato, R.; Berg, M.J. Aerosol light extinction and backscattering: A review with a lidar perspective. J. Quant. Spectrosc. Radiat. Transf. 2021, 262, 107492. [Google Scholar] [CrossRef]
  32. Ceolato, R.; Bedoya-Velasquez, A.; Fossard, F.; Mouysset, V.; Paulien, L.; Lefebvre, S.; Mazzoleni, C.; Sorensen, C.; Berg, M.; Yon, J. Black carbon aerosol number and mass concentration measurements by picosecond short-range elastic backscatter lidar. Sci. Rep. 2022, 12, 761–775. [Google Scholar] [CrossRef]
  33. Zhang, Y.; Li, Z.; Liu, Z.; Wang, Y.; Qie, L.; Xie, Y.; Hou, W.; Leng, L. Retrieval of aerosol fine-mode fraction over China from satellite multiangle polarized observations: Validation and comparison. Atmos. Meas. Tech. 2021, 14, 1655–1672. [Google Scholar] [CrossRef]
  34. Theys, N.; De Smedt, I.; Yu, H.; Danckaert, T.; van Gent, J.; Hörmann, C.; Wagner, T.; Hedelt, P.; Bauer, H.; Romahn, F.; et al. Sulfur dioxide retrievals from TROPOMI onboard Sentinel-5 Precursor: Algorithm theoretical basis. Atmos. Meas. Tech. 2017, 10, 119–153. [Google Scholar] [CrossRef] [Green Version]
  35. Stein, A.F.; Draxler, R.R.; Rolph, G.D.; Stunder, B.J.B.; Cohen, M.D.; Ngan, F. NOAA’s HYSPLIT Atmospheric Transport and Dispersion Modeling System. Bull. Am. Meteorol. Soc. 2015, 96, 2059–2077. [Google Scholar] [CrossRef]
  36. Torres, B.; Dubovik, O.; Fuertes, D.; Schuster, G.; Cachorro, V.E.; Lapyonok, T.; Goloub, P.; Blarel, L.; Barreto, A.; Mallet, M.; et al. Advanced characterisation of aerosol size properties from measurements of spectral optical depth using the GRASP algorithm. Atmos. Meas. Tech. 2017, 10, 3743–3781. [Google Scholar] [CrossRef] [Green Version]
  37. Lekkas, E.; Meletlidis, S.; Kyriakopolous, K.; Manousaki, E.; Mavroulis, S.; Kostaki, E.; Michailidis, A.; Gogou, M.; Mavrouli, M.; Castro-Melgar, I.; et al. The 2021 Cumbre Vieja volcanoeruptionin La Palma (CanaryIslands). In Newsletter of Environmental, Disaster and Crises Management Strategies; 2021; Volume 26, Available online: https://edcm.edu.gr/en/newsletter/newsletter-26-2021-cumbre-vieja-volcano-eruption-in-la-palma-canary-islands (accessed on 3 November 2022).
  38. Derimian, Y.; Dubovik, O.; Tanre, D.; Goloub, P.; Lapyonok, T.; Mortier, A. Optical properties and radiative forcing of the Eyjafjallajökull volcanic ash layer observed over Lille, France, in 2010. J. Geophys. Res. Atmos. 2012, 117. [Google Scholar] [CrossRef] [Green Version]
  39. Prata, A.T.; Young, S.A.; Siems, S.T.; Manton, M.J. Lidar ratios of stratospheric volcanic ash and sulfate aerosols retrieved from CALIOP measurements. Atmos. Chem. Phys. 2017, 17, 8599–8618. [Google Scholar] [CrossRef] [Green Version]
  40. Kar, J.; Vaughan, M.; Tackett, J.L.; Omar, A.H.; Trepte, C.R.; Lucker, P. Constrained Lidar Ratios for Volcanic Ash and Sulfate Layers in the Stratosphere from CALIOP Version 4.10 data. In Proceedings of the AGU Fall Meeting Abstracts, Washington, DC, USA, 10–14 December 2018; Volume 2018, pp. A31P–3170. [Google Scholar]
  41. Mereu, L.; Scollo, S.; Boselli, A.; Leto, G.; Zanmar Sanchez, R.; Bonadonna, C.; Marzano, F.S. Dual-Wavelength Polarimetric Lidar Observations of the Volcanic Ash Cloud Produced during the 2016 Etna Eruption. Remote Sens. 2021, 13, 1728. [Google Scholar] [CrossRef]
  42. Müller, D.; Weinzierl, B.; Petzold, A.; Kandler, K.; Ansmann, A.; Müller, T.; Tesche, M.; Freudenthaler, V.; Esselborn, M.; Heese, B.; et al. Mineral dust observed with AERONET Sun photometer, Raman lidar, and in situ instruments during SAMUM 2006: Shape-independent particle properties. J. Geophys. Res. Atmos. 2010, 115. [Google Scholar] [CrossRef] [Green Version]
  43. Gasteiger, J.; Groß, S.; Freudenthaler, V.; Wiegner, M. Volcanic ash from Iceland over Munich: Mass concentration retrieved from ground-based remote sensing measurements. Atmos. Chem. Phys. 2011, 11, 2209–2223. [Google Scholar] [CrossRef] [Green Version]
  44. Schumann, U.; Weinzierl, B.; Reitebuch, O.; Schlager, H.; Minikin, A.; Forster, C.; Baumann, R.; Sailer, T.; Graf, K.; Mannstein, H.; et al. Airborne observations of the Eyjafjalla volcano ash cloud over Europe during air space closure in April and May 2010. Atmos. Chem. Phys. 2011, 11, 2245–2279. [Google Scholar] [CrossRef]
  45. WHO. WHO Global Air Quality Guidelines: Particulate Matter (PM2.5 and PM10), Ozone, Nitrogen Dioxide, Sulfur Dioxide and Carbon Monoxide; World Health Organization: Geneva, Switzerland, 2021; p. xxi, 273p. [Google Scholar]
  46. Copernicus Tracks Ongoing Emissions from La Palma Volcano Across Europe and the Caribbean. Technical Report, Copernicus Atmosphere Monitoring Service (CAMS). 2021. Available online: https://atmosphere.copernicus.eu/copernicus-tracks-ongoing-emissions-la-palma-volcano-across-europe-and-caribbean (accessed on 14 July 2022).
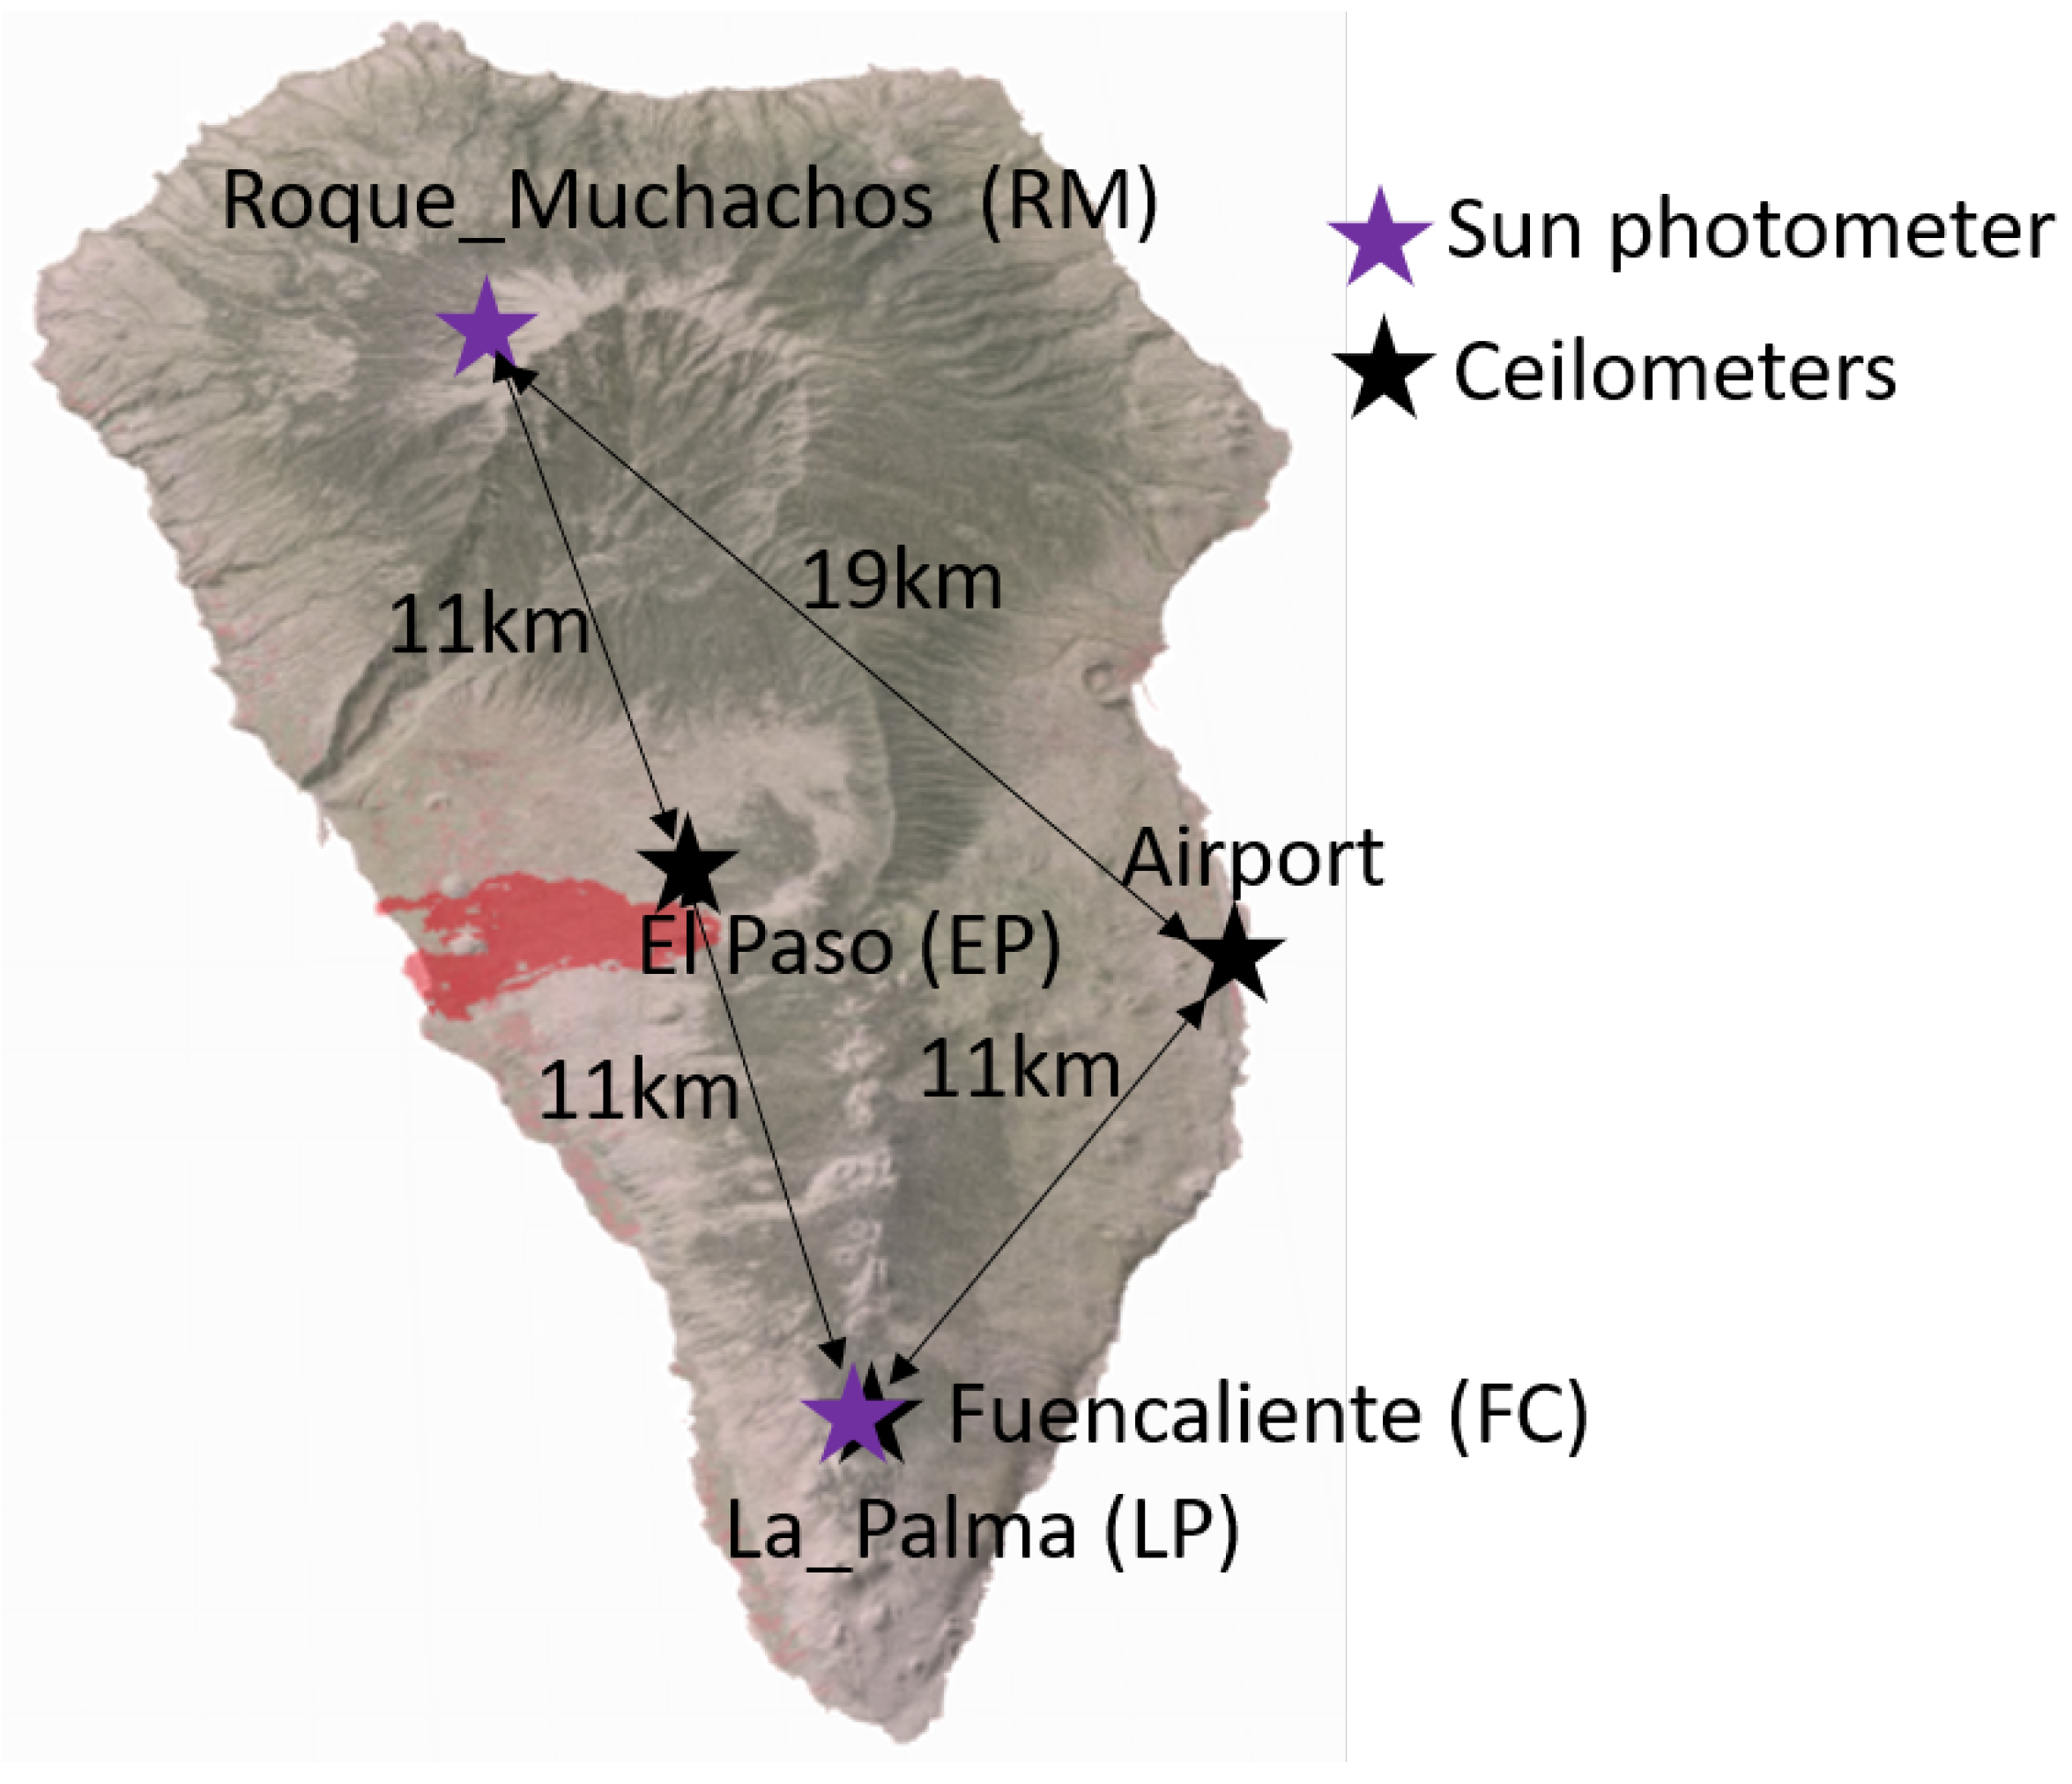
Figure 1. La Palma site description. The location of the different instruments is shown. The ceilometers and sunphotometers are shown in black and purple markers, respectively. Two sunphotometers were used at different altitude levels Roque_Muchachos(RM) at 2423 m asl and La_Palma (LP) at 56 m asl. RM is located in the north and LP in the south of the island. The ceilometers had three different locations. First, at Fuencaliente (from 20 September to 6 October 2021), the ceilometer CL51 was used, and then it was placed at the airport from 6 October to 14 December. Nearby to the volcano, the ceilometer CL61 measured from 25 September to 14 December 2021. All credits: https://ign-esp.maps.arcgis.com/, accessed on 1 July 2022.
Remotesensing 14 05680 g001
Figure 2. Block diagram of the methodology. An iterative backward Klett method was used to retrieve aerosol backscattering (Bwd Klett). WCT shows the wavelength covariant transform methods for estimating the boundary layer height. SNR is the signal-to-noise ratio, whereas radiative properties, such as backscattering and extinction coefficients, attenuated backscatter, lidar ratio, aerosol optical depth, and volume depolarization ratio, are referred to as β α , β a t t , LR, AOD, and δ , respectively.
Remotesensing 14 05680 g002
Figure 3. Mean AOD 910 in the upper panel (black circles and blue stars for LP and RM, respectively) and mean integrated β (red diamonds, all data availability considering all stations). The integrated β was considered from the CL51 ceilometer for the first block of data until 13 October 2021, then CL61 data were used from 25 October 2021 until the end of the volcanic eruption. Mean AOD fine/coarse fractions are displayed in the middle panel (black and red circles for LP and black and red stars for RM). Orange arrows highlight the days with dominant coarse mode fractions. The magenta dotted line refers to the experimental threshold imposed to classify the cases of interest, where fine and coarse differences were lower than 0.05. Finally, volume concentrations are shown in the bottom panel for the whole period, with the ones for the selected days highlighted in bold. The vertical dotted lines are the limits for the Aitken, accumulation, and coarse modes with their respective mean values.
Remotesensing 14 05680 g003
Figure 4. Ceilometer CL51 false color maps of β at two sites in La Palma, namely Fuencaliente and the airport. The data cover 19 September to 14 December 2021. Magenta dots represent the AsLH quantifications.
Remotesensing 14 05680 g004
Figure 5. Ceilometer CL61 false color maps of β (upper panel) and δ (lower panel) at the EL Paso site in La Palma. The data cover 25 October to 14 December 2021.
Remotesensing 14 05680 g005
Figure 6. Synoptic analysis of the transported ash plume to Toulouse, France. (a) The TROPOMI total column SO 2 concentration levels for the volcanic plume transported from La Palma to ONERA station. (b) The HYSPLIT 7-day back trajectories at 1000, 2000, and 3000 m agl.
Remotesensing 14 05680 g006
Figure 7. Aerosol radiative properties retrieved at Toulouse station. On the left, the rcs false color map is shown for 24 and 25 September. On the right, the black line indicated the mean β profile for 24 September at 14 h UTC with LR = 46.1 sr and AOD 910 = 0.25, whereas the inversion for 25 September is presented for 12 h UTC with LR = 53.6 sr and AOD 910 = 0.15.
Remotesensing 14 05680 g007
Table 1. Columnar products derived from the sun photometer and integrated β profiles. The values reported are the extrapolated mean and standard deviations at 910 nm for the selected days, avoiding the Saharan dust intrusions.
Radiative Properties
StationAOD FineAOD CoarseAODLR CoarseLR FineLR
RM0.03 ± 0.020.18 ± 0.050.21 ± 0.0721.0 ± 3.8 sr3.9 ± 0.8 sr24.9 ± 4.1 sr
LP0.03 ± 0.020.23 ± 0.060.26 ± 0.0730.1 ± 10.3 sr6.9 ± 1.8 sr41.1 ± 10.6 sr
Table 2. Radiative and microphysical ash properties retrieved by the synergy of the sunphotometer at the RM and LP stations and ceilometers at EP and FC. Values that pass some of the air quality limits set by the UK Meteorological Office are in color.
β (m 1 sr 1 )
Station β 0–1 km agl β 1–2 km agl β 2–3 km agl β 3–4 km agl
EP8 ± 4 × 10 7 7.9 ± 0.2 × 10 6 4 ± 9 × 10 6 5 ± 3 × 10 8
FC9.1 ± 0.3 × 10 6 3 ± 8 × 10 6 9.6 ± 0.1 × 10 8 5 ± 4 × 10 8
Mass concentration ( μ g m 3 )
Station β 0–1 km agl β 1–2 km agl β 2–3 km agl β 3–4 km agl
RM-EP fine2.6 ± 2.725.3 ± 2.712.8 ± 2.70.2 ± 2.7
RM-EP coarse23.9 ± 28.4235.7 ± 28.4119.3 ± 28.41.49 ± 28.4
LP-EP fine3.7 ± 4.736.0 ± 4.718.2 ± 4.70.2 ± 4.7
LP-EP coarse27.6 ± 44.3272.3 ± 44.3137.9 ± 44.31.7 ± 44.3
LP-FC fine41.5 ± 4.713.7 ± 4.70.4 ± 4.70.2 ± 4.7
LP-FC coarse313.7 ± 44.3103.4 ± 44.33.3 ± 44.31.0 ± 44.3
Publisher’s Note: MDPI stays neutral with regard to jurisdictional claims in published maps and institutional affiliations.