Abstract
Total phosphorus (TP) and total nitrogen (TN) reflect the state of eutrophication. However, traditional point-based water quality monitoring methods are time-consuming and labor-intensive, and insufficient to estimate and assess water quality at a large scale. In this paper, we constructed machine learning models for TP and TN inversion using measured data and satellite imagery band reflectance, and verified it by in situ data. Atmospheric correction was performed on the Landsat Top of Atmosphere (TOP) data by removing the effect of the adjacency effect and correcting differences between Landsat sensors. Then, using the established model, the TP and TN patterns in Dongting Lake with a spatial resolution of 30 m from 1996 to 2021 were derived for the first time. The annual and monthly spatio-temporal variation characteristics of TP and TN in Dongting Lake were investigated in details, and the influences of hydrometeorological elements on water quality variations were analyzed. The results show that the established empirical model can accurately estimate TP with coefficient (R2) ≥ 0.70, root mean square error (RMSE) ≤ 0.057 mg/L, mean relative error (MRE) ≤ 0.23 and TN with R2 ≥ 0.73, RMSE ≤ 0.48 mg/L and MRE ≤ 0.20. From 1996 to 2021, TP in Dongting Lake showed a downward trend and TN showed an upward trend, while the summer value was much higher than the other seasons. Furthermore, the influencing factors on TP and TN variations were investigated and discussed. Between 1996 and 2003, the main contributors to the change of water quality in Dongting Lake were external inputs such as water level and flow. The significant changes in water quantity and sediment characteristics following the operation of the Three Gorges Dam (TGD) in 2003 also had an impact on the water quality in Dongting Lake.
1. Introduction
Dongting Lake, the second-biggest freshwater lake in China and the largest lake below the Three Gorges Dam (TGD), is situated in the middle of the Yangtze River. It is the high-quality water resource in the Yangtze River Basin and an important wetland protection area in Central China. However, in recent years, under the influence of many factors such as urbanization and the operation of Three Gorges Dam (TGD), the phosphorus and nitrogen load and eutrophication in Dongting Lake’s waters have increased significantly [1]. Phosphorus and nitrogen nutrients are important causes of cyanobacterial blooms in lakes. Blooms may occur when total phosphorus (TP) and total nitrogen (TN) exceed 0.02 mg/L and 0.4 mg/L, respectively [2]. The eutrophication of water bodies caused by the release of phosphorus and nitrogen is the direct cause of the formation of blooms in the water. The cyanobacteria in the water body often lead to the dominance of the phytoplankton community succession with the eutrophication of lakes, notably the increase in phosphorus content [3]. Microorganisms consume large amounts of dissolved oxygen (DO) to break down algal debris, resulting in a significant drop in DO and even a lack of oxygen with killing fish. The ecological balance of the water body was destroyed by this biological activity [4]. The ecological security of the surrounding area is threatened by Dongting Lake’s deteriorated ecological environment [5]. Therefore, for the environmental management, control, and treatment of water pollution, monitoring water quality and understanding the mechanism of water eutrophication in Dongting Lake are of utmost importance.
In situ sampling and laboratory testing have a high degree of accuracy but take a lot of time and work, which are the mainstays of traditional water-quality monitoring. Moreover, the monitoring results at limited sampling locations cannot reflect the spatial distributions of water quality on the whole lake surface. Since the 1970s, satellite remote sensing has been widely applied in the water quality monitoring for oceanic, coastal, and inland waters [6,7]. Forster et al. determined seawater quality parameters using data from Landsat 5 Thematic Mapper (TM) over a coastal sewage outfall area [8]. Alparslan et al. established a link between in situ data and Enhanced Thematic Mapper Plus (ETM+) and assessed the water quality at the Merli Dam using the first four bands of Landsat 7 ETM+ data [9]. Anttila et al. used the semi-variogram to analyze the spatial representativeness of the samples, and the results showed that the discrete sampling data were not conducive to the inversion of water quality parameters in the study area [10]. Remote sensing compensates the drawbacks of conventional water quality monitoring techniques by providing long-term, extensive, regular, and inexpensive monitoring [11].
TP and TN are typical non-photosensitive parameters with low signal-to-noise ratios, which cannot be directly retrieved by remote sensing [12]. However, phosphorus and nitrogen are closely related to optically active components in water, including phytoplankton and non-algal particulate matter. The phytoplankton can be quantitatively characterized by chlorophyll-a (Chl-a) concentration, and non-algal particulate matter can be characterized by suspended particle content [13]. The major investigations employed statistical techniques to find remote sensing bands for phosphorus and nitrogen content inversion [14]. Since the different optical properties and morphology of phosphorus and nitrogen are presented in different lakes, some wavelengths from visible to near-infrared can be used to estimate TP and TN concentrations (Table 1).

Table 1.
Bands to estimate TP and TN concentrations.
At present, TP and TN inversion models are mainly divided into two types, semi-analytical modeling, and machine learning modeling. Semi-analytical models estimate water quality parameters based on inherent optical properties (IOPs), and hence have relatively good generalization capability. Wu et al. created a TP regression model for the link between Secchi depth (SD), Chl-a, and TP using Landsat 5, and then acquired the spatial distribution of TP concentration in the Qiantang River [16]. Liu and Jiang found a good correlation between TP and total suspended matter (TSS) concentration, and obtained the TP content in Poyang Lake’s surface layer based on MODIS by indirect inversion [18]. This method divided the concentration inversion into two steps, with a higher theoretical basis, and an improvement in accuracy [23]. The complex spectral characteristics of water bodies indicate that water quality remote-sensing inversion is essentially a nonlinear process. Machine learning refers to guiding computers through certain algorithms and using known data to obtain appropriate models, which have strong applicability, organization, and fault tolerance [12]. Therefore, it is suitable for constructing the intricate relationship between remote sensing images and water quality parameters. Guo et al. proposed a non-photosensitive parameter inversion method based on machine learning models and optimized band selection based on Sentinel-2 data [27]. These studies demonstrated the advantages of machine learning for inland water-quality remote sensing inversion.
In this paper, we develop and validate a machine learning model for long-term TP and TN estimation in Dongting Lake using in situ water quality measurements and synchronized Landsat data with satellite imagery atmospheric correction, continuity, and adjacency effects. Then, the monthly TP and TN concentrations in Dongting Lake from 1996 to 2021 were estimated, and the interannual temporal and spatial trends were presented. Finally, the influencing factors of water quality change in Dongting Lake are analyzed and discussed.
2. Materials and Methods
2.1. Study Area
Dongting Lake is located in the northern part of Hunan Province, China, on the southern bank of the Yangtze River’s Jingjiang section (Figure 1a). The lake is fed by seven major rivers and streams, including the Hunan, Zi, Yuan, and Li rivers in the south and the Ouchi, Taiping, and Songzi rivers in the north. Dongting Lake has a large flood storage capacity, which effectively reduces flood risks, and conserves water for the Yangtze River’s middle sections. The watershed of Dongting Lake is the birthplace of China’s traditional agriculture and a well-known land of fish and rice. In addition, Dongting Lake is one of the most focused wetland protection areas in China, providing an important guarantee for the maintenance of biodiversity. In recent years, the comprehensive influences of global climate change, rapid social and economic development of the watershed, the overutilization of resources, and the development of hydraulic engineering (e.g., the construction of TGD) have induced the water quality deterioration in Dongting Lake.
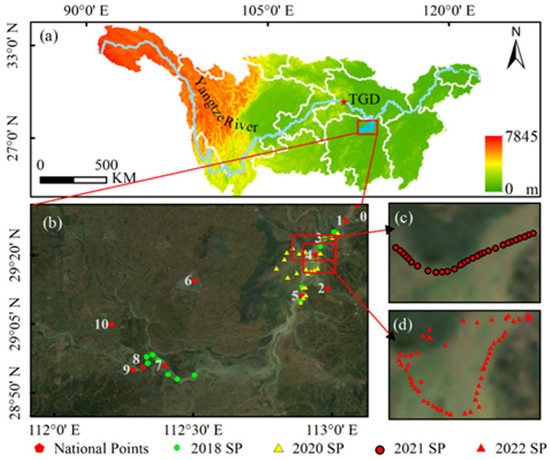
Figure 1.
The locations of the Dongting Lake, the Yangtze River, and the TGD (a), and the sampling points and the natural color composite in Dongting Lake (b); (c) and (d) are the locations of sampling sites in Dongting Lake in May 2021 and July 2022, respectively.
2.2. In Situ Measurements
Field measurements were obtained from two different sources: (1) 4-h water quality survey data in Dongting Lake from 2020 to 2022 provided by the Ministry of Ecology and Environment of the People’s Republic of China (https://www.mee.gov.cn/ (accessed on 1 August 2022)). These data provide water quality monitoring data for 11 monitoring sites in the Dongting Lake region (Dataset 1), covering a total of 182 samples available; (2) Data were collected from field surveys in Dongting Lake during 2018–2022 (Dataset 2). The available data for satellite matching are in April and July 2018, September 2020, May 2021, and July 2022 with a total of 156 pieces of available data. The data sample points are shown in Figure 1.
A 50 mL polyethylene water sampling device was used to collect water samples, which were then transported to the lab for additional examination after being kept in a dark refrigerator. TP concentrations were determined by the Ammonium molybdate spectrophotometric method [28], and TN concentrations were determined by the Alkaline potassium persulfate digestion UV spectrophotometric method [29]. The instrument for the measurement was a Spectrophotometer photoLab 7100 VIS—WTW (https://www.wtw.com/en/ (accessed on 2 October 2022)).
2.3. Remote Sensing Data
Landsat 5 TM, Landsat 7 ETM+, and the Operational Land Imager (OLI) of Landsat 8 provided images with a spatial resolution of 30 m and a revisit period of 16 days. In order to obtain the long-term water quality data in Dongting Lake with high spatial resolution, this paper selected the original Landsat satellite data as the satellite data source. Several standards were used in the picture screening: (1) The amount of cloud cover was restricted to 70%; (2) The lake’s area was only 20% cloud-covered, as determined visually from LandsatLook natural color photos. After screening, 344 pieces of level 1 remote-sensing data with satifying the requirements were obtained, including 53 Landsat-5 images, 65 Landsat-7 images, and 126 Landsat-8 images. Notably, Landsat 7 images taken after 31 May 2003 (when the scan line corrector failed) were only used for training and validating the models without mapping water quality in order to minimize the effects of data gaps, with the exception of the observation gap for Landsat-5 and 8 between 5 May 2012 and 11 April 2013.
The Level 2 Surface Reflectance (SR) data provided by Landsat were atmospherically corrected using the Landsat Ecosystem Disturbance Adaptive Processing System (LEDAPS) algorithm and the Land Surface Reflectance Code (LaSRC) algorithm, which were mainly used to support remote sensing inversion of land surfaces, but had limitations for water retrievals in several conditions. Acolite (version 20220222.0) is an integrated processing software for Landsat 5/7/8 and Sentinel-2 that incorporates dark spectral fitting (DSF) and exponential extrapolation (EXP) algorithms to correct incoming top of atmosphere (TOP) data (Level 1) to remote sensing reflectance (Rrs) data [30,31]. This study used the DSF algorithm to conduct atmospheric correction of Landsat TOP data. At the same time, we used the infrared band closest to 1600 nm to remove clouds and other non-water pixels with a threshold of 0.0215.
When the radiation from adjacent brighter land pixels may be scattered into the field of view of dark water pixels, the land adjacency effect results in uncertainty in water radiance [32]. Due to the higher reflectance contrast between land and water, these effects tend to grow dramatically with increasing wavelength, producing extremely high radiance in the SWIR bands [33]. In order to avoid the severe land proximity effect, a 300 m water boundary buffer was constructed in this paper, and the data in the buffer were removed [34].
When compared to the TM and the ETM+, the OLI has narrower spectral bands, better calibration and signal-to-noise characteristics, higher 12-bit radiometric resolution, and more exact geometry. In order to transit between similar sensor bands, Roy et al. constructed statistical functions, and sensor NDVI values were reported. Ordinary least squares (OLS) regression was used to develop the transformation functions, which fit pretty consistently (R2 > 0.7, r < 0.0001) [35]. Before building the model and inverting the results, this paper utilizes these functions to transform the TM and ETM+ bands with improving the temporal continuity between TM, ETM+, and OLI sensor data.
2.4. Hydrometeorological Data
The data of water level, flow, precipitation, and temperature were used to analyze the influence factors of TP and TN changes (Table 2). The monthly precipitation data and temperature data were collected from the nearest station to Dongting Lake, namely Changde Station of National Meteorological Data Center (http://data.cma.cn/ (accessed on 1 August 2022)). The water level data were collected daily by the Chenglingji Hydrological Station from the Hubei Provincial Hydrological Bereau (Figure 1b) and Water Resources Center (http://slt.hubei.gov.cn/sw/ (accessed on 1 August 2022)).

Table 2.
The hydrometeorological data were used in this study.
2.5. Principles and Methods
2.5.1. Principle of Water Quality Inversion
The concept of bio-optical was proposed by Smith and Baker (1978) [36], which refered to the optical properties of water bodies due to the combined effect of absorption and scattering of light by phytoplankton and their decomposed biomass. The bio-optical properties of water include IOPs, apparent optical properties (AOPs), and the relationship between AOPs and IOPs of water components [37]. IOPs refer to optical quantities that do not change with incidental light and are only related to water components, including beam attenuation coefficient c, absorption coefficient a, scattering coefficient b, and scattering phase function P, etc. [38]. There are four main substances that determine the intrinsic optical properties of inland water bodies: pure water; Chl-a; TSS; and CDOM, and each of them has its own intrinsic optical quantity [39]. The unit absorption and scattering coefficients are the ratio of the absorption and scattering coefficients of each water body component to its concentration, respectively.
AOPs are the optical parameters of the water body that vary with the incident light field [38]. Water-color remote sensing is to inverse the concentration of water quality components with the use of AOPs. Common AOPs are mainly off-water irradiance Lw and reflectance Rrs = Lw/Ed(0+), and Ed(0+) is the incident downlink irradiance at the water surface and just below the water surface irradiance ratio R(0−) = Eu(0−)/Ed(0−), where Eu(0−) is the upward irradiance just below the water surface, and Ed(0−) is the downward irradiance just below the water surface. AOPs of the water body can be measured by a spectrometer.
R(0−) is less influenced by the solar altitude angle, atmosphere, and water surface conditions, independent of light intensity. R(0−) is the bridge between AOPs and IOPs of the water body, which is an important parameter for establishing bio-optical models [40]. Bio-optical modeling is an orthorectified process to simulate the radiation signals received by remote sensors by using measurements of water quality parameters’ concentrations and intrinsic optical quantities of water bodies [41]. The water quality inversion based on the bio-optical model assumes that the unit absorption and scattering coefficients of the individual water body components are known, and R(0−) is also known, and then the concentrations of the water quality parameters are calculated from the obtained Rrs:
TP and TN are not components that affect the AOPs of water bodies, and remote sensing inversion methods based on bio-optical models cannot be used directly. However, phosphorus mainly exists in the form of particles in lakes, mainly from soil erosion, and phosphorus concentration has an important effect on the growth and reproduction of phytoplankton [14]. TN refers to the content of nitrogen elements in water, including ammonia nitrogen, nitrate nitrogen, nitrite nitrogen, and organic nitrogen [42]. Aquatic plants’ roots and stems can grow and develop more rapidly with thanks to phosphorus and nitrogen. Excessive nutrient content causes algae to multiply, and gradually reduces water bodies’ transparency. The development of aquatic vegetation was no longer restricted, and the lake showed the characteristics of eutrophication [43]. Therefore, there is a strong correlation between the content of TP and TN with the concentrations of Chl-a, CDOM, and TSS, and the following relationships are established indirectly with remote sensing data:
Xiong et al. [14] compared the indirect analysis method and the empirical method to construct TP inversion models and found that the model results from the empirical method were better than those from the indirect analysis method, mainly because the indirect analysis method had two-step errors, which reduced the model accuracy. The empirical method is based on the theory of indirect analysis method and directly explores the mathematical relationship between water quality parameters and Rrs, which avoids more errors brought by the indirect analysis method [23].
2.5.2. Methods of Water Quality Inversion
The empirical modeling of water quality inversion is to fit the relationship between remote sensing data and water quality measurements using mathematical models. The model development mainly includes establishment, evaluation and application. Before the model is established, the optimal features for water quality estimation are selected.
- 1
- Optimal feature selection
Remote sensing indices (RSIs) have provided better sensitivity than a single spectrum [44]. In order to provide the model with higher water quality inversion accuracy, common RSIs are added on the basis of a single band. According to the number of bands in the feature calculation, all features were divided into three categories, namely F1-band, F2-band, and F3-band (Table 3). Then, the Pearson correlation coefficient (r) of the band features with TP and TN are calculated, respectively, with the linear relationship between remote sensing data and field measurements:
where X is the value of the band combination; is the average of all band combinations; Y is the concentration of TP and TN; and is the average of all water quality parameters.

Table 3.
List of model input indices, formulas, and references.
More samples are needed for model training because there are more characteristics. Therefore, by setting the r threshold, we further filter out the features that contribute significantly to prediction. For the construction and validation of the model, characteristics of |r| between 0.1 and 0.9 were employed to match the water-quality measurement data.
- 2
- Model establishment and evaluation
The optical properties of TP and TN are weak, and the signal-to-noise ratio is poor, so remote sensing data cannot be directly used for inversion [51]. Therefore, TP and TN inversion requires the help of machine learning method to construct models for water quality parameters estimation and reduce indirect remote-sensing analysis. In this study, the linear regression model, regression tree model, support vector machine model, Gaussian process regression model (GP), and neural network model (NN) in machine learning were used to construct models for water quality parameters inversion. Then, by adjusting the model parameters, the optimal models of TP and TN inversion are established. Here 90% of the measured data were used as the modeling imput data, and the rest were used as the test data to evaluate the model. Model-checking is to observe whether the created mathematical model conforms to the actual situation after solving. The model evaluation includes the coefficient of determination (R2), Root Mean Square Error (RMSE), and Mean Relative Error (MRE) [22]:
where EV is the water quality concentration estimated by the model; MV is the measured water quality concentration; is the mean value of measured water quality parameter concentration; and n is the total number of measured water quality samples.
3. Results and Analysis
3.1. Feature Selection
Before model construction, we calculated r between RSIs and TP/TN and preliminarily screened RSIs according to the threshold to avoid the model for acquiring too many redundant parameters, which improved the model accuracy and efficiency (Figure 2).
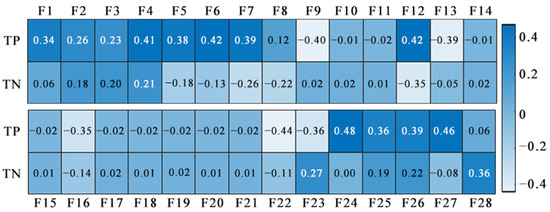
Figure 2.
The r between TP/TN and model input indices.
F1–F6 are single bands, including blue, green, red, near-infrared (NIR), shortwave infrared 1 (SWIR1), and shortwave infrared 2 (SWIR2). There are positive correlations between TP and F1-band, and the correlation with F6 (SWIR2) is the strongest (r = 0.42). The correlation between TP and F4 (NIR) is similar to that of F6 (r = 0.41), the correlations with F1 (blue) and F5 (SWIR1) are between 0.3 and 0.4, and the correlations with the other two are between 0.2 and 0.3.
Comparing with the correlation between TP and F1-band, the correlation between TN and F1-band are slightly lower. Among them, F1–F4 show positive correlations with TN, and F5 and F6 show negative correlations with TN. The correlation between F4 and TN is better, r = 0.21, and the correlations between the other single bands and TN are not significant.
Besides F1-band, we also computed 22 RSIs to improve the performance of model learning. F7–F21 are simple band ratios. F7 and F12 show a good positive correlation with TP (r = 0.39 and r = 0.42), and F9, F13, and F16 have a good negative correlation with TP (r = −0.40, −0.39, and −0.35). The correlations between TN and band ratios are weak, only F7 and F12 show good negative correlations with TN, and the other indices have no significant correlations. F22 and F23 are water body indices, and the correlations between TP and them are very strong, −0.44 and −0.36, but the correlations between TN and water body indices are not as good as TP, and the correlations are −0.11 and 0.27. F24–F27 all show good correlations with TP, with the best correlation for F24 (NDVI) with TP among all RSIs (r = 0.48), and the second highest correlation for F27 (Green-Blue NDVI) with TP (r = 0.46). F26 and F28 also show good correlations with TN.
The correlations between TP/TN and F2-band and F3-band are stronger than that of the single bands. Screening out characteristic bands with high correlation can improve the accuracy of the model. Finally, 15 feature bands and 7 feature bands were employed as the input data for the TP model and TN model, respectively.
3.2. Model Establishment and Accuracy Evaluation
When the model is building, a variety of machine learning regression methods are employed, shown in Figure 3. Among them, the GP shows good performance in the construction of the TP inversion model (R2 = 0.7, RMSE = 0.057, MRE = 0.23). When TP is greater than 0.6 mg/L, the model’s estimated value is small, but the model performs well as a whole. The ensemble tree algorithm (ET) is relatively good in TP model building (R2 = 0.65, RMSE = 0.11), but its performance from the test set is poor with R2 less than 0.5. The rest of the algorithms perform poorly in constructing the TP inversion model.
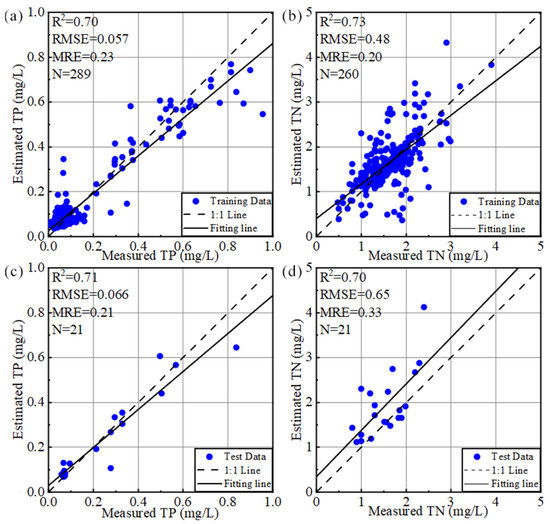
Figure 3.
Performances of TP inversion model, including training datasets (a) and test datasets (c) based on GP model, and performance of TN inversion model, including training datasets (b) and test datasets (d) based on NN model.
The NN model performs better in the TN inversion model construction (R2 = 0.73, RMSE = 0.48, MRE = 0.20). The inversion result makes the value of TN slightly larger if the TN is too small, and the value of the larger TN is slightly smaller, reducing the value range. Although the performance of the model from the test set is not as good as that from the training set, the overall performance is well-balanced. The R2 of the rest of the trained models are all less than 0.5, which were discarded in this study.
3.3. Long-Time Yearly Spatial Variations of Water Quality
The interannual variation trends of TP and TN in Dongting Lake are investigated and shown in Figure 4. From 1996 to 2021, the mean concentrations of TP and TN were 0.11 mg/L and 1.60 mg/L, respectively. From 1996 to 2010, TP showed an obvious upward trend, and particularly from 2003 to 2010, the upward trend was significant. After 2010, TP showed a downward trend year by year, and appeared its minimum around 2014. After 2014, the TP content showed a slight upward trend, but the overall difference was not significant. The inter-annual variation of TN was small with an upward trend in bands. The minimal TN was appeared in 2002, and the maximal TN was appeared in 2019. The TN content was increased year over year from 1996 to 1999. The TN content was fluctuated upward between 2000 and 2012. After 2012, it showed an upward trend year after year again, but the change was minimal.
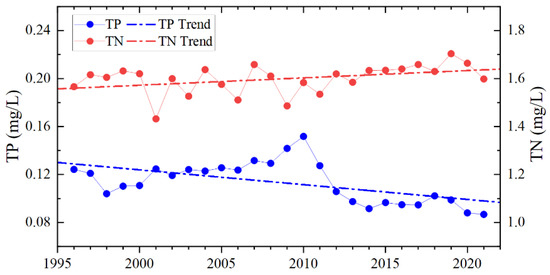
Figure 4.
Changes in water quality parameters in Dongting Lake from 1996 to 2021.
The TP and TN inversion results from 1996 to 2021 were synthesized into an annual spatial distribution image with the mean value. TP and TN distribution images are shown in Figure 5 and Figure 6.
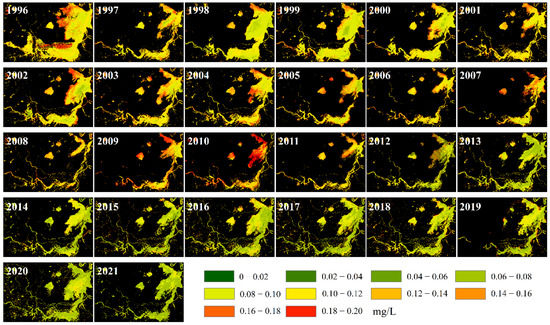
Figure 5.
Spatial distribution of TP in Dongting Lake.
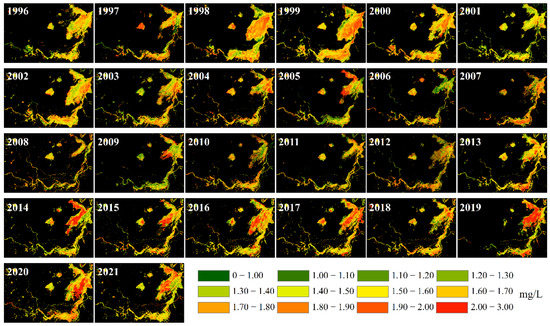
Figure 6.
Spatial distribution of TN in Dongting Lake.
The TP range was from 0 to 0.2 mg/L. The spatial distribution of TP concentration showed that the TP on the edge of the lake was higher than that in the center of the lake, and the TP on the southern side of the lake was higher than that in the northern area. From 1996 to 2010, TP in Dongting Lake was increased year by year, and the area with high TP concentration became wider and gradually spread from the edge to the center of the lake. By 2010, almost the entire northern area of Dongting Lake was a high concentration area. After 2011, the TP concentration in the entire Dongting Lake was gradually decreased, and the areas with high TP concentration were only existed in a small amount at the edge of the lake.
The TN was ranged from 0 to 3 mg/L. The distribution of TN in the north–south direction was the same as that of TP, which was higher in the north and lower in the south. However, the difference is that the concentration of TN in the center of the lake was much higher than that at the edge of the lake. Before 2014, the highest value of TN was about 2 mg/L. After 2014, the overall TN concentration became higher, and the high value was also changed from 2 mg/L to 3 mg/L, but the distribution area of the high value became smaller, mainly concentrated in the northern area of the lake, and the concentration in the southern area was relatively low.
3.4. Seasonal Changes in Water Quality Parameters
Dongting Lake is a typical seasonal lake. The water area changes greatly within a year and the water body forms are different in the four seasons. The seasonal distribution images are shown in Figure A1 and Figure A2. The seasonal distribution characteristics of TP and TN are different. Seasonal changes can reflect the water-quality change trend in Dongting Lake throughout the year. In order to depict the seasonal variation in spring, summer, autumn, and winter, we estimated the average seasonal TP and TN in Dongting Lake from March to May, June to August, September to November, and December to February, respectively.
Figure 7 and Figure 8 are the seasonal composite images of water quality parameter concentrations in the Dongting Lake area from 1996 to 2021. The spatial distributions of TP concentration have little difference among the four seasons, and the concentration in the lake edge is higher than that in the lake center. Different from the seasonal distribution of TP concentration, there was a great difference in the seasonal distribution of TN. TN was low in spring and winter, only a few high-value areas appeared in the northern part of the lake, and the TN in the rest of the lake was at a low level. However, in summer and autumn, the entire Dongting Lake area was in a state of high TN concentration.

Figure 7.
Quarterly composite image of TP content in Dongting Lake.

Figure 8.
Quarterly composite image of TN content in Dongting Lake.
3.5. Comparison of Water Quality Change Trends between Wet and Dry Seasons
From May to September, it is the wet season in the Dongting Lake area, and Dongting Lake is in the form of a planar lake. From October to April, it is the dry season in the Dongting Lake area, and most of the Dongting Lake is in the form of a linear river. The TP and TN contents are also different between these two periods. The contents of TP and TN in the dry and wet seasons of Dongting Lake from 1996 to 2021 are shown in Figure 9.
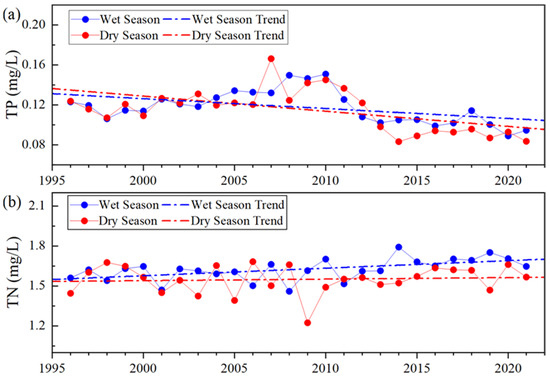
Figure 9.
Comparison of TP (a) and TN (b) variations in Dongting Lake in the wet season and dry season.
From 1996 to 2021, the content of TP showed a downward trend in both dry and wet seasons, and the decreasing trend of TP content in the dry season was more significant. In most years, the TP content was higher in the wet season than in the dry season, but the TP concentration in the dry season in 2007 reached 0.16 mg/L, which was higher than that in the wet season. In 1999, 2003, 2011, and 2012, the TP content in the dry season was higher than that in the wet season, while the difference was not significant.
On the whole, the TN concentration showed an upward trend in both the dry and wet seasons, and the increasing trend of TN in the wet season was much higher than that in the dry season. Before 2010, the difference of TN content in the wet and dry seasons had no obvious characteristics, but after 2010 the TN content in the wet season was higher than that in the dry season.
4. Discussion
4.1. Feasibility of Long-Term Water Quality Retrieval
In order to obtain the spatial distribution of TP and TN in Dongting Lake for a long time series, we used the DSF algorithm to perform atmospheric correction on the Landsat TOP data and obtained the Rrs data. Compared with the common LaSRC algorithm, this algorithm is more suitable for large-area water bodies [52]. We used a variation function to achieve no transition between sensors to reduce errors caused by sensor differences. The measured sample data covered the entire Dongting Lake area with each month. The input data of the model used the mean Rrs of the cloud-free pixels in the 3 × 3 grid of sampling points to reduce the error caused by the image point offset. Subsequently, a machine learning model was constructed to invert the TP and TN in Dongting Lake using the Rrs data. Our model was generally more accurate than other inversion models for the study area with a higher correlation (Table 4).

Table 4.
Accuracy of TP and TN inversion models in other studies.
Geng et al. [55] used the average value of nine stations in Dongting Lake to analyze the variation law of TP and TN content. A comparison with Geng’s data is shown in Figure 10:

Figure 10.
Comparison between remote sensing estimation results and Geng et al.’s results [55]. (a) Annual mean of TP content, and (b) Annual mean of TN content.
Our results are almost consistent in trend with Geng et al. [55], but there is a gap in the value. Possible reasons are: 1. Geng et al. [55] used the monitoring data of nine stations to replace the average value of the entire lake, and our data used the average value of each pixel result; 2. The model used in this study was a data-driven model, and the model performance was data-dependent. Although this study strictly controled the quality of the input data, the time and space distributions covered the water quality environment of Dongting Lake, while the R2 of the model was still only 0.70, so there was a certain error between the statistical results of TP and TN and the actual measured data.
4.2. Factors Related to TP and TN
The water quality of the Dongting Lake area shows significant trends, inter-annual and intra-annual differences, which are mostly related to meteorological and human factors. The relationship between water quality parameters and hydrometeorological elements is further analyzed.
4.2.1. Hydrometeorological Effects
This paper was focused on the four common hydrometeorological parameters of precipitation, temperature, water level, and flow. The annual mean values of the four parameters were calculated, and the Pearson correlation coefficients between them and TP/TN were calculated (Figure 11).
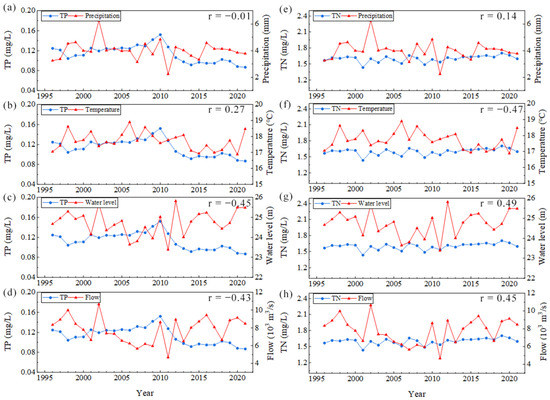
Figure 11.
Annual time series of hydrometeorological elements and water quality parameters. (a) TP and Precipation, (b) TP and Tempreture, (c) TP and Water level, (d) TP and Flow, (e) TN and Precipation, (f) TN and Tempreture, (g) TN and Water level, and (h) TN and Flow.
There is a positive correlation between temperature and TP, r = 0.27, and the change trends are highly consistent from 1999 to 2006 and from 2013 to 2018. There was a negative correlation between water level and TP, r = −0.45, showing an opposite trend in most years, but inconsistent characteristics were appeared around 2001 and 2010. The correlation between TP and flow is similar to that between TP and water level, both showing a negative correlation. However, there was no significant correlation between precipitation and TP. The correlations between TN and these four parameters are different from that of TP. TN showed a negative correlation with temperature (r = −0.47), and a good positive correlation with water level and flow (r = 0.49 and r = 0.48). Likewise, the change of TN was not significantly related to the trend of precipitation change.
Precipitation and temperature are climatic variables, which have little effect on TP and TN in Dongting Lake. Although the precipitation is not significantly correlated with the interannual variation of phosphorus and nitrogen content, the precipitation increases the surface runoff and thenincreases the total amount flowing into lakes. Temperature affects the consumption of phosphorus and nitrogen by plankton in water [56]. When the temperature increases, the growth cycle of plankton accelerates, thereby increasing the consumption of phosphorus and nitrogen in the water body [44]. Water level and flow are hydrological variables. Dongting Lake is the storage lake of the Yangtze River. Its hydrological characteristics are greatly affected by the Yangtze River, and the Yangtze River’s water will also have an impact on Dongting Lake’s water quality. This is also supported by the calculated correlation. The effects of water level and flow on TP and TN in Dongting Lake are divided into two parts: 1. The total amount of water is increased, which has a diluting effect on TP and TN, and decreases the TP and TN in Dongting Lake; 2. The upstream water brings a large amount of phosphorus and nitrogen to Dongting Lake, which increases TP and TN. According to the statistical data of the long-term series, it can be seen that the water level and flow are negatively correlated with TP, and more of them play a role in dilution, while they have a positive correlation with TN, and more of them are transported to Dongting Lake.
4.2.2. Human Activities Effects
During the period from 1998 to 2003, the project of returning farmland to Dongting Lake was successfully implemented by expanding the lake area [57], and the dilution and self-purification capacity of the lake water were enhanced. It can be seen from Figure 4 that during this period, the trend of TP change is down, and TN has a downward trend of fluctuation. In the 2000s, the local government restricted the use of phosphate-containing laundry detergents [58], which effectively controlled the phosphorus pollutants discharged into Dongting Lake. From 2000 to 2006, the TP content in Dongting Lake did not show an increasing trend. It can also be seen from the spatial distribution (Figure 5) that the area of TP > 0.1 is reduced.
From 2003 to 2010, the Three Gorges Reservoir completed the highest water storage capacity of 175 m during this period, resulting in a larger decrease in the amount of water entering Sanjin Lake when compared with the previous period (Figure 11c,d). The water exchange period in Dongting Lake was extended from 18.2 d before the dam was built to 214 d [59], the self-purification capacity of the water body was decreased, and the retention of phosphorus and nitrogen in the water body was increased.
The water pollution of East Dongting Lake is more serious than in other regions [7]. The papermaking enterprises in the Dongting Lake area are mainly distributed in the East Dongting Lake, and the pulping capacity accounts for more than half of the lake area. Beginning in 2006, the local government shut down some paper mills, which alleviated the water pollution in East Dongting Lake [60].
The main reasons for the deterioration in water quality after 2010 are the combined effects of industrial pollution, agricultural pollution, domestic sewage, and the operation of the Three Gorges Project. Previous studies have found that in 2010, the nitrogen fertilizer application rate in the Dongting Lake area was as high as 290.8 kg/ha [61], and the average nitrogen fertilizer utilization rate was about 37% [14]. The content of nitrogen in the material has been on the rise. In addition, the GDP in Dongting Lake area has doubled from 90.3 billion yuan in 2001 to 856.4 billion yuan in 2018 [55], and the annual urban domestic sewage discharged into the lake is as high as 4.03 × 10⁸ t [56]. It is also one of the main sources of phosphorus and nitrogen content in lakes. During this period, TN always showed an upward trend, and the change trend of TP also changed from falling to rising, as shown in Figure 4.
5. Conclusions
In this study, an inversion model of TP and TN estimation in Dongting Lake was established and validated based on Landsat data and field-measured data. This method can effectively excavate the relationship between the optical properties of water body in Dongting Lake and TP and TN. The machine learning models have good applicability in estimating TP with coefficient R2 ≥ 0.70, RMSE ≤ 0.057 mg/L and MRE ≤ 0.23, and TN with coefficient R2 ≥ 0.73, RMSE ≤ 0.48 mg/L and MRE ≤ 0.20 in Dongting Lake. Furthermore, the long-term variations of TP and TN are estimated and investigated in Dongting Lake from 1996 to 2021. TP in Dongting Lake showed a downward trend, and TN showed an upward trend. The contents of TP and TN in summer were much higher than those in other seasons. By analyzing hydrometeorological elements with TP and TN, it is found that water level, flow, and temperature have a good correlation with TP and TN contents. The temperature was positively correlated with TP and negatively correlated with TN. Water level and flow were negatively correlated with TP and positively correlated with TN. The external nutrient inputs by urbanization and large-scale precipitation in watersheds are the main factors for the increase in TP and TN contents in Dongting Lake. The operation of TGD since 2003 also affects the content of TP and TN in Dongting Lake.
Author Contributions
Conceptualization, Y.Z. and S.J.; methodology, Y.Z. and J.Z.; validation, Y.Z., N.W. and H.G.; formal analysis, Y.Z.; investigation, Y.Z.; resources, Y.Z.; data curation, Y.Z.; writing—original draft preparation, Y.Z., H.G., P.P. and S.J.; writing—review and editing, Y.Z.; visualization, Y.Z.; supervision, S.J.; project administration, S.J.; funding acquisition, S.J. All authors have read and agreed to the published version of the manuscript.
Funding
The work was supported by the Strategic Priority Research Program Project of the Chinese Academy of Sciences (Grant No. XDA23040100) and Jiangsu Natural Resources Development Special Project (Grant No. JSZRHYKJ202002).
Data Availability Statement
4-h water quality survey data in Dongting Lake from 2020 to 2022 were provided by the Ministry of Ecology and Environment of the People’s Republic of China (https://www.mee.gov.cn/ (accessed on 1 August 2022)), and Landsat 5 TM, Landsat 7 ETM+, and the Operational Land Imager (OLI) of Landsat 8 provided images are provided by USGS (EarthExplorer (usgs.gov)) (accessed on 1 August 2022).
Acknowledgments
The authors would like to acknowledge the data provided by the United States Geological Survey (USGS) and the National Aeronautics and Space Administration (NASA), and Xi’an Institute of Optics and Precision Mechanics, Chinese Academy of Sciences.
Conflicts of Interest
The authors declare no conflict of interest.
Appendix A
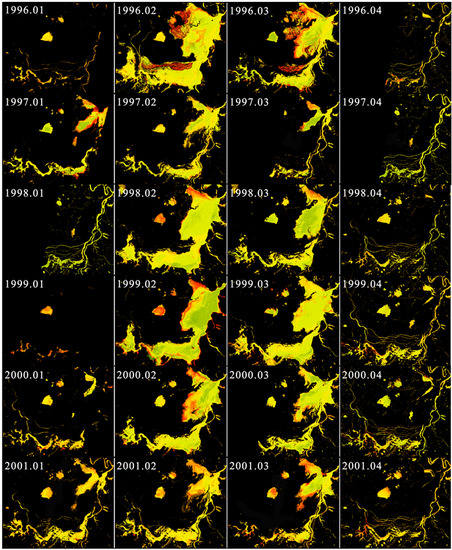
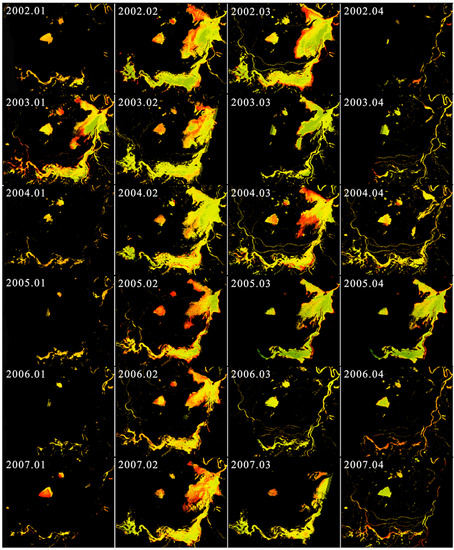
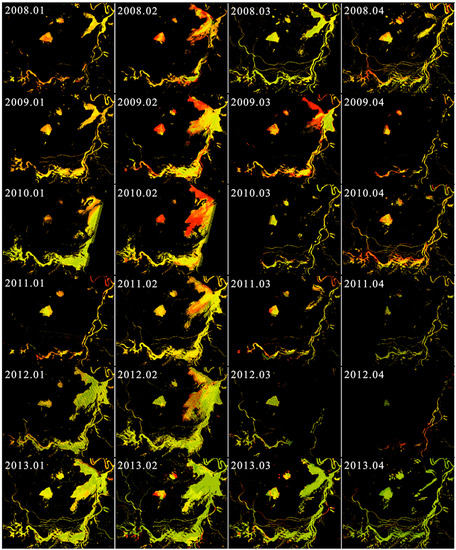
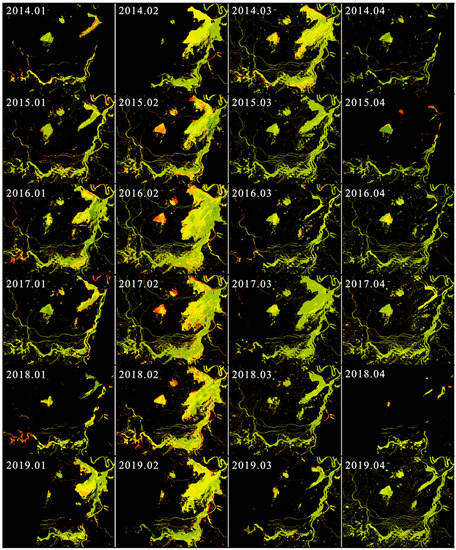
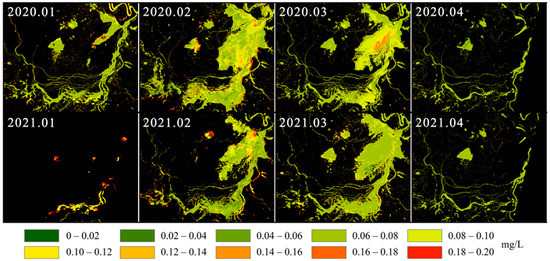
Figure A1.
Quarterly distribution of TP in Dongting Lake.
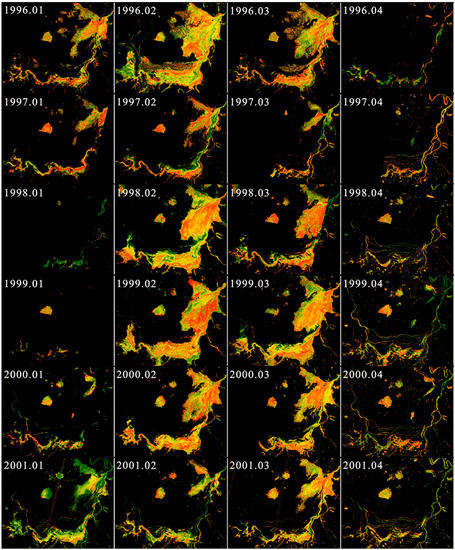
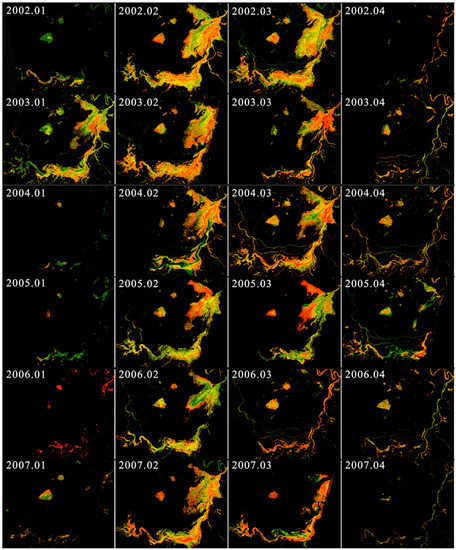
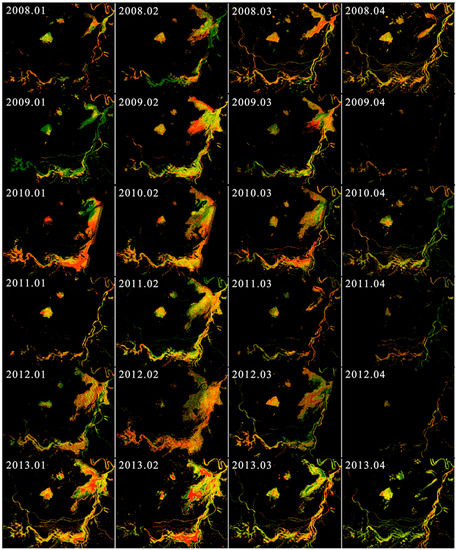
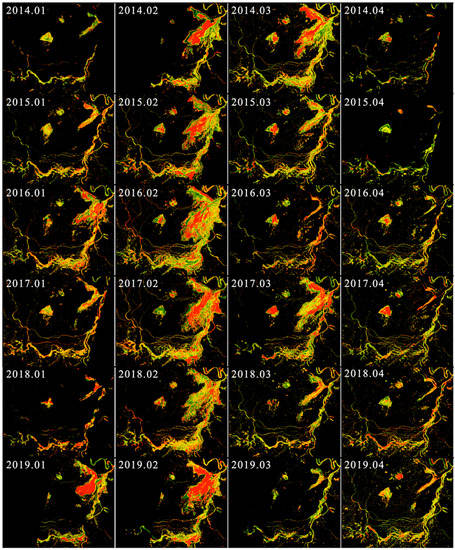
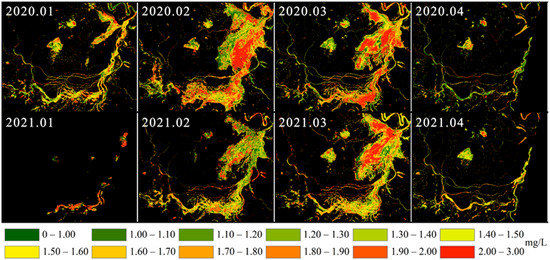
Figure A2.
Quarterly distribution of TN in Dongting Lake.
References
- Xue, Y.; Liu, P.J.; Liu, J.L.; Sun, Y.R. Annual variation characteristics of eutrophication in Dongting Lake, China. Proc. Inst. Civ. Eng.-Water Manag. 2020, 173, 208–216. [Google Scholar] [CrossRef]
- Ma, J.R.; Deng, J.M.; Qin, B.Q.; Long, S.X. Progress and prospects on cyanobacteria bloom-forming mechanism in lakes. Acta Ecol. Sin. 2013, 33, 3020–3030. [Google Scholar] [CrossRef]
- Steiberg, C.E.W.; Hartmann, H.M. Planktonic bloom forming cyanobacteria and the eutrophication of lake and rivers. Freshw. Biol. 1988, 20, 279–287. [Google Scholar] [CrossRef]
- Sun, Y.Y.; Hou, G.L. Analysis on the Spatial-Temporal Evolution Characteristics and Spatial Network Structure of Tourism Eco-Efficiency in the Yangtze River Delta Urban Agglomeration. Int. J. Environ. Res. Public Health 2021, 18, 2577. [Google Scholar] [CrossRef] [PubMed]
- Peng, X.; Sheng, S.H. Present Situation and Countermeasures of the Environmental Pollution in Dongting Lake. Anhui Agric. Sci. Bull. 2021, 27, 143–145. [Google Scholar] [CrossRef]
- Wang, L.; Bai, H.W. Research review on retrieval of water quality parameters about lake based on remote sensing techniques. GNSS World China 2013, 38, 57–61+72. [Google Scholar] [CrossRef]
- Gholizadeh, M.H.; Melesse, A.M.; Reddi, L. A comprehensive review on water quality parameters estimation using remote sensing techniques. Sensors 2016, 16, 1298. [Google Scholar] [CrossRef]
- Forster, B.C.; Sha, X.W.; Xu, B.D. Remote sensing of sea water quality parameters using Landsat-TM. Int. J. Remote Sens. 1993, 14, 2759–2771. [Google Scholar] [CrossRef]
- Alparslan, E.; Aydöner, C.; Tufekci, V.; Hüseyin, T. Water quality assessment at Ömerli Dam using remote sensing techniques. Environ. Monit. Assess. 2007, 135, 391–398. [Google Scholar] [CrossRef]
- Anttila, S.; Kairesalo, T.; Pellikka, P. A feasible method to assess inaccuracy caused by patchiness in water quality monitoring. Environ. Monit. Assess. 2008, 142, 11–22. [Google Scholar] [CrossRef]
- Li, J.; Pei, Y.Q.; Zhao, S.H.; Xiao, R.L.; Sang, X.; Zhang, C.Y. A Review of Remote Sensing for Environmental Monitoring in China. Remote Sens. 2020, 12, 1130. [Google Scholar] [CrossRef]
- Sagan, V.; Peterson, K.T.; Maimaitijiang, M.; Sidike, P.; Sloan, J.; Greeling, B.A.; Maalouf, S.; Adams, C. Monitoring inland water quality using remote sensing: Potential and limitations of spectral indices, bio-optical simulations, machine learning, and cloud computing. Earth-Sci. Rev. 2020, 205, 103187. [Google Scholar] [CrossRef]
- Li, Y.; Zhang, Y.L.; Shi, K.; Zhu, G.W.; Zhou, Y.Q.; Zhang, Y.B.; Guo, Y.L. Monitoring spatiotemporal variations in nutrients in a large drinking water reservoir and their relationships with hydrological and meteorological conditions based on Landsat 8 imagery. Sci. Total Environ. 2017, 599, 1705–1717. [Google Scholar] [CrossRef] [PubMed]
- Xiong, J.F.; Lin, C.; Cao, Z.G.; Hu, M.Q.; Xue, K.; Chen, X.; Ma, R.H. Development of remote sensing algorithm for total phosphorus concentration in eutrophic lakes: Conventional or machine learning? Water Res. 2022, 215, 118213. [Google Scholar] [CrossRef] [PubMed]
- He, W.Q.; Chen, S.; Liu, X.H.; Chen, J.N. Water quality monitoring in a slightly-polluted inland water body through remote sensing—Case study of the Guanting Reservoir in Beijing, China. Front. Environ. Sci. Eng. China 2018, 2, 163–171. [Google Scholar] [CrossRef]
- Wu, C.F.; Wu, J.P.; Qi, J.G.; Zhang, L.S.; Huang, H.Q.; Lou, L.P.; Chen, Y.X. Empirical estimation of total phosphorus concentration in the mainstream of the Qiantang River in China using Landsat TM data. Int. J. Remote Sens. 2010, 31, 2309–2324. [Google Scholar] [CrossRef]
- Chen, J.; Quan, W.T. Using Landsat/TM Imagery to Estimate Nitrogen and Phosphorus Concentration in Taihu Lake, China. IEEE J.-Stars 2011, 5, 273–280. [Google Scholar] [CrossRef]
- Liu, Y.; Jiang, H. Retrieval of total phosphorus concentration in the surface waters of Poyang lake based on remote sensing and analysis of its spatial-temporal characteristics. J. Nat. Resour. 2013, 28, 2169–2177. [Google Scholar] [CrossRef]
- Isenstein, E.M.; Park, M.H. Assessment of nutrient distributions in Lake Champlain using satellite remote sensing. J. Environ. Sci. 2014, 26, 1831–1836. [Google Scholar] [CrossRef]
- Gao, Y.N.; Gao, J.F.; Yin, H.B.; Liu, C.S.; Xia, T.; Wang, J.; Huang, Q. Remote sensing estimation of the total phosphorus concentration in a large lake using band combinations and regional multivariate statistical modeling techniques. J. Environ. Manag. 2015, 151, 33–43. [Google Scholar] [CrossRef]
- Du, C.; Li, Y.M.; Wang, Q.; Zhu, L.; Lv, H. Inversion Model and Daily Variation of Total Phosphorus Concentrations in Taihu Lake Based on GOCI Data. Environ. Sci. 2016, 37, 862–872. [Google Scholar] [CrossRef]
- Du, C.G.; Wang, Q.; Li, Y.M.; Lyu, H.; Zhu, L.; Zheng, Z.B.; Wen, S.; Liu, G.; Guo, Y.L. Estimation of total phosphorus concentration using a water classification method in inland water. Int. J. Appl. Earth Obs. Geoinf. 2018, 17, 29–42. [Google Scholar] [CrossRef]
- Xiong, J.F.; Lin, C.; Ma, R.H.; Cao, Z.G. Remote Sensing Estimation of Lake Total Phosphorus Concentration Based on MODIS: A Case Study of Lake Hongze. Remote Sens. 2019, 11, 2068. [Google Scholar] [CrossRef]
- Lei, K.; Zeng, B.H.; Wang, Q. Monitoring the surface water quality of Taihu Lake based on the data of CBERS-1. J. Environ. Sens. 2004, 24, 376–380. [Google Scholar] [CrossRef]
- Xu, L.J.; Huang, C.C.; Li, Y.M.; Chen, X. Deriving Concentration of TN, TP based on Hyper Spectral Reflectivity. Remote Sens. Technol. Appl. 2013, 28, 681–688. [Google Scholar] [CrossRef]
- Shang, W.; Jin, S.G.; He, Y.; Zhang, Y.Y.; Li, J. Spatial–Temporal Variations of Total Nitrogen and Phosphorus in Poyang, Dongting and Taihu Lakes from Landsat-8 Data. Water-Sui 2021, 13, 1704. [Google Scholar] [CrossRef]
- Guo, H.W.; Huang, J.H.; Chen, B.W.; Guo, X.L.; Singh, V.P. A machine learning-based strategy for estimating non-optically active water quality parameters using Sentinel-2 imagery. Int. J. Remote Sens. 2021, 45, 1841–1866. [Google Scholar] [CrossRef]
- Chen, G.M. Ammonium molybdate spectrophotometric method for determination of total phosphorus in municipal sewage sludge. China Water Wastewater 2006, 22, 85–86. [Google Scholar] [CrossRef]
- Xiao, Y.D. Alkaline potassium persulfate digestion UV spectrophotometric method for determination of total nitrogen in water by the method. Guangdong Chem. Ind. 2012, 39, 165–166. [Google Scholar] [CrossRef]
- Vanhellemont, G.; Ruddick, K. Atmospheric correction of Sentinel-3/OLCI data for mapping of suspended particulate matter and chlorophyll-a concentration in Belgian turbid coastal waters. Remote Sens. Environ. 2021, 256, 112284. [Google Scholar] [CrossRef]
- Vanhellemont, G.; Ruddick, K. Advantages of high quality SWIR bands for ocean colour processing: Examples from Landsat-8. Remote Sens. Environ. 2015, 161, 89–106. [Google Scholar] [CrossRef]
- Feng, L.; Hu, C.M. Cloud adjacency effects on top-of-atmosphere radiance and ocean color data products: A statistical assessment. Remote Sens. Environ. 2016, 174, 301–313. [Google Scholar] [CrossRef]
- Feng, L.; Hu, C.M. Land adjacency effects on MODIS Aqua top-of-atmosphere radiance in the shortwave infrared: Statistical assessment and correction. J. Geophys. Res.-Oceans 2017, 122, 4802–4818. [Google Scholar] [CrossRef]
- Wang, S.L.; Li, J.S.; Zhang, B.; Lee, Z.P.; Spyrakos, E.; Feng, L.; Liu, C.; Zhao, H.L.; Wu, Y.H.; Zhu, L.P.; et al. Changes of water clarity in large lakes and reservoirs across China observed from long-term MODIS. Remote Sens. Environ. 2020, 247, 111949. [Google Scholar] [CrossRef]
- Roy, D.P.; Kovalskyy, V.; Vermote, E.F.; Yan, L.; Kumar, S.S.; Egorov, A. Characterization of Landsat-7 to Landsat-8 reflective wavelength and normalized difference vegetation index continuity. Remote Sens. Environ. 2016, 185, 57–70. [Google Scholar] [CrossRef]
- Smith, R.C.; Baker, K.S. The bio-optical state of ocean waters and remote sensing. Limnol. Oceanogr. 1978, 19, 1–12. [Google Scholar] [CrossRef]
- Ma, R.; Tang, J.; Dai, J.; Zhang, Y.; Song, Q. Absorption and scattering properties of water body in Taihu Lake, China: Absorption. Int. J. Remote Sens. 2006, 19, 4277–4304. [Google Scholar] [CrossRef]
- Zaneveld, J.R.V. Light and water: Radiative transfer in natural waters. Bull. Am. Meteorol. Soc. 1995, 76, 60–63. Available online: https://www.jstor.org/stable/26231610 (accessed on 1 August 2022).
- Ma, R.; Tang, J.; Duan, H.; Pan, D. Progress in lake water color remote sensing. J. Lake Sci. 2009, 21, 143–158. [Google Scholar] [CrossRef]
- Zhang, B.; Li, J.; Zhen, L.; Tong, Q. Hyperspectral remote sensing inland water quality monitoring study. In Proceedings of the Sixth Workshop on Imaging Spectroscopy Technology and Applications, Lijiang, China, 1 June 2006. [Google Scholar]
- Ammenberg, P.; Flink, P.; Lindell, T.; Pierson, D.; Strombeck, N. Bio-optical modelling combined with remote sensing to assess water quality. Int. J. Remote Sens. 2002, 23, 1621–1638. [Google Scholar] [CrossRef]
- Hu, X.H.; Yang, L.; Li, Y.; Zhang, L.; Fei, E.H. Development of determination of total nitrogen in water. Environ. Prot. Xinjiang 2015, 37, 35–37+44. [Google Scholar] [CrossRef]
- Xu, H.; Zhu, G.W.; Qin, B.Q.; Gao, G. Influence of nitrogen-phosphorus ratio on dominance of bloom-forming cyanobacteria. China Environ. Sci. 2011, 31, 1676–1683. [Google Scholar] [CrossRef]
- Gao, L.; Wang, X.F.; Johnson, B.A.; Tian, Q.J.; Wang, Y.; Verrelst, J.; Mu, X.H.; Gu, X.F. Remote sensing algorithms for estimation of fractional vegetation cover using pure vegetation index values: A review. ISPRS J. Photogramm. Remote Sens. 2020, 159, 364–377. [Google Scholar] [CrossRef] [PubMed]
- McFeeters, S.K. The use of the Normalized Difference Water Index (NDWI) in the delineation of open water features. Int. J. Remote Sens. 1996, 17, 1425–1432. [Google Scholar] [CrossRef]
- Xu, H.Q. A Study on Information Extraction of Water Body with the Modified Normalized Difference Water Index (MNDWI). J. Remote Sens. 2005, 9, 589–595. [Google Scholar] [CrossRef]
- Rouse, J.W.; Haas, R.H.; Schell, J.A.; Deering, D.W. Monitoring vegetation systems in the great plains with erts. NASA Spec. Publ. 1974, 351, 309–317. [Google Scholar]
- Zhang, Y.S.; Odeh, I.O.A.; Han, C.F. Bi-temporal characterization of land surface temperature in relation to impervious surface area, NDVI and NDBI, using a sub-pixel image analysis. Int. J. Appl. Earth Obs. Geoinf. 2009, 11, 256–264. [Google Scholar] [CrossRef]
- Hunt , E.R., Jr.; Doraiswamy, P.C.; McMurtrey, J.E.; Daughtry, C.S.; Perry, E.M.; Akhmedov, B. RGB-NDVI color composites for monitoring the change in mangrove area at the Maubesi Nature Reserve, Indonesia. Int. J. Appl. Earth Obs. Geoinf. 2013, 21, 103–112. [Google Scholar] [CrossRef]
- Pujiono, E.; Kwak, D.; Lee, W.; Sulistyanto; Kim, S.; Lee, J.Y.; Lee, S.H.; Park, T.; Kim, M. RGB-NDVI color composites for monitoring the change in mangrove area at the Maubesi Nature Reserve, Indonesia. For Sci. Technol. 2013, 9, 171–179. [Google Scholar] [CrossRef]
- Wang, X.Y.; Yang, W. Water quality monitoring and evaluation using remote sensing techniques in China: A systematic review. Ecosyst. Health Sustain. 2019, 5, 47–56. [Google Scholar] [CrossRef]
- Tian, S.; Guo, H.W.; Huang, J.J.; Zhu, X.; Zhang, Z. Comprehensive comparison performances of Landsat-8 atmospheric correction methods for inland and coastal waters. Geocarto Int. 2022, 1–22. [Google Scholar] [CrossRef]
- Guo, H.; Tian, S.; Huang, J.J.; Zhu, X.; Wang, B.; Zhang, Z. Performance of deep learning in mapping water quality of Lake Simcoe with long-term Landsat archive. ISPRS J. Photogramm. Remote Sens. 2022, 183, 451–469. [Google Scholar] [CrossRef]
- Liu, J.; Zhang, Y.; Yuan, D.; Song, X. Empirical Estimation of Total Nitrogen and Total Phosphorus Concentration of Urban Water Bodies in China Using High Resolution IKONOS Multispectral Imagery. Water-Sui 2018, 7, 6551–6573. [Google Scholar] [CrossRef]
- Geng, M.M.; Wang, K.L.; Yang, N.; Qian, Z.; Li, F.; Zou, Y.; Chen, X.S.; Deng, Z.M.; Xie, Y.H. Is water quality better in wet years or dry years in river-connected lakes? A case study from Dongting Lake, China. Environ. Pollut. 2021, 290, 118115. [Google Scholar] [CrossRef] [PubMed]
- Wu, W.; Li, G.B.; Li, D.H.; Liu, Y.D. Temperature may be the dominating factor on the alternant succession of Aphanizomenon flos-aquae and Microcystis aeruginosa in Dianchi Lake. Fresen Environ. Bull. 2010, 19, 846–853. [Google Scholar] [CrossRef]
- Hu, G.W.; Zhang, M.; Liu, Z.; Xu, J.H.; Fan, Z. Analysis of water quality change and its formation mechanism of Dongting Lake. J. Water Resour. Water Eng. 2019, 30, 39–45. [Google Scholar] [CrossRef]
- Zhao, X.; Christianson, L.E.; Harmel, D.; Pittelkow, C.M. Assessment of drainage nitrogen losses on a yield-scaled basis. Field Crops Res. 2016, 199, 156–166. [Google Scholar] [CrossRef]
- Huang, Q.; Sun, Z.D.; Jiang, J.H. Impacts of operation of the Three Gorges Reservoir on the lake water level of Lake Dongting. J. Lake Sci. 2011, 23, 424–428. [Google Scholar] [CrossRef]
- Lv, Z.X.; Shi, G.M.; Peng, X.L. Study on the provider and receiver of eco-compensation for water environment in Dongting lake based on the source of pollutants. Chin. J. Environ. Manag. 2016, 8, 25–31. [Google Scholar] [CrossRef]
- Ji, X.H.; Zheng, S.X.; Shi, L.H.; Liu, Z.B. Systematic Studies of Nitrogen Loss from Paddy Soils Through Leaching in the Dongting Lake Area of China. Pedosphere 2011, 21, 753–762. [Google Scholar] [CrossRef]
Publisher’s Note: MDPI stays neutral with regard to jurisdictional claims in published maps and institutional affiliations. |
© 2022 by the authors. Licensee MDPI, Basel, Switzerland. This article is an open access article distributed under the terms and conditions of the Creative Commons Attribution (CC BY) license (https://creativecommons.org/licenses/by/4.0/).