Article

Global-Scale Evaluation of XCO2 Products from GOSAT, OCO-2 and CarbonTracker Using Direct Comparison and Triple Collocation Method

1
Zhejiang Carbon Neutral Innovation Institute, Zhejiang University of Technology, Hangzhou 310000, China
2
Zhejiang Geopher Spatial Planning Technology Co., Ltd., Hangzhou 310000, China
3
College of Geomatics and Municipal Engineering, Zhejiang University of Water Resources and Electric Power, Hangzhou 310018, China
4
Qiqihar Meteorological Service, Heilongjiang Meteorological Bureau, Qiqihar 161000, China
5
Longfengshan Regional Background Station, China Meteorological Administration, Harbin 150300, China
*
Author to whom correspondence should be addressed.
These authors contributed equally to this work.
Remote Sens. 2022, 14(22), 5635; https://doi.org/10.3390/rs14225635
Submission received: 24 September 2022 / Revised: 2 November 2022 / Accepted: 5 November 2022 / Published: 8 November 2022

Abstract

:
Triple collocation (TC) shows potential in estimating the errors of various geographical data in the absence of the truth. In this study, the TC techniques are first applied to evaluate the performances of multiple column-averaged dry air CO2 mole fraction (XCO2) estimates derived from the Greenhouse Gases Observing Satellite (GOSAT), the Orbiting Carbon Observatory 2 (OCO-2) and the CarbonTracker model (CT2019B) at a global scale. A direct evaluation with the Total Carbon Column Observing Network (TCCON) measurements is also employed for comparison. Generally, the TC-based evaluation results are consistent with the direct evaluation results on the overall performances of three XCO2 products, in which the CT2019B performs best, followed by OCO-2 and GOSAT. Correlation coefficient estimates of the TC show higher consistency and stronger robustness than root mean square error estimates. TC-based error estimates show that most of the terrestrial areas have larger error than the marine areas overall, especially for the GOSAT and CT2019B datasets. The OCO-2 performs well in areas where CT2019B or GOSAT have large errors, such as most of China except the northwest, and Russia. This study provides a reference for characterizing the performances of multiple CO2 products from another perspective.

Graphical Abstract

1. Introduction

Carbon dioxide (CO2) is one of the most important greenhouse gases (GHGs) in the atmosphere and plays an important role in global warming and climate change [1]. In the past decade, it is estimated that CO2 in the atmosphere has contributed about 82% of radiation forcing. A large amount of anthropogenic emissions from fossil fuel and biomass burning have caused a rapid rise in atmospheric CO2 concentration. The Greenhouse Gas Bulletin of the World Meteorological Organization (WMO) of the United Nations reported that the global average mole fraction of atmospheric CO2 in 2020 was 413.2 ± 0.2 ppm, which is 149% of the pre-industrial value. To mitigate the continuous rise in atmospheric CO2 concentration, ambitious emission reduction and control measures for anthropogenic carbon emissions, e.g., the Paris Agreement on climate change of 2016, have been initiated, and there is no doubt that accurate monitoring and quantifying of the variations in greenhouse gas emissions are of critical importance.
With the rapid development of remote sensing atmospheric sounding technology, satellite measurement has been one of the major ways to obtain global and regional CO2 data [2,3,4]. Further, using the atmospheric spectral information obtained by spaceborne sensors, the atmospheric column-averaged carbon dioxide dry air mole fraction (XCO2) is quantitatively estimated based on radiative transfer theory. Some countries have successively launched relevant carbon satellite observation programs, including the SCanning Imaging Absorption spectroMeter for Atmospheric CHartographY (SCIMACHY) on board the Envisat satellite of the European Space Agency (ESA) [5], Japan’s Greenhouse Gases Observing Satellite (GOSAT) [6], Orbiting Carbon Observatory-2 (OCO-2) of National Aeronautics [7] and Space Administration and Chinese Carbon Dioxide Observation Satellite Mission (TanSat) [8]. These satellites provide a variety of XCO2 inversion products, covering a much larger and more continuous space than ground-based observations. They are attractive alternatives for detecting CO2 spatial patterns, sources and sinks over global scales, especially for areas where ground observations are scarce [9,10,11,12,13]. However, it has been realized that the satellite-derived XCO2 estimates have some errors and uncertainties affected by the inversion model, measurement instrument and spatial resolution, atmospheric and surface parameters [3,14,15,16]. O’Dell et al. [16] indicated that imperfect characterization of atmospheric aerosols and clouds was the main source of systematic errors of XCO2 retrievals. Liang et al. [17] showed that the advantages of OCO-2 on spatial resolution and imaging capability were the main reasons for the higher overall retrieval accuracy than GOSAT, which increased the number of valid data points free from the influence of clouds and aerosols. Wu et al. [18] showed that a lower spectral resolution enhanced the scatter error of the retrieved XCO2. Satellite XCO2 retrieval errors exhibit dependence on atmospheric and geographical factors (e.g., topography, land use, urbanization), affecting atmospheric radiative transfer [19,20]. Bie et al. [20] presented that the western deserts with a high-brightness surface had large biases. O’Dell et al. [16,21] pointed out that additional real-world issues, such as forest canopy effects, dramatic topographic change, cloud shadows and plant fluorescence, would further increase the retrieval errors. A slight pointing shift in OCO-2 would cause errors in the XCO2 inversion results due to the change in surface altitude. A series of validation activities for the satellite-based XCO2 data products need to be conducted to clarify their uncertainties so as to further improve the inversion algorithms and the meaningful application of data products in the scientific community.
Usually, high-precision data obtained independently by ground-based instruments and aircrafts are used to validate the satellite-derived XCO2 products [3,7,22,23]. The ground-based XCO2 data retrieved from the measurements collected by the Total Carbon Column Observing Network (TCCON) Fourier Transform Spectrometer (FTS) instruments have high precision and stability, which have been the main ground data source for verifying and systematically correcting satellite-based XCO2 estimates. Moreover, many studies analyzed the uncertainties of satellite-derived XCO2 products and their application potential in different regions around the world using ground-based TCCON data [7,17,24,25,26,27,28,29,30,31]. For instance, Kong et al. [32] studied the spatio-temporal consistency of XCO2 retrievals based on TCCON and model data in carbon cycle research. Yang et al. [33] showed that the RMSE of the TanSat-derived XCO2 product was 1.41 ppm compared with the TCCON data, much better than what was originally designed, i.e., 4 ppm. Further, some studies also examined the consistency and differences between various satellite-based XCO2 products and model-based datasets to explore the availability and uncertainty of satellite data in greenhouse gas assimilation models [22,28,34]. However, large uncertainties might be introduced into the data products by using the model assimilation data as a benchmark because of the uncertainties in models. Generally, direct comparison based on ground measurements is considered the most reliable method for evaluating the performance of satellite products. However, the evaluation of satellite-derived XCO2 data based on in situ measurements is still insufficient and also has great uncertainties due to a sparse GHG monitoring network, site representative error and the spatial scale mismatch between the in situ measured data and the satellite retrieved data. For example, there are only about 27 operational TCCON sites around the world at present.
The triple collocation technique (TC), developed by Stoffelen [35], is effective in estimating the error variances in three or more datasets for the same target variable without requiring the truth. It was originally designed for error calibration of satellite wind speed products and has been applied in error estimation of satellite-based or model-based products for various geographical variables, such as soil moisture [36,37,38], precipitation [39,40], temperature [41], ocean wind speed [35,36,37,38,39,40,41,42], leaf area index (LAI) [43,44], land water storage [45] and surface albedo [46]. Recently, new variants of TC have also been published. For example, Alemohammad et al. (2015) provided a new multiplicative triple collocation method (MTC) based on the original mathematical assumptions in which a logarithmic error model was introduced and showed better performance in representing the relationship between precipitation measurements and true values; Mccoll et al. [47] proposed an extended TC method to estimate the correlation coefficient metric (CC) and the root mean square error (RMSE) for each of the triplets. The TC-based techniques may be less impacted by representative error and could offer an effective strategy for charactering the errors of satellite-based and model-based products, especially in areas with sparse ground measurements [46,48]. To our best knowledge, neither TC nor its variants have ever been used in error estimation of satellite-based or model-based XCO2 data.
The main objective of this study is to explore the potential of the TC algorithm and its variants in evaluating various XCO2 datasets. The TC technique is first used to assess the accuracies of multi-source XCO2 products at a global scale without ground-based observations, in which both an original additive error model and a multiplicative error model are introduced. Direct-evaluation-based TCCON XCO2 measurements are also employed in the comparison. In addition, the uncertainty of TC error estimation for XCO2 products is presented to provide a reference for improvement and better application of the TC method in the future.
This paper is organized as follows. Section 2 describes the data, including GOSAT, OCO-2 and CarbonTracker products and TCCON in situ measurements, and reviews the direct comparison and TC method. Section 3 presents the validation results based on direct comparison and TC estimation. In Section 4, the uncertainties of the results are discussed, and, in Section 5, the conclusion is provided.

2. Materials and Methods

2.1. Materials

2.1.1. Satellite and Model Datasets

Three daily XCO2 products derived from the Greenhouse Gases Observing Satellite “IBUKI” (GOSAT), Orbiting Carbon Observatory 2 (OCO-2) satellites and CarbonTracker model are used in this study for the global evaluation. A brief description of each XCO2 product is provided in Table 1. Due to the influence of clouds and aerosols, the available data of GOSAT and OCO-2 products cannot fully cover the whole space, and there are many gaps in the main observation range. To ensure spatio-temporal consistency of all datasets in TC analysis, 6 September 2014 to 29 March 2019 are selected as the study period, and GOSAT and OCO-2 satellite products are reprocessed to 3° × 2° spatial resolution to be consistent with the CarbonTracker data. The details of the three XCO2 datasets are described below.
GOSAT is the first dedicated spacecraft to monitor GHG concentration distribution from space [49]. It was launched successfully on 23 January 2009 with a joint effort of the Ministry of the Environment (MOE), the National Institute for Environmental Studies (NIES) and the Japan Aerospace Exploration Agency (JAXA). A Carbon Observation Fourier Transform Spectrometer (TANSO-FTS) and a Cloud and Aerosol Imager (CAI) are onboard the satellite to measure the reflected solar radiation in three SWIR bands (0.758–0.775, 1.56–1.72 and 1.92–2.08 µm) and a TIR region (5.5–14.3 µm) [6]. The spatial resolution of sub-satellite point of GOSAT is 10.5 km, and the observation repeats in a 3-day cycle and crosses the equator at approximately 13:00 local time. Many retrieval algorithms, e.g., NIES [50], ACOS [16] and UOL-FP [51], have been developed to calculate the column abundances of CO2 and CH4 from GOSAT measurements. The latest version of XCO2 daily product (GOSAT ACOS-L2_Lite_FP.9r) retrieved by ACOS from September 2014 to March 2019 is used in this study, and there are 1571 days of data available during this period. The ACOS/GOSAT XCO2 products are released by NASA’s Atmospheric CO2 Observations from Space team.
OCO-2 is NASA’s first dedicated carbon satellite to measure atmospheric CO2 from space to monitor near-surface carbon sources and sinks at regional scales. OCO-2, launched successfully on 2 July 2014, has a 1.29 × 2.25 km sub-satellite point resolution and a 16 d repeat cycle. A three-channel imaging grating spectrometer is mounted on the satellite to make coincident measurements of reflected sunlight at 0.76, 1.61 and 2.06 μm, respectively. The recorded spectral information is used to retrieve XCO2 with the Atmospheric CO2 Observations from Space (ACOS) algorithm [21,52,53]. The OCO-2 Level 2 XCO2 Version 10 Lite product from the full-physics retrieval algorithm is used in this study. A total of 1519 days of OCO-2 XCO2 data are available from 6 September 2014 to 29 March 2019.
CarbonTracker (CT) is a CO2 measurement and modeling system developed by the National Oceanic and Atmospheric Administration (NOAA) to keep track of CO2 sources and sinks around the world. It includes ocean, fire-point, fossil fuel and terrestrial ecosystem modules, in which the atmospheric transport model and Kalman filter method are combined to optimally estimate the temporal variation in CO2 absorption and release on Earth’s surface. The current release of NOAA’s CarbonTracker, CT2019B [54], provides global estimates of surface-atmosphere fluxes of CO2 from January 2000 through March 2019. The mole fractions of CO2, as a “byproduct” of the data assimilation system, are also calculated and available at 3° × 2° globally and North America 1° × 1°, which have been widely used to validate the satellite-based measurements [14,55]. In this paper, the daily CT2019B.xCO2_1330 (LST) dataset from September 2014 to March 2019 is used for comparison, and it is generated by assimilating ground and aerial observations. The column concentration data at 3° × 2° resolution are calculated from CO2 distribution data at 13:00 using the pressure weight average method proposed by Conner et al. [56].

2.1.2. TCCON Measurements

TCCON is a ground-based Fourier Transform Spectrometers (FTS) network used to record direct solar spectra in the near infrared spectral region and provides long time series precise column-averaged abundances of CO2, CH4, N2O, HF, CO, H2O and HDO [57]. At present, a total of 31 ground stations are used for data acquisition, including ~27 stations in operation, and mainly located in the United States and Europe. TCCON observation stations are generally set in areas slightly affected by human activities and carry out long-term continuous atmospheric composition monitoring in a unified standard. The TCCON ground-based XCO2 estimates provide a transfer standard between the space-based XCO2 estimates and the WMO GAW standards and a verification means for satellite-based XCO2 data retrieved from SCIMACHY, GOSAT and OCO2 programs. There are several versions of TCCON products. In this study, the GGG2014 dataset [58] is used to evaluate the processed GOSAT and OCO-2 data and CT2019B data. A total of 29 TCCON sites (Table 2) were selected, covering the period from September 2014 to March 2019. Two datasets, LL and LR, operated using two different instruments, are obtained at the Lauder site. The TCCON data are filtered according to the cloudiness during measurement, represented by the “fvsi” (fractional change in solar intensity) parameter. Data with fvsi greater than 5% are filtered out.

2.2. Methods

Conventional direct comparison as well as TC analysis are employed to assess the errors of the satellite-based and model-based XCO2 products, respectively.

2.2.1. Direct Evaluation with TCCON Data

In the direct comparison, the ground TCCON XCO2 data are assumed accurate and used as the reference data. For each TCCON site, near-simultaneous XCO2 data from a satellite or model within ±30 min and within three different spatial ranges, i.e., ±1°, ±2° and ±3°, are selected to match TCCON data for comparison. The repeated matches are averaged every 1 h. The latest research showed that the influence of column averaging kernels on GOSAT and OCO-2 XCO2 values can be negligible compared to the corresponding measurement accuracy, and it was also applicable to validate the satellite-derived XCO2 data without smoothing [17,59]. Therefore, similar to several previous works, we do not consider the influence of different averaging kernels and a priori profiles between different satellites [17,32,51,59].
A set of statistical indicators, including the mean error (ME), mean absolute error (MAE), root mean square error (RMSE) and correlation coefficient (CC), are used to evaluate the performance of GOSAT, OCO-2 and CT2019B XCO2 datasets. They can be mathematically expressed as follows:
ME = 1 n i = 1 n ( X i Y i )
MAE = 1 n i = 1 n | X i Y i |
RMSE = 1 n i = 1 n ( X i Y i ) 2
CC = i = 1 n ( X i X ¯ ) ( Y i Y ¯ ) i = 1 n ( X i X ¯ ) 2 i = 1 n ( Y i Y ¯ ) 2
where n represents the total matching number; X is the satellite-derived or model-based XCO2 data and Y is the TCCON-based XCO2 data; and X ¯ and Y ¯ are the mathematical expectations of X and Y , respectively.

2.2.2. Triple Collocation Error Model

Triple collocation technique (TC) is an objective method commonly used to estimate systematic biases and random errors for ground observations, satellite-based products or model outputs. It can effectively assess the performance of satellite-derived data without ground-based observations and has been applied in error estimations for various geographical variables [60]. In precipitation research, it is generally believed that the multiplication model can better describe the fitting relationship between precipitation truth and its measurements [40]. Therefore, Alemohammad et al. [39] proposed a multiplicative triple collocation method (MTC) to estimate errors of precipitation products and found that MTC outperformed TC. However, it is still unclear whether TC or MTC is appropriate to evaluate XCO2 products, and, if so, which one is better? For this purpose, both the general additive error model and the multiplicative error model are introduced in this study for global evaluation of XCO2 products. In addition, the extended triple collocation model (ETC) proposed by the authors of [47] is employed to solve the correlation between a dataset and the unknown truth.
In the TC model, three independent datasets of the target variable from three measurement systems are required and are assumed to be linearly related to the truth set T of the target variable:
X i = α i + β i T + ε i
where X i   ( i { 1 , 2 , 3 } ) is any independent dataset for the truth set T. Here, the three independent XCO2 products are GOSAT, OCO-2 and CarbonTracker model, respectively. ε i represents the zero-mean residuals ( E ( ε i ) = 0 ) of X i , and α i and β i are the corresponding ordinary least squares (OLS) coefficients.
The covariance between two different measurement systems X i and X j can be expressed as:
Cov ( X i , X j ) = β i β j σ T 2 + β i C o v ( T , ε j ) + β j C o v ( T , ε i ) + C o v ( ε i , ε j )
where σ t 2 is the variance of t. Assuming that the three collocated measurements and their zero-mean errors are independent of each other ( C o v ( ε i , ε j ) ,   i j ) and are uncorrelated with the truth ( C o v ( T , ε j ) = 0), the above equation can be simplified to:
C i j = C o v ( X i , X j ) = { β i β j σ t 2 ,                                   i j β i 2 σ T 2 + σ ε i 2 ,                           i = j
where σ ε i 2 denotes the variance of the i-th measurement. Then, the estimation equations of RMSE for the three measurement systems are as follows:
σ ε i = { C 11 C 12 C 13 C 23 ,   i = 1 C 22 C 12 C 23 C 13 ,   i = 2 C 33 C 13 C 23 C 12 ,   i = 3
In MTC, the multiplicative error model relating the measurement to the truth is expressed as:
X i = A i T β i e ε i
Defining x i = ln ( X i ) , α i = ln ( A i ) and t = ln ( T ) , Equation (9) can be linearized as follows:
x i = α i + β i t + ε i
Based on the same assumption as TC, the RMSE in MTC can be estimated according to Equation (8) using log-transformed data. It is obvious that the RMSE estimates by MTC are in logarithmic scale. We apply the solution proposed in [39] to generate the real RMSE to simplify the interpretation and comparison with direct evaluation results and TC-based results.
σ X i = μ X i σ x i
where σ X i and σ x i are the real RMSE estimated using Equation (11) and the RMSE in logarithmic scale, respectively; μ X i is the mean of the original sequence data. It is noted that TC-based or MTC-based σ ε i 2 may be negative if one data grid has small variance and large gap with the other two measurements. In this case, a null value is assigned.
According to the ETC [47], the correlation coefficient (CC) between the truth t and each measurement system can be calculated by the following equations:
ρ t , i = { C 12 C 13 C 11 C 23 ,   i = 1 C 12 C 23 C 22 C 13 ,   i = 2 C 13 C 23 C 33 C 12 ,   i = 3
The flowchart of global-scale assessment of XCO2 datasets via direct comparison and triple collocation method is shown in Figure 1. The process consists of five main parts: (1) evaluation of original satellite products with TCCON data. The original GOSAT and OCO-2 Level 2 products are spatio-temporally matched with TCCON in situ measurements and then are validated using traditional statistical metrics. (2) Spatio-temporal integration of data: the original GOSAT and OCO-2 satellite products are first reprocessed to the same spatial resolution with CT2019B data to ensure spatio-temporal consistency of all datasets in TC analysis. Then, four matching sequences are obtained by spatio-temporally matching TCCON data with the reprocessed GOSAT and OCO-2 data as well as CT2019B data. (3) Consistency analysis: error estimates for each site are obtained by direct evaluation and TC/MTC analysis based on the four matching sequences, and the consistency between different validation results is analyzed. (4) Global assessment of XCO2 datasets: the TC error model with better performance in previous consistency analysis is used to assess the accuracies of the GOSAT, OCO-2 and CT2019B datasets at global scale. (5) Uncertainty analysis: different triple combinations are designed to examine the impact of choice of triplets on TC-based estimates.

3. Results

3.1. Direct Evaluation with TCCON Data

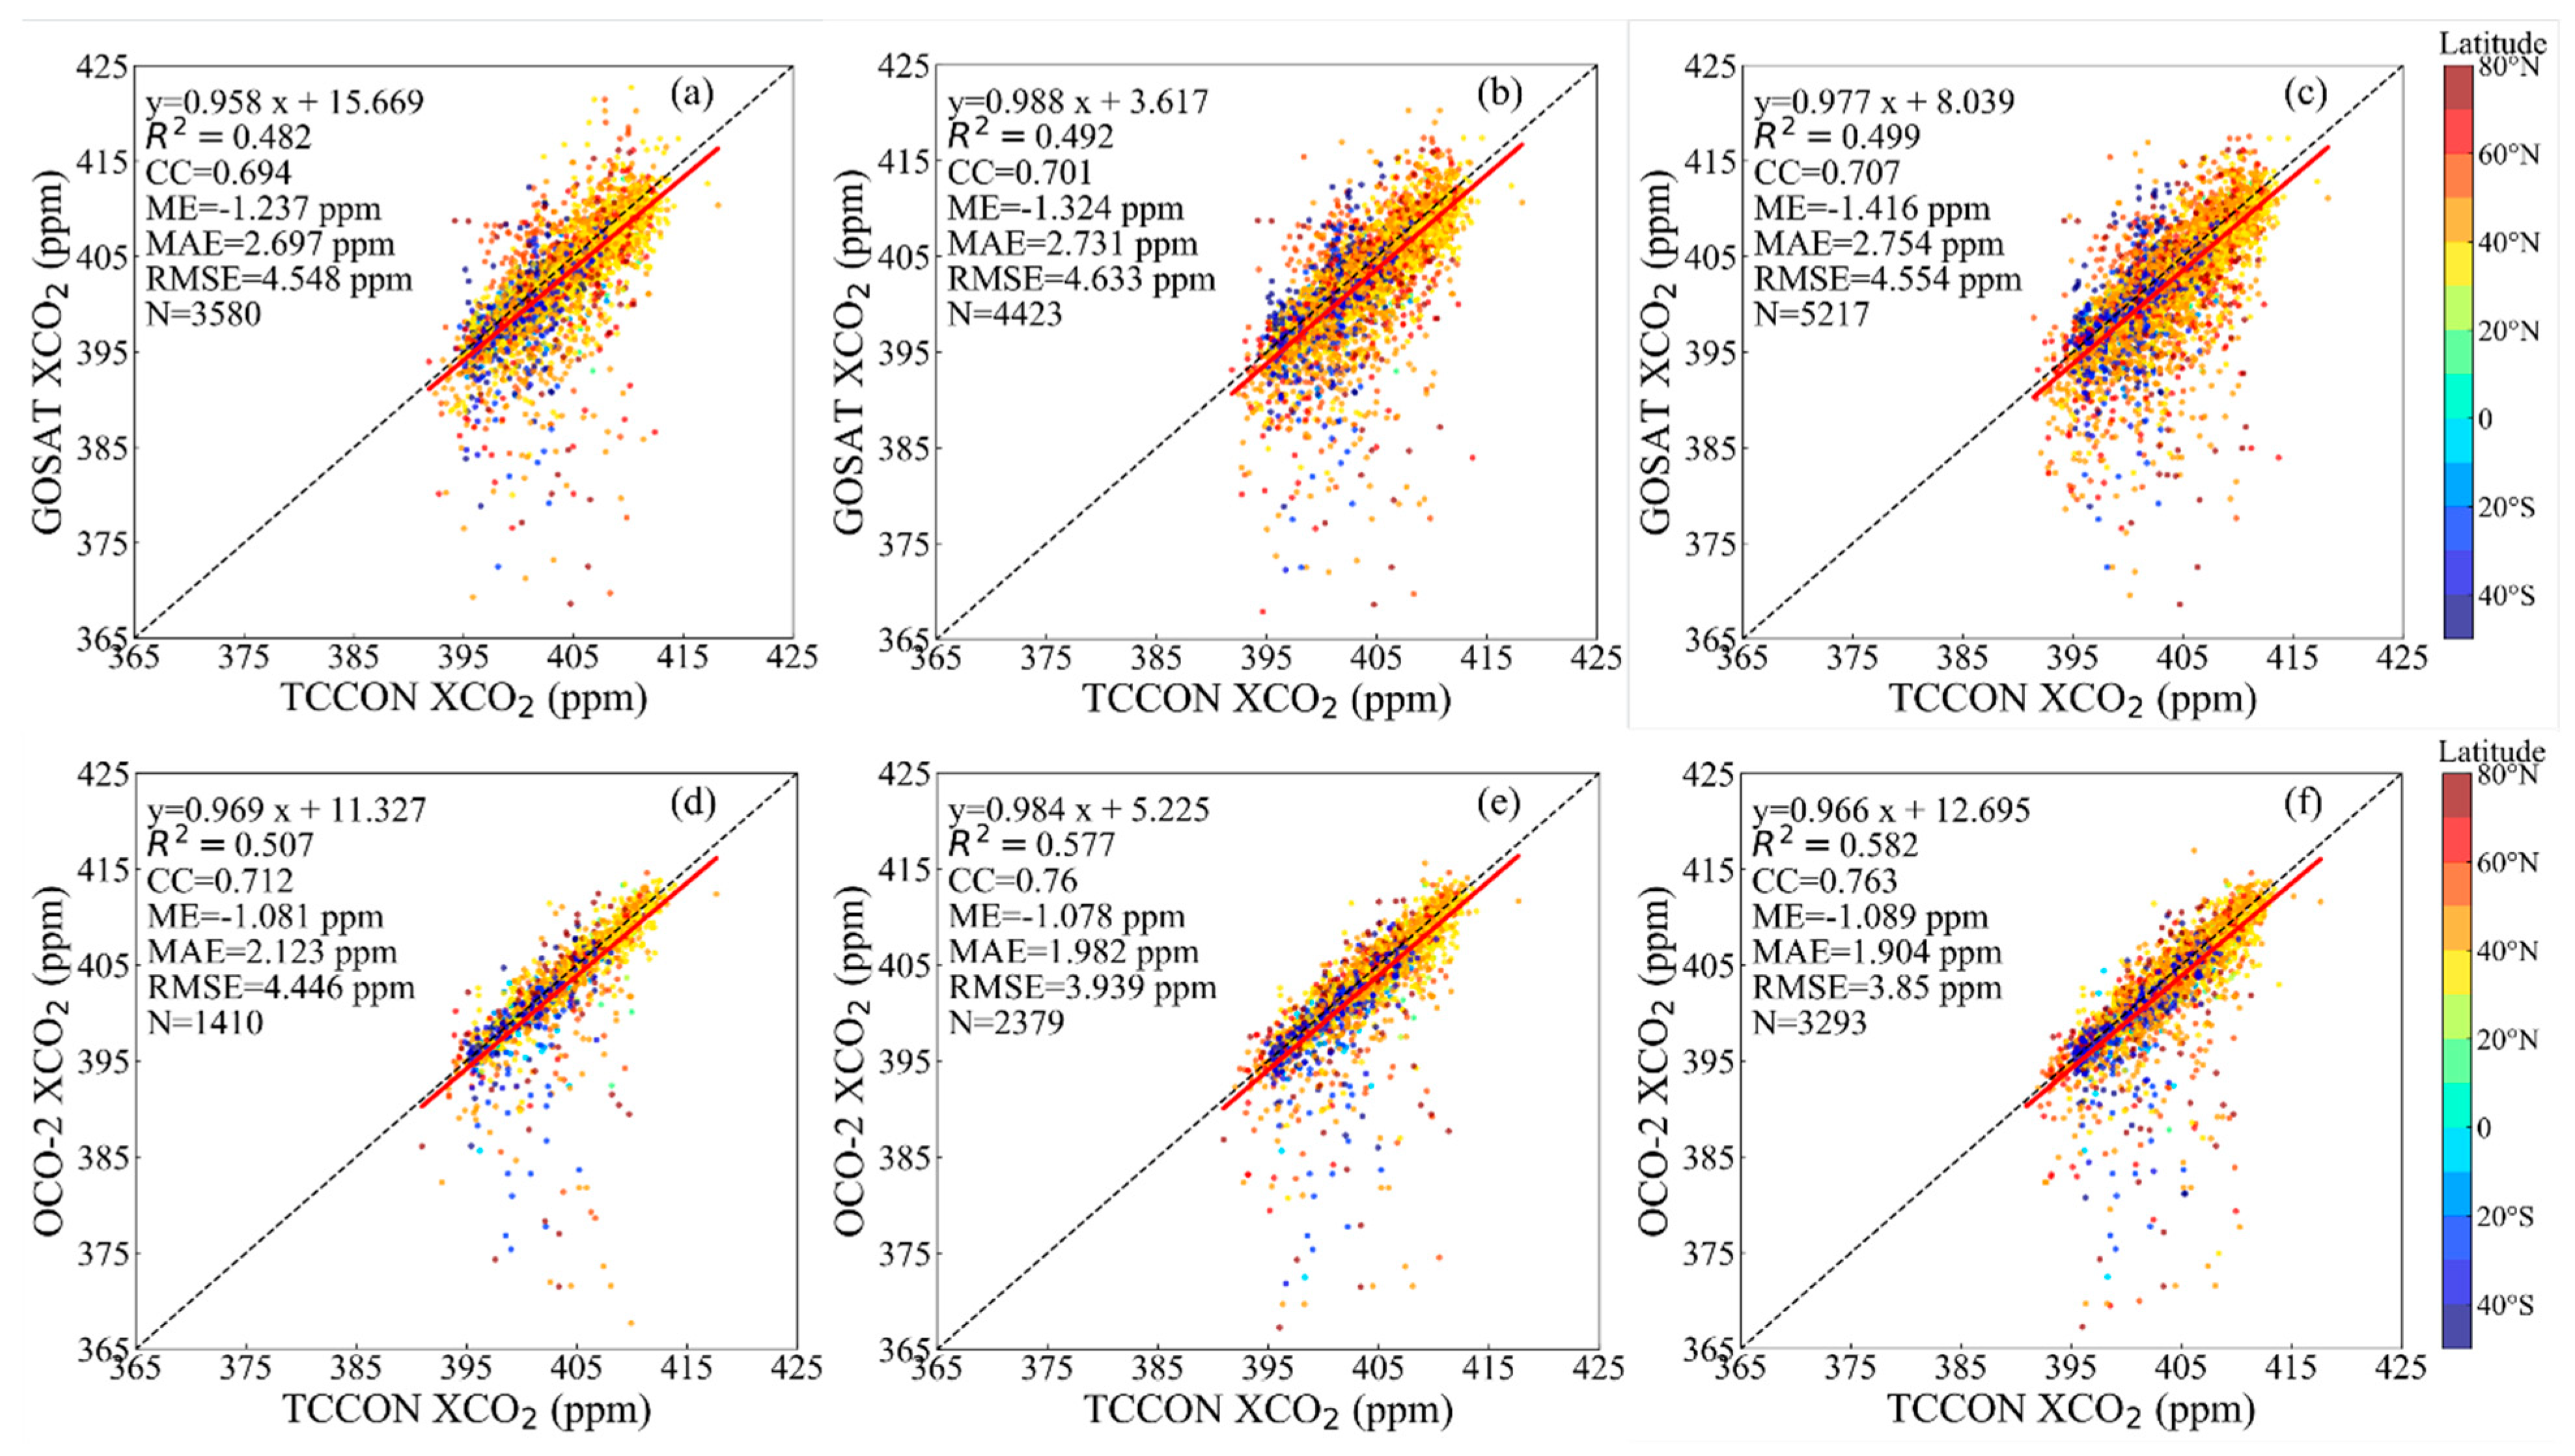
Figure 2 compares the original GOSAT (Figure 2a–c) and OCO-2 data (Figure 2d–f) with TCCON data using different spatio-temporal matching criteria. In the scatter plots, N is the matching number between satellite-derived data and TCCON data after averaging the duplicated and high-frequency collocations every 1 h. Compared with GOSAT, although OCO-2 has a higher spatial resolution, its revisit cycle is longer, so its final match number (N) after average is lower than that of GOSAT during the study time period. Overall, OCO-2 outperforms GOSAT under different spatial matching criteria, with higher CC values and lower ME, MAE and RMSE values. GOSAT has a slight deterioration in terms of ME, MAE and RMSE values while a little improvement in terms of CC values using the ±2° and ±3° spatial matching conditions compared to using ±1° spatial matching conditions. For OCO-2, all the statistical indicators under ±2° and ±3° matching conditions outperform that of ±1°, especially for CC. This may be related to the fact that the average of matching data has a certain smoothing effect, which could reduce the influence of the outliers; the larger the spatial range of the matching, the greater the smoothing effect. Both the ME values of GOSAT and OCO-2 are negative. Due to the influence of cloud cover, aerosol concentration and surface albedo on atmospheric CO2 observation, many XCO2 values for GOSAT and OCO-2 are significantly smaller than those of TCCON between 20°S and 50°S and 50°N and 80°N. In the released GOSAT and OCO-2 Level 2 products, the data grids with poor and good quality are marked 1 and 0 with the quality flag attribute, respectively. In the following, we filter the GOSAT and OCO-2 XCO2 data using a quality flag of 0 for further analysis and validation.
In order to obtain effective data of good quality, the GOSAT and OCO-2 observation data are filtered according to the quality screening scheme for land and ocean observation data in the data Product Manual. In addition, the filtered daily GOSAT and OCO-2 data are interpolated to the same spatial resolution of CT2019B, i.e., 3° × 2°. For a grid containing valid data, the average value of GOSAT or OCO-2 XCO2 records are used; for grids without any valid observation, the XCO2 values are obtained by using the Kriging spatial interpolation.
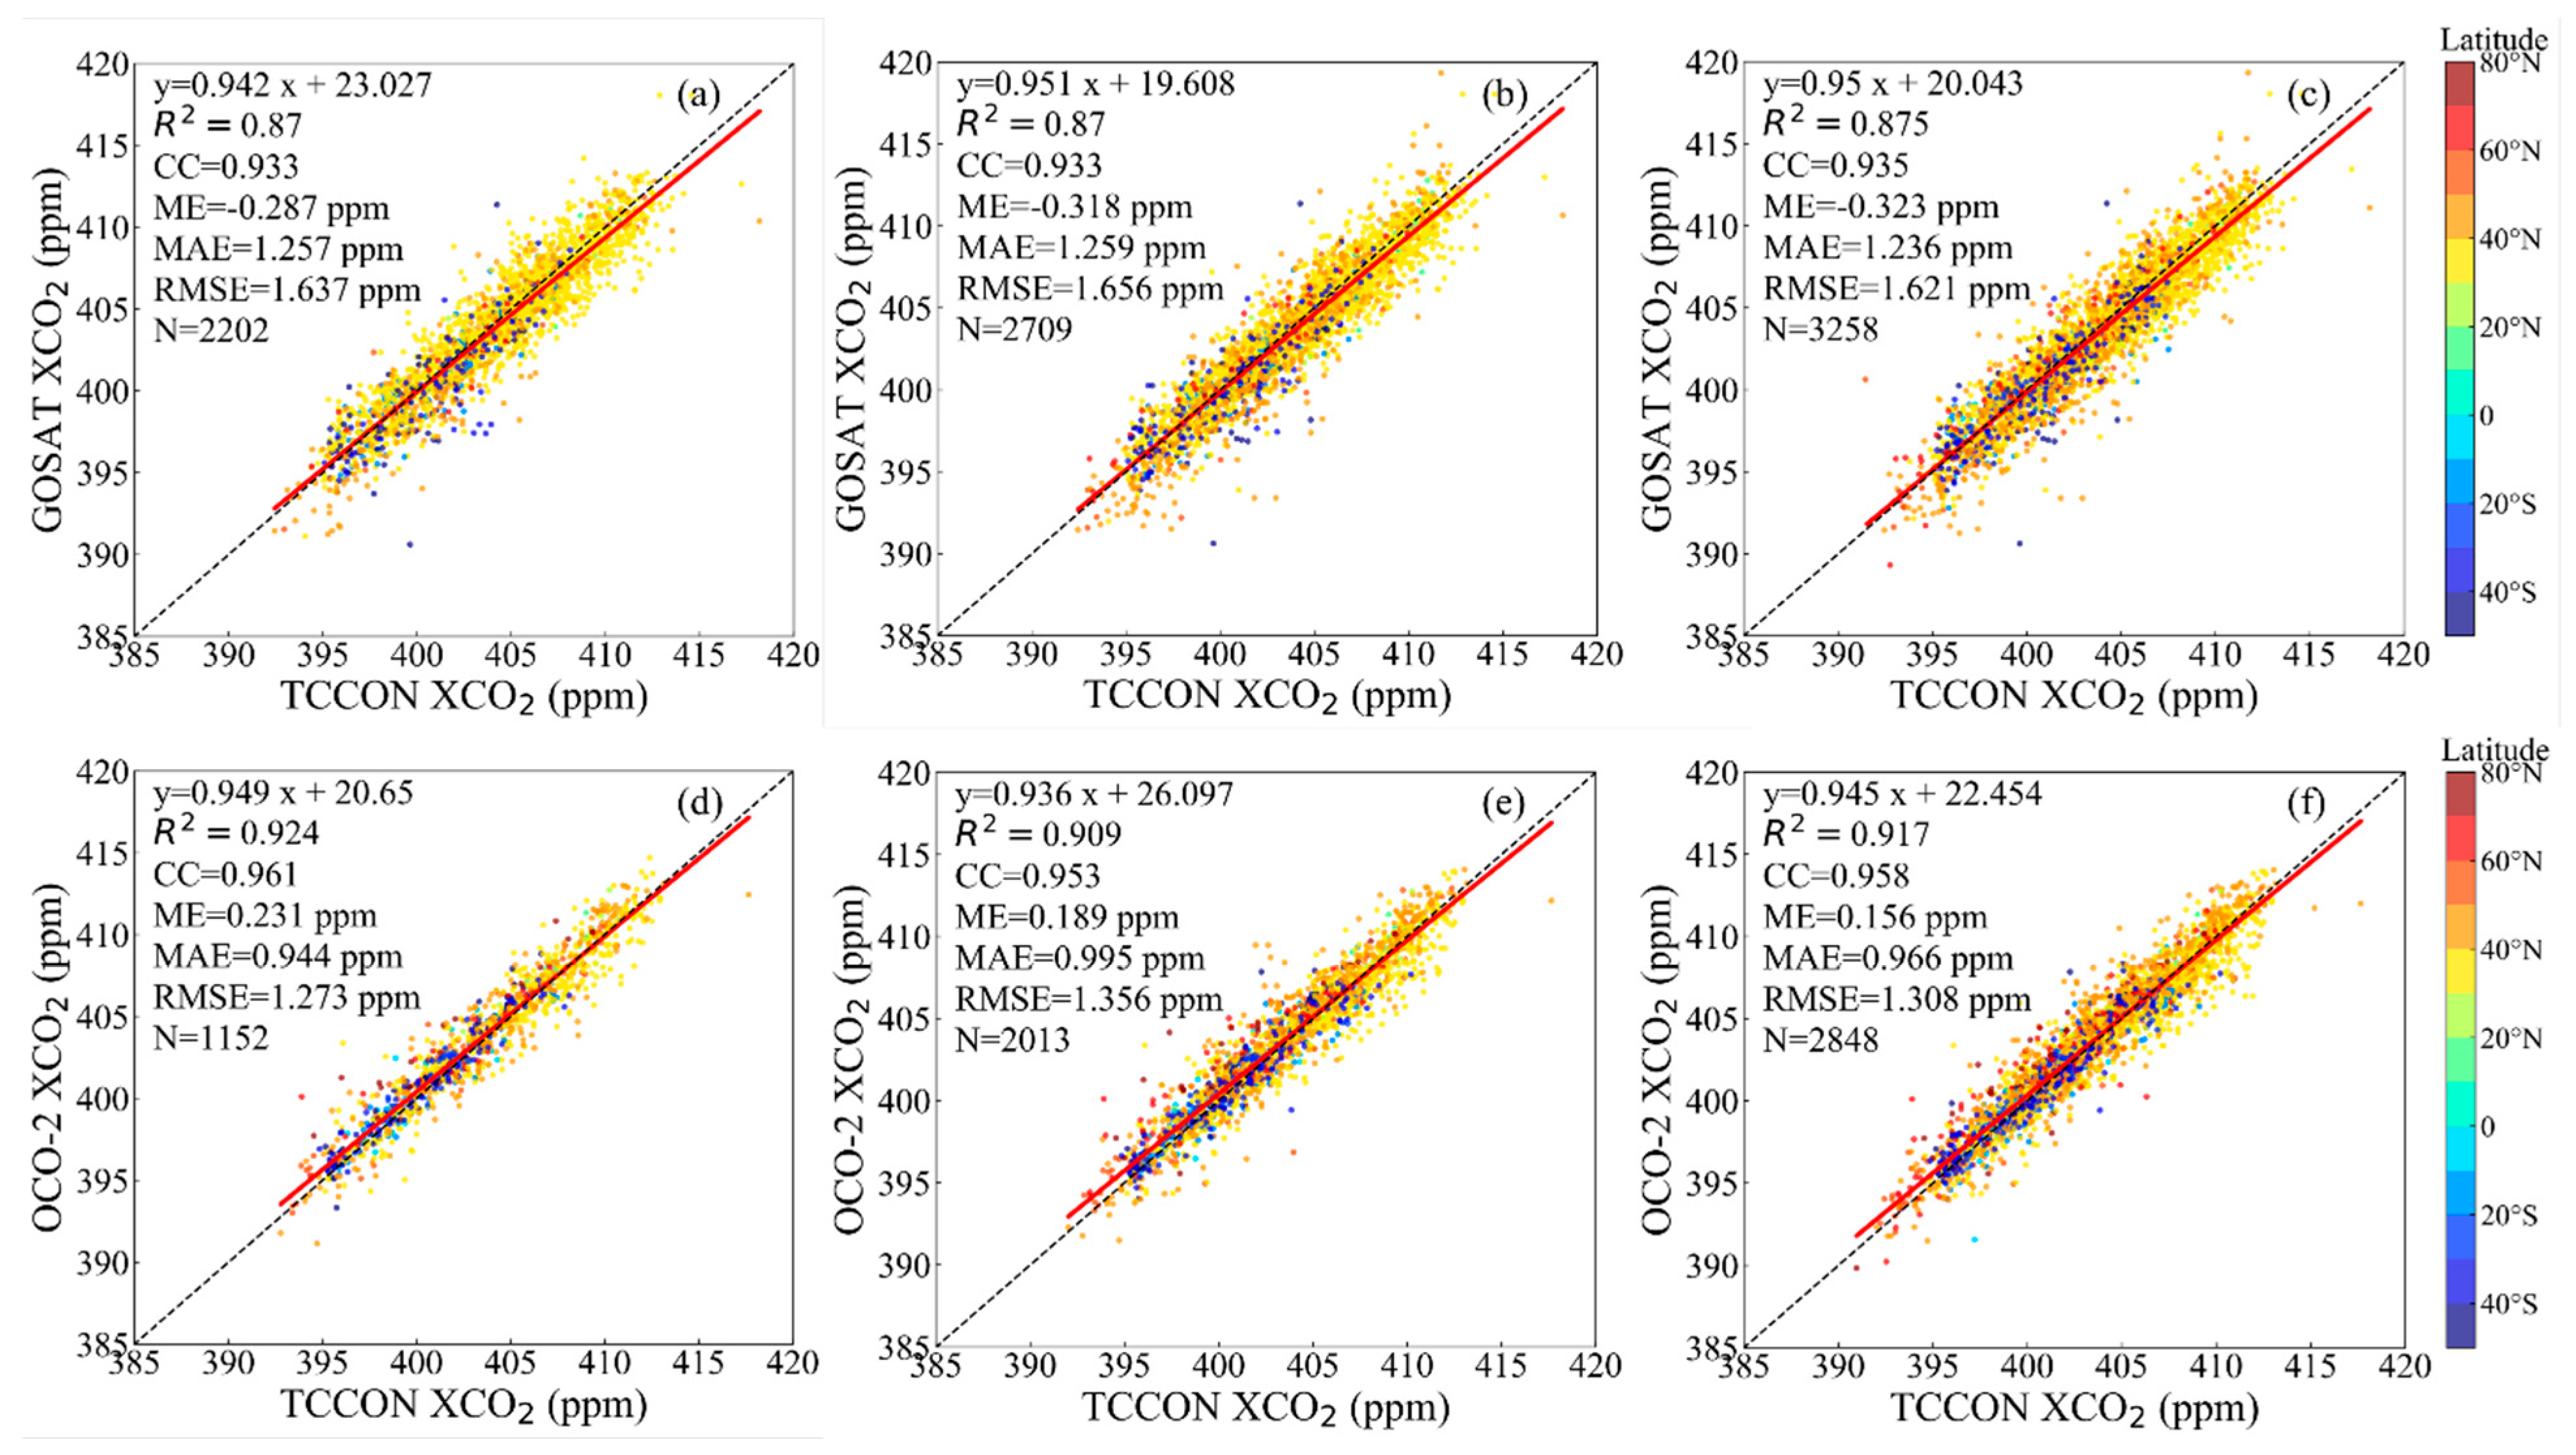
Figure 3 compares the filtered GOSAT (Figure 3a–c) and OCO-2 (Figure 3d–f) with TCCON data under different spatio-temporal matching criteria, respectively. Compared with Figure 2, the matching numbers of GOSAT and OCO-2 data decrease about 37.55 to 38.75% and 13.51 to 18.29%, respectively. The filtered GOSAT and OCO-2 data fit well with the TCCON data, with CC values of 0.933 and above. Overall, the OCO-2 data outperform the GOSAT data under different spatial matching conditions, with higher CC values (0.961, 0.953 and 0.958) and the lowest MAE (0.944, 0.995 and 0.966 ppm) and RMSE (1.273, 1.356 and 1.308 ppm). Compared with TCCON, OCO-2 has positive bias values of 0.156 to 0.231 ppm, while GOSAT shows negative bias with ME values of −0.287 to −0.323 ppm. These results are similar to previous studies [17,28,32]. Liang et al. [17] found that GOSAT monitoring capacity decreases in recent years and lags behind OCO-2. Between 40°N and 60°N, the two satellite-derived XCO2 datasets are overestimated in the high value range of about 407 ppm and above, especially for OCO-2, while, at between 390 and 395 ppm, GOSAT shows lower XCO2 values than TCCON observations. O’Dell et al. [16] suggested that the systemic errors of ACOS XCO2 retrievals mainly come from insufficient processing of clouds and aerosols.
It can be observed intuitively from the scatter plots that the results under ±1° matching are more concentrated than those under other matching ranges. In terms of statistical indicator values, there is little difference in the statistics using different spatio-temporal matching conditions. Generally, the accuracy of OCO-2 decreases with an increase in the matching spatial range, while the accuracy of GOSAT improves slightly, except for ME. Except for ME, all the other statistics, i.e., MAE, RMSE, CC and R2, of OCO-2 under ±2° and ±3° matching conditions are worse than those of ±1°. This is not unexpected because TCCON data involve point observations, while OCO-2 data include an area-support grid (e.g., 2° × 2°, 4° × 4° or 6° × 6°) centered at the TCCON site. The larger the matching spatial range, the more obvious the scale effect. However, we did not find a similar phenomenon in GOSAT, which may be influenced by the sample size matched in different spatial ranges and the smoothing effect on unstable data.
Figure 4 compares the interpolated GOSAT (a), OCO-2 (b) and CT2019 (c) with TCCON data using the same matching criteria as in Figure 2 and Figure 3. OCO-2 matches the least amount of data because of more days of missing data. The statistical values (ME = −0.39 ppm, MAE = 1.207 ppm, RMSE = 1.611 ppm, CC = 0.935 and R2 = 0.874) of GOSAT XCO2 data obtained by interpolation are close to those of filtered GOSAT data when compared with TCCON observations. The interpolated OCO-2 is not as good as the filtered OCO-2 but still outperforms the interpolated GOSAT. Previous studies have shown that, in order to reveal the temporal and spatial variation characteristics of atmospheric CO2 concentration, the deviation in CO2 observations was required to be less than 2 ppm [61]. From the validation results based on TCCON data, the interpolated GOSAT and OCO-2 XCO2 datasets meet this criterion. The CT2019B data show the highest consistency with the TCCON XCO2 observations overall, with the highest CC (0.967) and R2 (0.935) and the lowest MAE (0.837 ppm) and RMSE (1.131 ppm). In the TC analysis, CT2019B can be taken as the reference dataset from the three collocated data products. Compared with TCCON, the interpolated OCO-2 and CT2019B data both show an overall positive bias close to zero, i.e., 0.017 and 0.033 ppm, respectively, while the interpolated GOSAT data have a negative bias of −0.39 ppm. About two-thirds of TCCON sites show negative biases for GOSAT data, while the opposite is true for OCO-2 and CT2019B. All three datasets show obvious negative biases at the HF, JS, CI and JF sites between 30°N and 35°N. Similar to the results in Figure 3, at 40°N to 60°N, the matched XCO2 values with TCCON in the high value range of about 407 ppm and above are generally distributed above the one-to-one line for interpolated OCO-2 data and CT2019B data.
It is noted that direct validation can only reflect the performances of satellite- and model-based XCO2 datasets at very limited sites and there are still many uncertainties. For instance, the validation results are affected by the representativeness of TCCON sites and the scale differences between different measurements. TCCON sites are very few around the world at present. Only 29 sites are used for validation, and the time periods of XCO2 data from different sites are inconsistent. The performances of satellite- and model-based XCO2 datasets are usually spatio-temporally heterogeneous [14]. The amount of data matched with TCCON varies with different sites and time periods and will inevitably impact the overall evaluation results.

3.2. Evaluation and Spatio-Temporal Analysis Based on TC Analysis

3.2.1. Consistency of TC Analysis with Direct Validation

We first analyzed the consistency of the results between TC validation and traditional direct validation to examine the availability of the TC technique on error estimation. To obtain more samples in TC analysis at each site, TCCON data from 12:00–15:00 local time every day were averaged to match the spatially interpolated GOSAT and OCO-2 data as well as CT2019B data to obtain four time-consistent matching sequences. In cases where there is more than one site within a 3° × 2° grid, the site with a longer observation time and more records is used for evaluation. Based on the four matching sequences, the RMSE and CC estimates by direct evaluation and TC/MTC analysis for each site are obtained using traditional indicator Formulas (3) and (4) and TC/MTC-based calculation Formulas (8) and (12), respectively. In TC/MTC analysis, a bootstrap simulation with 1000 replicates is applied to compensate the influence of temporal self-correlation of time series data on TC results and to obtain more stable TC-based validation results. Then, the means of 1000 RMSE and CC estimates at each site are calculated for comparison, respectively.
Table 3 compares the validation results between TC, MTC and the traditional direct evaluation methods. Although TC- and MTC-based error estimates for the three datasets are lower than the direct evaluation method, they are in good agreement with the traditional direct validation results. GOSAT has a higher average RMSE and a lower average CC than the other two datasets, while CT2019B is the opposite. The correlation coefficients between TC and the direct validation results are 0.49–0.81 and 0.81–0.95 for RMSE and CC, respectively. CC shows higher stability than RMSE in TC analysis. Comparing the results of TC and MTC, the TC estimates show slightly higher consistency than the MTC estimates. MTC might be more suitable for variables, e.g., daily precipitation, with wide variation ranges [39]. Compared with precipitation, the variation range of XCO2 is relatively small. In the following evaluation, we used only the TC model to evaluate GOSAT, OCO-2 and CT2019B data globally.
The error estimate of GOSAT shows stronger correlations between TC and the traditional direct validation method, with correlation coefficients of 0.8137 and 0.9538 for RMSE and CC, respectively. In contrast, CT2019B performs the worst. Our analysis shows that it is affected by few outliers (e.g., JF, SP and EU), where the variances of CT2019B are too small. According to Formula (8), this could result in excessively low or even negative estimates of σ ε i 2 . TC-based techniques cannot resolve the sign of the output σ ε i 2 . In this study, the negative σ ε i 2 estimates by TC or MTC are set to NULL. Additionally, cross-correlated error between datasets might also cause negative estimates in the TC-based evaluation results [62,63]. In general, TC analysis can be an alternative method for evaluating the relative performance of various spatial data, especially when the ground observation sites are sparse or there is a lack of observational data.

3.2.2. Validation Results of TC Analysis

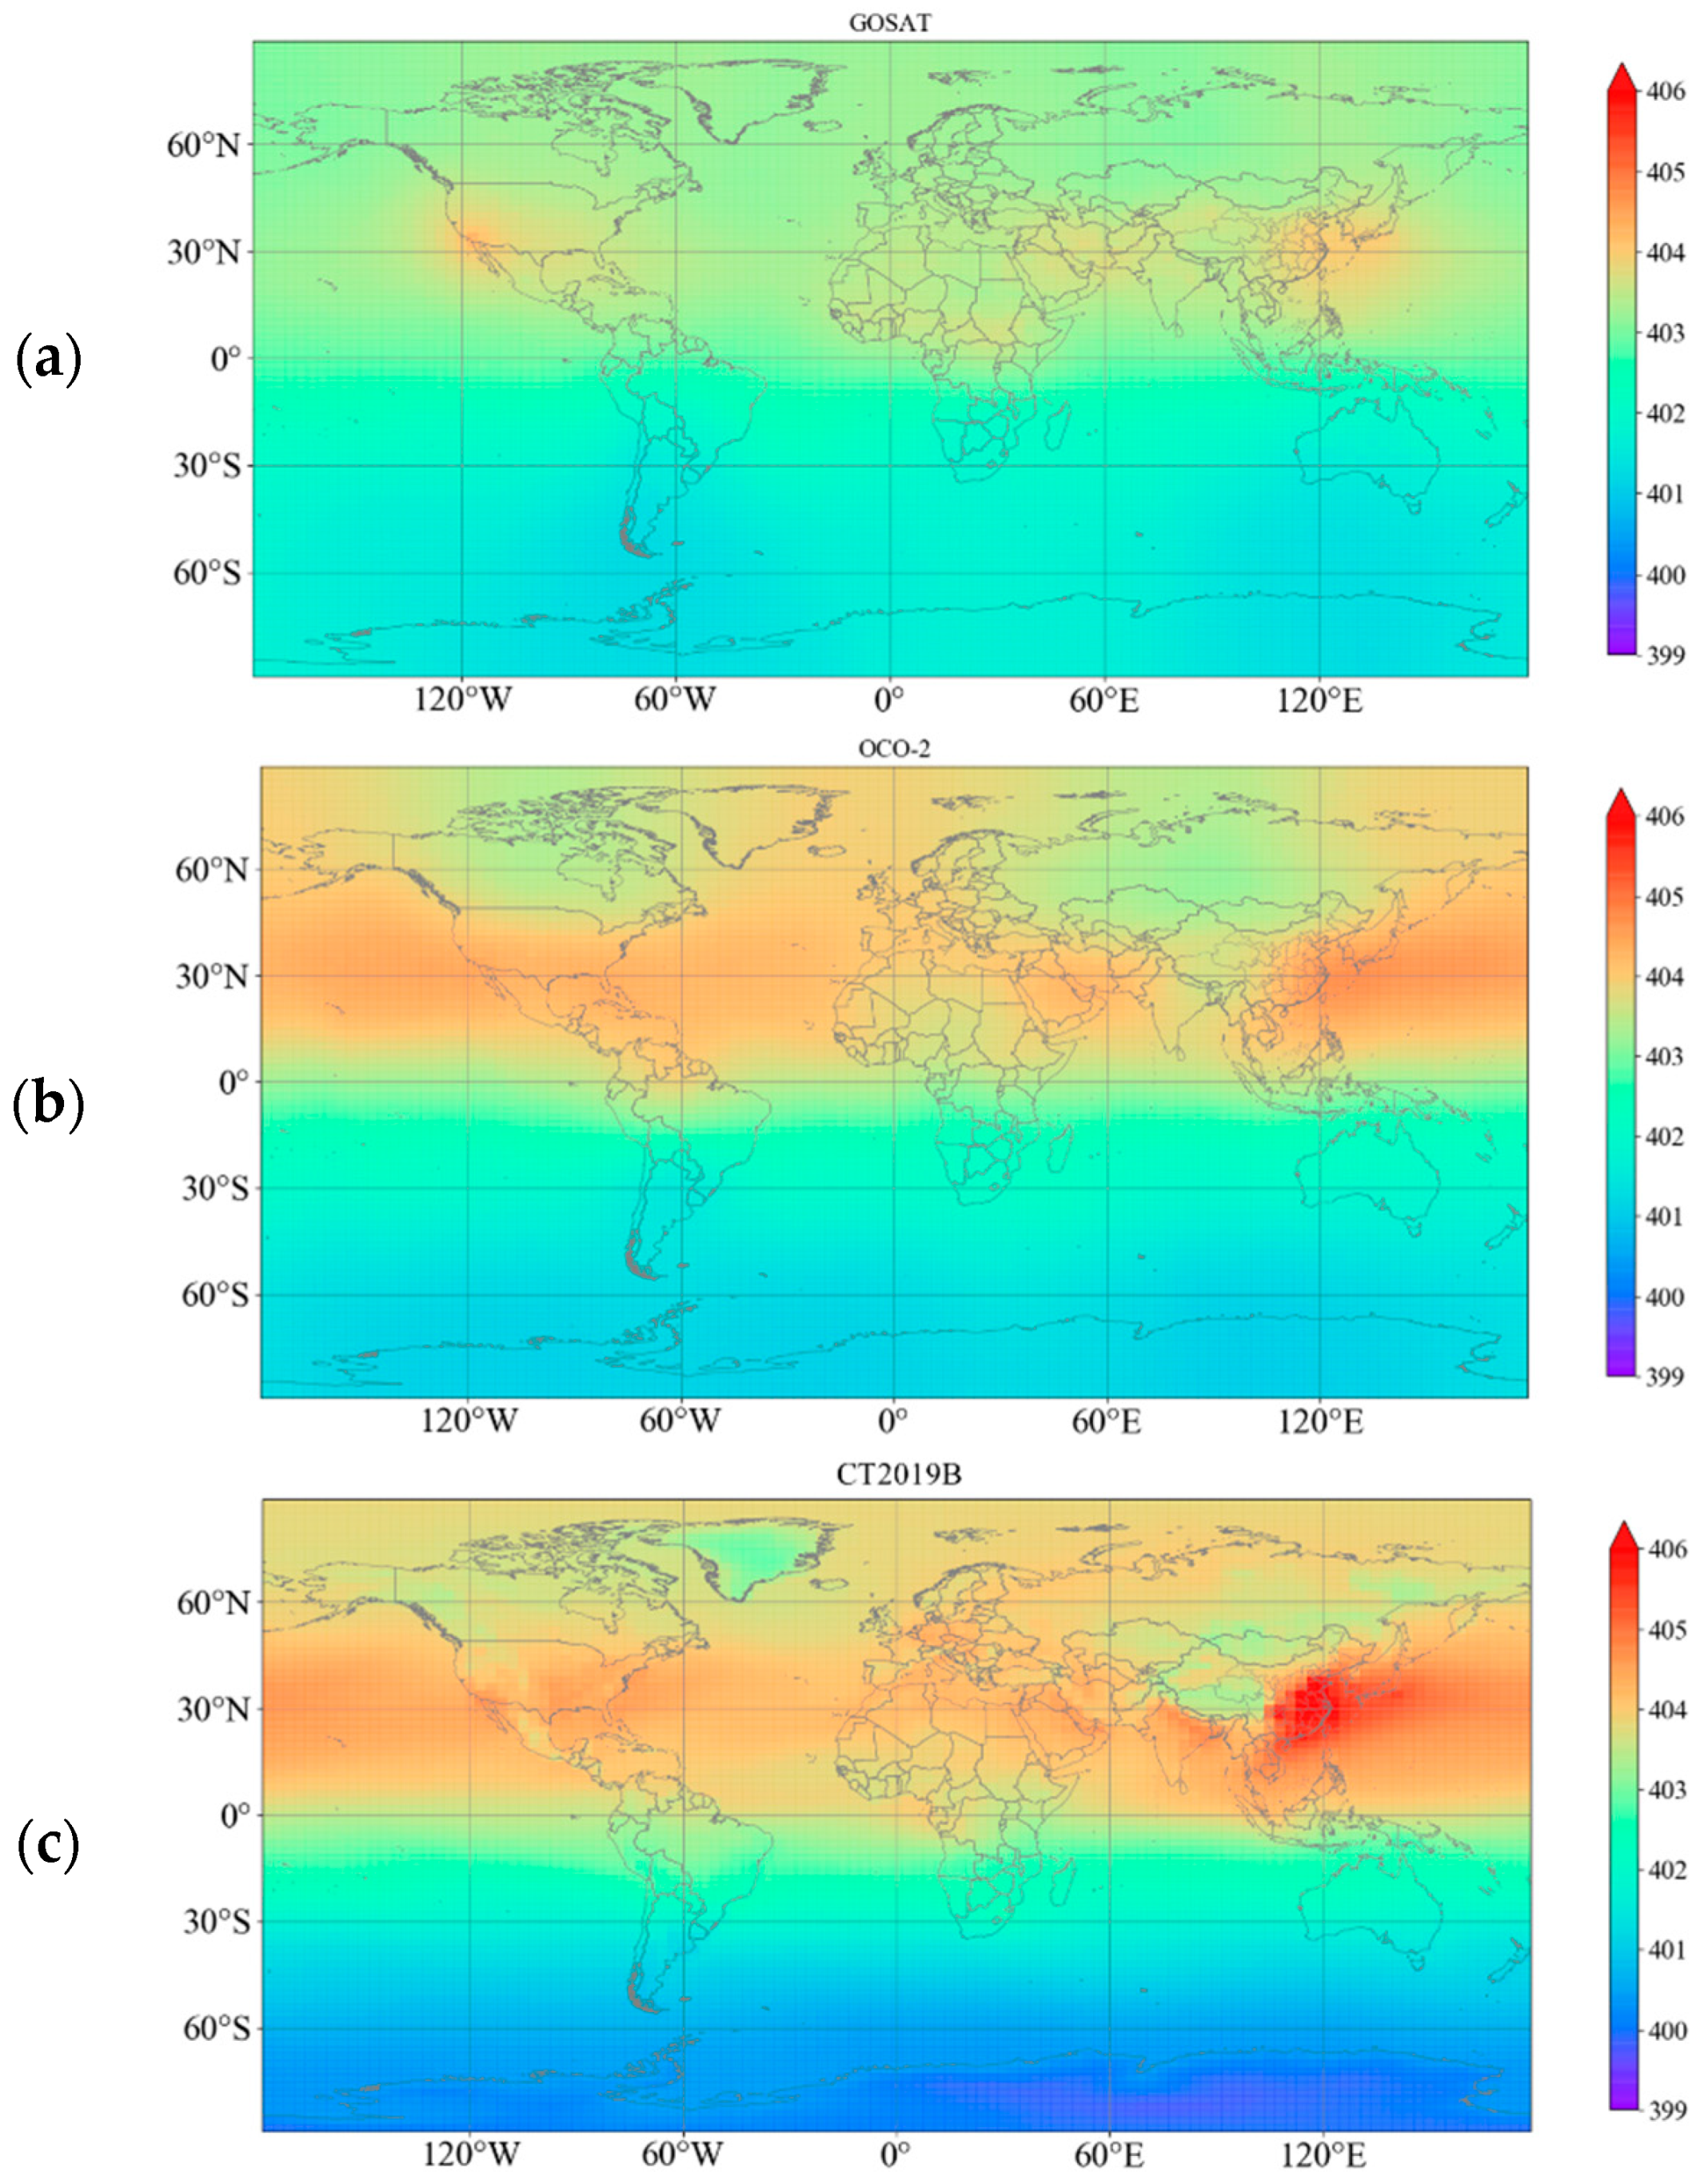
Figure 5 shows the spatial distributions of the average XCO2 mole fractions calculated using CT2019B data and the interpolated GOSAT and OCO-2 data. All the average XCO2 datasets are higher in the Northern Hemisphere, especially between 10°N and 50°N. Intensive human activities in the Northern Hemisphere, such as fossil fuel combustion and cement production, result in a higher concentration of carbon dioxide in the atmosphere [28]. From 30°S to 90°N, the average GOSAT XCO2 mole fractions are generally lower than the other two datasets, while the average mole fractions of CT2019B are higher, and the highest regions are located in the eastern and coastal areas of China. In the Southern Hemisphere, the average XCO2 mole fractions of CT2019B data gradually decrease from north to south and are lower than the GOSAT and OCO-2 datasets south of 30°S. This may be partly explained by the differences in the representative heights of the satellite-measured and modeled XCO2. In the ocean region, the glint mode of a satellite will increase the weight of the lower atmosphere with high CO2, which could cause higher XCO2. Higher spatial resolution enables OCO-2 to capture localized hot-spot emissions well, which may be an important reason for the larger average XCO2 mole fractions of OCO-2 than GOSAT in the Northern Hemisphere [18].
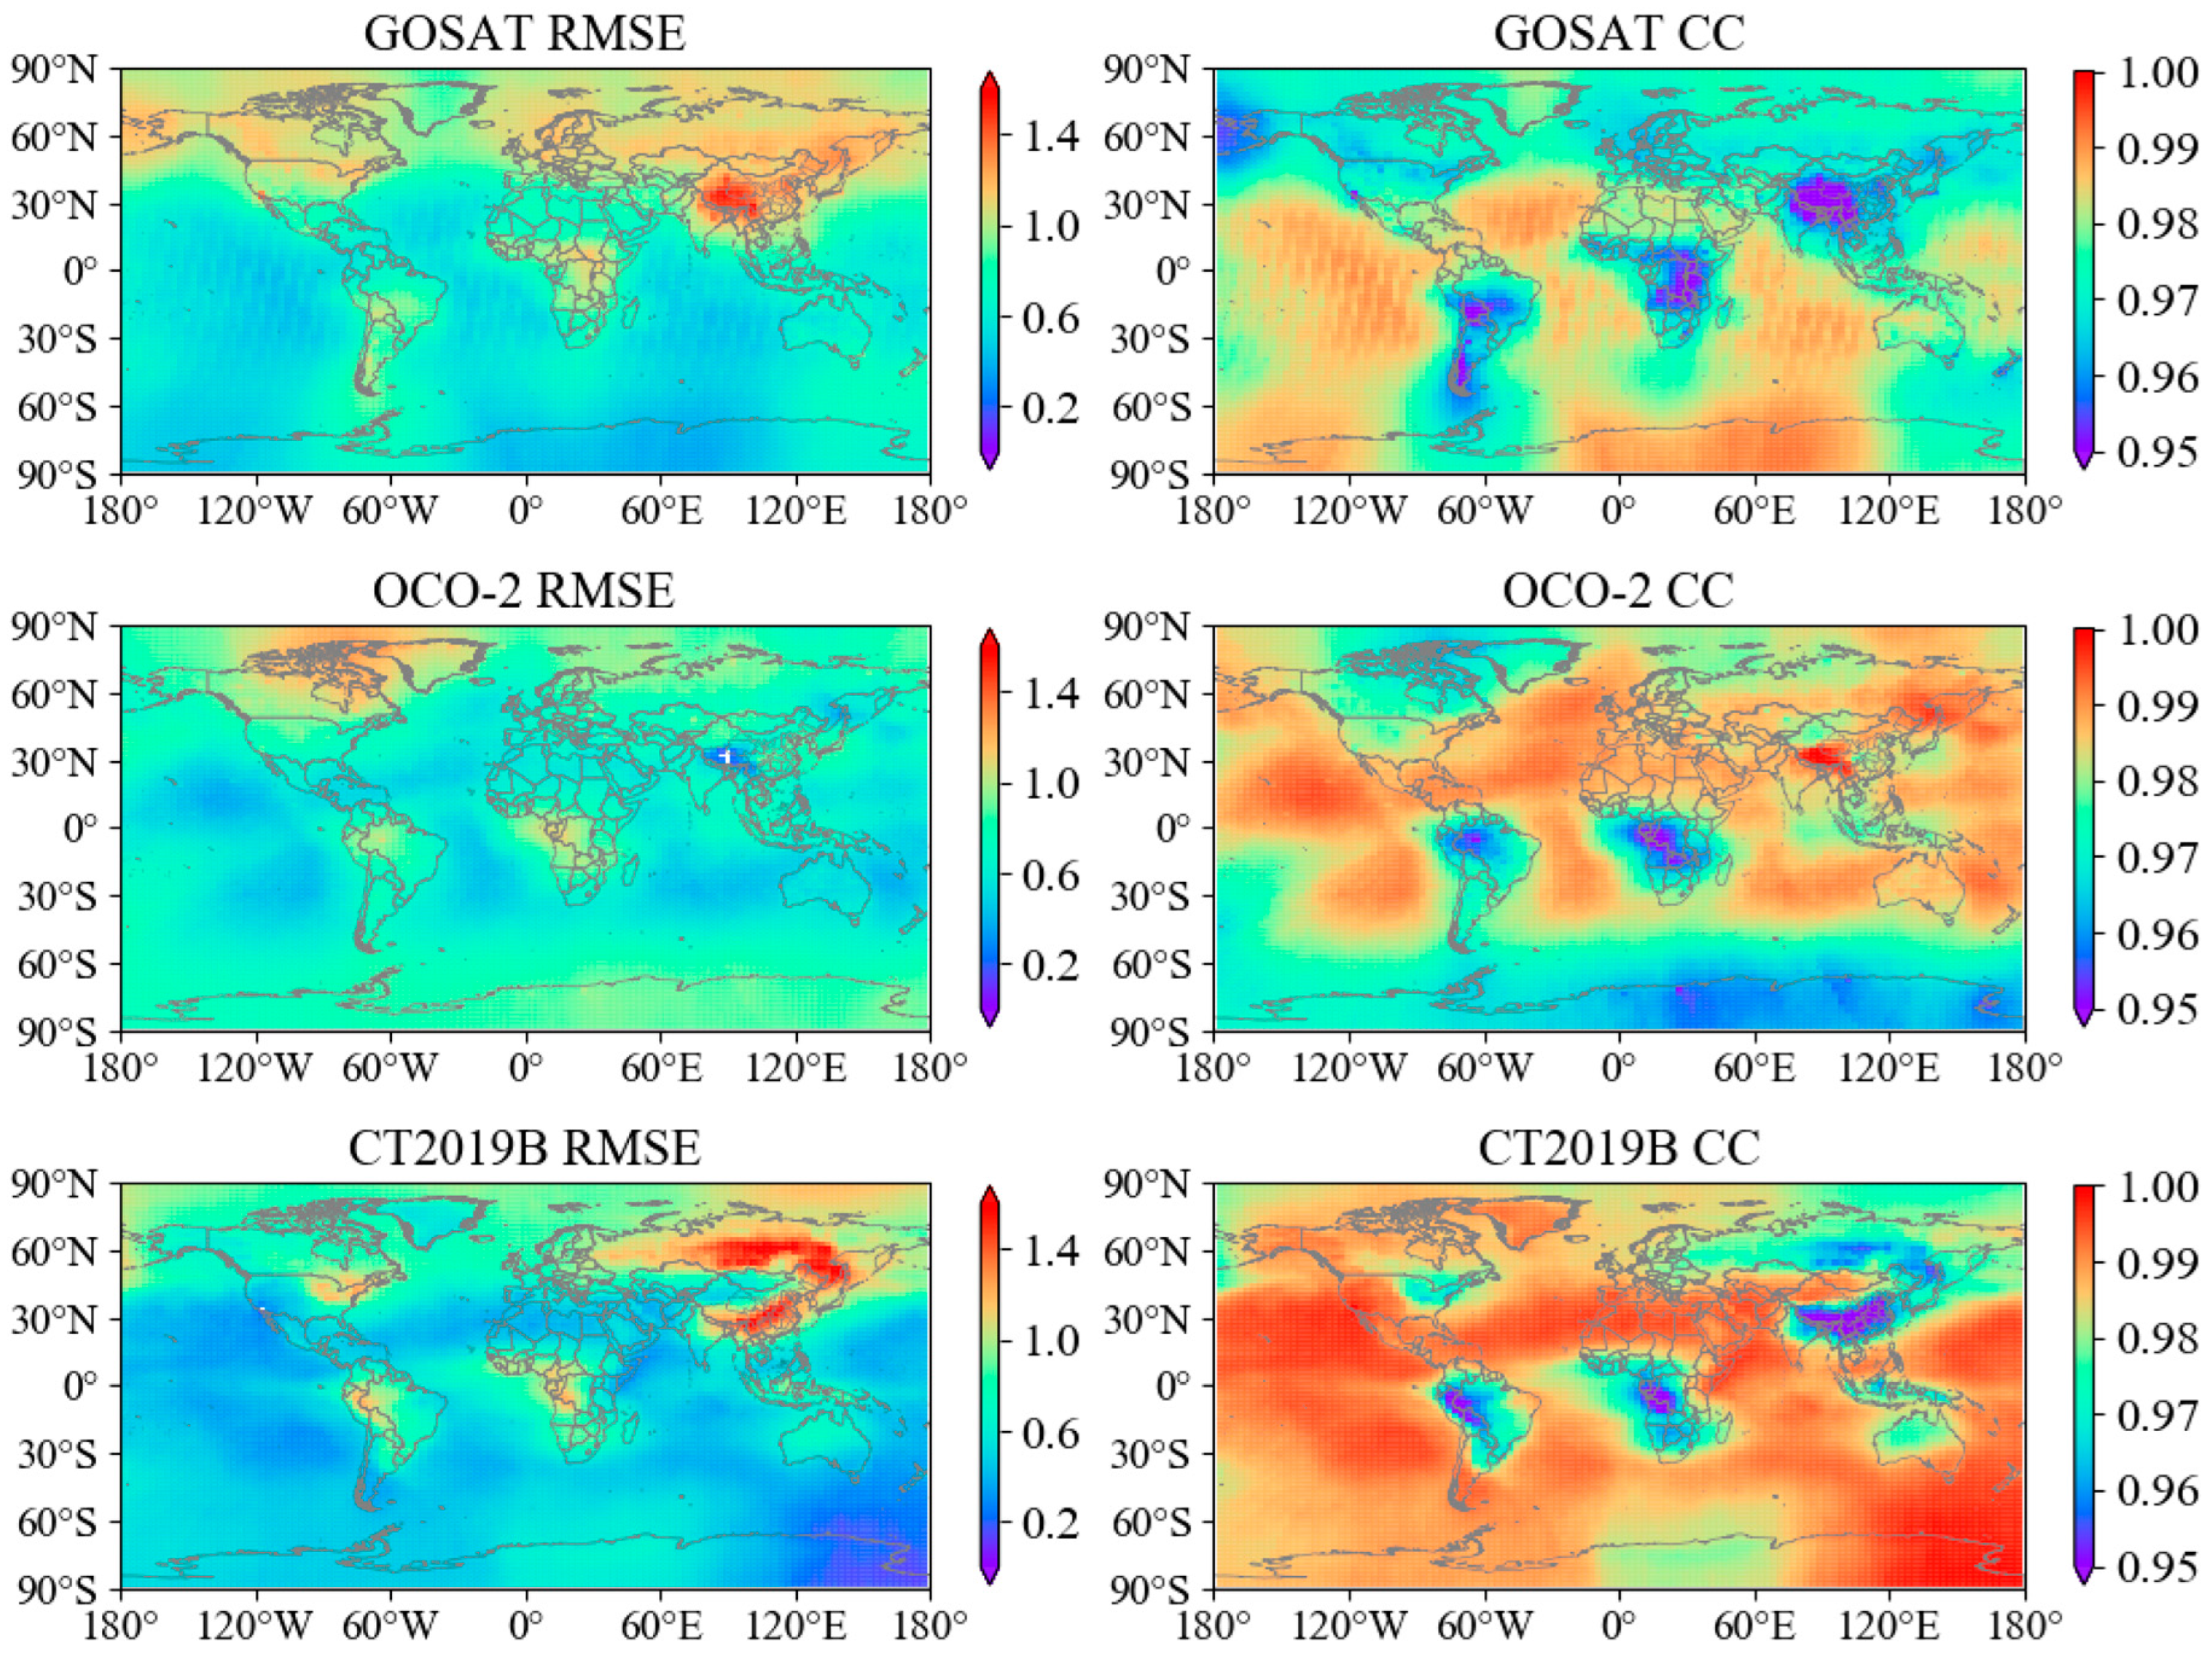
The interpolated GOSAT and OCO-2 data and CT2019B data are grouped to a triplet in the TC model. Figure 6 shows the mean validation results of TC analysis with 1000 bootstrap simulations. The spatial distributions of the data with the lowest RMSE or the highest CC values are displayed in Figure 7. As shown in Figure 6, the RMSE values of all three datasets are generally below 1.4 ppm, and the CC values are generally 0.96 and above. Overall, most of the terrestrial areas have larger errors than the marine areas, especially for the GOSAT and CT2019B datasets. Kong et al. [32] also found that the uncertainties of the seasonal mean mole fractions of CT2017B are relatively larger over land rather than ocean. All three datasets have relatively lower CC in South America and southern Africa. Liang et al. [17] also showed that the correlation between GOSAT and TCCON has a slight decreasing trend from north to south from September 2014 to December 2016. This result might be limited by the sparse and uneven distribution of TCCON sites, which are mainly distributed over land areas in the Northern Hemisphere. Our TC estimation results show that GOSAT generally has a smaller correlation with the truth in the land areas of Southern Hemisphere and western China.
As expected, CT2019B performs best in most marine areas, most of North America and Africa and regions where ground Global Atmosphere Watch (GAW) sites are used in assimilation of the CarbonTracker model, such as eastern and southern South America, southern Australia and northern Africa. However, it shows obvious larger errors in most of Russia and most of China, except the northwest, with RSME values concentrated between 1.30 and 1.72 ppm. The CarbonTracker assimilation system is susceptible to input observations, with large uncertainty in regions having few or no observations [64]. Jiang et al. [65] showed that CT2019B is significantly different from CMS-Flux NBE 2020 and Global Carbon Assimilation System version 2 (GCASv2) in temperate Asia. For GOSAT, larger RMSE and lower CC values are observed north of 30°N, the east of Asia, South America and southern Africa, and the largest errors are distributed in the Qinghai–Tibet Plateau. There are few areas where GOSAT performs better than CT2019 and OCO-2, e.g., the Southern Hemisphere, including northern South America, the marine areas of western Africa and western and central Antarctica. Overall, OCO-2 performs well in the regions with the largest errors in CT2019B and GOSAT, e.g., most regions of 30°W–180°E and 50°N–90°N, eastern Asia and its coastal areas and the eastern United States and its coastal areas. Surprisingly, OCO-2 performs slightly better than CT2019 in Europe, which might be related to the relatively dense TCCON sites available across Europe, so OCO-2-derived XCO2 could be more accurately calibrated.
Compared with GOSAT, OCO-2 is generally superior in most terrestrial areas and most areas of the Northern Hemisphere. OCO-2 has a higher spatial resolution and can obtain more measurements. Zhang et al. [28] compared HASM XCO2 estimates with GOSAT and OCO-2 products and also found that OCO-2 could provide more reliable global XCO2 patterns than GOSAT. The largest error in OCO-2 is distributed in the north of North America, where the RMSE is between 1.0 and 1.32 ppm. For GOSAT, the regions with better performance are mainly distributed in the Southern Hemisphere, e.g., northern South America, the Pacific Ocean in western South America and south of 50°S. It is noted that GOSAT and OCO-2 data used in the TC analysis are interpolated XCO2 datasets, so the uncertainty caused by the interpolation may be transferred to TC analysis, especially for regions with few observations at high latitudes.
Our results highlight the necessity of jointly using multi-source CO2 datasets to estimate CO2 sources and sinks, and OCO-2 derived XCO2 data can be considered as alternatives to the model-based XCO2 data over areas with no ground sites or few sites, such as Russia and China.
The standard deviations of the RMSE and CC estimates of the XCO2 mole fractions for the GOSAT, OCO-2 and CT2019B datasets using 1000 bootstrap simulations are displayed in Figure 8. They provide a confidence range regarding the TC-based RMSE and CC estimates. It shows that the standard deviations of the RMSE and CC estimates are generally about one and two orders of magnitude smaller than their estimations themselves, respectively, indicating that the estimated mean RMSE and CC by bootstrap simulations are reasonable. The regions with larger RMSE and lower CC values generally have larger standard deviations, especially for CC estimates. However, some regions with small RMSE values also exhibit larger standard deviations, such as OCO-2 in the Tibetan Plateau region and CT2019B in east Antarctica. This may be related to the seasonal variation in accuracy of the specific data. Generally, OCO-2 has greater spatial variability than GOSAT and CT2019B.

4. Discussion

Both TC and MTC underestimate the errors of GOSAT, OCO-2 and CT2019B XCO2 data compared with the direct evaluation results (Table 3). Similar error underestimation has also been reported in other evaluation studies via TC analysis [39,44,46,66]. The gap can be attributed to the uncertainty of the TC estimation, e.g., the violation of the zero-error cross-covariance assumption, and the uncertainty of the direct evaluation. It is often assumed that the input datasets in the TC model are free from error cross-correlation, while this may not be true in practical applications. Although the data triplets consisting of two different satellite-derived XCO2 products (GOSAT and OCO-2) and a model product (CT2019B) are applied here, there are still potential impacts on the TC-based estimation since both the GOSAT and OCO-2 level 2 products are derived using the same ACOS inversion algorithms and bias-corrected by using TCCON observation data. The CT2019B.xCO2_1330 (LST) dataset also assimilates ground observations, and the errors of these datasets have correlations in some areas, which might violate the TC hypothesis and result in slightly lower error estimates. Fang et al. [44] pointed out that this kind of underestimation is understandable because TC estimates approximate random errors based on its theoretical assumptions rather than systematic errors, and the assumption of zero-error cross-covariance between products may cause additional uncertainty. Alemohammad et al. [39] suggested that violation of the zero cross-covariance error within triplets would cause an underestimation of RMSE by TC.
On the other hand, the direct validation results with TCCON data may be overestimated compared with the unknown true error. The traditional direct validation results are inevitably affected by the representativeness errors of in situ measurements derived from spatial heterogeneities as well as the spatial scale mismatch between point-support and areal data. Chen et al. [60] and Wu et al. [46] pointed out that the representativeness errors of in situ measurements artificially magnified the quantified errors of various satellite products in the direct comparison based on ground observations, while TC-based estimation could weaken such affects to a certain extent. It can be inferred that TC error estimation results would be lower than the true physical errors, but the gap would be smaller than the gap with the direct validation results based on TCCON data.
Furthermore, some measurements are affected by local pollution or complex terrain, which will also affect the observation accuracy and the evaluation results [67]. For instance, CI, DF and JF sites, in or adjacent to a megacity with complex adjacent terrain in California, are affected by local urban sources [14]. However, these local enhancements are significantly reduced in the 3° × 2° satellite or model results.
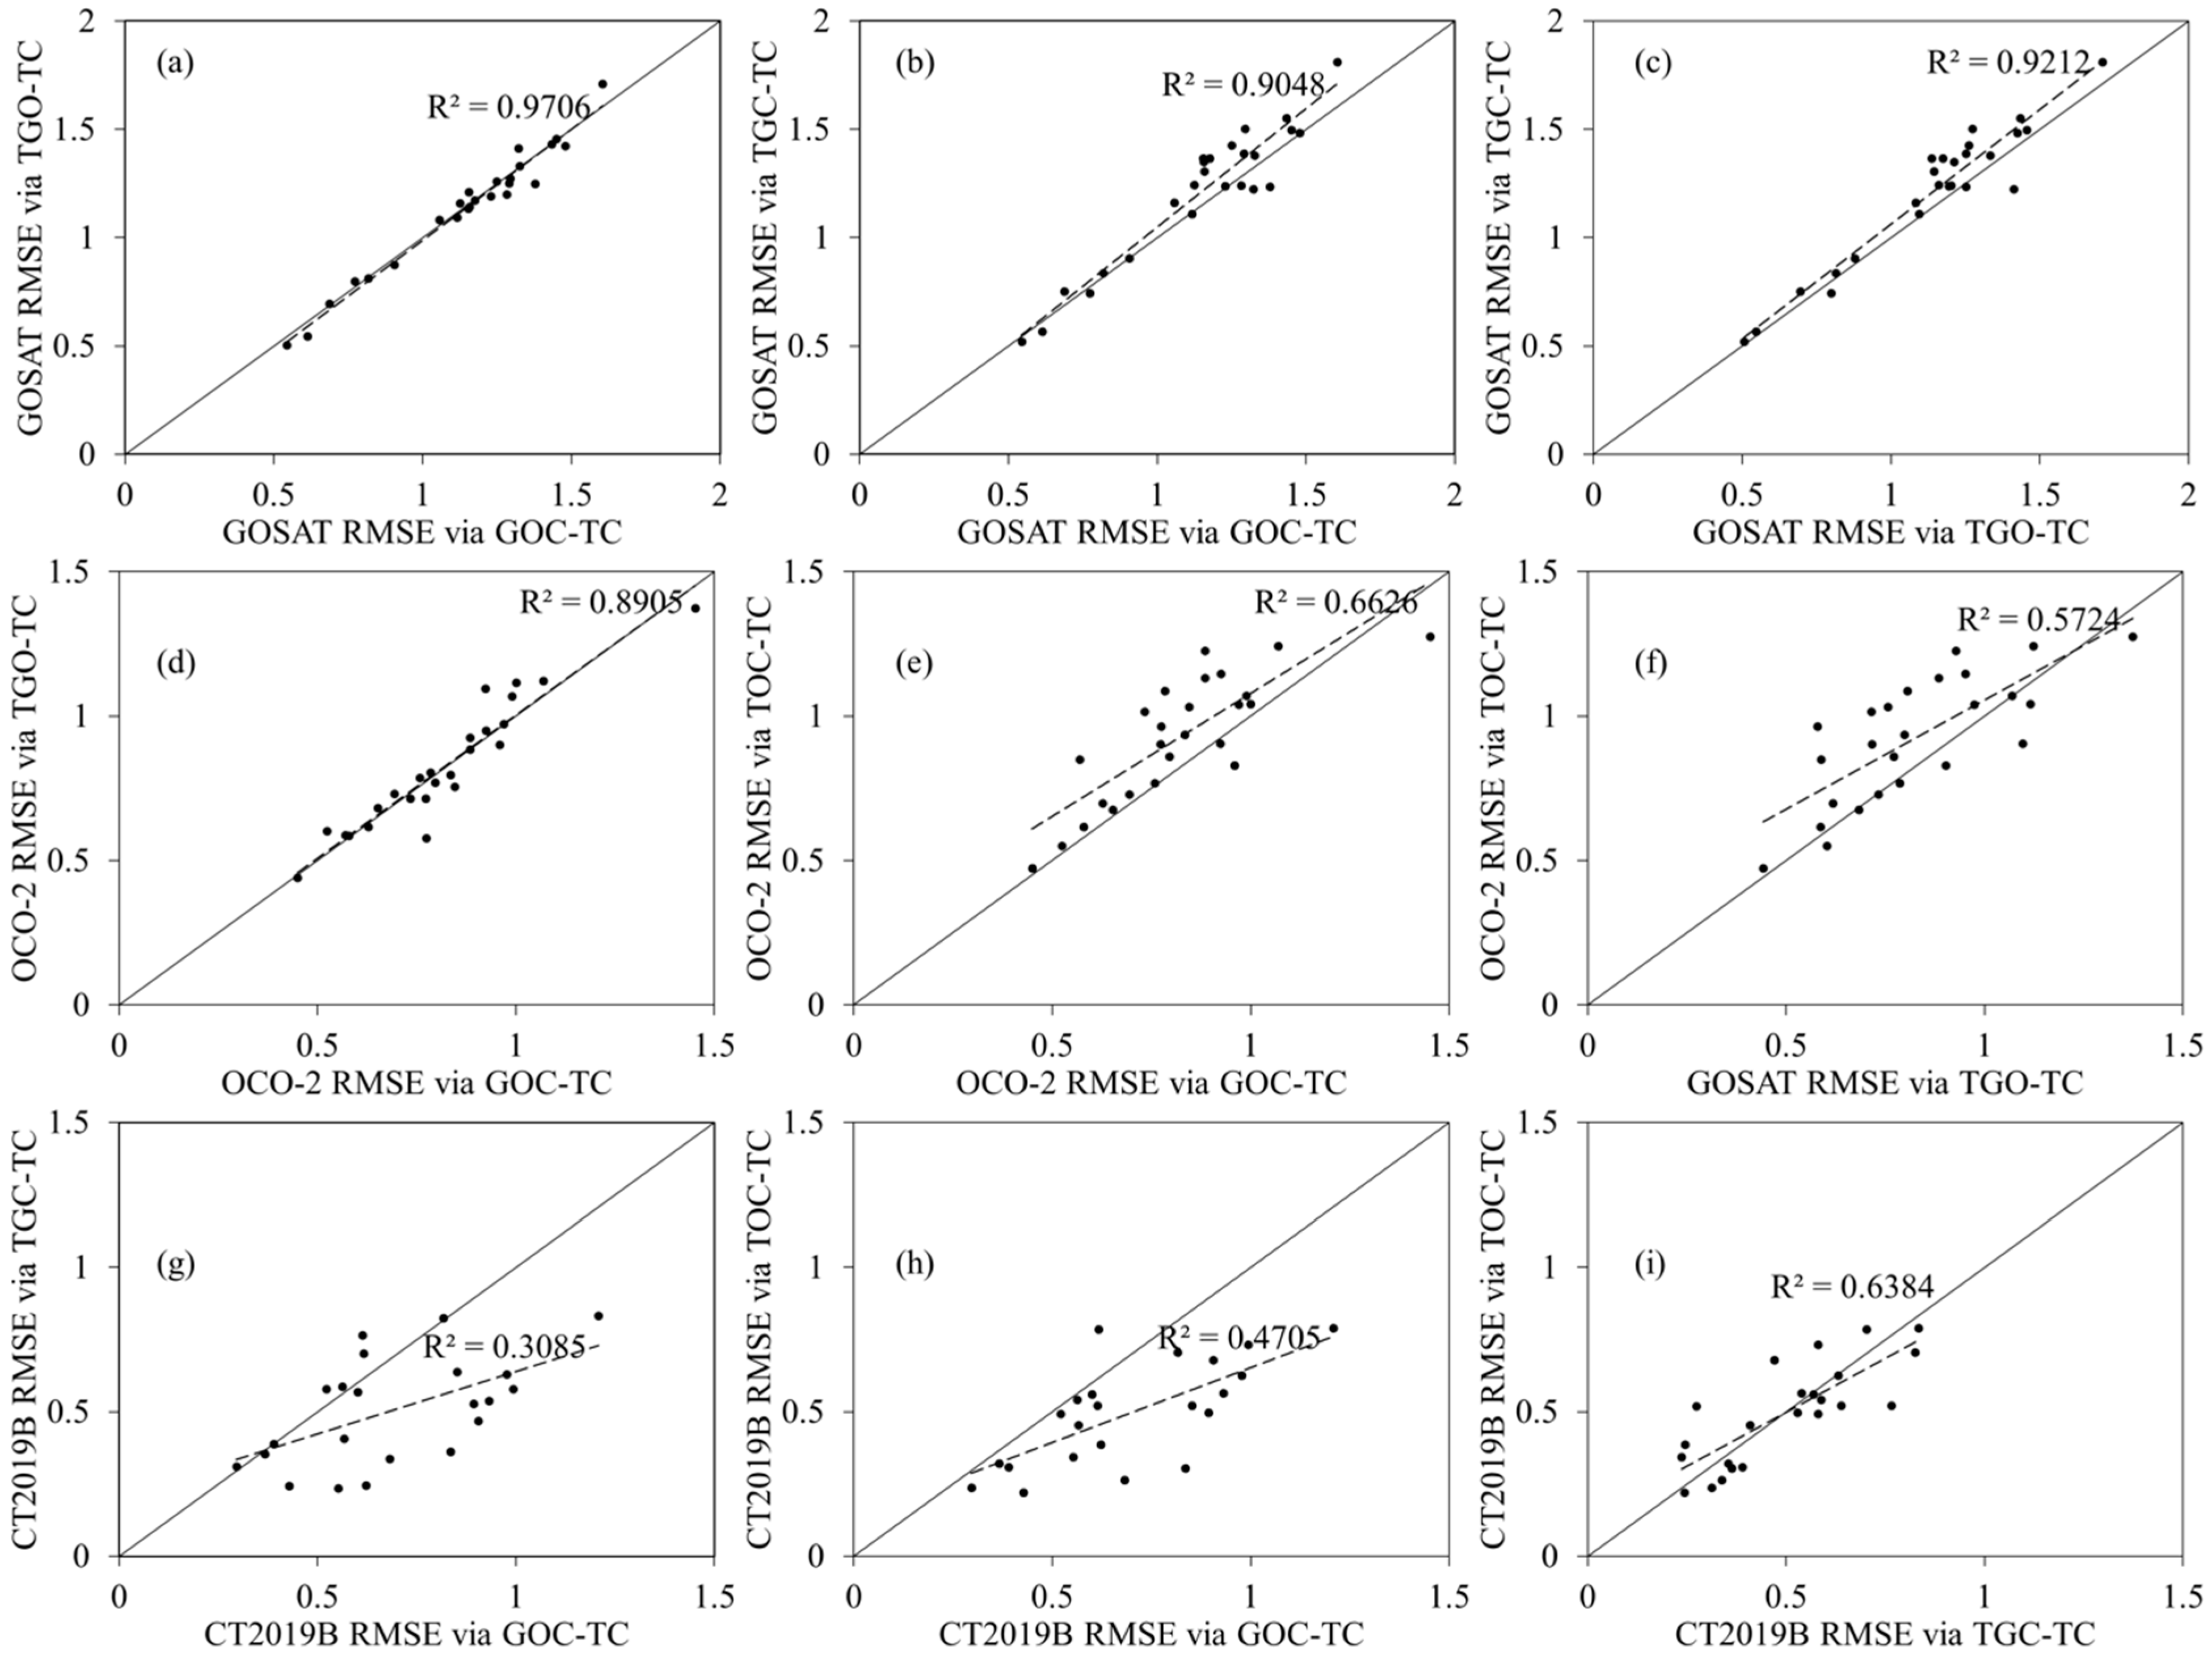
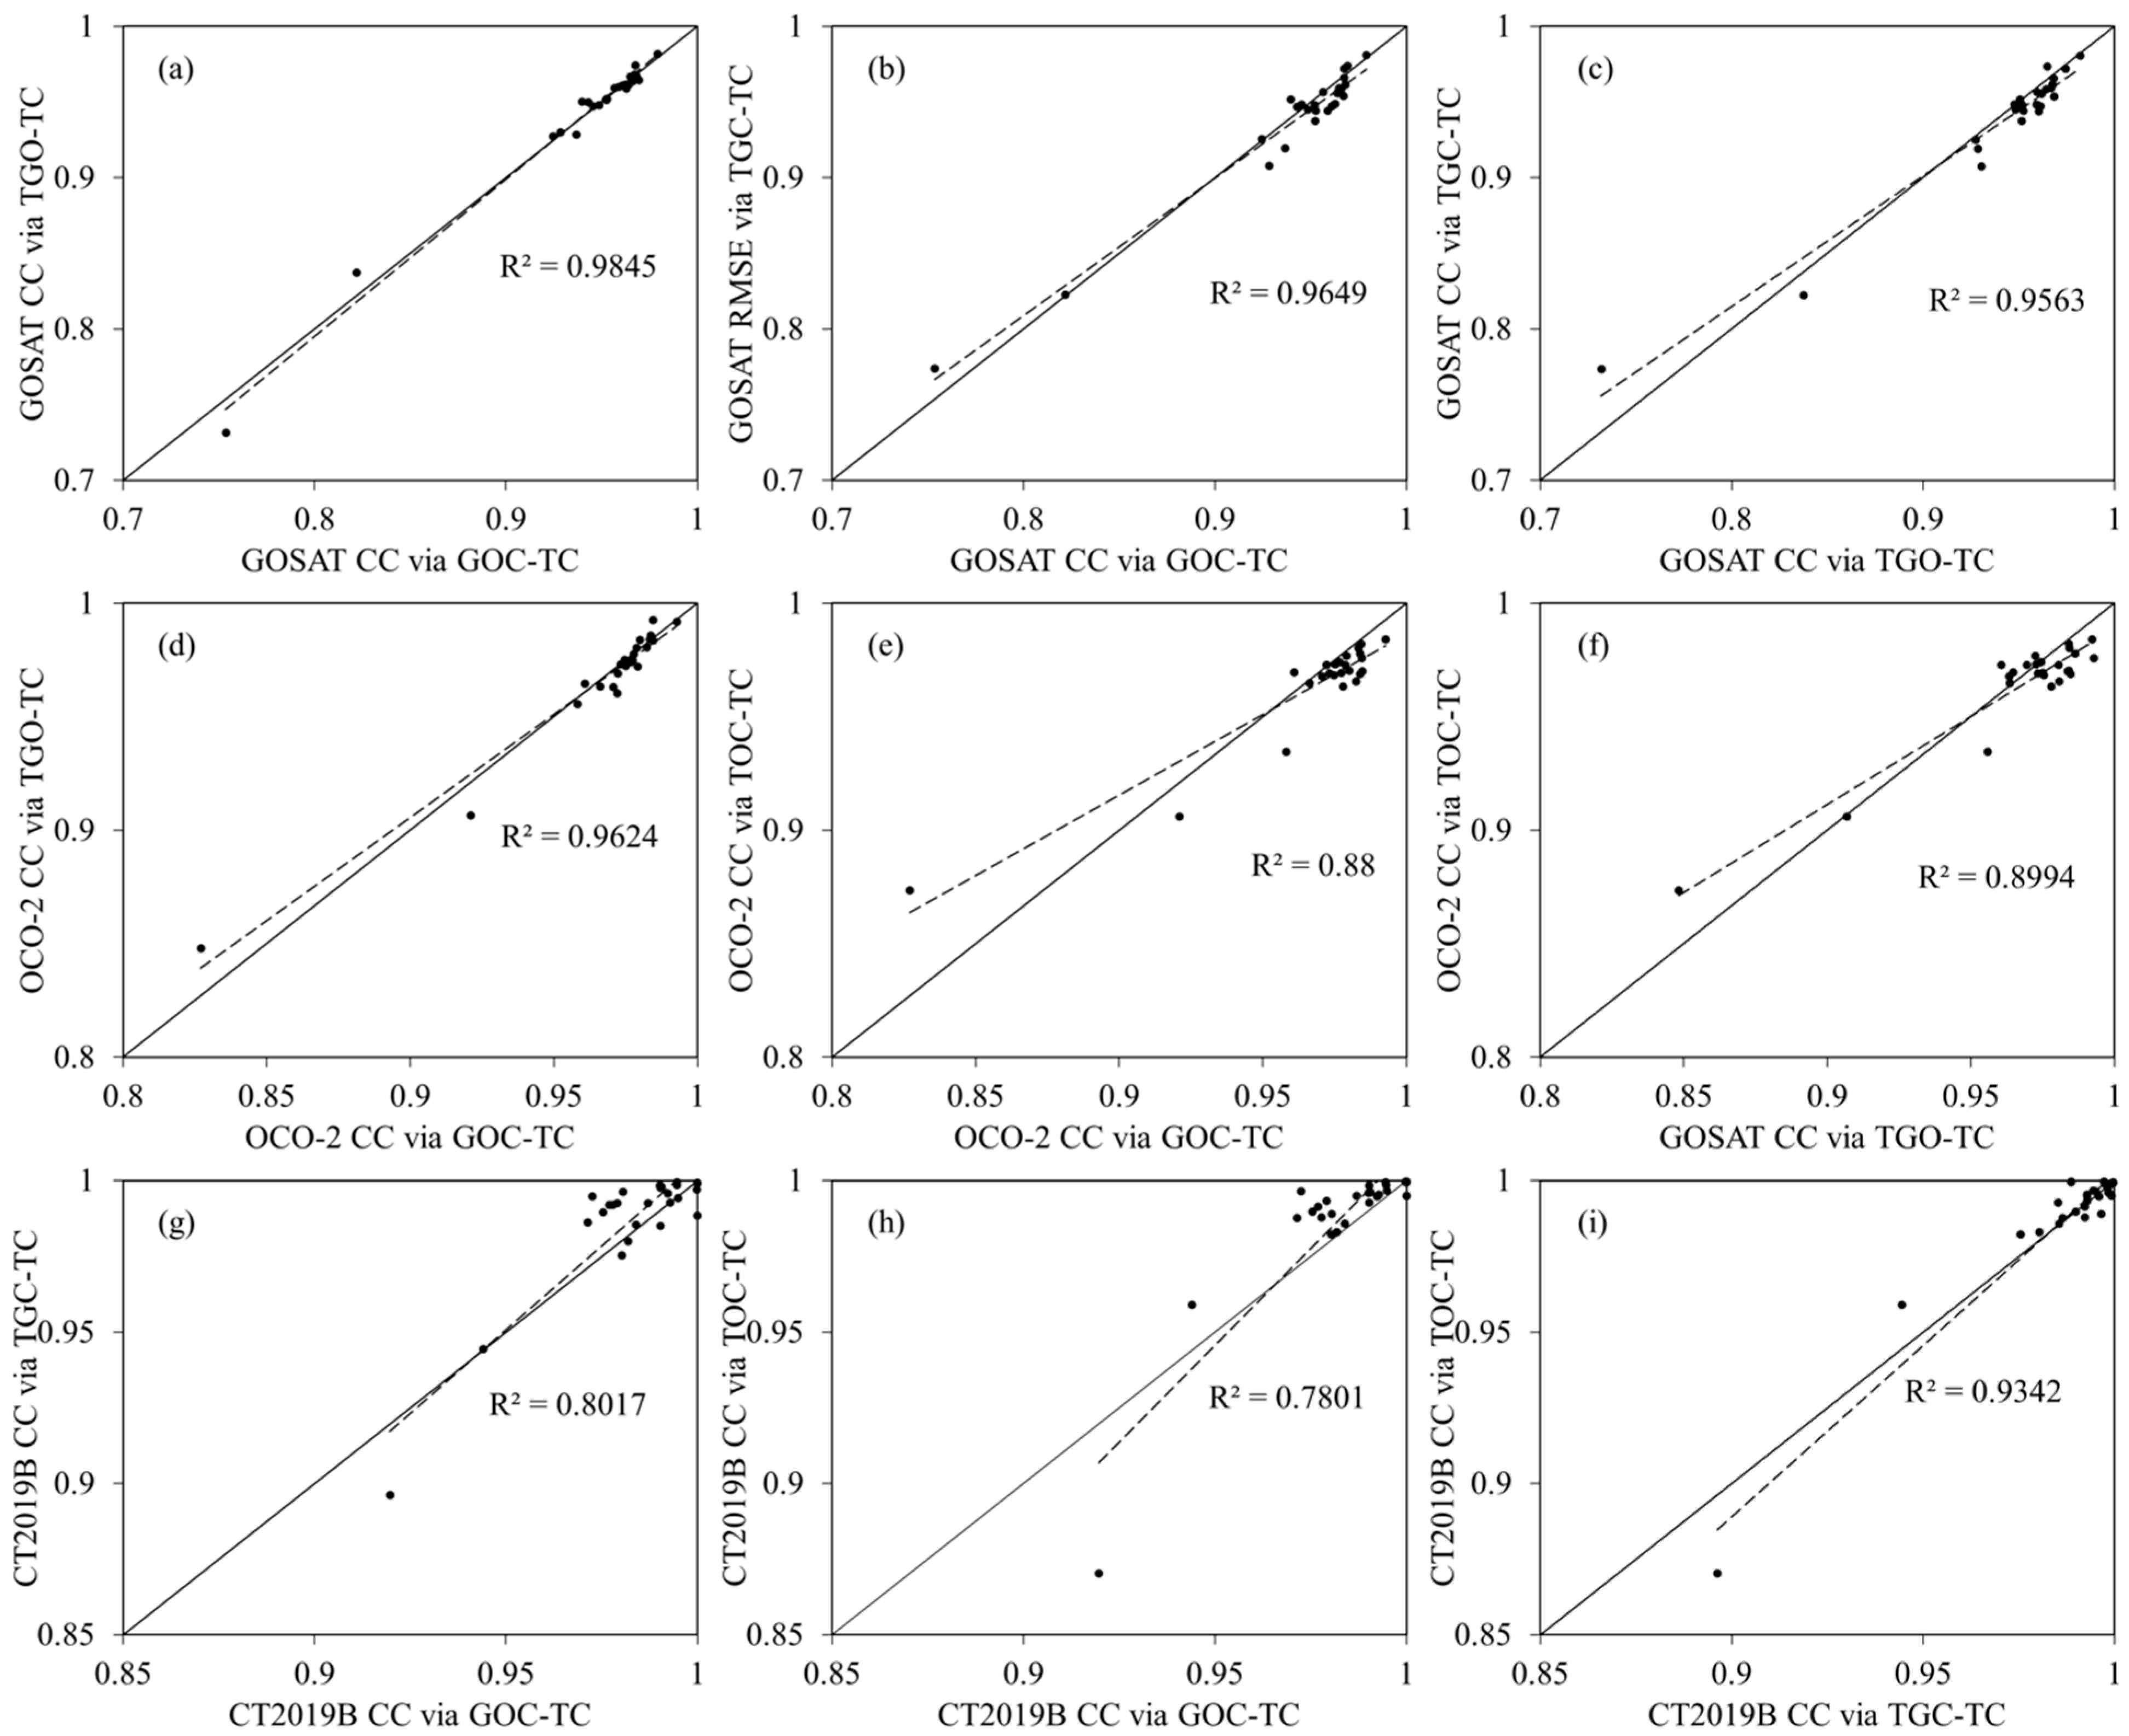
In TC analysis, three independent datasets for the same variable are required. Different triple combinations in a TC model may have an impact on the stability of TC-based validation for multi-source XCO2 products. Therefore, we composed four different triple groups to explore this issue by using the matched sequences of interpolated GOSAT and OCO-2, CT2019B and TCCON as follows: Group 1 includes the interpolated GOSAT and OCO-2 and CT2019B data (termed as GOC-TC), Group 2 includes TCCON and interpolated GOSAT and OCO-2 data (termed as TGO-TC), Group 3 includes TCCON and interpolated GOSAT and CT2019B data (termed as TGC-TC), and Group 4 includes TCCON, OCO-2 and CT2019B (termed as TOC-TC). The RMSE and CC estimates are calculated by using TC for each site with the four different combinations.
Figure 9 and Figure 10 summarize the comparison results of TC-based RMSE and CC estimates using the four triplets. Different from previous studies [39,60], the robustness of TC analysis is affected by the choice of datasets in the triplets, and the TC-based evaluation results show different stabilities for the GOSAT, OCO-2 and CT2019B XCO2 datasets. Overall, the stability of TC-based estimates is the best for GOSAT, followed by OCO-2 and CT2019B. The coefficients of determination between the TC-based RMSE and CC estimates for GOSAT are above 0.90 and 0.95, respectively. The validation results of GOC-TC and TGO-TC show the best consistency, with higher determination coefficient values for both the GOSAT and OCO-2 statistics. The TC-based CT2019B statistics, especially for the RMSE estimates, present worse robustness than the other two datasets. The maximum determination coefficients of RMSE and CC of CT2019B are 0.6384 and 0.9342, corresponding to TOC-TC and TGC-TC, respectively.
By contrast, the TC validation results of the other combinations, e.g., TOC-TC vs. GOC-TC, TOC-TC vs. TGO-TC and TGC-TC vs. GOC-TC, generally have a degree of systematic overestimation or underestimation. For example, when replacing the GOSAT sequence in the GOSAT–OCO2–CT2019B triplet group with the TCCON sequence to form a new triplet group, TCCON–OCO2–CT2019B, the covariance between the CT2019B sequence and the TCCON sequence ( C T C ) is obviously smaller than that with GOSAT sequence ( C G C ), and the ratio of covariance of the OCO-2 and CT2019B sequences to the GOSAT sequence is larger than the covariance ratio between them and the TCCON sequence (i.e., C G O C G C > C T O C T C ). According to Formulas (8) and (12), these could result in larger OCO-2 errors (larger RMSE and lower CC) and lower CT2019B errors (lower RMSE and larger CC) in the TOC-TC results than those estimated in the GOC-TC results (Figure 9e,h and Figure 10e,h). The stability of TC analysis is impacted by the accuracy gap between different datasets within the comparison groups, such as the accuracy gap of OCO-2 and TCCON in triple groups GOC-TC and TGC-TC. When the accuracy difference is small, TC analysis will show higher stability.
Although TC error estimates of different combinations have some differences, the ranks of overall performances of different XCO2 products estimated via TC analysis are generally consistent (i.e., CT2019B is the best, followed by OCO-2 and GOSAT; see Figure 9 and Figure 10). The TC-based error estimates, especially CC, are in good agreement with the direct comparison results (Table 3). This means that TC is an alternative and effective method to characterize the performances of multiple satellite- and model-based XCO2 datasets. The CC is superior to RMSE in characterizing the performances of various datasets and has stronger robustness. Previous works also indicated that CC in ETC proposed by the authors of [47] is more advantageous because it does not require a reference dataset and could provide a more comparable estimate [48]. Chen et al. [62] suggested that the RMSE estimation results by TC analysis are subject to the chosen reference dataset in the triplets and the multiplicative and additive biases of references. Therefore, we suggested the choice of the CC metric of ETC in TC-based evaluation and fusion of multi-source XCO2 datasets. It should be noted that TC estimation can only obtain the theoretical error estimates based on a set of assumptions rather than the true physical errors. The TC-based evaluation results still suffer from some uncertainties.

5. Conclusions

This paper presents, for the first time, a global assessment and comparison of GOSAT (ACOS-L2_Lite_FP.9r), OCO-2 (ACOS-L2_Lite_FP.10r) and CT2019B XCO2 products from 6th September 2014 to 29th March 2019 by using direct comparison and triple collocation (TC) analysis. Three different spatio-temporal matching criteria were employed in a direct evaluation with ground-based TCCON data. In TC analysis, both an original additive error model and a multiplicative error model were introduced to estimate the global error (RMSE) distribution for each product with respect to unknown truth, and the extended triple collocation was also applied to estimate the correlation coefficients. To account for sampling uncertainties, a bootstrap re-sampling approach was employed for the TC estimates at each pixel. In addition, we also analyzed the uncertainty of the TC estimation.
The direct validation results show that the GOSAT, OCO-2 and CT2019B XCO2 products were generally in good agreement with the ground-based TCCON data during the study period, with CC values of 0.933 and above. CT2019B fits best with ME, MAE, RMSE and CC values of 0.033 ppm, 0.837 ppm, 1.131 ppm and 0.967, respectively. GOSAT shows larger errors with ME, MAE, RMSE and CC values of −0.287 ppm, 1.257 ppm, 1.637 ppm and 0.933, respectively, under the ±30 min and ±1° spatio-temporal matching condition. OCO-2 data are superior to GOSAT data under different spatial matching conditions, having a higher CC (0.961, 0.953 and 0.958) and the lowest MAE (0.944, 0.995 and 0.966 ppm) and RMSE (1.273, 1.356 and 1.308 ppm). The ranks of the overall performances of different XCO2 products estimated via the TC technique are consistent with the validation based on TCCON data. However, the TC method tends to underestimate the RMSE and overestimate the correlation coefficient in different XCO2 products compared with the direct validation results due to the representativeness error of in situ measurements in direct comparison and the violation of the zero-error cross-covariance.
The mean validation results of TC via 1000 bootstrap simulations reveal that most of the terrestrial areas have larger errors than the marine areas, especially for the GOSAT and CT2019B datasets. The spatial patterns of the errors of the three datasets have obvious regional differences. As expected, CT2019B is superior overall to GOSAT and OCO-2 in most areas, especially in the marine areas, while it shows large errors in most of China except the northwest, and Russia, where few in situ observations are used in the assimilation model. For GOSAT, larger RMSE values and lower CC values are observed in the Qinghai–Tibet Plateau region, which may be related to few valid data points in this region. Interestingly, OCO-2 performs well in these areas compared with CT2019B and GOSAT, with an RMSE value below 1 ppm and a CC value above 0.98. Improvements in the retrieval algorithm and the high resolution of OCO-2 increase the number of valid data points and reduce uncertainties. Compared with GOSAT, OCO-2 is generally superior in most terrestrial areas and most areas of the Northern Hemisphere except northern Canada and Greenland. For GOSAT, the regions with better performance are mainly distributed in the Southern Hemisphere, e.g., northern South America, the Pacific Ocean of western South America and areas south of 50°S.
The uncertainty analysis indicates that the choice of triplets has an obvious impact on the TC validation results (Figure 9 and Figure 10). The robustness of the TC estimation is related to the accuracy gap between different datasets within the comparison groups. When the accuracy difference is small, the TC analysis will show higher stability. For instance, the estimated GOSAT and OCO-2 errors based on group GOC-TC are in good agreement with those based on group TGO-TC, while there is less consistency between GOC-TC and TGC-TC due to the relatively larger accuracy gap between the OCO-2 and TCCON data. Further, the CC estimates based on ETC have higher consistency with the direct validation results and higher robustness compared with the TC-based RMSE estimates.
This study demonstrates the application of a TC approach in validating multiple satellite- and model-based XCO2 products. It shows that TC could be an alternative and effective way to quantify spatial errors of gridded XCO2 data, particularly for regions with sparse or no in situ measurements, which is beneficial for multi-source XCO2 data fusion and the CO2 assimilation model. It is noted that the TC-based error estimates can characterize the performances of various XCO2 data but only limited to the theoretical errors subjected to a set of assumptions rather than the physical errors. This study only explores the application of the TC method in the validation of daily gridded XCO2 data. In future works, we will conduct TC validation on more XCO2 products (e.g., GOSAT 3 and OCO-3 data) at different spatio-temporal resolutions with the increase in different available satellite and model simulation data.

Author Contributions

Conceptualization, Y.C., D.Y. and S.F.; methodology, Y.C. and S.F.; software, J.C.; validation, J.C. and X.S.; formal analysis, Y.C., J.C. and D.Y.; investigation, Y.C., X.S., S.L. and Y.S.; resources, X.S. and S.F.; data curation, J.C.; writing—original draft preparation, Y.C.; writing—review and editing, S.F. and X.S.; visualization, Y.C., S.L. and D.Y.; supervision, S.F.; funding acquisition, Y.C. and D.Y. All authors have read and agreed to the published version of the manuscript.

Funding

This research was funded by the National Natural Science Foundation of China (Grant No. 41901363), the National Key Research and Development Program of China (Grant No. 2020YF0607502) and the Heilongjiang Provincial Natural Science Foundation of China (Grant No. LH2021D021).

Data Availability Statement

The ACOS/GOSAT XCO2 products were released by NASA’s Atmospheric CO2 Observations from Space team on the website https://oco2.gesdisc.eosdis.nasa.gov/data/ (accessed on 21 January 2022). The OCO-2 Level 2 XCO2 Version 10 Lite product from the full-physics retrieval algorithm is available online at https://disc.gsfc.nasa.gov/ (accessed on 17 August 2021). The current release of NOAA’s CarbonTracker, CT2019B, is at http://carbontracker.noaa.gov (accessed on 28 December 2021). The Total Carbon Column Observing Network (TCCON) provides long time series precise column-averaged abundances of CO2, CH4, N2O, HF, CO, H2O and HDO at https://tccondata.org/ (accessed on 2 December 2021).

Acknowledgments

The authors appreciate the data support from the ACOS GOSAT, ACOS OCO-2 and TCCON projects. We also thank NOAA ESRL Boulder, CO, USA for providing CarbonTracker CT2019B dataset free of charge. Finally, we appreciate the editor and anonymous reviewers for their valuable comments to improve this manuscript.

Conflicts of Interest

The authors declare that they have no known competing financial interest or personal relationships that could have appeared to influence the work reported in this paper.

References

  1. IPCC. Climate Change 2013: The Physical Science Basis. Contribution of Working Group I to the Fifth Assessment Report of the Intergovernmental Panel on Climate Change; Cambridge University Press: Cambridge, UK; New York, NY, USA, 2013. [Google Scholar]
  2. Lei, L.P.; Guan, X.H.; Zeng, Z.C.; Zhang, B.; Fei, R.U.; Ran, B.U. A comparison of atmospheric CO2 concentration GOSAT-based observations and model simulations. Sci. China Earth Sci. 2014, 57, 1393–1402. [Google Scholar] [CrossRef]
  3. Wunch, D.; Wennberg, P.O.; Osterman, G.; Fisher, B.; Naylor, B.; Roehl, C.M.; O’Dell, C.; Mandrake, L.; Viatte, C.; Kiel, M.; et al. Comparisons of the Orbiting Carbon Observatory-2 (OCO-2) XCO2 measurements with TCCON. Atmos. Meas. Tech. 2017, 10, 2209–2238. [Google Scholar] [CrossRef] [Green Version]
  4. Buchwitz, M.; Reuter, M.; Schneising, O.; Boesch, H.; Guerlet, S.; Dils, B.; Aben, I.; Armante, R.; Bergamaschi, P.; Blumenstock, T.; et al. The Greenhouse Gas Climate Change Initiative (GHG-CCI): Comparison and quality assessment of near-surface-sensitive satellite-derived CO2 and CH4 global data sets. Remote Sens. Environ. 2015, 162, 344–362. [Google Scholar] [CrossRef] [Green Version]
  5. Bovensmann, H.; Burrows, J.P.; Buchwitz, M.; Frerick, J.; Noel, S.; Rozanov, V.V.; Chance, K.V.; Goede, A. SCIAMACHY: Mission Objectives and Measurement Modes. J. Atmos. Sci. 1999, 56, 125–150. [Google Scholar] [CrossRef]
  6. Kuze, A.; Suto, H.; Nakajima, M.; Hamazaki, T. Thermal and near infrared sensor for carbon observation Fourier-transform spectrometer on the Greenhouse Gases Observing Satellite for greenhouse gases monitoring. Appl. Opt. 2009, 48, 6716–6733. [Google Scholar] [CrossRef]
  7. Crisp, D.; Fisher, B.M.; O’Dell, C.; Frankenberg, C.; Basilio, R.; Bösch, H.; Brown, L.R.; Castano, R.; Connor, B.; Deutscher, N.M.; et al. The ACOS CO2 retrieval algorithm-Part II: Global XCO2 data characterization. Atmos. Meas. Tech. 2012, 5, 687–707. [Google Scholar] [CrossRef] [Green Version]
  8. Liu, Y.; Cai, Z.; Yang, D.; Zheng, Y.; Duan, M.; Lü, D. Effects of spectral sampling rate and range of CO2 absorption bands on XCO2 retrieval from TanSat hyperspectral spectrometer. Chin. Sci. Bull. 2014, 59, 1485–1491. [Google Scholar] [CrossRef]
  9. Zeng, N.; Fang, Z.; Collatz, G.J.; Kalnay, E.; Salawitch, R.J.; West, T.O.; Guanter, L. Agricultural Green Revolution as a driver of increasing atmospheric CO2 seasonal amplitude. Nature 2014, 515, 394–410. [Google Scholar] [CrossRef] [PubMed]
  10. Deng, F.; Jones, D.B.A.; Henze, D.K.; Bousserez, N.; Bowman, K.W.; Fisher, J.B.; Nassar, R.; O’Dell, C.; Wunch, D.; Wennberg, P.O.; et al. Inferring regional sources and sinks of atmospheric CO2 from GOSAT XCO2 data. Atmos. Chem. Phys. 2014, 14, 3703–3727. [Google Scholar] [CrossRef] [Green Version]
  11. Sheng, M.; Lei, L.; Zeng, Z.-C.; Rao, W.; Zhang, S. Detecting the responses of CO2 column abundances to anthropogenic emissions from satellite observations of GOSAT and OCO-2. Remote Sens. 2021, 13, 3524. [Google Scholar] [CrossRef]
  12. Zhang, Y.; Liu, X.; Lei, L.; Liu, L. Estimating global anthropogenic CO2 gridded emissions using a data-driven stacked random forest regression model. Remote Sens. 2022, 14, 3899. [Google Scholar] [CrossRef]
  13. Mustafa, F.; Bu, L.; Wang, Q.; Yao, N.; Shahzaman, M.; Bilal, M.; Aslam, R.W.; Iqbal, R. Neural-network-based estimation of regional-scale anthropogenic CO2 emissions using an Orbiting Carbon Observatory-2 (OCO-2) dataset over East and West Asia. Atmos. Meas. Tech. 2021, 14, 7277–7290. [Google Scholar] [CrossRef]
  14. Kulawik, S.; Wunch, D.; O’Dell, C.; Frankenberg, C.; Reuter, M.; Oda, T.; Chevallier, F.; Sherlock, V.; Buchwitz, M.; Osterman, G.; et al. Consistent evaluation of ACOS-GOSAT, BESD-SCIAMACHY, CarbonTracker, and MACC through comparisons to TCCON. Atmos. Meas. Tech. 2016, 9, 683–709. [Google Scholar] [CrossRef] [Green Version]
  15. Jung, Y.; Kim, J.; Kim, W.; Boesch, H.; Lee, H.; Cho, C.; Goo, T.-Y. Impact of Aerosol Property on the Accuracy of a CO2 Retrieval Algorithm from Satellite Remote Sensing. Remote Sens. 2016, 8, 322. [Google Scholar] [CrossRef] [Green Version]
  16. O’Dell, C.W.; Connor, B.; Boesch, H.; O’Brien, D.; Wunch, D. The ACOS CO2 retrieval algorithm-Part 1: Description and validation against synthetic observations. Atmos. Meas. Tech. 2012, 5, 99–121. [Google Scholar] [CrossRef] [Green Version]
  17. Liang, A.; Gong, W.; Ge, H.; Xiang, C. Comparison of satellite-observed XCO2 from GOSAT, OCO-2, and ground-Based TCCON. Remote Sens. 2017, 9, 1033. [Google Scholar] [CrossRef] [Green Version]
  18. Wu, L.; Brugh, J.; Meijer, Y.; Sierk, B.; Hasekamp, O.; Butz, A.; Landgraf, J. XCO2 observations using satellite measurements with moderate spectral resolution: Investigation using GOSAT and OCO-2 measurements. Atmos. Meas. Tech. 2020, 13, 713–729. [Google Scholar] [CrossRef] [Green Version]
  19. Han, G.; Xu, H.; Gong, W.; Liu, J.; Du, J.; Ma, X.; Liang, A. Feasibility Study on Measuring Atmospheric CO2 in Urban Areas Using Spaceborne CO2-IPDA LIDAR. Remote Sens. 2018, 10, 985. [Google Scholar] [CrossRef] [Green Version]
  20. Bie, N.; Lei, L.; Zeng, Z.C.; Cai, B.; Yang, S.; He, Z.; Wu, C.; Nassar, R. Regional uncertainty of GOSAT XCO2 retrievals in China: Quantification and attribution. Atmos. Meas. Tech. 2017, 11, 1251–1272. [Google Scholar] [CrossRef] [Green Version]
  21. O’Dell, C.W.; Eldering, A.; Wennberg, P.O.; Crisp, D.; Gunson, M.R.; Fisher, B.; Frankenberg, C.; Kiel, M.; Lindqvist, H.; Mandrake, L. Improved retrievals of carbon dioxide from Orbiting Carbon Observatory-2 with the version 8 ACOS algorithm. Atmos. Meas. Tech. 2018, 11, 6539–6576. [Google Scholar] [CrossRef]
  22. Mustafa, F.; Wang, H.; Bu, L.; Wang, Q.; Shahzaman, M.; Bilal, M.; Zhou, M.; Iqbal, R.; Aslam, R.W.; Ali, M.A.; et al. Validation of GOSAT and OCO-2 against in situ aircraft measurements and comparison with CarbonTracker and GEOS-Chem over Qinhuangdao, China. Remote Sens. 2021, 13, 899. [Google Scholar] [CrossRef]
  23. Wang, Q.; Mustafa, F.; Bu, L.; Zhu, S.; Liu, J.; Chen, W. Atmospheric carbon dioxide measurement from aircraft and comparison with OCO-2 and CarbonTracker model data. Atmos. Meas. Tech. 2021, 14, 6601–6617. [Google Scholar] [CrossRef]
  24. Zhang, H.; Chen, B.; Xu, G.; Yan, J.; Che, M.; Chen, J.; Fang, S.; Lin, X.; Sun, S. Comparing simulated atmospheric carbon dioxide concentration with GOSAT retrievals. Sci. Bull. 2015, 60, 380–386. [Google Scholar] [CrossRef]
  25. Maksyutov, S.; Takagi, H.; Valsala, V.K.; Saito, M.; Oda, T.; Saeki, T.; Belikov, D.A.; Saito, R.; Ito, A.; Yoshida, Y. Regional CO2 flux estimates for 2009–2010 based on GOSAT and ground-based CO2 observations. Atmos. Chem. Phys. 2013, 13, 9351–9373. [Google Scholar] [CrossRef] [Green Version]
  26. Ru, M.; Lu, N.; Yao, L.; Zhu, Y.; Wang, J.; Sun, J. Multi-year comparison of carbon dioxide from satellite data with ground-based FTS measurements (2003–2011). Remote Sens. 2013, 5, 3431–3456. [Google Scholar] [CrossRef] [Green Version]
  27. Yoshida, Y.; Kikuchi, N.; Morino, I.; Uchino, O.; Yokota, T. Improvement of the retrieval algorithm for GOSAT SWIR XCO2 and XCH4 and their validation using TCCON data. Atmos. Meas. Tech. 2013, 6, 1533–1547. [Google Scholar] [CrossRef]
  28. Zhang, L.L.; Yue, T.X.; Wilson, J.P.; Zhao, N.; Zhao, Y.P.; Du, Z.P.; Liu, Y. A comparison of satellite observations with the XCO2 surface obtained by fusing TCCON measurements and GEOS-Chem model outputs. Sci. Total Environ. 2017, 601–602, 1575–1590. [Google Scholar] [CrossRef]
  29. Schneising, O.; Buchwitz, M.; Reuter, M.; Heymann, J.; Bovensmann, H.; Burrows, J.P. Long-term analysis of carbon dioxide and methane column-averaged mole fractions retrieved from SCIAMACHY. Atmos. Chem. Phys. 2010, 11, 2863–2880. [Google Scholar] [CrossRef] [Green Version]
  30. Hong, X.; Zhang, P.; Bi, Y.; Liu, C.; Sun, Y.; Wang, W.; Chen, Z.; Yin, H.; Zhang, C.; Tian, Y.; et al. Retrieval of global carbon dioxide from TanSat satellite and comprehensive validation with TCCON measurements and satellite observations. IEEE Trans. Geosci. Remote Sens. 2022, 60, 4101716. [Google Scholar] [CrossRef]
  31. Karbasi, S.; Malakooti, H.; Rahnama, M.; Azadi, M. Study of mid-latitude retrieval XCO2 greenhouse gas: Validation of satellite-based shortwave infrared spectroscopy with ground-based TCCON observations. Sci. Total Environ. 2022, 836, 155513. [Google Scholar] [CrossRef]
  32. Kong, Y.; Chen, B.; Measho, S. Spatio-temporal consistency evaluation of XCO2 retrievals from GOSAT and OCO-2 based on TCCON and model data for joint utilization in carbon cycle research. Atmosphere 2019, 10, 354. [Google Scholar] [CrossRef] [Green Version]
  33. Yang, D.; Boesch, H.; Liu, Y.; Somkuti, P.; Cai, Z.; Chen, X.; Noia, A.D.; Lin, C.; Lu, N.; Lyu, D.; et al. Toward high precision XCO2 retrievals from TanSat observations: Retrieval improvement and validation against TCCON measurements. J. Geophys. Res. Atmos. 2020, 125, e2020JD032794. [Google Scholar] [CrossRef]
  34. Houweling, S.; Baker, D.; Basu, S.; Boesch, H.; Butz, A.; Chevallier, F.; Deng, F.; Dlugokencky, E.J.; Feng, L.; Ganshin, A. An intercomparison of inverse models for estimating sources and sinks of CO2 using GOSAT measurements. J. Geophys. Res. Atmos. 2015, 120, 5253–5266. [Google Scholar] [CrossRef] [Green Version]
  35. Stoffelen, A. Toward the true near-surface wind speed: Error modeling and calibration using triple collocation. J. Geophys. Res. Oceans 1998, 103, 7755–7766. [Google Scholar] [CrossRef]
  36. Draper, C.S.; Reichle, R.; de Jeu, R.; Naeimi, V.; Parinussa, R.; Wagner, W. Estimating root mean square errors in remotely sensed soil moisture over continental scale domains. Remote Sens. Environ. 2013, 137, 288–298. [Google Scholar] [CrossRef] [Green Version]
  37. Hain, C.R.; Crow, W.T.; Mecikalski, J.R.; Anderson, M.C.; Holmes, T. An intercomparison of available soil moisture estimates from thermal infrared and passive microwave remote sensing and land surface modeling. J. Geophys. Res. Atmos. 2011, 116, D15107. [Google Scholar] [CrossRef]
  38. Gruber, A.; Dorigo, W.A.; Crow, W.; Wagner, W. Triple collocation-based merging of satellite soil moisture retrievals. IEEE Trans. Geosci. Remote Sens. 2017, 55, 6780–6792. [Google Scholar] [CrossRef]
  39. Alemohammad, S.H.; Mccoll, K.A.; Konings, A.G.; Entekhabi, D.; Stoffelen, A. Characterization of precipitation product errors across the United States using multiplicative triple collocation. Hydrol. Earth Syst. Sci. 2015, 19, 3489–3503. [Google Scholar] [CrossRef] [Green Version]
  40. Hossain, F.; Anagnostou, E.N. A two-dimensional satellite rainfall error model. IEEE Trans. Geosci. Remote Sens. 2006, 44, 1511–1522. [Google Scholar] [CrossRef]
  41. Sun, J.; McColl, K.A.; Wang, Y.; Rigden, A.J.; Lu, H.; Yang, K.; Li, Y.; Jr, J.A.S. Global evaluation of terrestrial near-surface air temperature and specific humidity retrievals from the Atmospheric Infrared Sounder (AIRS). Remote Sens. Environ. 2021, 252, 112146. [Google Scholar] [CrossRef]
  42. Portabella, M.; Stoffelen, A. On scatterometer ocean stress. J. Atmos. Ocean. Technol. 2008, 26, 368–382. [Google Scholar] [CrossRef] [Green Version]
  43. Fang, H.; Jiang, C.; Li, W.; Wei, S.; Baret, F.; Chen, J.M.; Garcia-Haro, J.; Liang, S.; Liu, R.; Myneni, R.B.; et al. Characterization and intercomparison of global moderate resolution leaf area index (LAI) products: Analysis of climatologies and theoretical uncertainties. J. Geophys. Res. Biogeosci. 2013, 118, 529–548. [Google Scholar] [CrossRef] [Green Version]
  44. Fang, H.; Wei, S.; Jiang, C.; Scipal, K. Theoretical uncertainty analysis of global MODIS, CYCLOPES, and GLOBCARBON LAI products using a triple collocation method. Remote Sens. Environ. 2012, 124, 610–621. [Google Scholar] [CrossRef]
  45. Van, D.; Renzullo, L.J.; Wada, Y.; Tregoning, P. A global water cycle reanalysis (2003–2012) merging satellite gravimetry and altimetry observations with a hydrological multi-model ensemble. Hydrol. Earth Syst. Sci. 2014, 18, 2955–2973. [Google Scholar] [CrossRef] [Green Version]
  46. Wu, X.; Xiao, Q.; Wen, J.; You, D. Direct comparison and triple collocation: Which is more reliable in the validation of coarse-scale satellite surface albedo products. J. Geophys. Res. Atmos. 2019, 124, 5198–5213. [Google Scholar] [CrossRef]
  47. Mccoll, K.A.; Vogelzang, J.; Konings, A.G.; Entekhabi, D.; Piles, M.; Stoffelen, A. Extended triple collocation: Estimating errors and correlation coefficients with respect to an unknown target. Geophys. Res. Lett. 2014, 41, 6229–6236. [Google Scholar] [CrossRef] [Green Version]
  48. Chen, F.; Crow, W.T.; Bindlish, R.; Colliander, A.; Burgin, M.S.; Asanuma, J.; Aida, K. Global-scale evaluation of SMAP, SMOS and ASCAT soil moisture products using triple collocation. Remote Sens. Environ. 2018, 214, 1–13. [Google Scholar] [CrossRef]
  49. Yokota, T.; Yoshida, Y.; Eguchi, N.; Ota, Y.; Tanaka, T.; Watanabe, H.; Maksyutov, S. Global concentrations of CO2 and CH4 retrieved from GOSAT: First preliminary results. Sola 2009, 5, 160–163. [Google Scholar] [CrossRef] [Green Version]
  50. Yoshida, Y.; Ota, Y.; Eguchi, N.; Kikuchi, N.; Nobuta, K.; Tran, H.; Morino, I.; Yokota, T. Retrieval algorithm for CO2 and CH4 column abundances from short-wavelength infrared spectral observations by the Greenhouse Gases Observing Satellite. Atmos. Meas. Tech. 2011, 4, 717–734. [Google Scholar] [CrossRef] [Green Version]
  51. Cogan, A.J.; Boesch, H.; Parker, R.J.; Feng, L.; Palmer, P.I.; Blavier, J.-F.L.; Deutscher, N.M.; Macatangay, R.; Notholt, J.; Roehl, C.; et al. Atmospheric carbon dioxide retrieved from the Greenhouse gases Observing SATellite (GOSAT): Comparison with ground-based TCCON observations and GEOS-Chem model calculations. J. Geophys. Res. Atmos. 2012, 117, D21301. [Google Scholar] [CrossRef]
  52. Merrelli, A.; Bennartz, R.; O’Dell, C.W.; Taylor, T.E. Estimating bias in the OCO-2 retrieval algorithm caused by 3-D radiation scattering from unresolved boundary layer clouds. Atmos. Meas. Tech. 2014, 8, 1641–1656. [Google Scholar] [CrossRef] [Green Version]
  53. Wunch, D.; Wennberg, P.O.; Toon, G.C.; Connor, B.J.; Fisher, B.; Osterman, G.B.; Frankenberg, C.; Mandrake, L.; O’Dell, C.; Ahonen, P.; et al. A method for evaluating bias in global measurements of CO2 total columns from space. Atmos. Chem. Phys. 2011, 11, 12317–12337. [Google Scholar] [CrossRef] [Green Version]
  54. Jacobson, A.R.; Schuldt, K.N.; Miller, J.B.; Oda, T.; Tans, P.; Andrews, A.; Mund, J.; Ott, L.; Collatz, G.J.; Aalto, T.; et al. CarbonTracker CT 2019B. 2020. Available online: https://doi.org/10.25925/20201008 (accessed on 4 November 2022). [CrossRef]
  55. Reuter, M.; Bovensmann, H.; Buchwitz, M.; Burrows, J.P.; Connor, B.J.; Deutscher, N.M.; Griffith, D.; Heymann, J.; Keppel-Aleks, G.; Messerschmidt, J.; et al. Retrieval of atmospheric CO2 with enhanced accuracy and precision from SCIAMACHY: Validation with FTS measurements and comparison with model results. J. Geophys. Res. Atmos. 2011, 116, D04301. [Google Scholar] [CrossRef] [Green Version]
  56. Connor, B.J.; Boesch, H.; Toon, G.; Sen, B.; Miller, C.; Crisp, D. Orbiting Carbon Observatory: Inverse method and prospective error analysis. J. Geophys. Res. Atmos. 2008, 113, D05305. [Google Scholar] [CrossRef]
  57. Wunch, D.; Toon, G.C.; Blavier, J.; Washenfelder, R.A.; Notholt, J.; Connor, B.J.; Griffith, D.W.; Sherlock, V.; Wennberg, P.O. The Total Carbon Column Observing Network. Philos. Trans. R. Soc. A 2011, 369, 2087–2112. [Google Scholar] [CrossRef] [PubMed] [Green Version]
  58. Wunch, D.; Toon, G.C.; Sherlock, V.; Deutscher, N.M.; Liu, C.; Feist, D.G.; Wennberg, P.O. The Total Carbon Column Observing Network’s GGG2014 Data Version; CaltechDATA, TCCON Teams: Pasadena, CA, USA, 2015. [Google Scholar] [CrossRef]
  59. Chevallier, F.; Engelen, R.J.; Peylin, P. The contribution of AIRS data to the estimation of CO2 sources and sinks. Geophys. Res. Lett. 2005, 32, L23801. [Google Scholar] [CrossRef] [Green Version]
  60. Gruber, A.; Su, C.-H.; Zwieback, S.; Crow, W.; Dorigo, W.; Wagner, W. Recent advances in (soil moisture) triple collocation analysis. Int. J. Appl. Earth Obs. Geoinf. 2016, 45, 200–211. [Google Scholar] [CrossRef]
  61. Bovensmann, H.; Buchwitz, M.; Burrows, J.P.; Reuter, M.; Krings, T.; Gerilowski, K.; Schneising, O.; Heymann, J.; Tretner, A.; Erzinger, J. A remote sensing technique for global monitoring of power plant CO2 emissions from space and related applications. Atmos. Meas. Tech. 2010, 3, 781–811. [Google Scholar] [CrossRef]
  62. Chen, F.; Crow, W.T.; Colliander, A.; Cosh, M.H.; Jackson, T.J.; Bindlish, R.; Reichle, R.H.; Chan, S.K.; Bosch, D.D.; Starks, P.J.; et al. Application of triple collocation in ground-based validation of soil moisture active/passive (SMAP) level 2 data products. IEEE J. Sel. Top. Appl. Earth Obs. Remote Sens. 2017, 10, 489–502. [Google Scholar] [CrossRef]
  63. Tilmaz, M.T.; Crow, W.T. Evaluation of assumptions in soil moisture triple collocation analysis. J. Hydrometeorol. 2014, 15, 1293–1302. [Google Scholar] [CrossRef]
  64. Babenhauserheide, A.; Basu, S.; Houweling, S.; Peters, W.; Butz, A. Comparing the CarbonTracker and TM5-4DVar data assimilation systems for CO2 surface flux inversions. Atmos. Chem. Phys. 2015, 15, 9747–9763. [Google Scholar] [CrossRef] [Green Version]
  65. Jiang, F.; Ju, W.; He, W.; Wu, M.; Wang, H.; Wang, J.; Jia, M.; Feng, S.; Zhang, L.; Chen, J.M. A 10-year global monthly averaged terrestrial net ecosystem exchange dataset inferred from the ACOS GOSAT v9 XCO2 retrievals (GCAS2021). Earth Syst. Sci. Data 2022, 14, 3013–3037. [Google Scholar] [CrossRef]
  66. Miralles, D.G.; Crow, W.T.; Cosh, M.H. Estimating spatial sampling errors in coarse-scale soil moisture estimates derived from point-scale observations. J. Hydrometeorol. 2010, 11, 1423–1429. [Google Scholar] [CrossRef]
  67. Pérez, I.A.; García, M.Á.; Sánchez, M.L.; Pardo, N. Trend analysis and outlier distribution of CO2 and CH4: A case study at a rural site in northern Spain. Sci. Total Environ. 2022, 819, 153129. [Google Scholar] [CrossRef] [PubMed]
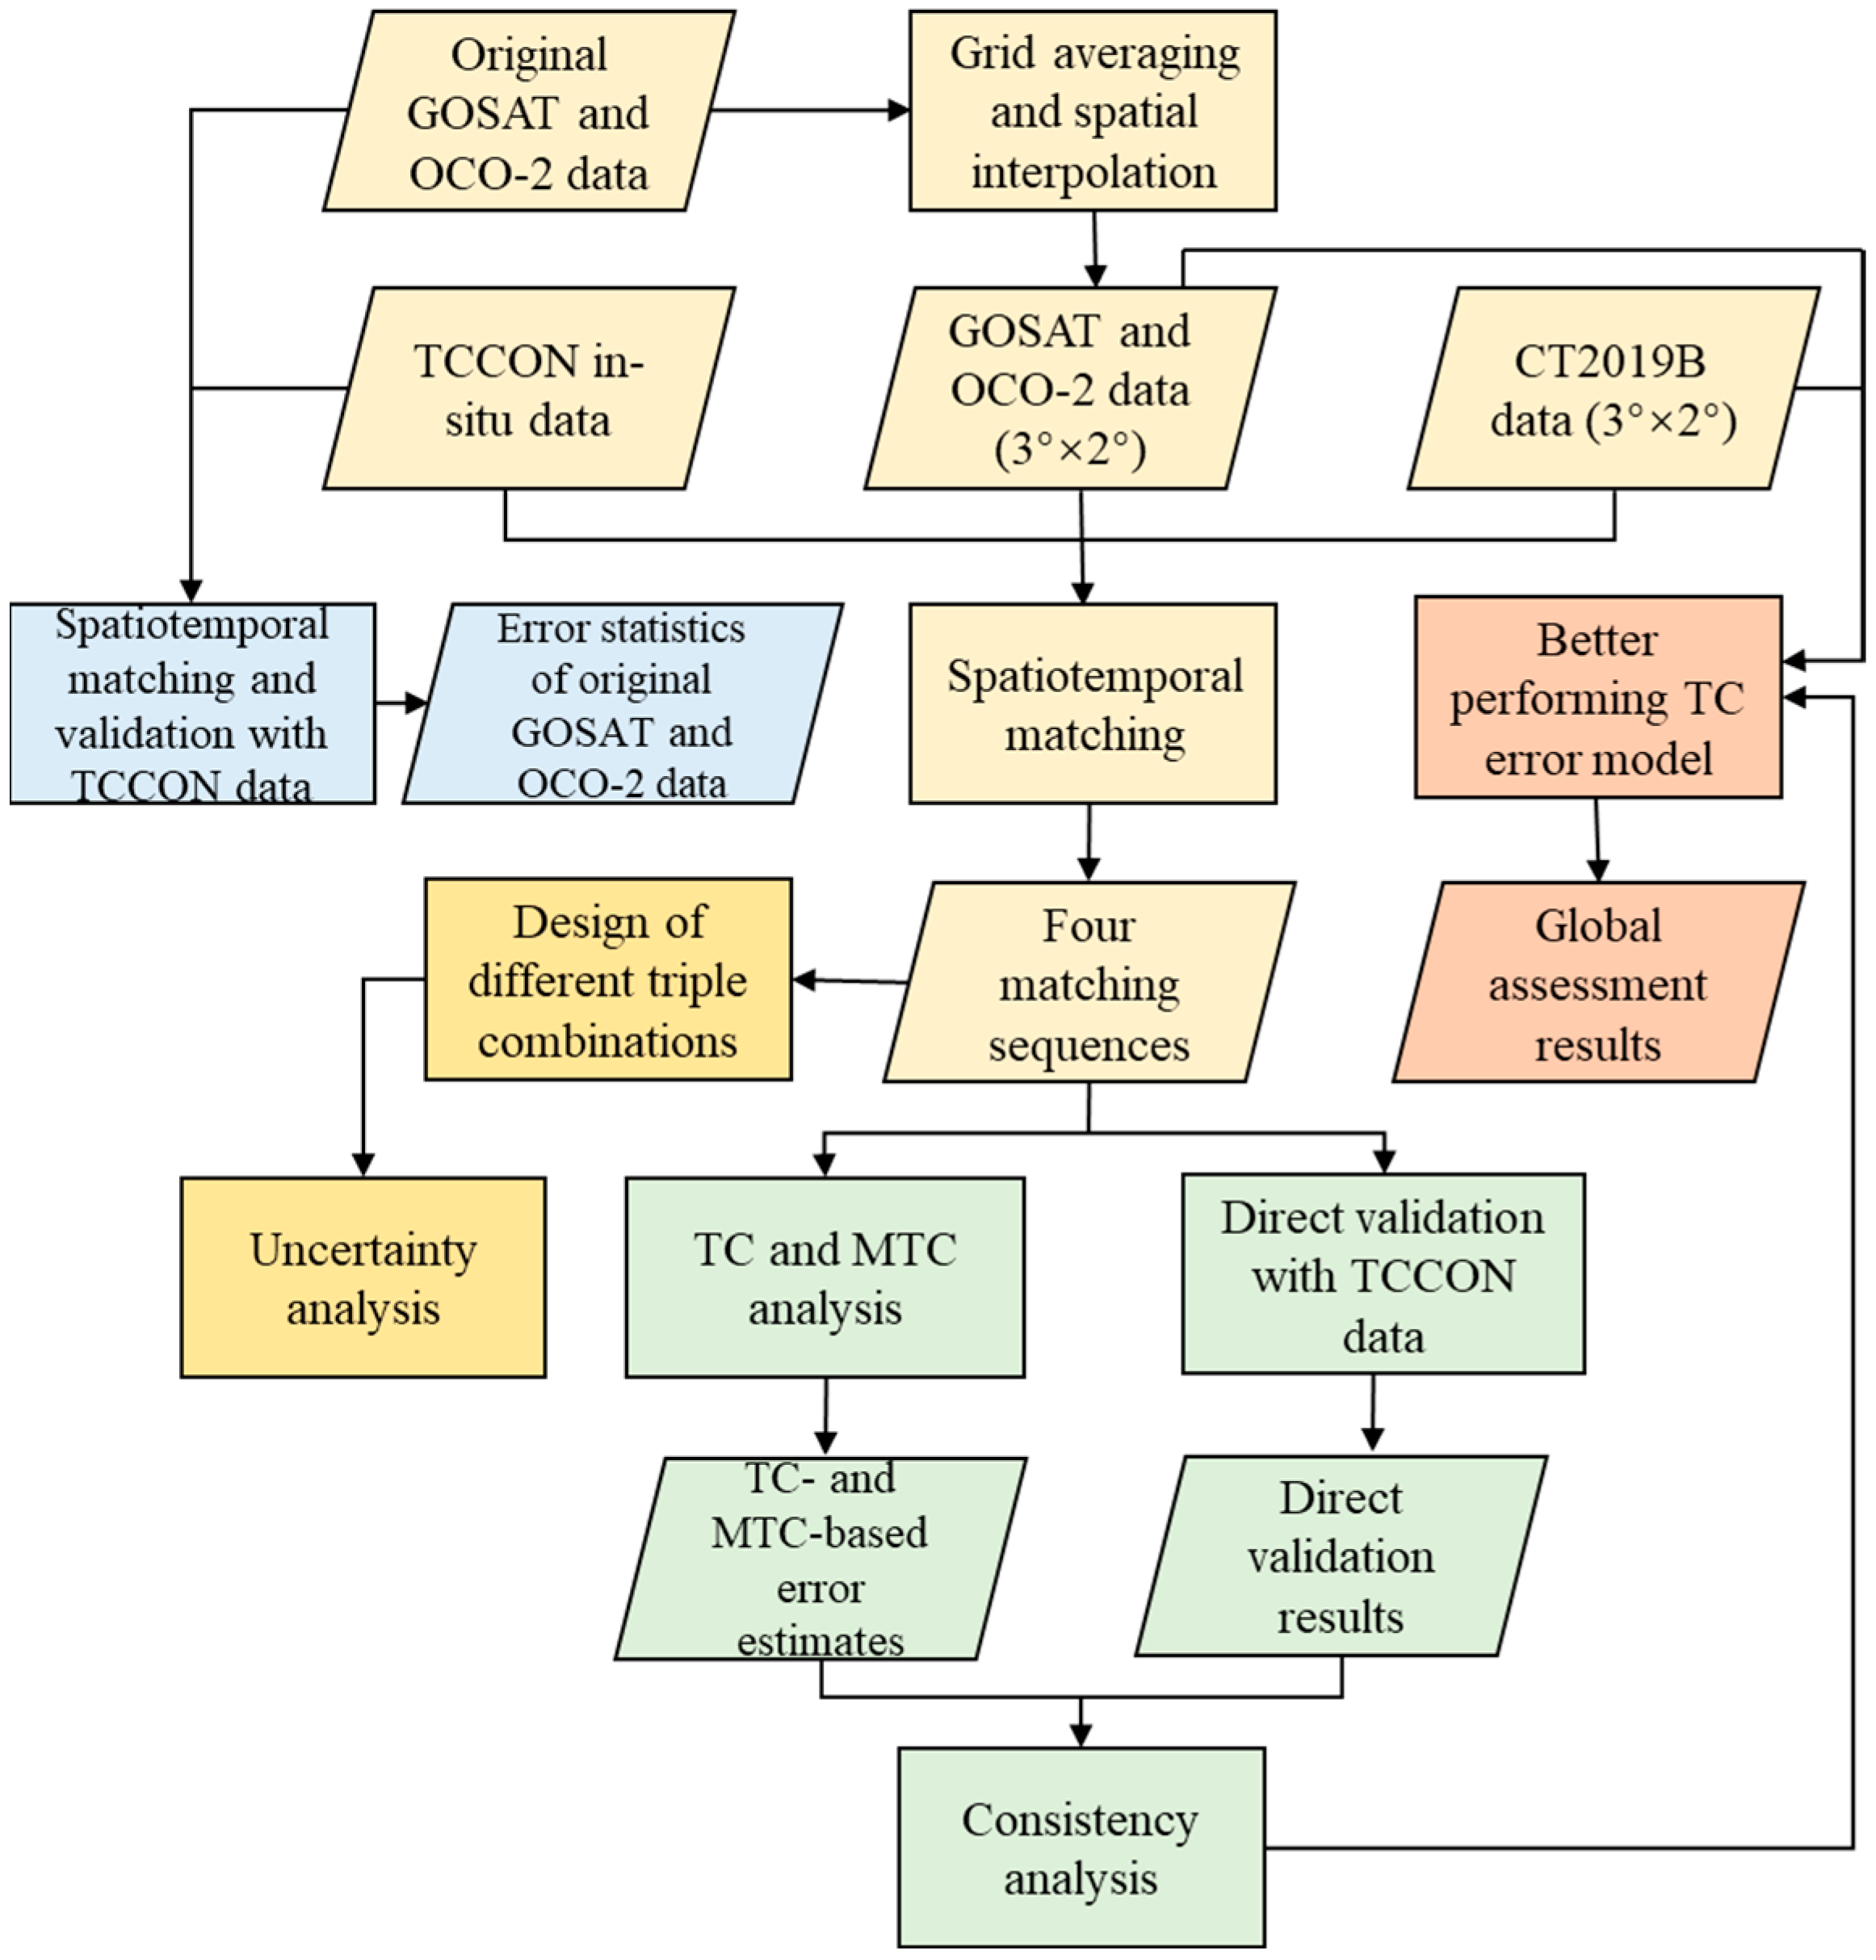
Figure 1. The flow chart of the assessment of XCO2 datasets via direct comparison and triple collocation method.
Remotesensing 14 05635 g001
Figure 2. Comparisons of GOSAT (ac) and OCO-2 (df) with TCCON data using different spatio-temporal matching criteria, respectively. All scatter plots use the ±30 min time matching criteria, and the (a,d) left, (b,e) middle and (c,f) right scatter plots use the ±1°, ±2° and ±3° spatial matching criteria, respectively. The black dotted line is the 1:1 line, and the red solid one is the linear fitting line.
Remotesensing 14 05635 g002
Figure 3. Comparisons of filtered GOSAT (ac) and OCO-2 (df) with TCCON data under different spatio-temporal matching criteria, respectively. The GOSAT and OCO-2 XCO2 data are filtered using quality flag 0. All scatter plots use the ±30 min time matching criteria, and the (a,d) left, (b,e) middle and (c,f) right scatter plots use the ±1°, ±2° and ±3° spatial matching criteria, respectively. The black dotted line is the 1:1 line, and the red solid one is the linear fitting line.
Remotesensing 14 05635 g003
Figure 4. Comparisons of the interpolated (a) GOSAT, (b) OCO-2 and (c) CT2019B with TCCON data. The same ±30 min time matching criteria are used and the collocation closest to the site is retrieved. The black dotted line is the 1:1 line, and the red solid one is the linear fitting line.
Remotesensing 14 05635 g004
Figure 5. Global distributions of the average XCO2 mole fractions of (a) GOSAT, (b) OCO-2 and (c) CT2019B. The average XCO2 mole fractions of GOSAT and OCO-2 are calculated from the interpolated data.
Remotesensing 14 05635 g005
Figure 6. Spatial distributions of RMSE (left column) and CC (right column) of GOSAT, OCO-2 and CT2019B XCO2 datasets with TC analysis.
Remotesensing 14 05635 g006
Figure 7. Comparison of the TC-estimated RMSE and CC values between GOSAT, OCO-2 and CT2019B. For each pixel, the best-performing data with the lowest RMSE or the highest CC values are shown.
Remotesensing 14 05635 g007
Figure 8. Standard deviation of RMSE (RSTD) and CC (CSTD) estimates of the XCO2 mole fractions for GOSAT, OCO-2 and CT2019B datasets. The results are derived using 1000 bootstrap simulations.
Remotesensing 14 05635 g008
Figure 9. Comparison of the RMSE of (ac) GOSAT, (df) OCO-2 and (gi) TC2019B obtained from TC analyses using four different triplets. The black line is the 1:1 line, and the black dotted line is the linear fitting.
Remotesensing 14 05635 g009
Figure 10. Comparison of the correction coefficients (CC) of (ac) GOSAT, (df) OCO-2 and (gi) TC2019B obtained from TC analyses using four different triplets. The black line is the 1:1 line, and the black dotted line is the linear fitting.
Remotesensing 14 05635 g010
Table 1. Summary of the three XCO2 products derived from GOSAT, OCO-2 satellites and CarbonTracker model.
Satellite DatasetsRevisit
Cycle (d)
Transit Time (LST)Footprint (km) Time Coverage
GOSAT ACOS-L2_Lite_FP.9r313:0010.5 km × 10.5 kmApril 2009–December 2019
OCO-2 ACOS-L2_Lite_FP.10r1613.362.25 km × 1.25 kmSeptember 2014–present
Model datasetTemporal resolutionSimulated time (LST)Spatial resolution (lon. × lat.)Time Coverage
CT2019B.xCO2_1330 (LST)daily13:303° × 2°June 2000–March 2019
Table 2. TCCON sites used in the comparison.
Site IDLongitudeLatitudeLocationStart DateEnd Date
AE−14.33 −7.92 Ascension Island, Saint Helena, Ascension and Tristan da Cunha22 May 201231 October 2018
AN126.33 36.54 Anmyeondo, South Korea2 February 201518 April 2018
BI23.02 53.23 Bialystok, Poland1 March 20091 October 2018
BR8.85 53.10 Bremen, Germany22 January 201030 July 2020
BU120.65 18.53 Burgos, Ilocos Norte, Philippines3 March 201731 March 2020
CI−118.13 34.14 California Institute of Technology, Pasadena, California, USA20 September 201229 December 2020
DB130.89 −12.43 Darwin, Australia28 August 200530 April 2020
DF−117.88 34.96 Armstrong Flight Research Center, Edwards, CA, USA20 July 201331 December 2020
ET−104.99 54.36 East Trout Lake, Canada7 October 20166 September 2020
EU−86.42 80.05 Eureka, Canada24 July 20106 July 2020
GM11.06 47.48 Garmisch, Germany16 July 200730 July 2020
HF117.17 31.90 Hefei, China18 September 201531 December 2016
IZ−16.48 28.30 Izana, Tenerife, Spain18 May 200726 February 2021
JF−118.18 34.20 Jet Propulsion Laboratory, Pasadena, California, USA19 May 201114 May 2018
JS130.29 33.24 Saga, Japan28 July 201129 December 2020
KA8.44 49.10 Karlsruhe, Germany19 April 201030 November 2020
LL169.68 −45.04 Lauder, New Zealand, 125HR2 February 201031 October 2018
LR169.68 −45.04 Lauder, New Zealand, 125HR3 October 201831 December 2020
MA−60.60 −3.21 Manaus, Brazil1 October 201424 June 2015
OC−97.49 36.60 Lamont, Oklahoma, USA6 July 200828 December 2020
OR2.11 47.97 Orleans, France29 August 200930 July 2020
PA−90.27 45.94 Park Falls, Wisconsin, USA2 June 200429 December 2020
PR2.36 48.85 Paris, France23 September 201422 June 2020
RA55.49 −20.90 Reunion Island (Ile de La Reunion), France16 September 201118 July 2020
RJ143.77 43.46 Rikubetsu, Hokkaido, Japan16 November 201330 September 2019
SO26.63 67.37 Sodankyla, Finland16 May 200920 October 2020
SP11.92 78.92 Ny Alesund, Spitzbergen, Norway6 April 201415 September 2019
TK140.12 36.05 Tsukuba, Ibaraki, Japan, 125HR4 August 201130 September 2019
WG150.88 −34.41 Wollongong, Australia26 June 200830 June 2020
ZS10.98 47.42 Zugspitze, Germany24 April 201520 July 2020
Table 3. Comparisons of the validation results between TC, MTC and the traditional direct evaluation. A V G D , A V G T C , A V G M T C are the average values of the validation results of all sites using the traditional direct evaluation, TC and MTC methods, respectively. C C D _ v s _ T C and C C D _ v s _ M T C are the correlation coefficients between the results of traditional direct validation method and the validation results of TC and MTC, respectively.
StatisticsRMSECC
GOSATOCO-2CT2019BGOSATOCO-2CT2019B
A V G D 1.60031.34261.02900.91700.94330.9682
A V G T C 1.14310.82990.68390.94040.96810.9810
A V G M T C 1.14370.83070.68790.94050.96800.9809
C C D _ v s _ T C 0.81370.70010.49020.95380.87180.8115
C C D _ v s _ M T C 0.80790.69800.49040.95370.86930.8061
Publisher’s Note: MDPI stays neutral with regard to jurisdictional claims in published maps and institutional affiliations.