Article

Impacts of FY-4A Atmospheric Motion Vectors on the Henan 7.20 Rainstorm Forecast in 2021

1
Institute of Urban Meteorology, China Meteorological Administration, Beijing 100089, China
2
National Space Science Center, Chinese Academy of Sciences, Beijing 100190, China
3
China Meteorological Administration (CMA) Earth System Modeling and Prediction Centre (CEMC), Beijing 100081, China
4
State Key Laboratory of Severe Weather, Beijing 100081, China
*
Author to whom correspondence should be addressed.
Remote Sens. 2022, 14(22), 5637; https://doi.org/10.3390/rs14225637
Submission received: 16 September 2022 / Revised: 3 November 2022 / Accepted: 3 November 2022 / Published: 8 November 2022

Abstract

:
Atmospheric motion vectors (AMVs) derived from images of the geostationary satellite, Fengyun-4A (FY-4A), can provide high-spatiotemporal-resolution wind observations in the atmospheric middle and upper levels. To explore the potential benefits of these data for the numerical forecasting of severe weather events, the characteristics of FY-4A AMVs in different channels were analyzed and three groups of assimilation experiments were conducted in this study. The impacts of FY-4A AMVs on the forecasts of the rainstorm that occurred in Henan province in China on 20 July 2021, were investigated based on the Weather Research and Forecasting (WRF) model. The results show that FY-4A AMVs with a higher quality indicator (QI) exhibited a lower error characteristic at the cost of a reduced sample size. The assimilation of FY-4A AMVs reduced the error of the upper-level wind fields in 24 h forecasts. A positive impact could also be obtained for 10 m wind in 24 h forecasts, with an improvement of up to 9.74% for the mean bias and 3.0% for the root-mean-square error due to the inclusion of FY-4A AMVs with a QI > 70. Assimilating the AMVs with a QI > 80, there was an overall positive impact on the CSI score skills of 6 h accumulated precipitation above 1.0 mm in the 24 h forecast. A significant improvement could be found in the forecasting of heavy rainfall above 25.0 mm after 6 h of the forecast. The spatial distribution of the 24 h accumulated heavy rainfall zone was closer to the observations with the assimilation of the FY-4A AMVs. The adjustment of the initial wind fields resulting from the FY-4A AMVs brought a clear benefit to the quantitative precipitation forecasting skills in the event of the Henan 7.20 rainstorm; however, the AMV data assimilation still had difficulty in capturing the hourly maximum rainfall and intensity well.

Graphical Abstract

1. Introduction

Access to information on wind fields is important to correctly represent the divergent component of the flow in numerical weather prediction (NWP) models. Atmospheric motion vectors (AMVs), also known as wind vectors, are generated from consecutive satellite images by tracking the movement of clouds or water vapor gradients [1,2,3,4,5]. They mainly provide wind information on the middle and upper troposphere, constituting valuable complementary data to conventional observations in time and space. AMV data have been used widely in operational NWP systems to improve the initial wind fields since the 1990s [6,7,8,9,10].
On the one hand, various studies have demonstrated that assimilating AMV data could reduce wind errors and have a positive impact on the analyses and forecasts in global and regional models [11,12,13,14,15]. Tomassini et al. [16] showed that AMVs from water vapor and visible channels consistently improved the first-guess wind field of the European Centre for Medium-Range Weather Forecasts (ECMWF) system in the Tropics and Southern Hemisphere. Langland et al. [17] noted that satellite-derived AMV data had a more positive impact on the forecast of the Navy Operational Global Atmospheric Prediction System (NOGAPS) in comparison with the dropsonde data. Joo et al. [18] indicated that a strong beneficial impact could be obtained from the Meteosat AMVs in the Met Office system. William et al. [19] pointed out that high-density AMVs contributed to the improvement of the forecast variables in the National Centers for Environmental Prediction (NCEP) Hurricane Weather Research and Forecasting Model (HWRF). Zhao et al. [20] concluded that GOES-16 AMVs could enable a better simulation of the boundaries leading to an improved subsequent forecast for storm evolution in the National Severe Storms Laboratory (NSSL) system, although it was still difficult to capture the sharp moisture gradient. Gelaro et al. [21] compared the impact of AMV data on the forecast accuracy of three global NWP systems, and suggested that the benefit of AMVs was quite different depending on the model and the quality of the AMVs.
On the other hand, it is still difficult to assimilate AMV data in NWP models due to their complicated errors [22,23,24]. AMV data are typically treated as single-level observations retrieved from satellite radiances which measure the signals from a finite layer of the atmosphere rather than a specific level [25]. Various errors can be introduced in the reversion process, such as cloud-tracking errors, height errors, and spatially and temporally correlated errors [24,26]. Among the sources of error in AMV data, the vector height assignment is thought to be the most crucial and challenging issue. Velden et al. [27] pointed out that height errors contributed up to 70% of the total errors in AMV data; however, much work has been performed to improve the quality of satellite-derived AMV data. For the appropriate spectral radiance measurements, several different approaches were developed to assign the height of AMVs [28,29], such as the carbon dioxide (CO2) slicing technique, as well as the infrared window (IRW) and the water vapor (H2O) intercept techniques. Nieman et al. [1] compared these different height assignment techniques of AMVs, and the result suggested that CO2 and H2O techniques could provide good agreement with radiosonde wind observations. Rao et al. [30] dealt with the height errors of AMVs through spreading the information across multiple levels, while Yang et al. [31] developed a method of height reassignment and obtained an obvious improvement with 58.7% and 25% for the AMVs derived from the infrared and water vapor channels of the FY-2C satellite, respectively. Holmlund [32] exploited a quality indicator (QI) to describe the quality of the derived AMVs and verified its effectiveness against radiosonde measurements and an ECMWF analysis. Rohn et al. [33] indicated that the use of the QI in Meteosat AMVs products provided a considerable benefit to the medium-range forecast at ECMWF. Currently, the QIs have been disseminated and used widely together with AMV data to provide guidance for quality control.
Due to their high spatiotemporal resolution, the AMVs derived from new-generation geostationary satellites are becoming more helpful for capturing small-scale features of the flow in the forecast of short-term severe weather over a specific region [15]. Bedka et al. [10] indicated that GOES satellite-derived AMVs contained a detailed flow structure consistent with localized mesoscale flow patterns. Enhanced AMVs from GOES-16 can provide high-spatiotemporal-resolution sampling and improve the track and size forecast of North Atlantic tropical cyclones [34]. High-density AMV products from the Himawari-8 satellite have been used to provide an improved forecast for extreme weather over the Asian and Australasian region [35]. EUMETSAT plans to launch the third generation of geostationary satellites between 2022 and 2024, on which the new instruments are expected to provide AMV production for severe weather forecasting over Europe and Africa [36]. FY-4A is the new-generation geostationary meteorological satellite of China, and the AMVs retrieved from the Advanced Geosynchronous Radiation Imager (AGRI) aboard the satellite of FY-4A provide an opportunity for better presenting the high-level atmospheric flow over the Asia area [37,38]. Wan et al. [39] assessed the quality and impact of FY-4A AMVs based on GRAPES_RAFS, and the results showed that the assimilation of FY-4A AMV data improved the performance of the rainfall forecast due to an improvement in the initial fields of the model.
The focus of this work is to analyze the characteristics of AMVs derived from the FY-4A satellite and evaluate the impact of assimilating FY-4A AMV data on the forecasting of the extreme rainstorm event that occurred in Henan province in China. This rainstorm mainly occurred on 18–21 July 2021. It caused serious economic loss and widespread death. A subtropical high, the westward movement of Typhoon In-Fa and abundant water vapor were brought together [40], leading to an extreme rainstorm over the region of Zhengzhou city. The 24 h accumulated precipitation on 20 July reached 624 mm, which was more than the total precipitation in 2019 over this area. The maximum hourly rainfall appeared between 08 and 09 UTC on 20 July, with the accumulated rainfall reaching 201.9 mm. Due to all of these features, it was difficult to forecast this extreme rainfall event in the NWP model. In this study, FY-4A AMV data are used to improve the forecasting of the Henan 7.20 rainstorm, and the impacts of these data are investigated based on a regional model. In the following, configurations of the regional model, FY-4A AMV data and verification strategies are introduced in Section 2. In Section 3, the characteristics of the FY-4A AMV data are first analyzed based on re-analysis data, and then the results from the assimilation experiments are investigated. The discussion and conclusion are given in Section 4 and Section 5, respectively.

2. Materials and Methods

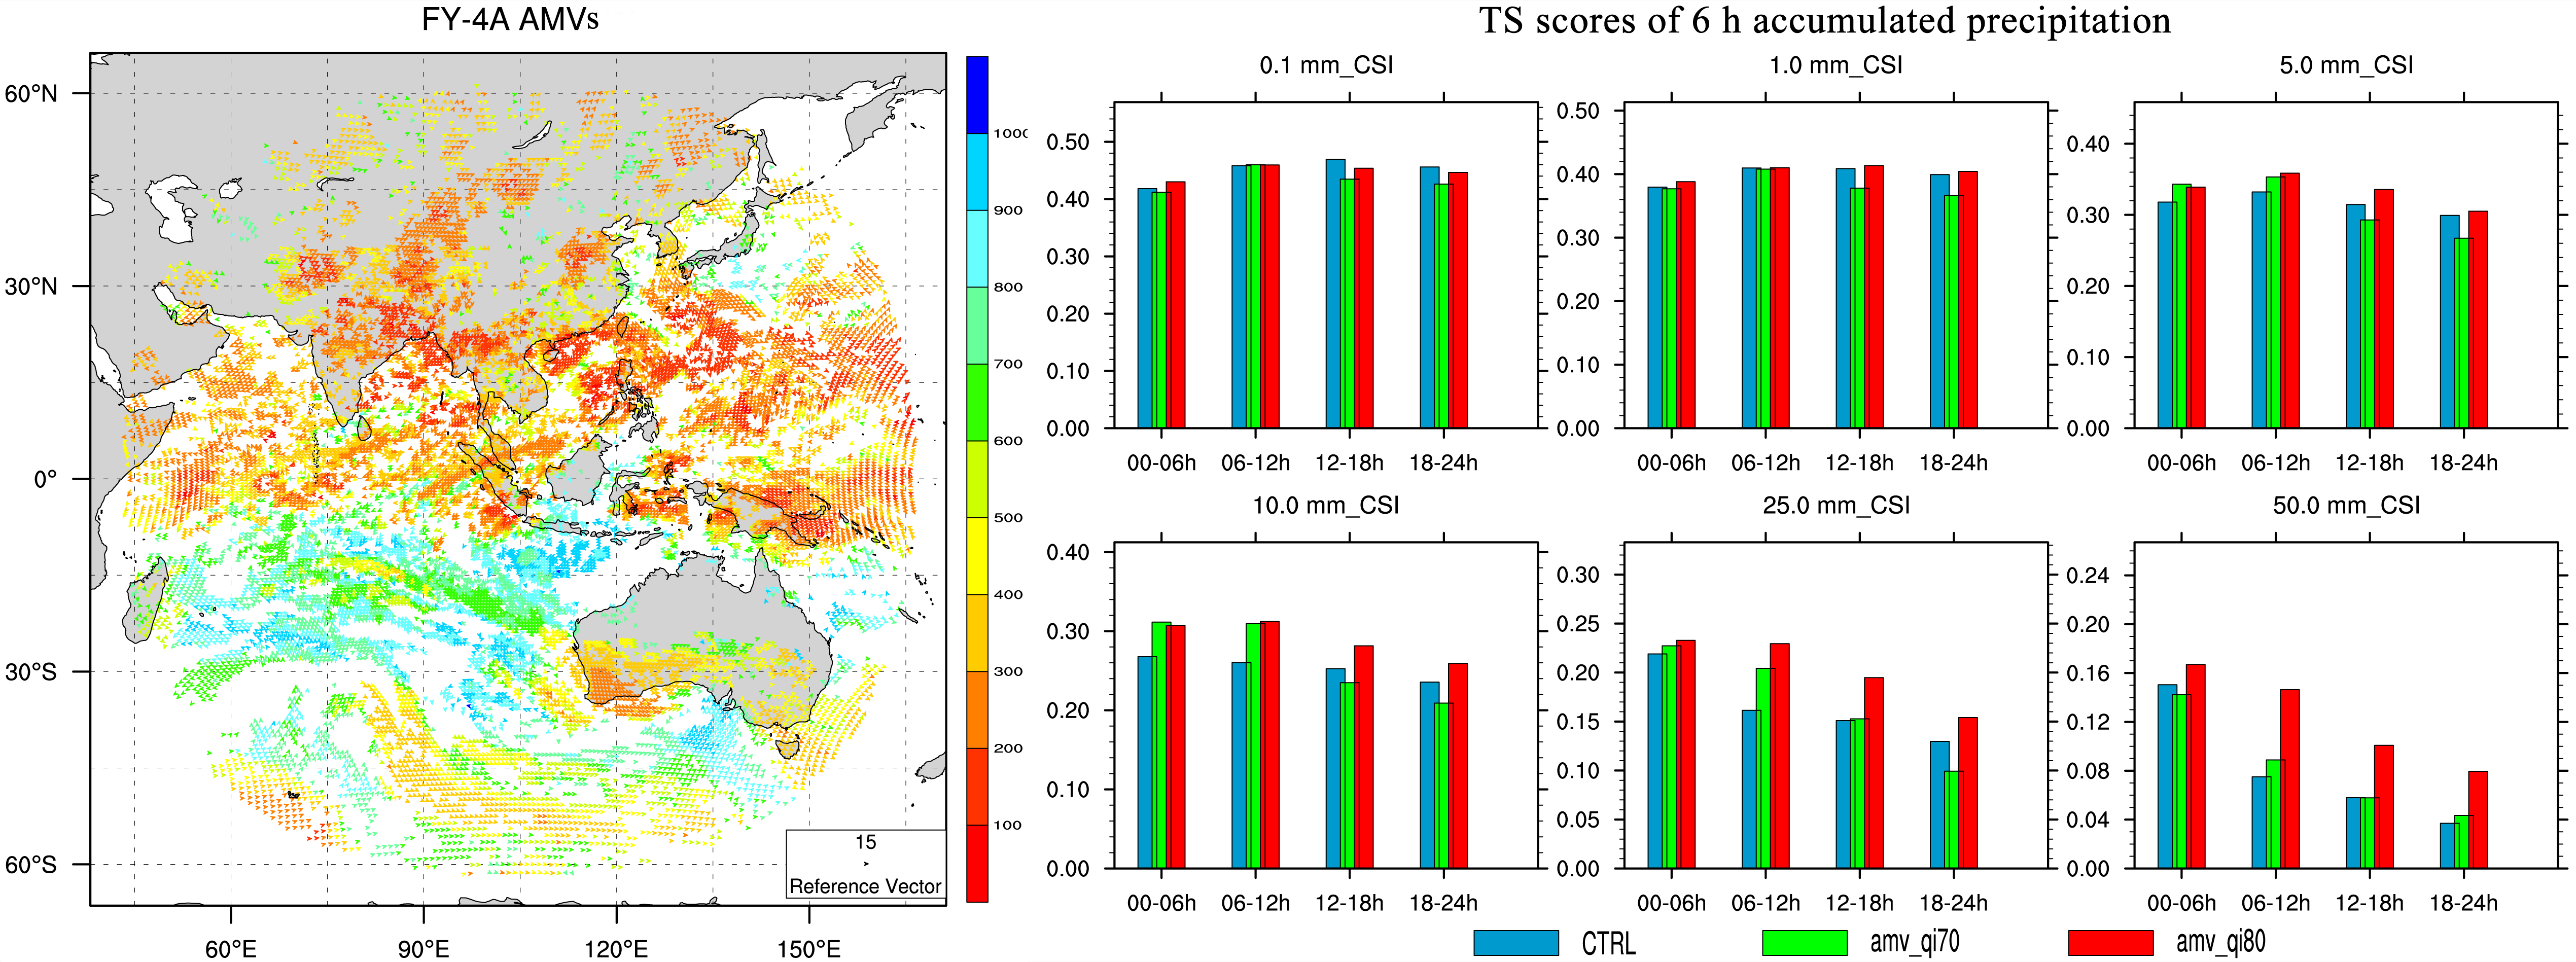
2.1. Model and Experiments

The Weather Research and Forecasting (WRF) model, Version 4.1.2 and the corresponding WRF data assimilation (WRFDA) system were used in this study. The WRF is a regional numerical weather prediction modeling system developed by the lead institution of the National Center for Atmospheric Research (NCAR) [41], which has been used in a broad range of applications across different scales. It is a full, compressible and nonhydrostatic equation model providing different dynamical cores and physics packages.
The specific configurations were set for the experiments in this study. Two nested domains covered different regional scopes, as shown in Figure 1. The outer domain had a 9 km grid of 649 × 500 points which covered the whole of China and the surrounding areas. The inner domain included the area of Henan province, which was the center of the “7.20” rainstorm event. It had a 3 km grid of 550 × 424 points. The physics schemes, including the Thompson graupel microphysics scheme, the RRTMG longwave and shortwave radiation schemes, the YSU planetary boundary layer scheme and the Unified Noah land-surface scheme, were chosen for the two domains. The New Tiedtke cumulus parameterization scheme was applied only for the 9 km domain. There were 59 vertical σ layers and a model top pressure of 10 hPa. Real-time forecasts from the ECMWF were taken as the large-scale initial atmospheric fields and boundary conditions.
Three groups of experiments were carried out based on the WRF model and WRFDA system. Twenty-four-hour forecasts for three days were conducted in three hour cycling runs starting at 00 UTC for each day from 18 to 20 July 2021. In the first group experiment (CRTL), conventional observations, including SYNOP, SOUND, PILOT, AMDAR, SHIP and BUOY, were assimilated to provide the analysis fields for the 24 h forecasts. In the second and third groups, the configuration was the same as that of the CTRL, except for the addition of FY-4A AMV data with QI values greater than 80 (amv_qi80) and 70 (amv_qi70), respectively. The assimilation time window was ±0.5 h from the analysis time. The three-dimension variational (3DVar) technique was used to perform data assimilation. In the 3Dvar, an optimal estimate of the atmospheric state at the analysis time was produced through an iterative solution of a prescribed cost function J x [42]:
J x = 1 2 x x b T B 1 x x b + 1 2 y y o T R 1 y y o .
where x b and y o represent the priori data of the background and observation, respectively. B and R are the background and observation error covariance matrices, respectively. The gridded analysis x is transformed to the observation space y = H( x ) (linearizations) for comparison with the observations.
Figure 1. Two nested domain settings in the experiments. The outside box is for the outer domain with a resolution of 9 km and the red box is for the inner domain with a resolution of 3 km. The red point (34.6°N, 113.6°E) indicates the capital of Henan province, which was the center of the 7.20 extreme rainstorm.
Remotesensing 14 05637 g001

2.2. FY-4A AMV Data

The FY-4A is one of the latest geostationary meteorological satellites in the Feng-Yun (FY) series of China. It was launched in December 2016. The FY-4A satellite plays an important role in the monitoring and prediction of severe weather systems over Asia [37]. The Advanced Geostationary Radiation Imager (AGRI) is one of the primary instruments onboard the FY-4A satellite. The AGRI instrument has a total of 14 channels including visible (VIS) channels (1–3) and infrared (IR) channels (4–14), as listed in Table 1. It can provide full-disc scanning every 15 min with spatial resolutions of 0.5–4 km over different channels. For this study, high-density AMV datasets were produced from three channels: IR high level water vapor (channel 9), IR middle level water vapor (channel 10) and IR longwave (channel 12).
FY-4A AMV products were processed at 3 h intervals by the National Satellite Meteorological Center of China Meteorological Administration. A QI value for each AMV was also provided to describe the quality and representativeness of the individual wind vectors. This was calculated based on the statistical properties of the derived vectors [32,43], including the temporal and spatial consistency of the wind direction, wind speed, and vertical and horizontal wind components. The QI values of the FY-4A AMVs ranged from 0 to 100. A high QI value indicated a high degree of credibility. Figure 2 presents the spatial distribution of the AMVs from three channels over the grid points of the 9 km domain at 00 UTC 20 July 2021. Figure 2a–c depicts the spatial distributions of all the FY-4A AMVs from channels 9, 10 and 12, respectively, and Figure 2d–f displays the spatial distributions of the corresponding AMVs with QI values above 80. It can be seen that the AMV data were mainly above 300 hPa for channel 9 and above 500 hPa for channel 10. The AMV data from the IR channel 12 were mostly distributed between 200 and 700 hPa. In contrast, the amount of AMV data with a QI > 80 was greatly reduced, and the proportion was about 50% for all the three channels.

2.3. Verification

First, the error characteristics of FY-4A AMVs with different QI values were compared and analyzed based on the NCEP reanalysis data. A statistical analysis was performed over the one-month period from 1 to 31 July 2021, in 6 h cycles. To calculate the RMSE of the FY-4A AMVs in each vertical level, the AMV data and the NCEP re-analysis data were both interpolated into the model layers at an interval of 50 hPa.
Second, the impact of the FY-4A AMV data assimilation on the forecast of the Henan 7.20 extreme rainstorm was evaluated based on site and sounding observations. These observation data were from more than 10,000 national ground automatic weather stations and more than 100 sounding vertical profiles. They were preprocessed in advance through a series of quality control procedures [44,45]. To verify the forecast results, the value of the forecast gridded point was assigned to the nearest observation for two-dimensional components in the horizontal direction, such as the rainfall and the 10 m wind. For the vertical profiles, the forecast and the observation at the same level were directly paired. If any discrepancy existed between the vertical levels, then the forecast value was interpolated into the level of the observation in the natural log of pressure coordinates.
In addition, the scores of the CSI and BIAS were also used to evaluate the rainfall forecast quantitatively. Theses scores were calculated based on a four-element (hit, miss, false alarm and correct negative) contingency table which is a joint distribution of forecasts and observations [46]. For a given threshold of rainfall, a hit meant that the forecast and the observed rainfall were both greater than the threshold, while a miss indicated that the observation was greater than the threshold, but the forecast was not. A false alarm meant that the forecast was beyond the threshold, but the observation was not, and a correct negative suggested that the forecast and the observed rainfall were both not above the threshold. The CSI and BIAS can be expressed as:
CSI   = N hit N hit + N false + N miss ,
BIAS   = N hit + N false N hit + N miss .
where N is the number of the corresponding component in the contingency table. The value of the CSI ranges from 0 to 1. A higher value suggests a better rainfall prediction. A BIAS score of 1.0 indicates a perfect prediction. A value of BIAS above 1.0 indicates an over-prediction and below 1.0 indicates an under-prediction.

3. Results

In this section, the statistical characteristics of the FY-4A AMV data from three channels are analyzed. The results of the FY-4A AMV data assimilation in the forecasting of the Henan 7.20 rainstorm are presented and investigated.

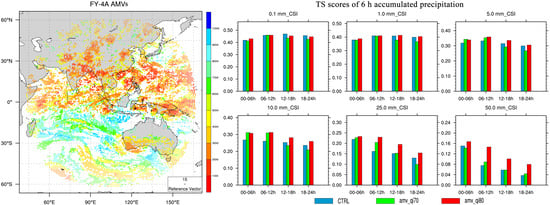
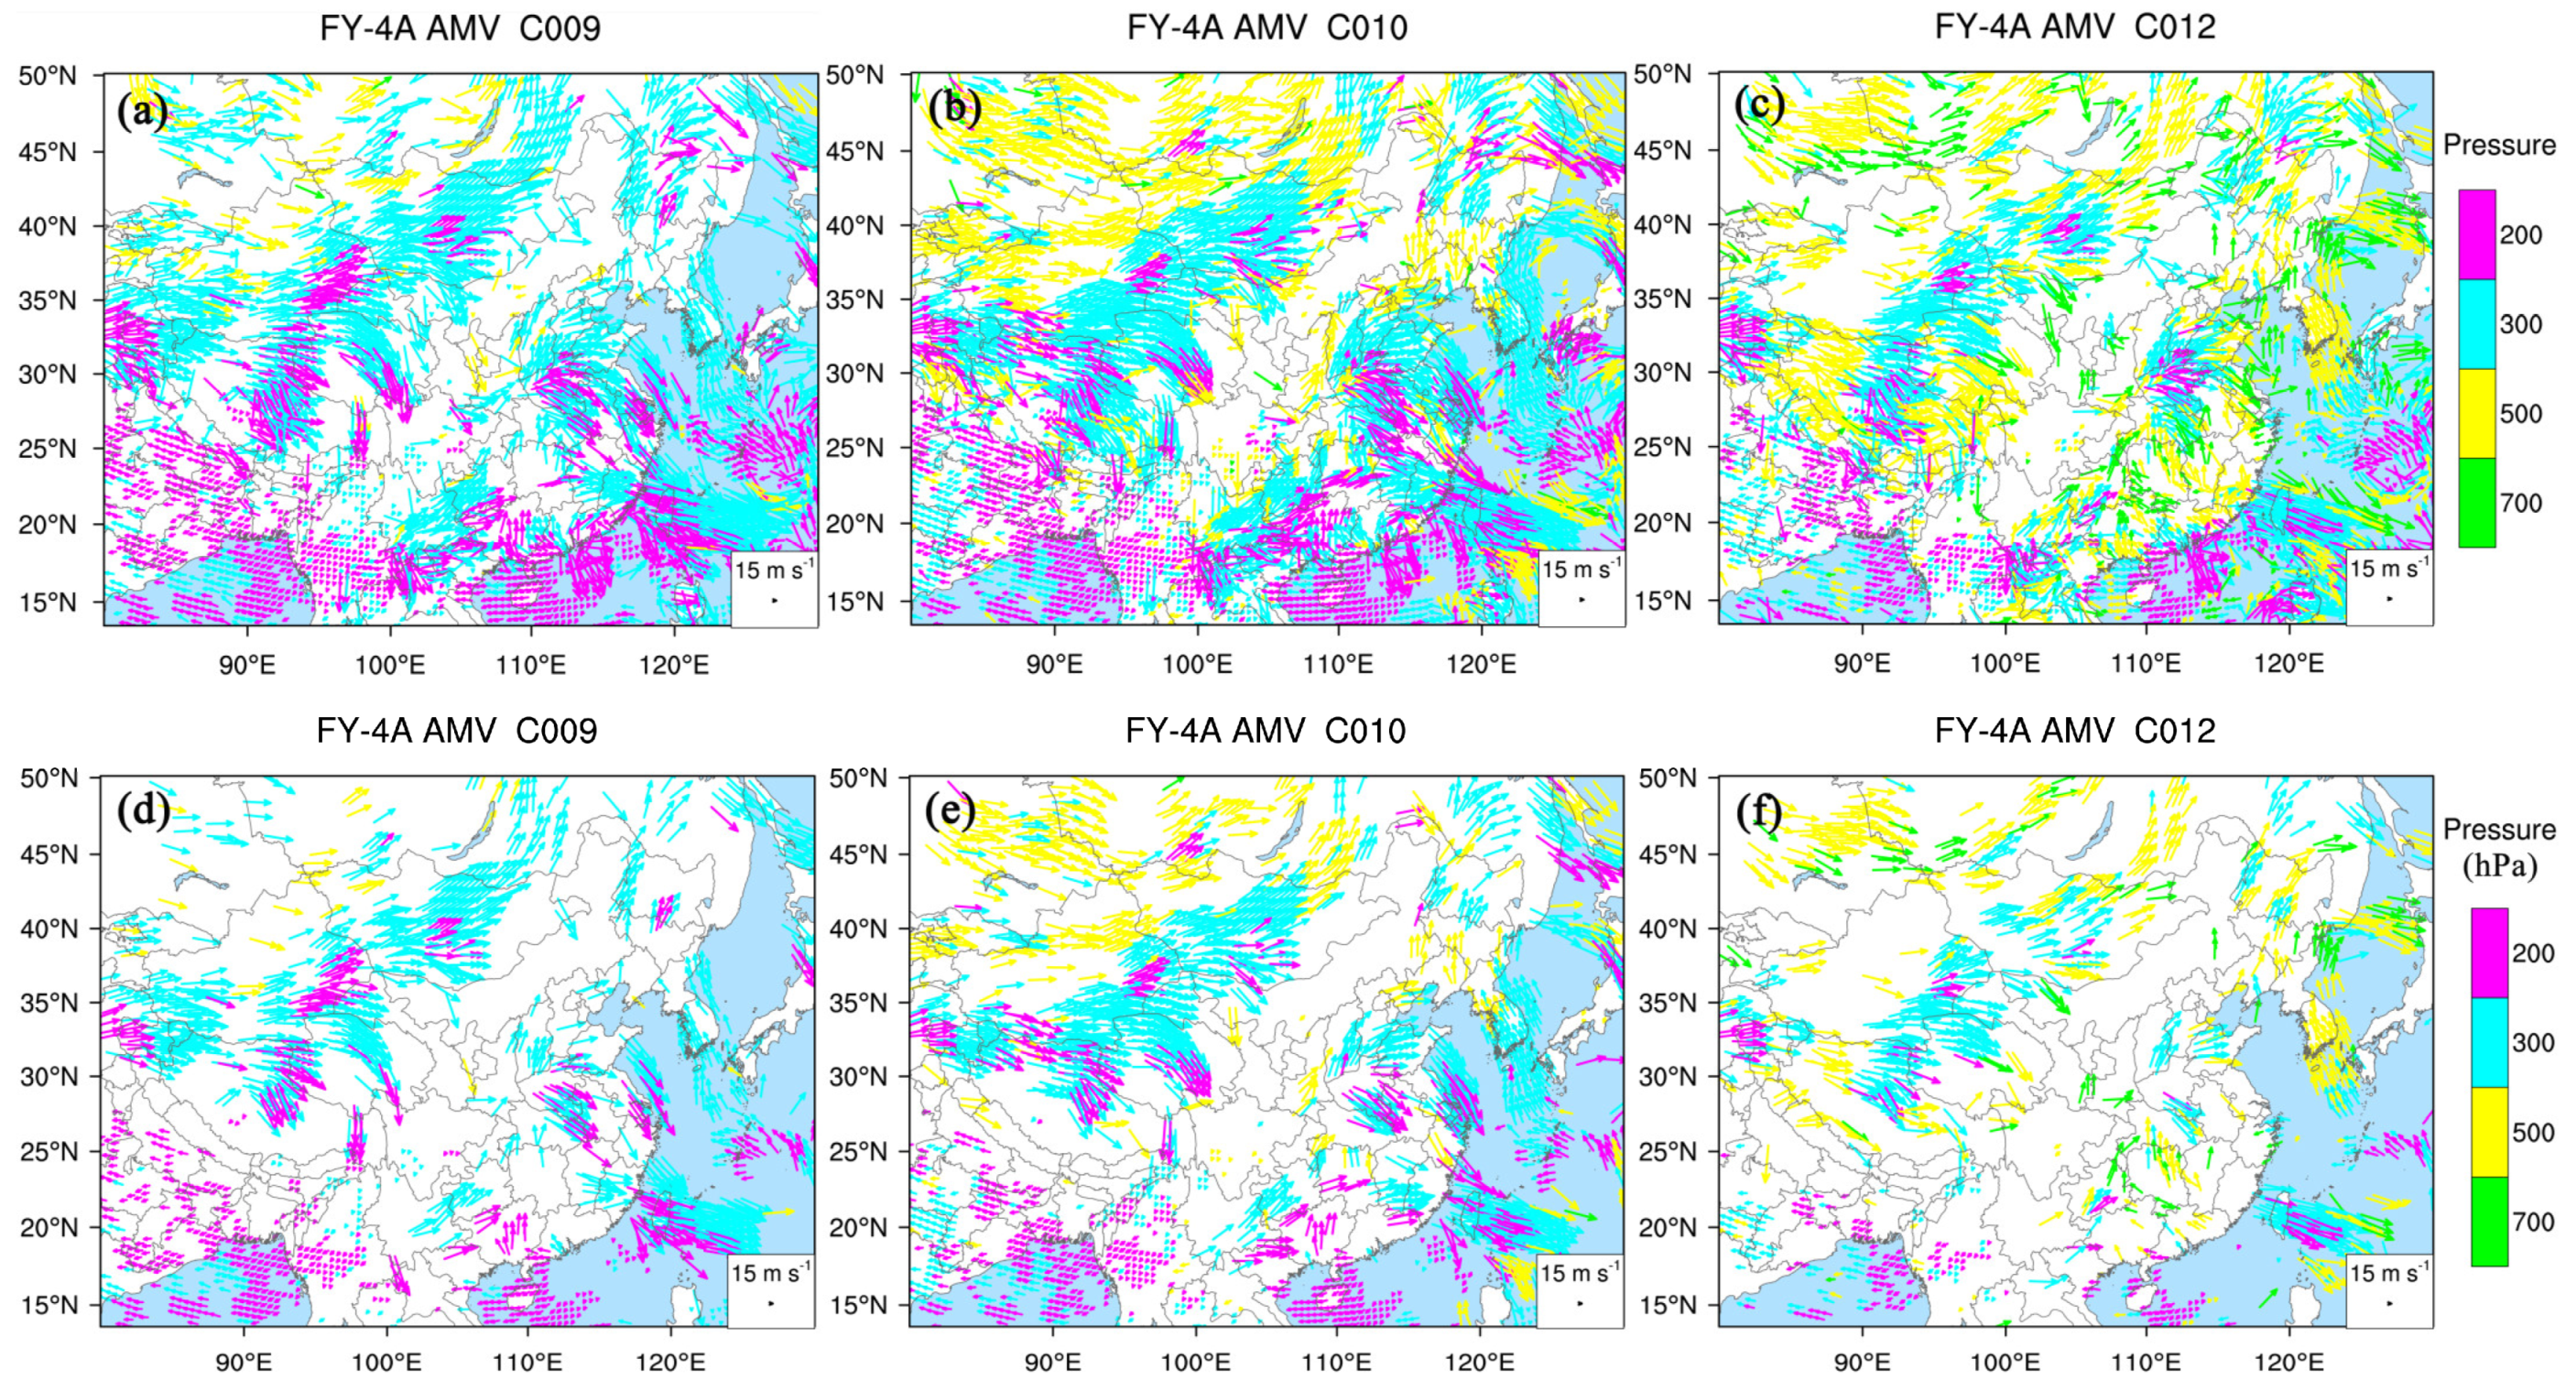
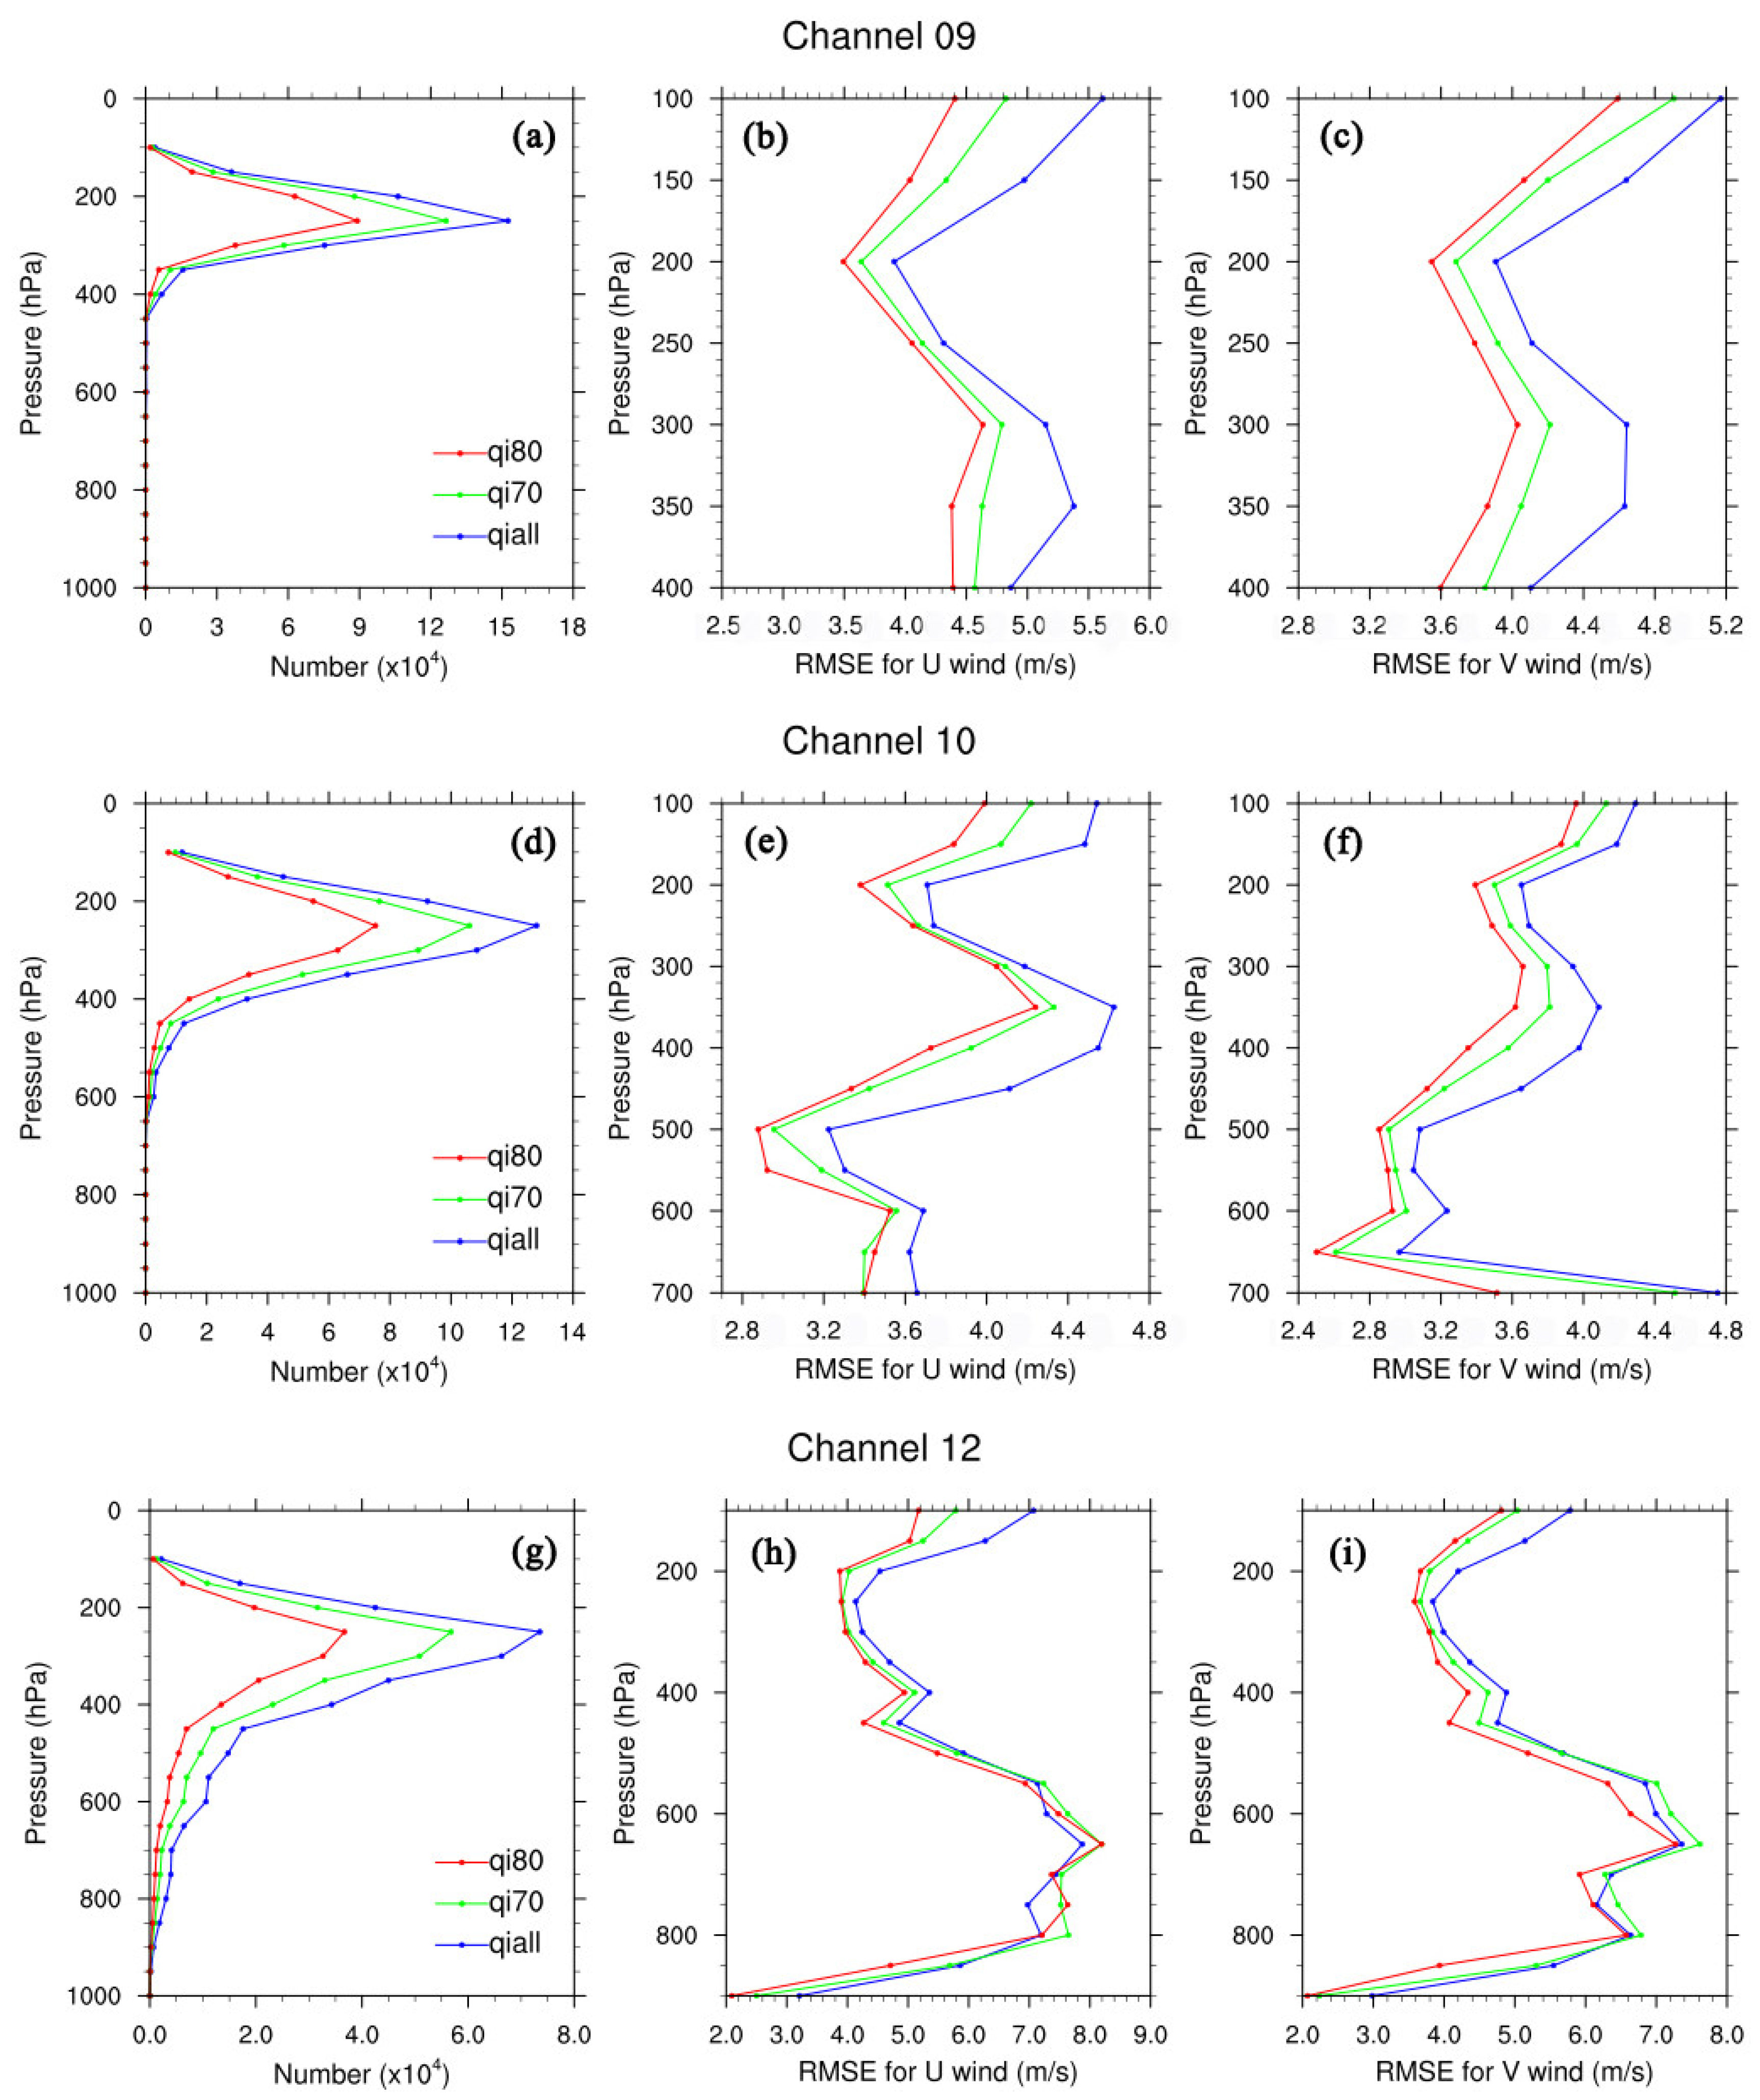
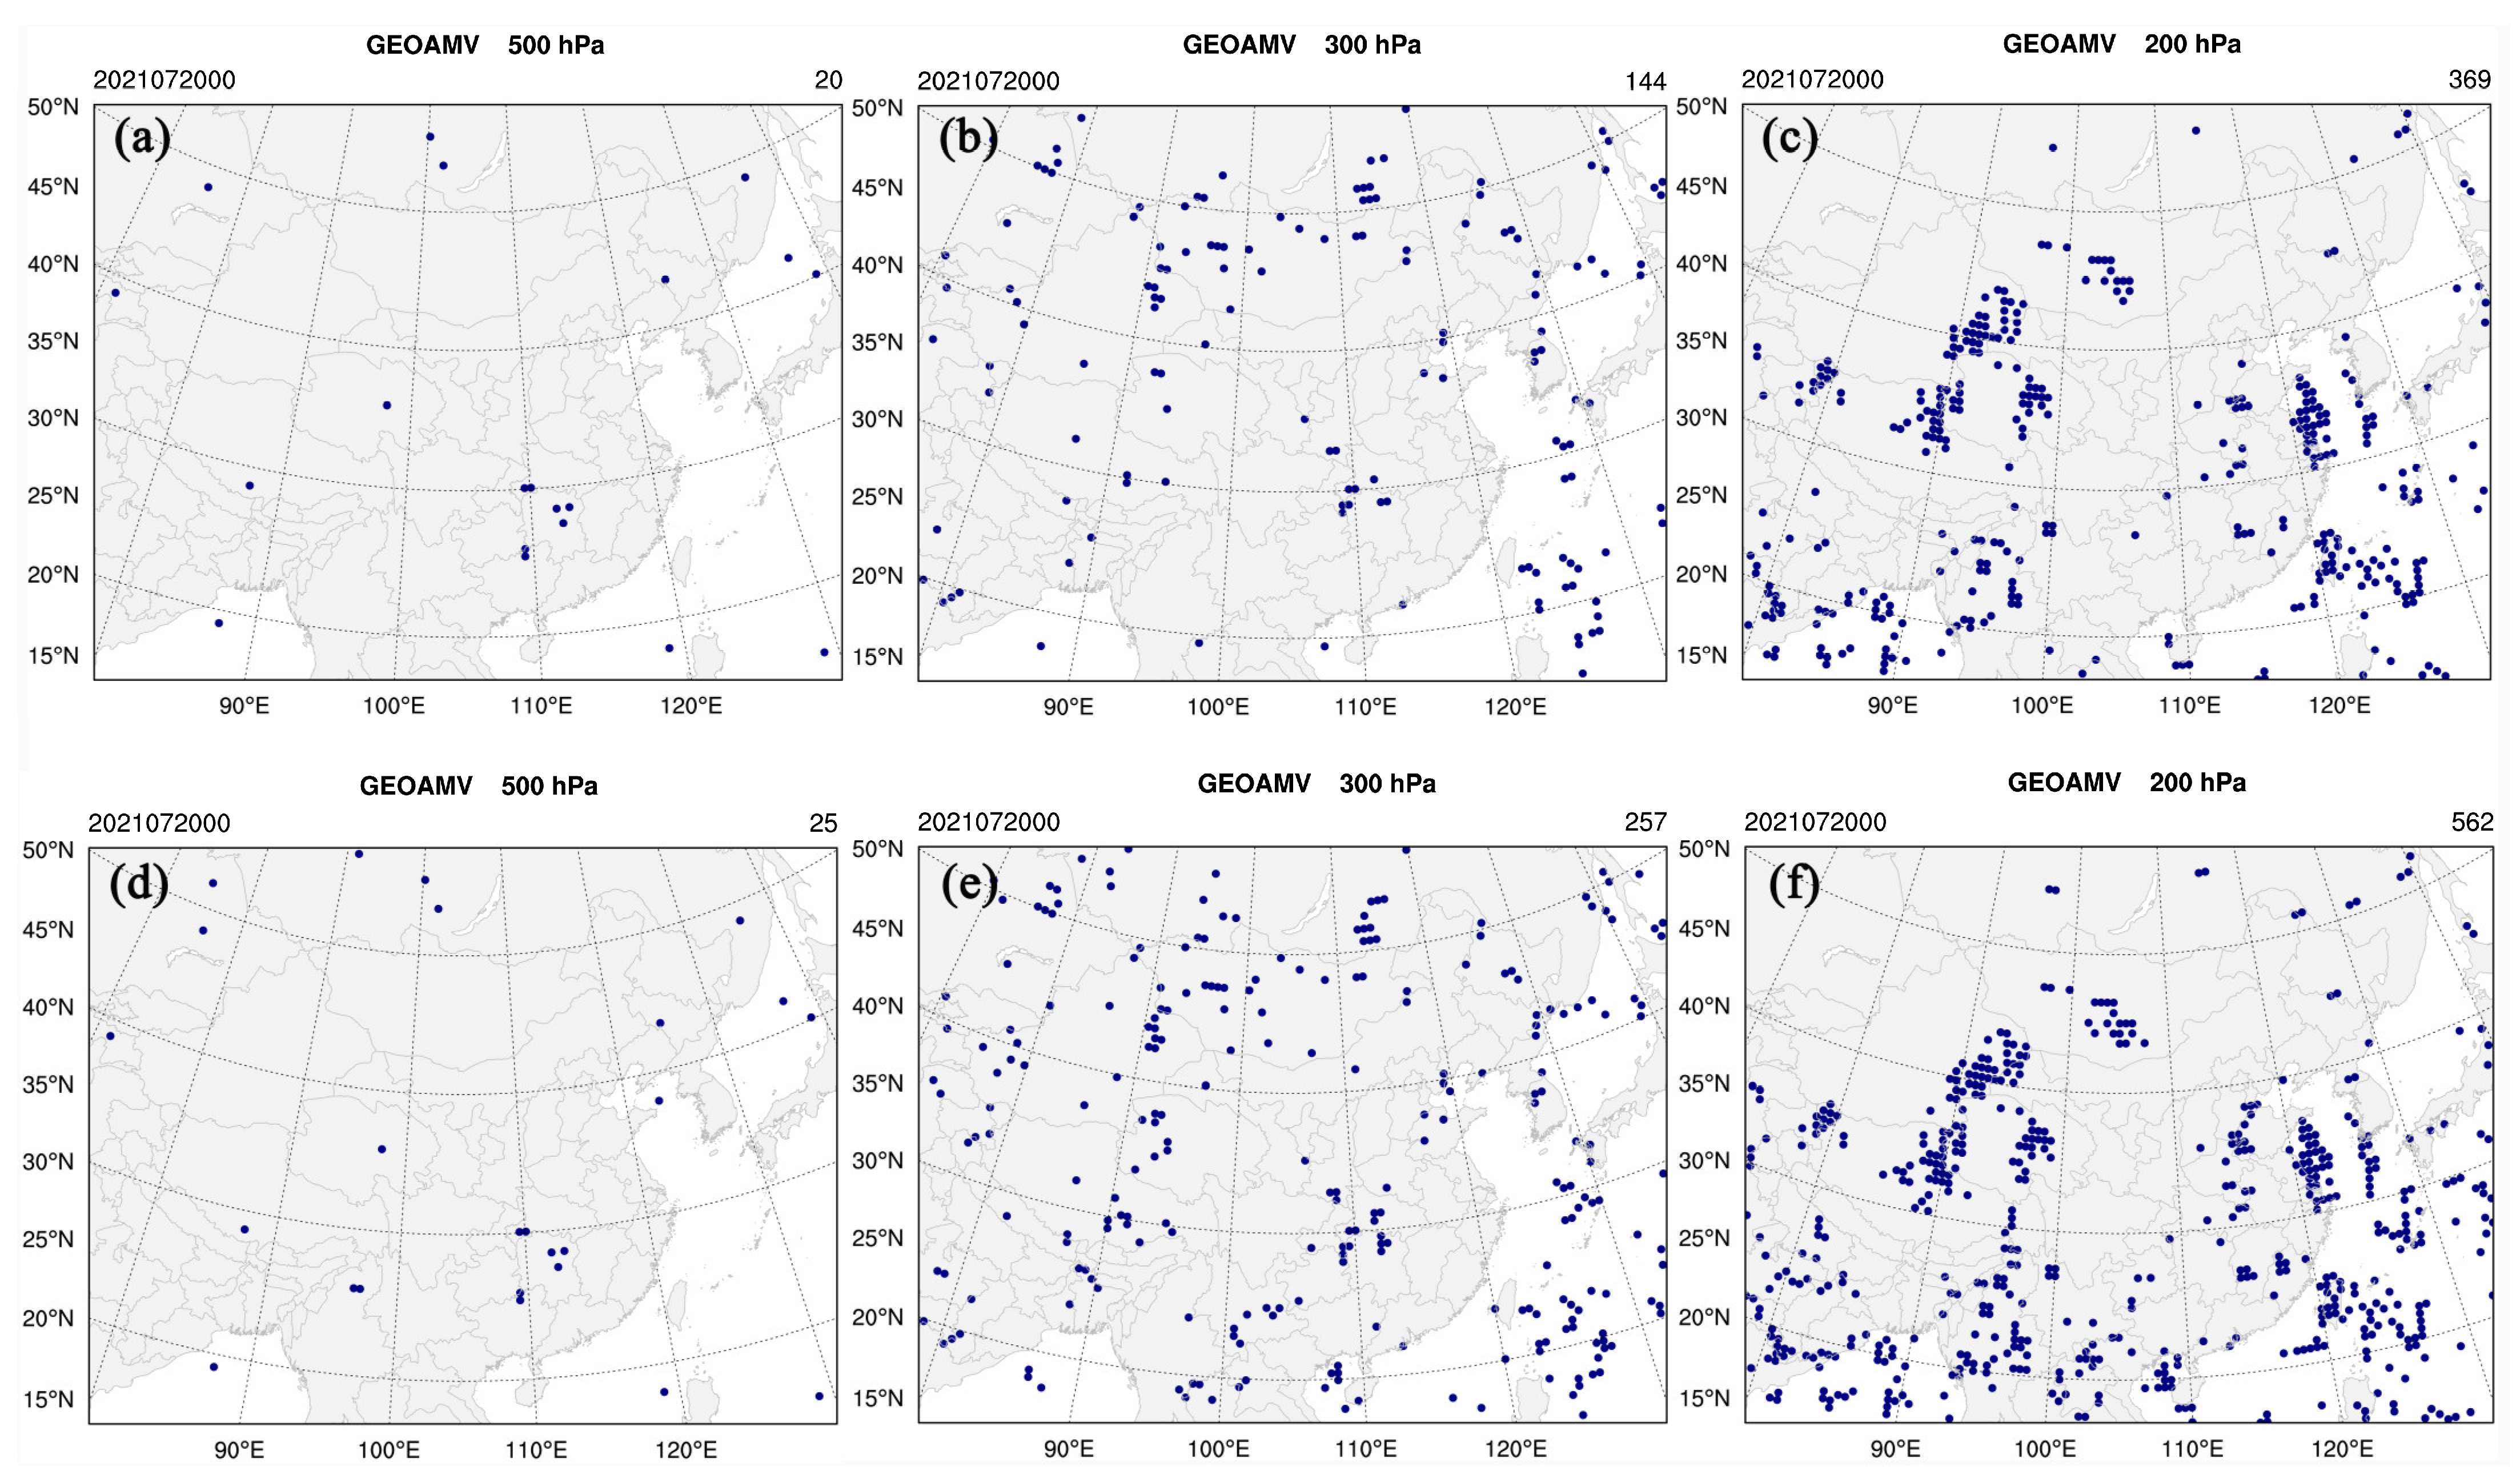
3.1. Statistical Characteristics of FY-4A AMVs

The AMV data were retrieved from satellite observations indirectly, and they were assimilated subject to quality control. The QI values also provided a quality indication for the FY-4A AMVs. Figure 3 presents the statistics of FY-4A AMVs with different QI values based on the NCEP re-analysis data over one month from 1 to 31 July 2021. For the two water vapor channels, namely, 9 and 10, the AMV data were mainly above 400 hPa and 600 hPa, respectively. The number of AMVs with a QI > 70 was about 85% of the total number and about 60% for the QI > 80. The corresponding errors of the U and V wind also decreased with the increase in the QI value. Compared with the errors of all the AMV data, the RMSEs of the U and V wind from these two channels reduced greatly for the AMVs with a QI > 70 between 300 hPa and 400 hPa. There was a small decrease in the RMSEs of the AMV data when the QI value changed from 70 to 80. For channel 9, the RMSEs were less than 4.5 m/s for the U wind with a QI > 80 and less than 4.0 m/s for the corresponding V wind, except for the high levels of 100 hPa and 150 hPa. For channel 10, the RMSEs were both less than 4.0 m/s for the U and V wind with a QI > 80, except for the value of the U wind between 300 hPa and 400 hPa, at a little greater than 4.0 m/s. For IR channel 12, a small amount of AMV data below 600 hPa were also available, but the errors increased obviously between 600 hPa and 800 hPa. The RMSEs of the U and V wind were about 4.0 m/s between 200 and 400 hPa. At high levels above 200 hPa, the RMSEs of all the AMVs were relatively large with a value of about 6.0 m/s. The corresponding RMSEs of the U and V wind with a QI > 80 had a great reduction compared with that of all the AMV data. There were similar statistical characteristics for the AMVs with a QI > 70 and QI > 80 above 600 hPa. This suggests that the QI value can give a good indication of FY-4A AMV data quality for the middle and upper levels above 600 hPa. For these three channels, most AMV data were distributed between 200 hPa and 400 hPa. About 60% of all the AMV data could be retained for a QI value above 80, and about 85% for a QI value above 70 at the cost of increased errors. In this study, due to the limited data and large errors being at low levels, only the AMV data above 600 hPa from these three channels were used in the data assimilation experiments.

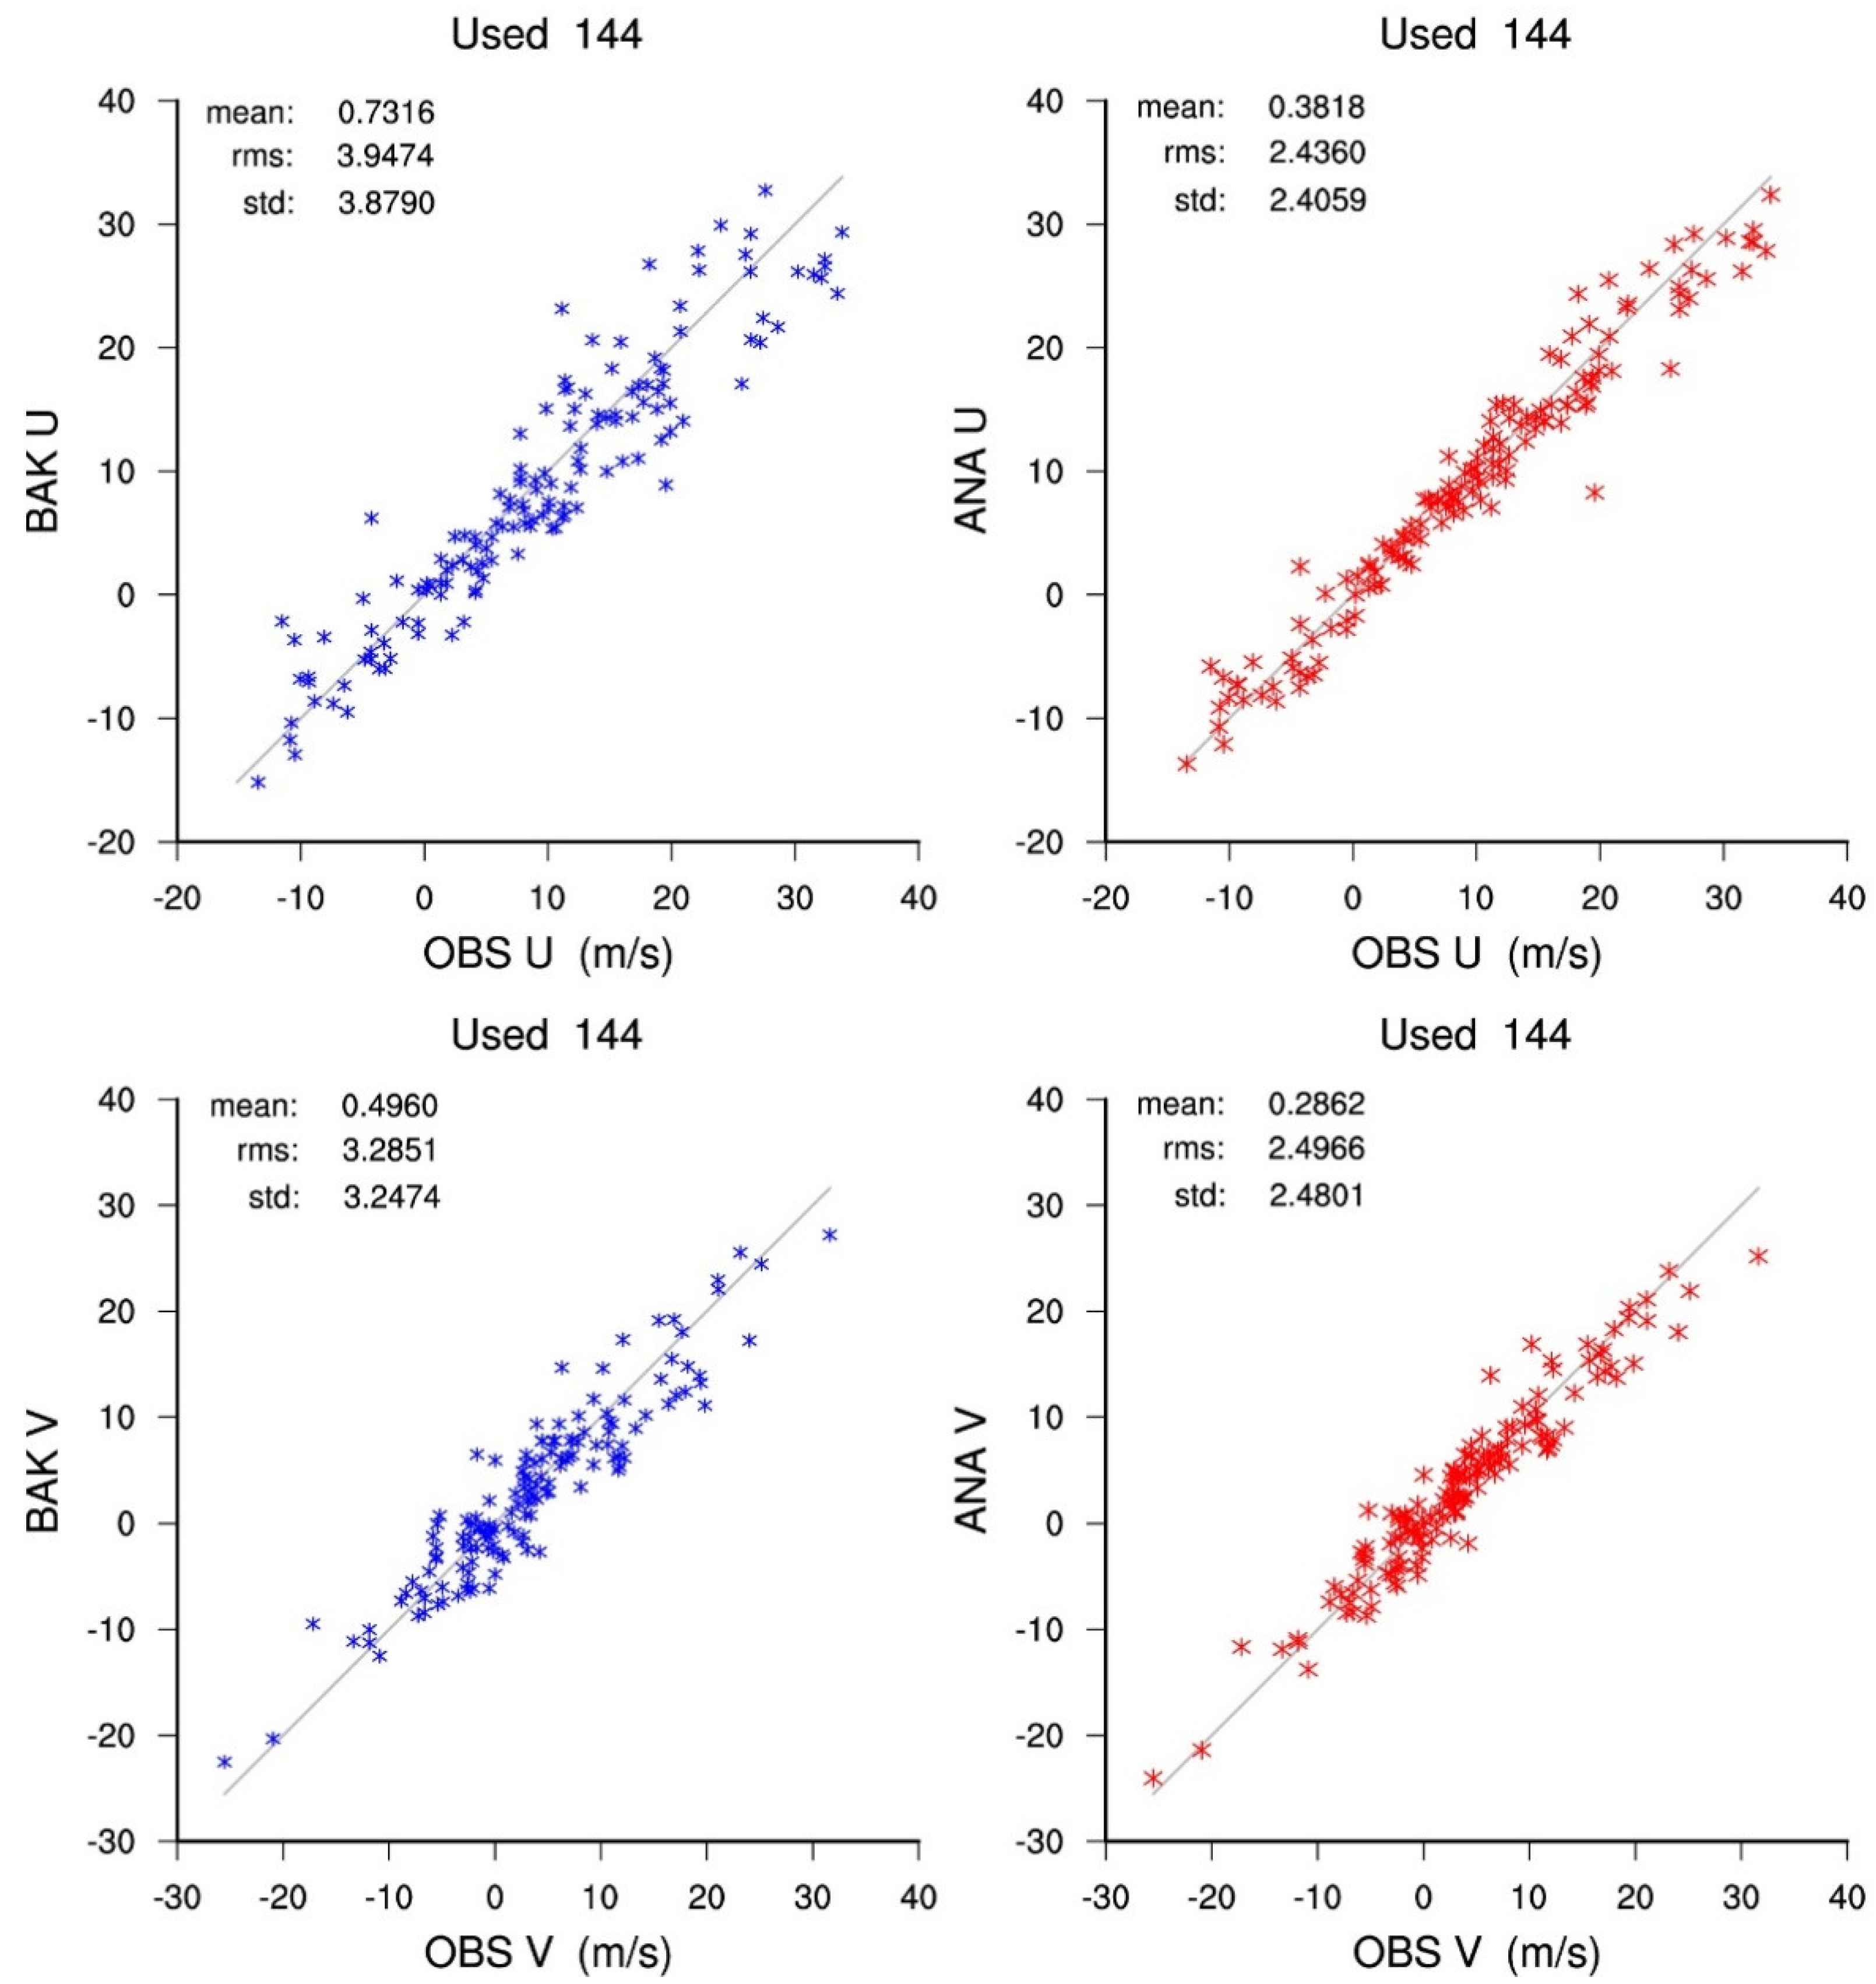
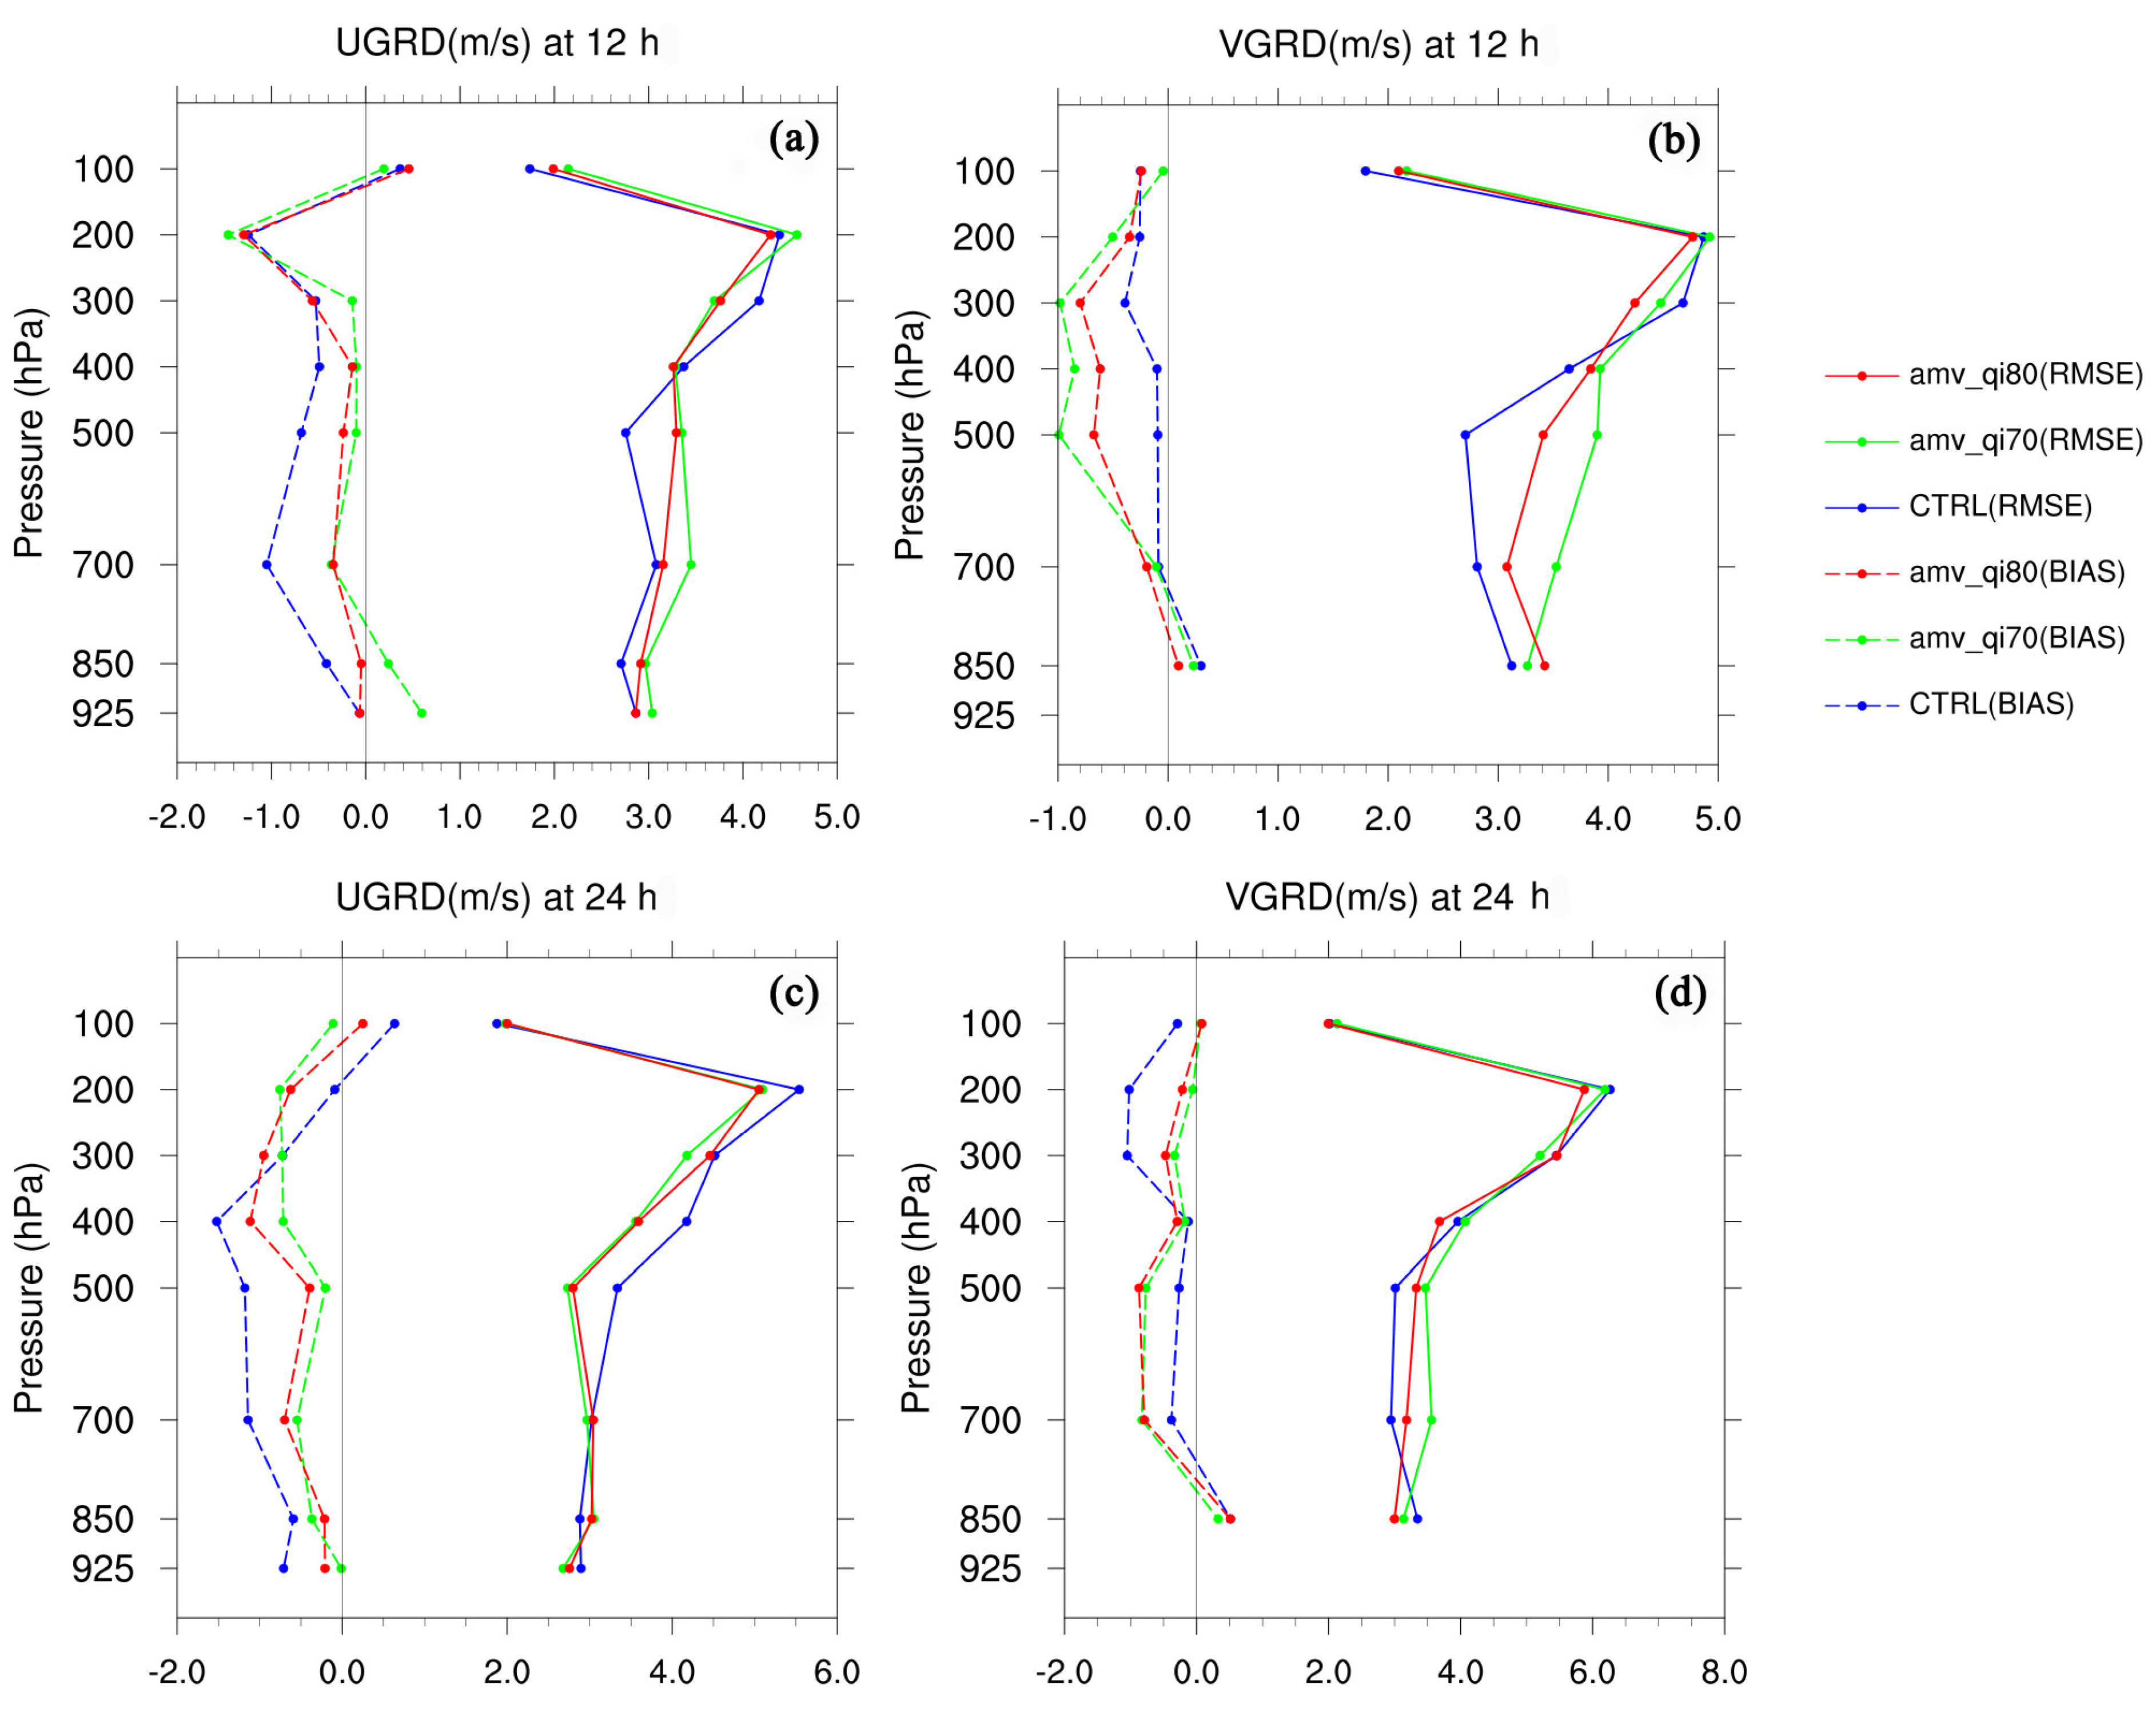
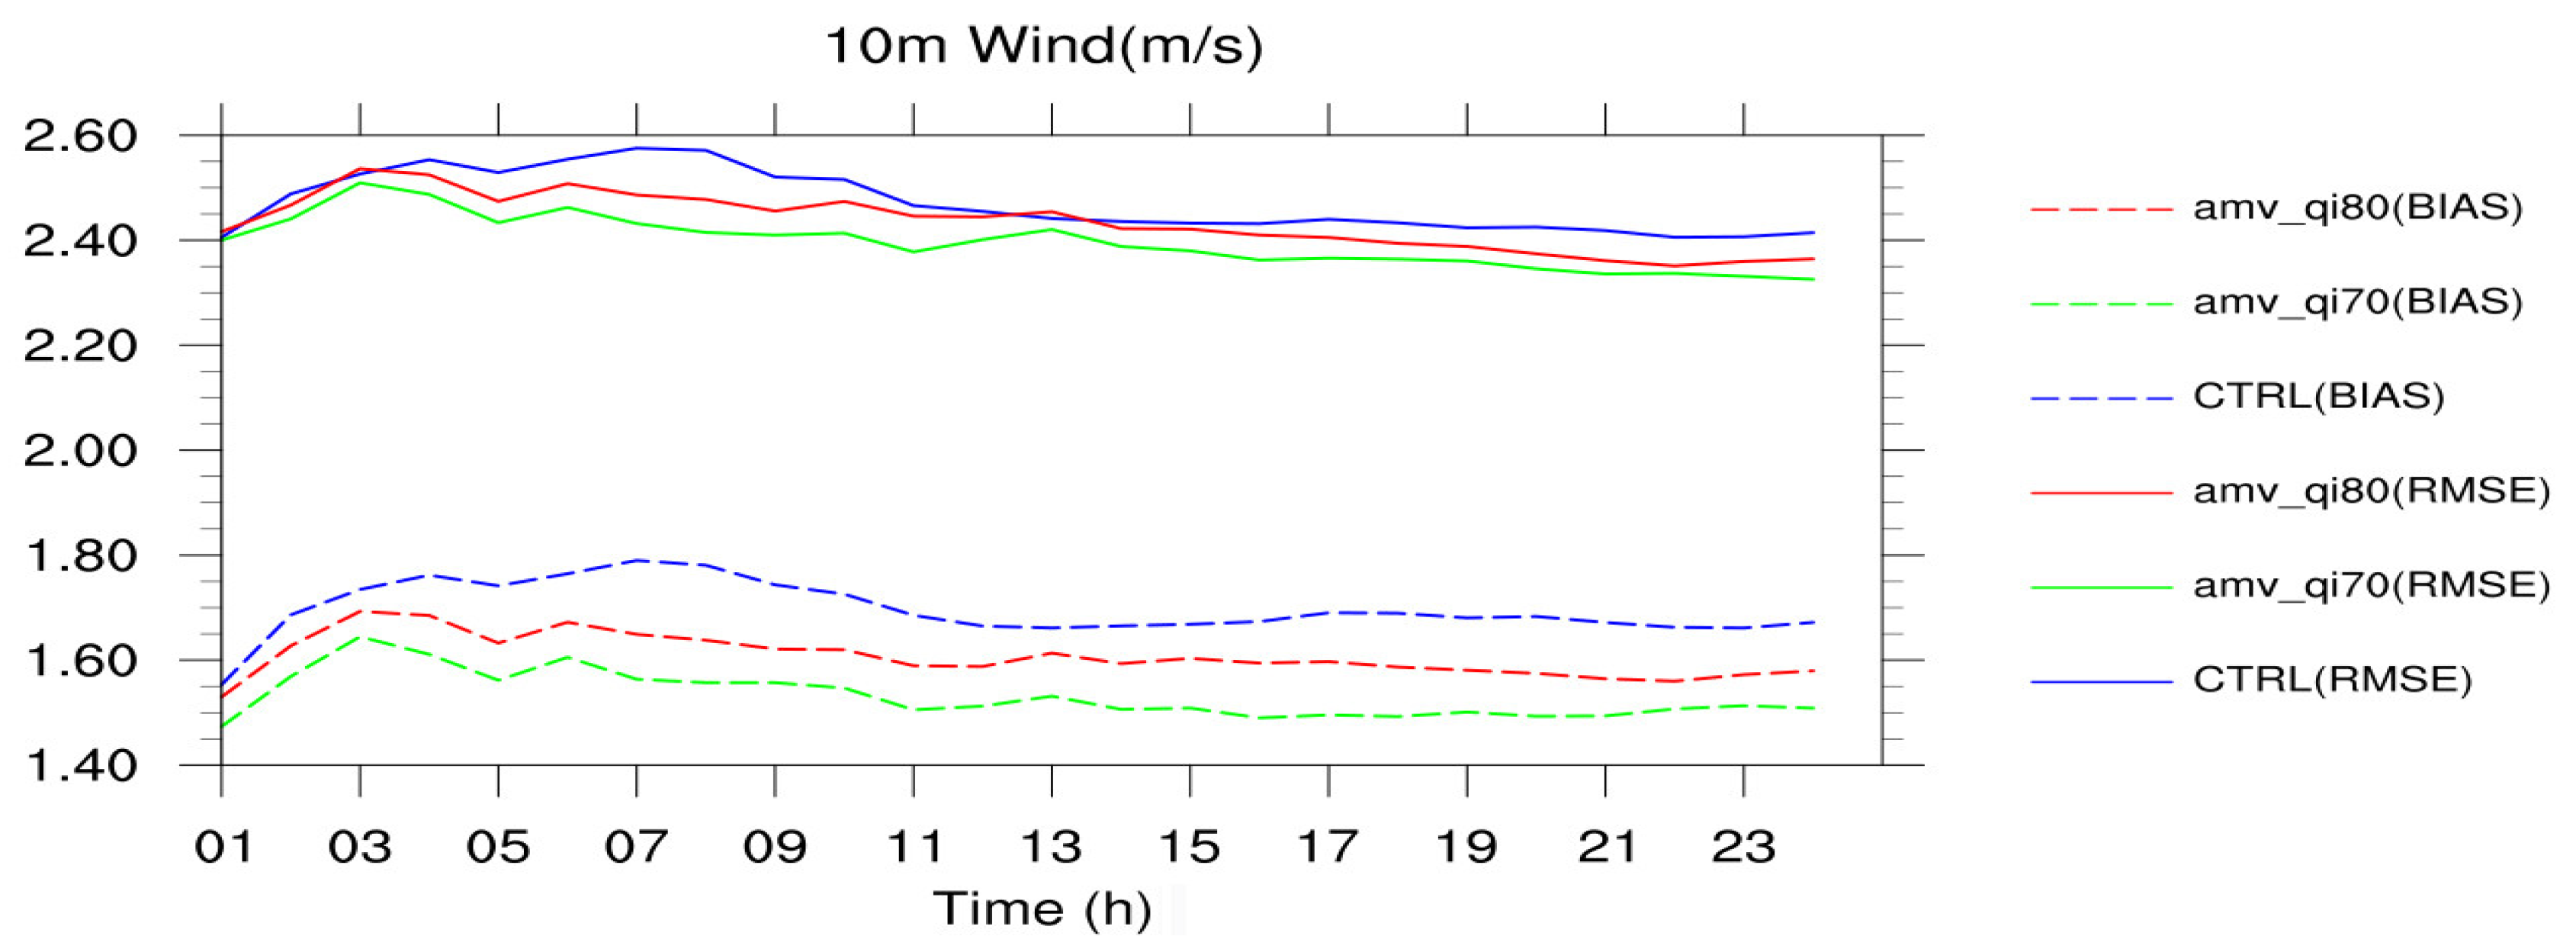
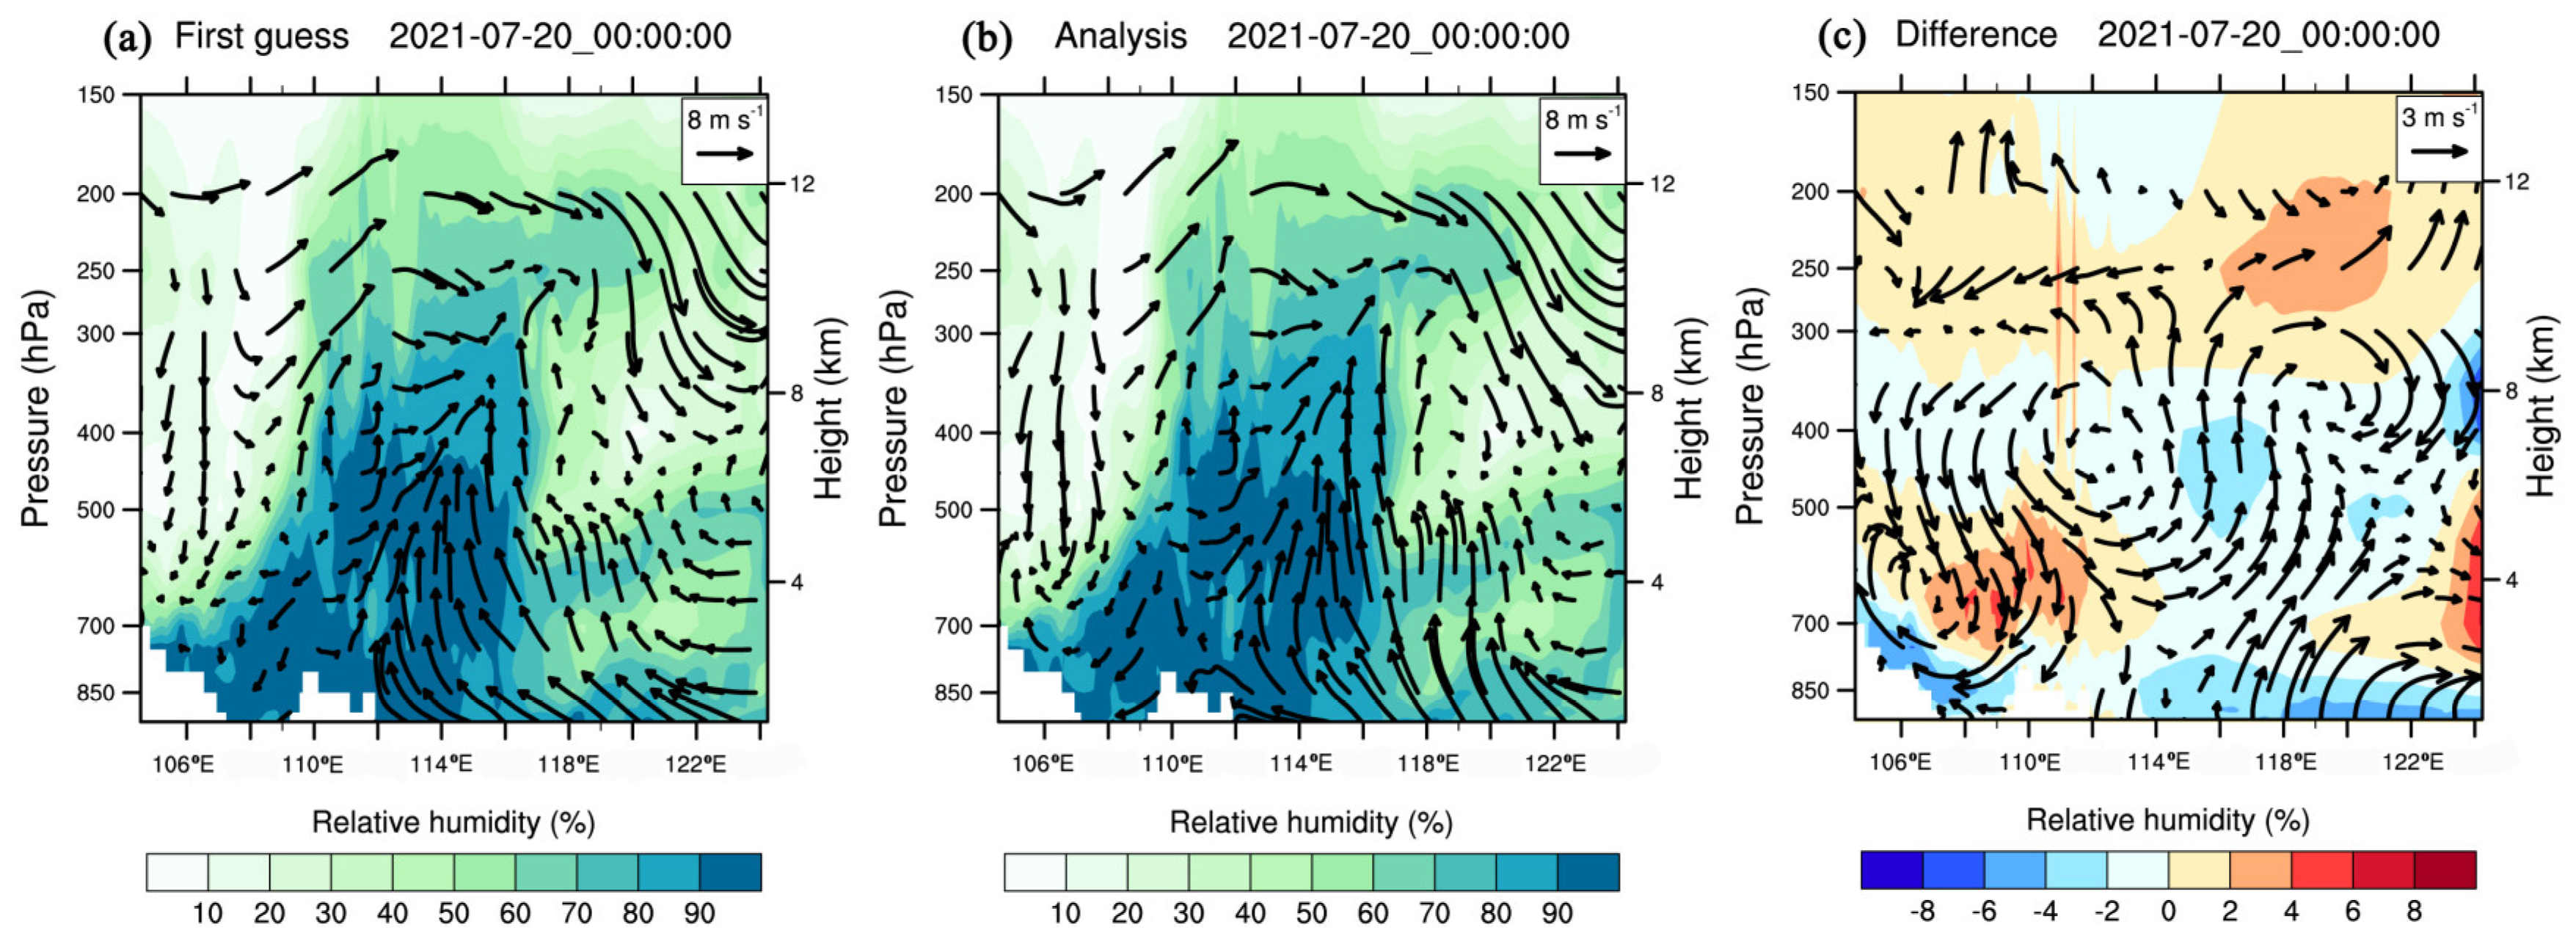
3.2. FY-4A AMV Data Assimilation

To investigate the impact of FY-4A AMVs with different QIs on rainstorm forecasting, AMV data with a QI > 80 and QI > 70 were assimilated, respectively. Figure 4 shows the spatial distribution of the FY-4A AMVs used in the data assimilation experiments for different levels at 00 UTC 20 July 2021. Figure 4a–c is from the experiment of assimilating FY-4A AMV data with a QI > 80, and Figure 4d–f is from that of assimilating AMVs with a QI > 70. For the experiment with a QI > 80 AMVs, the number of AMV data used was only 20, 144 and 369 for the levels of 500 hPa, 300 hPa and 200 hPa, respectively. For the experiment with AMVs of a QI > 70, the number used for the assimilation increased slightly, with 25, 257 and 562 for the three levels, respectively. The spatial distribution of the AMV data was similar for the QI > 80 and QI > 70. Relatively more AMV data were used in the assimilation experiments at 300 hPa and 200 hPa. At 300 hPa, the assimilated AMV data were sparsely distributed over the domain. At 200 hPa, most AMV data were located in the southwest and southeast of the region.
Figure 5 gives the scatter plots of the U and V wind from the background and analysis against the corresponding components of FY-4A AMVs with a QI > 80 for the level of 300 hPa at 00 UTC 20 July 2021. For the U wind, the mean bias of the background departures was about 0.73 m/s and the standard deviation was about 3.88 m/s. Meanwhile, it can be seen that the bias was larger when the U wind was greater than 20 m/s. After the AMV data assimilation, the mean bias and the standard deviation of the analysis departures were both reduced, with about 0.38 m/s and 2.41 m/s, respectively. For the V wind, the mean bias and the standard deviation of the background departures were about 0.50 m/s and 3.25 m/s, respectively, both being less than that of the corresponding U wind. The values of the mean bias and standard deviation of the analysis departures were reduced to 0.29 m/s and 2.48 m/s, respectively.
The FY-4A AMV data assimilation represents an innovation mainly on the upper levels for the initial wind fields. Figure 6 shows the spatial distribution of the analysis increment for the U and V wind at 00 UTC 20 July 2021 on the level of about 300 hPa in the experiment with the QI > 80 AMV data assimilation. For the U wind, there was a great decrease in the west of the domain with the value reaching 12 m/s around 37°N. Great increments could also be found around 45°N. For the V wind, a great increment and decrement appeared around 33°N in the west and east of the domain, respectively, corresponding exactly to the distribution of the FY-4A AMV observations. There was also a great decrement that appeared on the ocean in the southeast of the domain.

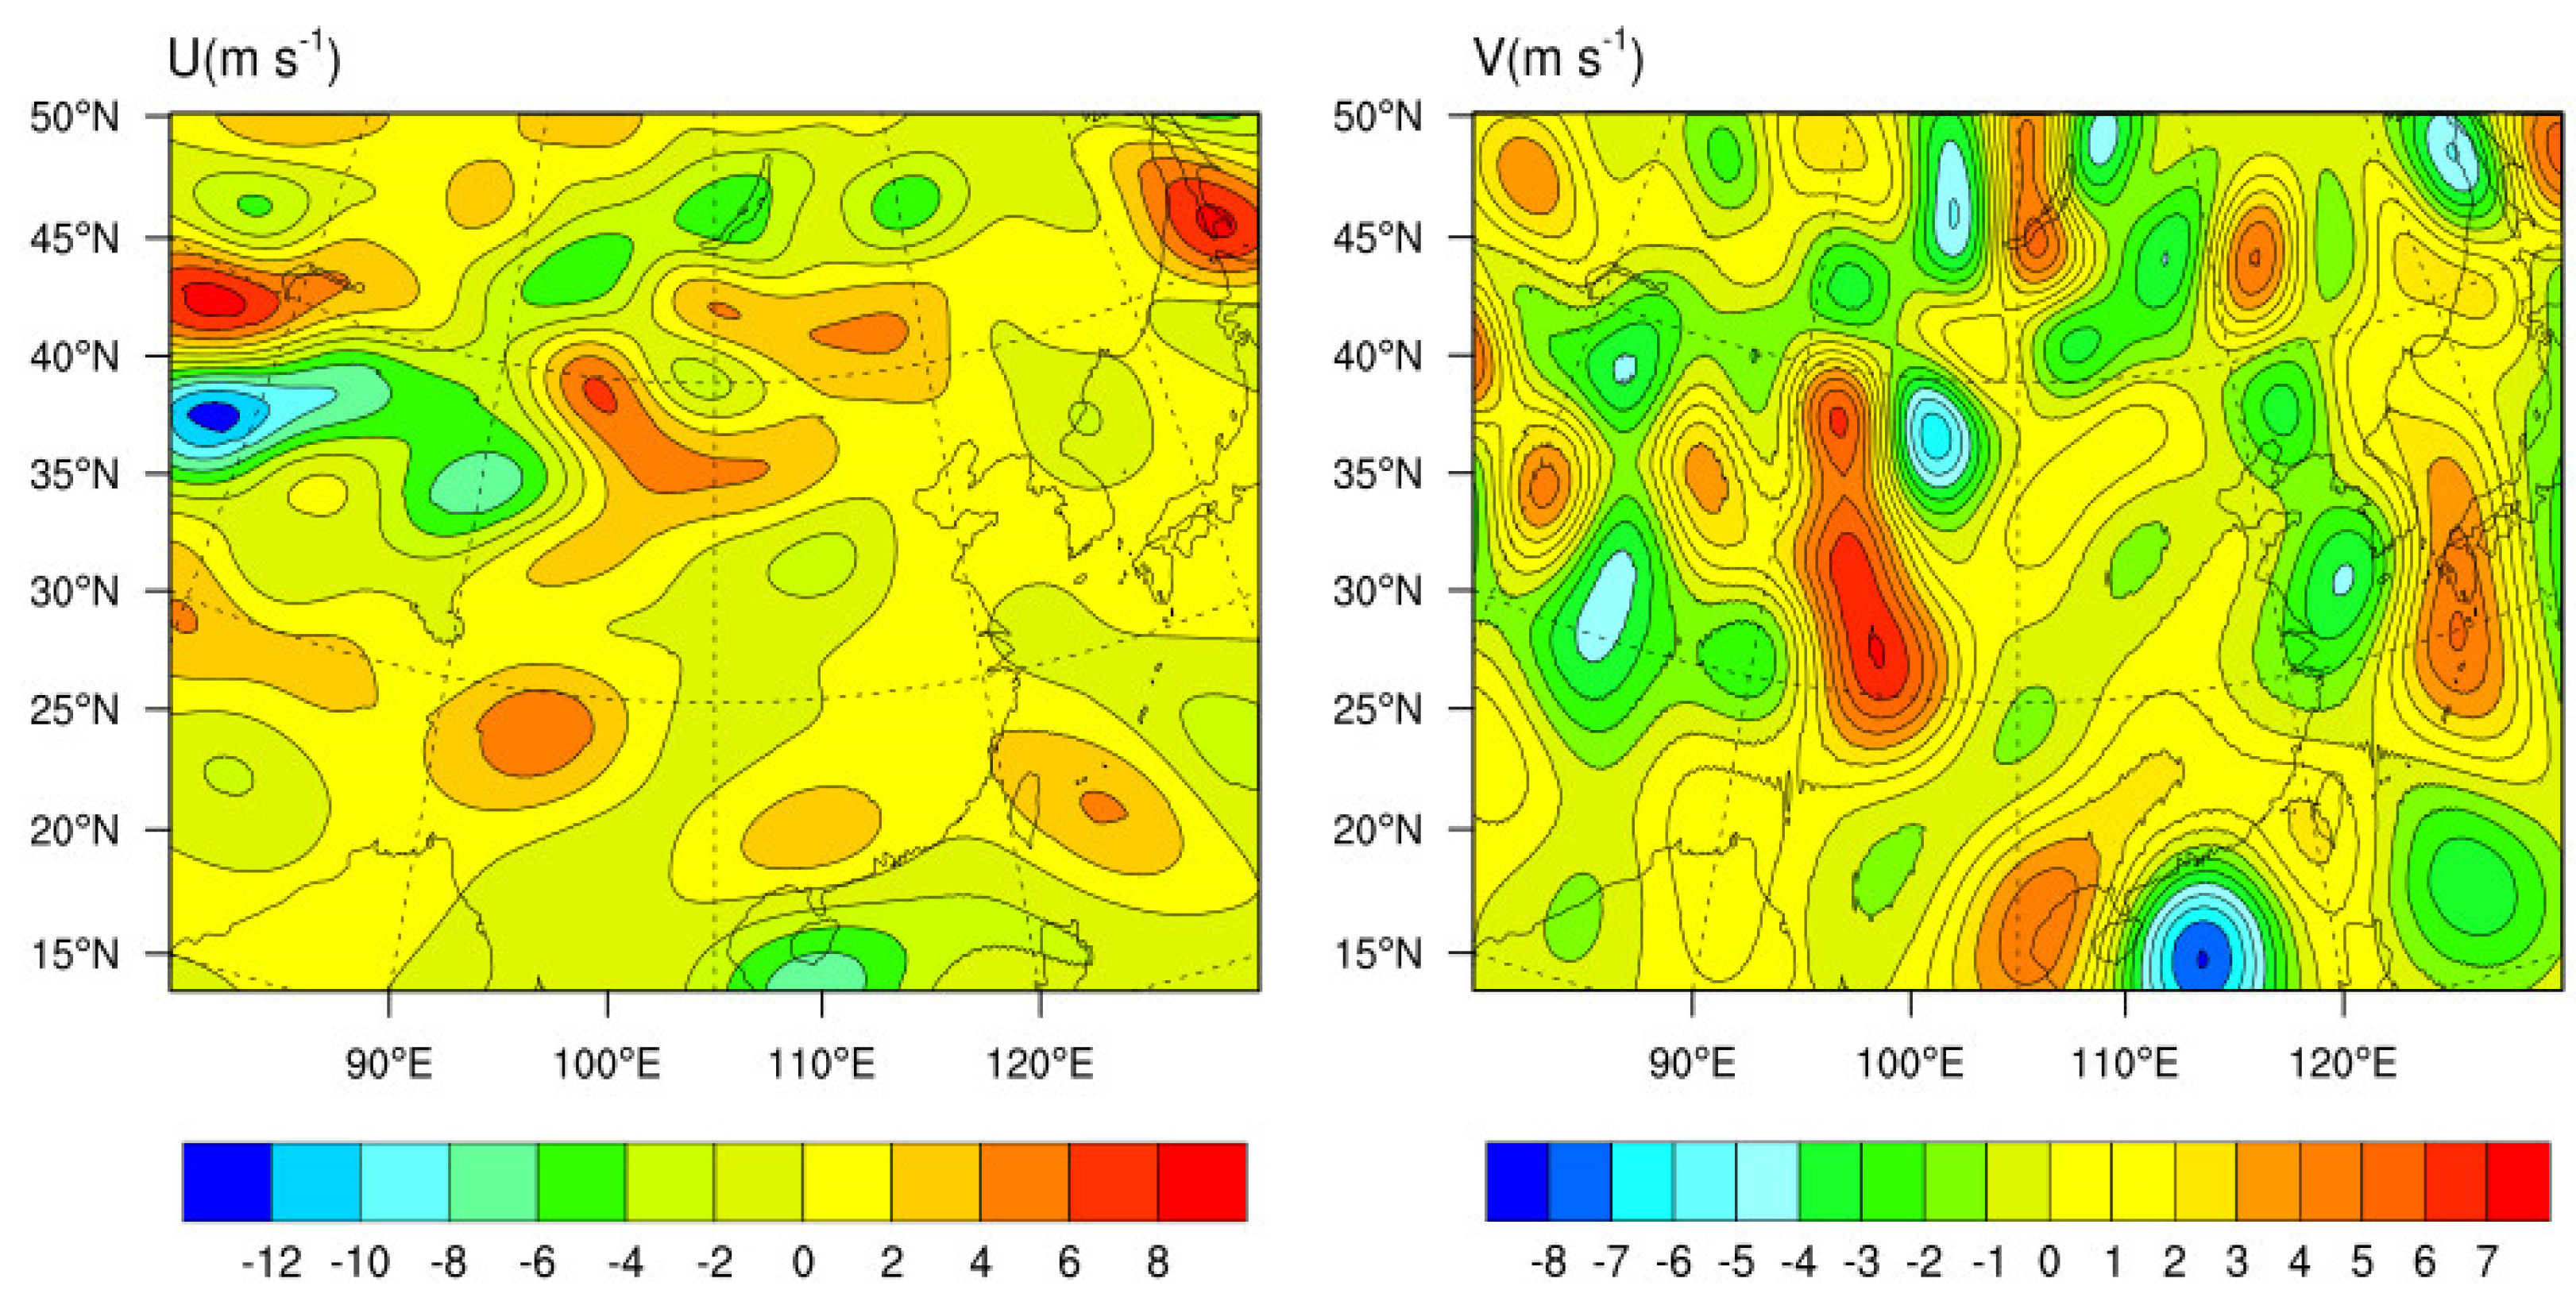
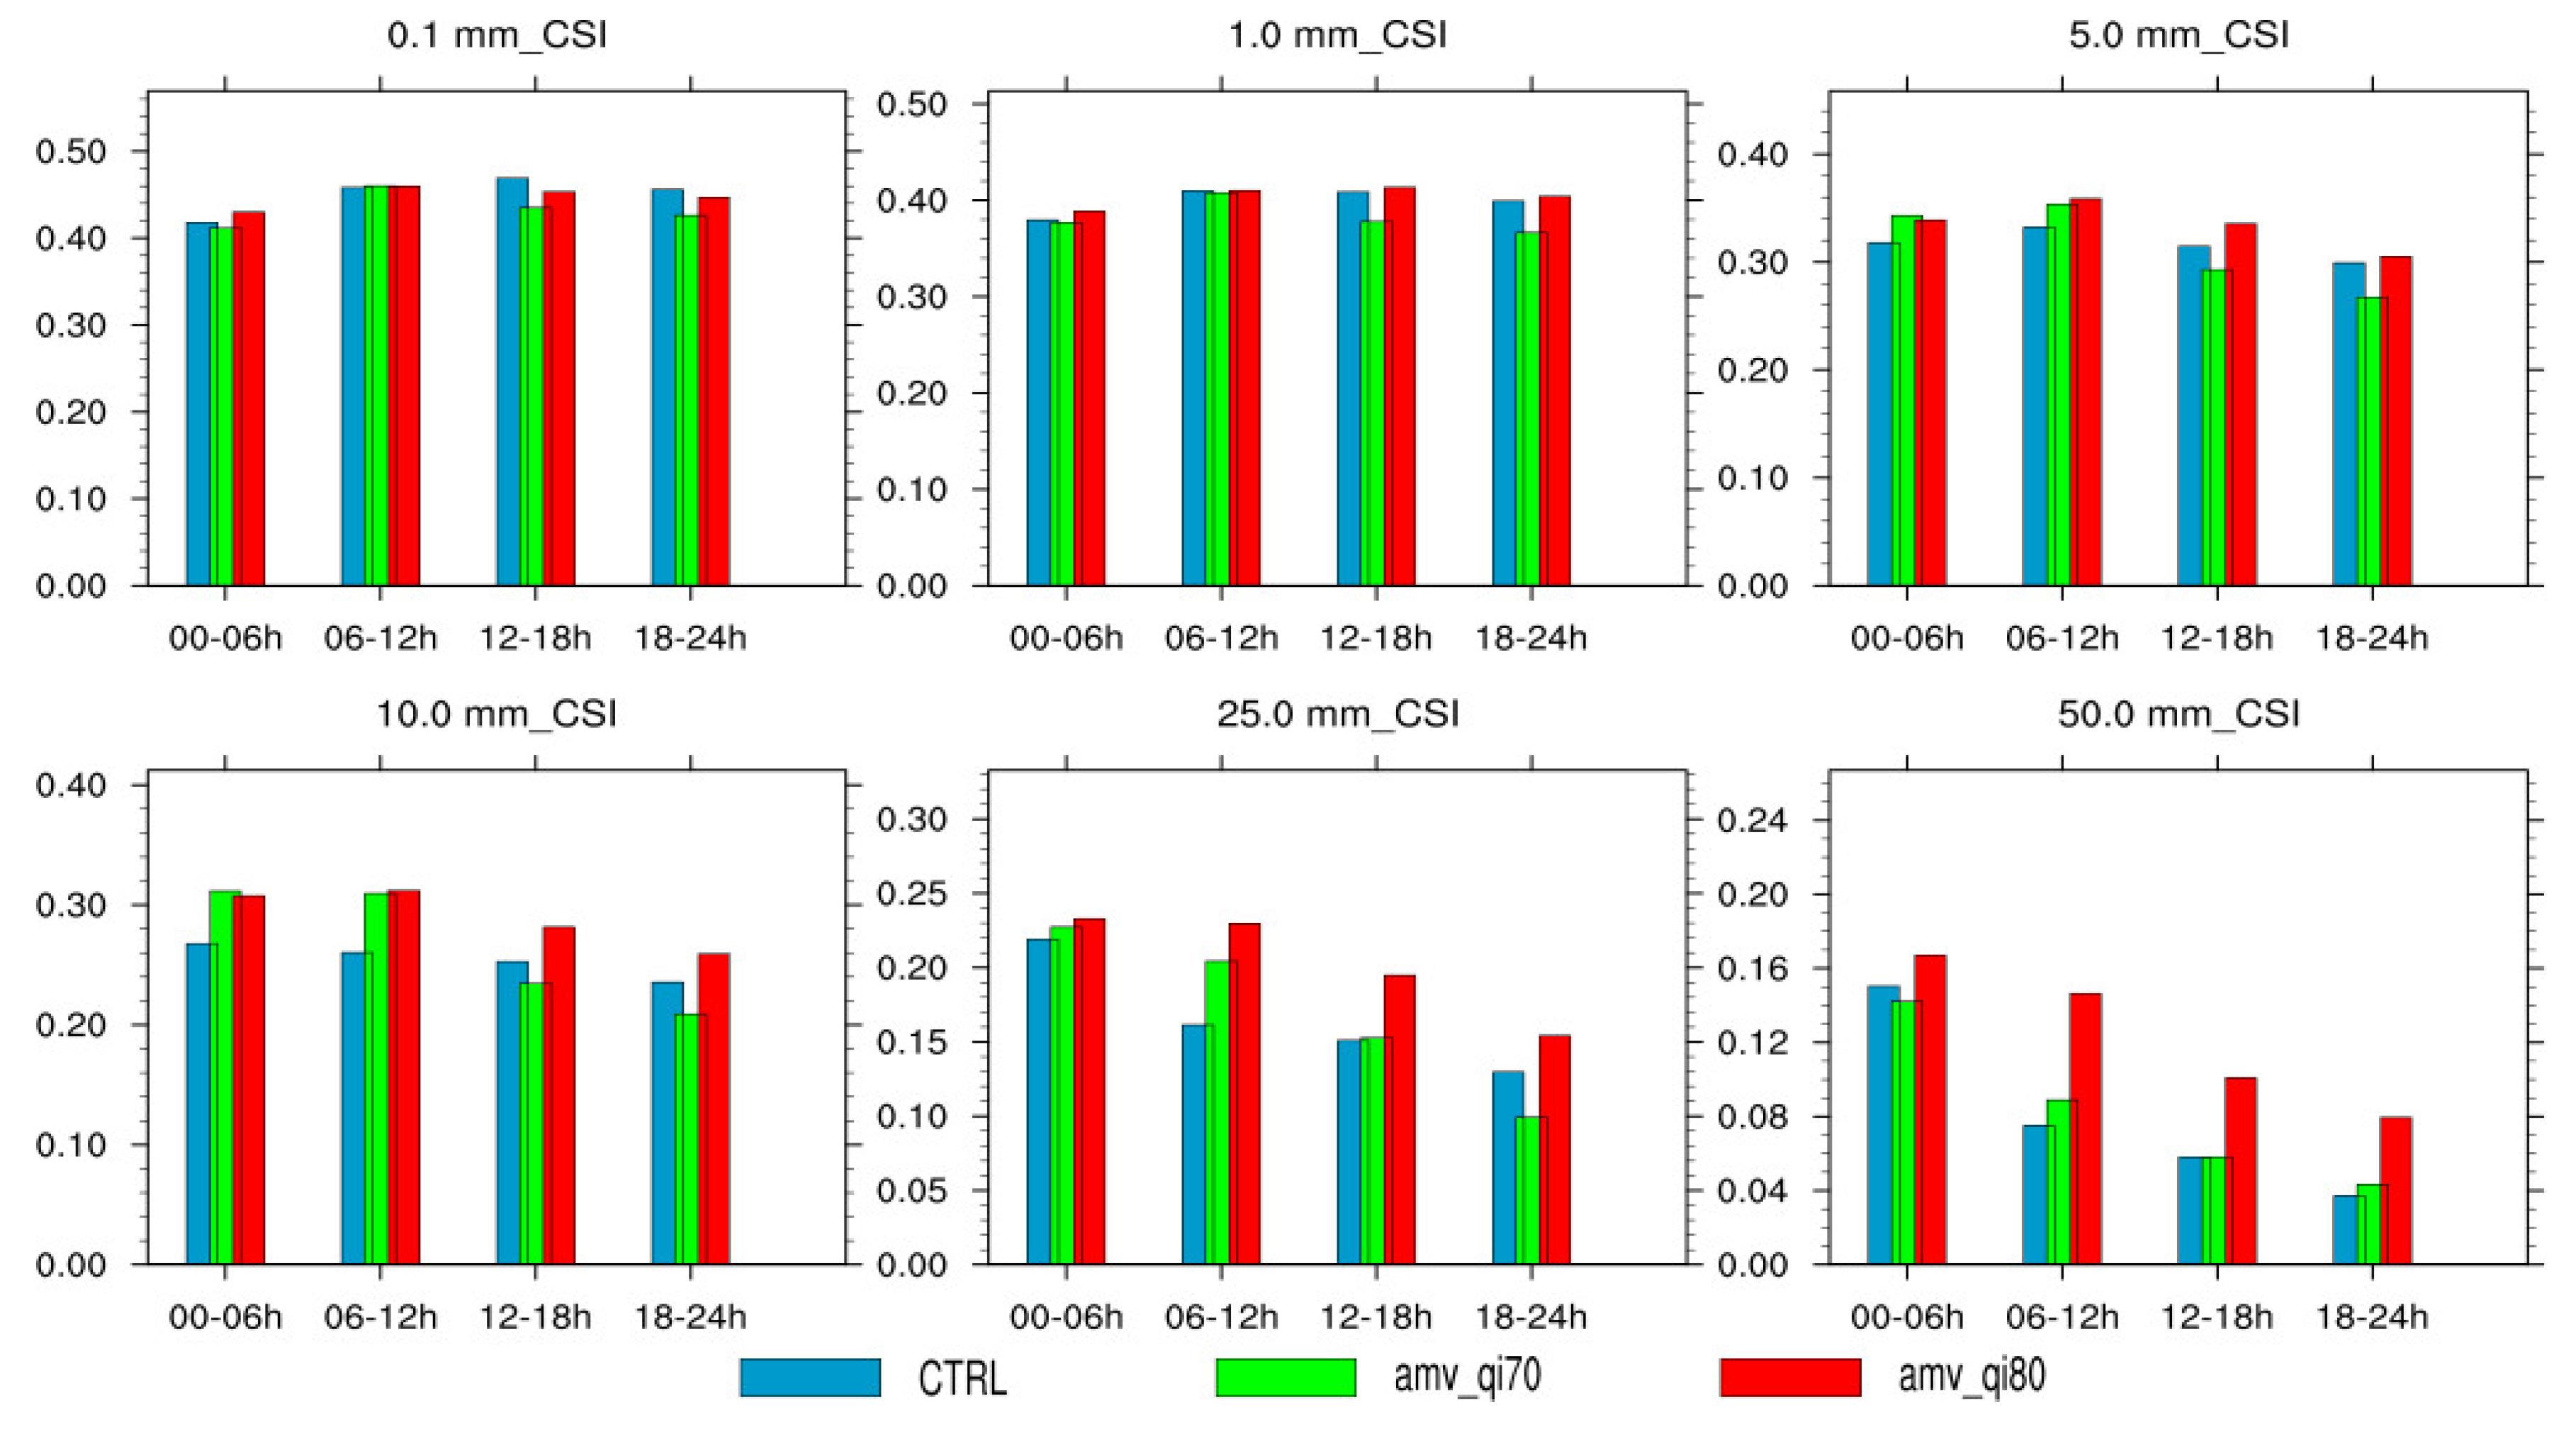
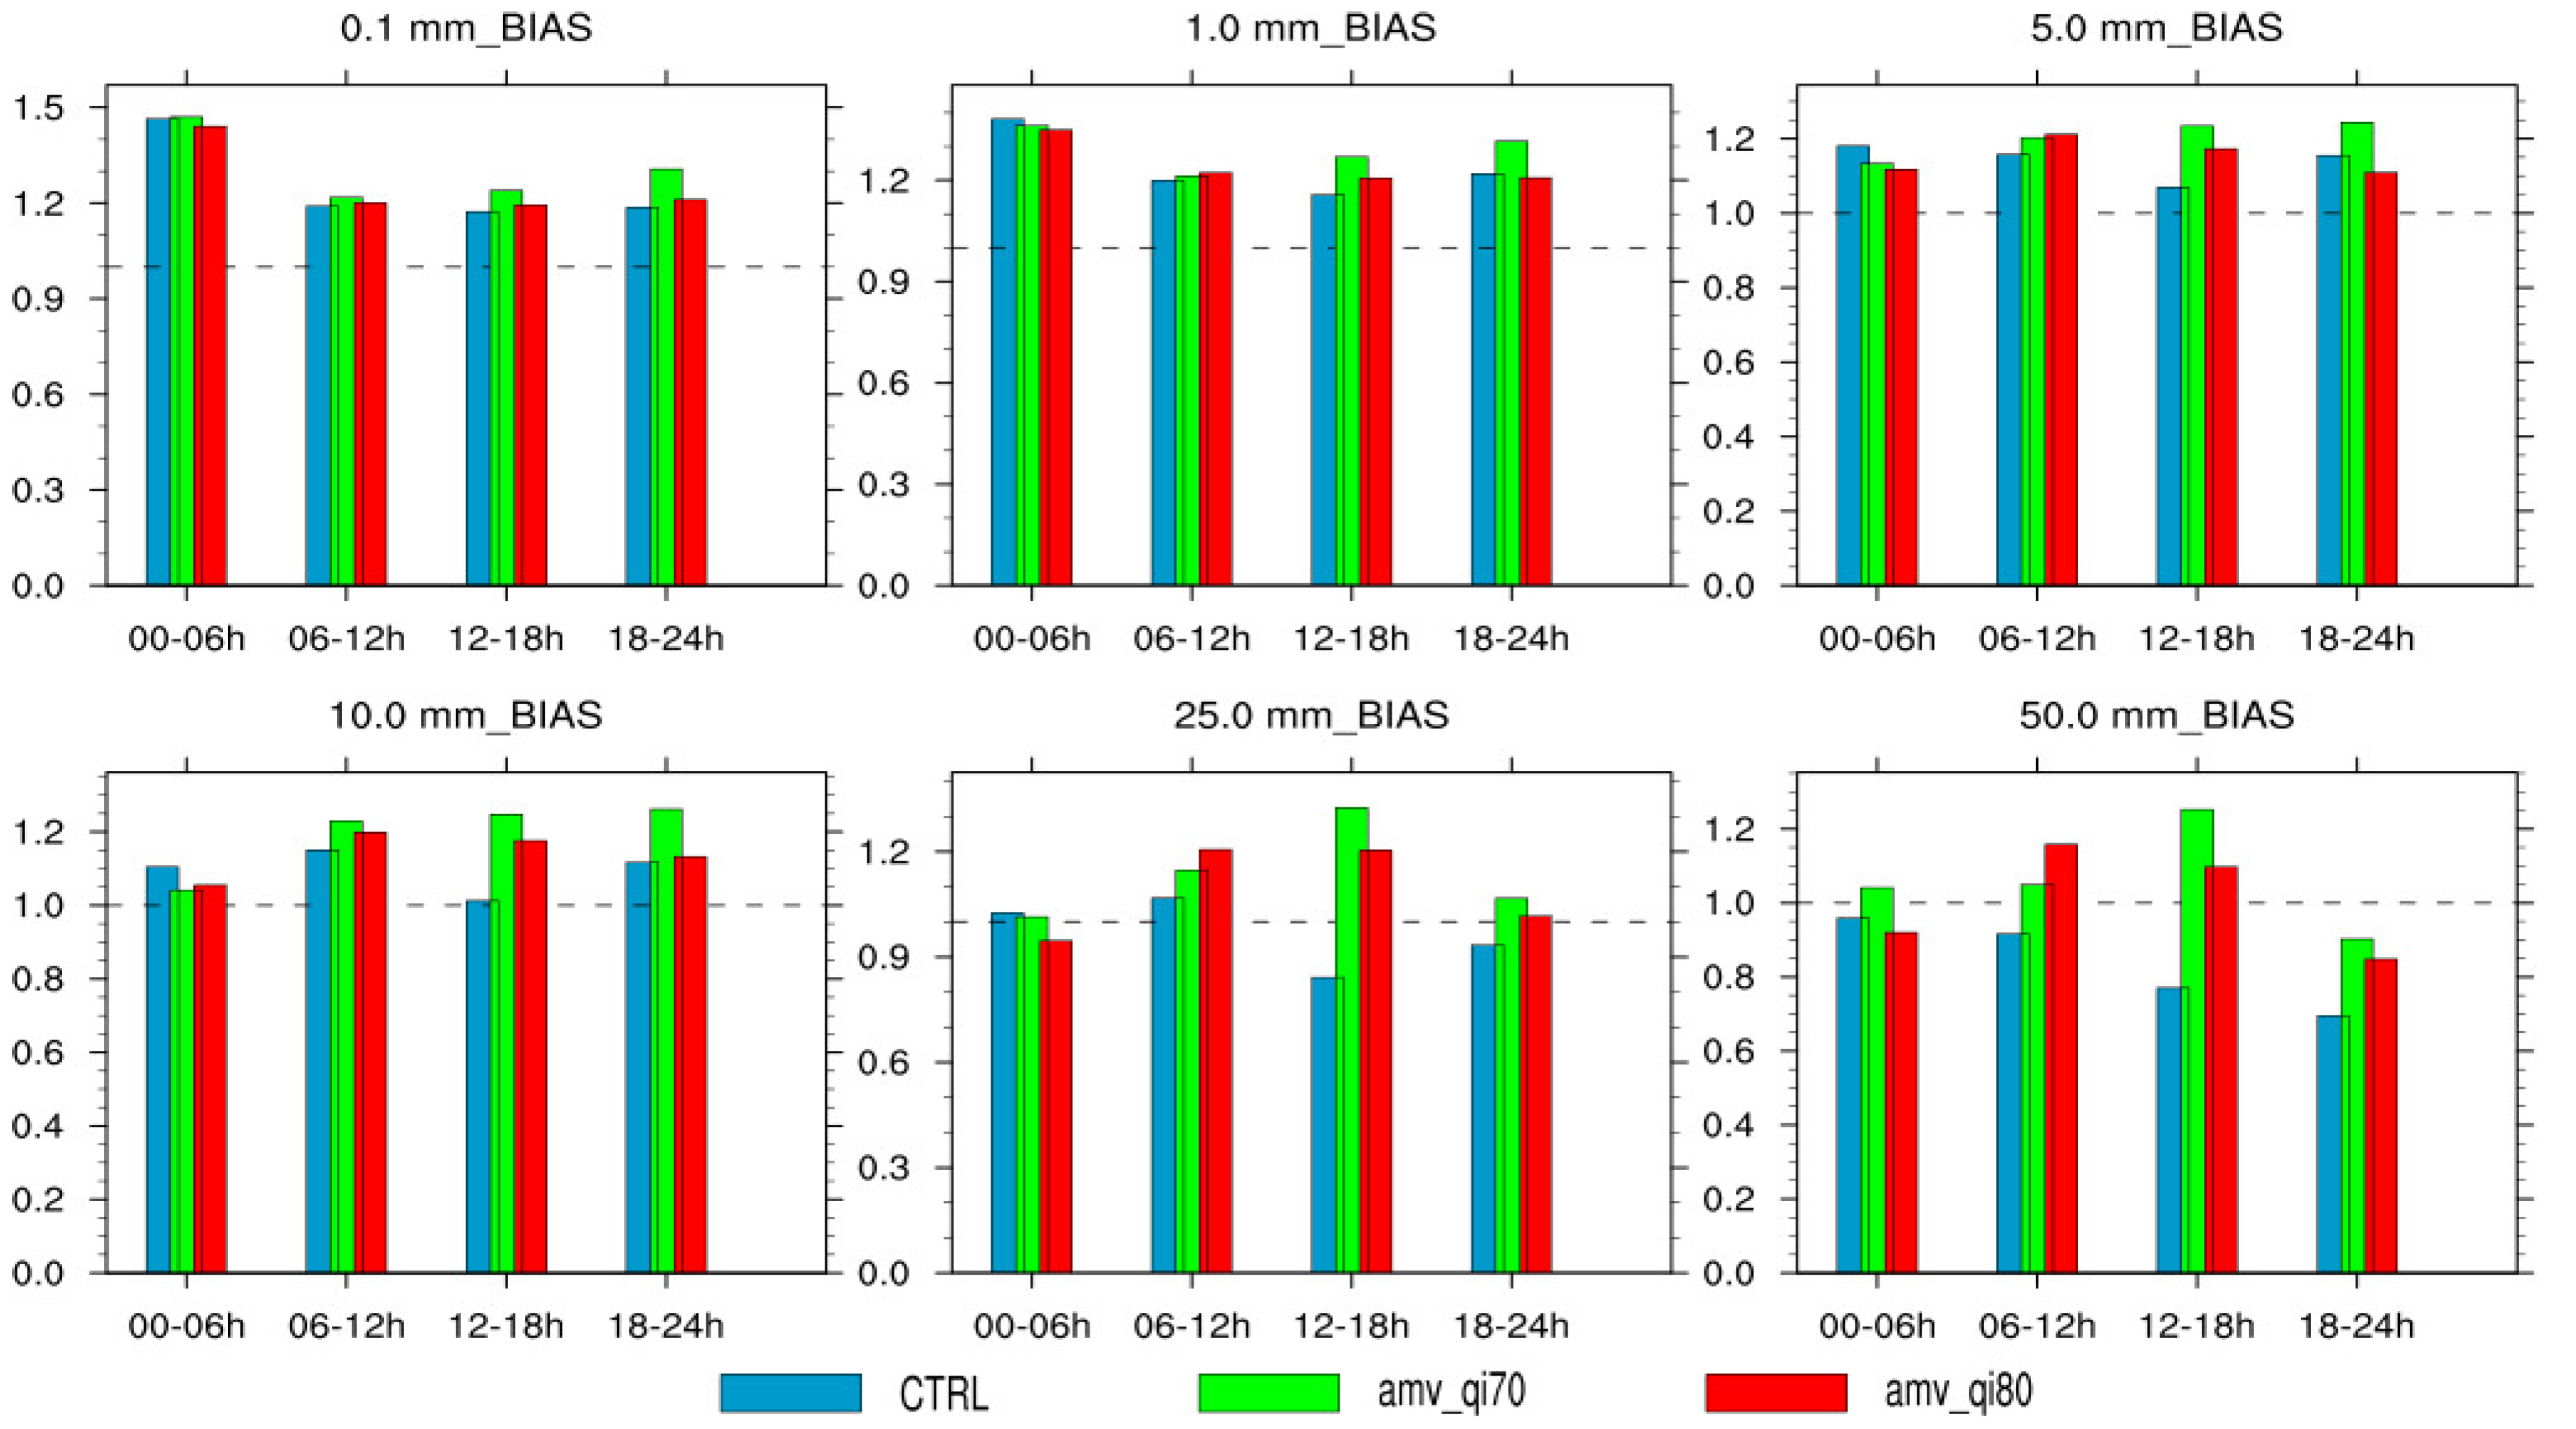
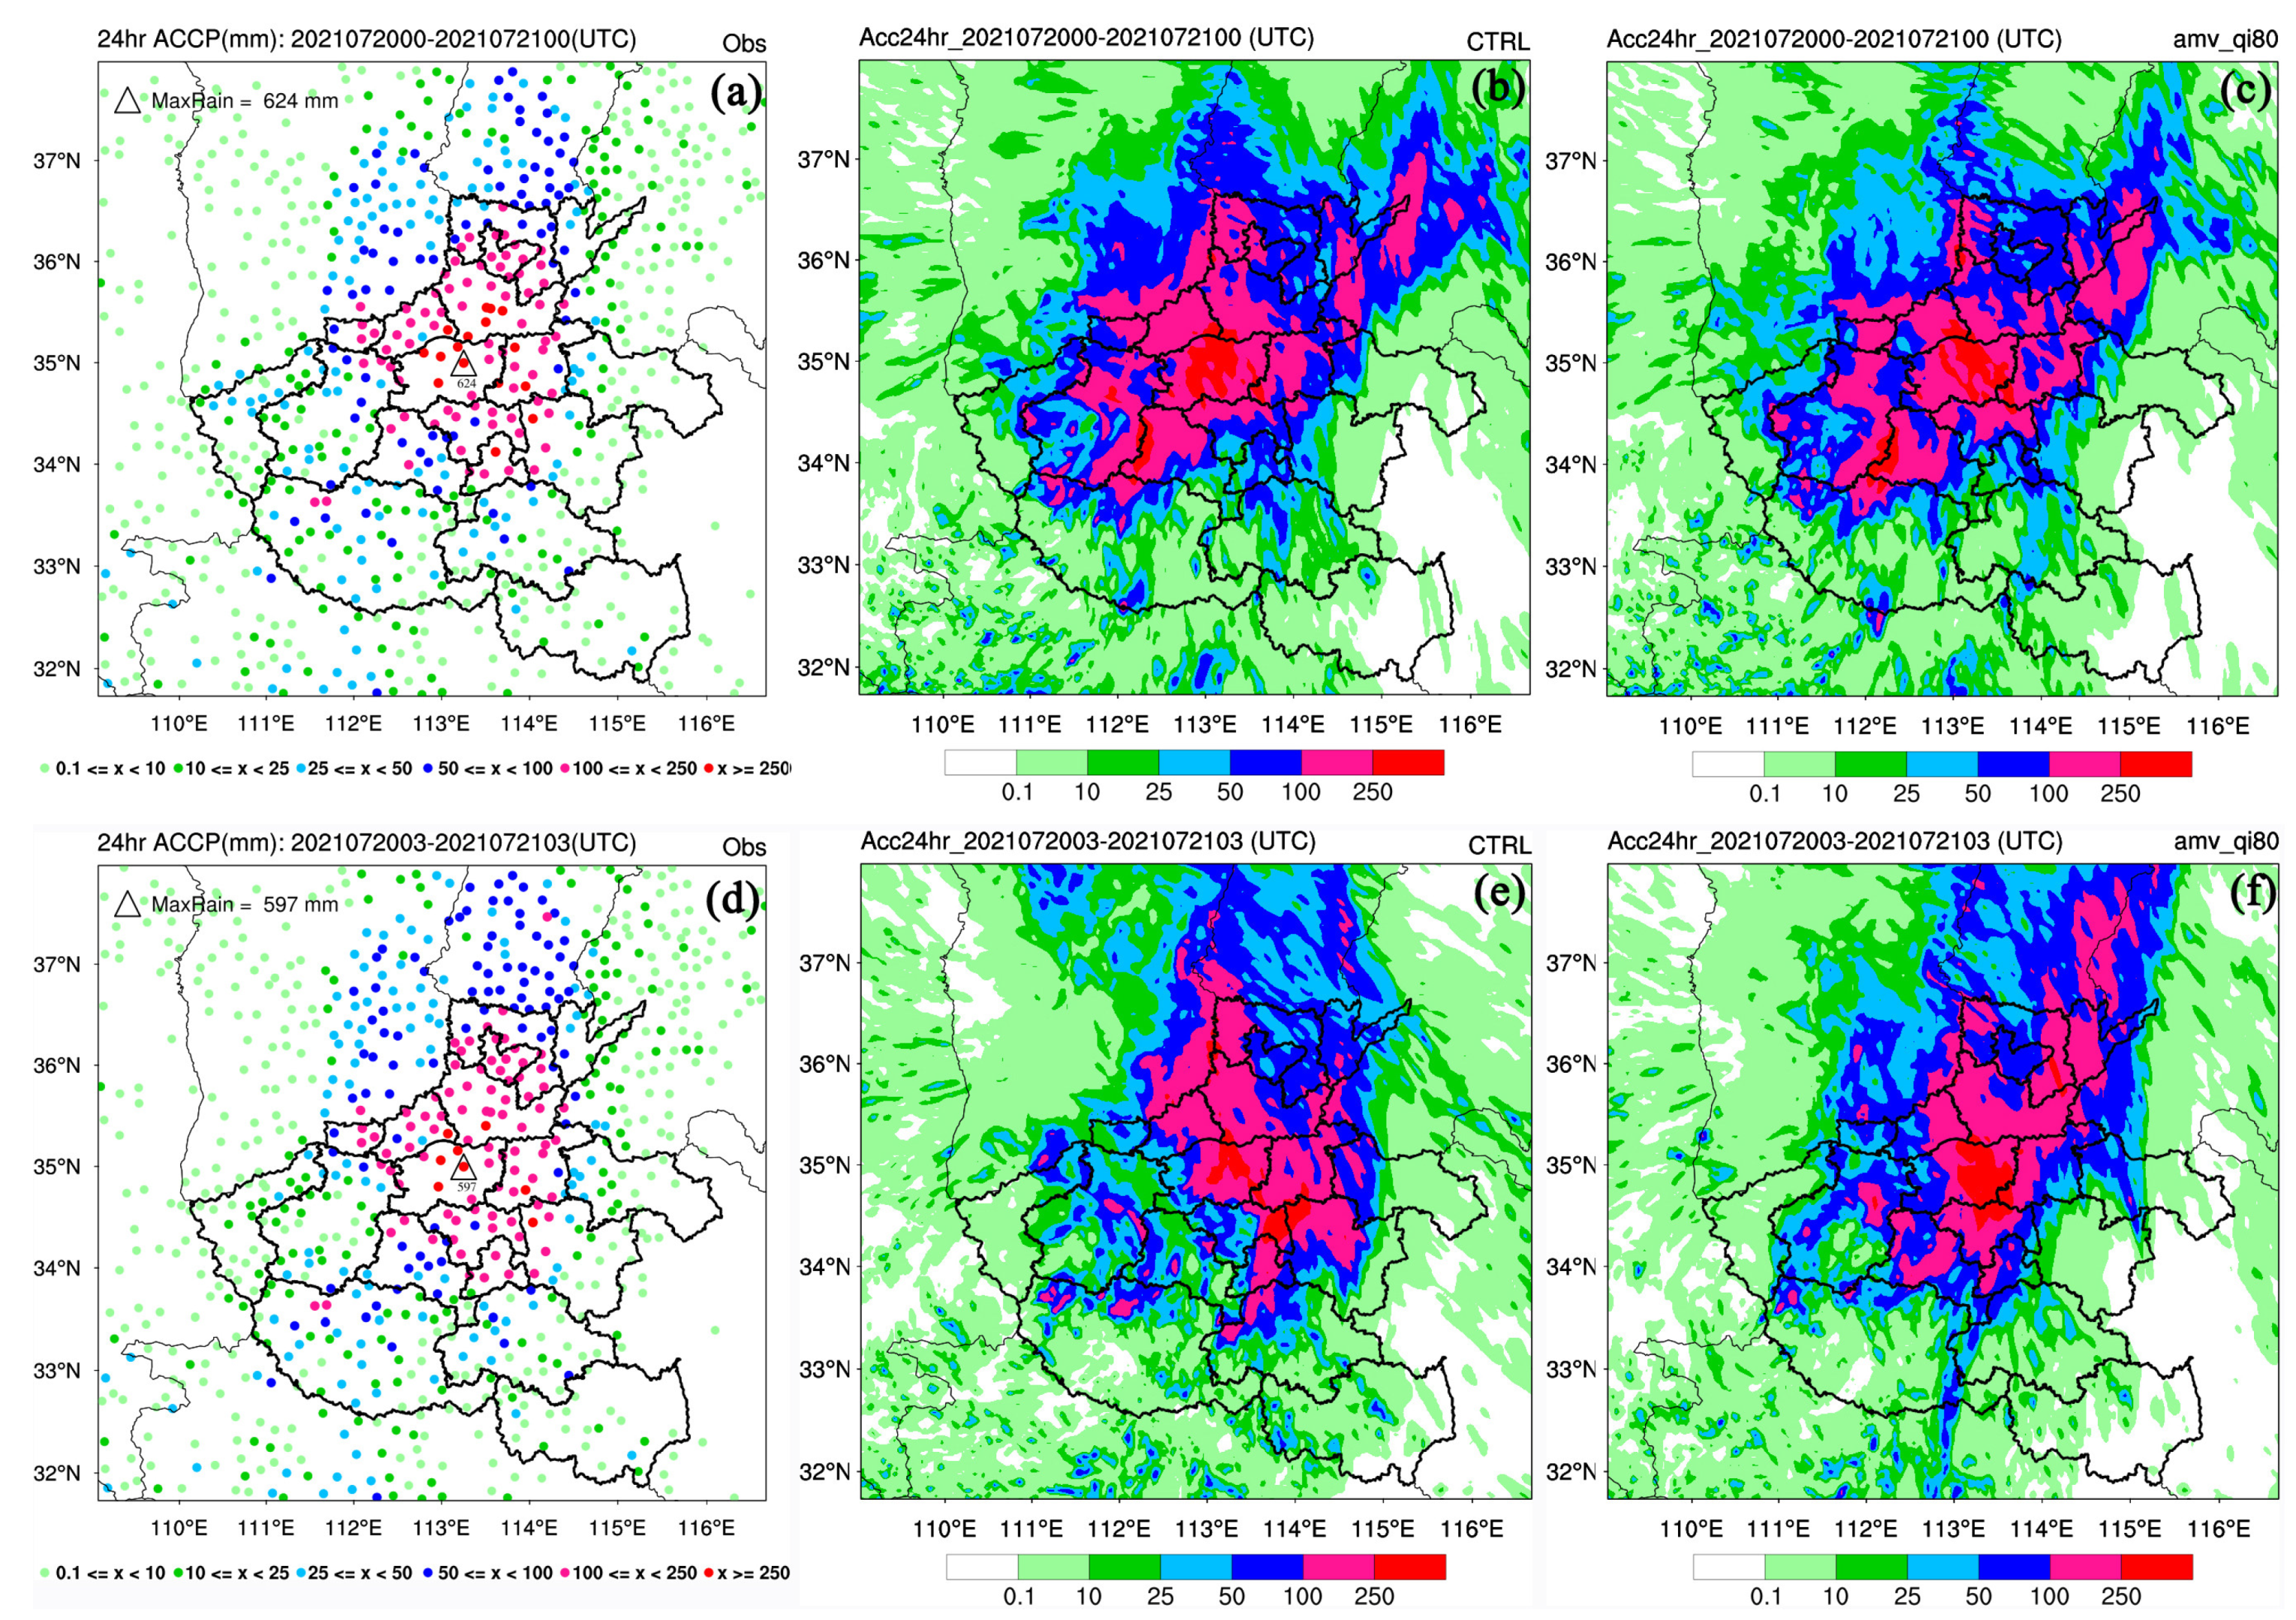
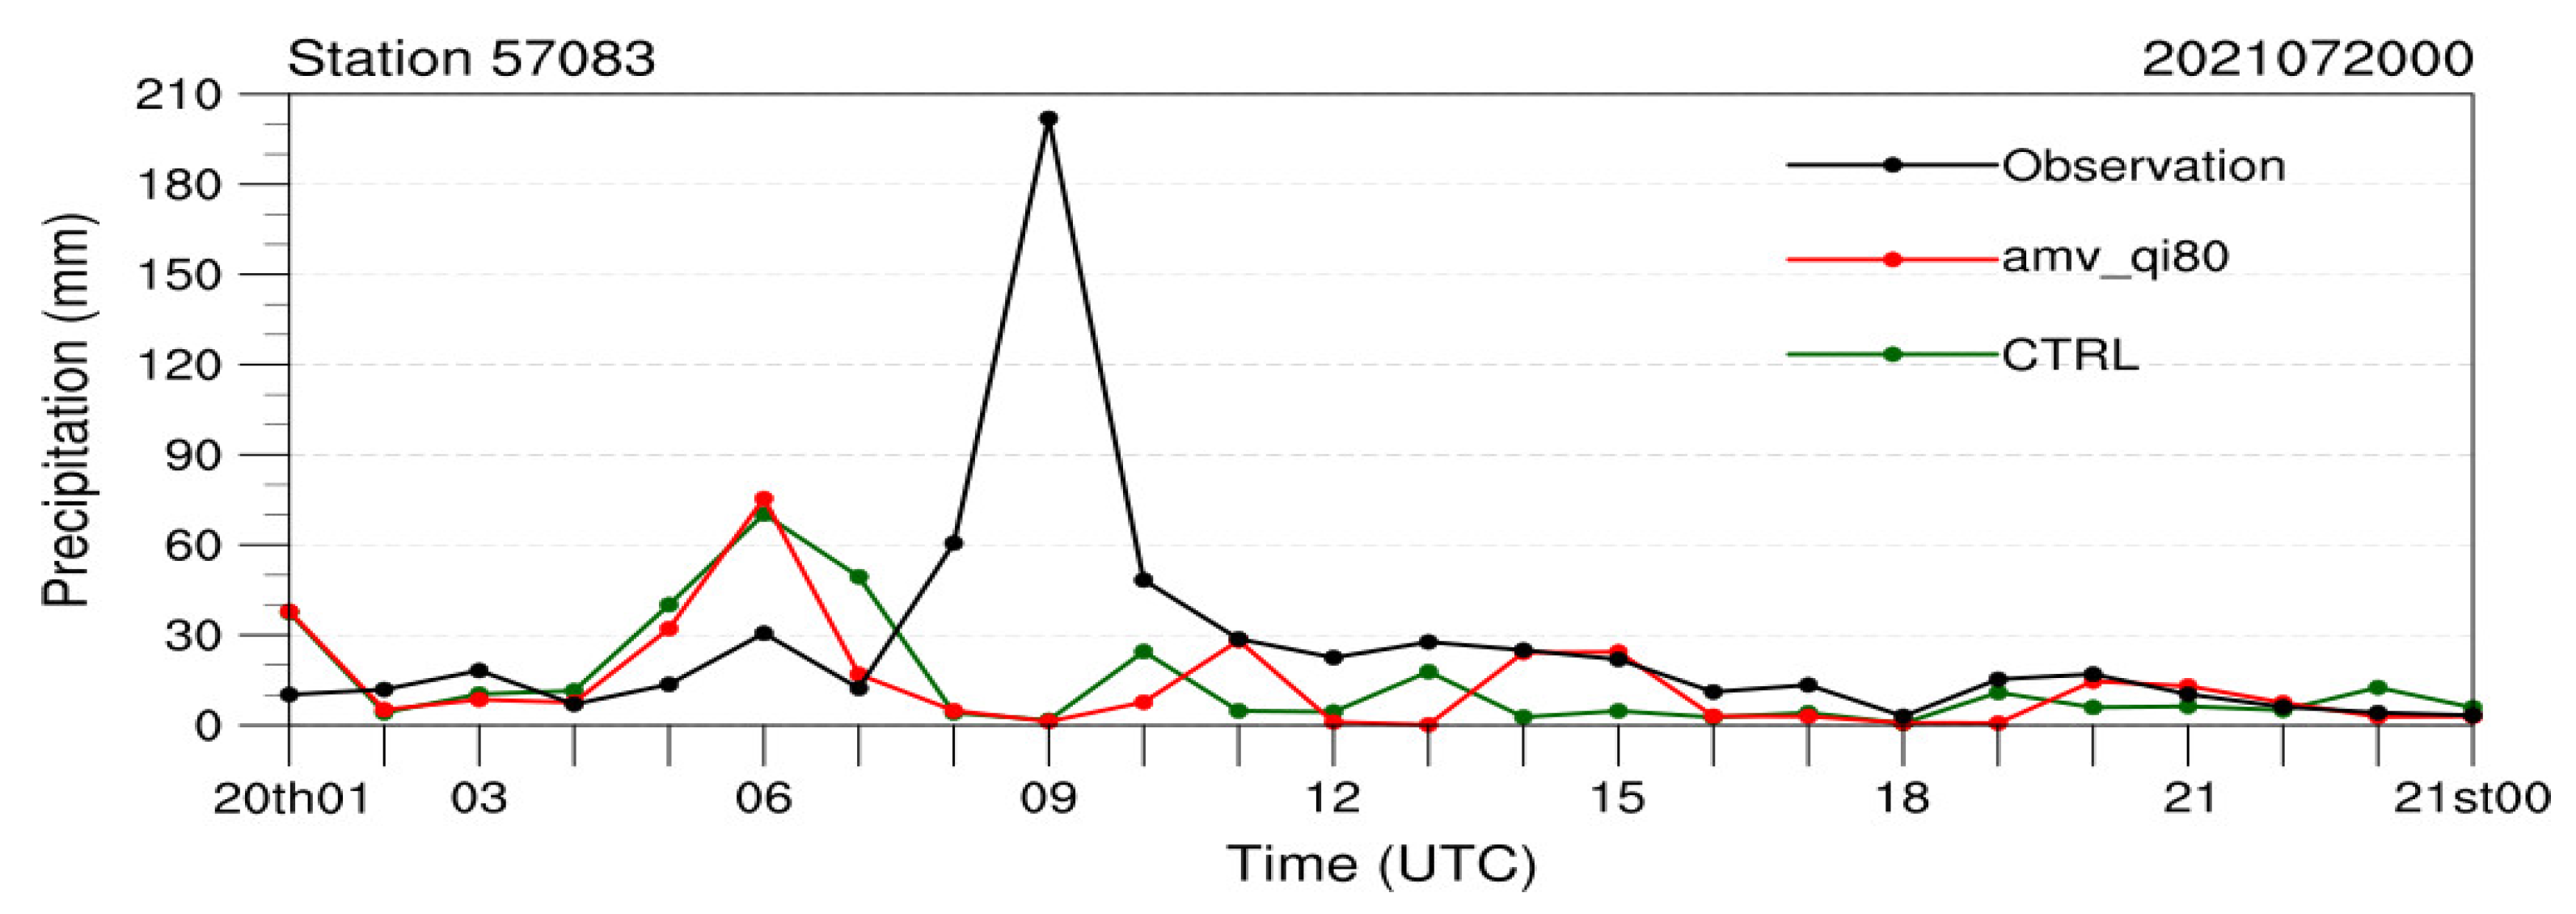
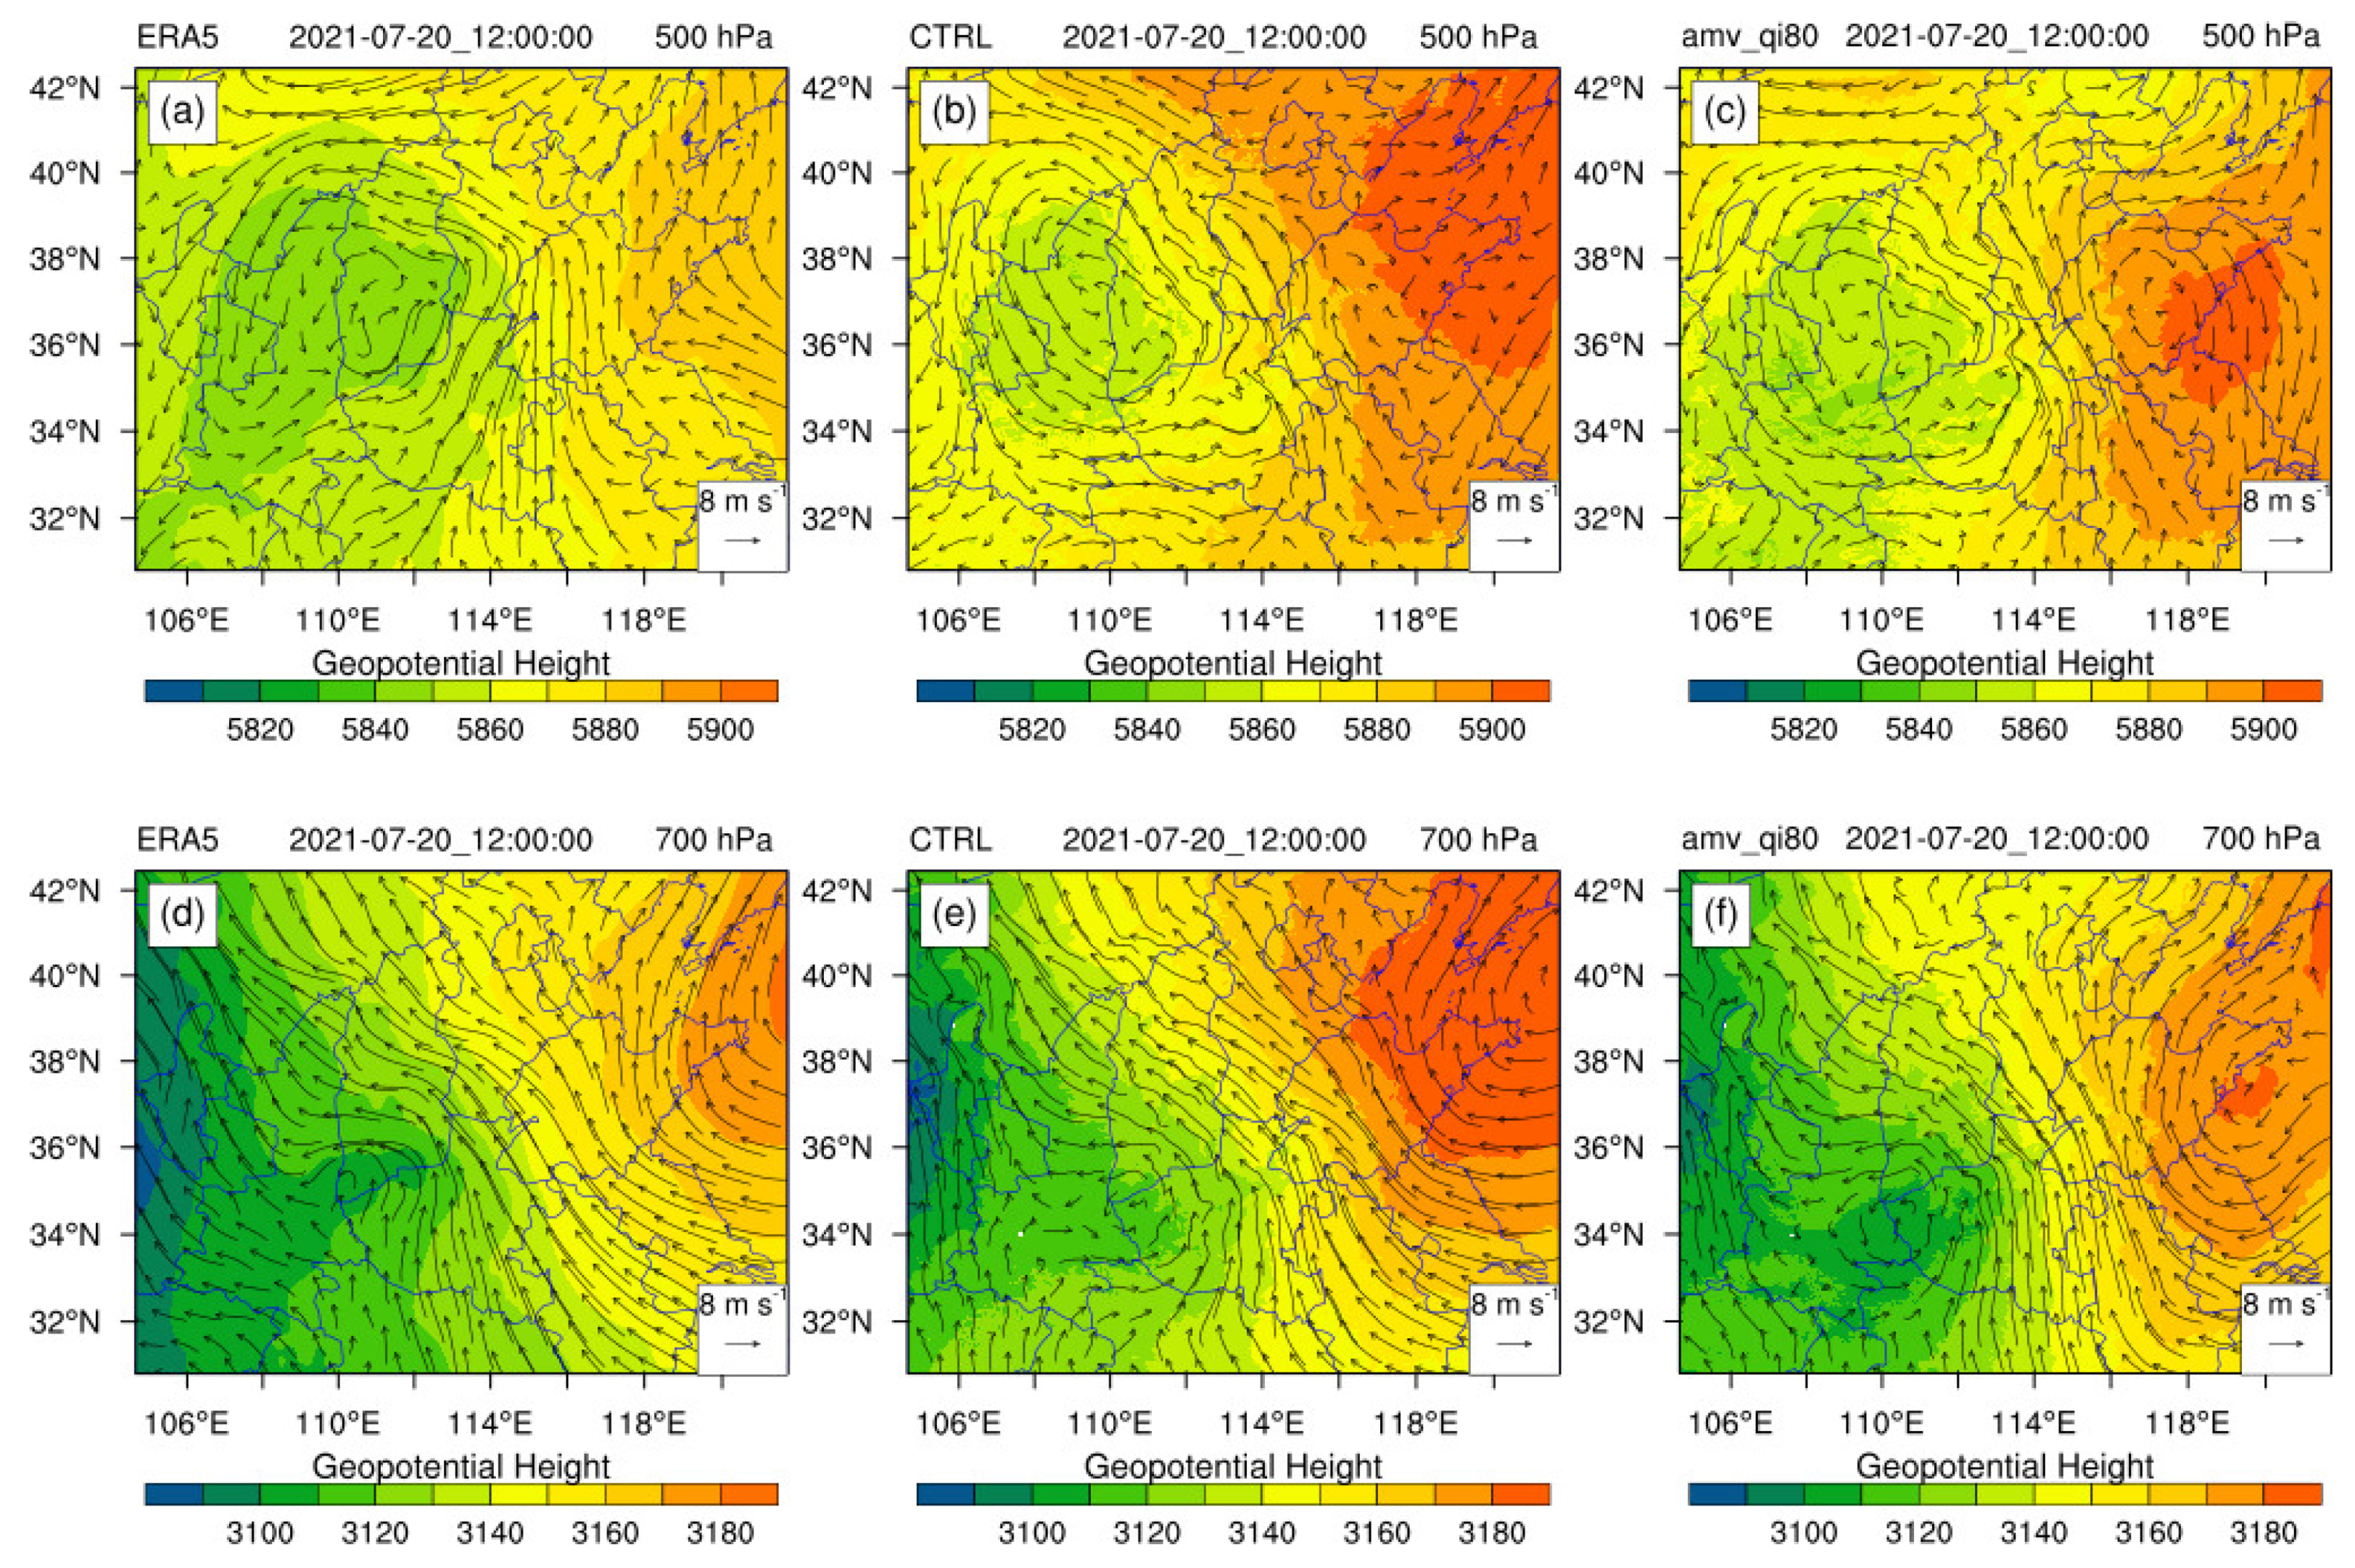
3.3. Impacts on Rainstorm Forecast

The impacts of assimilating FY-4A AMV data in the forecasting of the Henan 7.20 rainstorm in 2021 were investigated. The forecasting results from three groups of assimilation experiments, including the CTRL, amv_qi70 and amv_qi80, were compared and evaluated against the observations.
Figure 7 gives the bias and RMSE of the forecasted U and V wind averaged over the 3 km domain from the three groups of experiments over the period of three days from 18 to 20 July 2021, in 3 h cycling runs. At 12 h of the forecast, the bias of the U wind between 400 hPa and 850 hPa was reduced both for the amv_qi70 and amv_qi80 experiments compared with that of the CTRL. The RMSE of the U wind between 200 hPa and 400 hPa also decreased in the amv_qi80. Below 500 hPa, the RMSE value of the amv_qi80 was a little smaller than that of the amv_qi70, but still larger than that of the CTRL. The bias of the V wind experienced an increase in both the amv_qi70 and the amv_80, except for at the levels of 100 hPa and 850 hPa. The corresponding RMSE was reduced between 200 hPa and 300 hPa in the amv_qi80, and only at 300 hPa in the amv_qi70. At 24 h of the forecast, there was an obvious decrease in the bias of the U wind below 400 hPa for both the two experiments. The corresponding RMSE was also reduced below 200 hPa, except for the level of 850 hPa. The bias and the RMSE of the U wind from the amv_qi80 were a little larger than those of the amv_qi70 on the middle levels and the low level of 925 hPa. For the corresponding V wind, the bias and the RMSE experienced a reduction above 300 hPa in both the amv_qi80 and amv_qi70 experiments. The RMSE values of the V wind in the amv_qi80 were a little smaller than those of the amv_qi70 below 400 hPa. In the forecast range of 0–24 h, assimilating the FY-4A AMV data produced an improvement in the RMSE of the forecasted U and V wind on the upper levels between 200 hPa and 300 hPa. Compared with the CTRL, a greater improvement could be obtained in the error of the U wind than that of the V wind.
Figure 8 gives the bias and RMSE of the 10 m wind averaged over the 3 km domain from the three experiments of the CTRL, amv_qi70 and amv_qi80. It can be seen that the bias and the RMSE in the three experiments varied with the forecast time. At the start of the forecast, there was a small difference in the bias and RMSE for the three experiments. The bias and the RMSE experienced a small increase in the first 3 h of the forecast and then decreased with the forecast time. In comparison with the CTRL, there was an overall reduction in the bias for both the amv_qi70 and amv_qi80 in the forecast range of 0–24 h. A similar improvement appeared in the RMSE of the amv_qi70. The RMSE of the amv_qi80 also reduced, but experienced a small increase at hours 3 and 13 of the forecast. The bias and RMSE values of the amv_qi80 were both slightly larger than that of the amv_qi70.
For the rainfall, the CSI and BIAS score skills were used to evaluate the quantitative precipitation forecast (QPF). Figure 9 presents the CSI scores of the 6 h accumulated precipitation over the 3 km domain from the three experiments of the CTRL, amv_70 and amv_80 for different thresholds. For the thresholds of 0.1 mm and 1.0 mm, the CSI scores of the amv_qi70 and the amv_qi80 were equivalent to that of the CTRL in the first 12 h of the forecast. After 12 h, the CSI values of the amv_qi70 were lower than that of the CTRL and the amv_qi80. For the thresholds of 5.0 mm and 10.0 mm, the CSI scores of the amv_qi80 were all higher than that of the CTRL in the forecast range of 0–24 h. The CSI values of the amv_qi70 were similar to that of the amv_qi80 in the first 12 h of the forecast, but lower than that of the CTRL after 12 h of the forecast. For the thresholds of 25.0 mm and 50.0 mm, there was an obvious increase in the CSI scores of the amv_qi80 in the 24 h forecast compared with the CTRL, especially for the heavy rainfall above 50.0 mm. A significant improvement appeared after 6 h of the forecast. In comparison with the CTRL, the CSI scores of the amv_qi70 also increased slightly for the threshold of 25.0 mm in the first 18 h of the forecast, but decreased after 18 h. An improvement could also be found in the CSI scores of the amv_qi70 for the heavy rainfall above 50.0 mm after 6 h of the forecast, but was much smaller than that of the amv_qi80. The assimilation of FY-4A AMVs with a QI > 70 improved the CSI score skills mainly in the first 12 h of the forecast. Assimilating the AMVs with a QI > 80 had an overall positive impact on the forecasted rainfall above 1.0 mm in the 24 h forecast.
Figure 10 depicts the corresponding BIAS scores of the 6 h accumulated precipitation from the three experiments for the different thresholds. It can be seen that the BIAS scores were all greater than 1.0 for the thresholds of 0.1 mm, 1.0 mm, 5.0 mm and 10.0 mm in the three experiments, which indicates an over-prediction for the rainfall below 10.0 mm. The BIAS values of the amv_qi80 were closer to 1.0 than that of the amv_qi70, which means a smaller overestimate in the amv_qi80. For the threshold of 25.0 mm, the BIAS values were closer to 1.0 in the CTRL and the amv_qi70 experiments for the first 6 h of the forecast, and lower than 1.0 in the amv_qi80, meaning a slight under-prediction. After 6 h, there was also an over-prediction for the amv_qi70 and the amv_qi80. The BIAS scores of the CTRL were less than 1.0 after 12 h in the forecast, indicating an under-prediction. For the threshold of 50.0 mm, the BIAS values of the CTRL were all lower than 1.0 in the 24 h forecast, producing an overall under-prediction. The amv_qi70 provided an over-prediction in the first 18 h of the forecast and an under-prediction after 18 h. For the amv_qi80 experiment, there was an over-prediction in the 6–18 h of the forecast and a slight under-prediction before hour 6 and after hour 18. Assimilating the FY-4A AMV data caused an over-estimation in the rainfall forecast in the Henan rainstorm for most of the forecast, which corresponded to the higher CSI scores.
Figure 9. The CSI score of 6 h accumulated precipitation over the 3 km domain from the three experiments of the CTRL, amv_qi70 and amv_qi80 for the thresholds of 0.1 mm, 1.0 mm, 5.0 mm, 10.0 mm, 25.0 mm and 50.0 mm.
Remotesensing 14 05637 g009
Figure 10. The BIAS score of 6 h accumulated precipitation over the 3 km domain from the three experiments of the CTRL, amv_qi70 and amv_qi80 for the thresholds of 0.1 mm, 1.0 mm, 5.0 mm, 10.0 mm, 25.0 mm and 50.0 mm.
Remotesensing 14 05637 g010
Figure 11 presents the spatial distribution of the 24 h accumulated precipitation around the center of heavy rainfall from the observations, the CTRL and the amv_qi80 starting from 00 UTC and 03 UTC 20 July 2021, respectively. The rainfall observation showed that the center of heavy rainfall was mainly located in the northern part of Henan province. The zone of heavy rainfall moved slightly to the north from 00 UTC to 03 UTC. The maximum rainfall in 24 h reached 624 mm on 20 July 2021. For the forecast starting at 00 UTC, the location of heavy rainfall above 250 mm was predicted successfully in both the experiments, namely, the CTRL and amv_qi80, although there was an over-estimation in the southwest. In comparison with the CTRL, the over-estimation in the northwest and northeast of the strong rainfall center was improved in the amv_qi80. For the forecast starting at 03 UTC, there was an under-estimation in the southwest and northeast of the rainstorm center in the CTRL. For the amv_qi80 experiment, the spatial distribution of the heavy rainfall zone was more similar to the observations showing a southwest-to-northeast pattern, although there was also an over-prediction in the northeast.
In the Henan 7.20 rainstorm event, the station 57083 located at 34.72°N and 113.65°E recorded the maximum value of 24 h accumulated rainfall of 624 mm on 20 July 2021. Figure 12 presents the variation in the hourly precipitation from the observations, the CTRL and the amv_qi80 at the location of station 57083 on 20 July 2021. It shows that the hourly maximum rainfall of the observations happened at 09 UTC on 20 July 2021, reaching 201.9 mm. In the CTRL and the amv_qi80 experiments, the maximum rainfall occurred at 06 UTC and the maximum values were both about 75 mm, which was much smaller than the maximum in the observations. In the first 6 h of the forecast, the rainfall of the amv_qi80 was similar to that of the CTRL. After 11 h, the rainfall in the amv_qi80 was closer to the observations for most of the time compared with that of the CTRL.

4. Discussion

The results suggest that the FY-4A AMV data assimilation reduced the error of the wind fields on the upper levels during the forecasting of the Henan 7.20 extreme rainfall event. The bias of the 10 m wind experienced an overall reduction in the 24 h forecast. A great improvement could also be obtained in the scores skills of the forecast rainfall with the FY-4A AMV data, especially for heavy rainfall; however, the intensity and the time of the hourly maximum rainfall still could not be captured well. To explore the impact of FY-4A AMV data on the forecasting of this Henan 7.20 rainstorm, further investigation was performed, and the accuracy of the results is discussed in this section.
Figure 13 presents the cross sections of the wind field and relative humidity along 34.72°N from the first guess, the analysis and their difference in the experiment of the amv_qi80 at 00 UTC 20 July 2021. In the first guess, a strong southeast wind appeared on 850 hPa near 113.6°E, which was the center of the extreme rainfall, and it became a south wind above 850 hPa. In the analysis, the strong wind was similar to that of the first guess but moved slightly to the east. The difference shows that the north wind in the west and the south wind in the east of the heavy rainfall center were strengthened between 400 hPa and 850 hPa. That is, the southerly wind field was weakened in the west and strengthened in the east with the assimilation of the FY-4A AMV data. Regarding the humidity, there was a small increase in the west and a decrease in the east of the heavy rainfall center between 400 hPa and 700 hPa. The humidity experienced a slight decrease below 850 hPa and an increase above 400 hPa. This means that the change in the initial wind field also brought about a small corresponding change in the humidity. These adjustments in the initial fields resulting from the FY-4A AMVs led to a certain impact on the spatial distribution of the forecasted heavy rainfall, and an improvement was consequently obtained in the score skills of the QPF.
Figure 14 presents the wind fields and geopotential heights of 500 hPa and 700 hPa at 12 h of the forecasts from the CTRL and the amv_qi80 experiments initialized at 00 UTC 20 July 2021. The corresponding fields from the ERA5 re-analysis data were also used for comparison. For the level of 500 hPa, there was an easterly wind in the west and a southerly wind in the east between 40°N and 42°N in the ERA5. In the CTRL experiment, the wind was southeast and southwest in the corresponding position. The wind fields from the amv_qi80 were similar to that of the ERA5. Meanwhile, there was a low-pressure system towards the southwest-to-northeast in the ERA5 and an obvious trough appeared near 114°E. In the CTRL and the amv_qi80 experiments, the low-pressure system was towards the southeast-to-northwest due to a change in the wind direction, leading to a different circulation field in the east of the domain. Compared with the CTRL, the high-pressure system in the east of the domain was slightly further south in the amv_qi80. For the level of 700 hPa, a strong low-pressure system was developing in the southwest of the domain. In comparison with the ERA5, the location of the low-pressure system near 112°E was slightly south and the intensity was a little weaker in the CTRL. The pattern and the intensity of the low-pressure system in the amv_qi80 was closer to that of the ERA5, but the location was also slightly further south. In the northeast of the domain, a corresponding high-pressure system could be found, and it was strengthened in the CTRL experiment. The great difference between the amv_qi80 and the CTRL was the pattern of the high-pressure system and the changed circulation fields. In the southeast, the wind field was easterly in the CTRL, but there was a wind shear in the amv_qi80. The adjustment of the initial wind fields resulting from the assimilation of the FY-4A AMV data also produced a certain impact on the circulation fields in the forecasting of the Henan 7.20 rainstorm event.
Although AMV data from the three channels of the FY-4A satellite could reduce the error of wind fields on the upper levels in the forecasting of the Henan 7.20 rainstorm event, the error experienced an increase at the middle and low levels. On the one hand, this was directly related to the quantity and vertical distribution of the AMV data. On the other hand, the number and spatial distribution of the observations used for verification were important factors affecting the evaluation. The accuracy of the forecast results was dependent on the observations used in this study. There were only around 100 sounding observations available over the 9 km domain, meaning that only a small portion of the forecast grid points could be verified. Meanwhile, the results were evaluated based on the method of point-to-point verification. It was inevitable that errors would be introduced in the process of matching the model grid points and observations.
Figure 14. Wind fields and geopotential heights from ERA5 reanalysis data, the CTRL and the amv_qi80 for (a–c) 500 hPa and (d–f) 700 hPa over the 3 km domain, initialized at 00 UTC 20 July 2021.
Remotesensing 14 05637 g014
Additionally, the observational errors of the FY-4A AMV data were not considered in the assimilation experiments. The results indicate a greater improvement in the error of the U wind compared with that of the V wind, which may be related to the observation errors used in the system of the data assimilation.

5. Conclusions

AMV data from China’s new-generation geostationary satellite, FY-4A, can provide potential benefits for the numerical weather prediction in Asia. In this study, the error characteristics of FY-4A AMVs from three channels were analyzed based on the NCEP re-analysis data over one month from 1 to 31 July 2021. FY-4A AMVs with different QI values were used to improve the forecast of the extreme rainstorm event that occurred in Henan province in China from 18 to 20 July 2021. The impact of assimilating FY-4A AMV data on the forecasting of the Henan 7.20 rainstorm was evaluated and investigated.
FY-4A AMV data can provide information about wind fields at the middle and upper levels. There was a similar error characteristic for AMV data derived from the two water vapor channels 9 and 10 above 400 hPa. The RMSE of the U wind was about 4.5 m/s, slightly larger than that of the V wind, which was about 4.0 m/s. Meanwhile, a higher QI value exhibited a lower error characteristic at the cost of a reduced sample size. Below 500 hPa, there were limited data of AMVs available for the IR channel 12, and the corresponding errors increased obviously. According to these characteristics, FY-4A AMV data with high QI values above 700 hPa were better for the data assimilation.
During the forecasting of the Henan 7.20 rainstorm, assimilating FY-4A AMV data brought an improvement in the RMSE of the U and V wind at the upper levels between 200 hPa and 300 hPa. The mean bias and RMSE of the 10 m wind experienced an overall reduction in the forecast range of 0–24 h when assimilating FY-4A AMV data with a QI > 70. In comparison with the CTRL, assimilating the AMVs with a QI > 80 had an overall positive impact on the score skills of the forecasted rainfall above 1.0 mm in the 24 h forecast. A significant improvement could be obtained for the forecast of the 6 h accumulated precipitation above 25.0 mm including the AMV data with a QI > 80. With the FY-4A AMV data, the intensity and spatial pattern of the 24 h accumulated precipitation had good agreement with the observations; however, the intensity and the time of the hourly maximum rainfall still could not be captured well in the forecasting of the Henan 7.20 rainstorm event.
All of these conclusions are based on the results of this case study, which can provide a valuable reference for the further application of FY-4A AMV data in NWP models. In the future, more research may also be needed to focus on improving the observation error of FY-4A AMV data and verifying their impact in regional NWP models.

Author Contributions

Conceptualization, Y.X. and M.C.; methodology, Y.X.; validation, Y.X. and S.Z.; formal analysis, Y.X. and M.C.; investigation, Y.X.; writing—original draft preparation, Y.X.; writing—review and editing, J.S. and R.L.; funding acquisition, Y.X. All authors have read and agreed to the published version of the manuscript.

Funding

This research was funded by the Beijing Natural Science Foundation (Grant No. 8202021) and the National Natural Science Foundation of China (Grant No. 42005119).

Data Availability Statement

The data presented in this study are available on request from the corresponding author.

Acknowledgments

The authors acknowledge the National Satellite Meteorological Center of China for sharing FY−4A AMV data. We also greatly appreciate the anonymous reviewers for their valuable comments.

Conflicts of Interest

The authors declare no conflict of interest.

References

  1. Nieman, S.; Schmetz, J.; Menzel, W.P. A comparison of several techniques to assign heights to cloud tracers. J. Appl. Meteorol. 1993, 32, 1559–1568. [Google Scholar] [CrossRef]
  2. Velden, C.S.; Hayden, C.M.; Nieman, S.J.; Menzel, W.P.; Wanzong, S.T.; Goerss, J.S. Upper-tropospheric winds derived from geostationary satellite water vapor observations. Bull. Am. Meteorol. Soc. 1997, 78, 173–195. [Google Scholar] [CrossRef]
  3. Cordoba, M.; Dance, S.L.; Kelly, G.A.; Nichols, N.K.; Waller, J.A. Diagnosing atmospheric motion vector observation errors for an operational high-resolution data assimilation system. Q. J. R. Meteorol. Soc. 2017, 143, 333–341. [Google Scholar] [CrossRef]
  4. Bhatia, R.C.; Khanna, P.N.; Prasad, S. Improvements in Automated Cloud Motion Vectors (CMWs) Derivation Scheme Using INSAT VHRR Data. In Proc. Third Int. Winds Workshop; EUMETSAT: Ascona, Switzerland, 1996; pp. 37–43. [Google Scholar]
  5. Holmlund, K. The Atmospheric Motion Vector Retrieval Scheme for Meteosat Second Generation. In Proceedings of the Fifth International Winds Workshop, Lorne, Australia, 28 February–23 March 2000. [Google Scholar]
  6. Schmetz, J.; Holmlund, K.; Hoffman, J.; Strauss, B. Operational cloud-motion winds from Meteosat infrared images. J. Appl. Meteorol. Clim. 1993, 32, 1206–1225. [Google Scholar] [CrossRef]
  7. Le Marshall, J.; Pescod, N.; Khaw, A.; Allen, G. The real time generation and application of cloud drift winds in the Australian region. Aust. Meteorol. Mag. 1993, 42, 89–103. [Google Scholar]
  8. Nieman, S.J.; Menzel, W.P.; Hayden, C.M.; Gray, D.; Wanzong, S.; Velden, C.; Daniels, J. Fully automated cloud-drift winds in NESDIS operations. Bull. Am. Meteorol. Soc. 1997, 78, 1121–1134. [Google Scholar] [CrossRef]
  9. Le Marshall, J.; Pescod, N.; Seaman, B. An Operational System for Generating Cloud Drift Winds in the Australian Region and Their Impact on Numerical Weather Prediction. Weather Forecast. 1994, 9, 361–370. [Google Scholar] [CrossRef]
  10. Bedka, K.M.; Mecikalski, J.R. Application of satellite-derived atmospheric motion vectors for estimating mesoscale flows. J. Appl. Meteorol. 2005, 44, 1761–1772. [Google Scholar] [CrossRef]
  11. Cherubini, T.; Businger, S.; Velden, C.; Ogasawara, R. The impact of satellite-derived atmospheric motion vectors on mesoscale forecasts over Hawaii. Mon. Weather Rev. 2006, 134, 2009–2020. [Google Scholar] [CrossRef]
  12. Le Marshall, J.; Seecamp, R.; Dunn, M.; Velden, C.; Wanzong, S.; Puri, K. The contribution of locally generated MTSat-1R atmospheric motion vectors to operational meteorology in the Australian region. Aust. Meteorol. Mag. 2008, 57, 359–365. [Google Scholar]
  13. Bormann, N.; Salonen, K.; Peubey, C.; Mcnally, T.; Lupu, C. An Overview of the Status of the Operational Assimilation of AMVS at ECMWF. In Proceedings of the 11th International Winds Workshop, Auckland, New Zealand, 20–24 February 2012. [Google Scholar]
  14. Kim, M.; Kim, H.M.; Kim, J.; Kim, S.-M.; Velden, C.; Hoover, B. Effect of enhanced satellite-derived atmospheric motion vectors on numerical weather prediction in East Asia using an adjoint-based observation impact method. Weather Forecast. 2017, 32, 579–594. [Google Scholar] [CrossRef]
  15. Velden, C.; Lewis, W.E.; Bresky, W.; Stettner, D.; Daniels, J.; Wanzong, S. Assimilation of high-resolution satellite-derived atmospheric motion vectors: Impact on HWRF forecasts of tropical cyclone track and intensity. Mon. Weather Rev. 2017, 145, 1107–1125. [Google Scholar] [CrossRef]
  16. Tomassini, M.; Kelly, G.; Saunders, R. Use and impact of satellite atmospheric motion winds on ECMWF analyses and forecasts. Mon. Weather Rev. 1999, 127, 971–986. [Google Scholar] [CrossRef]
  17. Langland, R.H.; Toth, Z.; Gelaro, R.; Szunyogh, I.; Bishop, C.H. NORPEX-98: Targeted observations for improved North American weather forecasts. Bull. Am. Meteorol. Soc. 1999, 80, 1363–1384. [Google Scholar] [CrossRef]
  18. Joo, S.; Eyre, J.; Marriott, R. The impact of MetOp and other satellite data within the Met Office Global NWP system using an adjoint-based sensitivity method. Mon. Weather Rev. 2013, 141, 3331–3342. [Google Scholar] [CrossRef]
  19. Lewis, W.E.; Velden, C.S.; Stettner, D. Strategies for assimilating high-density atmospheric motion vectors into a regional tropical cyclone forecast model (HWRF). Atmosphere 2020, 11, 673. [Google Scholar] [CrossRef]
  20. Zhao, J.; Gao, J.; Jones, T.A.; Hu, J. Impact of Assimilating High-Resolution Atmospheric Motion Vectors on Convective Scale Short-Term Forecasts: 2. Assimilation Experiments of GOES-16 Satellite Derived Winds. J. Adv. Model. Earth Syst. 2021, 13, 1–25. [Google Scholar] [CrossRef]
  21. Gelaro, R.; Langland, R.H.; Pellerin, S.; Todling, R. The THORPEX Observation Impact Intercomparison Experiment. Mon. Weather Rev. 2010, 138, 4009–4025. [Google Scholar] [CrossRef]
  22. Daley, R. Atmospheric Data Analysis; Cambridge University Press: Cambridge, UK, 1993; 460p. [Google Scholar]
  23. Bormann, N.; Saarinen, S.; Kelly, G.; Thepaut, J.N. The Spatial Structure of Observation Errors in Atmospheric Motion Vectors from Geostationary Satellite Data. Q. J. R. Meteorol. Soc. 2003, 131, 706–718. [Google Scholar] [CrossRef]
  24. Marshall, J.L.; Rea, A.; Leslie, L.; Seecamp, R.; Dunn, M. Error characterisation of atmospheric motion vectors. Aust. Meteorol. Mag. 2004, 53, 123–131. [Google Scholar]
  25. Hernandez-Carrascal, A.; Bormann, N.; Borde, R.; Lutz, H.J.; Wanzong, S. Atmospheric Motion Vectors from model simulations. Part I: Methods and characterisation as single-level estimates of wind. ECMWF Tech. Memo. 2012, 677, 31. [Google Scholar]
  26. Menzel, P. Cloud tracking with satellite imagery: From the pioneering work of Ted Fujita to the present. Bull. Am. Meteorol. Soc. 2001, 82, 33–47. [Google Scholar] [CrossRef]
  27. Velden, C.S.; Bedka, K. Identifying the uncertainty in determining satellite-derived atmospheric motion vector height attribution. J. Appl. Meteorol. Climatol. 2008, 48, 450–463. [Google Scholar] [CrossRef]
  28. Szejwach, G. Determination of semi-transparent cirrus cloud temperatures from infrared radiances: Application to Meteosat. J. Appl. Meteorol. 1982, 21, 384–393. [Google Scholar] [CrossRef]
  29. Menzel, W.P.; Smith, W.L.; Stewart, T.R. Improved cloud motion wind vector and altitude assignment using VAS. J. Appl. Meteorol. Clim. 1983, 22, 377–384. [Google Scholar] [CrossRef]
  30. Rao, P.A.; Velden, C.S.; Braun, S.A. The vertical error characteristics of GOES-derived winds: Description and experiments with Numerical Weather Prediction. J. Appl. Meteorol. 2002, 41, 253–271. [Google Scholar] [CrossRef]
  31. Yang, C.; Lu, Q.; Zhang, P. A study on height reassignment for the AMV products of the FY-2C satellite. Acta Meteorol. Sin. 2012, 26, 614–628. [Google Scholar] [CrossRef]
  32. Holmlund, K. The utilization of statistical properties of satellite-derived atmospheric motion vectors to derive quality indicators. Weather Forecast. 1998, 13, 1093–1104. [Google Scholar] [CrossRef]
  33. Rohn, M.; Kelly, G.; Saunders, R. Impact of a new cloud motion wind product from Meteosat on NWP analyses. Mon. Weather Rev. 2001, 129, 2392–2403. [Google Scholar] [CrossRef]
  34. Li, J.; Li, J.; Velden, C.; Wang, P.; Schmit, T.J.; Sippel, J. Impact of rapid-scan-based dynamical information from GOES-16 on HWRF hurricane forecasts. J. Geophys. Res. Atmos. 2020, 125, 1–18. [Google Scholar] [CrossRef]
  35. Marshall, J.L.; Howard, D.; Xiao, Y.; Daniels, J.; Margetic, D. Himawari-8 atmospheric motion vectors—Operational generation and assimilation. J. South. Hemisph. Earth Syst. Sci. 2017, 67, 12–24. [Google Scholar] [CrossRef]
  36. Borde, R.; Carranza, M.; Hautecoeur, O.; Barbieux, K. Winds of change for future operational AMV at EUMETSAT. Remote Sens. 2019, 11, 2111. [Google Scholar] [CrossRef] [Green Version]
  37. Yang, J.; Zhang, Z.; Wei, C.; Lu, F.; Guo, Q. Introducing the new generation of Chinese geostationary weather satellites—FengYun 4. Bull. Am. Meteorol. Soc. 2017, 98, 1637–1658. [Google Scholar] [CrossRef]
  38. Chen, Y.; Shen, J.; Fan, S.; Meng, D.; Wang, C. Characteristics of fengyun-4a satellite atmospheric motion vectors and their impacts on data assimilation. Adv. Atmos. Sci. 2020, 37, 1222–1238. [Google Scholar] [CrossRef]
  39. Wan, X.M.; Gong, J.D.; Han, W.; Tian, W.H. The evaluation of FY-4A AMVs in GRAPES_RAFS. Meteorol. Mon. 2019, 45, 458–468. [Google Scholar]
  40. Ran, L.; Li, S.; Zhou, Y.; Yang, S.; Ma, S.; Zhou, K.; Shen, D.; Jiao, B.; Li, N. Observational analysis of the dynamic, thermal, and water vapor characteristics of the “7.20” extreme rainstorm event in Henan province, 2021. Chin. J. Atmos. Sci. 2021, 45, 1366–1383. [Google Scholar]
  41. Skamarock, W.C.; Klemp, J.B.; Dudhia, J.; Gill, D.O.; Barker, D.M.; Duda, M.G.; Huang, X.Y.; Wang, W.; Powers, J.G. A Description of the Advanced Research WRF Version 3; NCAR Tech. Note NCAR/TN-475+STR; National Center for Atmospheric Research: Boulder, CO, USA, 2008. [Google Scholar]
  42. Ide, K.; Courtier, P.; Ghil, M.; Lorenc, A.C. Unified notation for data assimilation: Operational, sequential and variational. J. Met. Soc. Jpn. 1997, 75, 181–189. [Google Scholar] [CrossRef] [Green Version]
  43. Deb, S.K.; Kishtawal, C.M.; Kaur, I.; Pal, P.K.; Kiran Kumar, A.S. Assessment of a new quality control technique in the retrieval of atmospheric motion vectors. Meteorol. Appl. 2013, 22, 178–186. [Google Scholar] [CrossRef]
  44. Wang, H.; Yang, Z.; Yang, D.; Gong, X. The method and application of automatic quali ty control for real time data from Automatic Weather Stations. Meteorol. Mon. 2007, 33, 102–109. [Google Scholar]
  45. Ren, Z.; Zhang, Z.; Sun, C.; Liu, Y.; Li, J. Development of three-step quality control system of real-time observation data from AWS in China. Meteorol. Mon. 2015, 41, 1265–1277. [Google Scholar]
  46. Schaffer, J.T. The critical success index as an indicator of warning skill. Weather Forecast. 1990, 5, 570–575. [Google Scholar] [CrossRef]
Figure 2. Spatial distribution of FY-4A AMVs over the grid points of the 9 km domain at 00 UTC 20 July 2021. (ac) Spatial distribution of all AMVs from channels 9, 10 and 12, respectively. (df) Spatial distribution of the corresponding AMVs with the QI values above 80.
Remotesensing 14 05637 g002
Figure 3. Statistical characteristics of FY-4A AMVs with different QI values (qi80: QI > 80; qi70: QI > 70; qiall: QI > 0) based on the NCEP re-analysis data over one month from 1 to 31 July 2021. (a,d,g) represent the number of AMV data for channel 9, 10 and 12, respectively; (b,e,h) represent the corresponding RMSEs of U wind; (c,f,i) represent the corresponding RMSEs of V wind.
Remotesensing 14 05637 g003
Figure 4. Spatial distribution of FY-4A AMVs used in the data assimilation experiments for the levels of 500 hPa, 300 hPa and 200 hPa at 00 UTC 20 July 2021. (ac) represent the AMVs with QI > 80; (df) represent the AMVs with QI > 70.
Remotesensing 14 05637 g004
Figure 5. Scatter plots of the background and analysis of U and V wind against the corresponding components of FY-4A AMVs with a QI > 80 for the level of 300 hPa at 00 UTC 20 July 2021 (the first line represents U wind, and the second line represents V wind).
Remotesensing 14 05637 g005
Figure 6. Analysis increment of the U and V wind at 00 UTC 20 July 2021 for the level of about 300 hPa in the experiment with the QI > 80 AMV data (left, U wind; right, V wind).
Remotesensing 14 05637 g006
Figure 7. The bias and RMSE of the forecast U (UGRD) and V (VGRD) wind averaged over the 3 km domain from the experiments of the CTRL, amv_qi70 and amv_qi80. (a,c) represent the values for U wind at 12 h and 24 h of the forecast, respectively; (b,d) represent the values for the corresponding V wind.
Remotesensing 14 05637 g007
Figure 8. The bias and RMSE of the forecast wind at 10 m averaged over the 3 km domain from the experiments of the CTRL, amv_qi70 and amv_qi80 in the forecast range of 0–24 h.
Remotesensing 14 05637 g008
Figure 11. Spatial distribution of 24 h accumulated precipitation around the center of heavy rainfall in the Henan 7.20 rainstorm. (ac) depict 00 UTC; (df) depict 03 UTC 20 July 2021 for observations, CTRL and amv_qi80, respectively.
Remotesensing 14 05637 g011
Figure 12. Variation of hourly precipitation on 20 July 2021 from the observations, the CTRL and the amv_qi80 at the location of station 57083 (34.72°N, 113.65°E), which recorded the maximum rainfall in the Henan 7.20 rainstorm.
Remotesensing 14 05637 g012
Figure 13. Cross sections of wind field and relative humidity along 34.72°N for (a) the first guess, (b) the analysis and (c) their difference in the amv_qi80 experiment at 00 UTC 20 July 2021.
Remotesensing 14 05637 g013
Table 1. Characteristics of the AGRI instrument.
ChannelBand (µm)Spatial ResolutionMain Purpose
10.47–0.491 km
20.55–0.750.5~1 km
30.75–0.901 km
41.36–1.392 km
51.58–1.642 km
62.1–2.352~4 km
73.5–4.0 (high)2 km
83.5–4.0 (low)4 km
95.8–6.74 kmHigh level water vapor
106.9–7.34 kmMiddle level water vapor
118.0–9.04 km
1210.3–11.34 kmCloud and surface temperature
1311.5–12.54 km
1413.2–13.84 km
Publisher’s Note: MDPI stays neutral with regard to jurisdictional claims in published maps and institutional affiliations.

