Article

Regional Patterns of Vegetation Dynamics and Their Sensitivity to Climate Variability in the Yangtze River Basin

1
State Key Laboratory of Hydrology-Water Resources and Hydraulic Engineering, Hohai University, Nanjing 210098, China
2
College of Hydraulic Science and Engineering, Yangzhou University, Yangzhou 225009, China
3
Hydrology Research Unit, Swedish Meteorological and Hydrological Institute, 60176 Norrköping, Sweden
*
Author to whom correspondence should be addressed.
Remote Sens. 2022, 14(21), 5623; https://doi.org/10.3390/rs14215623
Submission received: 19 September 2022 / Revised: 1 November 2022 / Accepted: 3 November 2022 / Published: 7 November 2022

Abstract

:
To better understand the mechanisms of the hydro-ecological cycle in the changing environments of the Yangtze River Basin (YZRB), it is valuable to investigate vegetation dynamics and their response to climate change. This study explored the spatial patterns of vegetation dynamics and the essential triggers of regional differences by analyzing vegetation variations in the 1982–2015 period at different time scales and the interannual variability of vegetation sensitivity to climate variability. The results showed that the normalized difference vegetation index (NDVI) increased significantly in the last three decades, but vegetation displayed great spatiotemporal variations at different time scales. The vegetation in the central part of the YZRB dominated by forests and shrublands was more sensitive to climate variability than vegetation in the source region of the YZRB, which was dominated by alpine meadows and tundra (AMT). The contribution of climate variables to the vegetation sensitivity index (VSI) had large spatial differences, but solar radiation and temperature were the dominant factors. Furthermore, 57.9% of the YZRB had increasing VSIs, especially in the south-central part. Consistent with the distributions of elevation and vegetation types, vegetation dynamics in the YZRB were divided into five spatial patterns, with the largest increasing NDVI trend in Region III and the largest VSI in Region IV. Moreover, the VSI exhibited fairly consistent dynamics in all subregions, but the contributions of climate variables to the VSI varied greatly among the different regions.

1. Introduction

Vegetation, which plays an essential role in carbon balance, energy exchange, and water cycles, has served as an indicator of terrestrial environmental changes [1,2,3,4]. Thus, understanding vegetation changes at regional and global scales is crucial for stakeholders (e.g., policymakers and natural resource managers) to evaluate environmental conditions and cope with future ecosystem challenges [5]. As space remote sensing technology has developed, satellite-derived vegetation indices, such as the normalized difference vegetation index (NDVI), the enhanced vegetation index (EVI), and the leaf area index (LAI), have become powerful tools with which to monitor vegetation activities and their response to natural environmental changes and human interventions at regional and global scales [6,7,8,9,10]. Zhu et al. [11] reported that global LAI showed greening trends in most regions and that CO2 fertilization effects explained 70% of these trends. Liu et al. [12] reported that anthropogenic effects had varied impacts on global NDVI across continents, and significant positive effects were found in Asia, Africa, and Europe. Moreover, Jiang et al. [13] distinguished the effects of climatic change and human activities on vegetation dynamics in Central Asia through residual trend analysis and highlighted the degradation in vegetation triggered by human activities. However, Ge et al. [14] revealed that both climate change and human activities had favorable effects on vegetation growth in China from 2001 to 2016.
In general, studies have pointed out that vegetation has changed due to ongoing global climate changes and an increase in associated extreme events [15,16,17]. Temperature alters the phenology of vegetation due to the close association between temperature and the initiation, termination, and performance of photosynthetic activities [18,19,20], and precipitation controls the water deficit of vegetation [21,22]. Additionally, solar radiation provides energy for photosynthesis in vegetation [23,24]. In addition to vegetation becoming more vulnerable to the substantial effects of climate change, vegetation changes can reflect and regulate climate through biophysical processes, such as modifying living conditions [3,25,26]. The response of vegetation to climate change exhibits nonlinear, nonstationary, and complex processes; however, previous studies on climate–vegetation interactions have focused mainly on mean climate states and have typically considered correlations or linear relationships [4,5,27,28,29]. Recently, a new metric, the vegetation sensitivity index (VSI), was proposed by Seddon et al. [30] to explore the vulnerability of ecosystems to external variability. This index has become a new favorite metric when assessing the responses of vegetation to climatic variability [31,32,33,34,35]. For example, Zhu et al. [32] evaluated the effects of climatic variations on vegetation based on the VSI in the desert region of northern China. Li et al. [31] revised the VSI approach on the Qinghai–Tibet Plateau and found that the sensitivity of alpine grasslands to climate variability increased along an elevational gradient. Combined with a 15-year moving window, Jiang et al. [33] used the VSI to investigate interannual variability in the sensitivity of vegetation to climate in China over the last three decades.
Numerous studies have also found that vegetation activities and their reactions to climate variations are complex and spatially heterogeneous because water–heat mechanisms and eco-environmental conditions exhibit dramatic diversity among different regions [36,37,38,39]. For example, vegetation has been greening in Europe, eastern America, western and southern Australia, India, and China but browning in southern Africa, South America, and Southeast Asia [40,41,42,43]. Extended drought has killed trees and altered the composition of species in the Amazon rainforest [30,36], but an increase in solar radiation has led to an increase in net primary production (NPP) in parts of the Amazon [11,37,44]. Additionally, the prolonged growing season caused by the warming climate has been confirmed as the main factor promoting grassland growth on the Tibetan Plateau [20,45]. In contrast, vegetation changes in grasslands have shown consistent variations in temperature and precipitation in semi-arid and arid regions [46] such as the Inner Mongolia grasslands [32,47]. However, many studies on vegetation dynamics and their association with climate change are based on pixels or regional averaging scales, making it difficult to explore the essential triggers of spatial heterogeneity at a regional scale. Thus, cluster analysis can group objects into several homogeneous subsets based on certain attributions, providing an effective way of addressing spatial heterogeneity, and has been widely used in studies of climatology and hydrology [48,49,50].
Variations in vegetation can alter hydrological processes and lead to fluctuations in the rainfall–runoff relationship and runoff dynamics [51,52]. As an essential barrier to sustaining ecological balance, the Yangtze River Basin (YZRB) is susceptible to climate change because it straddles various climatic zones [53,54]. Investigating vegetation changes and their climatic response in the YZRB is valuable for understanding the mechanisms of the hydro-ecological cycle in changing environments. Many studies have been conducted to analyze vegetation dynamics and their attributions in the YZRB [54,55,56] to better understand the mechanisms of the hydro-ecological cycle in changing environments. However, as with studies in other regions, these studies in the YZRB only briefly analyzed vegetation responses on long-term mean climate states; the climate–vegetation interactions in short-term climate variability remain poorly understood. Moreover, due to spatial heterogeneity, it is difficult to explore the essential triggers of regional differences in vegetation dynamics and their association with climate in the YZRB when simply investigating them with pixel or regional averaging scales. Thus, vegetation sensitivity to climate variability, variations in vegetation sensitivity to climate variability, the spatial patterns of vegetation dynamics, and the essential triggers of regional differences in the YZRB still need further exploration.
To address the problems mentioned above, this study concentrated on the regional patterns of vegetation dynamics and their sensitivity to climate variability in the YZRB. This study (1) analyzed the spatiotemporal variations in vegetation at different time scales; (2) quantified the VSI and its variations in the YZRB, together with the contributions of climate variables (precipitation, temperature, and solar radiation) to the VSI; (3) detected the spatial patterns of vegetation dynamics; and (4) explored vegetation dynamics and their sensitivity at a regional scale. This study will help to better understand the mechanisms of the hydro-ecological cycle in the changing environments in the YZRB and provides a foundation for predicting future vegetation dynamics under changing climate conditions.

2. Materials and Methods
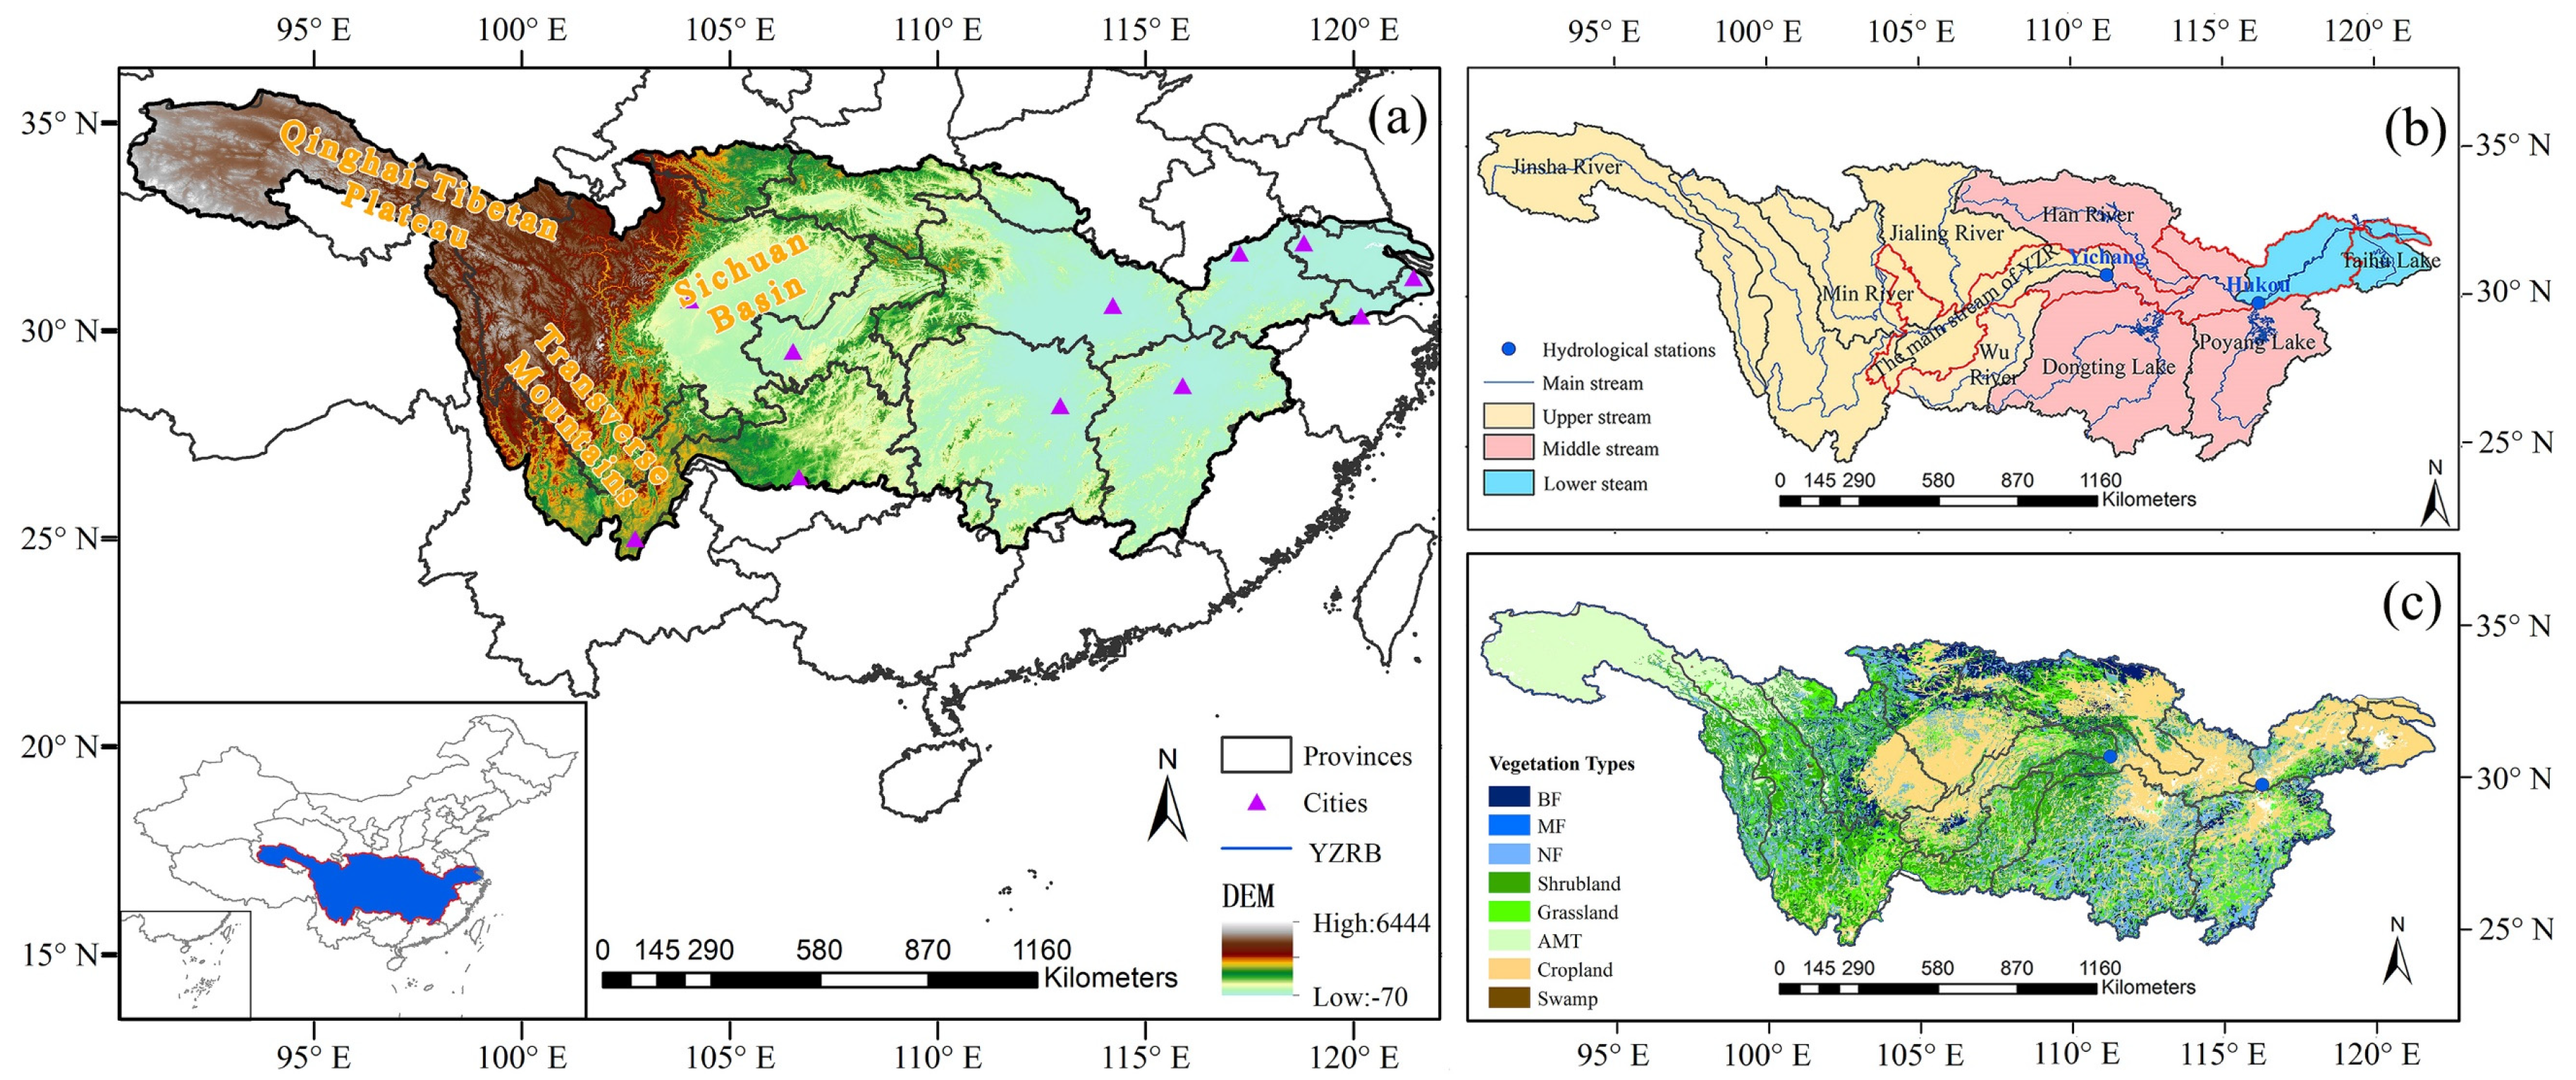
2.1. Study Area

The YZRB (24°27′–35°54′N and 90°33′–122°19′E) originates in the eastern part of the Tibetan Plateau, flows through eleven provinces (including Qinghai, Tibet, Yunnan, Sichuan, Chongqing, Hubei, Hunan, Jiangxi, Anhui, Suzhou, and Shanghai), and terminates at the East China Sea in Shanghai. It covers an area of 1.8 million km2 (accounting for approximately one fifth of China’s total land area) and spans China’s three major economic regions. Due to its advantageous geographical location and unique natural conditions, the YZRB plays an important role in socioeconomic development. The complex topography of the YZRB has the shape of a three-stage ladder, with high terrain in the west and low terrain in the east (Figure 1a). The entire YZRB can be divided into 12 subbasins (Figure 1b), including the Jinsha River, Min River, Jialing River, Wu River, Han River, Dongting Lake, Poyang Lake, Taihu Lake, and the mainstream of the Yangtze River. The YZRB has a plateau mountain climate and a typical subtropical monsoon climate, with an uneven distribution of annual precipitation and temperature that decreases from the southeast to the northwest [54,57]. As shown in Figure 1c, this basin also has abundant forest resources. Alpine meadows and tundra (AMT) and grasslands predominate in the source region and upper reaches of the YZRB, while the dominant vegetation types in the middle reach of the YZRB are forests and shrublands. Moreover, the middle and lower plains of the YZRB consist of abundant cropland.

2.2. Data Sources

The datasets used in this study contain NDVI data, gridded climate data, and vegetation type data. The NDVI dataset was obtained from the Global Inventory Monitoring and Modeling Studies (GIMMS) group (http://ecocast.arc.nasa.gov/data/pub/gimms (accessed on 12 February 2020)), with a spatial resolution of 1/12° for the data from 1981 to 2015. To reduce the influence of clouds and aerosols in the atmosphere, biweekly NDVI data were synthesized into monthly series using the maximum value composite (MVC) technique [58]. Moreover, pixels with mean growing season NDVI (GS-NDVI) values of less than 0.1 were classified as bare ground and removed.
The China Meteorological Forcing Dataset (CMFD), with a spatial resolution of 0.1° × 0.1° and covering the period from 1979 to 2018, provided the grid monthly mean temperature, precipitation, and solar radiation used in this study (http://data.tpdc.ac.cn (accessed on 20 February 2020)). The dataset was developed by merging remote sensing products, reanalysis datasets, and in situ observation datasets from meteorological stations [59,60]. This dataset has been used to investigate vegetation growth reactions to climatic changes because of its comparatively high reliability and precision [31,61,62]. To match the NDVI data, the study period was defined as 1982–2015, and the gridded climate data were resampled from a spatial resolution of 0.1° to 1/12° using bilinear interpolation.
The spatial distribution of vegetation types was determined using a digitized vegetation map of China at a scale of 1:1,000,000, which was obtained from the Resource and Environment Science and Data Center [63,64] (RESDC, https://www.resdc.cn (accessed on 8 March 2020)). Eight vegetation types were recognized, including broadleaf forests (BF), broadleaf and mixed forests (MF), needleleaf forests (NF), shrublands, grasslands, alpine meadows and tundra (AMT), croplands, and swamps.

2.3. Methods

2.3.1. Trend Analysis

In this study, the linear least squares regression method was utilized to investigate multiple time scale linear trends of the NDVI at pixel and regional scales [56]. The Theil–Sen median analysis combined with the Mann–Kendall test, which has been extensively used to analyze long-term sequences of vegetation in previous studies [5,65,66], was also chosen to determine the statistical significance of vegetation changes. On the basis of previous studies [13,65] and the real conditions in the YZRB, the statistically significant results were categorized into five types: significantly improved (SNDVI ≥ 0.0005, Z ≥ 1.96), slightly improved (SNDVI ≥ 0.0005, −1.96 ≤ Z ≤ 1.96), stable (−0.0005 ≤ SNDVI ≤ 0.0005), slightly degraded (SNDVI ≤ -0.0005, −1.96 ≤ Z ≤ 1.96), and significantly degraded (SNDVI ≤ −0.0005, Z ≤ −1.96).

2.3.2. Vegetation Sensitivity Index

The VSI, developed by Seddon et al. [30], was used to investigate vegetation sensitivity to climate variability while taking the complexity of the ecosystem’s response to climate into account. Here, the NDVI and three main climate drivers (TEM, PRE, and RAD) were chosen to calculate the VSI in the YZRB. The expression is as follows:
VSI =   ( T E M w e i × T E M s e n + P R E w e i × P R E s e n + R A D w e i × R A D s e n ) C O N T E M = T E M w e i × T E M s e n V S I C O N P R E = P R E w e i × P R E s e n V S I C O N R A D = R A D w e i × R A D s e n V S I
where T E M w e i ,   P R E w e i , and R A D w e i are the relative importance of the temperature, precipitation, and solar radiation on vegetation changes (climate weights), respectively. T E M s e n , P R E s e n , and R A D s e n are the sensitivities of the NDVI to the climate variables. C O N T E M , C O N P R E , and C O N R A D are the contributions of climate variables to the VSI. For the methodological details, see Seddon et al. [30].
Additionally, to investigate the interannual variations in vegetation sensitivity to climate, a 15-year moving window approach was applied to the NDVI and climate variable time series [33] from 1982 to 2015. Thus, a VSI was calculated for a specific 15-year time series, and the result was assigned to the middle year of the moving window. For example, the VSI in 1989 represented the result calculated from the NDVI and climate variables for the first 15-year period (1982–1996). Moreover, the Theil–Sen median analysis and the Mann–Kendall test were combined to investigate the trends and significance of the variability in vegetation sensitivity to climate. VSI slope trends greater than 0 indicated an increase in vegetation sensitivity, while | Z | > 1.96 was considered as statistically significant.

2.3.3. K-Means Clustering Analysis

For a better understanding of the regional patterns of vegetation dynamics and their sensitivity to climate change, K-means clustering analysis was used to determine the homogeneous subregions in the YZRB with certain attributions at the pixel scale. Compared to other clustering methods, K-means clustering analysis is one of the simplest and most flexible unsupervised learning algorithms, especially for large-volume datasets [67]. It divides the sampling set into K clusters, making points within a cluster as close as possible and distances between clusters as large as possible. In other words, the squared errors within a cluster and the sum of squared errors in all clusters are minimized:
J ( C k ) = x i c k   x i μ k 2
J ( C ) = k = 1 K x i c k     x i μ k 2
where x i are the parameters (i.e., vegetation variability, vegetation sensitivity) in pixel   i . X = { x i } ,   i = 1 , 2 , , n , pixels with different parameters are clustered into K clusters. μ k   is the mean value of cluster   C k . J ( C k ) is the squared error of cluster C k . J ( C ) is the sum of the squared error in all K clusters.
In this paper, the average and linear NDVI trends during the growing season (GS) and four seasons were selected as vegetation variability properties. Additionally, VSI, climate variable contribution, and their trends were taken as vegetation sensitivity properties. Latitude, longitude, and elevation were regarded as spatial properties. All data mentioned above were taken as attributions involved in the K-means clustering analysis.

3. Results

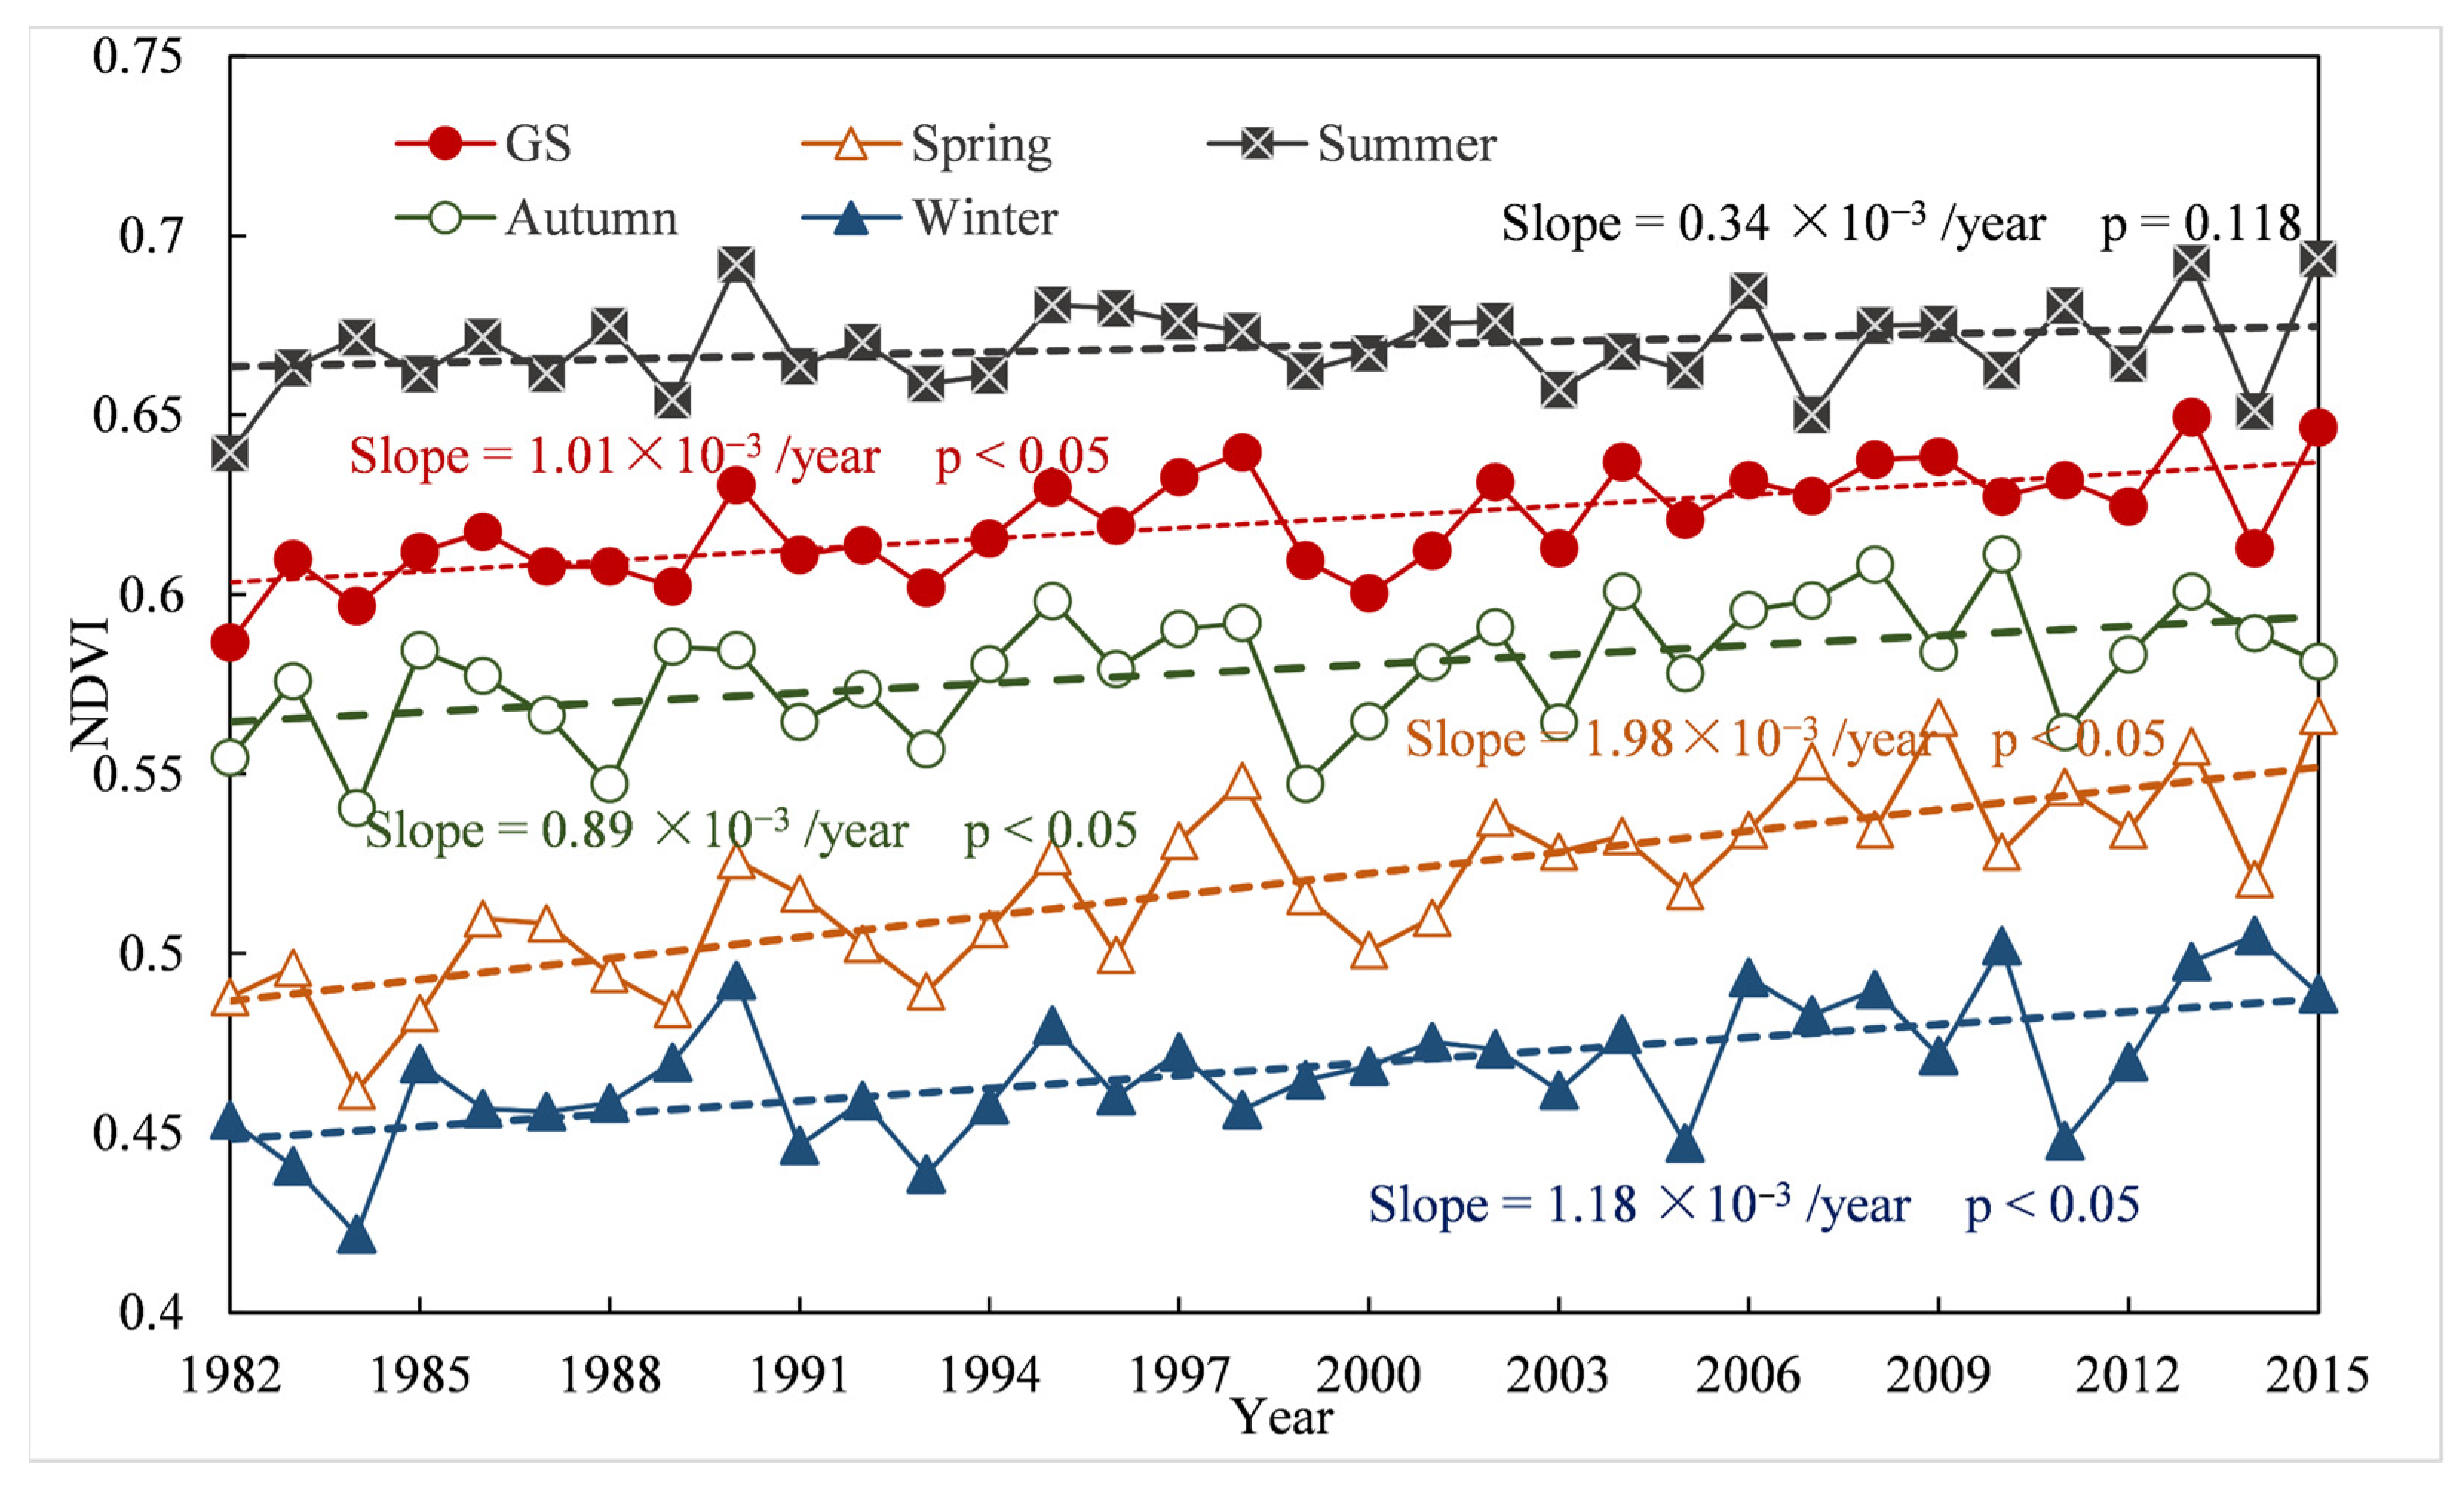
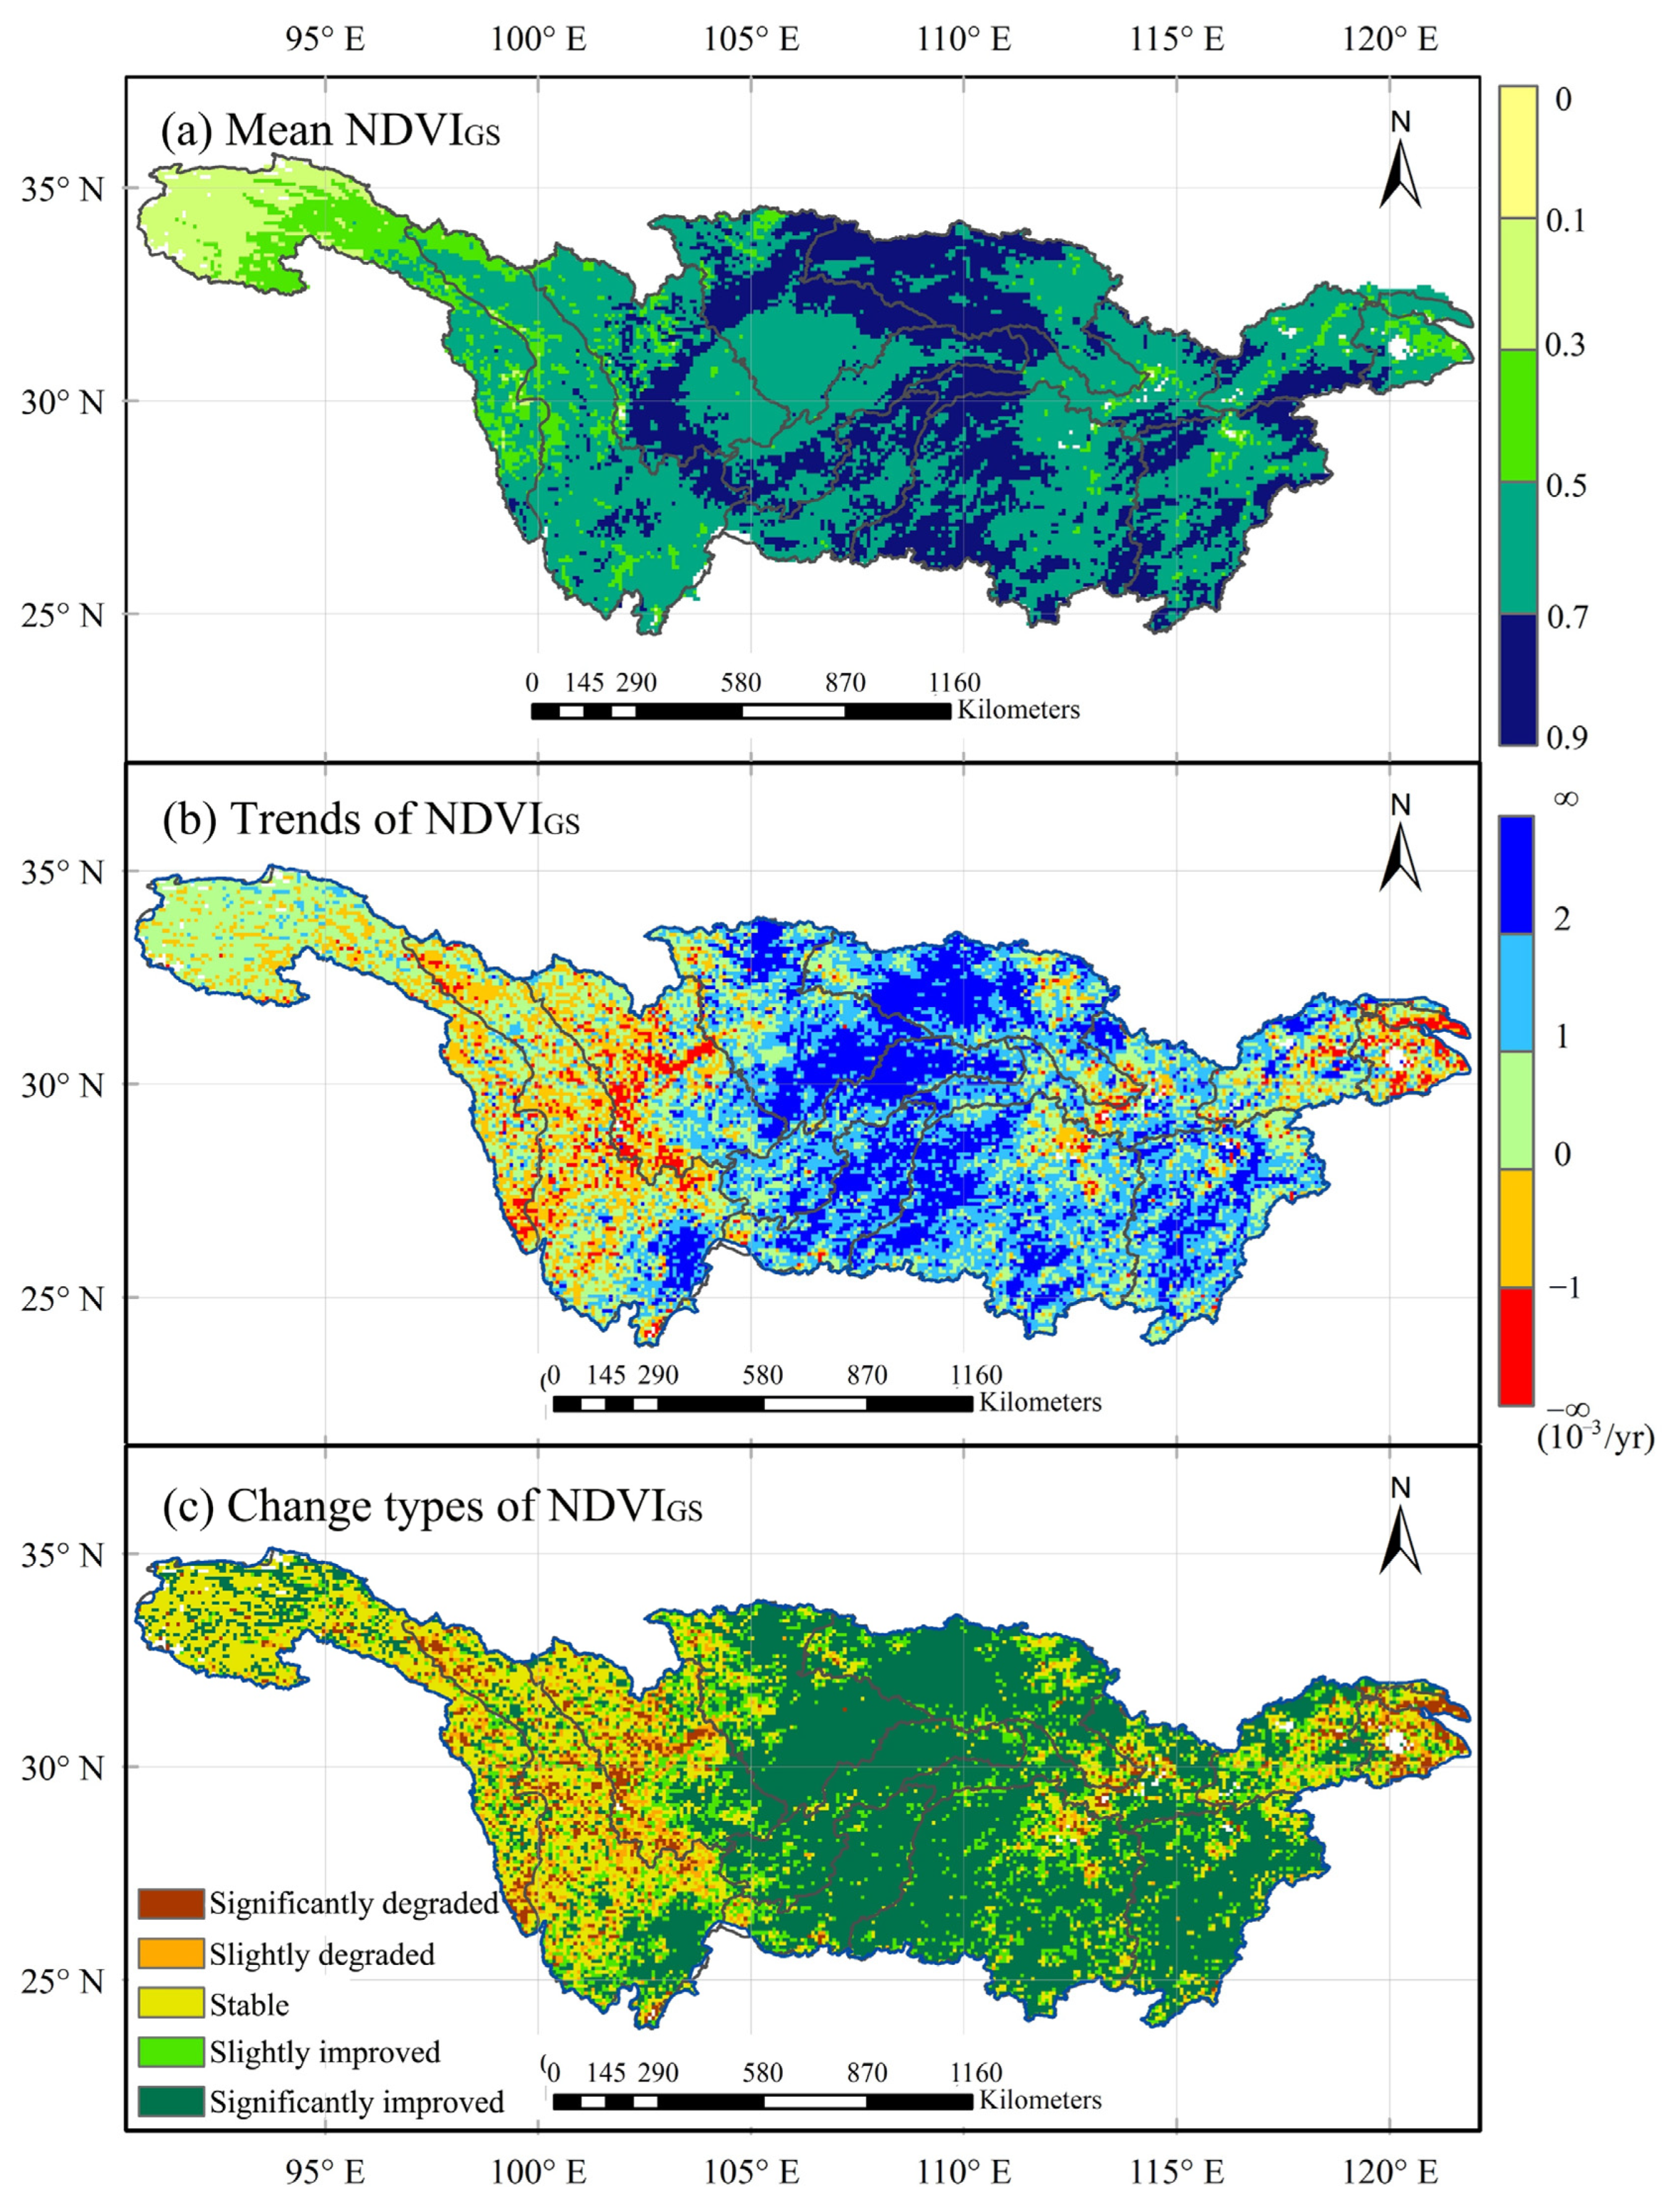
3.1. Spatiotemporal Variations in Vegetation

The spatiotemporal variations in vegetation in the YZRB at different time scales were investigated. Note that the GS in this study was defined as from April to October [64], and the four seasons were spring (March to May), summer (June to August), autumn (September to November), and winter (December to February). Figure 2 shows the NDVI interannual variations in the YZRB. The NDVI showed increasing trends during the 1982–2015 period at all time scales. The GS-NDVI values in the YZRB fluctuated between 0.58 and 0.65 and increased significantly at a rate of 1.01 ×   10 3 /yr. The seasonal NDVI values were ranked as summer > autumn > spring > winter. Vegetation showed significant greening trends (p < 0.05) in spring, autumn, and winter and a slight upward trend in summer. The seasonal NDVI trends were in the order of spring (1.98 ×   10 3 /yr), winter (1.18 ×   10 3 /yr), autumn (0.89 ×   10 3 /yr), and summer (0.34 ×   10 3 /yr).
The spatial distributions of the GS-NDVI variations in the YZRB are shown in Figure 3. Overall, the GS-NDVI values in the YZRB were relatively low in the west and high in the center (Figure 3a) with a mean GS-NDVI of 0.62, and more than 85% of the areas had mean NDVI values greater than 0.5. Areas with mean NDVI values greater than 0.7 accounted for 31% and were mainly distributed in the hilly areas covered with forests, shrublands, and grasslands around the Sichuan Basin. However, areas with mean NDVI values less than 0.5 were mainly located in the upper Jinsha River Basin and the Taiho Lake Basin. The GS-NDVI trends in the YZRB mainly increased linearly (Figure 3b), accounting for 81% of the YZRB. In particular, 21.3% of the areas with increasing rates greater than 2 × 10⁻³/yr were mainly distributed in the central part of the YZRB. However, areas with linearly decreasing trends accounted for only 19% and were located in the western and eastern parts of the YZRB. In particular, vegetation in western Sichuan, the Taiho Lake Basin, and the Yangtze River Delta was severely degraded. The spatial distribution of the types of GS-NDVI change in the YZRB was similar to that of linear trends (Figure 3c), with significantly improved vegetation mainly in the central region and degraded vegetation in the western and eastern parts. The main types of vegetation changes in the YZRB were stable and significantly improved, occupying 24% and 53.1%, respectively. However, areas with significantly degraded vegetation accounted for only a small proportion (4.5%).
The spatial distributions of seasonal NDVI variations are illustrated in Figures S1–S3. Vegetation changes in the YZRB displayed spatiotemporal differences in different seasons. The seasonal mean NDVI in the YZRB was the highest in summer with a value of 0.67, followed by autumn (0.57) and spring (0.51); winter (0.46) had the lowest vegetation coverage (Figure S1). In addition, the differences in the seasonal mean NDVI in the source region of the YZRB were smaller than those in other areas of the YZRB. The spatial distributions of the linear NDVI trends were dominated by linear increases in all seasons (Figure S2). The percentage of pixels with linearly increasing trends greater than 2 × 10⁻³/yr was the largest in spring (50%) but the lowest in summer (8.3%). However, the largest percentage of areas with decreasing trends, accounting for 36.6%, was observed in the Hengduan Mountains and the lower reaches of the YZRB in summer. The major type of NDVI change in spring, autumn, and winter was significantly improved (Figure S3), accounting for 63.1%, 46.1%, and 46.1%, respectively. In contrast, the main type of vegetation change in summer was stable, with a percentage of 30.2%.

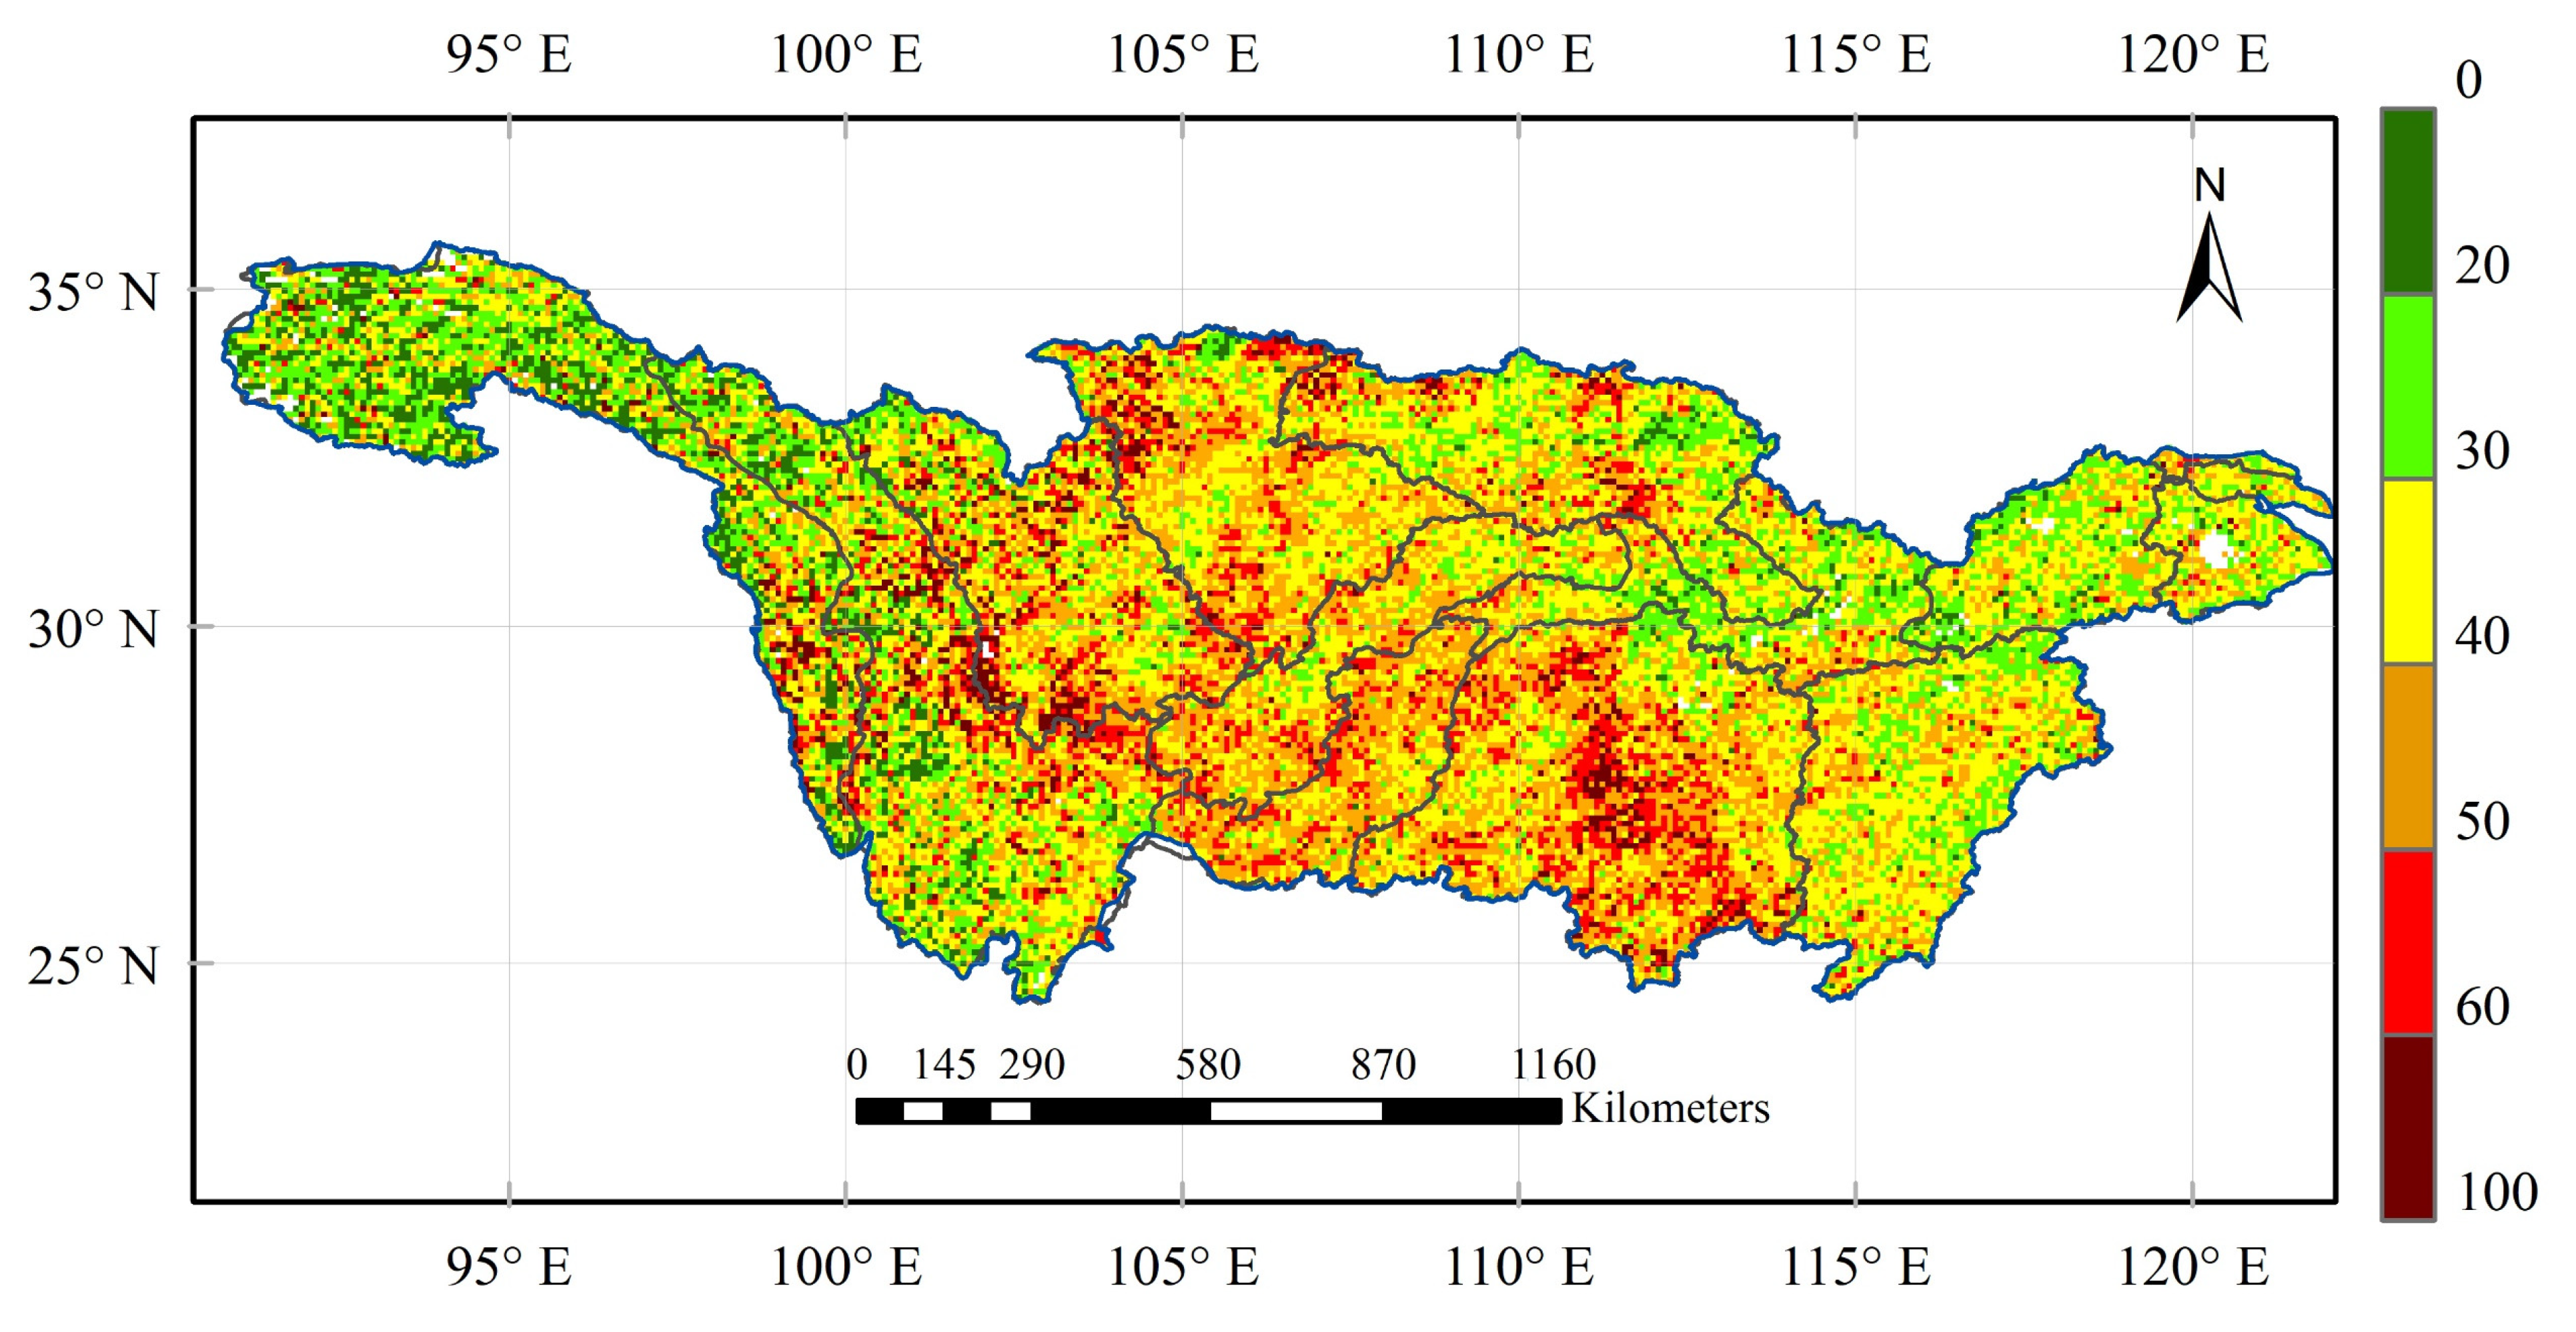
3.2. Vegetation Sensitivity to Climate Variability

To recognize the comprehensive effect of climate on vegetation dynamics, the VSI was used to quantify the sensitivity of vegetation to climate variability. The spatial distribution of the VSI exhibited obvious spatial heterogeneity in the YZRB (Figure 4). The VSI of AMT in the source region of the YZRB was low and most values were less than 40, indicating more stable feedback of vegetation to climate variability. In contrast, areas with high VSIs were mainly located in the central part of the YZRB, which was dominated by forests and shrublands.
The contribution of climate variables to the VSI in the YZRB is shown in Figure 5. The contribution of precipitation to the VSI was comparatively smaller than that of temperature and solar radiation. Spatially, the contribution of precipitation to the VSI was less than 30% in most regions in the YZRB, while only a few areas in the source region of the YZRB had a greater contribution from precipitation. Temperature had a great contribution to the VSI, with a mean value of 37.5%. In the source region of the YZRB, Sichuan Basin, and the middle-lower Yangtze Plain, the contribution of temperature to the VSI was greater than 50% in most pixels. Moreover, solar radiation had a great contribution to the VSI in the southern part of the YZRB, which is dominated by forests and shrublands. According to the spatial distribution of the primary drivers controlling the VSI in Figure 4d, solar radiation was the dominant factor for the VSI in the YZRB for the largest number of areas (49.2%), while 42.6% of the areas had temperature as the dominant factor for the VSI. In contrast, there were few areas where precipitation was the primary driver of the VSI (8.2%).
The VSI time series were calculated by using a 15-year moving window approach, and the spatial distributions of the variability in the VSI are displayed in Figure 6. The VSI trends in the YZRB ranged from −4 to 3.46, and most of the areas fluctuated between −1 and 1. Based on the Mann–Kendall test, the VSI trends were classified into four types: significantly increased, slightly increased, significantly decreased, and slightly decreased. The percentages of increasing and decreasing VSIs in the YZRB were 57.9% and 42.1%, respectively. The areas with significantly increased VSI trends accounted for 22.6% and were mainly concentrated in the south-central part of the YZRB, while only 12.7% of the areas had significantly decreased VSI trends and were sporadically distributed.
This study also investigated the trends relating to the contribution of climate variables to the VSI (Figure S4). The spatial distribution of the precipitation contribution trends was dispersed, and the percentages of precipitation contributions with significantly increasing and decreasing trends were 13.4% and 18%, respectively. The areas with significantly increased temperature contributions were mainly concentrated in the source region of the YZRB and Poyang Lake. Furthermore, 50.1% of the areas showed increasing trends for the contribution of solar radiation, and these areas were primarily located in the central part of the YZRB. Generally, the trends for the contributions of climate variables were spatially heterogeneous. For example, the precipitation and solar radiation contributions in the source region of the YZRB were decreasing, but a temperature contrast was observed.

3.3. Vegetation Dynamics and Their Sensitivity at a Regional Scale

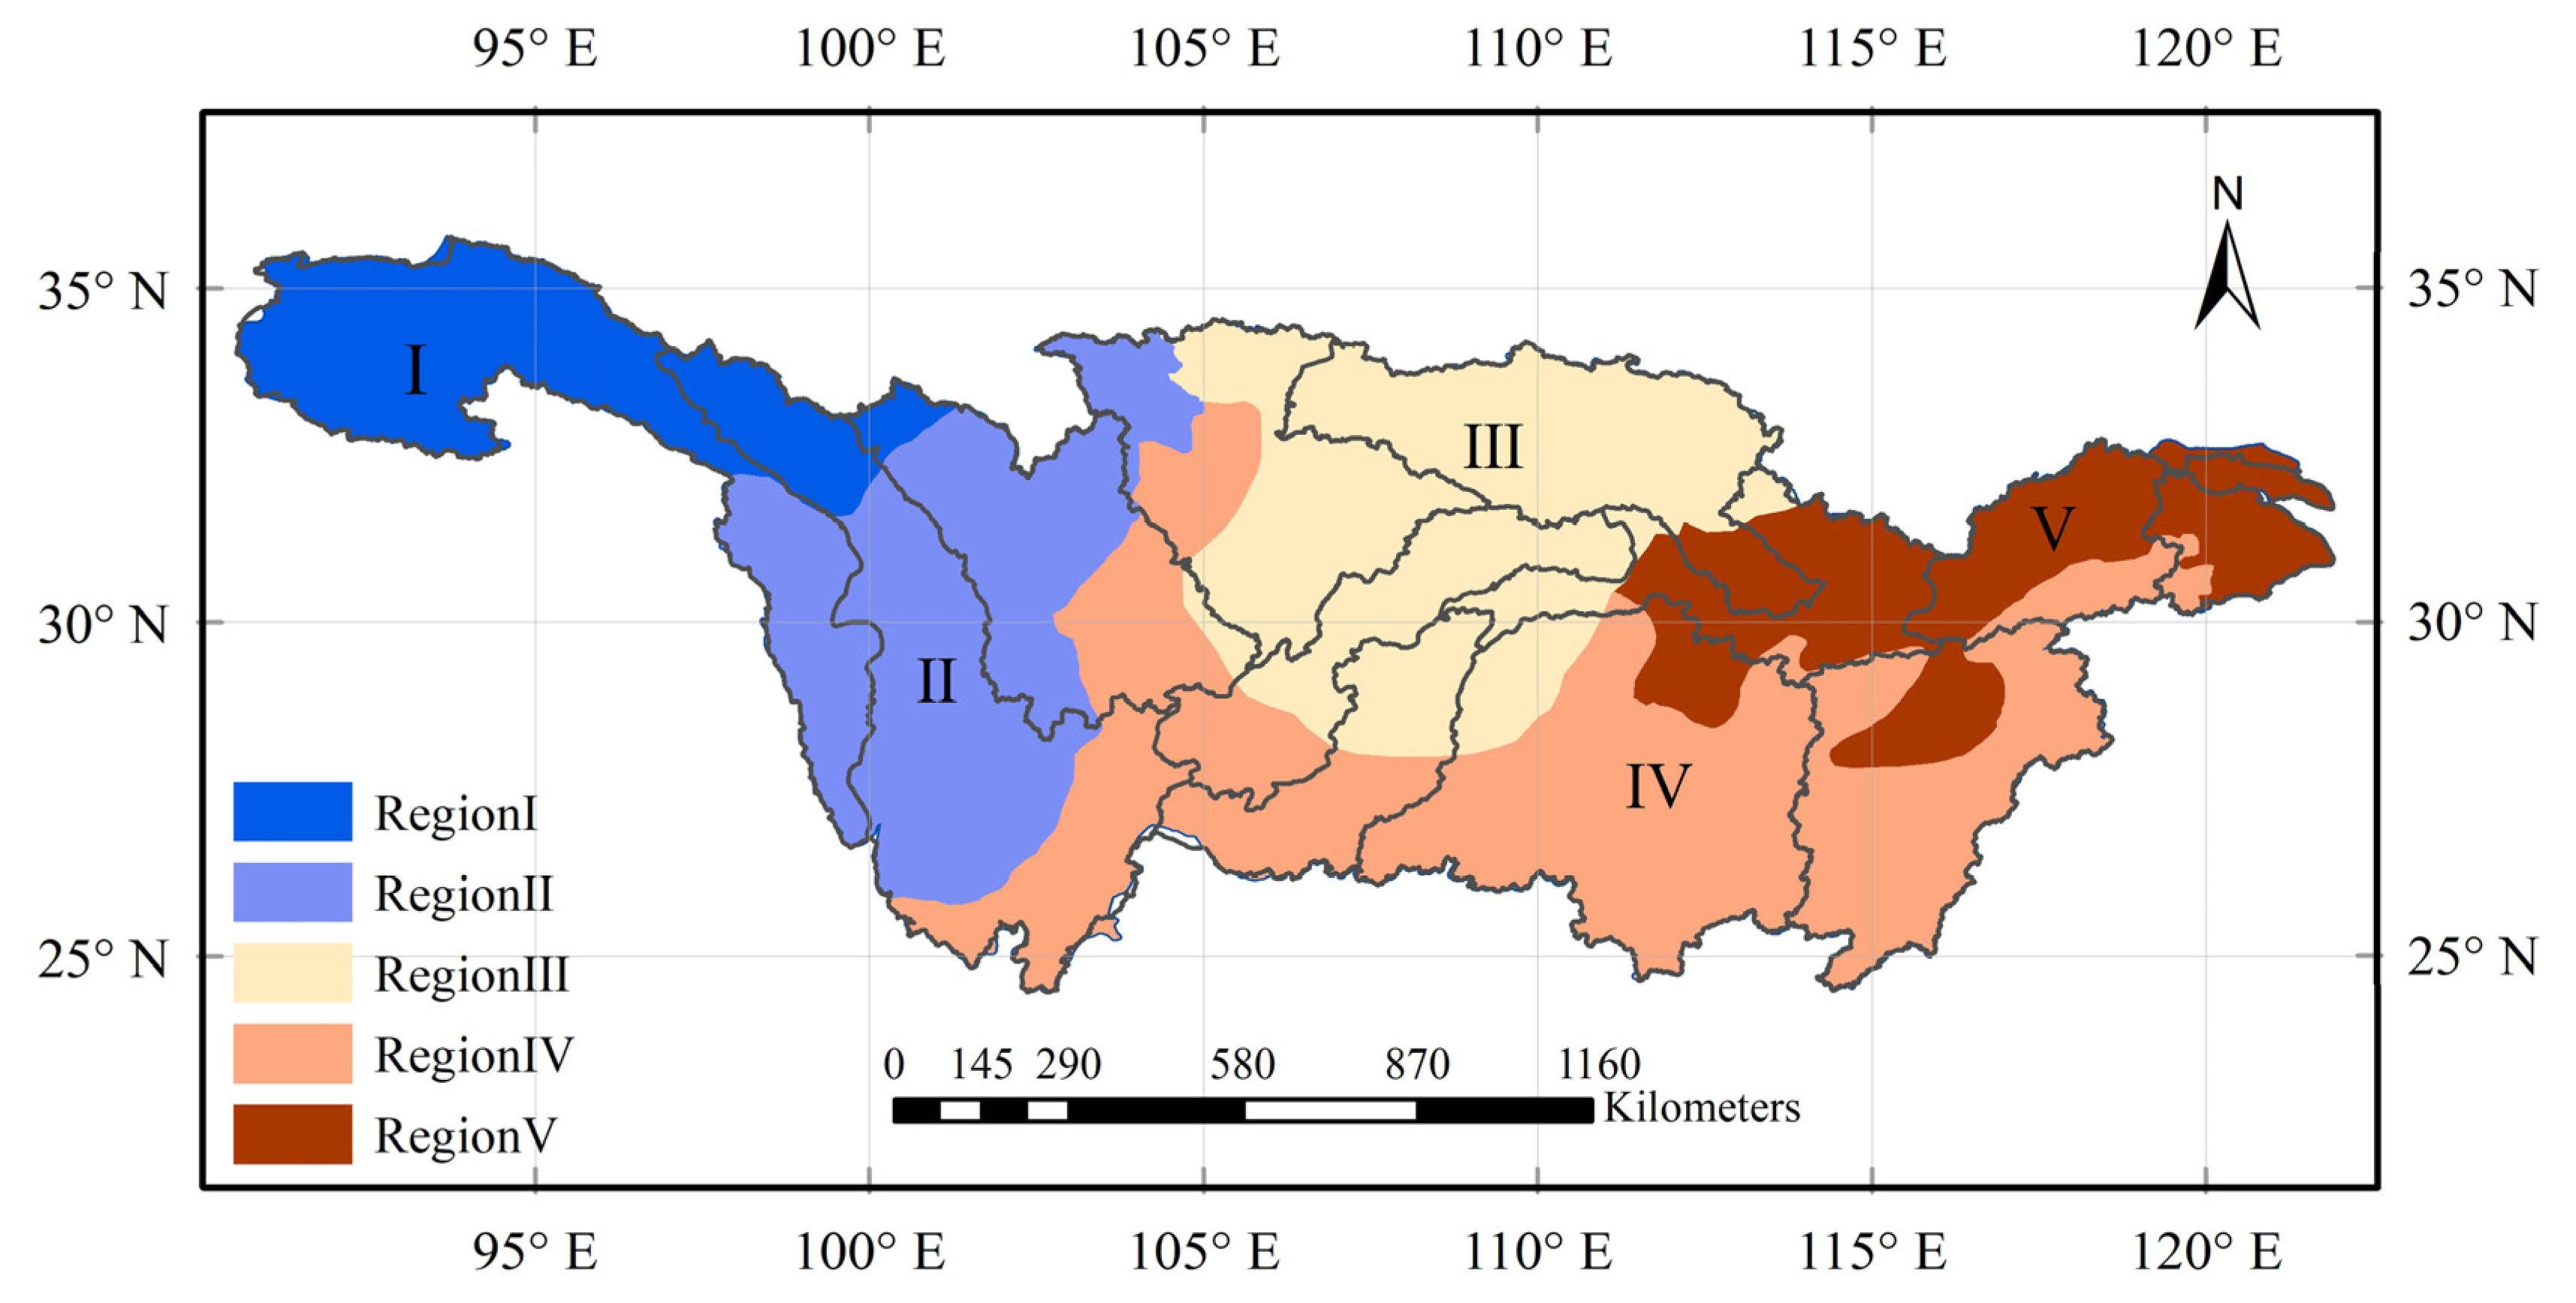
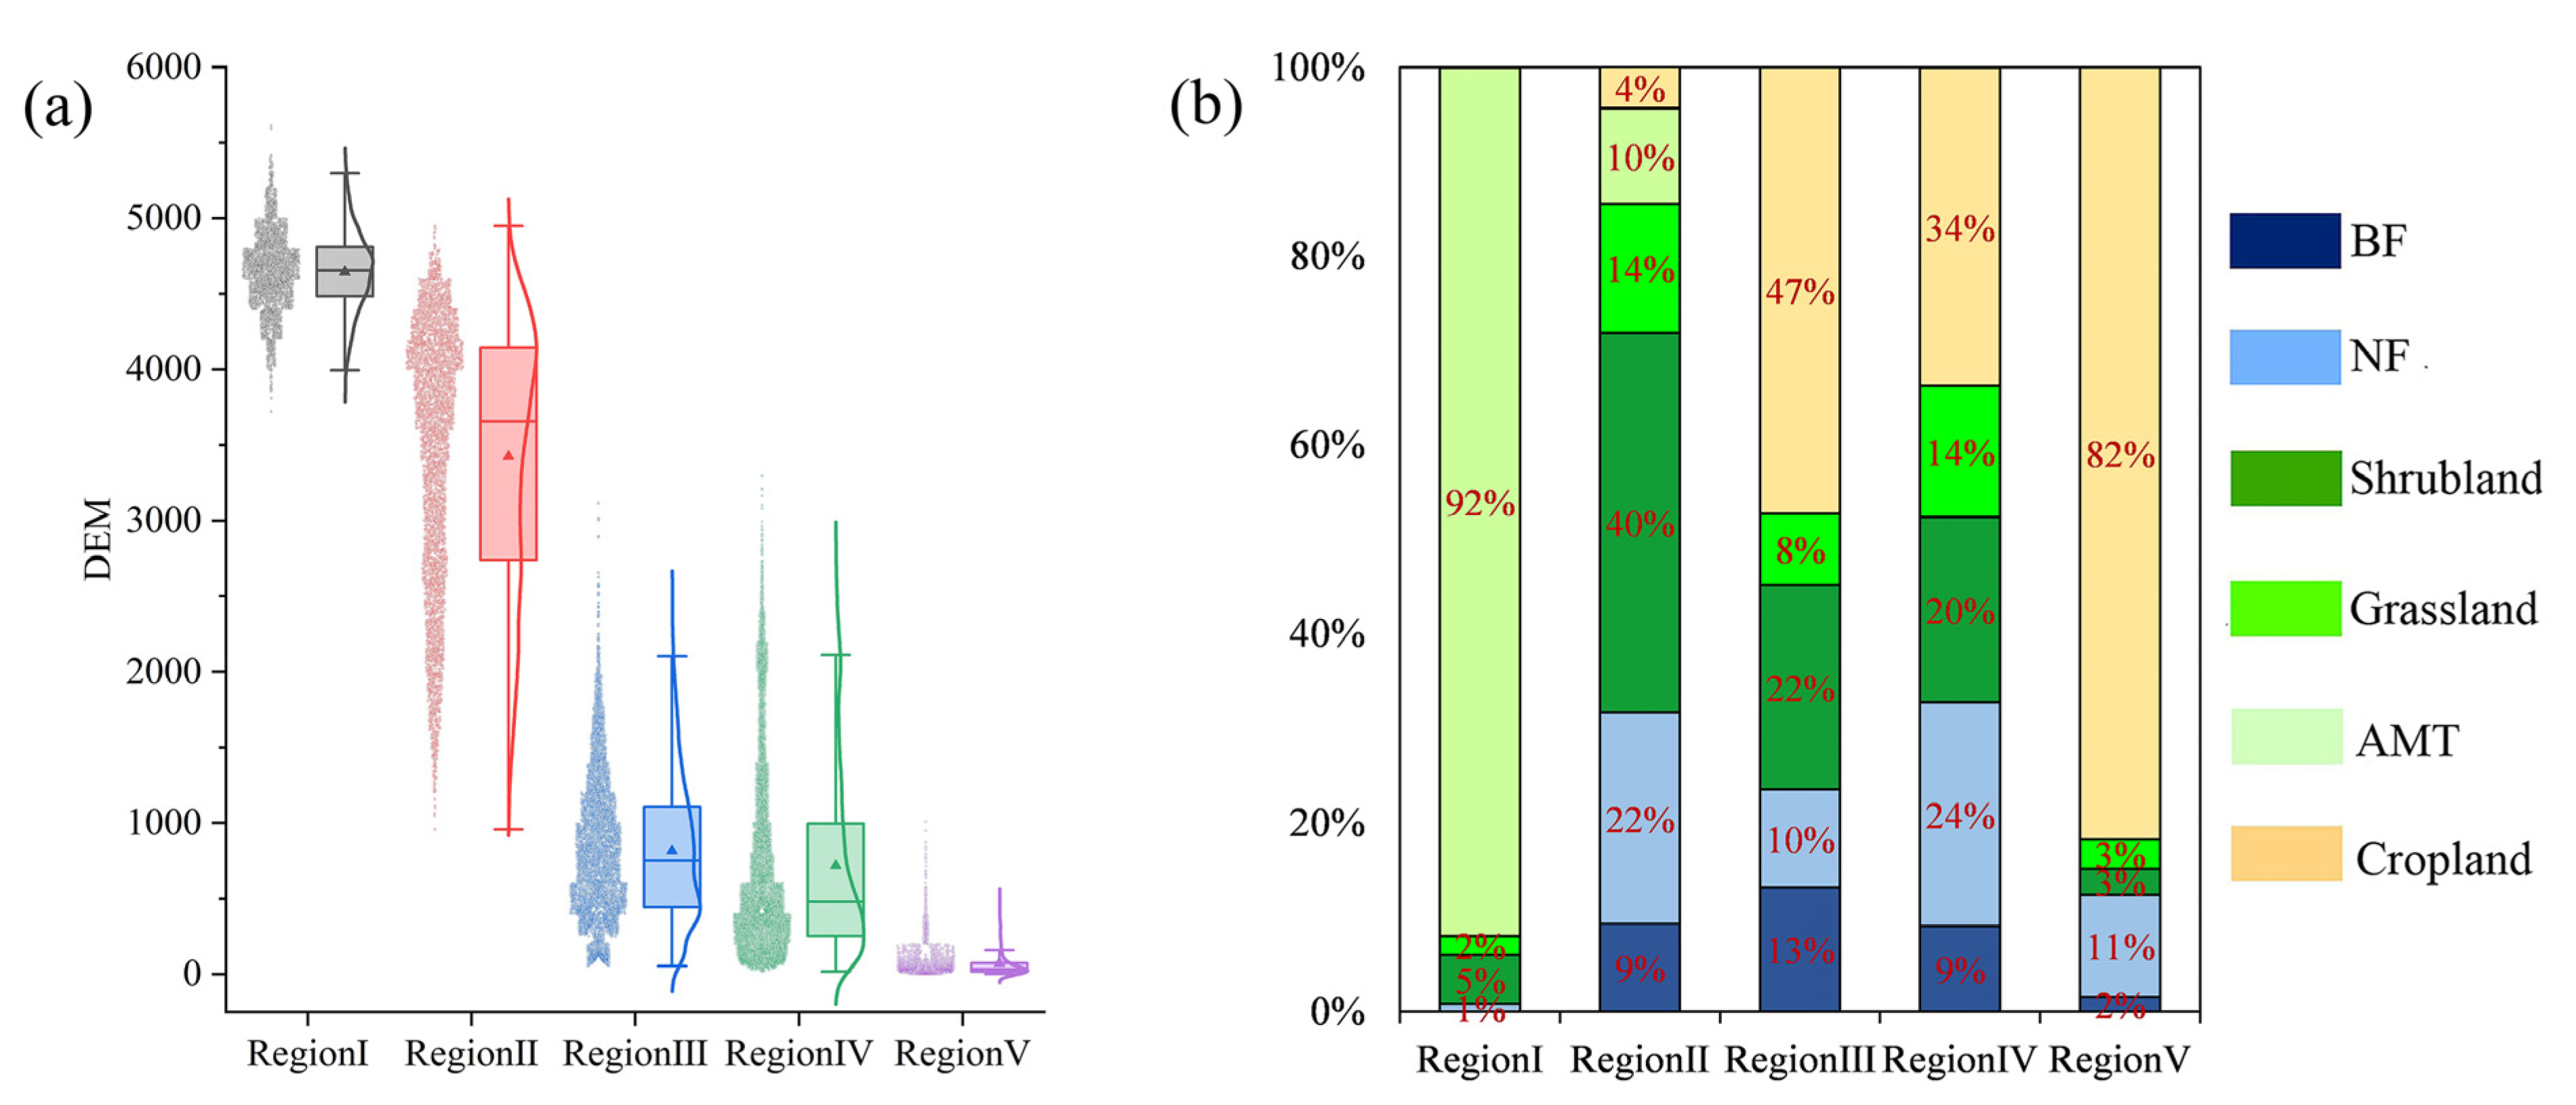
3.3.1. Regionalization of Vegetation Changes

To explore essential triggers of spatial heterogeneity on vegetation dynamics and their response to climate, K-means clustering analysis was used to divide the YZRB into several homogeneous subregions. To reduce the heterogeneity and discontinuity within the subregions, some subjective adjustments [68] were conducted after obtaining K-means clustering results based on the different types of properties. The adjustments included moving pixels from one subregion to another, deleting some pixels from a subregion, subdividing a subregion, eliminating a subregion, and combining two or more subregions (Figure S5). These adjustments have been used in many other regionalization studies with a large number of stations or grids [69,70]. Eventually, a more reasonable and consistent regionalization result was obtained and the YZRB was divided into five subregions (Figure 7), covering the source region of the YZRB (Region I), the Hengduan Mountains (Region II), the north-central YZRB (Region III), the south-central YZRB (Region IV) and the northeastern YZRB (Region V).
The elevation ranges and the percentages of vegetation types in different subregions shown in Figure 8 indicate that the subregion divisions and the distributions of elevation and vegetation types were consistent. The elevation in Region I was the highest among all subregions, with a mean value of 4650 m. The elevation values had a concentrated normal distribution, with a range of 4000–5300 m. In Region II, the mean elevation was 3400 m, and the distribution of elevation was leftward and discrete, ranging from 950 m to 4950 m. Regions III and IV both exhibited rightward distributions of elevation with a similar dispersion, while Region V had the lowest and most concentrated elevation with a mean value of 70 m. According to the percentage of different vegetation types in different subregions (Figure 7b), the vegetation in Region I was dominated by AMT (92%), whereas Region II was dominated by shrublands (40%) and complemented by forests (31%). However, vegetation in Regions III and IV was interspersed with croplands, shrublands, and forests, while 82% of the vegetation in Region V was croplands.
In summary, the elevation and vegetation types in the YZRB were consistent within a subregion but varied greatly among subregions. Region I was a high-elevation area dominated by AMT, Region II was a middle-elevation area dominated by shrubland and forest, Regions III and IV were low-elevation areas and had mixed vegetation types, and Region V was a plain area dominated by cropland. Nevertheless, despite the similarities in elevation and vegetation types, Regions III and IV were still divided into two subregions, indicating that vegetation changes and their sensitivity to climate variability in the YZRB were regionally different. Therefore, the following sections identify the differences among subregions.

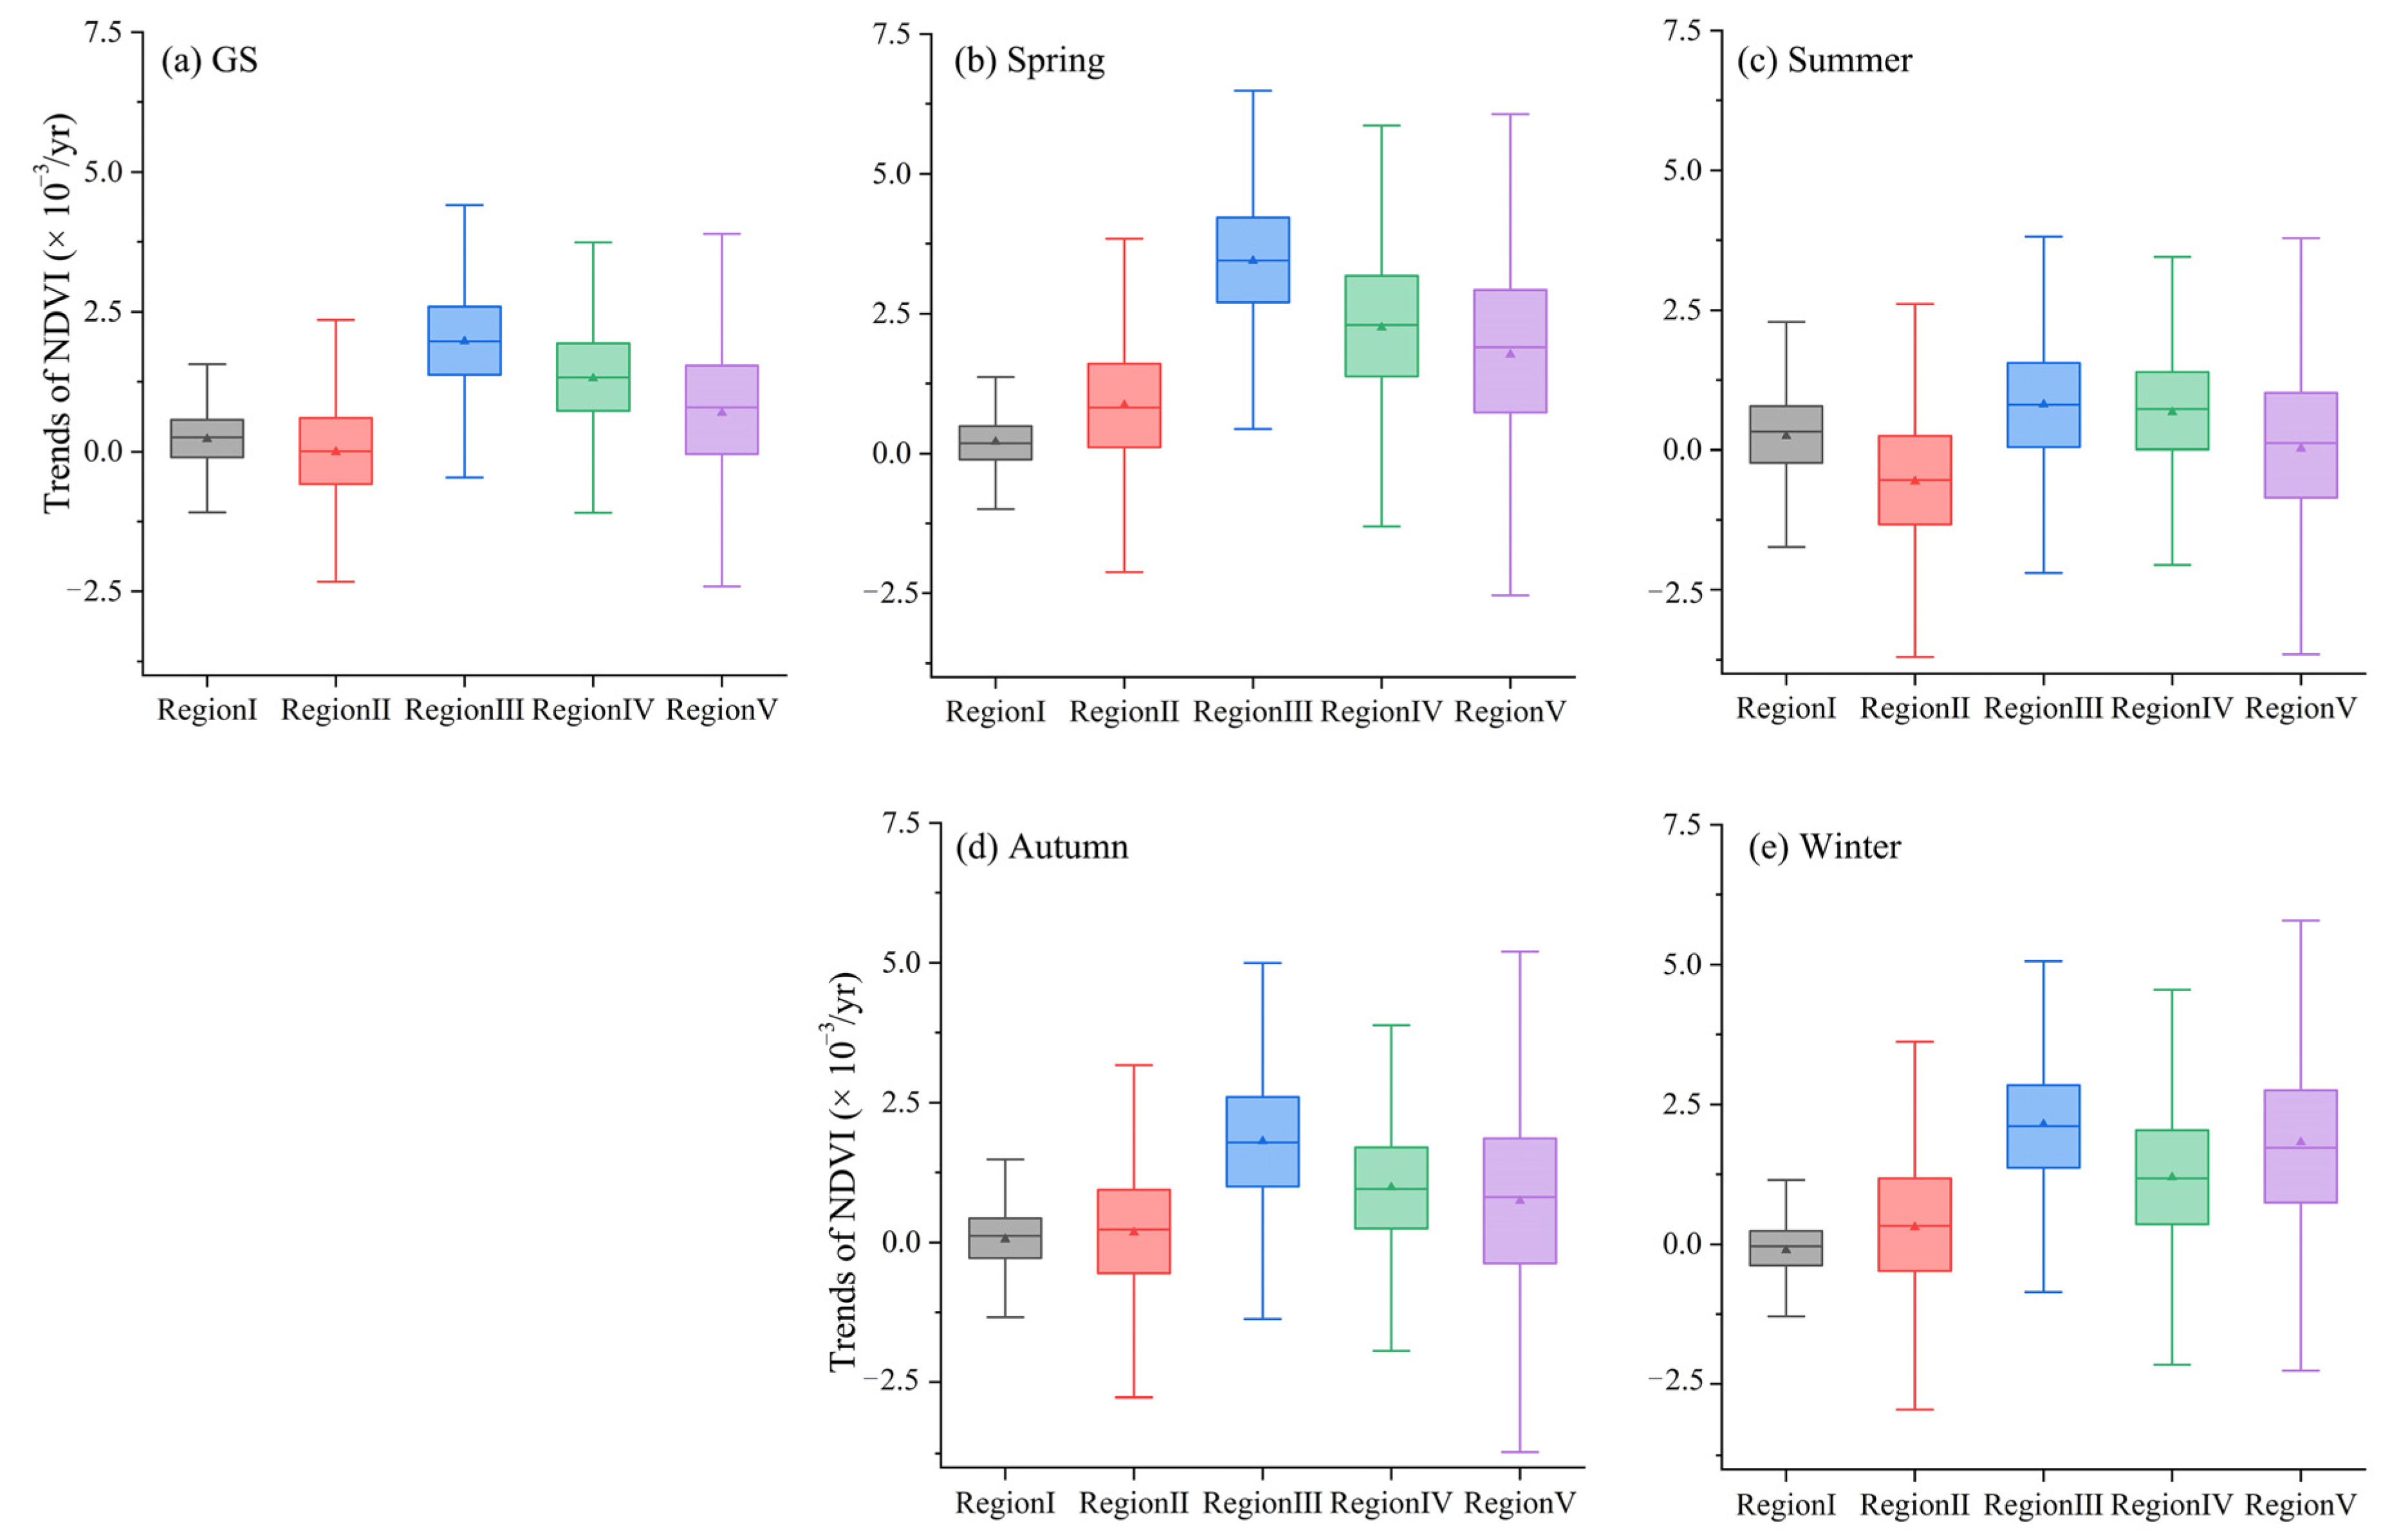
3.3.2. Regional Vegetation Dynamics

To investigate the vegetation changes in the YZRB at a regional scale, the linear trends and types of NDVI changes were compared in different subregions. Figure 9 shows the boxplots for the linear trends of the NDVI in each subregion during the GS and the four seasons. The linear trends of the GS and seasonal NDVI had distinct regional features, with smaller average rates of change in Regions I and II than in the other subregions and the largest average rate of change in Region III. For example, the average rates of change in the NDVI during the GS were Region II (0.01 × 10⁻³/yr) < Region I (0.22 × 10⁻³/yr) < Region V (0.69 × 10⁻³/yr) < Region IV (1.31 × 10⁻³/yr) < Region III (1.97 × 10⁻³/yr). Generally, the linear trends in all subregions displayed normal distributions, although the degrees of dispersion in different subregions and at different time scales were different. The dispersion degree of the trends in Region I was the smallest among all subregions during the GS and the four seasons, and the dispersion degree in Region V was the largest. Nevertheless, the dispersion degrees of the NDVI trends in the same subregion varied greatly at different time scales. Taking Region II as an example, the dispersion degrees of the NDVI trends were large in summer and winter, with ranges of −3.70 × 10⁻³/yr to 2.61 × 10⁻³/yr and −2.95 × 10⁻³/yr to 3.62 × 10⁻³/yr, respectively, followed by ranges of −2.12 × 10⁻³/yr to 3.84 × 10⁻³/yr and −2.77 × 10⁻³/yr to 3.17 × 10⁻³/yr in spring and autumn. The NDVI trends in the GS were more concentrated, ranging from −2.33 × 10⁻³/yr to 2.36 × 10⁻³/yr.
Figure S6 depicts the percentage of regional types of NDVI changes in the YZRB. The types of NDVI changes in Region I were fairly simple and consistent during the GS and four seasons, all of which were dominated by stable trends. In contrast, the types of NDVI changes in Region II were more complex and varied widely on different time scales, with the largest percentage of degraded vegetation among all subregions. The vegetation changes in Region III were dominated by significant increases in all seasons other than summer, and the percentage of significant increase in vegetation exceeded 85% in the GS and spring. For Regions IV and V, vegetation in the GS, spring, and winter mainly significantly increased, while the types of vegetation changes in summer and autumn were more complex.

3.3.3. Regional Vegetation Sensitivity

The climate conditions and vegetation sensitivity to climate in subregions are summarized in Table 1, with pronounced regional discrepancies. Among all subregions, Region I was the most arid, the coldest, and had the highest solar radiation. The VSI in Region I was the lowest, and the contribution of temperature to the VSI in this subregion was higher than the other climate variables. Despite the different climate conditions, Regions II, III, and IV had higher VSIs. The difference was that the VSIs in Regions II and III were determined by the combination of air temperature and solar radiation, while the contribution of solar radiation to the VSI was the greatest in Region IV. In the wetter and warmer Region V, the VSI was slightly larger than that in Region I, with the largest contribution of temperature to the VSI. However, precipitation contributed the least to the VSI in all regions.
The variabilities in the regional VSI and the contribution of climate variables were also investigated in this study. Figure S7f–j shows that the VSI exhibited fairly consistent dynamics in different subregions, with the VSI increasing sharply from 1994 to 1999 and then decreasing gradually. By combining the dynamics of climate variables (Figure S7a–e), the dominant climate factors affecting the VSI did not change, but the contribution of each climate variable to the VSI and its relationship with climate change varied greatly among different regions. As the weakest influencing factor, the contribution of precipitation to the VSI showed no clear changes with the interannual variations in precipitation, except in Region I where the contribution first decreased and then increased as precipitation increased. Nevertheless, as temperature increased during the 1982–2015 period, the contribution of temperature to the VSI first increased and then decreased in Regions I and II, whereas the contribution of temperature to the VSI decreased slightly in Regions III and V and increased gradually in Region IV. Moreover, the contribution of solar radiation to the VSI was positively associated with the interannual solar radiation variations, and the contribution of solar radiation to the VSI was great in all subregions except Regions I and V.

4. Discussion

4.1. Vegetation Dynamics and Their Sensitivity to Climate Variability

In accordance with previous studies [4,56,71], the distribution of the mean NDVI in the YZRB was spatially heterogeneous, with lower vegetation coverage in the western part and higher vegetation coverage in the central part. This study reported that vegetation coverage has gradually increased in the YZRB in the last three decades, and it has significantly improved in most areas, especially in the central part of the YZRB. Zhang et al. [4] confirmed these findings and explained that the significantly increased vegetation in the central part of the YZRB might result from the combined effects of climate changes and the implementation of the Yangtze River Shelterbelt Program. Moreover, there were some areas with linearly decreasing trends in the YZRB, which were mainly located in the Jinsha River Basin and the Yangtze River Delta. Li et al. [72] and Cao et al. [55] explained that the construction of the Three Gorges Dam in the Jinsha River Basin, rapid urbanization, and population expansion in the Yangtze River Delta were the main reasons for vegetation deterioration. However, previous studies on vegetation changes in the YZRB were mainly conducted on annual or growing season scales and did not monitor vegetation dynamics in multiple temporal dimensions (such as seasonal variations). In this study, vegetation dynamics revealed obvious seasonal characteristics in the YZRB (Figures S1–S3). For example, the greening trend in spring was the most obvious, while the percentage of areas with decreasing trends was largest in summer. The apparent greening of the YZRB in spring was possibly caused by the earlier beginning of the growing season, which has been confirmed by research in Central Europe [73]. Nevertheless, in those areas that experience extensive browning in summer, sufficient water–heat supplements caused vegetation to be almost saturated under natural conditions, thus the growth of vegetation would be limited if climate changed dramatically.
This study demonstrated that vegetation in the central part of the YZRB, which is dominated by forests and shrublands, displayed higher VSIs than grasslands in the source region, which is in agreement with recent conclusions that the sensitivity of vegetation to climate varies with vegetation type [32,33]. Solar radiation was the most essential element for vegetation sensitivity in the YZRB, followed by temperature, which has also been found in previous research in China [30,33,74]. However, other studies in the YZRB have indicated that temperature plays a dominant role in vegetation changes [4,75] because these studies considered only temperature and precipitation as influencing factors and ignored the effect of solar radiation. In addition, in agreement with the results in this study, Qu et al. [56] observed that the impact of precipitation on vegetation dynamics in the YZRB was weak due to adequate water supply from dense rivers. This study showed that vegetation sensitivity to climate variability had large fluctuations and exhibited consistent dynamics in all subregions, with the VSI increasing sharply from 1994 to 1999 and then decreasing gradually. This phenomenon was also found by Jiang et al. [33], who claimed that this was caused by the frequent climate variability in the early 1990s.

4.2. Changes and Sensitivity of Regional Vegetation

After dividing the YZRB into five subregions based on K-means clustering analysis, the distributions of the elevation and vegetation types showed great consistency with subregion divisions. First, the distributions of climate variables were latitudinally dependent, with temperature and solar radiation decreasing gradually with decreasing latitude [76]. Second, as mentioned above, different vegetation types had diverse responses to climate change [30,64,77]. In that case, the spatial patterns of vegetation dynamics and their sensitivity to climate variability were influenced by the geographic location, terrain, vegetation types, etc., which has also been discussed in many other studies [4,31,56,78,79]. For example, Chen et al. [78] reported that the correlation between vegetation and precipitation was closely related to the vegetation type and elevation. Research on vegetation dynamics on the Tibetan Plateau conducted by Liu et al. [79] and Li et al. [31] showed that the increasing rates of vegetation changes decreased as the elevation increased, while vegetation sensitivity to climate increased as the elevation increased.
Thus, regional vegetation changes and their sensitivity were analyzed in this study. Taking Region I as an example, no significant vegetation changes were observed in this subregion, and temperature was the dominant climate factor controlling the VSI due to the cold–dry climate conditions. However, as a warming–wetting trend occurred, the contribution of temperature to the VSI first increased as the contribution of precipitation decreased in Region I, and the contribution of temperature then decreased as the increasing contribution of precipitation increased. Qu et al. [56] explained that, in temperature-limited regions such as the Tibetan Plateau, a warmer climate could extend the growing season, which would thus promote vegetation growth; however, with continual temperature increases, the increasing evapotranspiration would result in drought and inhibit vegetation growth, leaving precipitation with an important role to play. Moreover, enhanced solar radiation could promote photorespiration and encourage vegetation growth, thus the contribution of solar radiation to the VSI was positively associated with the interannual solar radiation variations in all subregions. However, although solar radiation was the most crucial component for vegetation sensitivity in the YZRB, it had a modest effect on the VSI in Region I. Because sufficient sunlight resources satisfied the basic requirements of vegetation growth in this region, the changes in solar radiation had less impact on vegetation. This explanation is also supported by the research into vegetation changes in the Three-River Source Region of China conducted by Zhang et al. [80]. Generally, these findings regarding regional vegetation–climate interactions support the projection of vegetation responses to future climate changes.

4.3. Anthropogenic Factors Influencing Vegetation

Anthropogenic factors are also critical factors that influence vegetation dynamics, and the impact of anthropogenic factors is both positive and negative [4,10,13,14]. As overgrazing and land reclamation has severely damaged the ecological system, the Chinese government has implemented the nationwide Grain for Green Program (GTGP) since 1999, which has made a great contribution to vegetation restoration [14,66,81]. In addition, rapid economic expansion and a massive rising population have resulted in the degradation of vegetation surrounding cities [55,82]. As illustrated in Section 4.3, anthropogenic factors were the main factors contributing to the decreasing trends of the NDVI in the YZRB, while significant vegetation growth in the central part of the YZRB resulted from the combined effects of climate changes and anthropogenic factors. Qu et al. [54] also reported that the contributions of climate change and anthropogenic factors to vegetation dynamics in the YZRB were 70.37% and 29.63%, respectively. However, whether vegetation’s sensitivity to climate variability and spatial patterns of vegetation dynamics can be affected by anthropogenic factors needs more discussion.
Jiang et al. [33] analyzed the variability of the VSI in China and reported that areas with decreased VSIs in China coincided with the locations where ecological restoration projects (such as the Three-North Shelterbelt Program, the Yellow River Shelterbelt Program, and the Beijing-Tianjin Sandstorm Source Control Program) have been conducted. Stanimirova et al. [83] also proposed that effective livestock management could improve the resilience of vegetation productivity to climate variations. These studies indicated that anthropogenic factors could intensify vegetation resistance to climate variability and lead to low vegetation sensitivity to climate. However, in our study, VSIs showed increasing trends in some areas where the Yangtze River Shelterbelt Program was carried out, which is contrary to the previous statements. Chi et al. [84] explained that this might be due to the particular vulnerability of mountain needle-leaved forests to climate variability in southwestern China. Thus, vegetation is highly sensitive to climate despite experiencing considerable human activities, and this has also been confirmed by Zhang et al. [4] and Qu et al. [54] who found that climate change is still considered a dominant factor affecting vegetation dynamics in the YZRB. In general, vegetation sensitivity to climate variability is also influenced by anthropogenic factors, but the effectiveness of the influence depends on different environmental conditions.
On the other hand, it is well documented that the effects of anthropogenic factors on vegetation changes are spatially heterogeneous. Li et al. [85] concluded that the effectiveness of afforestation projects was influenced by elevation and slope gradients on China’s Loess Plateau. Qu et al. [54] explained that areas where croplands were converted to forests were primarily distributed below 1500 m with slopes less than 20°, while large-scale afforestation policies were difficult to conduct in high-elevation areas due to the complex topography and sparse population. Moreover, the effect of rapid economic development and population expansion on vegetation is spatially different, and more developed plain regions (such as the Yangtze River Delta) are more affected by human activities than high-elevation cities with lower economic levels [4]. These findings further elucidate how anthropogenic factors shape the spatial patterns of vegetation dynamics and support that the distribution of elevation is consistent with the regionalization results in our study.

4.4. Limitations and Uncertainties

Although the analysis of regional patterns of vegetation dynamics and their sensitivity to climate variability helps to better understand the mechanisms of the hydro-ecological cycle in the changing environments in the YZRB, there are still great limitations and uncertainties in this study that cannot be ignored. First, vegetation sensitivity to climate variability, as evaluated by the VSI in this study, overlooked time-lag and cumulative effects of climate factors on vegetation growth. As the significance of the time-lag and the cumulative effects has been confirmed in many studies [5,86,87], ignoring these effects leads to uncertainties in the contributions of climate variables to the VSI. Second, the spatiotemporal vegetation variations in the YZRB were analyzed at different time scales, while the investigation of variations in the VSI was limited to a single time scale (monthly). However, because of the seasonal non-uniformity in climate change, it is valuable to comprehensively consider whether variations in the VSI differ at finer temporal scales (i.e., seasonally). In addition, other potential mechanisms could affect the spatial patterns of vegetation dynamics, such as CO2 fertilization [11], extreme climatic events [88], snow cover conditions, and human activities [13]. However, due to the deficiencies in data and methodology, this study mainly focused on the effect of climate factors without considering other relevant indicators, which contributes to the uncertainties in the regionalization results. Thus, further studies are needed to address the limitations mentioned above by establishing a more comprehensive framework to explore the spatial patterns of vegetation dynamics at regional or global scales in the future.

5. Conclusions

In this study, the spatiotemporal vegetation variations in the YZRB were analyzed at different time scales during the 1982–2015 period, and vegetation sensitivity to climate variability was quantified using the VSI. Moreover, K-means clustering analysis was used to reveal the spatial patterns of vegetation changes, and vegetation dynamics and their sensitivity at a regional scale were then studied to explore the essential triggers of regional differences. Based on the above analysis and discussion, the following conclusions can be drawn:
(1) The GS-NDVI has increased significantly in the last three decades, and areas of vegetation with significantly increasing trends during the GS were mainly located in the central part of the YZRB, accounting for 53.1%. However, vegetation variations had great spatiotemporal differences in different seasons, with the greening trends most obvious in spring but most stable in summer.
(2) Vegetation in the central part of the YZRB, which is dominated by forests and shrublands, was more sensitive to climate variability than vegetation in the source region of the YZRB, which is dominated by AMT. Solar radiation was the dominant factor for vegetation sensitivity to climate variability in the southern YZRB. However, in the source region of the YZRB, the Sichuan Basin, and the middle-lower Yangtze Plain, temperature made great contributions to the VSI. Based on a 15-year moving window approach, 57.9% of the areas had increasing VSIs, especially in the south-central part of the YZRB. Nevertheless, the trends for the contributions of climate variables to the VSI were widely dispersed.
(3) Based on certain attributes, vegetation dynamics in the YZRB were divided into five spatial patterns, which showed great consistency with the distributions of elevation and vegetation types. Distinct regional features were observed in vegetation dynamics and their sensitivity on regional scales. Comparatively, the increasing NDVI trends were the smallest in Region I but the largest in Region III, while the VSI in Region IV was markedly larger than in Regions I and V. Moreover, the VSI exhibited fairly consistent dynamics in all subregions, though variations in the contribution of climate variables to the VSI and their relationships with climate changes varied greatly among different regions.

Supplementary Materials

The following supporting information can be downloaded at: https://www.mdpi.com/article/10.3390/rs14215623/s1, Figure S1: Spatial distributions of the seasonal mean NDVI from 1982 to 2015: (a) spring, (b) summer, (c) autumn, and (d) winter; Figure S2: Spatial distributions of the seasonal NDVI linear trends from 1982 to 2015: (a) spring, (b) summer, (c) autumn, and (d) winter; Figure S3: Spatial distributions of types of seasonal NDVI changes (statistical significance) from 1982 to 2015: (a) spring, (b) summer, (c) autumn, and (d) winter; Figure S4: Spatial distributions of trend types in the contribution of climate variables to VSI: (a) PRE, (b) TEM, and (c) RAD; Figure S5: Schematic of subjective adjustments for the K-means clustering analysis result; Figure S6: Percentage of types of GS and seasonal NDVI changes in subregions: (a) GS, (b) spring, (c) summer, (d) autumn, and (e) winter; Figure S7: Interannual variations in climate variables (a–e, blue solid lines are the regional PRE variations, red solid lines are the regional TEM variations, yellow solid lines are the regional RAD variations) and vegetation sensitivity to climate in subregions (f–j, black dashed lines are the regional VSI variations, blue solid lines are the regional variations in PRE contribution to VSI, red solid lines are the regional variations in TEM contribution to VSI, yellow solid lines are regional variations in RAD contribution to VSI).

Author Contributions

Conceptualization, Q.W.; data curation, Q.J.; funding acquisition, Q.J.; investigation, Q.W. and Y.W.; methodology, Y.W.; project administration, Q.J.; resources, Z.H.; software, Q.W.; supervision, X.F.; visualization, W.Z.; writing—original draft preparation, Q.W.; writing—review and editing, Y.D. and P.J. All authors have read and agreed to the published version of the manuscript.

Funding

This research was funded by the National Natural Science Foundation of China (Grant No. U2240217), National Key R&D Program of China (Grant No. 2021YFC3201104), Fundamental Research Funds for the Central Universities of China (Grant Nos. 2019B05014, B200203050), and the Belt and Road Special Foundation of the State Key Laboratory of Hydrology-Water Resources and Hydraulic Engineering (Grant No. 2021490611).

Data Availability Statement

Publicly available datasets were analyzed in this study. The NDVI dataset can be found here: http://ecocast.arc.nasa.gov/data/pub/gimms (accessed on 12 February 2020); the CMFD dataset can be found here: https://data.tpdc.ac.cn/en/data/8028b944-daaa-4511-8769-965612652c49 (accessed on 20 February 2020); the vegetation type data can be found here: https://www.resdc.cn (accessed on 8 March 2020).

Conflicts of Interest

The authors declare no conflict of interest.

References

  1. De Jong, R.; de Bruin, S.; de Wit, A.; Schaepman, M.E.; Dent, D.L. Analysis of monotonic greening and browning trends from global NDVI time-series. Remote Sens. Environ. 2011, 115, 692–702. [Google Scholar] [CrossRef] [Green Version]
  2. Erb, K.-H.; Kastner, T.; Plutzar, C.; Bais, A.L.S.; Carvalhais, N.; Fetzel, T.; Gingrich, S.; Haberl, H.; Lauk, C.; Niedertscheider, M. Unexpectedly large impact of forest management and grazing on global vegetation biomass. Nature 2018, 553, 73–76. [Google Scholar] [CrossRef] [PubMed]
  3. Law, B.; Falge, E.; Gu, L.V.; Baldocchi, D.; Bakwin, P.; Berbigier, P.; Davis, K.; Dolman, A.; Falk, M.; Fuentes, J. Environmental controls over carbon dioxide and water vapor exchange of terrestrial vegetation. Agric. For. Meteorol. 2002, 113, 97–120. [Google Scholar] [CrossRef] [Green Version]
  4. Zhang, W.; Wang, L.; Xiang, F.; Qin, W.; Jiang, W. Vegetation dynamics and the relations with climate change at multiple time scales in the Yangtze River and Yellow River Basin, China. Ecol. Indic. 2020, 110, 105892. [Google Scholar] [CrossRef]
  5. Zuo, D.; Han, Y.; Xu, Z.; Li, P.; Ban, C.; Sun, W.; Pang, B.; Peng, D.; Kan, G.; Zhang, R. Time-lag effects of climatic change and drought on vegetation dynamics in an alpine river basin of the Tibet Plateau, China. J. Hydrol. 2021, 600, 126532. [Google Scholar] [CrossRef]
  6. Fensholt, R.; Rasmussen, K.; Nielsen, T.T.; Mbow, C. Evaluation of earth observation based long term vegetation trends—Intercomparing NDVI time series trend analysis consistency of Sahel from AVHRR GIMMS, Terra MODIS and SPOT VGT data. Remote Sens. Environ. 2009, 113, 1886–1898. [Google Scholar] [CrossRef]
  7. Fang, H.; Baret, F.; Plummer, S.; Schaepman-Strub, G. An overview of global leaf area index (LAI): Methods, products, validation, and applications. Rev. Geophys. 2019, 57, 739–799. [Google Scholar] [CrossRef]
  8. Huete, A.; Didan, K.; Miura, T.; Rodriguez, E.P.; Gao, X.; Ferreira, L.G. Overview of the radiometric and biophysical performance of the MODIS vegetation indices. Remote Sens. Environ. 2002, 83, 195–213. [Google Scholar] [CrossRef]
  9. Bageshree, K.; Kinouchi, T. Unraveling the Multiple Drivers of Greening-Browning and Leaf Area Variability in a Socioeconomically Sensitive Drought-Prone Region. Climate 2022, 10, 70. [Google Scholar] [CrossRef]
  10. Gao, W.; Zheng, C.; Liu, X.; Lu, Y.; Chen, Y.; Wei, Y.; Ma, Y. NDVI-based vegetation dynamics and their responses to climate change and human activities from 1982 to 2020: A case study in the Mu Us Sandy Land, China. Ecol. Indic. 2022, 137, 108745. [Google Scholar] [CrossRef]
  11. Zhu, Z.; Piao, S.; Myneni, R.B.; Huang, M.; Zeng, Z.; Canadell, J.G.; Ciais, P.; Sitch, S.; Friedlingstein, P.; Arneth, A. Greening of the Earth and its drivers. Nat. Clim. Chang. 2016, 6, 791–795. [Google Scholar] [CrossRef]
  12. Liu, Y.; Li, Y.; Li, S.; Motesharrei, S. Spatial and temporal patterns of global NDVI trends: Correlations with climate and human factors. Remote Sens. 2015, 7, 13233–13250. [Google Scholar] [CrossRef] [Green Version]
  13. Jiang, L.; Guli, J.; Bao, A.; Guo, H.; Ndayisaba, F. Vegetation dynamics and responses to climate change and human activities in Central Asia. Sci. Total Environ. 2017, 599–600, 967–980. [Google Scholar] [CrossRef] [PubMed]
  14. Ge, W.; Deng, L.; Wang, F.; Han, J. Quantifying the contributions of human activities and climate change to vegetation net primary productivity dynamics in China from 2001 to 2016. Sci. Total Environ. 2021, 773, 145648. [Google Scholar] [CrossRef]
  15. Bonan, G.B. Forests and climate change: Forcings, feedbacks, and the climate benefits of forests. Science 2008, 320, 1444–1449. [Google Scholar] [CrossRef] [Green Version]
  16. Doughty, C.E.; Metcalfe, D.; Girardin, C.; Amézquita, F.F.; Cabrera, D.G.; Huasco, W.H.; Silva-Espejo, J.; Araujo-Murakami, A.; Da Costa, M.; Rocha, W. Drought impact on forest carbon dynamics and fluxes in Amazonia. Nature 2015, 519, 78–82. [Google Scholar] [CrossRef] [Green Version]
  17. Myers-Smith, I.H.; Elmendorf, S.C.; Beck, P.S.; Wilmking, M.; Hallinger, M.; Blok, D.; Tape, K.D.; Rayback, S.A.; Macias-Fauria, M.; Forbes, B.C. Climate sensitivity of shrub growth across the tundra biome. Nat. Clim. Chang. 2015, 5, 887–891. [Google Scholar] [CrossRef] [Green Version]
  18. Braswell, B.; Schimel, D.S.; Linder, E.; Moore, B. The response of global terrestrial ecosystems to interannual temperature variability. Science 1997, 278, 870–873. [Google Scholar] [CrossRef]
  19. Zhu, W.; Tian, H.; Xu, X.; Pan, Y.; Chen, G.; Lin, W. Extension of the growing season due to delayed autumn over mid and high latitudes in North America during 1982–2006. Glob. Ecol. Biogeogr. 2012, 21, 260–271. [Google Scholar] [CrossRef]
  20. Wang, S.; Zhang, B.; Yang, Q.; Chen, G.; Yang, B.; Lu, L.; Shen, M.; Peng, Y. Responses of net primary productivity to phenological dynamics in the Tibetan Plateau, China. Agric. For. Meteorol. 2017, 232, 235–246. [Google Scholar] [CrossRef]
  21. Nielsen, U.N.; Ball, B.A. Impacts of altered precipitation regimes on soil communities and biogeochemistry in arid and semi-arid ecosystems. Glob. Chang. Biol. 2015, 21, 1407–1421. [Google Scholar] [CrossRef] [PubMed]
  22. Vicente-Serrano, S.M.; Gouveia, C.; Camarero, J.J.; Beguería, S.; Trigo, R.; López-Moreno, J.I.; Azorín-Molina, C.; Pasho, E.; Lorenzo-Lacruz, J.; Revuelto, J. Response of vegetation to drought time-scales across global land biomes. Proc. Natl. Acad. Sci. USA 2013, 110, 52–57. [Google Scholar] [CrossRef] [PubMed] [Green Version]
  23. Li, X.; Xiao, J.; He, B. Higher absorbed solar radiation partly offset the negative effects of water stress on the photosynthesis of Amazon forests during the 2015 drought. Environ. Res. Lett. 2018, 13, 044005. [Google Scholar] [CrossRef]
  24. Monteith, J. Solar radiation and productivity in tropical ecosystems. J. Appl. Ecol. 1972, 9, 747–766. [Google Scholar] [CrossRef] [Green Version]
  25. Lloret, F.; Escudero, A.; Iriondo, J.M.; Martínez-Vilalta, J.; Valladares, F. Extreme climatic events and vegetation: The role of stabilizing processes. Glob. Chang. Biol. 2012, 18, 797–805. [Google Scholar] [CrossRef]
  26. Zeng, Z.; Piao, S.; Li, L.Z.; Zhou, L.; Ciais, P.; Wang, T.; Li, Y.; Lian, X.; Wood, E.F.; Friedlingstein, P. Climate mitigation from vegetation biophysical feedbacks during the past three decades. Nat. Clim. Chang. 2017, 7, 432–436. [Google Scholar] [CrossRef]
  27. Chu, H.; Venevsky, S.; Wu, C.; Wang, M. NDVI-based vegetation dynamics and its response to climate changes at Amur-Heilongjiang River Basin from 1982 to 2015. Sci. Total Environ. 2019, 650, 2051–2062. [Google Scholar] [CrossRef]
  28. Li, G.; Sun, S.; Han, J.; Yan, J.; Liu, W.; Wei, Y.; Lu, N.; Sun, Y. Impacts of Chinese Grain for Green program and climate change on vegetation in the Loess Plateau during 1982–2015. Sci. Total Environ. 2019, 660, 177–187. [Google Scholar] [CrossRef]
  29. Sun, W.C.; Wang, Y.Y.; Fu, Y.S.H.; Xue, B.L.; Wang, G.Q.; Yu, J.S.; Zuo, D.P.; Xu, Z.X. Spatial heterogeneity of changes in vegetation growth and their driving forces based on satellite observations of the Yarlung Zangbo River Basin in the Tibetan Plateau. J. Hydrol. 2019, 574, 324–332. [Google Scholar] [CrossRef]
  30. Seddon, A.W.; Macias-Fauria, M.; Long, P.R.; Benz, D.; Willis, K.J. Sensitivity of global terrestrial ecosystems to climate variability. Nature 2016, 531, 229. [Google Scholar] [CrossRef]
  31. Li, L.; Zhang, Y.; Wu, J.; Li, S.; Zhang, B.; Zu, J.; Zhang, H.; Ding, M.; Paudel, B. Increasing sensitivity of alpine grasslands to climate variability along an elevational gradient on the Qinghai-Tibet Plateau. Sci. Total Environ. 2019, 678, 21–29. [Google Scholar] [CrossRef] [PubMed]
  32. Zhu, Y.K.; Zhang, J.T.; Zhang, Y.Q.; Qin, S.G.; Shao, Y.Y.; Gao, Y. Responses of vegetation to climatic variations in the desert region of northern China. CATENA 2019, 175, 27–36. [Google Scholar] [CrossRef]
  33. Jiang, P.; Ding, W.; Yuan, Y.; Ye, W.; Mu, Y. Interannual variability of vegetation sensitivity to climate in China. J. Environ. Manag. 2022, 301, 113768. [Google Scholar] [CrossRef] [PubMed]
  34. Yuan, Y.; Bao, A.; Liu, T.; Zheng, G.; Jiang, L.; Guo, H.; Jiang, P.; Yu, T.; de Maeyer, P. Assessing vegetation stability to climate variability in Central Asia. J. Environ. Manag. 2021, 298, 113330. [Google Scholar] [CrossRef]
  35. Jiang, L.; Liu, B.; Yuan, Y. Quantifying Vegetation Vulnerability to Climate Variability in China. Remote Sens. 2022, 14, 3491. [Google Scholar] [CrossRef]
  36. Craine, J.M.; Ocheltree, T.W.; Nippert, J.B.; Towne, E.; Skibbe, A.M.; Kembel, S.W.; Fargione, J.E. Global diversity of drought tolerance and grassland climate-change resilience. Nat. Clim. Chang. 2013, 3, 63–67. [Google Scholar] [CrossRef]
  37. Holmgren, M.; Hirota, M.; van Nes, E.H.; Scheffer, M. Effects of interannual climate variability on tropical tree cover. Nat. Clim. Chang. 2013, 3, 755–758. [Google Scholar] [CrossRef]
  38. Hou, W.; Gao, J.; Wu, S.; Dai, E. Interannual variations in growing-season NDVI and its correlation with climate variables in the southwestern karst region of China. Remote Sens. 2015, 7, 11105–11124. [Google Scholar] [CrossRef] [Green Version]
  39. Liu, H.; Zhang, M.; Lin, Z.; Xu, X. Spatial heterogeneity of the relationship between vegetation dynamics and climate change and their driving forces at multiple time scales in Southwest China. Agric. For. Meteorol. 2018, 256, 10–21. [Google Scholar] [CrossRef]
  40. De Jong, R.; Schaepman, M.E.; Furrer, R.; de Bruin, S.; Verburg, P.H. Spatial relationship between climatologies and changes in global vegetation activity. Glob. Chang. Biol. 2013, 19, 1953–1964. [Google Scholar] [CrossRef]
  41. Julien, Y.; Sobrino, J.A.; Verhoef, W. Changes in land surface temperatures and NDVI values over Europe between 1982 and 1999. Remote Sens. Environ. 2006, 103, 43–55. [Google Scholar] [CrossRef]
  42. Xiao, J.; Moody, A. Geographical distribution of global greening trends and their climatic correlates: 1982–1998. Int. J. Remote Sens. 2005, 26, 2371–2390. [Google Scholar] [CrossRef]
  43. Zhang, Y.; Zhu, Z.; Liu, Z.; Zeng, Z.; Ciais, P.; Huang, M.; Liu, Y.; Piao, S. Seasonal and interannual changes in vegetation activity of tropical forests in Southeast Asia. Agric. For. Meteorol. 2016, 224, 1–10. [Google Scholar] [CrossRef]
  44. Nemani, R.R.; Keeling, C.D.; Hashimoto, H.; Jolly, W.M.; Piper, S.C.; Tucker, C.J.; Myneni, R.B.; Running, S.W. Climate-driven increases in global terrestrial net primary production from 1982 to 1999. Science 2003, 300, 1560–1563. [Google Scholar] [CrossRef] [PubMed] [Green Version]
  45. Liu, H.; Mi, Z.; Lin, L.; Wang, Y.; Zhang, Z.; Zhang, F.; Wang, H.; Liu, L.; Zhu, B.; Cao, G. Shifting plant species composition in response to climate change stabilizes grassland primary production. Proc. Natl. Acad. Sci. USA 2018, 115, 4051–4056. [Google Scholar] [CrossRef] [Green Version]
  46. Heisler-White, J.L.; Blair, J.M.; Kelly, E.F.; Harmoney, K.; Knapp, A.K. Contingent productivity responses to more extreme rainfall regimes across a grassland biome. Glob. Chang. Biol. 2009, 15, 2894–2904. [Google Scholar] [CrossRef]
  47. Mu, S.; Yang, H.; Li, J.; Chen, Y.; Gang, C.; Zhou, W.; Ju, W. Spatio-temporal dynamics of vegetation coverage and its relationship with climate factors in Inner Mongolia, China. J. Geogr. Sci. 2013, 23, 231–246. [Google Scholar] [CrossRef]
  48. Jolliffe, I.T.; Philipp, A. Some recent developments in cluster analysis. Phys. Chem. Earth Parts A/B/C 2010, 35, 309–315. [Google Scholar] [CrossRef]
  49. Knapp, P.A.; Grissino-Mayer, H.D.; Soulé, P.T. Climatic regionalization and the spatio-temporal occurrence of extreme single-year drought events (1500–1998) in the interior Pacific Northwest, USA. Quat. Res. 2002, 58, 226–233. [Google Scholar] [CrossRef] [Green Version]
  50. Yang, T.; Xu, C.-Y.; Shao, Q.-X.; Chen, X. Regional flood frequency and spatial patterns analysis in the Pearl River Delta region using L-moments approach. Stoch. Environ. Res. Risk Assess. 2010, 24, 165–182. [Google Scholar] [CrossRef]
  51. Chen, Z.; Wang, W.; Woods, R.A.; Shao, Q. Hydrological effects of change in vegetation components across global catchments. J. Hydrol. 2020, 595, 125775. [Google Scholar] [CrossRef]
  52. Rodriguez-Iturbe, I. Ecohydrology: A hydrologic perspective of climate-soil-vegetation dynamies. Water Resour. Res. 2000, 36, 3–9. [Google Scholar] [CrossRef] [Green Version]
  53. Zhang, Y.; Song, C.; Zhang, K.; Cheng, X.; Zhang, Q. Spatial–temporal variability of terrestrial vegetation productivity in the Yangtze River Basin during 2000–2009. J. Plant Ecol. 2014, 7, 10–23. [Google Scholar] [CrossRef] [Green Version]
  54. Qu, S.; Wang, L.; Lin, A.; Yu, D.; Yuan, M. Distinguishing the impacts of climate change and anthropogenic factors on vegetation dynamics in the Yangtze River Basin, China. Ecol. Indic. 2020, 108, 105724. [Google Scholar] [CrossRef]
  55. Cao, Y.; Wang, Y.; Li, G.; Fang, X. Vegetation Response to Urban Landscape Spatial Pattern Change in the Yangtze River Delta, China. Sustainability 2019, 12, 68. [Google Scholar] [CrossRef] [Green Version]
  56. Qu, S.; Wang, L.C.; Lin, A.W.; Zhu, H.J.; Yuan, M.X. What drives the vegetation restoration in Yangtze River basin, China: Climate change or anthropogenic factors? Ecol. Indic. 2018, 90, 438–450. [Google Scholar] [CrossRef]
  57. Ju, Q.; Yu, Z.; Hao, Z.; Ou, G.; Wu, Z.; Yang, C.; Gu, H. Response of hydrologic processes to future climate changes in the Yangtze River Basin. J. Hydrol. Eng. 2014, 19, 211–222. [Google Scholar] [CrossRef]
  58. Holben, B.N. Characteristics of maximum-value composite images from temporal AVHRR data. Int. J. Remote Sens. 1986, 7, 1417–1434. [Google Scholar] [CrossRef]
  59. He, J.; Yang, K.; Tang, W.; Lu, H.; Qin, J.; Chen, Y.; Li, X. The first high-resolution meteorological forcing dataset for land process studies over China. Sci. Data 2020, 7, 25. [Google Scholar] [CrossRef] [Green Version]
  60. Yang, K.; He, J.; Tang, W.; Qin, J.; Cheng, C.C. On downward shortwave and longwave radiations over high altitude regions: Observation and modeling in the Tibetan Plateau. Agric. For. Meteorol. 2010, 150, 38–46. [Google Scholar] [CrossRef]
  61. Yang, L.; Feng, Q.; Adamowski, J.F.; Alizadeh, M.R.; Yin, Z.; Wen, X.; Zhu, M. The role of climate change and vegetation greening on the variation of terrestrial evapotranspiration in northwest China’s Qilian Mountains. Sci. Total Environ. 2020, 759, 143532. [Google Scholar] [CrossRef] [PubMed]
  62. Yang, L.; Feng, Q.; Zhu, M.; Wang, L.; Alizadeh, M.R.; Adamowski, J.F.; Wen, X.; Yin, Z. Variation in actual evapotranspiration and its ties to climate change and vegetation dynamics in northwest China. J. Hydrol. 2022, 607, 127533. [Google Scholar] [CrossRef]
  63. Gu, Z.J.; Duan, X.W.; Shi, Y.D.; Li, Y.; Pan, X. Spatiotemporal variation in vegetation coverage and its response to climatic factors in the Red River Basin, China. Ecol. Indic. 2018, 93, 54–64. [Google Scholar] [CrossRef]
  64. Peng, S.S.; Chen, A.P.; Xu, L.; Cao, C.X.; Fang, J.Y.; Myneni, R.B.; Pinzon, J.E.; Tucker, C.J.; Piao, S.L. Recent change of vegetation growth trend in China. Environ. Res. Lett. 2011, 6, 044027. [Google Scholar] [CrossRef]
  65. Jiang, W.G.; Yuan, L.H.; Wang, W.J.; Cao, R.; Zhang, Y.F.; Shen, W.M. Spatio-temporal analysis of vegetation variation in the Yellow River Basin. Ecol. Indic. 2015, 51, 117–126. [Google Scholar] [CrossRef]
  66. Tian, F.; Liu, L.-Z.; Yang, J.-H.; Wu, J.-J. Vegetation greening in more than 94% of the Yellow River Basin (YRB) region in China during the 21st century caused jointly by warming and anthropogenic activities. Ecol. Indic. 2021, 125, 107479. [Google Scholar] [CrossRef]
  67. Cui, L.; Pang, B.; Zhao, G.; Ban, C.; Ren, M.; Peng, D.; Zuo, D.; Zhu, Z. Assessing the Sensitivity of Vegetation Cover to Climate Change in the Yarlung Zangbo River Basin Using Machine Learning Algorithms. Remote Sens. 2022, 14, 1556. [Google Scholar] [CrossRef]
  68. Hosking, J.; Wallis, J. Regional Frequency Analysis, Regional Frequency Analysis; Cambridge University Press: Cambridge, UK, 1997. [Google Scholar]
  69. Wu, F.; Yang, X.; Shen, Z. A three-stage hybrid model for regionalization, trends and sensitivity analyses of temperature anomalies in China from 1966 to 2015. Atmos. Res. 2018, 205, 80–92. [Google Scholar] [CrossRef]
  70. Yu, Y.; Shao, Q.X.; Lin, Z.H. Regionalization study of maximum daily temperature based on grid data by an objective hybrid clustering approach. J. Hydrol. 2018, 564, 149–163. [Google Scholar] [CrossRef]
  71. Xu, L.; Yu, G.; Tu, Z.; Zhang, Y.; Tsendbazar, N.-E. Monitoring vegetation change and their potential drivers in Yangtze River Basin of China from 1982 to 2015. Environ. Monit. Assess. 2020, 192, 642. [Google Scholar] [CrossRef]
  72. Li, K.; Zhu, C.; Wu, L.; Huang, L. Problems caused by the Three Gorges Dam construction in the Yangtze River basin: A review. Environ. Rev. 2013, 21, 127–135. [Google Scholar] [CrossRef]
  73. Kern, A.; Marjanović, H.; Barcza, Z. Spring vegetation green-up dynamics in Central Europe based on 20-year long MODIS NDVI data. Agric. For. Meteorol. 2020, 287, 107969. [Google Scholar] [CrossRef]
  74. Ding, Y.; Li, Z.; Peng, S. Global analysis of time-lag and-accumulation effects of climate on vegetation growth. Int. J. Appl. Earth Obs. Geoinf. 2020, 92, 102179. [Google Scholar] [CrossRef]
  75. Zhang, L.; Chen, X.; Cai, X.; Salim, H.A. Spatial-temporal changes of NDVI and their relations with precipitation and temperature in Yangtze River basin from 1981 to 2001. Geo-Spat. Inf. Sci. 2010, 13, 186–190. [Google Scholar] [CrossRef]
  76. Chen, C.; He, B.; Yuan, W.; Guo, L.; Zhang, Y. Increasing interannual variability of global vegetation greenness. Environ. Res. Lett. 2019, 14, 124005. [Google Scholar] [CrossRef]
  77. Xu, Y.; Shen, Z.-H.; Ying, L.-X.; Ciais, P.; Liu, H.-Y.; Piao, S.-L.; Wen, C.; Jiang, Y.-X. The exposure, sensitivity and vulnerability of natural vegetation in China to climate thermal variability (1901–2013): An indicator-based approach. Ecol. Indic. 2016, 63, 258–272. [Google Scholar] [CrossRef]
  78. Chen, Z.; Wang, W.; Fu, J. Vegetation response to precipitation anomalies under different climatic and biogeographical conditions in China. Sci. Rep. 2020, 10, 830. [Google Scholar] [CrossRef] [Green Version]
  79. Liu, L.B.; Wang, Y.; Wang, Z.; Li, D.L.; Zhang, Y.T.; Qin, D.H.; Li, S.C. Elevation-dependent decline in vegetation greening rate driven by increasing dryness based on three satellite NDVI datasets on the Tibetan Plateau. Ecol. Indic. 2019, 107, 105569. [Google Scholar] [CrossRef]
  80. Zhang, Y.; Zhang, C.; Wang, Z.; Chen, Y.; Gang, C.; An, R.; Li, J. Vegetation dynamics and its driving forces from climate change and human activities in the Three-River Source Region, China from 1982 to 2012. Sci. Total Environ. 2016, 563, 210–220. [Google Scholar] [CrossRef]
  81. Zheng, K.; Wei, J.Z.; Pei, J.Y.; Cheng, H.; Zhang, X.L.; Huang, F.Q.; Li, F.M.; Ye, J.S. Impacts of climate change and human activities on grassland vegetation variation in the Chinese Loess Plateau. Sci. Total Environ. 2019, 660, 236–244. [Google Scholar] [CrossRef]
  82. Wu, Y.; Tang, G.; Gu, H.; Liu, Y.; Yang, M.; Sun, L. The variation of vegetation greenness and underlying mechanisms in Guangdong province of China during 2001–2013 based on MODIS data. Sci. Total Environ. 2019, 653, 536–546. [Google Scholar] [CrossRef] [PubMed]
  83. Stanimirova, R.; Arévalo, P.; Kaufmann, R.K.; Maus, V.; Lesiv, M.; Havlík, P.; Friedl, M.A. Sensitivity of global pasturelands to climate variation. Earth’s Future 2019, 7, 1353–1366. [Google Scholar] [CrossRef]
  84. Chi, D.; Wang, H.; Li, X.; Liu, H.; Li, X. Assessing the effects of grazing on variations of vegetation NPP in the Xilingol Grassland, China, using a grazing pressure index. Ecol. Indic. 2018, 88, 372–383. [Google Scholar] [CrossRef]
  85. Li, J.; Peng, S.; Li, Z. Detecting and attributing vegetation changes on China’s Loess Plateau. Agric. For. Meteorol. 2017, 247, 260–270. [Google Scholar] [CrossRef]
  86. Wen, Y.; Liu, X.; Xin, Q.; Wu, J.; Xu, X.; Pei, F.; Li, X.; Du, G.; Cai, Y.; Lin, K. Cumulative effects of climatic factors on terrestrial vegetation growth. J. Geophys. Res. Biogeosciences 2019, 124, 789–806. [Google Scholar] [CrossRef]
  87. Wu, D.; Zhao, X.; Liang, S.; Zhou, T.; Huang, K.; Tang, B.; Zhao, W. Time-lag effects of global vegetation responses to climate change. Global Change Biology 2015, 21, 3520–3531. [Google Scholar] [CrossRef]
  88. Zscheischler, J.; Mahecha, M.D.; Von Buttlar, J.; Harmeling, S.; Jung, M.; Rammig, A.; Randerson, J.T.; Schölkopf, B.; Seneviratne, S.I.; Tomelleri, E. A few extreme events dominate global interannual variability in gross primary production. Environmental Research Letters 2014, 9, 035001. [Google Scholar] [CrossRef]
Figure 1. The Yangtze River Basin (YZRB): (a) location and elevation; (b) subbasins; and (c) vegetation types.
Remotesensing 14 05623 g001
Figure 2. Interannual variations in the GS and seasonal NDVI in the YZRB from 1982 to 2015.
Remotesensing 14 05623 g002
Figure 3. Spatial distributions of the (a) mean NDVI, (b) linear trends of the NDVI, and (c) types of NDVI changes (statistical significance) in the growing season (GS) from 1982 to 2015.
Remotesensing 14 05623 g003
Figure 4. Spatial distribution of the VSI in the YZRB.
Remotesensing 14 05623 g004
Figure 5. Contribution of climate variables to the VSI in the YZRB: (a) precipitation (PRE), (b) temperature (TEM), (c) solar radiation (RAD), and (d) the primary drivers controlling the VSI.
Remotesensing 14 05623 g005
Figure 6. Spatial distributions of (a) trends, (b) trend types, and (c) the percentage of trend types in the VSI.
Remotesensing 14 05623 g006
Figure 7. Spatial regionalization of vegetation changes.
Remotesensing 14 05623 g007
Figure 8. The (a) elevation ranges and (b) percentages of different vegetation types in subregions.
Remotesensing 14 05623 g008
Figure 9. Boxplots for the GS and seasonal NDVI trends in subregions: (a) GS, (b) spring, (c) summer, (d) autumn, and (e) winter.
Remotesensing 14 05623 g009
Table 1. Mean climate variables and vegetation sensitivity to climate in subregions.
Mean Climate VariablesVSIContribution of Climate Variables
PRE
(mm)
TEM
(°C)
RAD
(W/m2)
PRETEMRAD
Region I460.1−3.9216.228.626%45%29%
Region II796.34.8188.640.028%35%37%
Region III1025.913.6135.839.923%39%38%
Region IV1344.915.9142.340.523%34%43%
Region V1338.416.9149.233.325%41%34%
Publisher’s Note: MDPI stays neutral with regard to jurisdictional claims in published maps and institutional affiliations.

