Abstract
The Visible Infrared Imaging Radiometer Suite (VIIRS) instruments on-board the Suomi National Polar-orbiting Partnership (S-NPP), National Oceanic and Atmospheric Administration 20 (NOAA-20) and Joint Polar Satellite System (JPSS-2) spacecraft, with launch dates of October 2011, November 2017 and late 2022, respectively, have polarization sensitivity that affects the at-aperture radiometric Sensor Data Record (SDR) calibration in the Visible Near InfraRed (VNIR) spectral region. These SDRs are used as inputs into the VIIRS atmospheric, land, and water Environmental Data Records (EDRs) that are integral to climate and weather applications. Pre-launch characterization of the VIIRS polarization sensitivity was performed that provides an SDR radiance correction factor to enable high fidelity EDR products for the user community. The pre-launch polarization sensitivity used an external source that consisted of a 100 cm diameter Spherical Integrating Source (SIS) in combination with several sheet polarizers. These sheet polarizers were illuminated by the SIS and viewed by the VIIRS instrument. The sheet was then rotated to measure the variation in the VIIRS response relative to the at-aperture polarization orientation. There are sensor requirements that define the maximum allowed polarization amplitude to be below 2.5–3.0% depending on the band and have an uncertainty in both amplitude and phase of less than 0.5%. The pre-launch data analysis evaluated the VIIRS response through the rotating sheet polarizer to quantify each VNIR bands polarization amplitude, phase, and uncertainty. These parameters were compared with the sensor requirements and used to create on-orbit Look-Up Tables (LUTs) for EDR ground processing. The results of the analysis showed that all bands met the uncertainty requirement of 0.5%, but band M1 failed the 3% polarization amplitude requirement. A root-cause analysis identified the optical element responsible for the non-compliance and has been modified for JPSS-3 and -4 builds. The large polarization amplitudes observed in the NOAA-20 VIIRS build, for bands M1-M4, are greatly reduced for JPSS-2 VIIRS. This improved polarization performance was due to modifications to the band M1-M4 bandpass filters between these sensor builds.
1. Introduction
The Visible Infrared Imaging Radiometer Suite (VIIRS) is a cross-track scanning sensor in a low Earth orbit aboard the Suomi National Polar-orbiting Partnership (S-NPP), National Oceanic and Atmospheric Administration 20 (NOAA-20) or Joint Polar Satellite System (JPSS-1), and JPSS-2 spacecraft with launch dates of October 2011 and November 2017 and late 2022, respectively [1]. Like its heritage sensors Operational Linescan System (OLS) [2], Advanced Very High Resolution Radiometer (AVHRR) [3], and Moderate Resolution Imaging Spectroradiometer (MODIS) [4], VIIRS provides calibrated top-of-atmosphere (TOA) reflectance, brightness temperature and radiance products for weather and climate applications. The VIIRS Sensor Data Records (SDRs) radiance and reflectance are key inputs into the Environmental Data Record (EDR) algorithms for ocean, land and atmospheric products and their calibration is based on unpolarized at-aperture radiance [5]. However, VIIRS scenes can have significant polarization in their at-aperture radiance from Rayleigh scatter in the atmosphere or specular reflection off the ocean. This requires not only the VIIRS polarization sensitivity to be minimized but also well characterized for EDR product performance purposes. Therefore, the VIIRS instrument polarization sensitivity is characterized to correct for partial polarization in the top-of-atmosphere radiance. Weather and climate sensors such as Sea-Viewing Wide-Field-of-View Sensor (SeaWiFS) [6] and MODIS have used polarization characterization to reduce the radiometric impacts of partial polarization on their ocean color products. Ocean color Level-2 products on MODIS showed striping and calibration issues over ocean scenes due to high uncertainties in the MODIS pre-launch polarization sensitivity characterization [7]. The MODIS polarization also changed over the 20+ year mission and required an update to maintain optimum EDR performance [8]. Table 1 lists the VIIRS polarization sensitivity requirements for each of the Visible Near InfraRed (VNIR) bands. The Short and Mid wave Infra Red (SMIR) and Long Wave Infra Red (LWIR) bands do not have significant EDR polarization effects to warrant VIIRS design constraints on polarization sensitivity or a need to correct for its effects. The polarization amplitude is required to be a small fraction (2–3%) of the total at-aperture radiance to limit the magnitude of the EDR correction. The polarization sensitivity characterization uncertainty requirement is 0.5% and drives the measurement equipment and test methodology to provide high fidelity polarization measurements. The VIIRS polarization pre-launch test setup used lessons learned from the MODIS pre-launch testing to improve its uncertainty and reduce on-orbit ocean color EDR striping and calibration issues. If the polarization sensitivity of the VIIRS instrument is unaccounted for, it could cause ocean color EDR striping and biases that would significantly degrade the product. The polarization sensitivity characterization for S-NPP and NOAA-20 VIIRS is currently being used on-orbit. While the correction is not perfect, it is a significant improvement over MODIS [9]. Pre-launch characterization of the VIIRS polarization sensitivity was performed for JPSS-2 in July 2016 and passed the amplitude and characterization uncertainty (0.5%) requirements for all VNIR bands except band M1 (412 nm). The cause of the band M1 requirements failure will be discussed. The history of the VIIRS optical design changes, as it relates to polarization sensitivity, will also be discussed and how it has impacted the VIIRS polarization performance from build-to-build. This can be seen by comparing the pre-launch polarization sensitivity from S-NPP, NOAA-20 and JPSS-2 and observe how the detector-to-detector and scan angle amplitudes have changed with each optical modification. A comparison of the JPSS-2 VIIRS polarization performance with S-NPP and NOAA-20 (JPSS-1) can be found in [10].

Table 1.
VIIRS polarization sensitivity requirements for each VNIR band with the center wavelength as well as maximum allowable polarization amplitude and characterization uncertainty listed.
2. VIIRS Instrument Overview
VIIRS has 22 bands at two spatial resolutions distributed across four focal planes. There are 16 moderate resolution (M-) bands and a Day Night Band (DNB) with a nadir dynamic field-of-view (DFOV) of 750 m with 16 detectors in the track direction. There are 5 imaging (I-) bands with 32 detectors in track with each having a nadir DFOV of 375 m. Nine bands, M1–M7, I1 and I2, are on the VNIR focal plane that covers a spectral range of 395–900 nm. Eight bands, M8–M13, I3 and I4, are on the SMIR Focal Plane Assembly (FPA) that has a spectral range of 1230–4130 nm and four bands, I5 and M14–M16, are on the LWIR FPA with a spectral coverage of 8400–12,490 nm. The DNB has its own FPA and covers of a spectral range of 500–900 nm. The nominal orbital altitude of its spacecraft is ~824 km with an equatorial crossing of 13:30 Greenwich Mean Time and swath width of 3000 km.
The VIIRS optical design, shown in Figure 1, has a Rotating Telescope Assembly (RTA) that rotates 360° to capture light from the Earth View, with a scan range of ±56.03° from nadir, as well as energy from the three internal calibration views. The RTA is an afocal three mirror anastigmat telescope and fold mirror that collects and demagnifies this energy and passes it to the Half-Angle Mirror (HAM) as a collimated beam. The HAM rotates at half the speed of the RTA and directs the output energy from the RTA to the stationary aft-optics assembly. The aft-optics focuses the collimated energy onto the four FPAs using a four-mirror telescope. Spectral filtering of the energy through the optics is also performed in the aft-optics using dichroics and bandpass filters. The VNIR and DNB FPAs receives reflected light off dichroic 1, the SMIR FPA receives transmitted and reflected light off dichroic 1 and 2, respectively, and the LWIR FPA receives transmitted light off both dichroics 1 and 2. Each band has a bandpass filter as the last element before the detectors to further segregate the light. The SMIR and LWIR FPAs are inside a vacuum Dewar set to ~82K for JPSS-2, immediately outside of which is a beam steering assembly consisting of the second dichroic and an additional fold mirror to direct the light through their respective Dewar windows.
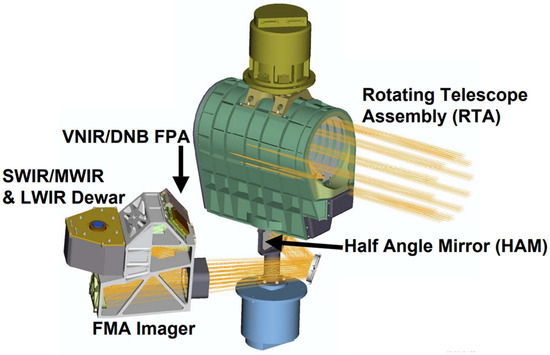
Figure 1.
A cartoon of the VIIRS optical system showing the scanning system and aft-optics design.
Each mirror in the optical system has a silver coating with reflectance that is dependent on the orientation of the incident polarization. These mirror reflectance polarization sensitivities are spectrally and angle of incidence (AOI) dependent that results in the HAM reflectance, with AOIs varying from 29.60° to 56.47°, changing significantly over scan angle within the Earth view. Therefore, the scan angle dependence of the VIIRS polarization sensitivity must be characterized to account for this effect. The dichroics also contribute to the VIIRS polarization due to their intricate and numerous dielectric layers and have a strong spectral dependence. The last unique optical component that contributes to the VIIRS polarization are the bandpass filters. These filters have numerous dielectric layers that are uniquely tailored for each band to allow spectral transmission in the in-band region while minimizing any out-of-band energy. The design of the bandpass filters has changed between each of the S-NPP, NOAA-20 and JPSS-2 VIIRS builds and thus impacted the overall VIIRS polarization sensitivity differently. The ray bundles received by each band’s detectors have different AOIs on the mirrors, dichroics, and bandpass filters resulting in each band having different detector-dependent polarization sensitivities. Overall, the major contributor to the detector-dependence of the system-level polarization sensitivity is the dichroic one and the bandpass filter. The dielectric layers on the dichroic is the driver for most of the polarization sensitivity in the S-NPP and JPSS-2 builds while the bandpass filters produce significant polarization effects for the NOAA-20 build [11,12].
3. Materials and Methods
3.1. Polarization Test Source Assembly
The pre-launch testing of the VIIRS polarization sensitivity and characterization methodology will be covered briefly in this section. A more detailed description of how the testing is performed can be found in the documentation of the NOAA-20 VIIRS polarization results [13]. The pre-launch JPSS-2 VIIRS polarization testing data was collected at Raytheon Intelligence and Space in El Segundo, California in July of 2016. The Polarization Test Source Assembly (PTSA) is the Ground Support Equipment (GSE) used as the external source to characterize the VIIRS polarization sensitivity. Figure 2 shows the PTSA which contains a 100 cm Spherical Integration Source (SIS) that provides wide FOV unpolarized illumination with adjustable intensity combined with a polarization sheet between it and the VIIRS sensor. A spectral blocking filter and straylight baffling is also part of the PTSA to control unwanted energy reaching the detectors. The blocking filter reduces unwanted energy longer than 625 nm and is used during the characterization of bands M1–M3 where out-of-band spectral response can influence their polarization sensitivity in a non-flight like manner. This is because the on-orbit Solar Irradiance is much higher in the blue region than in the red and near infra red (NIR) regions. The PTSA SIS has its peak illumination in the NIR spectral region and therefore would weight the red and NIR polarization features substantially more than in the blue. So, the energy from red and NIR spectral regions are removed during the M1–M3 characterization to eliminate the unequal weighting effects of the PTSA source. There are two different types of sheet polarizers (BVONIR and BVO777) that are used during the test and can easily be interchanged onto the rotation stage with very excellent repeatability. The rotation stage rotates one of these polarization sheets 360° in 15° increments for a total of 25 separate measurements with the orientation of the sheet with respect to the source shown in Figure 3. The polarizing sheets are not perfect polarizers and allow some unpolarized SIS illumination to reach the VIIRS entrance aperture [13]. To characterize the polarization efficiency of the polarization sheets, a second sheet of the same type is placed on the rotation stage to do a cross-polarizer measurement. VIIRS is used to measure the transmission through the two-sheet combination as a function of rotation stage angle for the first polarizer. When the two sheets’ polarization electric fields are parallel, the transmission through the sheets is at its maximum and when they are orthogonal, full extinction of the light to VIIRS should occur. However, since the polarizer sheets are not fully efficient there is some unpolarized light that passes to VIIRS when the sheets transmission axis orientations are orthogonal. The <100% signal modulation observed by VIIRS is used to determine the extinction ratio of the polarizer sheets and scale the VIIRS polarization test results to correct for this effect. A full characterization of the PTSA is performed to understand the uncertainties of the source. This includes knowledge of the rotation stage accuracy, straylight influences and polarization sheet uniformity. Details of the PTSA characterization requirements can be found in [13].
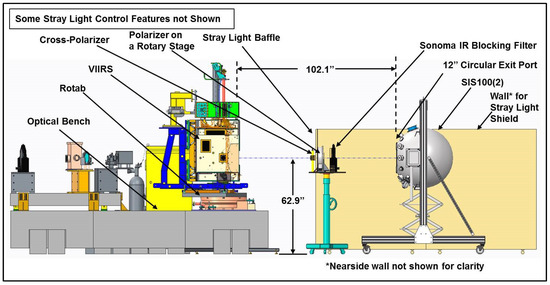
Figure 2.
PTSA setup (right side of the figure) with respect to VIIRS (left side of the figure) during the polarization characterization tests.
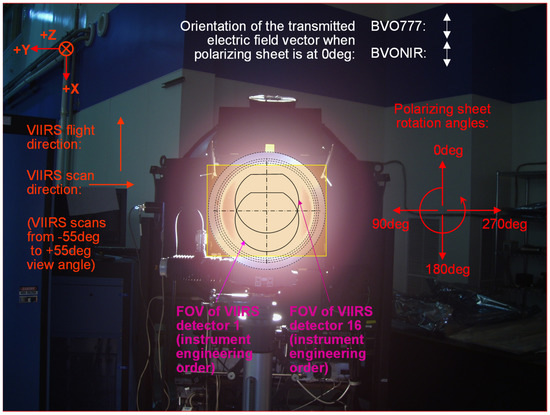
Figure 3.
PTSA viewed by VIIRS during the JPSS-1 VIIRS polarization sensitivity test illustrating the VIIRS coordinate frame with respect to the rotation geometry of the polarization sheet.
3.2. Test Data Analysis Methodology
The polarization sensitivity test (PST) was run with VIIRS scanning horizontally across the room with a full aperture view of the PTSA with both HAM sides A and B viewing the source. VIIRS also views an internal On-Board Calibrator Blackbody (OBCBB) as a dark reference for background subtraction. Equation (1) shows the offset corrected digital number (dn). The lower case dn corresponds to background corrected values and the capital DN does not have background correction. The dns are averaged over ~30 samples and scans, of the Earth View (DNEV) when viewing the PTSA subtracted by the dark digital numbers of the OBCBB (DNOBCBB). These dns are a function of scan angle θ, polarization angle φ, band b, detector d and HAM side ms. All three test phases (straylight, cross polarizer and VIIRS polarization) are handled with the same analysis methodology.
For each band, detector and scan angle measurement, a Fourier filtering using a 2-phi fit with the dns as the dependent variable and the polarization angle φ as the independent variable is used as shown in Equation (2).
The ½ a0 term is the dc offset of the measurement which is the average dn signal for that band throughout the 360° polarization angle rotation, the a2 and b2 fit the 2φ modulation in the dns from polarization sensitivity effects. Residuals to the fit can be used to estimate the uncertainty in the measurement quality. Modulations in the dns with frequencies other than 2φ are either from detector noise or PTSA artifacts contaminating the measurements. These residuals provide information into the magnitude of the errors and are included in the uncertainty analysis. The a0, a2 and b2 are then used to compute the polarization amplitude (PA) and phase (β), as shown in Equations (3) and (4) respectively. The cross-polarization testing efficiency term, Fcross, is a scale factor on the polarization amplitude and is computed using Equation (5). The Fcross term represents the sheet polarization efficiency and scales the polarization amplitude in Equation (3) to correct for partial polarization effects from the sheet polarizer.
The Fcross term assumes that both polarization sheets (the fixed and rotation stage ones) have the same efficiencies and is the reason the polarization amplitude in Equation (5) has a square root. The polarization amplitude of the VIIRS response when viewing the cross-polarization sheet configuration, in Equation (5), is used to quantify the sheet polarization efficiency. If it is a perfect polarizer, the amplitude will be 1, but it falls somewhere between 0.5–0.99 depending on the band and sheet type. A band averaged value is used in Equation (3) with the assumption that the polarizer efficiency is not detector dependent. Any band dependent efficiency errors resulting from band averaging are included in the uncertainty analysis tree.
The results of the analysis are a PA and β for each band, detector, HAM side and scan angle measured and are plotted in polar plots with the radius term representing the PA and polar angle corresponding to twice the β angle (this is due to the 2φ covering 0° to 180° while the polar plot is a full 360° angular extent). These polar plots of the PA and β over detector, scan angle and HAM side for each band allow for correlations in polarization sensitivity with respect to different optical component performance to be investigated.
4. JPSS-2 VIIRS Polarization Sensitivity Results
The following four sections will discuss the results of the JPSS-2 VIIRS polarization characterization testing. The first two sections cover special tests to evaluate the PTSA setup. The first section looks for straylight that could bias the polarization characterization data with additional unwanted signal. The second section discusses the sheet polarizer efficiency described in Equation (5) and is applied to the polarization amplitudes in Equation (3). These two measurements are performed before the VIIRS characterization to assess the PTSA performance. If they do not behave as expected, the PTSA setup is modified until it meets expectations. The third section covers the VIIRS polarization sensitivity performance and the last section the uncertainties in that characterization. The results of the first two sections feed into the uncertainty analysis as residual uncertainties in the polarization sensitivity characterization in Section 3.
4.1. Straylight Analysis
PTSA straylight testing uses VIIRS in two different configurations to identify any polarized light contamination. The first was a dark test where the SIS was off and any observed VIIRS signal would be a result of straylight from the laboratory surrounding; the second was a lollipop test where the PTSA SIS was on but an obscuration blocks light from passing through the polarization sheet to the VIIRS entrance aperture. The VIIRS signal was evaluated from these two configurations to determine if unwanted light that was reaching the sensor would impact the a0 term and bias the PA in Equation (3). The straylight signal was Fourier fit, using Equation (2), to evaluate possible modulations in the straylight data. These modulations would affect the phase accuracy due to mixing of the 2φ frequency with the VIIRS polarization sensitivity phase. Figure 4 shows an example of the dark signal response for band M4 HAM B for all detectors with the curves the Fourier fits and the points corresponding to the dns as a function of polarization angle. The dn response is less than ~1 dn for all detectors but the correlation between the dns and the Fourier fits is ~0.51 indicating no significant 2φ component. Table 2 lists the median of the ratio of the dn from the dark measurements to the SIS signal during the test, and their median correlation factors to the Fourier fits for both the dark and lollipop test configurations. The dn response levels are within the noise of the detectors and the correlation with a 2φ modulation is high for some bands, but the low signal minimizes its impact on the polarization sensitivity. A straylight contamination PA using these a2 and b2 coefficients with the a0 from a nominal SIS illumination level is included in the uncertainty analysis.
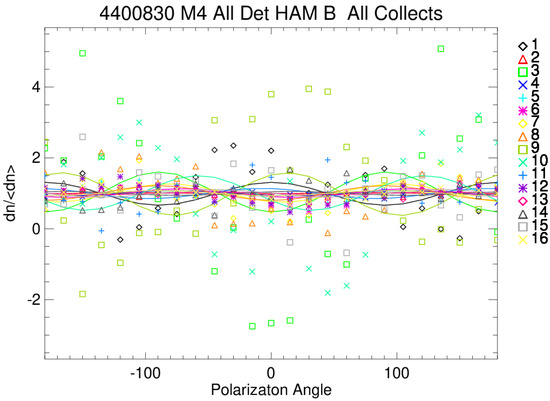
Figure 4.
VIIRS response during dark testing with Fourier fits for Band M4 HAM B all detectors showing that there is very little correlation between the signal (points) and the 2-phipolarization model.
Table 2.
2 Signal and correlation information for the dark and lollipop portions of the test for each VNIR band showing how well the straylight signal correlated with the 2-phi polarization model used in the PST analysis.
4.2. Cross-Polarizer Correction Factors
The PTSA cross polarizer configuration was used, in conjunction with VIIRS, to determine the polarization efficiency of the PTSA sheets. The methodology used for the cross-polarizer configuration was discussed in section II., with Equation (5) used to compute the polarization efficiency. Figure 5 shows an example of the band M1 response during the cross-polarization test, for all detectors and HAM side A, as a function of polarizer rotation angle. The signal modulation follows a 2φ frequency with the square root of the amplitude corresponding to the PTSA efficiency and the phase providing the transmission axis orientation of the polarizer sheet. The polarization efficiency test of the PTSA was performed at the beginning of the PST and Table 3 lists the results for each VNIR band. Bands M1-M3 were measured with the PTSA configured with the Sonoma filter while the remaining bands were measured without spectral attenuation. The polarizer sheet efficiency was above 98% for all bands and therefore the correction applied to the measured PAs is less than 2%. The phase is ~3° rotated away from zero and was most likely due to the fixed polarization sheet’s transmission axis not being perfectly aligned to the rotation stage. Since the phase is not used in the polarization correction in Equation (3), it does not impact the VIIRS polarization sensitivity analysis. A band averaged polarization sheet efficiency value was used in the PST analysis and the impact of averaging across band was included in the uncertainty analysis discussed later.
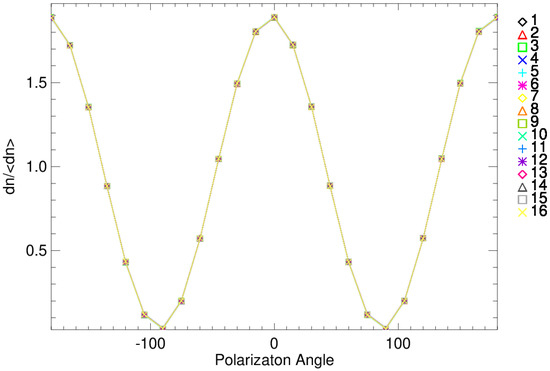
Figure 5.
VIIRS response for Band M1 HAM A all detectors during the cross-polarizer testing phase showing nearly 100% extinction of the signal when the polarization sheet’s transmission axis is orthogonal and nearly 100% transmittance when they are parallel.
Table 3.
Cross polarizer results for PST and the resulting PTSA efficiencies for each VNIR band.
4.3. Polarization Sensitivity Test Results
Polar plots of the polarization sensitivity determined during the PST are shown in this section. The x- and y-axis in the polar plots correspond to the a2 and b2 terms from Equation (2), respectively. From the origin of the polar plot, a vector can be used to evaluate the polarization amplitude (magnitude of this vector) and phase (half of the angle of the vector with respect to the positive x-axis). There are multiple colors on the polar plot that correspond to each unique scan angle. There are 16- or 32-line connected symbols within each color corresponding to each detector of the band of interest. Detector 1 (in instrument order) has a larger symbol to identify the detector order of the points on a connected line. Visualizing the polarization sensitivity in polar plot fashion allows for amplitude, phase, and scan angle variations to be more easily compared and patterns in their behavior to be examined.
Figure 6 shows the polarization sensitivity for band M1 HAM A for all detectors and each scan angle measured for JPSS-2. The band M1 amplitude exceeds the 3% requirement across the ±45° scan angles measured causing a noncompliance for this band. The root cause of this large polarization sensitivity and specification failure was found to be due to the dichroic #1 s and p reflectance separation in the blue wavelength region. Figure 7 shows band M1 HAM B results. Unlike JPSS-1, where the HAM side differences in polarization sensitivity were large (~0.5%), the JPSS-2 polarization sensitivities are very consistent (~0.07%). The JPSS-2 polarization sensitivities show significant scan angle dependence (HAM AOI variation drives these differences) while the detector-to-detector variation remains consistent in length (dichroic #1 with a fixed AOI drives this). This will cause banding in the JPSS-2 SDRs where scene polarization is significant. Table 4 lists the maximum PA for each band and HAM side at all the measured PST scan angles. This gives a quantitative look into the HAM side difference discussed here for bands other than M1. Table 5 lists the JPSS-1 polarization sensitivities for comparison purposes. Optical modifications to the bandpass filters for bands M1-M4 reduced the polarization sensitivity for JPSS-2 compared to JPSS-1. Polar plots for S-NPP, JPSS-1 and -2 VIIRS can be found in [10] for comparison purposes.
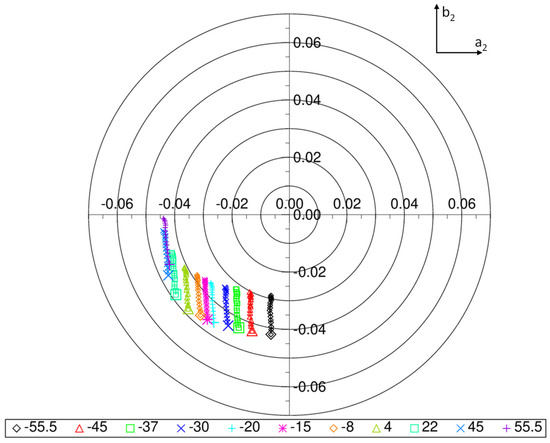
Figure 6.
Band M1 HAM side A polarization sensitivity polar plot for JPSS-2 showing the amplitude and phase of each detector (points) and scan angles (different colors). The larger points correspond to detector 1 with the connected points within a given color monotonically increasing from detector 1 (large symbol) to 16 (farthest from detector 1). The radius from the center of the polar plot to the point corresponds to the magnitude of the polarization amplitude while half the angle from the positive x-axis to the point is the phase.
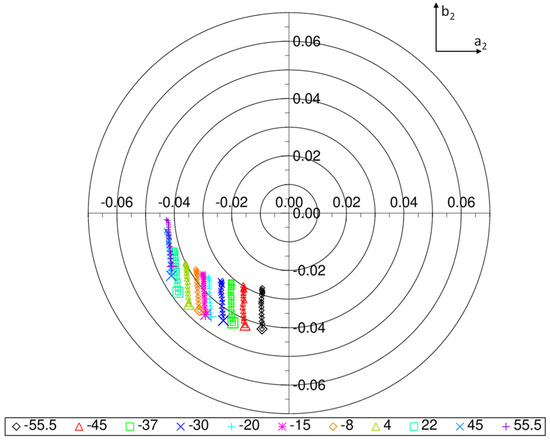
Figure 7.
Band M1 HAM side B polarization sensitivity polar plot for JPSS-2 showing each detector’s amplitude (radius to the point) and phase (half angle to point from the +x-axis) for all detectors (large symbols are detector 1) for each scan angle (different color points).
Table 4.
JPSS-2 Maximum detector PA (in percentage) for all VNIR bands, scan angles and HAM sides from PST.
Table 5.
JPSS-1 Maximum detector PA (in percentage) for all VNIR bands, scan angles and HAM sides from PST.
Figure 8, Figure 9 and Figure 10 illustrate the polarization sensitivities for bands M2-M4 for HAM side A. These bands also show a decrease in polarization sensitivity in JPSS-2 compared to JPSS-1 and now meet their sensor requirement of 2.5% between ±45° scan angles. All the bands showed decreases in detector-to-detector sensitivity in both amplitude and phase. The largest decrease between the two sensors is for band M4 which decreased by ~3% in amplitude and a 3% change in detector-to-detector variation. This will decrease the SDR striping for this band significantly in JPSS-2 compared to JPSS-1 in regions where the scene polarization is prominent. Polarization sensitivity variation across HAM sides for these bands are very similar and should limit HAM side striping effects.
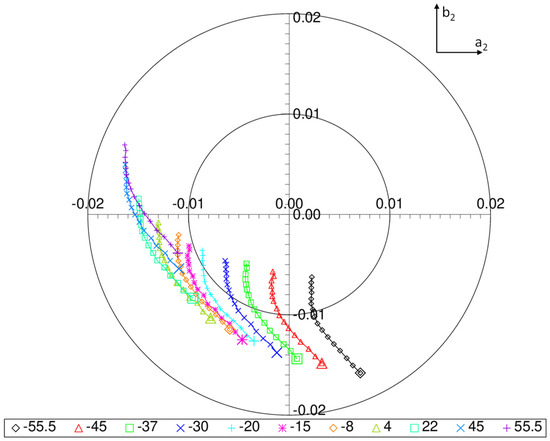
Figure 8.
Band M2 HAM side A polarization sensitivity polar plot JPSS-2 showing each detector’s amplitude (radius to the point) and phase (half angle to point from the +x-axis) for all detectors (large symbols are detector 1) for each scan angle (different color points).
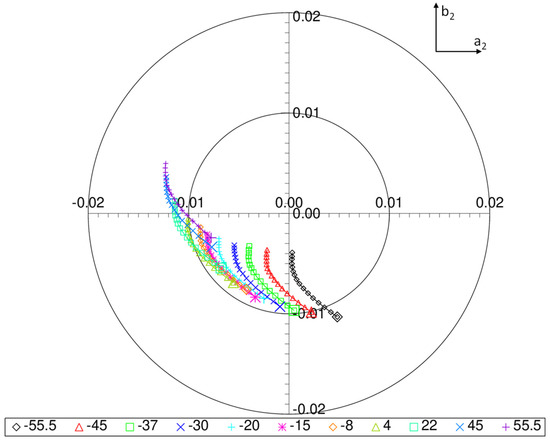
Figure 9.
Band M3 HAM side A polarization sensitivity polar plot for JPSS-2 showing each detector’s amplitude (radius to the point) and phase (half angle to point from the +x-axis) for all detectors (large symbols are detector 1) for each scan angle (different color points).
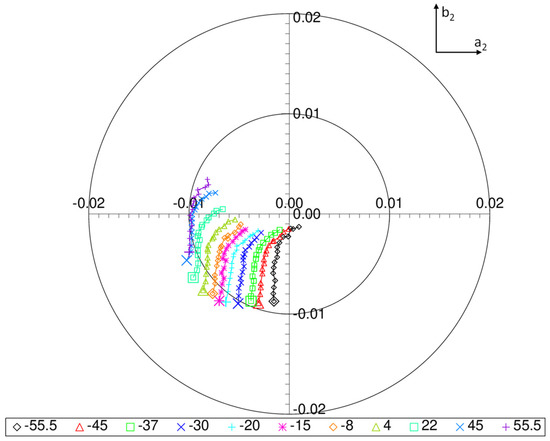
Figure 10.
Band M4 HAM side A polarization sensitivity polar plot for JPSS-2 showing each detector’s amplitude (radius to the point) and phase (half angle to point from the +x-axis) for all detectors (large symbols are detector 1) for each scan angle (different color points).
Figure 11, Figure 12, Figure 13, Figure 14 and Figure 15 show the polarization sensitivities for bands M5–M7 and I1–I2. The polarization sensitivities fall within the sensor requirements. The JPSS-2 dichroic #1 rework does change the detector-to-detector amplitude and phase behavior when compared to JPSS-1, but the relationship with scan angle is consistent with previous builds. The detector-to-detector variation is different for these bands compared to bands M1–M4 in that its shape varies significantly as a function of scan angle. Bands M1–M4 have a mostly linear detector-to-detector pattern that moves across the polar plots with scan angle, but the shape remain relatively constant. Bands M5–M7 and I1–I2 have large parabolic detector-to-detector shapes with the curvature changing based on scan angle position. The scan angle pattern also changes between bands M1–M3 and bands M4–M7 and I1–I2. The left most polarization sensitivity on the polar plots is a scan angle of +55° or +45° for bands M1–M3 and the right most scan angle values corresponding to −55°. For bands M4–M7 and I1–I2, the left most points on the polar plots correspond to a scan angle of −55° and the right most are for +55°. This is caused by an inversion of the s and p polarization reflectance for the VIIRS mirrors near the spectral region of band M4. This s and p reflectance inversion is a characteristic of the VIIRS mirror coating design and is similar for S-NPP and NOAA-20 VIIRS. The scan angle and detector-to-detector phase variation makes the s and p orientation important because it affects each band differently. Errors in the polarization orientation will cause striping in the EDRs because each band is affected differently and the EDR algorithms rely on band combinations to extract geophysical parameters. While bands I2 and M7 share the same spectral bandpass, the AOIs on their optics is different and therefore, the polarization sensitives are slightly different between the two bands.
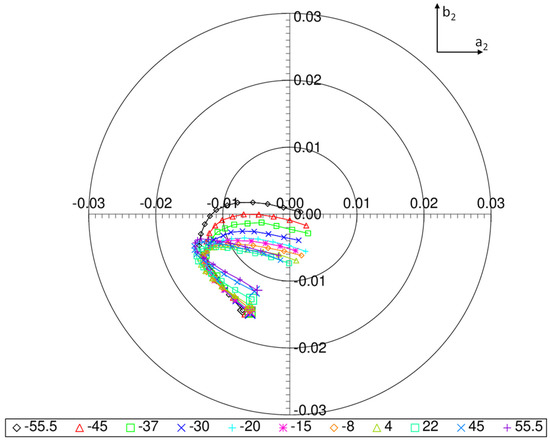
Figure 11.
Band M5 HAM side A polarization sensitivity polar plot for JPSS-2 showing each detector’s amplitude (radius to the point) and phase (half angle to point from the +x-axis) for all detectors (large symbols are detector 1) for each scan angle (different color points).
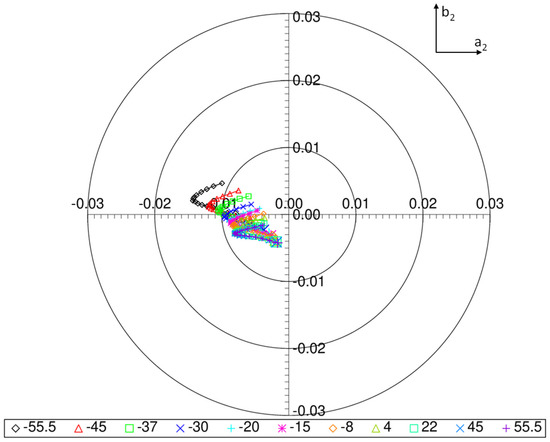
Figure 12.
Band M6 HAM side A polarization sensitivity polar plot for JPSS-2 showing each detector’s amplitude (radius to the point) and phase (half angle to point from the +x-axis) for all detectors (large symbols are detector 1) for each scan angle (different color points).
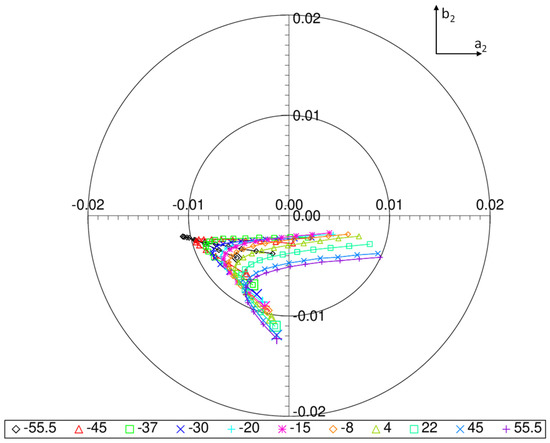
Figure 13.
Band M7 HAM side A polarization sensitivity polar plot for JPSS-2 showing each detector’s amplitude (radius to the point) and phase (half angle to point from the +x-axis) for all detectors (large symbols are detector 1) for each scan angle (different color points).
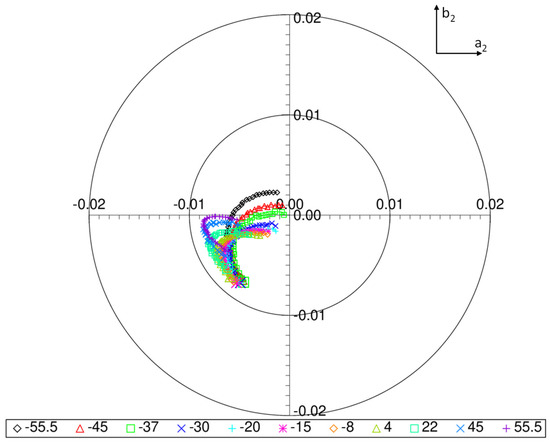
Figure 14.
Band I1 HAM side A polarization sensitivity polar plot for JPSS-2 showing each detector’s amplitude (radius to the point) and phase (half angle to point from the +x-axis) for all detectors (large symbols are detector 1) for each scan angle (different color points).
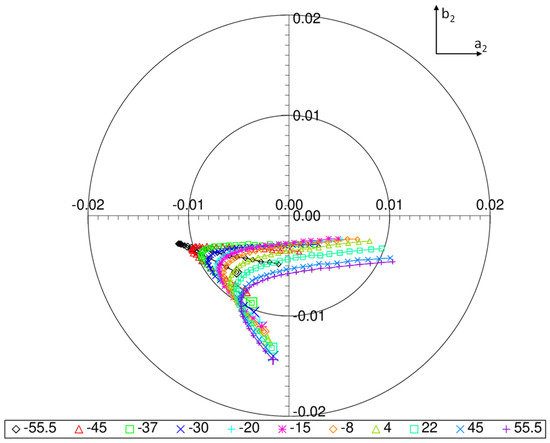
Figure 15.
Band I2 HAM side A polarization sensitivity polar plot for JPSS-2 showing each detector’s amplitude (radius to the point) and phase (half angle to point from the +x-axis) for all detectors (large symbols are detector 1) for each scan angle (different color points).
4.4. Uncertainty
The estimate of uncertainty for the PST uses a combination of sensor level measurements combined with PTSA characterization information to assess the quality of the JPSS-2 VIIRS polarization sensitivity characterization. The error tree in Figure 16 illustrates the inputs into the estimate of uncertainty and what factors are included in the budget. The measurement total box in Figure 16 includes source stability, dn noise, sheet efficiency, polarization sheet angle, and straylight errors. The source stability was estimated by using repeated measurements during one 360° rotation where the points that are ±180° apart correspond to a common sensitivity level on the 2φ angle space in Equation (2). The PTSA source drift can be estimated by comparing these common polarization orientations. The dn noise was computed using the standard deviation of the dns over all samples and scans for a particular polarization angle. This varies by band, detector, scan angle and polarization angle and the maximum value for each band was used in the uncertainty tree. The cross-polarizer measurement data was used to measure the polarization sheet efficiency. During the cross-polarization measurements, the uncertainties in the fit coefficients, from Equation (2), are propagated to the Fourier coefficients during the nominal polarization sensitivity test using the Fcross factor. The change in PA and β due to the Fcross uncertainties are included in the estimated uncertainty. The estimated uncertainty in the polarization angle was determined during the cross-polarization measurement. The maximum response in the modulation during the cross-polarization test was expected to be aligned with the rotation axis of the RTA and any deviations from this are included in the phase uncertainty. The dark and lollipop measurements were used to estimate the straylight contribution of the polarization testing. The straylight causes a bias in the a0 portion of Equation (2) and therefore impacts the PA in Equation (3). The dn pedestal in the lollipop test was used to estimate this bias error. Since it is small ~0.1–0.2 dn, it was not removed during data processing and is carried in the estimated uncertainty.
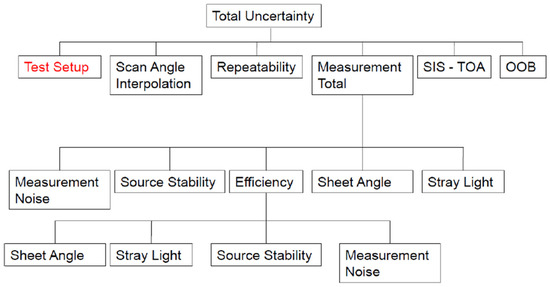
Figure 16.
Estimated uncertainty tree for PST polarization sensitivity test that includes error terms from both the sensor and test source used during the characterization.
The multiple collections at the scan angle of −8° were used to determine the repeatability portion in Figure 16. These collections were taken at the beginning, middle and end of the test to evaluate the repeatability of the test and the PTSA. The repeatability uncertainty used the maximum minus minimum of the PA from the −8° measurements. The difference between the polynomial fits of the PA over scan angles with respect to the measured points was used to estimate the uncertainty from scan angle interpolation. The SIS-TOA term accounts for the spectral differences between the PTSA and on-orbit Solar sources. This spectral uncertainty was estimated using a correlated polarization model that accounted for the spectral weighting differences between the two source profiles. While the absolute value in the modeled polarization sensitivities have error, the relative values when comparing different spectral source profiles provides an accurate estimate of its uncertainty. The OOB box in Figure 16 was estimated for bands M1–M3 by comparing the PAs with and without the Sonoma blocking filter. The Sonoma blocking filter eliminates signal with wavelengths longer than 600 nm and therefore changes the out-of-band contributions to the polarization measurements. This OOB component was a significant contributor to the S-NPP polarization characterization uncertainty. However, a redesign of the bandpass filters for JPSS-1 and forward has reduced the impact of this uncertainty contributor. Uncertainty from the PTSA setup was allocated in the final box in Figure 16. These values were determined during the PTSA performance characterization before the execution of the PST. A more detailed description of this characterization can be found in [13].
Table 6 lists the estimated uncertainty for each contributor and band with a rollup of these components into a total estimated uncertainty. The total uncertainty was a root sum square (RSS) of the measurement total, repeatability, scan angle interpolation, SIS-TOA, OOB and test setup line contributions as listed in Table 6. The total measurement line in Table 6 combined the uncertainties of the dn and sheet uncertainties that were propagated through the Fourier coefficients of both the cross polarizer and nominal test portions to determine the measurement uncertainty on the PA. The values are rounded to the nearest hundredth which results in the dn noise (non-zero, but <0.005%) uncertainty contribution being listed as zero. The main contributors to the total estimated uncertainty come from the OOB, SIS-TOA spectral differences, and PTSA setup. The largest uncertainty contributor was the 0.29% SIS-TOA for band M1 but the band’s total estimated uncertainty was well below the 0.5% uncertainty requirement. Bands M1, M2, and I2 have a total estimated uncertainty of 0.78%, 0.30%, and 0.35%, respectively while all other bands are below 0.30%. The uncertainty term that causes the band M1 characterization failure is the spectral differences in the PTSA source and the Solar illumination profile.
Table 6.
Uncertainty contributors and RSS estimated uncertainty from the PST polarization sensitivity test with the values in percentage. The first row of bold values is the RSS of the non-bold items below it. The bold values in row 11 are the RSS uncertainty from the PTSA and the bold values in row 12 are the RSS of the values in rows 1 and 11. The last row is the polarization sensitivity characterization requirement that row 12 should be below. These values are all in percentage.
5. Discussion
The polarization sensitivity of JPSS-2 VIIRS was characterized and within its 0.5% uncertainty requirements. The methodology to characterize the instrument’s polarization sensitivity was like heritage sensors such as MODIS and SeaWiFS. On-orbit performance of previous sensor builds S-NPP and NOAA-20 shows that the pre-launch characterization of the VIIRS polarization sensitivity is adequate to generate high quality ocean color EDRs. The MODIS polarization sensitivity changed over its 20+ year mission and indicates that VIIRS polarization performance could change over the mission if on-orbit for an extended period. The uncertainty in the previous section does not include optical degradation of the instrument over time and could change if the mission was extended. Future missions, such as the Plankton, Aerosol, Cloud, ocean Ecosystem (PACE) Ocean Color Instrument (OCI) could be used to compare and monitor the VIIRS polarization sensitivity performance over time.
The lessons learned during the S-NPP and JPSS programs has informed the VIIRS optical design to improve the radiometric, spatial, and spectral performance. One unintended consequence of the bandpass filter optical change between S-NPP and NOAA-20 VIIRS was an increase in the polarization sensitivity of the instrument. JPSS-2 VIIRS bandpass filters were modified to correct this effect, but residual dichroic #1 polarization left band M1 above the amplitude requirement in Table 1. The optical design has been modified to account for this unexpected polarization performance and is set for JPSS-3 and -4 instrument builds. The polarization sensitivity is expected to be compliant and have similar performance to S-NPP VIIRS. JPSS-3 and -4 should have improved polarization performance while maintaining the out-of-band spectral response and radiometric performance of the previous sensor builds.
6. Conclusions
The polarization sensitivity of JPSS-2 VIIRS was measured using the PTSA during the PST that closely mimicked the JPSS-1 VIIRS polarization test setup. The polarization sensitivities for JPSS-2 were smaller than the JPSS-1 VIIRS, but band M1′s amplitude value of 4.8% still exceeds the sensor’s maximum amplitude requirement of 3%. The cause of the band M1 polarization amplitude failure is due to a large polarization contribution from dichroic #1. The scan angle dependence is consistent between JPSS-1 and -2, but the amplitude and phase consistently decreased in detector-to-detector spread, for most bands, on the JPSS-2 VIIRS sensor compared to JPSS-1. The polarization sensitivity characterization was below the 0.5% requirement for all bands, except for band M1, with the spectral effects being the largest contributor to the uncertainty. This indicates that the polarization sensitivity values will accurately remove polarization effects on the TOA radiance for JPSS-2 VIIRS.
Several VIIRS EDR algorithms, such as ocean color, need to account for polarization effects in the top-of-atmosphere radiance. This is due to a large portion (up to 90%) of the at-aperture radiance originating from highly polarized Rayleigh scatter from the atmosphere mixed with the reflected ocean radiance in the blue spectral region. Therefore, the pre-launch sensor characterization of the polarization sensitivity plays a major roll in the performance of these EDRs. The low polarization amplitude and measurement uncertainties (<0.5%) in JPSS-2 VIIRS reduces the striping and radiometric biases that would be present due to the top-of-atmosphere partially polarized radiance. With S-NPP, NOAA-20, and JPSS-2 VIIRS all having different polarization sensitivities, intercomparison of ocean color EDRs will be more consistent with each sensor applying unique polarization sensitivity corrections based on pre-launch measurements. A future work task will be to monitor the intercomparisons between the different VIIRS ocean color EDRs to look for changes in the quality of the polarization sensitivity correction and make adjustments if necessary. Comparisons with the JPSS-3 and -4 prelaunch polarization sensitivity results will also be performed to look for consistency and possible on-orbit EDR performances differences.
Author Contributions
Conceptualization, D.M., J.M. and X.X.; methodology, D.M. and J.M.; software, D.M.; validation, J.M; formal analysis, D.M. and J.M.; investigation, D.M., J.M. and X.X.; resources, D.M., J.M. and X.X.; data curation, D.M. and J.M.; writing—original draft preparation, D.M.; writing—review and editing, J.M. and X.X.; visualization, D.M.; supervision, X.X.; project administration, X.X.; funding acquisition, X.X. All authors have read and agreed to the published version of the manuscript.
Funding
This research received no external funding.
Acknowledgments
The authors would like to thank the contractor Raytheon Technologies for development, assembly, and performance/characterization testing of the VIIRS instrument. They also allowed the authors access to the test data and analysis approaches that was essential to the polarization sensitivity results shown here. The uncertainty analysis is also a product of the Raytheon Technologies polarization sensitivity performance verification report.
Conflicts of Interest
The authors declare no conflict of interest.
References
- Welsch, C.; Swenson, H.; Cota, S.A.; Deluccia, F.; Haas, J.M.; Schueler, C.; Durham, R.M.; Clement, J.E.; Ardanuy, P.E. VIIRS (Visible Infrared Imager Radiometer Suite): A next-generation operational environmental sensor for NPOESS. In IGARSS 2001. Scanning the Present and Resolving the Future, Proceedings of the IEEE 2001 International Geoscience and Remote Sensing Symposium (Cat. No. 01CH37217), Sydney, Australia, 9–13 July 2001; IEEE: Piscataway, NJ, USA, 2001. [Google Scholar] [CrossRef]
- Kramer, H.J. Observation of the Earth and Its Environment: Survey of Missions and Sensors, 4th ed.; Springer: Berlin/Heidelberg, Germany, 2002; ISBN 3540423885. [Google Scholar]
- Holben, B.N.; Kaufman, Y.J.; Kendall, J.D. NOAA-11 AVHRR visible and near-IR inflight calibration. Int. J. Remote Sens. 1990, 11, 1511–1519. [Google Scholar] [CrossRef]
- Salomonson, V.; Barnes, W.; Xiong, J.; Kempler, S.; Masuoka, E. An overview of the Earth Observing System MODIS instrument and associated data systems performance. In IEEE International Geoscience and Remote Sensing Symposium; IEEE: Piscataway, NJ, USA, 2003; Volume 2, pp. 1174–1176. [Google Scholar] [CrossRef]
- Cao, C.; Xiong, J.; Blonski, S.; Liu, Q.; Uprety, S.; Shao, X.; Bai, Y.; Weng, F. Suomi NPP VIIRS sensor data record verification, validation, and long-term performance monitoring. J. Geophys. Res. Atmos. 2013, 118, 11664–11678. [Google Scholar] [CrossRef]
- Gordon, H.R.; Du, T.; Zhang, T. Atmospheric correction of ocean color sensors: Analysis of the effects of residual instrument polarization sensitivity. Appl. Opt. 1997, 36, 6938–6948. [Google Scholar] [CrossRef] [PubMed]
- Meister, G.; Franz, B.A.; Kwiatkowska, E.J.; Eplee, R.E.; McClain, C.R. Detector dependency of MODIS polarization sensitivity derived from on-orbit characterization. In Earth Observing Systems XIV; SPIE: Bellingham, WA, USA, 2009; Volume 7452. [Google Scholar] [CrossRef]
- Meister, G.; Eplee, R.E.; Franz, B.A. Corrections to MODIS Terra calibration and polarization trending derived from ocean color products. In Earth Observing Systems XIX; SPIE: Bellingham, WA, USA, 2014; Volume 9218. [Google Scholar] [CrossRef]
- Sun, J.; Wang, M.; Jiang, L.; Xiong, X. NOAA-20 VIIRS polarization effect and its correction. Appl. Opt. 2019, 58, 6655–6665. [Google Scholar] [CrossRef] [PubMed]
- Moyer, D.I.; McIntire, J.; Oudrari, H.; De Luccia, F.J. JPSS-2 VIIRS polarization sensitivity comparison with Heritage VIIRS sensors. In Earth Observing Missions and Sensors: Development, Implementation, and Characterization V; SPIE: Bellingham, WA, USA, 2018; Volume 10781. [Google Scholar] [CrossRef]
- McIntire, J.; Young, J.B.; Moyer, D.; Waluschka, E.; Oudrari, H.; Xiong, X. Analysis of JPSS J1 VIIRS polarization sensitivity using the NIST T-SIRCUS. In Earth Observing Systems XX; SPIE: Bellingham, WA, USA, 2015; Volume 9607. [Google Scholar] [CrossRef]
- Waluschka, E.; McCorkel, J.; McIntire, J.; Moyer, D.; McAndrew, B.; Brown, S.W.; Lykke, K.R.; Young, J.B.; Fest, E.; Wang, T.R.; et al. VIIRS/J1 polarization narrative. In Earth Observing Systems XX; SPIE: Bellingham, WA, USA, 2015; Volume 9607. [Google Scholar] [CrossRef]
- Moyer, D.; McIntire, J.; Young, J.; McCarthy, J.K.; Waluschka, E.; Xiong, X.; De Luccia, F.J. JPSS-1VIIRS Prelaunch Polarization Testing and Performance. IEEE Trans. Geosci. Remote Sens. 2017, 55, 2463–2476. [Google Scholar] [CrossRef]
Publisher’s Note: MDPI stays neutral with regard to jurisdictional claims in published maps and institutional affiliations. |
© 2022 by the authors. Licensee MDPI, Basel, Switzerland. This article is an open access article distributed under the terms and conditions of the Creative Commons Attribution (CC BY) license (https://creativecommons.org/licenses/by/4.0/).