Abstract
Wildfires are predicted to occur more frequently and intensely as a result of global warming, posing a greater threat to human society, terrestrial ecosystems, and the atmosphere. Most existing methods for monitoring wildfire occurrences are based either on static topographical information or weather-based indices. This work explored the advantages of a new machine learning-based ‘soil properties’ attribute in monitoring wildfire occurrence in Pakistan. Specifically, we used satellite observations during 2001–2020 to investigate the correlation at different temporal and spatial scales between wildfire properties (fire count, FC) and soil properties and classes (SoilGrids1km) derived from combination with local covariates using machine learning. The correlations were compared to that obtained with the static topographic index elevation to determine whether soil properties, such as soil bulk density, taxonomy, and texture, provide new independent information about wildfires. Finally, soil properties and the topographical indices were combined to establish multivariate linear regression models to estimate FC. Results show that: (1) the temporal variations of FC are negatively correlated with soil properties using the monthly observations at 1° grid and regional scales; and overall opposite annual cycles and interannual variations between and soil properties are observed in Pakistan; (2) compared to the other static variables such as elevation, soil properties shows stronger correlation with the temperate wildfire count in Northern Pakistan but weaker correlation with the wildfire properties in Southern Pakistan; and it is found that combining both types of indices enhances the explained variance for fire attributes in the two regions; (3) In comparison to linear regression models based solely on elevation, multivariate linear regression models based on soil properties offer superior estimates of FC.
1. Introduction
Wildfires have an impact on terrestrial ecosystems and the Earth’s climate system, as well as causing significant economic damage and harm to human health [1,2]. For example, they alter the composition and structure of forest stands and have a significant impact on post-fire recovery and production [3,4,5]. Wildfires (henceforth simply referred to as “fires”) influence the amount of ultraviolet radiation reaching the Earth’s surface [6], the radiative energy balance of the Earth’s climate, and the composition and chemistry of the atmosphere by producing smoke aerosols and trace chemicals [7,8]. Severe fires can kill a huge number of people, inflict enormous economic damage, and have a negative influence on air quality and human health [1,9]. These effects might be amplified by predictions of increasing fire activity in many parts of the world as a result of global warming [10,11]. Monitoring fire incidence and intensity, as well as understanding the temporal dynamics of fires, is critical for wildland management, the early warning of fire hazard, and air pollution.
Human activity, geography, weather, and fuel moisture are all elements that impact fire occurrence and intensity [12,13,14]. While the distance from infrastructures, population distribution, local land use, and fire legislation are all factors that impact human influence [14,15]. Topography, such as elevation, should be thought of as “static” elements in the temporal distribution of flames [16]. Conversely, weather and fuel moisture are dynamic and fluctuate over time, and both have a significant impact on the occurrence and intensity of fires. Precipitation, for example, prevents fires from starting, while windspeed affects fire spread rate and direction [17], and fuel moisture regulates fuel flammability and the rate at which fire energy is generated [17,18,19]. As a result, researchers commonly use weather and fuel moisture to build models to predict fire occurrence and risk, with supporting models relying mostly on meteorological and remotely-sensed data [18,20,21]. The weather-based fuel moisture codes and fire behavior indices from the Canadian Wildfires Weather Index System (CFFWIS), for example, employ factors including temperature, precipitation, and relative humidity to construct indices to assess fire-weather and fire-danger situations [21,22]. Many studies have utilized topography to forecast the occurrence of fires [23]. Despite its critical influence on fire incidence and severity, the effect of variables other than elevation, such as soil conditions, on fire hazard is poorly studied or overlooked in data-driven prediction models. Satellite remote sensing can help to address some of these difficulties by giving estimates of soil properties at regional, national, and global scales, as well as across several climatic zones. Many studies have already employed satellite-derived visible and infrared variables for fire hazard assessment, notably spectral indexes (e.g., moisture indices) [20,24]. Despite the fact that satellite optical and infrared images have a high spatial resolution and are available on platforms such as the Google Earth Engine, few novel criteria are employed and studied for fire evaluation. Remotely-Sensed-Derived datasets are receiving increasing attention in other fields, following the introduction of remarkable machine learning techniques. Compared with primary satellite data, machine-learned-derived datasets have large information, can relate to a large number of dependent variables and events. The new ‘digital’ approach to soil mapping is data-driven, relying on statistical methods and information technology to forecast soil properties based on soil point measurements and spatially comprehensive environmental factors [25,26]. This method takes advantage of new soil measurement technologies such as soil spectroscopy [27,28] and newly available global data layers, particularly those that are free and widely distributed, such as MODIS products [29], ASTER and Landsat images, and the Shuttle Radar Topography Mission digital elevation model (SRTM DEM) [27,28,30]. These are not only useful in identifying soil taxonomy, their textures, and bulk, but also provide unique information in monitoring vegetation water content. Soil moisture, vegetation, and plant kind are all factors that influence soil properties. In addition, soil moisture is influenced by soil texture and plants [31]. The impact of soil factors on plant shape and species diversity is more prominent in savannic formations. Habitats are structurally unique, and diversity differed across savannic and forest communities; however, when the savannic formation habitats were examined, a higher level of divergence occurred. Although plant diversity did not differ among forest formation habitats, soil attributes showed a close relationship with edaphic factors such as physical, chemical, and biological properties of soil, and can contribute to similar vegetation. The soil–vegetation relationship in highly diverse ecotonal landscapes is important from the conservation biology point of view and aids in the execution of proactive plans for the maintenance of biodiversity. [32]. When compared to sub-surface fluids, surface waters from native plant and grass catchments had a greater relative quantity of organic components suitable to coagulation removal. As a result, they play a role in both fuel and climatic-driven soil moisture variables. soil properties have a function as a fuel component for flames in the wildfire zone, as it drives soil moisture and vegetational group [30]. Surface waters from the native vegetation and grass catchments were generally found to have a higher relative abundance of organic compounds amenable to removal by coagulation compared with sub-surface waters; thus, play a role behind fuel factors, and climatic-driven soil moisture factors. Over wildfire regions, soil properties play a role as a fuel factor of wildfires as it is driving soil moisture and vegetational group. Based on these, [33] developed the soil properties at depth using satellite data, and experimental data using machine learning method to monitor soil taxonomy, texture, and bulk density [30,33,34,35]. Its performance has been evaluated in previous studies. For example, [36] used a simplified soil porosity approach to investigate the association between soil and drought. Their findings revealed substantial relationships between the soil moisture anomaly and standardized precipitation index, the land surface temperature anomaly, and the normalized difference vegetation index anomaly [36]. A recent study [37] discussed soil moisture effect on fire count, and allows space to discover more soil properties-based deriving factors behind FC. Such studies, however, are limited due to data availability, and the rare investigations on the relation of soil properties such as soil texture and taxonomy to fire properties.
In this study, we presented a useful introduction to the use of soil properties as an indicator of wildfire occurrence in Pakistan. Our work uses soil properties as a surrogate for determining the likelihood of wildfires, the existence of good soil mapping in most countries suggests that this indicator has substantial merit in evaluating the likelihood of wildfire occurrences. By linking soil metrics to data obtained through remote sensing, we have suggested a way to use “current” soil conditions as an immediate indicator of wildfire potential. We concluded that this approach should be tested in other country environments is sound; if soil properties can be used as a surrogate to forecast the potential for wildfires, this method could have widespread application and significant implications for land cover (soil) management. There is a pressing need to find and analyze more new factors behind wildfire activities to improve the accuracy of prediction and wildfire management. In our study, we evaluated and introduced soil properties as a driving factor that can be used in addition to other factors, such as elevation, topography, and climate. Wildfire prediction and driving factors are not limited to the traditional triangle of factors, as, in recent times, for example, Ref. [38] also used socioeconomic data, and introduced these as a driving factor behind wildfire.
In this work, we conducted a novel study of the connection and application of soil properties to wildfire attributes based on satellite machine learning soil properties acquired in earlier studies (e.g., [30]). Our goals were to: (i) look into the temporal relationship between machine-learned soil properties and wildfire occurrence (as measured by fire count, FC); (ii) see if remotely-sensed soil properties can explain temporal variations in FC better than commonly used static indices such as topography; and (iii) learn more about how soil properties and topographic indices can be used to estimate FC.
2. Materials and Methods
2.1. Study Area
The study area was Pakistan and the study object was wildfires that occurred over the period 2001–2020. Pakistan is in south Asia on the Arabian Sea. The surface area of Pakistan is 875,175 km2. Cropland cover 33.3% of this, wildland covers 25,683 km2, and grass/shrubland covers 292,882 km2. Thus, the wildland area of Pakistan is 36.4% of the whole. Pakistan recorded 175,000 fire events from 2001 to 2020, out of which 22,311 were categorized as wildfires. Pakistan’s wildland area is shown in Figure 1. Based on the land cover classification categorized as wildland, the map shows the area of interest overlaid with historical fire events from 2001–2020.
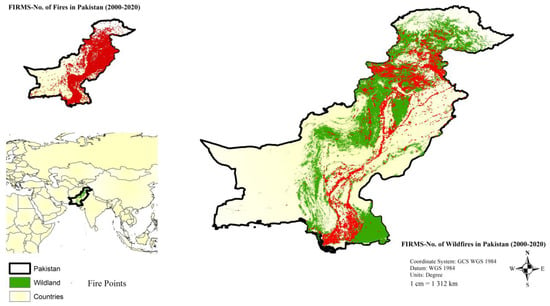
Figure 1.
Study area map of wildfires in Pakistan.
Pakistan’s eastern region is one of the most vulnerable to wildfires due to its arid climate which receives the lowest rainfall and is prone to desertification [39]. The north of the country has mountainous terrain, while the topography progressively declines southward. The northeast of the country has the largest population density. Population clusters may also be found in the vicinity of the country’s major cities, and they are scattered rather evenly across the country. The most sparsely inhabited parts of Pakistan are in the southwest.
There are four seasons in Pakistan: a mild, dry winter from December to February (DJF); a hot, dry spring from March to May (MAM); a summer rainy season, or southwest monsoon period, from June to August; (JJA) and a receding monsoon period from September to November (SON) [40]. Being in the South Asian Ecological Zone, Pakistan is a region of various landscapes and natural resources. It has a wide range of edaphic, physiographic, climatic, and wildlife characteristics. For a country like Pakistan, where the economy is centered on agriculture, wildland is one of the most valuable natural resources. At the same time, Pakistan has one of the world’s lowest forest cover, with only 4.5 percent of its land covered in forest, and is experiencing significant forest depletion [41]. During the second part of the twentieth century, there was evidence of higher fire incidence than in prior years in Pakistan, as well as other regions, as well as a constant increase in the frequency of big wildfires, and an increase in the extent of burned territory [42].
2.2. Soil Properties
Important soil properties such as soil texture, soil taxonomy, and soil bulk density that determine landscape shape as well as erosion and deposition processes include elevation, slope, the topographic wetness index, climate images, lithology and land cover maps, harmonized world soil database mapping units, and other environmental elements were used to create soil grids with 1 km estimations [34]. Table 1 shows the source of soil data with spatial resolution. Figure 2 depicts the variation in soil properties in the research region.
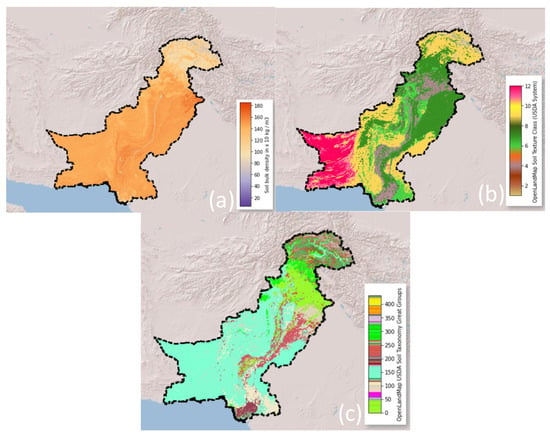
Figure 2.
Soil properties, (a) soil bulk density, (b) soil texture, and (c) soil taxonomy.
The National Cooperative Soil Survey and the United States Department of Agriculture developed the USDA soil taxonomy, which offers a detailed classification of soil types based on a number of factors (mostly their properties) and at various levels: Order, Suborder, Great Group, Subgroup, Family, and Series. Guy Donald Smith [43], a former head of the U.S. Department of Agriculture’s soil survey investigations, created the original categorization. Ref. [43] built it into machine learning predictions drawn from a global compilation of soil pro-files (>350,000 training points).
The percentage of sand, silt, and clay-sized particles that make up the mineral portion of the soil are referred to as the soil texture (such as loam, sandy loam, or clay). For instance, a light soil is one that is high in sand content compared to clay, whereas heavy soils are predominately composed of clay. The ability of the soil to retain water, the speed at which water moves through the soil, and how workable and fertile the soil is are all influenced by its texture [30].
Bulk density is used to determine how compacted a soil is. It’s calculated by dividing the soil’s dry weight by its volume. This volume includes the volume of soil particles as well as the volume of pores between soil particles. In most cases, bulk density is expressed in kilograms per cubic meter. 10× kg/m3 soil bulk density (fine earth) with a 250 m resolution at six standard depths (0, 10, 30, 60, 100, and 200 cm).


Table 1.
List and description of the study’s datasets with source information.
Table 1.
List and description of the study’s datasets with source information.
| Category | Parameter | Source | Resolution | Unit | Date |
|---|---|---|---|---|---|
| Soil | soil bulk density | open land map USDA [34] | 250 m | kg/m3 | 1950–2018 |
| soil taxonomy | open land map USDA [33] | Classes | |||
| Soil texture | open land map USDA [35] | ||||
| Fire | Fire points | NASA/LANCE/EOSDIS [44] | 1000 m | 2000–2020 |
2.3. Elevation, Fire Data
Elevation, as shown in Figure 3, makes up the topographic category. The elevation was calculated using a digital elevation model (DEM) with a spatial resolution of 30 m. The model was created using data from NASA’s Shuttle Radar Topography Mission (SRTM) [45].
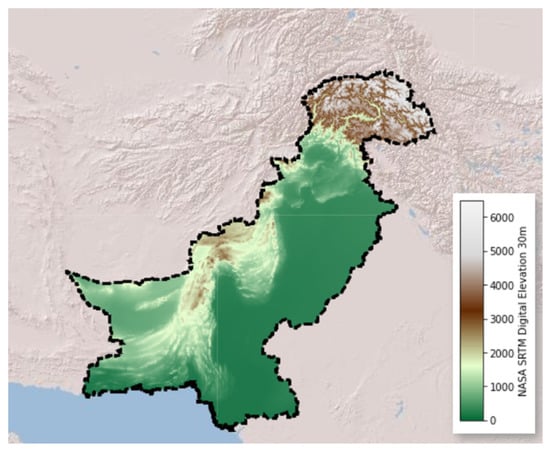
Figure 3.
Elevation of the study area.
The monthly correlation coefficients of elevation with FC are −0.29 in Northern Pakistan, and 0.18 in Southern Pakistan, according to data analysis. Topography (elevation) has been selected by many researchers in wildfire prediction [46,47,48,49,50,51,52,53,54]. Thus, we selected the topographical index elevation for associated analyses in this study. Fire locations were obtained from the MODIS 1-km fire product MYD14 to give daily fire detections [55]. Table 1 shows the source information of fire data. Furthermore, to filter wildfire points, the University of Maryland classification scheme was used to link MODIS’s monthly land-cover type product MCD12C1 Version 51 (0.05° 0.05°, [56]) with the University of Maryland classification system. The University of Maryland Dataset (UMD)’s landcover classification was employed as a guide, with classifications indicating shrublands, savannas, and wildlands (classes: 1–10).
2.4. Data Processing
We processed soil properties, topographical indices, and fire as follows (Figure 4). Based on fire location and fire date, we first identified for each 1-km fire detection the land cover type at the fire year from the nearest grid (0.05°) of the annual MCD12C1 data. We then calculated daily FC (number of the 1-km fire detections), mean soil bulk density, the maximum number of soil texture, and taxonomy classes at 0.25° resolution. For each 0.25° grid, we assigned the static (1958 to 2018) SRTM DEM values from the nearest grid (0.5°). We also calculated for each 1° grid the proportion of the number of 1-km wildfires detections, and the proportion of background forest coverage (using MCD12C1).
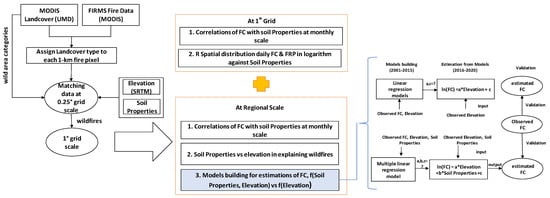
Figure 4.
Data processing and approaches used in the study.
To ensure that FC are mainly due to wildfires and that the soil properties mainly come from forests, only the 0.25° grids with background with classifications indicating shrublands, savannas, and wildlands (classes: 1–10) were used for subsequent analyses. Finally, matching data within 0.25° grids were aggregated into 1° grids. As potential random effects from uncertainty/error were present, sources, such as fire observation and soil properties retrieval at the scale of soil properties footprint (250 m), were minimized at a larger scale of 1°. For this, total FC, mean values of soil properties, and topographical indices were calculated for each 1° grid each day from 2000 to 2021.
We further used these 1° grid data to explore the linkage and application of wildfires to soil properties at 1° grid and regional scales following the approaches in Figure 4. Specifically, at a 1° grid scale, we compared the spatial distribution of FC with soil properties in the study regions and estimated the temporal correlations between them at each 1° grid. At the regional scale, we used those 1° grid data to calculate the regional total values of FC, and mean values of slope, elevation, and aspect at monthly scales) over Northern and Southern Pakistan, respectively. Then, we studied the temporal correlations between fire properties (FC) and soil properties, and the three selected topographical indices at the monthly scale. Finally, we studied the performances in predicting FC at a monthly mean scale using linear regression models with topographical indices only and with (topographical indices, and soil properties) as inputs. To simplify, we used the term “FC” to refer to the total values of FC hereafter.
3. Results
3.1. Wildfires with Soil Properties (SP) at 1.0° Grid Scale
The spatial distributions of soil properties, and FC during 2001–2020 are shown in Figure 5. Generally, lower soil bulk density often suggests lower vegetation water content which is linked to higher FC. Such associations are most noticeable between wet and dry seasons (winter versus receding monsoon, respectively), and between the Northern and Southern regions of Pakistan. In Northern Pakistan, soil bulk density is lowest (103) during the summer rainy season and coincides with the regional FC of 460, which is the second largest count in the region. In Southern Pakistan, the summer rainy season showed the lowest soil bulk density (129), and the third highest regional FC (201). As for a hot dry spring, both regions observed the highest soil bulk density against low FC. For comparison between the two regions, Northern Pakistan relative to Southern Pakistan shows lower soil bulk density, but higher FC. In Northern Pakistan, a mild dry winter observed a maximum (108) FC, which is almost equal to the lowest FC in the region.
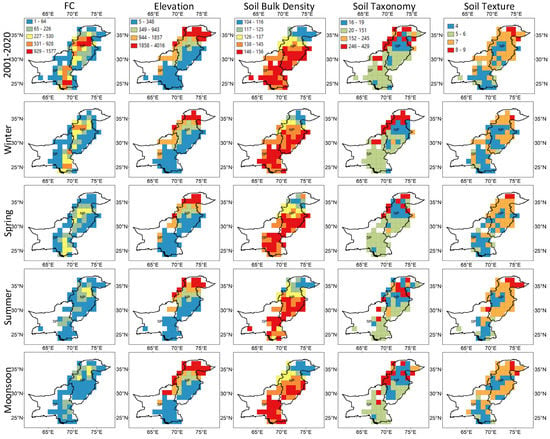
Figure 5.
Spatial distributions of soil properties, and cumulated FC during 2001–2020, and for each season during the period. NP and SP indicate Northern Pakistan and Southern Pakistan, respectively.
Lower soil texture classes are found to be linked with the highest FC. In Southern Pakistan soil class 4 (clay loam), showed the greatest number of fires in winter. In Northern Pakistan, class 4, and class 7 types (clay loam, and loam) showed the greatest number of fires during winter. In Northern Pakistan class 7 (loam) was linked with higher FC during the summer rainy season. In Southern Pakistan, the highest FC was linked with more soil type 4, clay loam, and 7, loam, during the summer rainy season. In spring, in Northern Pakistan, classes 7 and 4 showed the highest number of fires, while, in Southern Pakistan, class 4 showed a higher FC. In the receding monsoon period, Northern and Southern Pakistan witnessed the highest FC with soil texture class 7 (loam).
Soil taxonomy class 19 (Haplustalfs) was found in considerable numbers in Northern Pakistan, with a higher FC (15221). While, in Southern Pakistan, the 138 class was seen in greater numbers, with a lesser number of FC (7187). A substantial number of fires were related to soil taxonomy class 111 and class 117 during the winter season in Southern Pakistan. The soil taxonomy class 19 during spring in Northern Pakistan reveals a huge number of fires. However, the soil taxonomy classes 291, 111, and 151 revealed a higher frequency of fires only in some cells. FC was found in greater numbers during the summer rainy season in Northern Pakistan with soil taxonomy class 290. Higher FC was found during the summer rainy season in Southern Pakistan, against the soil taxonomy classes 429, and 19. The number of fires counted in Northern Pakistan during spring was the highest against soil taxonomy class 19. In Southern Pakistan during spring, class 117 showed the highest number of fires. In Northern Pakistan during the receding monsoon, taxonomy classes such as 19, 290, and 16 showed the highest number of FC. In Southern Pakistan during the receding monsoon, soil taxonomy class 138 showed the highest FC. In Southern Pakistan during winter, soil taxonomy class 291 showed the lowest fire count. In Northern Pakistan during the summer rainy season, soil taxonomy class 291, which is the highest value group, showed the lowest FC. While in Northern Pakistan during spring, soil taxonomy 291 was linked with the lowest FC. In Southern Pakistan during spring, the highest soil taxonomy class was linked with the lowest FC as well. In Northern Pakistan during the receding monsoon, class 291 was the highest taxonomy group and it showed much lower FC, but in the southern region, fire count was evidently higher in higher taxonomy groups in seasons such as winter, summer, and the receding monsoon. While Northern Pakistan showed FC varying between the low and higher taxonomy groups.
For each 1.0° grid, we looked at the temporal connection of monthly wildfires FC with soil properties. Because soil properties change over a narrow range of values (Figure 6), whereas FC fluctuate over a large range of values and are distributed in a nonlinear fashion, studies were performed at the ln(FC) and ln (soil properties) scales. To focus our research on places where fires occur often, we constrained future analyses to 1.0° grids with at least 40 matched fire and soil property data.
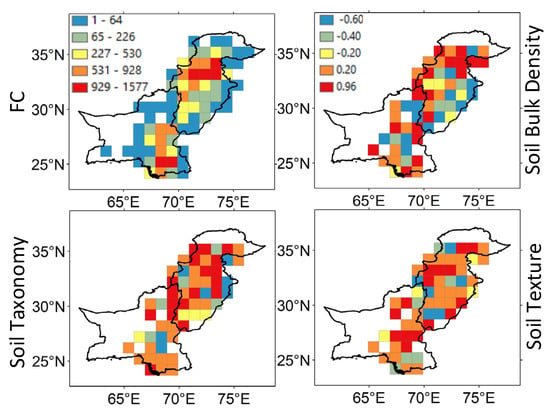
Figure 6.
During the period 2001–2020, the spatial distribution of the number of monthly paired observations (1.0° grids) of wildfires and soil parameters.
Many of those filtered grids have a negative correlation of ln(FC) versus monthly soil properties, with R ranging from −0.95 to −0.05 for soil bulk density, −0.98 to −0.19 for soil taxonomy, and −0.97 to −0.14 for soil texture, according to the analysis. A few even demonstrate a favorable link (Figure 6). Negative correlation grids account for 65% of all grids for soil bulk density and 64% for soil texture; soil taxonomy, on the other hand, exhibited a 44% negative correlation. The strong association shows that soil properties may be used to capture the influence of soil properties on wildfires at a 1.0° grid size, especially in places where wildfires are common.
3.2. Regional Wildfires with Soil Properties at Monthly Scale
Temporal connections between regional wildfires and soil properties were studied in this Section. To focus our study on areas with frequent fire activity, we constrained subsequent analyses to those 1.0° grids that had ≥40 paired observations of fire and soil properties. At the monthly scale, variations of ln(FC) are closely related to mean soil bulk density and linearly decrease with it (Figure 7). Low Pearson R of −0.16 and −0.27 are presented between ln(FC) and ln (soil bulk density) in Northern and Southern Pakistan, respectively, corresponding with the linear regression slopes of −0.01 and −0.05. At the monthly scale, variations of ln(FC) are closely related to soil taxonomy and linearly decrease with it in Northern Pakistan, while they increase with it in Southern Pakistan (Figure 7). Moderate Pearson R of −0.20 and 0.28 are presented between ln(FC) and ln (soil taxonomy) in Northern and Southern Pakistan, respectively, corresponding with the linear regression slopes of −0.24 and 0.17. At the monthly scale, variations of ln(FC) are closely related to soil textures and linearly decrease with it (Figure 7). Moderate Pearson R of −0.34 and 0.02 are presented between ln(FC) and ln (soil texture) in Northern and Southern Pakistan, respectively, corresponding with the linear regression slopes of −0.10 and 0.01. These results suggest the connection between the intra-annual variations of monthly wildfires FC with soil properties at a regional scale. Due to very small changes in the soil texture and soil taxonomy classes, the relationship curve is affected. It remains evident in both Southern and Northern Pakistan that a greater number of fires are happening in classes 4 and 7.
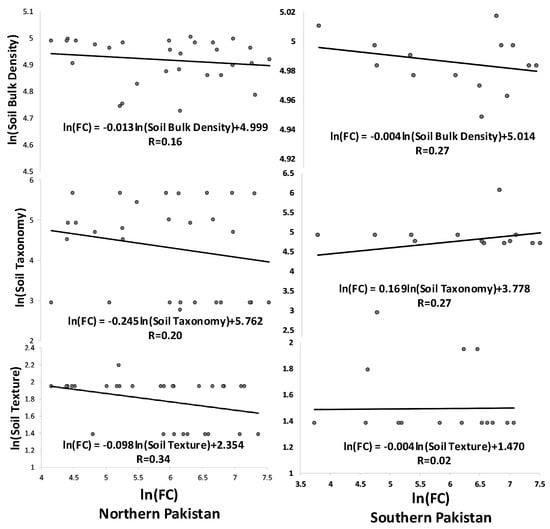
Figure 7.
In Northern Pakistan (left panel) and Southern Pakistan (right panel), monthly FC (in logarithm) is plotted against mean (or mode of classes) soil properties (the right panel). The black lines indicate the linear least squares regressions.
3.3. Soil Properties versus Elevation in Explaining Regional Wildfires
We studied the association of wildfire FC with the topographical index elevation and compared it to that with soil properties to see if soil properties give an alternative explanation for the temporal fluctuation of wildfires compared to the generally used topographical indices. The association coefficients of wildfire FC with the two types of variables are summarized in Figure 8. The correlations of ln(FC) with the three soil properties are often higher in the north than they are in the south. In the northern area, elevation has a positive association, whereas SP has a negative connection. Pearson R with the three soil properties varies from −0.15 to −0.34 on a monthly basis, and 0.18 for elevation. In comparison, correlations of ln(FC) with the three soil properties are usually smaller in Northern Pakistan soil attributes than those with elevation. In the northern area, elevation has a negative association. Pearson R on a monthly scale varies from −0.01 to −0.27 for the three soil properties, and −0.29 for elevation.
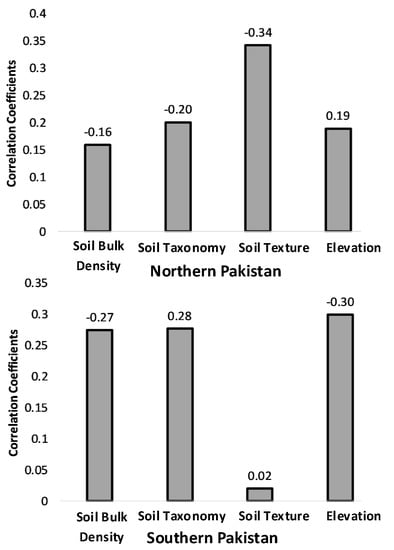
Figure 8.
Pearson’s Temporal in Northern Pakistan (top panel) and Southern Pakistan (bottom panel), R of monthly FC in logarithm versus mean soil properties, elevation. R was calculated at monthly scales using data from 2001 to 2020.
3.4. Combining Soil Properties and Elevation to Explain and Estimate Regional Wildfires
The above analyses reveal the different performances of soil properties versus the topography index elevation in explaining wildfire occurrence in the two regions. We further examined their synergistic effect on daily FC. High FC, as illustrated in Figure 9, is associated with low soil bulk density, soil taxonomy, soil texture, and high elevation. A high topographical index elevation is necessary for high FC when soil qualities change, and the frequency of seeing high FC diminishes. A low topographical index, on the other hand, necessitates low soil properties for high FC. Wildfire’s influence on soil properties and topographical indices was largely noticed in the north.
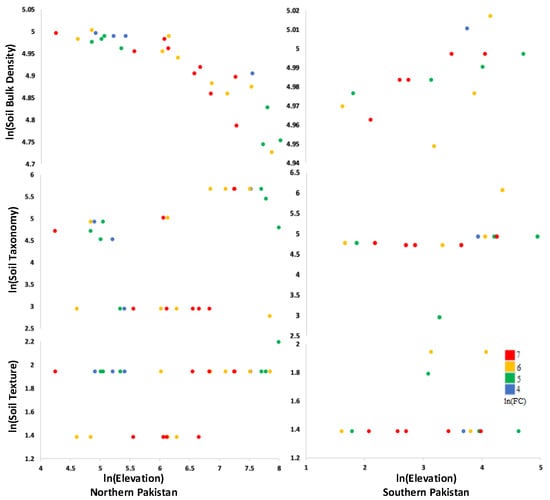
Figure 9.
Monthly FC in North and Southern Pakistan as a function of a mix of regional mean soil properties and topography index (elevation) from 2001 to 2020.
We then combined soil properties and the topographic index elevation to estimate the multiple correlation coefficients, and to establish multivariate linear regression models for the monthly ln(FC), separately, using data from 2001 to 2015. The established multivariate linear regression models (Table 2) were further used to predict FC during the 2016–2020 period and were evaluated using satellite observations in the same period (see details of approach in Figure 1). As the results in Table 2 show, the combination of soil properties and elevation performs better than using elevation alone in explaining monthly variations of FC in both regions. In Northern Pakistan, the multivariate correlation coefficients of monthly FC with (soil properties, elevation) are 0.59, higher than the R of 0.19 with elevation. In Southern Pakistan, for monthly FC, R increases from 0.30 with elevation to 0.60 with (soil properties, elevation). The improvement when using both soil properties and elevation as explanatory variables is less significant in Northern Pakistan than in Southern Pakistan.

Table 2.
Using data from 2001 to 2015, regressions and correlations of ln(FC) as a function of elevation vs. as a function of a combination of soil properties and elevation. Elevation—(E), soil bulk density—SBD, soil taxonomy—STax, and soil texture—SText.
In addition, including soil properties as an extra explanatory component improves the prediction of FC when compared to linear models based just on elevation. In Northern Pakistan, monthly correlations between computed FC and satellite measurements improve from 0.01 to 0.60. As a result, the RMSE of FC drops from 0.94 to 0.75 (Figure 10). Correlations between estimated and observed FC improve from 0.35 to 0.60 in Southern Pakistan, whereas RMSE decreases from 0.92 to 0.79 (Figure 10). These findings demonstrate the use of soil properties in enhancing wildfire FC estimate at monthly scales in the two areas. However, there are certain adjustments that need to be checked between daily scales in order to establish higher temporal validity.
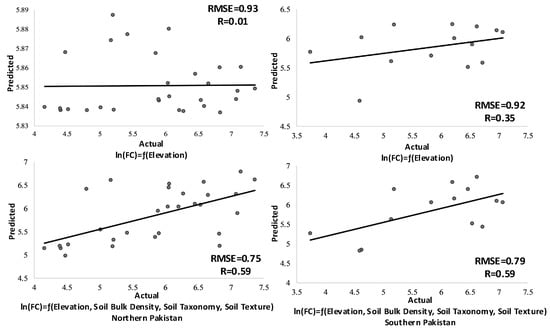
Figure 10.
Monthly FC (Predicted) was calculated and compared to satellite-observed FC (Actual) in Northern and Southern Pakistan from 2016 to 2020. FC predictions were derived using Table 2’s daily-based models. RMSE = Root Mean Square Error; R = Pearson Correlation Coefficient; R = Pearson Correlation Coefficient; R = Pearson Correlation.
4. Discussion
We provided an overview of the utilization of soil properties as a wildfire occurrence indicator in Pakistan in this study. Our research relies on soil properties to estimate the risk of wildfires; the fact that most nations have accurate soil maps shows that this indicator has considerable value in estimating the likelihood of wildfire occurrences. We have proposed a method to use “current” soil conditions as an immediate indicator of wildfire potential by integrating soil metrics into remote sensing data. We conclude that this strategy should be explored in other country regions. If soil properties can be used as a proxy to predict the likelihood of wildfires, this methodology might be widely adopted and have important ramifications for managing land cover (soil). There is an urgent need to identify and examine additional and novel properties that influence wildfire activities in order to increase the precision of prediction and wildfire management. As a driving component that can be used in addition to other parameters, such as elevation, topography, and climate, soil qualities were assessed and introduced in our study. In recent years, for instance, Ref. [38] used socioeconomic data, and offered it as a driving component behind wildfire. This shows that wildfire forecasting and driven variables are not confined to a few factors.
The underlying theoretical basis for the correlation of FC with soil properties can be briefly explained as follows. High bulk density is indicated by low soil porosity and compaction. Root growth might be limited, and air and water movement in the soil could be hampered. Compaction can result in shallow plant roots and poor plant growth, decreasing the amount of vegetative cover available to protect soil from erosion while also diminishing agricultural productivity. By reducing water absorption into the soil, compaction can produce increased runoff and erosion from sloping slopes or saturated soils in flat areas. Under dry climates, moderate soil compaction to prevent water transport through the soil profile is advantageous, although compaction affects receding monsoon yields due to increased humidity in both the northern and southern areas of Pakistan. Plants at such soil bulk densities show poor health, increasing the risk of fire incidence and spread. The soil texture classes falling in fire-prone areas are 4 and 7. Soil texture 7 (Loam) showed the most fire counts in Northern Pakistan because, as such a soil texture is regarded as the most welcoming for plants, a large area of wildlands is covered by it. In addition, such soils are more prone to erosion in the rainy season, hence leading to larger vegetation cover with poor health in rainy seasons. In terms of the clumping or aggregation of minerals into larger clusters, loam soils have great structure. Loam soils are more workable than other soil types due to their moist nature, but they are also more prone to eroding. This is due to the high silt and fine sand content and moderate to low permeability of loam soils. Therefore, while water is readily retained in loam soils, it does not readily enter to increase bulk and density. As a result, loam soils have a tendency for detaching particles. When silt and clay particles in the soil are disturbed by rain, wind, or construction, the silt and clay can readily be transferred and the soil can start to erode. Northern Pakistan experiences large rainfall, and wind and population of the northern region are also high, which affects loam soil properties more drastically.
Soil texture 4 (Clay Loam) demonstrated the highest number of fires in Southern Pakistan. The density of the clay is the cause of the two biggest drawbacks of clay loam. When it becomes wet, it expands to contain water, making it difficult to handle. Plant growth may be hampered by poor drainage over time. Dry clay shrinks but keeps its compactness, resulting in dense clouds and soil surface cracking. The higher temperatures in the south cause soil to dry up, which then dries out soil-effecting plants, increasing the danger of fire. Many studies have been conducted to determine how soil conditions affect plant types and health [57].
In terms of classes of soil taxonomy, class Haplustalf (19) is generating a huge number of fires in the north; it is not regarded as beneficial for plant health, and it can induce dryness in plants. As a result, significant fire counts may be seen, and the large soil taxonomy class Torrifluvents (138) is the most prevalent, while large fire counts are associated with Camborthids (111). In the south, with Torrifluvents (138), we can see soils on flood plains or alluvial fans in desert, moderate climates. Despite the fact that the soils are slightly salty, they cannot be extremely salty. They’re probably stratified, but there aren’t any severe watering limitations. When sensitive plants are watered, iron chlorosis can be a problem. Unless the soils are watered, they can only be used for restricted grazing. Camborthids (111) represent the driest end of the large group’s spectrum, with minimal organic matter and little accessible water. Moisture-rich soils are classed as intergrades to Mollisols because they have higher biologic activity and organic content. Weak silica cementation indicates a shift to Durorthids. A clay-like texture and expanding clays imply a transition to Vertisols. Although they are not the most common, Typic Camborthids are the driest Camborthid subgroup. They feature a variety of slopes, ranging from gentle to high. The bulk of these soils is used for grazing, although when slopes are gentle and water is available, many of them are irrigated. As a result, during dry seasons, particularly in the south, where elevation is lower, vegetation may be in poor health and thus be more susceptible to fire. The flammability of the fuel is increased, the time to ignite is reduced, and the rate of energy release is accelerated as a result of poor vegetative health [18,19]. As a result, with related soil qualities, an increase in fire occurrence (e.g., FC) is predicted. Based on these findings, the correlation of FC with soil properties can be deduced as follows: for months with low (high) weather properties, soil properties play a different role, forests are relatively dry (wet), and fuel conditions are favorable (unfavorable) for fire activity, resulting in a statistical increase (decrease) in fire occurrence. Similarly, the behavior of static properties such as soil bulk density is strongly interlinked with the meteorological dynamics of wildfires as the seasons change and the amount of flames varies. In the receding monsoon, soil taxonomy played a major role, while in the hot, dry spring season, soil texture played the most important role.
4.1. Wildfires with Soil Properties
The relationships between soil properties and FC discovered in this study are similar to those established in prior studies regarding soil moisture [57]. Bulk density is an indicator of soil compaction as wet bulk density is affected by moisture content. Ref. [52] found that significant negative relationships existed between field-based fuel moisture content and the number of fires, and between field-based fuel moisture content and burn area for herbaceous and two shrub species in the Mediterranean ecosystem. In California, for example, Ref. [58] produced nonlinear fitting curves between fuel moisture and burn area, while [59] demonstrated a nonlinear decline in the number of fire detections across live fuel moisture content. Previous studies have looked at the impact of soil properties on plant health, which is consistent with our findings [60,61,62,63]. In our study, we found a link between soil properties and fire frequency, despite the fact that we focused on wildfires and employed machine-learned soil parameters and fire counts from satellite, rather than field samples or archival, data. Furthermore, we found that FC and soil properties had largely opposite interannual fluctuations. Our study’s nonlinear link between FC and soil properties (e.g., Figure 4) is also consistent with literature that discusses elevation alone as a driver of wildfires [46,54,58,59,64].
4.2. SP versus Elevation in Explaining Wildfires
Soil properties (soil texture) give a better explanation for wildfires in Northern Pakistan than other static indices (DEM) but are less effective in explaining wildfires in Southern Pakistan (see Section 3.3). We attribute this to the relative importance of soil properties and elevation on wildfires in the two regions.
In the north, soil properties are likely more important than elevation in driving wildfires because correlations of FC with soil texture indices are generally higher than those with elevation. This is how we describe it: soil texture in northern loam is most affected by increasing changes due to natural disasters, large population, and higher wind and rain, which causes soil erosion and plant health to deteriorate and the water content of plants to reduce, hence the chances of plants catching fire increases [60,65]. Because of the low elevation of Southern Pakistan, fire activity might grow dramatically as a result of more access to the area and a greater population. Higher elevation in the north may also cause fire more than in Southern Pakistan due to its strong direct influence on fires. Associated evidence for this is provided by the significantly higher correlations of FC with elevation in the north (Figure 6). The relationship of elevation is positive in the north and negative in the south, which could be related to the fact that, in elevated areas, there are more chances of fire with an increase in elevation. While in Southern Pakistan, where the area is less elevated, the elevation decrease is driving Fire Count based on the different and suitable socioeconomic and weather conditions in both regions.
4.3. Combining Elevation and Indices to Explain and Estimate Wildfires
Our findings also show that soil properties are an excellent complement to static indices (DEM) in explaining and predicting the occurrence of wildfires in Pakistan. We provide two lines of evidence hereafter. First, the daily FC are found to change as a function of the combination of soil properties and topographic indices (Figure 7). Under such conditions, low elevations do not limit fires. While with high soil bulk density, soil texture, and elevation, and low soil taxonomy, fire ignition potential is restricted by high live fuel moisture content and better vegetation health, and favorable conditions, leading to fewer observations of high FC (Figure 7). Second, the multivariate linear regression models based on soil properties and elevation perform better in estimating monthly FC in the two regions than linear regression models based on elevation alone (see Section 3.4). Such improvement is obvious because estimations of FC using the multivariate linear regression models show higher correlation but lower root mean square errors with satellite observations (Figure 8 and Figure 9). Particularly, the improvement is more significant in estimating wildfires FC at the monthly scale (e.g., fire occurrence) though the linear/multivariate linear regressions applied may not be the best models. More complex models and intercomparing among multiple models would provide more details for the usefulness of elevation in modeling wildfire properties; and this will be conducted in our future study.
4.4. Sources of Uncertainty
Despite the fact that our data suggest that soil properties may be utilized to explain and estimate wildfires FC, the low to moderate correlations between wildfires and soil highlight the relevance of other factors such as human activities, vegetation composition, and the structure of flames [12,13,14]. If there were no fire ignition sources, no flames would be detected, regardless of the soil attributes value. Furthermore, several uncertainties may influence our findings, including (1) the coarse soil properties footprint (25 km), which may include some bare soil and open water bodies, causing forest soil properties to be underestimated; (2) despite our requirement that only specific types of landcover be classified as wildfire, a possible combination of non-forest vegetation signals inside the soil properties area may introduce noise into our results; and (3) the coarse Soil Properties footprint (25 km), which may include some bare soil and open water bodies, causing forest Soil Properties (see Section 2.4); (4) At fire locations (identified by 1-km MODIS fire detections), the vegetation water status represented by soil properties (25 km) may have changed due to regional variance in vegetation and its moisture content; and (5) Deep canopies, thick smoke, and clouds weaken fire signals, preventing detection [66,67], resulting in an underestimation of FC from MODIS [68].
5. Conclusions
Soil properties datasets prepared through machine learning based on remotely sensed data have a strong capability in monitoring surface and vegetation properties. However, few studies have applied soil properties observation in wildfire prediction. In this study, we comprehensively investigated the utility of soil properties, using soil bulk density, soil texture, and soil taxonomy indices derived from previous studies in explaining and modeling the temporal variation of wildfire count (FC) over Pakistan. Results show that the temporal variations of FC in the two regions of Pakistan are closely related to soil properties with generally negative correlations observed using monthly observations, suggesting the strong capability of machine learning in capturing the effect of soil properties on fire occurrence. Soil attributes, as compared to the commonly utilized static topographical indices from the SRTM digital elevation model, give a superior explanation of FC in Northern Pakistan, but are less effective in explaining FC changes in Southern Pakistan. This disparity might be explained by the relative relevance of topography and live fuel soil qualities, and, hence, vegetation type and health, in the two regions, as well as the possible differences in other parameters, such as organic layer properties, wildland composition, and structure, all of which should be investigated further. In both regions, a combination of soil properties and elevation was shown to better explain wildfires FC. When compared to linear regression models based just on elevation, the adoption of multivariate linear regression models based on soil properties and elevation improves the estimation of monthly FC. These findings give direct and early evidence that soil properties may be used to explain and simulate short- and long-term wildfire fluctuations. Although the present poor resolution of soil properties (~0.25 km) restricts its applicability at smaller geographical scales, our findings in Northern and Southern Pakistan demonstrate its utility at the regional scale. We suggest further research could help assess soil properties’ usefulness towards understanding vegetation fires in regions other than that selected in our study, and possibly understanding structural fires.
Author Contributions
W.R.: Conceptualization, Methodology, Data curation and Writing—Original draft preparation. M.I.: Visualization, Investigation, Software and validation. R.K.: Writing—Reviewing and Editing. S.W.: Supervision. All authors have read and agreed to the published version of the manuscript.
Funding
The work was supported by National Key R&D Program of China (2021YFC3000300).
Data Availability Statement
All the data that support this study are open access and can be accessed using websites or data repositories. Source of datasets are described accordingly.
Conflicts of Interest
The authors declare no conflict of interest.
References
- Chen, J.; Li, C.; Ristovski, Z.; Milic, A.; Gu, Y.; Islam, M.S.; Wang, S.; Hao, J.; Zhang, H.; He, C.; et al. A review of biomass burning: Emissions and impacts on air quality, health and climate in China. Sci. Total Environ. 2017, 579, 1000–1034. [Google Scholar] [CrossRef] [PubMed]
- Bond, W.J.; Keeley, J.E. Fire as a global ‘herbivore’: The ecology and evolution of flammable ecosystems. Trends Ecol. Evol. 2005, 20, 387–394. [Google Scholar] [CrossRef] [PubMed]
- Bergeron, Y.; Irulappa Pillai Vijayakumar, D.B.; Ouzennou, H.; Raulier, F.; Leduc, A.; Gauthier, S. Projections of future forest age class structure under the influence of fire and harvesting: Implications for forest management in the boreal forest of eastern Canada. For. Int. J. For. Res. 2017, 90, 485–495. [Google Scholar] [CrossRef]
- Boucher, Y.; Auger, I.; Noël, J.; Grondin, P.; Arseneault, D. Fire is a stronger driver of forest composition than logging in the boreal forest of eastern Canada. J. Veg. Sci. 2017, 28, 57–68. [Google Scholar] [CrossRef]
- Sparks, A.M.; Kolden, C.A.; Smith, A.; Boschetti, L.; Johnson, D.M.; Cochrane, M.A. Fire intensity impacts on post-fire temperate coniferous forest net primary productivity. Biogeosciences 2018, 15, 1173–1183. [Google Scholar] [CrossRef]
- Tzanis, C.; Tsivola, E.; Efstathiou, M.; Varotsos, C. Forest fires pollution impact on the solar UV irradiance at the ground. Fresenius Environ. Bull 2009, 18, e2158. [Google Scholar]
- Andreae, M.O.; Merlet, P. Emission of trace gases and aerosols from biomass burning. Glob. Biogeochem. Cycles 2001, 15, 955–966. [Google Scholar] [CrossRef]
- Randerson, J.T.; Liu, H.; Flanner, M.G.; Chambers, S.D.; Jin, Y.; Hess, P.G.; Pfister, G.; Mack, M.C.; Treseder, K.K.; Welp, L.R.; et al. The impact of boreal forest fire on climate warming. Science 2006, 314, 1130–1132. [Google Scholar] [CrossRef]
- Wang, D.; Guan, D.; Zhu, S.; Kinnon, M.M.; Geng, G.; Zhang, Q.; Zheng, H.; Lei, T.; Shao, S.; Gong, P.; et al. Economic footprint of California wildfires in 2018. Nat. Sustain. 2021, 4, 252–260. [Google Scholar] [CrossRef]
- Bergeron, Y.; Cyr, D.; Girardin, M.P.; Carcaillet, C. Will climate change drive 21st century burn rates in Canadian boreal forest outside of its natural variability: Collating global climate model experiments with sedimentary charcoal data. Int. J. Wildland Fire 2010, 19, 1127–1139. [Google Scholar] [CrossRef]
- Flannigan, M.D.; Krawchuk, M.A.; de Groot, W.J.; Wotton, B.M.; Gowman, L.M. Implications of changing climate for global wildland fire. Int. J. Wildland Fire 2009, 18, 483–507. [Google Scholar] [CrossRef]
- Chuvieco, E.; Aguado, I.; Yebra, M.; Nieto, H.; Salas, J.; Martín, M.P.; Vilar, L.; Martínez, J.; Martín, S.; Ibarra, P.; et al. Development of a framework for fire risk assessment using remote sensing and geographic information system technologies. Ecol. Model. 2010, 221, 46–58. [Google Scholar] [CrossRef]
- Govender, N.; Trollope, W.S.; van Wilgen, B.W. The effect of fire season, fire frequency, rainfall and management on fire intensity in savanna vegetation in South Africa. J. Appl. Ecol. 2006, 43, 748–758. [Google Scholar] [CrossRef]
- Guo, F.; Su, Z.; Wang, G.; Sun, L.; Lin, F.; Liu, A. Wildfire ignition in the forests of southeast China: Identifying drivers and spatial distribution to predict wildfire likelihood. Appl. Geogr. 2016, 66, 12–21. [Google Scholar] [CrossRef]
- Xiong, Q.; Luo, X.; Liang, P.; Xiao, Y.; Xiao, Q.; Sun, H.; Pan, K.; Wang, L.; Li, L.; Pang, X. Fire from policy, human interventions, or biophysical factors? Temporal–spatial patterns of forest fire in southwestern China. For. Ecol. Manag. 2020, 474, 118381. [Google Scholar] [CrossRef]
- Carlson, J.; Burgan, R. Review of users’ needs in operational fire danger estimation: The Oklahoma example. Int. J. Remote Sens. 2003, 24, 1601–1620. [Google Scholar] [CrossRef]
- Viegas, D.X. Slope and wind effects on fire propagation. Int. J. Wildland Fire 2004, 13, 143–156. [Google Scholar] [CrossRef]
- Yebra, M.; Dennison, P.E.; Chuvieco, E.; Riaño, D.; Zylstra, P.; Hunt, E.R., Jr.; Danson, F.M.; Qi, Y.; Jurdao, S. A global review of remote sensing of live fuel moisture content for fire danger assessment: Moving towards operational products. Remote Sens. Environ. 2013, 136, 455–468. [Google Scholar] [CrossRef]
- Possell, M.; Bell, T.L. The influence of fuel moisture content on the combustion of Eucalyptus foliage. Int. J. Wildland Fire 2012, 22, 343–352. [Google Scholar] [CrossRef]
- Molaudzi, O.D.; Adelabu, S.A. Review of the use of remote sensing for monitoring wildfire risk conditions to support fire risk assessment in protected areas. South Afr. J. Geomat. 2018, 7, 222–242. [Google Scholar] [CrossRef]
- Hamadeh, N.; Daya, B.; Hilal, A.; Chauvet, P. An analytical review on the most widely used meteorological models in forest fire prediction. In Proceedings of the 2015 Third International Conference on Technological Advances in Electrical, Electronics and Computer Engineering (TAEECE), Beirut, Lebanon, 29 April–1 May 2015. [Google Scholar]
- Van Wagner, C.E. (Ed.) Development and Structure of the Canadian Forest Fire Weather Index System; Canadian Forestry Service, Headquarters, Ottawa. Forestry Technical Report 35; Canadian Forest Service Publications: Ottawa, ON, Canada, 1987; p. 19927. 35p. [Google Scholar]
- Sulova, A.; Jokar Arsanjani, J. Exploratory analysis of driving force of wildfires in Australia: An application of machine learning within Google Earth engine. Remote Sens. 2020, 13, 10. [Google Scholar] [CrossRef]
- Chowdhury, E.H.; Hassan, Q.K. Operational perspective of remote sensing-based forest fire danger forecasting systems. ISPRS J. Photogramm. Remote Sens. 2015, 104, 224–236. [Google Scholar] [CrossRef]
- McBratney, A.B.; MacMillan, R.A.; Carré, F. Digital Soil Mapping. In Handbook of Soil Science; Li, H., Ed.; CRC: Boca Raton, FL, USA, 2011; p. 1/45. [Google Scholar]
- Boettinger, J.L.; Howell, D.W.; Moore, A.C.; Hartemink, A.E.; Kienast-Brown, S. (Eds.) Digital Soil Mapping: Bridging Research, Environmental Application, and Operation; Springer Science & Business Media: Berlin/Heidelberg, Germany, 2010. [Google Scholar]
- Shepherd, K.D.; Walsh, M.G. Infrared spectroscopy—Enabling an evidence-based diagnostic surveillance approach to agricultural and environmental management in developing countries. J. Near Infrared Spectrosc. 2007, 15, 1–19. [Google Scholar] [CrossRef]
- Nocita, M.; Stevens, A.; van Wesemael, B.; Brown, D.J.; Shepherd, K.D. Soil Spectroscopy: An Opportunity to Be Seized. Glob. Chang. Biol. 2015, 21, 10–11. [Google Scholar] [CrossRef] [PubMed]
- Savtchenko, A.; Ouzounov, D.; Ahmad, S.; Acker, J.; Leptoukh, G.; Koziana, J.; Nickless, D. Terra and Aqua MODIS products available from NASA GES DAAC. Adv. Space Res. 2004, 34, 710–714. [Google Scholar] [CrossRef]
- Hengl, T.; Heuvelink, G.B.; Kempen, B.; Leenaars, J.G.; Walsh, M.G.; Shepherd, K.D.; Sila, A.; MacMillan, R.A.; Mendes de Jesus, J.; Tamene, L.; et al. Mapping soil properties of Africa at 250 m resolution: Random forests significantly improve current predictions. PLoS ONE 2015, 10, e0125814. [Google Scholar]
- English, N.B.; Weltzin, J.F.; Fravolini, A.; Thomas, L.; Williams, D.G. The influence of soil texture and vegetation on soil moisture under rainout shelters in a semi-desert grassland. J. Arid Environ. 2005, 63, 324–343. [Google Scholar] [CrossRef]
- Rodrigues, P.M.S.; Schaefer, C.E.G.R.; de Oliveira Silva, J.; Ferreira Júnior, W.G.; dos Santos, R.M.; Neri, A.V. The influence of soil on vegetation structure and plant diversity in different tropical savannic and forest habitats. J. Plant Ecol. 2018, 11, 226–236. [Google Scholar] [CrossRef]
- Hengl, T.; Nauman, T. Predicted USDA soil great groups at 250 m (probabilities). Zenodo 2018. Available online: https://zenodo.org/record/3528062#.Y2CfcHZByUk (accessed on 27 September 2022).
- Hengl, T. Soil bulk density (fine earth) 10 × kg/m-cubic at 6 standard depths (0, 10, 30, 60, 100 and 200 cm) at 250 m resolution. Zenodo 2018. Available online: https://zenodo.org/record/1492157#.Y2CfzHZByUk (accessed on 27 September 2022).
- Hengl, T. Soil texture classes (USDA system) for 6 soil depths (0, 10, 30, 60, 100 and 200 cm) at 250 m. Zenodo 2018. Available online: https://zenodo.org/record/2525817#.Y2Cf9HZByUk (accessed on 27 September 2022).
- Ontel, I.; Ir Ontel, I.; Irimescu, A.; Boldeanu, G.; Mihailescu, D.; Angearu, C.V.; Nertan, A.; Craciunescu, V.; Negreanu, S. Assessment of Soil Moisture Anomaly Sensitivity to Detect Drought Spatio-Temporal Variability in Romania. Sensors 2021, 21, 8371. [Google Scholar] [CrossRef] [PubMed]
- Li, R.; Fu, Y.; Bergeron, Y.; Valeria, O.; Chavardès, R.D.; Hu, J.; Wang, Y.; Duan, J.; Li, D.; Cheng, Y. Assessing forest fire properties in Northeastern Asia and Southern China with satellite microwave Emissivity Difference Vegetation Index (EDVI). ISPRS J. Photogramm. Remote Sens. 2022, 183, 54–65. [Google Scholar] [CrossRef]
- Rafaqat, W.; Iqbal, M.; Kanwal, R.; Song, W. Study of Driving Factors Using Machine Learning to Determine the Effect of Topography, Climate, and Fuel on Wildfire in Pakistan. Remote Sens. 2022, 14, 1918. [Google Scholar] [CrossRef]
- Kattel, D.B.; Yao, T.; Ullah, K.; Rana, A.S. Seasonal near-surface air temperature dependence on elevation and geographical coordinates for Pakistan. Theor. Appl. Climatol. 2019, 138, 1591–1613. [Google Scholar] [CrossRef]
- Begum, B.A.; Biswas, S.K.; Pandit, G.G.; Saradhi, I.V.; Waheed, S.; Siddique, N.; Seneviratne, M.S.; Cohen, D.D.; Markwitz, A.; Hopke, P.K. Long–range transport of soil dust and smoke pollution in the South Asian region. Atmos. Pollut. Res. 2011, 2, 151–157. [Google Scholar] [CrossRef]
- Oliveira, S.L.; Pereira, J.M.; Carreiras, J.M. Fire frequency analysis in Portugal (1975–2005), using Landsat-based burnt area maps. Int. J. Wildland Fire 2011, 21, 48–60. [Google Scholar] [CrossRef]
- FerreirA-leiTe, F.; Lourenço, L.; Bento-Gonçalves, A. Large forest fires in mainland Portugal, brief characterization. Méditerranée. Rev. Géographique Des Pays Méditerranéens/J. Mediterr. Geogr. 2013, 121, 53–65. [Google Scholar]
- Smith, G.D. Experimental Studies on the Development of Heavy Claypans in Soils; University of Missouri, College of Agriculture, Agricultural Experiment Station: Columbia, MO, USA, 1934. [Google Scholar]
- MODIS/Aqua+Terra Thermal Anomalies/Fire locations 1 km FIRMS V006 NRT (Vector Data). Available online: https://catalog.data.gov/dataset/modis-aqua-terra-thermal-anomalies-fire-locations-1km-firms-v006-nrt-vector-data (accessed on 27 September 2022).
- Farr, T.G.; Rosen, P.A.; Caro, E.; Crippen, R.; Duren, R.; Hensley, S.; Kobrick, M.; Paller, M.; Rodriguez, E.; Roth, L.; et al. The Shuttle Radar Topography Mission. Rev. Geophys. 2007, 45, RG2004. [Google Scholar] [CrossRef]
- Maingi, J.K.; Henry, M.C. Factors influencing wildfire occurrence and distribution in eastern Kentucky, USA. Int. J. Wildland Fire 2007, 16, 23–33. [Google Scholar] [CrossRef]
- Dodson, E.K.; Root, H.T. Conifer regeneration following stand-replacing wildfire varies along an elevation gradient in a ponderosa pine forest, Oregon, USA. For. Ecol. Manag. 2013, 302, 163–170. [Google Scholar] [CrossRef]
- Starbuck, C.A.; Considine, E.S.; Chambers, C.L. Water and elevation are more important than burn severity in predicting bat activity at multiple scales in a post-wildfire landscape. PLoS ONE 2020, 15, e0231170. [Google Scholar] [CrossRef]
- Verde, J.; Zêzere, J. Assessment and validation of wildfire susceptibility and hazard in Portugal. Nat. Hazards Earth Syst. Sci. 2010, 10, 485–497. [Google Scholar] [CrossRef]
- Alizadeh, M.R.; Abatzoglou, J.T.; Luce, C.H.; Adamowski, J.F.; Farid, A.; Sadegh, M. Warming enabled upslope advance in western US forest fires. Proc. Natl. Acad. Sci. USA 2021, 118, e2009717118. [Google Scholar] [CrossRef] [PubMed]
- Carmo, M.; Moreira, F.; Casimiro, P.; Vaz, P. Land use and topography influences on wildfire occurrence in northern Portugal. Landsc. Urban Plan. 2011, 100, 169–176. [Google Scholar] [CrossRef]
- Bassett, M.; Leonard, S.W.; Chia, E.K.; Clarke, M.F.; Bennett, A.F. Interacting effects of fire severity, time since fire and topography on vegetation structure after wildfire. For. Ecol. Manag. 2017, 396, 26–34. [Google Scholar] [CrossRef]
- Calviño-Cancela, M.; Chas-Amil, M.L.; García-Martínez, E.D.; Touza, J. Interacting effects of topography, vegetation, human activities and wildland-urban interfaces on wildfire ignition risk. For. Ecol. Manag. 2017, 397, 10–17. [Google Scholar] [CrossRef]
- Alexandre, P.M.; Stewart, S.I.; Mockrin, M.H.; Keuler, N.S.; Syphard, A.D.; Bar-Massada, A.; Clayton, M.K.; Radeloff, V.C. The relative impacts of vegetation, topography and spatial arrangement on building loss to wildfires in case studies of California and Colorado. Landsc. Ecol. 2016, 31, 415–430. [Google Scholar] [CrossRef]
- Louis Giglio, C.J. MODIS/Aqua Thermal Anomalies/Fire 5-Min L2 Swath 1 km V006. NASA EOSDIS Land Processes DAAC, 2015-08-26T00:00:00.000Z. 006. Available online: https://data.amerigeoss.org/es/dataset/modis-aqua-thermal-anomalies-fire-5-min-l2-swath-1km-v006 (accessed on 27 September 2022).
- Friedl, M.A.; Sulla-Menashe, D.; Tan, B.; Schneider, A.; Ramankutty, N.; Sibley, A.; Huang, X. MODIS Collection 5 global land cover: Algorithm refinements and characterization of new datasets. Remote Sens. Environ. 2010, 114, 168–182. [Google Scholar] [CrossRef]
- Syed, A.; Sarwar, G.; Shah, S.H.; Muhammad, S. Soil salinity research in 21st century in Pakistan: Its impact on availability of plant nutrients, growth and yield of crops. Commun. Soil Sci. Plant Anal. 2021, 52, 183–200. [Google Scholar] [CrossRef]
- Schoenberg, F.P.; Peng, R.; Huang, Z.; Rundel, P. Detection of non-linearities in the dependence of burn area on fuel age and climatic variables. Int. J. Wildland Fire 2003, 12, 1–6. [Google Scholar] [CrossRef]
- Jurdao, S.; Chuvieco, E.; Arevalillo, J.M. Modelling fire ignition probability from satellite estimates of live fuel moisture content. Fire Ecol. 2012, 8, 77–97. [Google Scholar] [CrossRef]
- Schimel, J.; Chadwick, O. What’s in a name? The importance of soil taxonomy for ecology and biogeochemistry. Front. Ecol. Environ. 2013, 11, 405–407. [Google Scholar] [CrossRef]
- Benetková, P.; Tichý, L.; Háněl, L.; Kukla, J.; Vicentini, F.; Frouz, J. The effect of soil and plant material transplants on vegetation and soil biota during forest restoration in a limestone quarry: A case study. Ecol. Eng. 2020, 158, 106039. [Google Scholar] [CrossRef]
- Nyamekye, C.; Schönbrodt-Stitt, S.; Amekudzi, L.K.; Zoungrana, B.J.B.; Thiel, M. Usage of MODIS NDVI to evaluate the effect of soil and water conservation measures on vegetation in Burkina Faso. Land Degrad. Dev. 2021, 32, 7–19. [Google Scholar] [CrossRef]
- Wu, G.L.; Liu, Y.F.; Cui, Z.; Liu, Y.; Shi, Z.H.; Yin, R.; Kardol, P. Trade-off between vegetation type, soil erosion control and surface water in global semi-arid regions: A meta-analysis. J. Appl. Ecol. 2020, 57, 875–885. [Google Scholar] [CrossRef]
- Nolan, R.H.; Boer, M.M.; Resco de Dios, V.; Caccamo, G.; Bradstock, R.A. Large-scale, dynamic transformations in fuel moisture drive wildfire activity across southeastern Australia. Geophys. Res. Lett. 2016, 43, 4229–4238. [Google Scholar] [CrossRef]
- Westerling, A.L.; Hidalgo, H.G.; Cayan, D.R.; Swetnam, T.W. Warming and earlier spring increase western US forest wildfire activity. Science 2006, 313, 940–943. [Google Scholar] [CrossRef]
- Schroeder, W.; Csiszar, I.; Morisette, J. Quantifying the impact of cloud obscuration on remote sensing of active fires in the Brazilian Amazon. Remote Sens. Environ. 2008, 112, 456–470. [Google Scholar] [CrossRef]
- Dickinson, M.B.; Hudak, A.T.; Zajkowski, T.; Loudermilk, E.L.; Schroeder, W.; Ellison, L.; Kremens, R.L.; Holley, W.; Martinez, O.; Paxton, A.; et al. Measuring radiant emissions from entire prescribed fires with ground, airborne and satellite sensors–RxCADRE 2012. Int. J. Wildland Fire 2015, 25, 48–61. [Google Scholar] [CrossRef]
- Fu, Y.; Li, R.; Wang, X.; Bergeron, Y.; Valeria, O.; Chavardès, R.D.; Wang, Y.; Hu, J. Fire detection and fire radiative power in forests and low-biomass lands in Northeast Asia: MODIS versus VIIRS Fire Products. Remote Sens. 2020, 12, 2870. [Google Scholar] [CrossRef]
Publisher’s Note: MDPI stays neutral with regard to jurisdictional claims in published maps and institutional affiliations. |
© 2022 by the authors. Licensee MDPI, Basel, Switzerland. This article is an open access article distributed under the terms and conditions of the Creative Commons Attribution (CC BY) license (https://creativecommons.org/licenses/by/4.0/).