Abstract
This research analyzes the impact on land use induced by urban solid waste landfills using the Weighted Environmental Index (WEI). The methodology used to analyze the environmental value of the landfill’s areas of influence is based on the analysis of the space-time variations of the WEI inside them. The application of this methodology allows identifying the areas where the environmental value has changed over time, providing a quantitative indicator that can be analyzed using statistical techniques. The methodology has been applied as a case study to analyze the influence over land use in all the municipal solid waste landfills currently in operation inside the Valencia Region (Spain). Results have been obtained using GIS techniques integrating the information provided by the Information System on Land Occupation in Spain land use database. Results show that, without exception, the environmental value of the territory has decreased in all the cases analyzed. WEI is a powerful tool for analyzing land use change over time, and its application allows for performing detailed statistical analyses leading to key conclusions about land use changes inside the landfill influence areas.
1. Introduction
The analysis of changes in land use (LULC) is one of the main challenges in territorial planning. There are different tools that integrate the different territorial functions, such as production, landscape, management of water resources, land use planning, natural characteristics, and the conservation of the identity to which the territory is strongly linked. The development of these tools is essential to properly understand the dynamics and variables in territorial management [1].
Anthropic actions are the most important factors that induce land use change and modify the environmental balance in all space-time scales. These changes are one of the main environmental concerns in relation to climate change, soil and air contamination, water resources, and loss of biodiversity. Therefore, mitigating the negative consequences of these changes has become a priority for researchers and policymakers around the world [2].
Changes in LULCs can be interpreted as non-linear dynamic interactions between human beings and nature that involve important transformation processes of the earth’s surface through complex processes. The evolution of these changes on the planet in the last 300 years has fundamentally meant an increase in agricultural areas and the expansion of urban areas to the detriment of forest areas. Many developed countries have practiced massive deforestation for centuries, with agricultural expansion and industrialization influenced by population growth identified as the main drivers. This has led to an intensive modification of the landscape due mainly to the socioeconomic and political changes of the first half of the 19th century in Europe and North America. However, another important trend has been the decrease in agricultural areas due to urban expansion and the increase in surface water consumption [3].
The intensification of the LULC change is directly related to the overexploitation of natural resources and climatic changes. Therefore, the integration of natural and anthropic factors in the dynamics of land use change and the analysis of direct or indirect driving variables is a relevant topic for researchers. Its results must be the basis for the development of policies and actions to guarantee the efficient use of natural resources.
Landfills are currently the most widely used urban solid waste disposal method [1,2,3], despite being the last option in the waste management hierarchy (Circular Economy Package Directive, 2008/98/EC) [4,5,6,7].
Different studies have been published to describe and quantify the environmental problems induced by landfills [8]. The main environmental risks of this infrastructure are related to the management of leachate and biogas [9,10], which can contaminate the soil, atmosphere, and surface- and groundwater, becoming a risk to human health. Other possible negative impacts are those derived from the settlement that occurs over time as the waste decomposes, which may affect the land close to the landfill site [6]. Moreover, there are also social, economic, and territorial impacts, which must be evaluated to achieve optimal management of waste dumps [11].
Currently, the use of indicators to evaluate the management of waste landfills focuses mainly on the analysis of leachate [12,13,14] and biogas [15,16,17]. This research has been developed under very specific conditions and refers to small areas.
In relation to the rest of the factors, the use of indicators is much less implemented. There are studies that, using economic indicators, seek to identify the influence of the existence of landfills on the price of the nearest homes. Some results show that the price of properties decreases in the vicinity of the landfill [18,19]. In [20], it is indicated that the impacts on the value of the property vary considerably from one landfill to another, depending on the amount of waste deposited in the facilities. However, other studies do not show a statistical relationship between proximity to a landfill and house prices [21,22,23].
Bioindicators have also been used to evaluate changes in the ecosystems close to landfills, studying the alteration in the behavior, appearance, or presence of some organism or their concentration [24,25]. However, despite the fact that scientific interest in biomonitoring has increased in recent years, the use of bioindicators is rarely applied in the analysis of landfills [7].
With regard to territorial variables, there are hardly any studies that evaluate land use and its change as a consequence of the existence of solid waste dumps. These investigations are limited, for example, to optimizing the site selection of new landfills [26,27] or to determining the change in urban land use due to the modification of the topography [28].
These latest studies related to land use require the application of GIS and remote sensing techniques. These techniques have been used in landfills mainly to justify their best location [11,29,30,31,32,33]. Other applications of remote sensing in landfills are, for example, the measurement of methane emissions [34] or the location of illegal landfills [35].
However, there are few investigations aimed at carrying out continuous environmental monitoring of landfills using remote sensing [36,37], and land use is not usually included among the factors studied.
The few existing studies show that the existence of waste dumps contributes to land degradation [38,39]. However, these studies do not quantify this degradation or provide information about the change in land use.
Environmental indicators based on GIS analysis of land use generally use qualitative values, and the number of categories is usually small [40,41,42,43,44]. This allows for performing easy comparisons between different years but not quantitative assessments of changes in environmental quality.
The Weighted Environmental Index (WEI), based on land use analysis techniques, integrates all the information obtained from official public databases at a detailed scale and quantitatively evaluates the environmental quality of the territory. The complete description of the index, as well as the justification for its development, can be found in [45].
The objective of this work is to analyze land use change in the surroundings of urban solid waste landfills. This task has been performed using the Weighted Environmental Index (WEI) [45] to compare the environmental value in the landfill’s influence areas. The space-time evolution of WEI has been analyzed in all the landfills currently in operation in the Region of Valencia (Spain) between 2005 and 2015.
2. Materials and Methods
2.1. The Information System on Land Occupation in Spain (SIOSE) Land Use Cartography
Land use mapping, integrated into geographic information systems (GIS), is a basic element for the design of policies for the analysis, management, and planning of the territory. In 1990 the Corine Land Cover (Coordination of information on the environment) program was created for Europe [46]. Its main objective was to create an updated European-wide database of land uses at a 1:100,000 scale. However, for policy management at the national level, this spatial scale does not provide enough detail. For this reason, each country has created its own land use information system at the national level. Starting in 2005, Spain created the SIOSE project (Information System on Land Occupation in Spain) at a 1:25,000 scale. Using 2005 as a reference, the National Geographic Institute (IGN) published the first version of the SIOSE land use database in 2012, and the second update (based on 2011 data) was published in 2016. Its distribution has been carried out through the download center of the National Geographic Information Center (CDIGN) (https://centrodedescargas.cnig.es/CentroDescargas/index.jsp, accessed on 1 August 2022) [47].
The main difference between the SIOSE and CORINE databases is the type of model used. While CORINE considers a hierarchical model with 44 classes at level three, SIOSE is an object-oriented model with a total of 85 land cover types that incorporates 40 simple classes and 45 compound classes, as well as 23 attributes subdivided into different types. Aside from the different spatial resolutions, there are other notable differences between the two databases. One example is the existing differences in the dimensions of the interpreted landscape elements, such as, for example, the minimum width of the linear elements (roads and infrastructure). While for CORINE, the minimum width is 100 m, for SIOSE, the minimum width is 15 m [48].
The SIOSE database is generated from the interpretation of Spot 5 satellite images as the main source of information. The polygon is the working unit and is the only geometric entity delimited. Within this polygon, land uses are inscribed, considering them continuous land spaces with sets of attributes that characterize them and represent 100% of the surface. Land use in the polygon is simple when there is only one type of cover on its entire surface, and it is compound when two or more simple and/or compound uses are identified inside the polygon [49]. For the representation of the land use type for each polygon, a code called “Label” is used, and, within it, all the land cover types that are present in it are included, using the following nomenclature:
PPCCaa1 aa2 … aan
where:
- PP: corresponds to the land use percentage if it is lower than 100%
- CC: corresponds to the land cover label
- aa1: corresponds to the first attribute
- aa2: corresponds to the second attribute
- aan: corresponds to the nth attribute
When polygons contain more than two land covers, the “_” symbol is used to separate them, and the “()” symbol is used to sub-define composite covers. Although this structure is a bit complex, it generates a very detailed model that is very useful at the disaggregation level. The database is grouped by type, theme, and sub-theme. The type of cover can be (i) simple, (ii) compound, or (iii) predefined. The theme can be (i) cultivation, (ii) forestry, or (iii) artificial compound, among others. The subtopic can be (i) Herbaceous crops, (ii) Leafy, or (iii) Industrial [49].
A land use database depends not only on its quality and spatial resolution but also on its level of updating. These updating processes generally require a significant effort, both in terms of time and financial resources. SIOSE 2005 is the first version of the national land use map in Spain. The next update was made for the ensuing four years in 2009. However, the update period is currently two years. Inside Spain, each region is responsible for maintaining the SIOSE database for its territory [50].
In this work, the SIOSE 2005, 2009, and 2015 databases have been used to describe land use, the last being the last officially published by the IGN in Spain.
2.2. The Weighted Environmental Index (WEI)
The Weighted Environmental Index (WEI) has been developed by the Research Institute of Water Engineering and Environment of the Universitat Politècnica de València (IIAMA-UPV) as a tool to analyze the environmental value based on land use [45].
WEI is calculated for every polygon in which SIOSE discretizes the area under study, accounting for the existing land uses inside it. The process of determining environmental index values for each land use (EIj) is done by accounting for the joint consideration of the following five environmental factors (Fi), which may acquire a value between 0 and 100:
- F1: Anthropic or natural nature of activity developed in soil.
- F2: Water consumption associated with land use.
- F3: Soil degradation (use of chemicals).
- F4: Environmental sustainability of land use (stability of the ecosystem).
- F5: Landscape value of activity carried out in the analyzed area.
A quantitative evaluation for every environmental factor and every land use is done using GIS tools. The value of the Weighted Environmental Index inside every polygon (WEIk) is obtained by considering the value of the weighting factors () defined by the user and the proportion of every land use inside each polygon (βjk).
Equations (1) to (5) are used to obtain the value of the WEI index inside every polygon:
where:
: environmental index of land use j ()
assigned weights to factor i
: evaluation factor i
: total area of study
: area of polygon k
npol: total number of polygons in the discretization
WEIk: weighted environmental index of polygon k
Ajk: area assigned to land use j inside the polygon k
βjk: land use weighting factor j in polygon k
njk: number of land uses (j) inside polygon k
The values of the weighted environmental index considered in this research for each land use (WEIk) included in the SIOSE legend as a result of the linear combination of the five evaluation factors (Fi) considered in the index definition are provided in Supplementary Material (Table S1). In this research, equal values of the weights associated with each factor ( = 0.2) have been considered.
The application of the WEI to each land use considered by the SIOSE legend allows a classification to be established based on the discrimination by ranges shown in Table 1:

Table 1.
Environmental value as a function of the WEI range.
2.3. WEI Computation Methodology
Figure 1 shows the flowchart of the computation methodology used in this research. For every landfill and for every year under analysis, the landfill’s influence area must be defined. Inside this area, all the existing polygons must be identified. Afterward, LULC inside every polygon must be obtained using the classification considered by SIOSE (see Supplementary Material Table S1). Once all this information has been obtained, WEI index for every polygon can be computed using the preestablished set of Environmental Factors (Fi). Finally, WEI distribution functions and the evolution of their average values over time can be computed based on previous results.
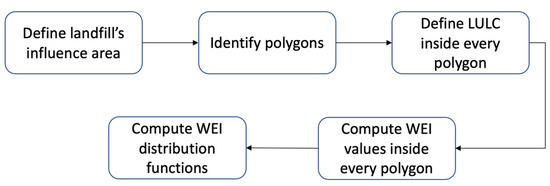
Figure 1.
WEI computation methodology flowchart.
A detailed description of the WEI definition can be found in [45].
3. Case Study: The Solid Waste Landfills in Valencia Region (Spain)
3.1. Description of the Study Area
The Valencian Community is one of the 17 autonomous regions into which Spain is divided. It is made up of three provinces (Alicante, Castellón, and Valencia), keeping its capital in the city of Valencia. It is located on the east side of the Iberian Peninsula, on the coast of the Mediterranean Sea. It has an area of 23,255 km2 and a population of 5,003,769 inhabitants, according to the latest data provided by the Spanish National Statistical Institute (INE).
The Municipal Solid Waste (MSW) management system inside the region is ultimately dependent on a set of sanitary landfills to which the refuse from the mechanical-biological waste treatment plants is sent. These plants classify the solid waste, obtain recycling by-products, and process the organic fraction of the waste to produce compost. The efficiency of this process is low, and usually, around 50% of the total mass of MSW is ultimately stored in sanitary landfills.
Following the current MSW management plan [51], the region is divided into 11 areas (Zonal Plans-ZP). Each one of these areas should independently manage the solid waste produced inside them. However, for environmental and social reasons, area A6 (located in the bottom south of the region) does not have any treatment plants or landfills. Currently, there are 10 sanitary landfills in operation inside the region. Their location and main characteristics are shown in Figure 2 and Table 2.
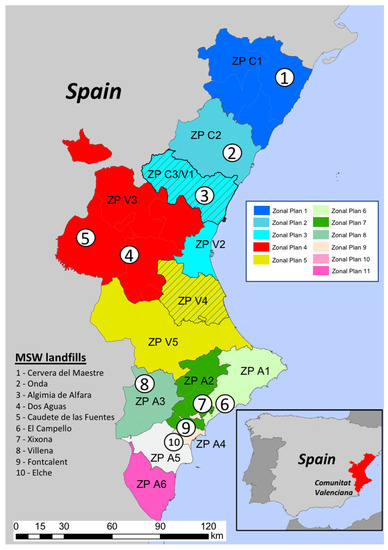
Figure 2.
Location of the 10 sanitary landfills currently in operation inside Valencia Community and delimitation of the MSW Zonal Plans.
Table 2.
Main characteristics of the 10 sanitary landfills currently in operation inside Valencia Community.
3.2. Results and Discussion
For each one of the 10 landfills, the temporal evolution of WEI has been analyzed using the SIOSE land use maps for 2005, 2009, and 2015. The differences between the WEI values inside an area defined by a 5 km radius circumference centered on each landfill have been obtained to analyze the impact of the presence of the landfills on the environmental value.
As an example of the results obtained for a particular landfill, Figure 3 shows the land use (LCM) using the SIOSE database on the Algimia de Alfara influence area in 2005 and 2015. The areas (Has) of each one of the LCM categories considered by SIOSE in these years and its evolution in the 2005–2015 period are shown in Table 3.
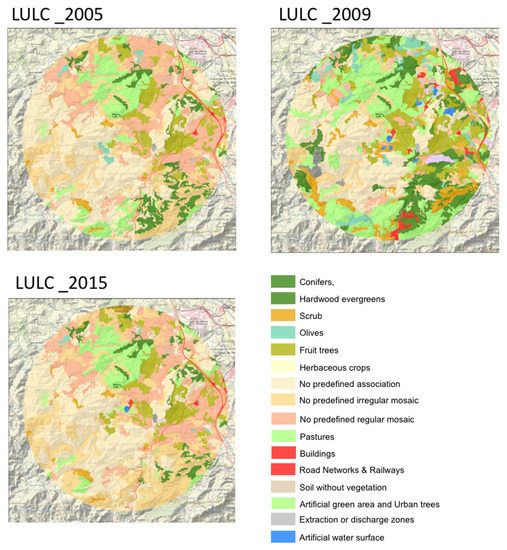
Figure 3.
Land use following SIOSE on the Algimia de Alfara landfill influence area in 2005, 2009 and 2015.
Table 3.
Land use change in the Algimia de Alfara landfill influence area (2005–2015).
Results show that land use inside the predefined landfill influence area of the Algimia de Alfara landfill has changed during the 2005–2015 period. A total of 2.52% of coniferous surfaces and 2.6% of grassland surfaces have been lost. Crop surfaces have increased by 6% with respect to the total study area.
These changes may have been induced by the existence of the landfill or just happened due to other reasons. SIOSE database provides information about LULC at a scale that is detailed enough to visualize these changes in particular plots of land. Similar results have been obtained for all ten landfills currently in operation in the Valencia Region.
In order to analyze the evolution of the environmental value around the landfills, the WEI index has been used. Figure 4 shows the WEI distribution evolution for the Algimia de Alfara landfill influence area in 2005, 2009, and 2015 and the map of WEI variations, which allows the visualization of the loss of environmental value between 2005 and 2015. For this particular landfill, the higher loss of environmental value is located in the South-Eastern part of the influence area (marked as red areas in Figure 4).
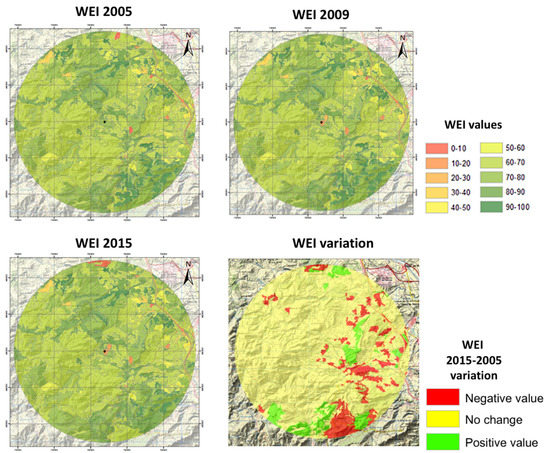
Figure 4.
WEI distribution and variations in the Algimia de Alfara landfill between 2005 and 2015.
The comprehensive analysis of the LCM evolution using the SIOSE database, the WEI distribution evolution for every landfill in the 2005–2009–2015 period, and the correspondent maps of WEI differences are included as Supplementary Material (Figure S1).
3.2.1. LCM and WEI Evolution over Time on the Landfill’s Influence Areas
The evolution over time of the WEI values and distribution has been obtained for all ten landfills currently in operation inside the Valencia Region. Similar results to those obtained for the Algimia de Alfara landfill (shown in Figure 3 and Figure 4) have been obtained for the other nine landfills under study. All the details about LCM change over time for all the landfill sites are provided in the Supplementary Material (Figure S1). Some of the main specific results obtained for each landfill are the following:
- -
- In the Campello landfill area, 7.98% of forest association and 1.81% of grassland areas have been lost. Crop mosaics have increased by 9.08%, and the landfill with its treatment plant has been installed within an area equal to 0.61% of the total study area.
- -
- In the Caudete de las Fuentes landfill area, 0.5% of pasture areas have been lost. Urban zones have increased by 0.91% with respect to the total study area.
- -
- In the Cervera del Maestre landfill area, 0.64% of non-predefined mosaic areas have been lost. Urban zones have decreased by 0.21% with respect to the total study area. Mining zones and extraction zones have increased by 0.43%.
- -
- In the Dos Aguas landfill area, a reclassification in the SIOSE database may have been performed, as results show extreme LCM variations inside it.
- -
- In the Elche landfill area, 14.03% of forestry associations and 1.3% of fruit trees areas have been lost. Crop surfaces have increased by 10.29% and pastures by 2.97% with respect to the total study area.
- -
- In the Fontcalent landfill area, 2.75% of grassland and 2.18% of forest association areas have been lost. Crops have increased by 1.83% with respect to the total study area.
- -
- In the Onda landfill area, 12.63% of grassland, 2.18% of fruit-bearing areas, and 2.43% of the primary forests have been lost. Crops have increased by 15.40% with respect to the total study area.
- -
- In the Villena landfill area, 12.43% of the grassland and 2.98% of the vineyard areas have been lost. Crop areas have increased by 14.70%.
- -
- In the Xixona landfill area, 16.65% of the forest, 6.15% of grassland areas, and 2.21% of rainfed herbaceous crops have been lost. Crop mosaics have increased by 24.27% with respect to the total study area.
WEI values have been obtained for every landfill site for 2005, 2009, and 2015. Table 4 shows these WEI values and the corresponding percentage evolution during this period.
Table 4.
WEI values and percentage variation over time in the 2005–2009–2015 period.
Results show that WEI has decreased in all the landfills in the 2005–2015 period. On average, WEI has decreased by 2.89% in the 2005–2015 period, going from WEI = 72.90 in 2005 to WEI = 70.79 in 2015.
Results shown in Table 4 about the WEI evolution over time on every landfill can be interpreted as follows:
- The El Campello, Villena, and Elche landfills were built in 2005, so a decrease in the environmental value of the area was expected. Between 2009 and 2015, WEI values did not change significantly.
- The Onda, Xixona, and Fontcalent landfills were built in 2005, so a decrease in the environmental value of the area was expected. However, between 2009 and 2015, WEI values also decreased with time.
- The Algimia, Caudete de las Fuentes, and Cervera del Maestre landfills show a small decrease in the WEI values in the 2005–2009 period but a much larger decrease between 2009 and 2015. There is not enough information to explain these observations.
- The Dos Aguas landfill shows the largest WEI decrease (−10.59%), going from WEI = 73.31 in 2005 to WEI = 65.54 in 2015. As has been said above, an in-depth analysis has shown that this effect may be due to a reclassification in the SIOSE database, so it is not likely to be a direct effect induced by the landfill.
Figure 5 shows the WEI evolution between 2005 and 2015 for every landfill. It has been seen that WEI decreased for every landfill during the period of analysis. The Algimia de Alfara landfill is the one that shows the lowest WEI variation over time (−0.55%).
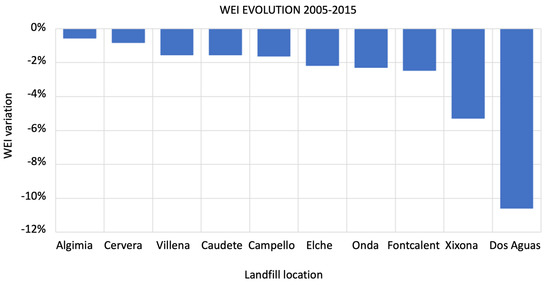
Figure 5.
WEI evolution between 2005 and 2015 for every landfill.
3.2.2. WEI Distribution Inside the Landfill Influence Area
The definition of WEI allows the performance of an analysis of its distribution inside the landfill influence area (a circle of a 5 km radius centered at the landfill site). Figure 6 shows the evolution of the WEI distribution functions over time inside the landfill influence area.
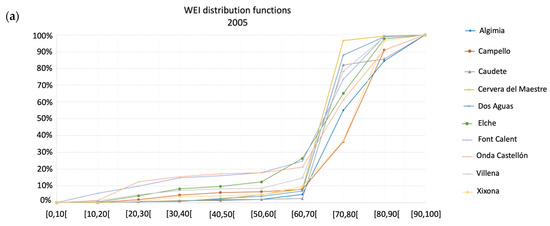
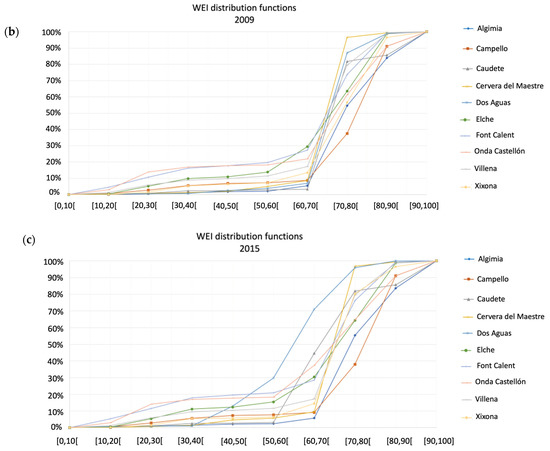
Figure 6.
Evolution of the WEI distribution functions inside the landfill influence area for (a) 2005, (b) 2009, and (c) 2015.
Results show that all the landfills are located in locations of high environmental value (WEI average value was over 70 during the whole period of analysis). The effect of landfills over time inside their influence areas is such that the WEI distribution functions expand horizontally, especially in the 2009–2015 period, as can be seen by comparing Figure 5b,c. This effect is also clearly seen in Figure 7, which shows the WEI average distribution function and its maximum and minimum values observed in the 2005–2015 period.
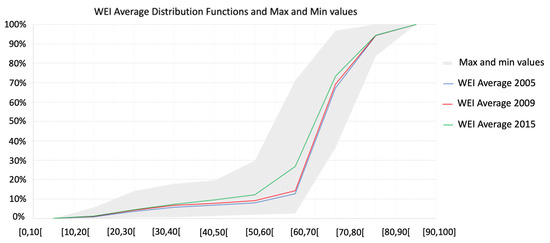
Figure 7.
WEI average distribution function and maximum and minimum values.
Figure 6 and Figure 7 show that all the existing landfills inside the Valencia Region are located in areas in which the WEI median value ranges from 55 to 75, exposing their high environmental value. This is consistent with the fact that landfills in the Valencia Region are usually located far away from urban centers where agriculture or natural land is the predominant land use
To better understand the changes in land use (LCM) inside the influence areas, Figure 8 shows the WEI evolution over time for each one of the ten classes in which the distribution function has been divided.
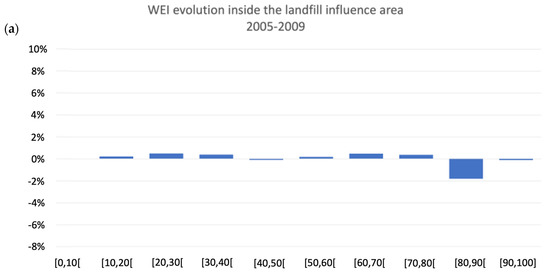
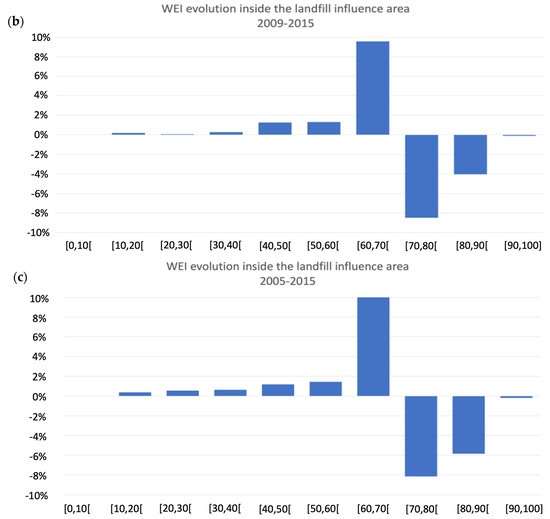
Figure 8.
WEI evolution inside the landfill influence area for each one of the ten classes. (a) 2005–2009, (b) 2009–2015, (c) 2005–2015.
Figure 8a shows that between 2005 and 2009, there has been a 2% decrease in the area of the WEI class [80,90[, and this area is now occupied by a land use of lower value.
Figure 8b shows that the majority of the land use changes happened between 2009 and 2015. More than 8% of the area of the WEI class [70,80[ and more than 4% of the area of the WEI class [80,90[ were lost, and these areas are now occupied by a land use of lower value (almost 10% of the lost area is now included in the WEI class [60,70[).
Figure 8c shows the overall effect of land use change over time in the influence area of the landfills. Fourteen percent of the total area was originally included inside WEI classes [70,80[ and [80,90[. However, 10% was included in WEI class [60,70[ by 2015, and the rest (4%) was included in lower WEI classes.
4. Conclusions
The Weighted Environmental Index (WEI), a new index based on object-oriented models and using GIS data, has been applied to analyze the evolution over time of the environmental value around all the landfill sites currently in operation in the Valencia Community (Spain). The proposed methodology allows quantifying the environmental value of the study areas based on the spatial and temporal evolution of land use.
Results show that environmental value (measured in terms of the WEI index) decreases with time around landfill sites. This effect has been described in the existing scientific literature but can now be quantified using the WEI index. A reduction in the WEI average value for the landfill influence area in the Valencia Region (2.84% in a 10-year period) has been observed. This effect has been observed in all the landfill sites currently in operation in the Valencia Community (Spain) without exception in the 2005–2015 period.
Therefore, the application of WEI to these ten landfill locations leads to the following final conclusions:
- WEI is a powerful tool for analyzing land use change over time.
- The application of WEI allows performing detailed statistical analyses leading to key conclusions about land use changes inside the landfill influence areas
- WEI is therefore applicable as a tool to quantify and analyze trends of the environmental quality related to land use change.
- Results show that WEI has decreased in all the landfills in the 2005–2015 period.
- All the landfills are located in locations of high environmental value (WEI average value was over 70 during the whole period of analysis.
- The majority of the land use changes happened between 2009 and 2015. More than 8% of the area of WEI class [70,80[ and more than 4% of the area of WEI class [80,90[ were lost, and these areas are now occupied by a land use of lower value (almost 10% of the lost area is now included in WEI class [60,70[).
Once this work has been concluded, future research will be focused on performing a sensitivity analysis on the parameters (assigned weights to factor i) to analyze the robustness of the results found.
Supplementary Materials
The following supporting information can be downloaded at: https://www.mdpi.com/article/10.3390/rs14215502/s1, Table S1: Basic values of the evaluation factors (Fi) for every land use considered by the SIOSE and final value of the Weighted Environmental Index for a single-use polygon (WEIk); Figure S1: LCM evolution and WEI evolution over time for every landfill.
Author Contributions
Conceptualization, J.R.-I. and C.P.R.; methodology, J.R.-I., C.P.R., and M.-E.R.-C.; formal analysis, J.R.-I.; investigation, J.R.-I., C.P.R., and P.S.-R.; resources, J.R.-I. and M.-E.R.-C.; data curation, M.-E.R.-C. and P.S.-R.; writing—original draft preparation, J.R.-I.; writing—review and editing, J.R.-I., C.P.R., and M.-E.R.-C.; supervision, J.R.-I. All authors have read and agreed to the published version of the manuscript.
Funding
This research received no external funding.
Data Availability Statement
Data used on this study have been obtained from the Spanish Land Occupation Information System (SIOSE) public database which can be downloaded from the download center of the National Geographic Information Center (CDIGN) (https://centrodedescargas.cnig.es/CentroDescargas/index.jsp, accessed on 1 August 2022).
Conflicts of Interest
The authors declare no conflict of interest.
References
- Castanho, R.A.; Gómez, J.M.N.; Kurowska-Pysz, J. Assessing land use changes in Polish Territories: Patterns, directions and socioeconomic impacts on territorial management. Sustainability 2019, 11, 1354. [Google Scholar] [CrossRef]
- Ansari, A.; Golabi, M.H. Prediction of spatial land use changes based on LCM in a GIS environment for Desert Wetlands—A case study: Meighan Wetland, Iran. Int. Soil Water Conserv. Res. 2019, 7, 64–70. [Google Scholar] [CrossRef]
- Leta, M.K.; Demissie, T.A.; Tränckner, J. Modeling and prediction of land use land cover change dynamics based on land change modeler (Lcm) in nashe watershed, upper blue nile basin, Ethiopia. Sustainability 2021, 13, 3740. [Google Scholar] [CrossRef]
- Sauve, G.; Van Acker, K. The environmental impacts of municipal solid waste landfills in Europe: A life cycle assessment of proper reference cases to support decision making. J. Environ. Manag. 2020, 261, 110216. [Google Scholar] [CrossRef] [PubMed]
- Anand, N.; Palani, S.G. A comprehensive investigation of toxicity and pollution potential of municipal solid waste landfill leachate. Sci. Total Environ. 2022, 838, 155891. [Google Scholar] [CrossRef]
- Ren, Y.; Zhang, Z.; Huang, M. A review on settlement models of municipal solid waste landfills. Waste Manag. 2022, 149, 79–95. [Google Scholar] [CrossRef]
- Koda, E.; Winkler, J.; Wowkonowicz, P.; Cerny, M.; Kiersnowska, A.; Pasternak, G.; Vaverková, M.D. Vegetation changes as indicators of landfill leachate seepage locations: Case study. Ecol. Eng. 2022, 174, 106448. [Google Scholar] [CrossRef]
- Calvo, F.; Moreno, B.; Ramos, A.; Zamorano, M. Implementation of a new environmental impact assessment for municipal waste landfills as tool for planning and decision-making process. Renew. Sustain. Energy Rev. 2007, 11, 98–115. [Google Scholar] [CrossRef]
- Yang, N.; Damgaard, A.; Lü, F.; Saho, L.M.; Brogaard, L.K.; He, P.J. Environmental impact assessment on the construction and operation of municipal solid waste sanitary landfills in developing countries: China case study. Waste Manag. 2014, 34, 929–937. [Google Scholar] [CrossRef]
- Ma, J.; Li, Y.; Li, Y. Effects of leachate recirculation quantity and aeration on leachate quality and municipal solid waste stabilization in semi-aerobic landfills. Environ. Technol. Innov. 2021, 21, 101353. [Google Scholar] [CrossRef]
- Kebede, Y.; Alene, M.M.; Endalemaw, N.T. Urban landfill investigation for managing the negative impact of solid waste on environment using geospatial technique. A case study of Assosa town, Ethiopia. Environ. Chall. 2021, 4, 100103. [Google Scholar] [CrossRef]
- Mohammad, A.; Singh, D.N.; Podlasek, A.; Osinki, P.; Koda, E. Leachate characteristics: Potential indicators for monitoring various phases of municipal solid waste decomposition in a bioreactor landfill. J. Environ. Manag. 2022, 309, 114683. [Google Scholar] [CrossRef] [PubMed]
- Wdowczyk, A.; Szymanska-Pulikowska, A. Analysis of the possibility of conducting a comprehensive assessment of landfill leachate contamination using physicochemical indicators and toxicity test. Ecotoxicol. Environ. Safe 2021, 221, 112434. [Google Scholar] [CrossRef]
- Shu, S.; Zhu, W.; Xu, H.; Wang, S.; Fan, X.; Wu, S.; Shi, J.; Song, J. Effect of the leachate head on the key pollutant indicator in a municipal solid waste landfill barrier system. J. Environ. Manag. 2019, 239, 262–270. [Google Scholar] [CrossRef] [PubMed]
- Ruoso, A.C.; Nora, M.D.; MairesseSiluk, J.C.; Duarte Ribeiro, J.L. The impact of landfill operation factors on improving biogas generation in Brazil. Renew. Sustain. Energy Rev. 2022, 154, 111868. [Google Scholar] [CrossRef]
- Curiel-Esparza, J.; Reyes-Medina, M.; Martín-Utrillas, M.; Martínez-García, M.P.; Cantó-Perelló, J. Collaborative elicitation to select a sustainable biogas desulfurization technique for landfills. J. Clean. Prod. 2019, 212, 1334–1344. [Google Scholar] [CrossRef]
- Mambeli Barros, R.; Tiago Filho, G.L.; da Silva, T.R. The electric energy potential of landfill biogas in Brazil. Energ. Policy 2014, 65, 150–164. [Google Scholar] [CrossRef]
- Nelson, A.C.; Genereux, J.; Genereux, M.M. Price Effects of Landfills on Different House Value Strata. J. Urban Plan. Dev. 1997, 123, 59–67. [Google Scholar] [CrossRef]
- Tey, J.S.; Goh, K.C.; Ang, P.S.E. Sustainable Impact of Landfill Siting towards Urban Planning in Malaysia. IOP Conf. Ser. Mater. Sci. Eng. 2015, 245, 052052. [Google Scholar] [CrossRef]
- Ready, R.C. Do Landfills Always Depress Nearby Property Values? J. Real Estate Res. 2010, 32, 321–340. [Google Scholar] [CrossRef]
- Gamble, H.B.; Downing, R.H.; Shortle, J.S.; Epp, D.J. Effects of Solid Waste Disposal Sites on Community Development and Residential Property Values. In Final Report for The Bureau of Solid Waste Management; Department of Environmental Resources, Commonwealth of Pennsylvania: Harrisburg, PA, USA, 1982. [Google Scholar]
- Bouvier, R.A.; Halstead, J.M.; Conway, K.S.; Manalo, A.B. The Effect of Landfills on Rural Residential Property Values: Some Empirical Analysis. J. Rel. Anal. Policy 2000, 30, 23–37. [Google Scholar] [CrossRef]
- Zeiss, C.; Atwater, J. Waste facility impacts on residential property values. J. Urban Plan. Dev. 1989, 115, 64–80. [Google Scholar] [CrossRef]
- Kotovicová, J.; Toman, F.; Vaverková, M.D.; Stejskal, B. Evaluation of waste landfills impact on the environmentwith the use of bioindicators. Pol. J. Environ. Stud. 2011, 20, 371–377. [Google Scholar]
- Vaverkovà, M.D.; Toman, F.; Adamcová, D.; Kotovicová, J. Verifying Research of Waste Landfill Environmental Impact Using Bioindicators. Pol. J. Environ. Stud. 2013, 22, 313–317. [Google Scholar]
- Eskandari, M.; Homaee, M.; Mahmoodi, S.; Pazira, E.; Van Genuchten, M.T. Optimizing landfill site selection by using land classification maps. Environ. Sci. Pollut. Res. 2015, 22, 7754–7765. [Google Scholar] [CrossRef] [PubMed]
- Rezaeisabzevar, Y.; Bazargan, A.; Zohourian, B. Landfill site selection using multi criteria decision making: Influential factors for comparing locations. J. Environ. Sci. 2020, 93, 170–184. [Google Scholar] [CrossRef]
- Eghtesadifard, M.; Afkhami, P.; Bazyar, A. An integrated approach to the selection of municipal solid waste landfills through GIS, K-Means and multi-criteria decision analysis. Environ. Res. 2020, 185, 109348. [Google Scholar] [CrossRef]
- Demesouka, O.E.; Anagnostopoulos, K.P.; Eleftherios, S. Spatial multicriteria decision support for robust land-use suitability: The case of landfill site selection in Northeastern Greece. Eur. J. Oper. Res. 2019, 272, 574–586. [Google Scholar] [CrossRef]
- De Feo, G.; De Gisi, S. Using MCDA and GIS for hazardous waste landfill siting considering land scarcity for waste disposal. Waste Manag. 2014, 34, 2225–2238. [Google Scholar] [CrossRef]
- Chabok, M.; Asakereh, A.; Bahrami, H.; Jaafarzadeh, N.O. Selection of MSW landfill site by fuzzy-AHP approach combined with GIS: Case study in Ahvaz, Iran. Environ. Monit. Assess. 2020, 192, 433. [Google Scholar] [CrossRef]
- Dolui, S.; Sarkar, S. Identifying potential landfill sites using multicriteria evaluation modeling and GIS techniques for Kharagpur city of West Bengal, India. Environ. Chall. 2021, 5, 100243. [Google Scholar] [CrossRef]
- Majid, M.; Mir, B.A. Landfill site selection using GIS based multi criteria evaluation technique. A case study of Srinagar city, India. Environ. Chall. 2021, 3, 100031. [Google Scholar] [CrossRef]
- Innocenti, F.; Robinson, R.; Gardiner, T.; Finlayson, A.; Connor, A. Differential Absorption Lidar (DIAL) Measurements of Landfill Methane Emissions. Remote Sens. 2017, 9, 953. [Google Scholar] [CrossRef]
- Torres, R.N.; Frternali, P. Learning to Identify Illegal Landfills through Scene Classification in Aerial Images. Remote Sens. 2021, 13, 4520. [Google Scholar] [CrossRef]
- Sliusar, N.; Filkin, T.; Humer-Humer, M.; Ritzkowski, M. Drone technology in municipal solid waste management and landfilling: A comprehensive review. Waste Manag. 2022, 139, 1–16. [Google Scholar] [CrossRef]
- Zamorano, M.; Molero, E.; Hurtado, A.; Grindlay, A.; Ramos, A. Evaluation of a municipal landfill site in Southern Spain with GIS-aided methodology. J. Hazard. Mater. 2008, 160, 473–481. [Google Scholar] [CrossRef]
- Mitri, G.; Nasrallah, G.; Gebrael, K.; Nassar, M.B.; Abou Dagher, M.; Nader, M.; Masri, N.; Choueiter, D. Assessing land degradation and identifying potential sustainable land management practices at the subnational level in Lebanon. Environ. Monit. Assess. 2019, 191, 1–22. [Google Scholar] [CrossRef]
- Feng, S.; Zhao, W.; Zhan, T.; Yan, Y.; Pereira, P. Land degradation neutrality: A review of progress and perspectives. Ecol. Indic. 2022, 144, 109530. [Google Scholar] [CrossRef]
- Benini, L.; Bandini, V.; Marazza, D.; Contin, A. Assessment of land use changes through an indicator-based approach: A case study from the Lamone river basin in Northern Italy. Ecol. Indic. 2010, 10, 4–14. [Google Scholar] [CrossRef]
- López, S.; López-Sandoval, M.F.; Gerique, A.; Salazar, J. Landscape change in Southern Ecuador: An indicator-based and multi-temporal evaluation of land use and land cover in a mixed-use protected area. Ecol. Indic. 2020, 115, 106357. [Google Scholar] [CrossRef]
- Bicudo da Silva, R.F.; Millington, J.D.A.; Moran, E.F.; Batistella, M.; Liu, J. Three decades of land-use and land-cover change in mountain regions of the Brazilian Atlantic Forest. Landsc. Urban Plan. 2020, 204, 103948. [Google Scholar] [CrossRef]
- Teucher, M.; Schmitt, C.B.; Wiese, A.; Apfelbeck, B.; Maghenda, M.; Pellikka, P.; Lens, L.; Habel, J.C. Behind the fog: Forest degradation despite logging bans in an East African cloud forest. Glob. Ecol. Conserv. 2020, 22, e01024. [Google Scholar] [CrossRef]
- Rawat, J.S.; Kumar, M. Monitoring land use/cover change using remote sensing and GIS techniques: A case study of Hawalbagh block, district Almora, Uttarakhand, India. Egypt. J. Remote Sens. Sp. Sci. 2015, 18, 77–84. [Google Scholar] [CrossRef]
- Rodrigo-Ilarri, J.; Romero-Hernández, C.P.; Rodrigo-Clavero, M.E. Land Use/Land Cover Assessment over Time Using a New Weighted Environmental Index (WEI) Based on an Object-Oriented Model and GIS Data. Sustainability 2020, 12, 10234. [Google Scholar] [CrossRef]
- European Comission. Corine Land Cover: Technical Guide; Directorate-General for Environment, Directorate-General for the Information Society and Media, Publications Office: Brussels, Belgium, 1994. [Google Scholar]
- Fernández Noguerol, S. Desarrollo de herramientas para el tratamiento de la información y el análisis con SIG de los usos del suelo utilizando el SIOSE. Una aproximación al caso de Asturias. GeoFocus Rev. Int. Cienc. Y Tecnol. La Inf. Geográfica 2017, 20, 233–251. [Google Scholar] [CrossRef][Green Version]
- Vila-García, D.; Gil-Docampo, M.L.; Iniesto-Alba, M.J. Change detection in land use from unsupervised classifications for updating SIOSE. Implementation in Galicia. Rev. Teledetección 2015, 43, 63–75. [Google Scholar] [CrossRef][Green Version]
- IGN. Descripción del modelo de datos SIOSE. 2015. Available online: www.siose.es (accessed on 1 June 2022).
- Carpintero, I.; Granado, L.; Méndez, E.; Montoya, G.; Pino, I.; Prieto, R.; Vales, J.; Giménez de Azcarate, F.; Moreira, J.M. Detección de Cambios en Zonas Forestales Para la Actualización de SIOSE-Andalucía 2005 a 2009 con Imágenes SPOT-5 (REDIAM); Proceedings of the XIV Congreso de la Asociación Española de Teledetección (AET): Mieres, Spain, 2011. [Google Scholar]
- Generalitat Valenciana. Plan Integral de Residuos de la Comunidad Valenciana, 2013. In DECRETO 81/2013, de 21 de Junio, del Consell, de Aprobación Definitiva del Plan Integral de Residuos de la Comunitat Valenciana (PIRCV); Generalitat Valenciana: Catalonia, Spain, 2013. [Google Scholar]


Publisher’s Note: MDPI stays neutral with regard to jurisdictional claims in published maps and institutional affiliations. |
© 2022 by the authors. Licensee MDPI, Basel, Switzerland. This article is an open access article distributed under the terms and conditions of the Creative Commons Attribution (CC BY) license (https://creativecommons.org/licenses/by/4.0/).