Article

High-Resolution Drone Images Show That the Distribution of Mussels Depends on Microhabitat Features of Intertidal Rocky Shores

1
IRD, Ifremer, University of Brest, CNRS, LEMAR, 29280 Plouzané, France
2
European Institute for Marine Studies (IUEM)—UAR 3113, University of Brest, CNRS, IRD, IUEM, Rue Dumont d’Urville, 29280 Plouzané, France
3
UMR Geo-Ocean 6538, University of Brest, CNRS, Ifremer, IUEM, Rue Dumont d’Urville, 29280 Plouzané, France
4
Ifremer, DYNECO, 29280 Plouzané, France
*
Author to whom correspondence should be addressed.
Remote Sens. 2022, 14(21), 5441; https://doi.org/10.3390/rs14215441
Submission received: 26 August 2022 / Revised: 19 October 2022 / Accepted: 21 October 2022 / Published: 29 October 2022
(This article belongs to the Special Issue Remote Sensing Applied to Marine Species Distribution)

Abstract

:
In this study, we used orthomosaics and a digital surface model (DSM) generated from drone surveys to (1) characterize the distribution of mussel (Mytilus galloprovincialis) aggregations at high resolution (centimeters), and (2) evaluate the role of topographic features, intertidal height, slope, and orientation angle in determining mussel distribution on two rocky shores oriented differently on both sides of a beach on the French Brittany coast. We first developed and tested a mussel visualization index (MVI) for mapping mussel aggregations from drone images. Then, we analyzed mussel distribution on the two shores. The results showed a contrasted total mussel-occupied area between the two rocky shores, with a higher occupation rate and a clear pattern of distribution depending on topographic features on the rocky shore oriented to the west. Intertidal height, and its associated immersion time, was the main factor determining mussel distribution. An optimum intertidal height was found in the center of the distribution height range, at c.a. 4.5 m above the lowest astronomical tide (LAT), where individuals are under immersion phase on average 43% of the time. Within this optimum, the occupation rate of the mussels was significantly higher in microhabitats facing south and west, particularly at intermediate slope angles. These results demonstrate the role of microhabitat topographic features on the development of intertidal mussels and their final distribution. Furthermore, the results highlight the importance of mesoscale structures of habitats (e.g., 100 m), which seem to be responsible for the differences we observed between the two shores. Our methodological approach highlights the main advantage of using high-resolution drone images to address ecological processes in intertidal ecosystems. Indeed, drone imagery offers the possibility to assess small-scale interactions between individuals and habitat conditions over a wide area, which is technically infeasible from fieldwork approaches or by using satellite remote sensing due to their lower resolution. Scale integration and methodological complementarity are powerful approaches to correctly represent the processes governing the ecology of intertidal ecosystems. We suggest using this methodology to monitor long-term changes of sentinel sessile species.

Graphical Abstract

1. Introduction

Intertidal rocky shores generally have complex three-dimensional (3D) structures, which create heterogeneous microhabitat conditions. This heterogeneity directly regulates local drivers which affect the distribution of species. For instance, stressing conditions such as waves [1,2], wind, solar radiation, and temperature [3,4,5] are linked to the topography in intertidal areas. Mapping species distribution and characterizing the topographic structure is, thus, fundamental for addressing the relationship between habitat conditions and species presence within a site. To this end, mussels are target species that serve as a sentinel for monitoring environmental changes due to their wide distribution, sensitivity to environmental factors, and sessile condition [6,7]. Mussel species dominate the mid-intertidal zone by forming individual aggregations and creating mussel beds. They experience the combined stressing conditions of intertidal environments, although we still do not completely understand how the within-site heterogeneity of microhabitat conditions affects their distribution. The present study aims to improve the understanding of the effect of the high-resolution topographic structure on the distribution of an intertidal mussel species, Mytilus galloprovincialis. We studied the distribution of intertidal mussels in rocky shore habitats of a macrotidal temperate area in French Brittany.
The distribution of bivalve populations has been assessed using airplane images or satellite images, but most of these studies focused on tidal flat environments and targeted the changes at resolutions larger than ~0.5 m [8,9]. This resolution allows monitoring of wide surfaces but limits the analysis of aggregations of small individuals and habitat complexity, such as the ones observed on many rocky shores. The use of unmanned aerial vehicles (UAVs), such as drones that can acquire aerial images associated with algorithms of structure from motion (SfM), allows the creation of bidimensional representations (orthomosaic) for species identification and 3D digital surface models (DSM) that, in absence of canopy species, represent the topographic structure [10].
SfM algorithms provide the 3D structure of a given surface, allowing multiple applications, such as the calculation of terrain attributes for characterizing the topographic structure and measures of surface complexity (e.g., roughness, fractal dimension) [11]. Such characterization is important for understanding the relationship between environmental conditions, species distribution, and dynamics. For example, high-resolution topographic heterogeneity determined from SfM has been shown to influence the development of intertidal species such as Sabellaria alveolata [12]. However, studies associating intertidal species distribution with the high-resolution substrate structure, i.e., the microhabitat, are scarce (e.g., [12,13,14,15]). With respect to benthic habitat mapping, several studies showed the advantages of and recommended using images rather than field qualitative observations for habitat characterization (e.g., [11,12,13]). However, few studies described intertidal rocky shore environments at high resolution (<1 m) (e.g. [11,16,17]). For instance, Gomes et al. [16] used drone images and mapped the distribution of mussels in diverse sites. They related the size of individuals and the population density with the substrate rugosity (measured as terrain roughness index, TRI) and wave intensity. They observed an increase in the size of individuals with increasing TRI (calculated in a 20 cm2 area around each central cell of 1 cm resolution) [16]. Considering the need for high-resolution information to properly describe species habitat, the use of drone images appears as a relevant tool to allow the study of ecological questions that cannot be addressed using other image sources, such as satellites [10,18].
Particularly, terrain slope and orientation attributes are highly determinant of species presence and patterns of biodiversity distribution in terrestrial ecosystems due to their relationship with sun exposure and ground temperature and humidity (e.g., [19,20,21,22]). Similarly, the slope and orientation of the rocky-shore substrate affect microhabitat temperatures during the emersion phase at low tides [3,23] and the exposure to physical constraints through water dynamics [1,4,24]. Intertidal microhabitat conditions are, thus, spatially and temporally highly variable, offering contrasted living conditions for benthic species. Such conditions may influence the development and abundance of mussel recruits and adults [25,26], mortality from thermal stress [27], or mussel dislodgement by waves [24,28]. Linking the topographic complexity of microhabitats (i.e., slope and orientation) and the distribution of intertidal sessile benthic species provides an opportunity to better understand how environmental heterogeneity determines species distribution.
In this study, we used orthomosaics and digital surface models (DSM) generated from drone surveys to (1) characterize the distribution of mussel aggregations at high resolution (centimeters) on two rocky shores occupying 100 s meters of spatial extent, and (2) evaluate the role of topographic microhabitat features, intertidal height, slope, and orientation angle in determining mussel distribution on two adjacent rocky shores oriented differently on both sides of a beach in the French Brittany coast. The studied rocky shores were dominated by M. galloprovincialis individuals [29], although the region is known to present hybrid individuals [30].

2. Methods

2.1. Study Site

The study site was in Le Petit Minou beach (coordinates 48.34°N, −4.62°E), located in Northwestern France, on the west coast of Brittany (Figure 1A). Le Petit Minou site presents two rocky shores on both sides of a beach (Figure 1B) and constitutes a sheltered macrotidal area, with a tidal range of approximately 6 m (ca. 1.2–7.3 m height). Mussel aggregations from Le Petit Minou form dense monolayers, such that adults create shade on smaller individuals, but all are fixed to the substrate, creating a single layer [31].

2.2. Drone Survey and SfM Photogrammetry Processing

To obtain the distribution of mussels and the topography of Le Petit Minou site at high resolution, a drone survey was performed in June 2019. The survey was performed on the west and east shores, separately, with a DJI® Phantom 4 pro (DJI Sciences and Technologies Ltd., Shenzhen, China) with autonomous flight mode during low tide (Figure 1B). Drone images were taken at ~30 m of altitude with a 1″ CMOS camera (DJI Sciences and Technologies Ltd., Shenzhen, China) with a fixed focal length of 8.8 mm (35 mm equivalent: 24 mm), taking 8-megapixel resolution photos (which corresponded to a ground resolution of ca. 5 mm/pixel) in intervalometer mode every 2 s. The flight speed was adapted to obtain an 80% overlap between consecutive images to optimize tie points’ detection during further SfM processing. The total number of processed images was ca. 240 for the west and ca. 260 for the east shore.
Additionally, multiple ground control points (GCPs), marked by red discs, were distributed on the study area and geolocated with centimeter precision using a real-time kinematic (RTK) GPS to limit possible distortions in the DSM reconstruction, such as the “bowl effect”, that are common in linear surveys [32].
The drone images and GCPs were used to provide a digital surface model (DSM) and an orthomosaic from drone image analyses with the SfM photogrammetry method [33], using Agisoft PhotoScan v.1.4.0 software (Agisoft LLC, St. Petersburg, Russia). The complete process implemented in PhotoScan included the following steps:
  • Detection of distinct features (key points, limited to 40,000) on the images and detection and matching of tie points (homologous key points on overlapping photographs, limited to 4000) to perform image alignment by bundle adjustment and to generate a sparse point cloud. The “High” accuracy parameter was selected so that the software used original size photos to obtain a more accurate estimation of camera exterior orientation.
  • Manual pointing of GCP position in the images (with their GPS position downloaded beforehand) to georeference the scene and to refine the camera calibration to exterior parameters (position, orientation).
  • Generation of a dense point cloud by dense image matching, based on the previously estimated camera external and internal parameters. The quality is set to “High” to obtain a more detailed and accurate reconstruction.
  • Construction of a 3D polygonal mesh.
  • DSM computation by interpolation of the irregular polygonal mesh into a regular XY grid. This DSM is a “2.5D” reconstruction.
  • Generation of the orthomosaic (a mosaic of geometrically corrected aerial photographs).
The final cell resolution of the DSMs was 1 × 1 cm, but it was decreased to 20 × 20 cm before deriving terrain attributes to facilitate processing and avoid very local roughness effects when evaluating the effect of topographic features. To restrict the mapped area to the rocky-shore area, we created a hand-delineated polygon excluding sand areas and used it to mask the DSM in QGIS software. We combined the mask polygon with the intertidal range defined by the tidal dynamics from 0 to 8 m above the Lowest Astronomical Tide (LAT). The masked total area of both shores was relatively similar, 6284 and 6244 m2 on the west and east shores, respectively.

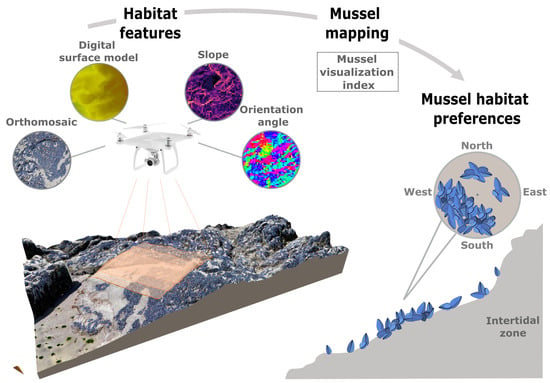
2.3. Microhabitat Features

Slope and orientation (also called aspect) were derived using the terrain function (raster R package [34]) in order to characterize mussel distribution along the study site due to the potential importance of such features in conditioning species distribution. Slope measures the inclination with respect to the horizontal axis, here represented as degrees (°) with respect to the plane or horizontal surface, with 90° indicating the highest inclination (vertical surface). The microhabitat orientation indicates its azimuth, which is the horizontal angle from the northern cardinal direction, with clockwise values between 0 and 360° (e.g., the value of 90° indicates the orientation east). Slope and orientation layers were derived from a DSM with a resolution of 20 × 20 cm (averaged from the original). Different spatial resolutions generally result in a different distribution of terrain attributes in a determined area, with decreasing mean slope at decreasing resolutions, whereas the aspect is less prone to change with decreasing resolutions [35,36]. A preliminary analysis evaluated the distribution of the slope and orientation attributes in the studied shores at different resolutions and showed that a 20 cm resolution provides a representation of a wide range of slopes (see Figure S3). Therefore, the 20 cm resolution was selected based on a compromise between a good representation of the surface structure while avoiding very local roughness effects and computational constraints.
The spatial distribution of the mean daily percentage of immersion time was determined on both rocky shores. This indicates the mean percentage of time in the immersion phase at a specific intertidal height position. The immersion time was calculated based on tidal regime measurements taken over 5 years (from 1 January 2015 to 31 December 2019) in the study area. First, the altitude (z value) of the constructed DSM was corrected to represent the zero altitude at the LAT—the chart datum used for tide predictions and water height measures. Then, a cubic polynomial model of the mean percentage of immersion time (%) in relation to intertidal height (m) was fitted following Barbosa et al. [31].

2.4. Mussel Mapping

An unsupervised classification was performed based on the information of the three color bands, red, green, and blue (RGB), contained in the orthomosaics. To improve the detection of the mussels’ color, we created an index that increases the relative importance of the blue band that characterizes Mytilus spp. mussel shell, since blue was not a prominent color in the background of our area of interest. This index was called the ‘mussel visualization index’ (MVI):
MVI = (B − (R + G)/2) × 100
where B is blue, R is red, and G is green, the three bands (RGB) of each cell in the orthomosaic.
Mussel distribution was assessed following the workflow presented in Figure 2. The classification based on RGB color properties can result in several false positives due to the presence of shadows and other species with similar color properties. In Le Petit Minou, we observed that diverse algae and lichen species show a similar color to mussels. To overcome possible bias in the identification of mussels, we adapted the approach to our specific study case. The procedure consisted of 4 steps, presented in Figure 2.
Firstly, shaded areas were identified based on the DSM slope and orientation structure and solar angle of incidence at the time of the drone survey by applying the hillShade R function (raster package [34]). The solar angle and altitude at the time of the drone survey were obtained from the NOAA solar position calculator (https://gml.noaa.gov/grad/solcalc/azel.html; accessed on 1 March 2021). The resultant shaded areas were used to mask the orthomosaics.
Subsequently, the frequency distribution of cells classified as potential mussel-occupied areas in the orthomosaic was evaluated (Figure S1). Mussel cells were selected by hand for the calibration step to evaluate the lower MVI values they presented and determine a threshold for mussel cell classification. The threshold of MVI values was identified in a supervised way, based on 60 virtual fully occupied quadrat training samples (10 × 10 cm), in the orthomosaics of both rocky shores. Sampled cells were used to characterize the frequency distribution of MVI values and the lower confidence interval of 68% was selected to determine the threshold.
MVI values computed over the entire site and falling above this threshold were considered specific to mussels and used for identifying their distribution in the entire site.
Finally, the main groups of cells with mussel MVI values were observed and separated based on their frequency distribution along the intertidal height (Figure S2). A Gaussian curve was calculated for each group identified using the normalmixEM R function (mixtools package [37]), which “maximizes the conditional expected complete-data log-likelihood at each M-step of the algorithm” [37]. The three groups were distributed in the low-, mid-, and high-intertidal heights, which corresponded to the distribution of algae, mussels, and lichens, respectively. Then, the intertidal height range of mussel cells was differentiated from that of algae and lichens by separating the Gaussians distributions based on their interception using the Intersect2Mixtures R function (AdaptGauss package [38]) (Figure S2). This determined the distribution range of mussels to be between 2.55 and 5.70 m intertidal height. Cells outside this range were considered false positives (false mussel cells) and discarded.
The obtained mussel distribution from the image classification process was validated based on a random sample of cells taken from the entire zones of both the east and west rocky shore. A total of 260 random cells were sampled from both orthomosaics (130 cells × 2 rocky shores). The samples on each shore were divided into a group of 30 and another of 100 cells, corresponding to mussels and non-mussels, respectively. Non-mussel cells were randomly sampled and checked to exclude potential real mussel areas, whereas cells containing mussels were manually sampled to try to represent a wide and representative spatial distribution of the mussels. A manual sampling of pixels was performed instead of field validation quadrants because the resolution of images was high enough to unequivocally differentiate mussels and non-mussels. These samples constituted the reference for evaluating the classification performance using a confusion matrix. The performance of the supervised classification was assessed by the overall accuracy, which is the percentage of cells correctly classified [39], and the Kappa index, which is the overall accuracy corrected for random predictions [40,41]. The Kappa index can take values from −1 to 1, with −1 being equivalent to zero concordance between the supervised classification and the real distribution of mussels, whereas 1 indicates a perfect concordance (true positives and true negatives).

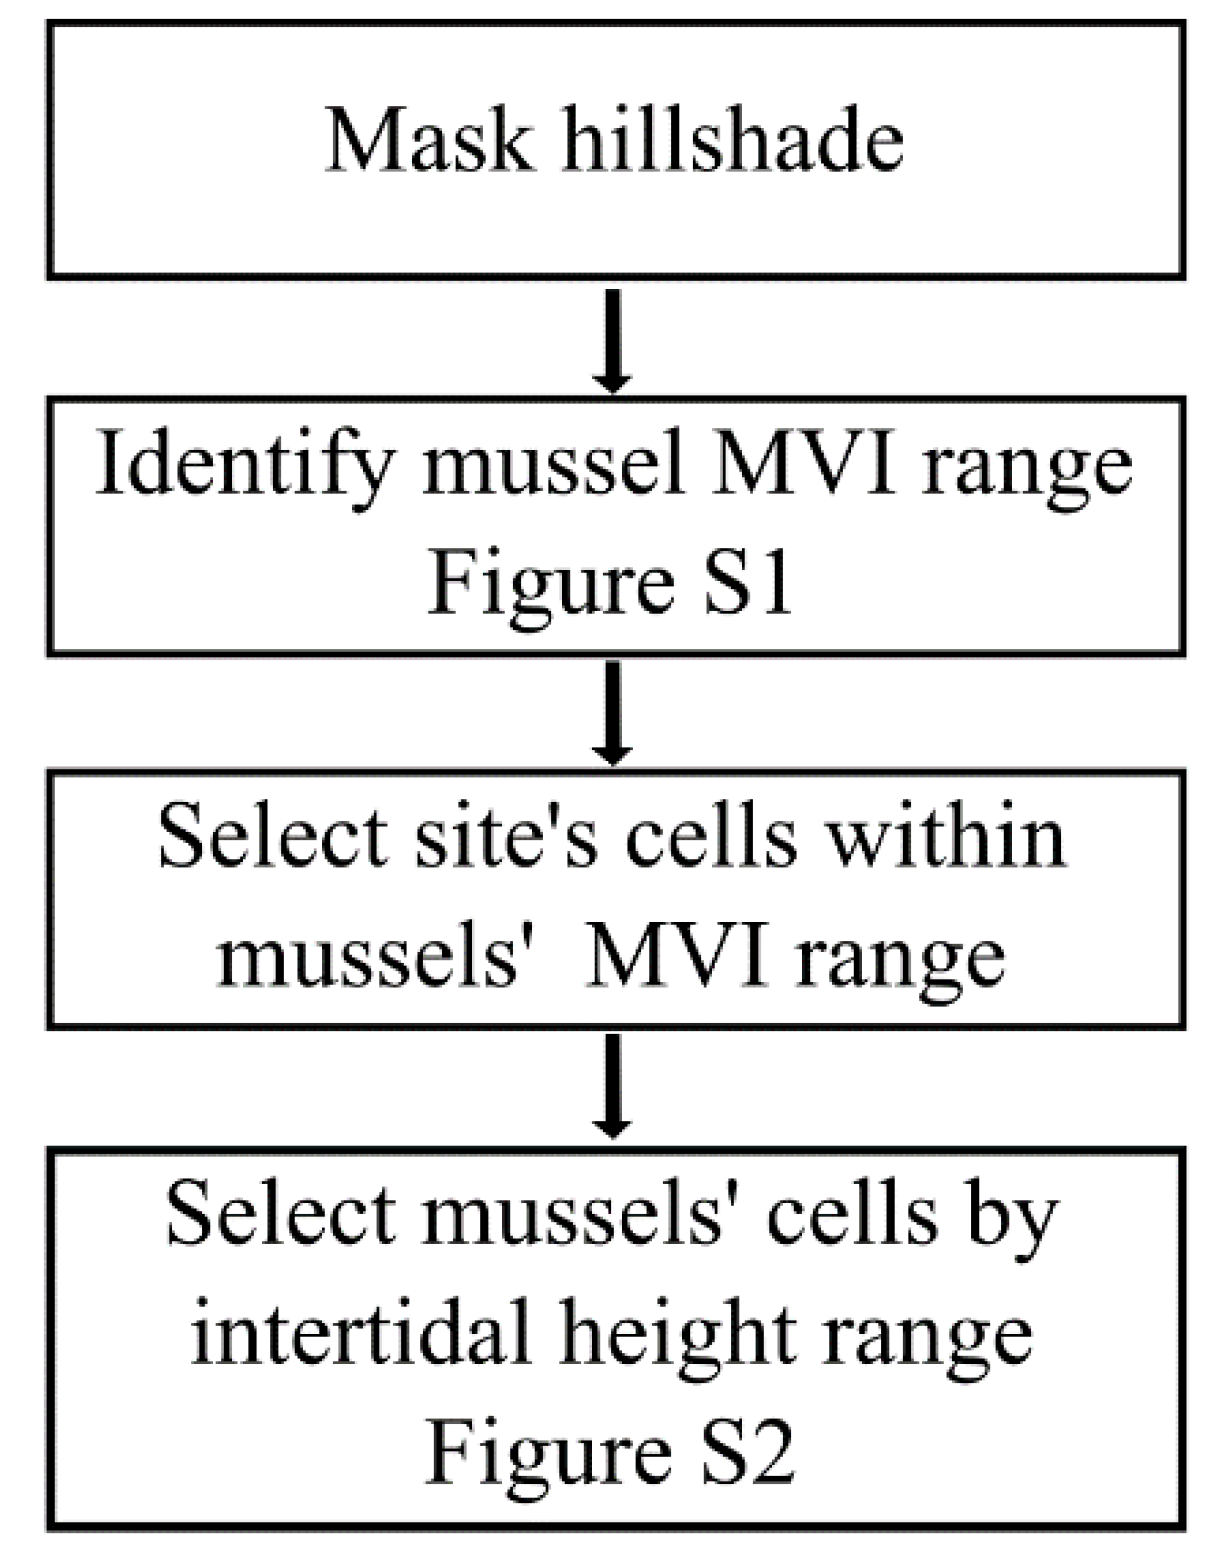
2.5. Mussel Habitat Preferences

To characterize the distribution of mussels along the intertidal height (m above the LAT) and explore its relationship with the slope and orientation conditions, a merged dataset containing these features in each mussel distribution cell was created. To achieve this, we first characterized the area occupied by mussels (1 × 1 cm resolution) (Table S1). The layer of mussel distribution was converted from raster to points (i.e., each cell of mussel distribution corresponded to a point) to extract information for the three terrain attribute layers (slope, orientation, and intertidal height) at each point. The final points layer created was transformed into a table. Rows corresponding to non-mussel cells were excluded to reduce the table size and allow further analyses (Table S1). In parallel, we characterized the available area based on its slope, orientation, and intertidal height using the terrain attribute layers at 20 × 20 cm resolution (Table S2). Both tables were merged by first creating groups based on the combination of the three terrain conditions’ ranges (slope–aspect–intertidal height) and then merging by associating the total mussel-occupied area with specific conditions and the total available area with similar conditions. The slope was classified into 9 ranges, from 0° to 90°, each at 10° intervals. Similarly, the orientation was divided from 0° to 360° at 10° intervals (counterclockwise, with 0° as the north orientation), and the intertidal height was divided from 0 to 8 m above the LAT (the entire intertidal area) and from 3.3 to 5.8 m above the LAT (the intertidal range occupied by mussels, based on our results) at 0.2 m intervals. The whole process of extracting the layers’ information and creating the complete dataset was performed in R [42] using functions contained within the raster package [34].
To identify potential patterns in mussel distribution associated with intertidal topographic features, we calculated the occupation rate as the proportion of occupied area in relation to the available area along each intertidal height range, as well as among diverse slope and orientation range combinations. This analysis allowed us to evaluate whether the mussels demonstrate a preference along the intertidal zone and evaluate if mussel distribution was restricted by the available substrate conditions. Then, to simplify interpretation of the interaction of intertidal height, slope, and orientation, we reclassified the orientation angle to the primary orientation (north, east, south, and west). Primary orientations were implemented as follows: 45° to 135, east; 135° to 225°, south; 225° to 315°, west; 315° to 45°, north. Intertidal height was divided in ranges of 0.2 m. We evaluated the differences in the mean occupation rate between primary orientations, depending on the slope angle at different intertidal height ranges on the west and east shores. All analyses were performed in R [42].

3. Results

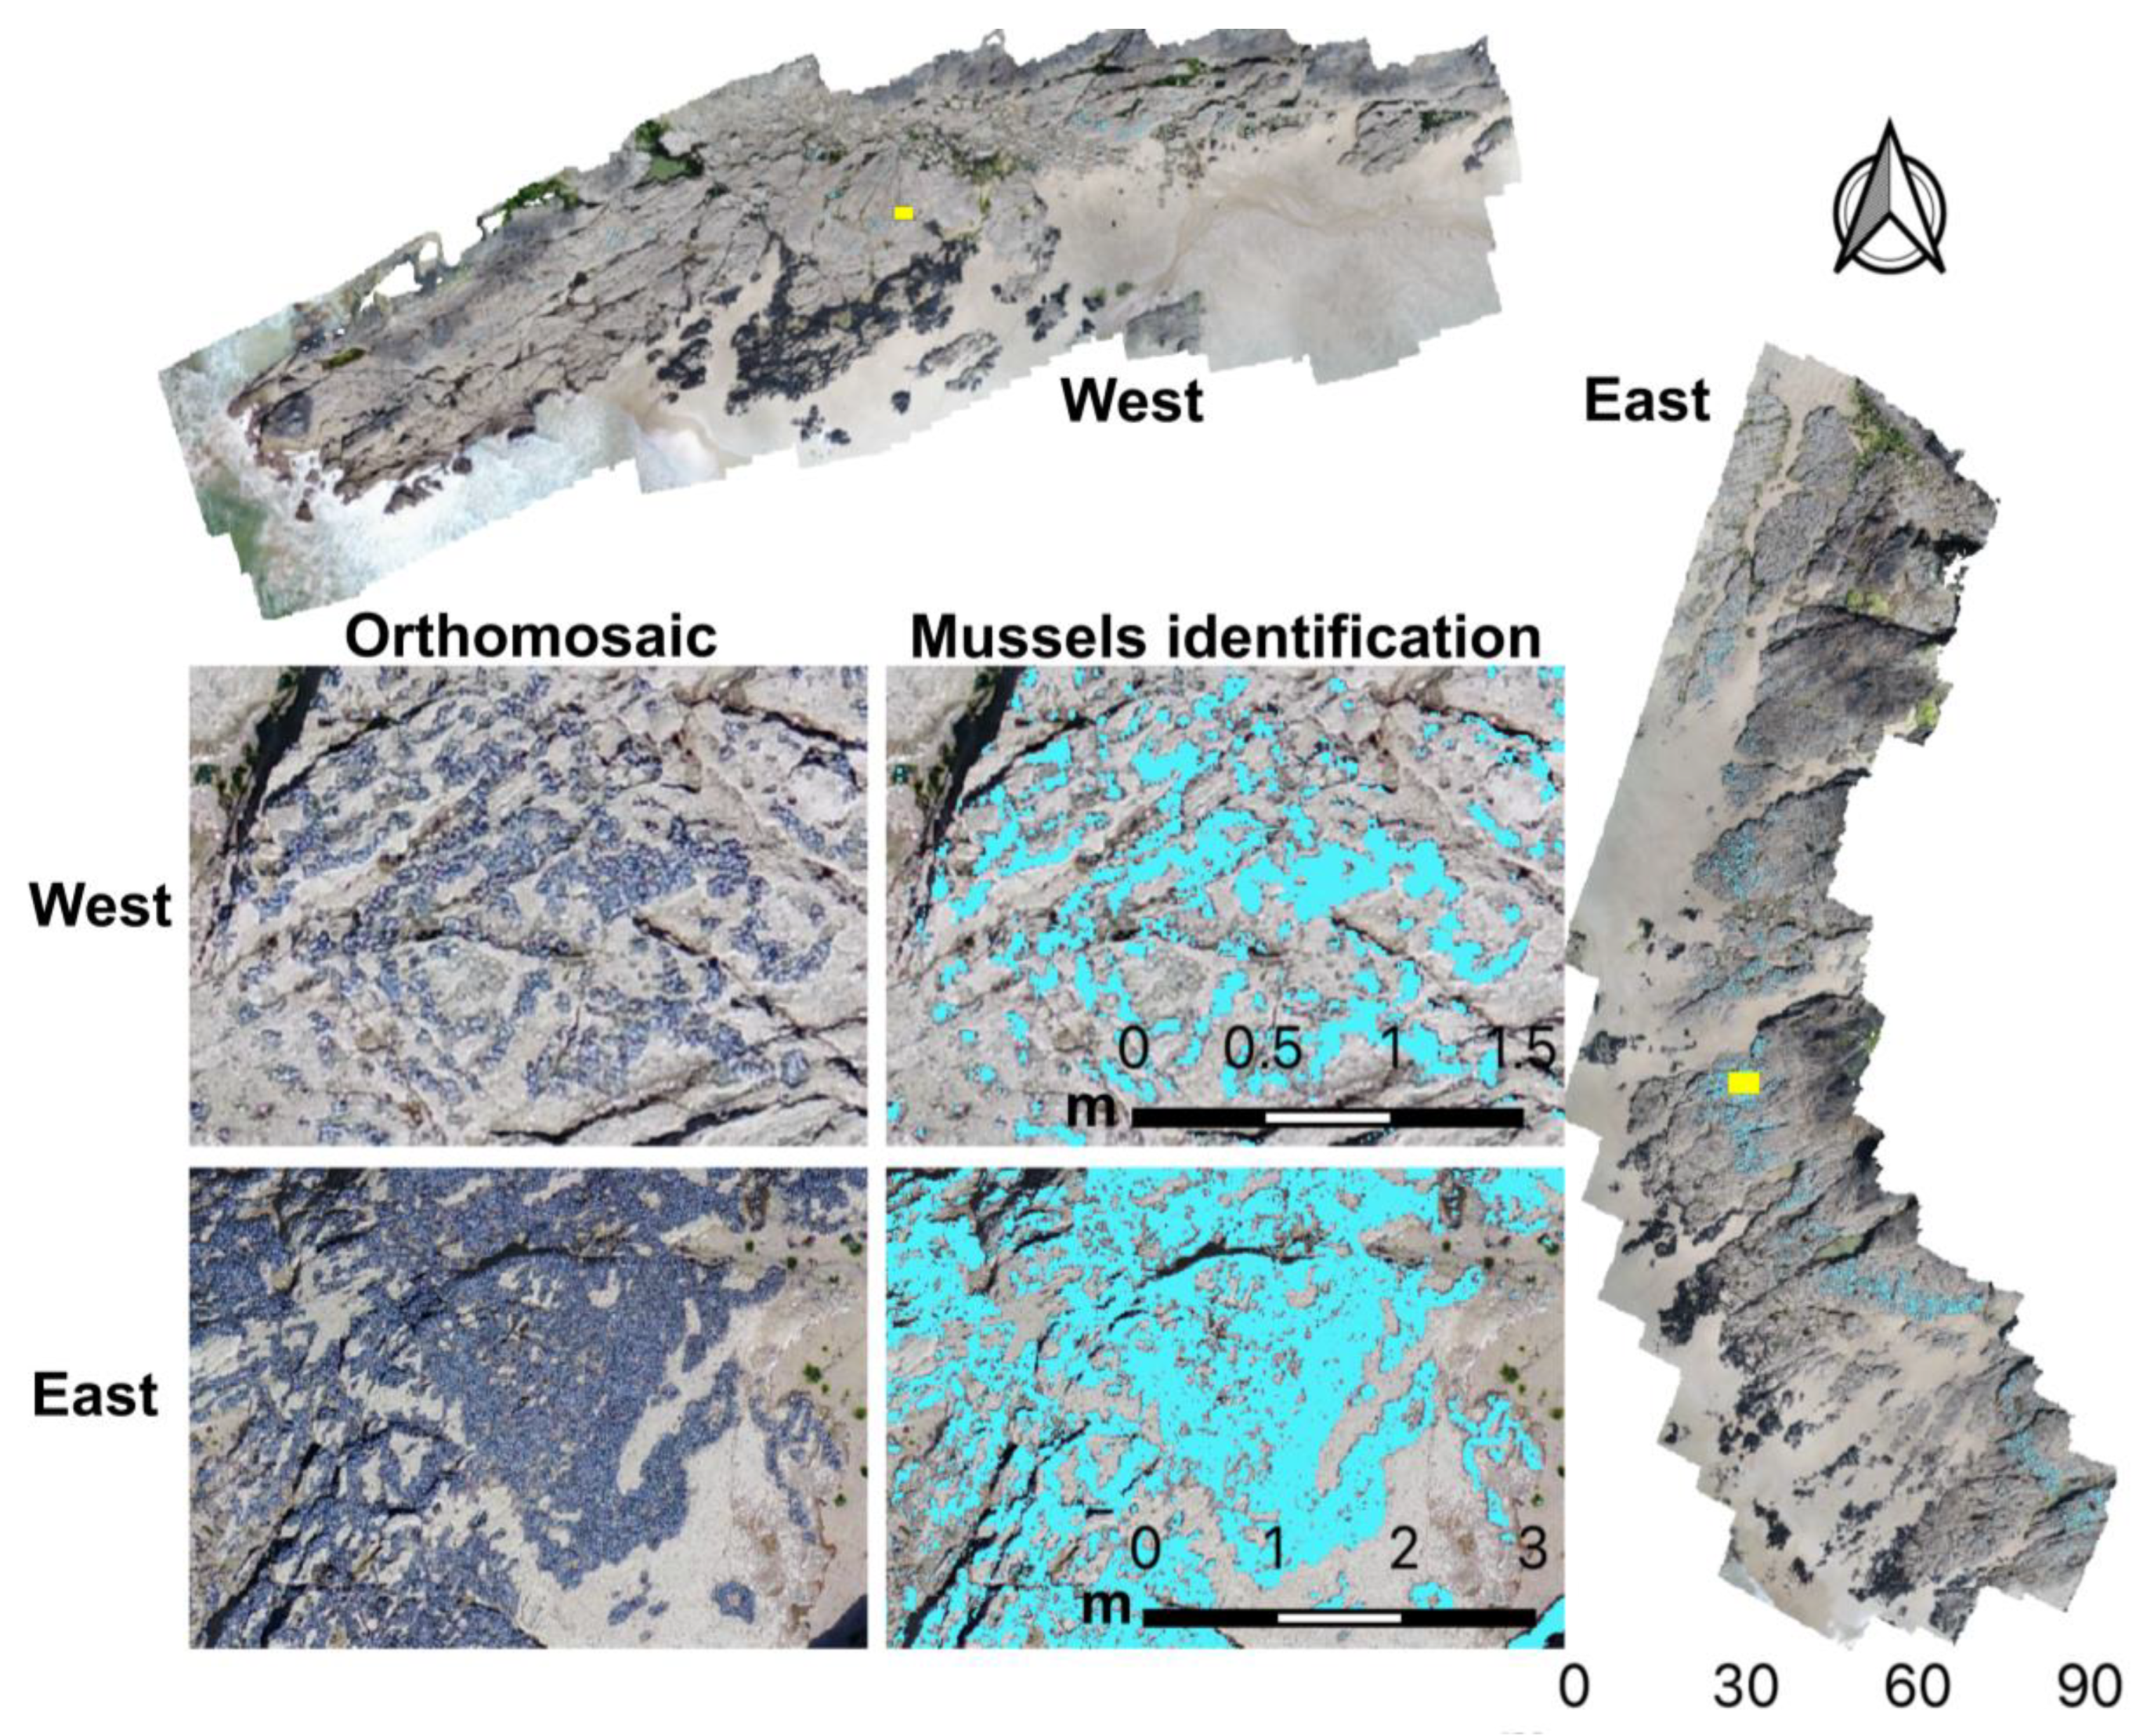
3.1. Microhabitat Features

The available area obtained from the DSMs presented a wide variety of topographic conditions (Figure 3). The distribution of available area along the intertidal height gradient presented a higher proportion of area between a 2 and 5.5 m height on both the west and east shores (Figure 3B). Along the intertidal gradient, there was a particularly higher proportion of microhabitats with low to mid-slope (slope ≤ 40°) in both shores (87.94% and 92.87% in the west and east, respectively; Figure 3C). Additionally, all possible combinations of slope and orientation, except for slopes higher than 80°, were present (considering the available surface area between 0 and 8 m height above the LAT) (Figure 3D). Most of the available microhabitats in the west shore were oriented to the south and southeast, whereas in the east shore microhabitats were mostly oriented to the northwest and southeast (Figure 3D).
Combining slope and orientation angle, the west shore presented a higher proportion of area with microhabitats oriented to the south–southeast and slopes lower than 40° (Figure 4). In contrast, the east shore presented a higher proportion with microhabitats oriented to the northwest and south, with slopes lower than 40° (Figure 4). Furthermore, the occupation rate varied among different conditions of orientation and slope angle, with a more marked slope and orientation effect in the east shore than in the west when considering the intertidal height range of mussels (Figure 4). Such an orientation effect showed a higher occupation rate in areas facing south-to-west in slopes lower than 40° (Figure 4).
Mussels were distributed within an intertidal range of about 2.5 m, between 3.32 and 5.80 m height above the LAT on both shores. M. galloprovincialis individuals in Le Petit Minou occupied a surface area of 58.8 m2 out of 3121 m2, and 281 m2 out of 3499 m2 total available intertidal area within the mussel distribution range (3.32–5.80 m) in the west and east shores, respectively (Figure 5). This represented a mussel occupation rate of 1.8% and 8.0% when considering the area in the intertidal height range demonstrating mussel presence in the west and east shores, respectively, while it represented 0.9% and 4.5% of the total rocky intertidal area in the west and east shores, respectively.
Based on the validation of the developed mussel identification approach, the obtained mussel distribution was shown to be of good quality. Validation results showed a good agreement between the cells identified as mussel-occupied area and the original orthomosaic on both shores (Table 1).

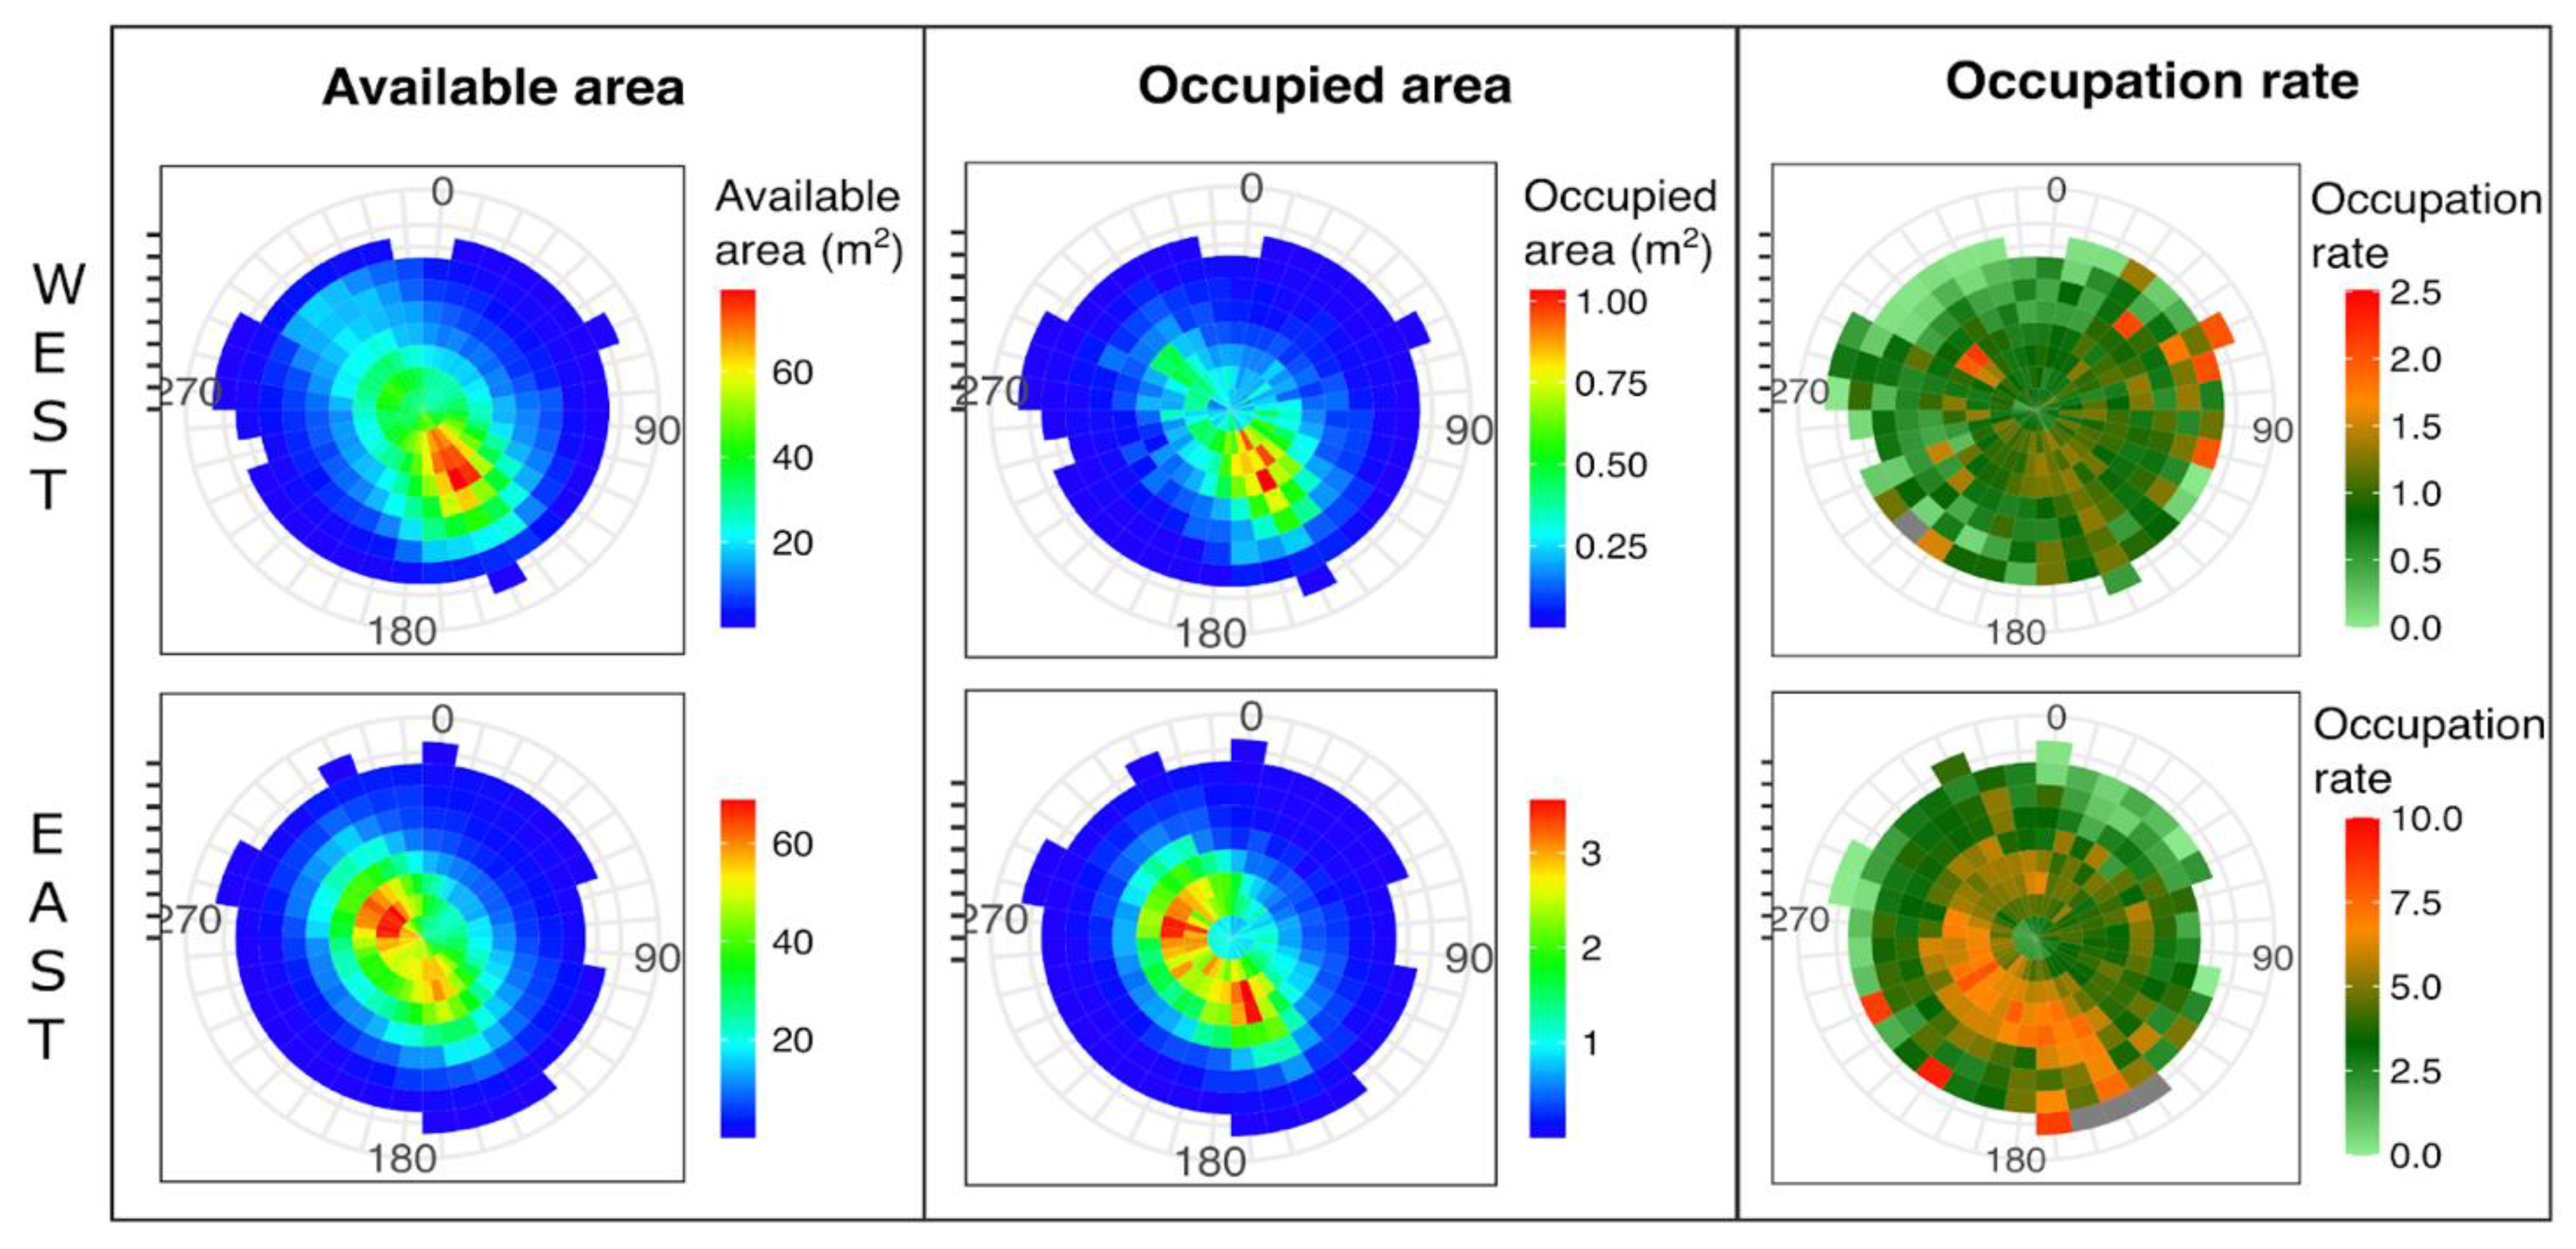
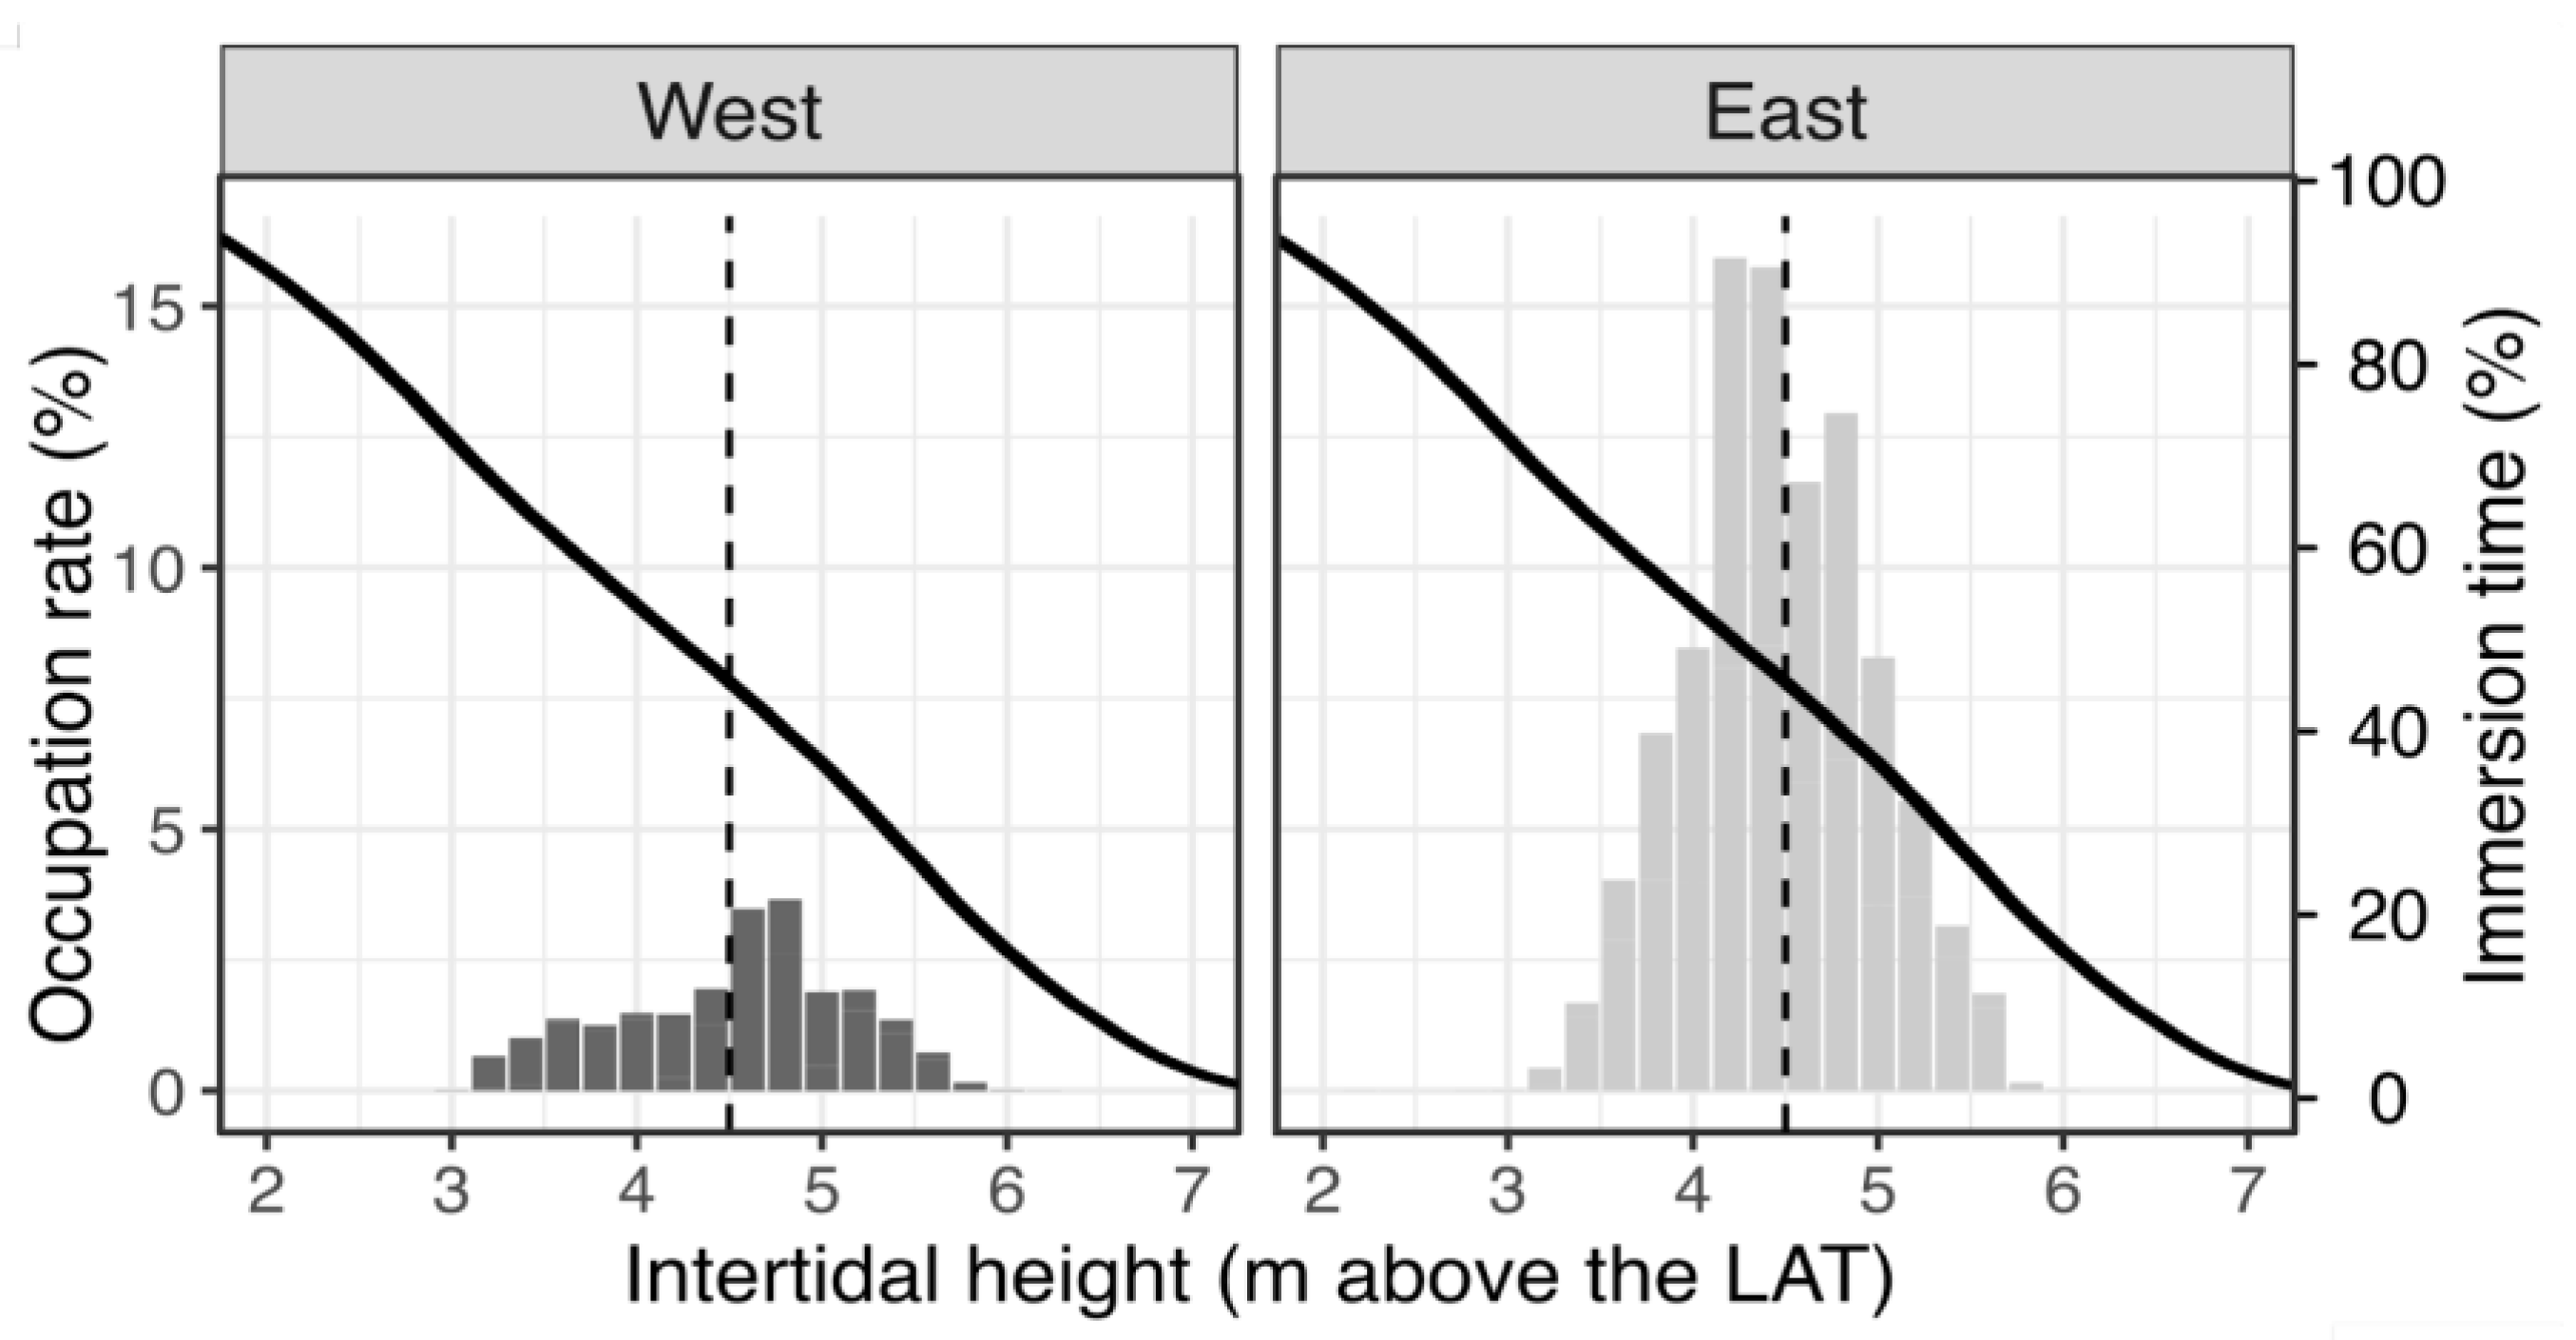
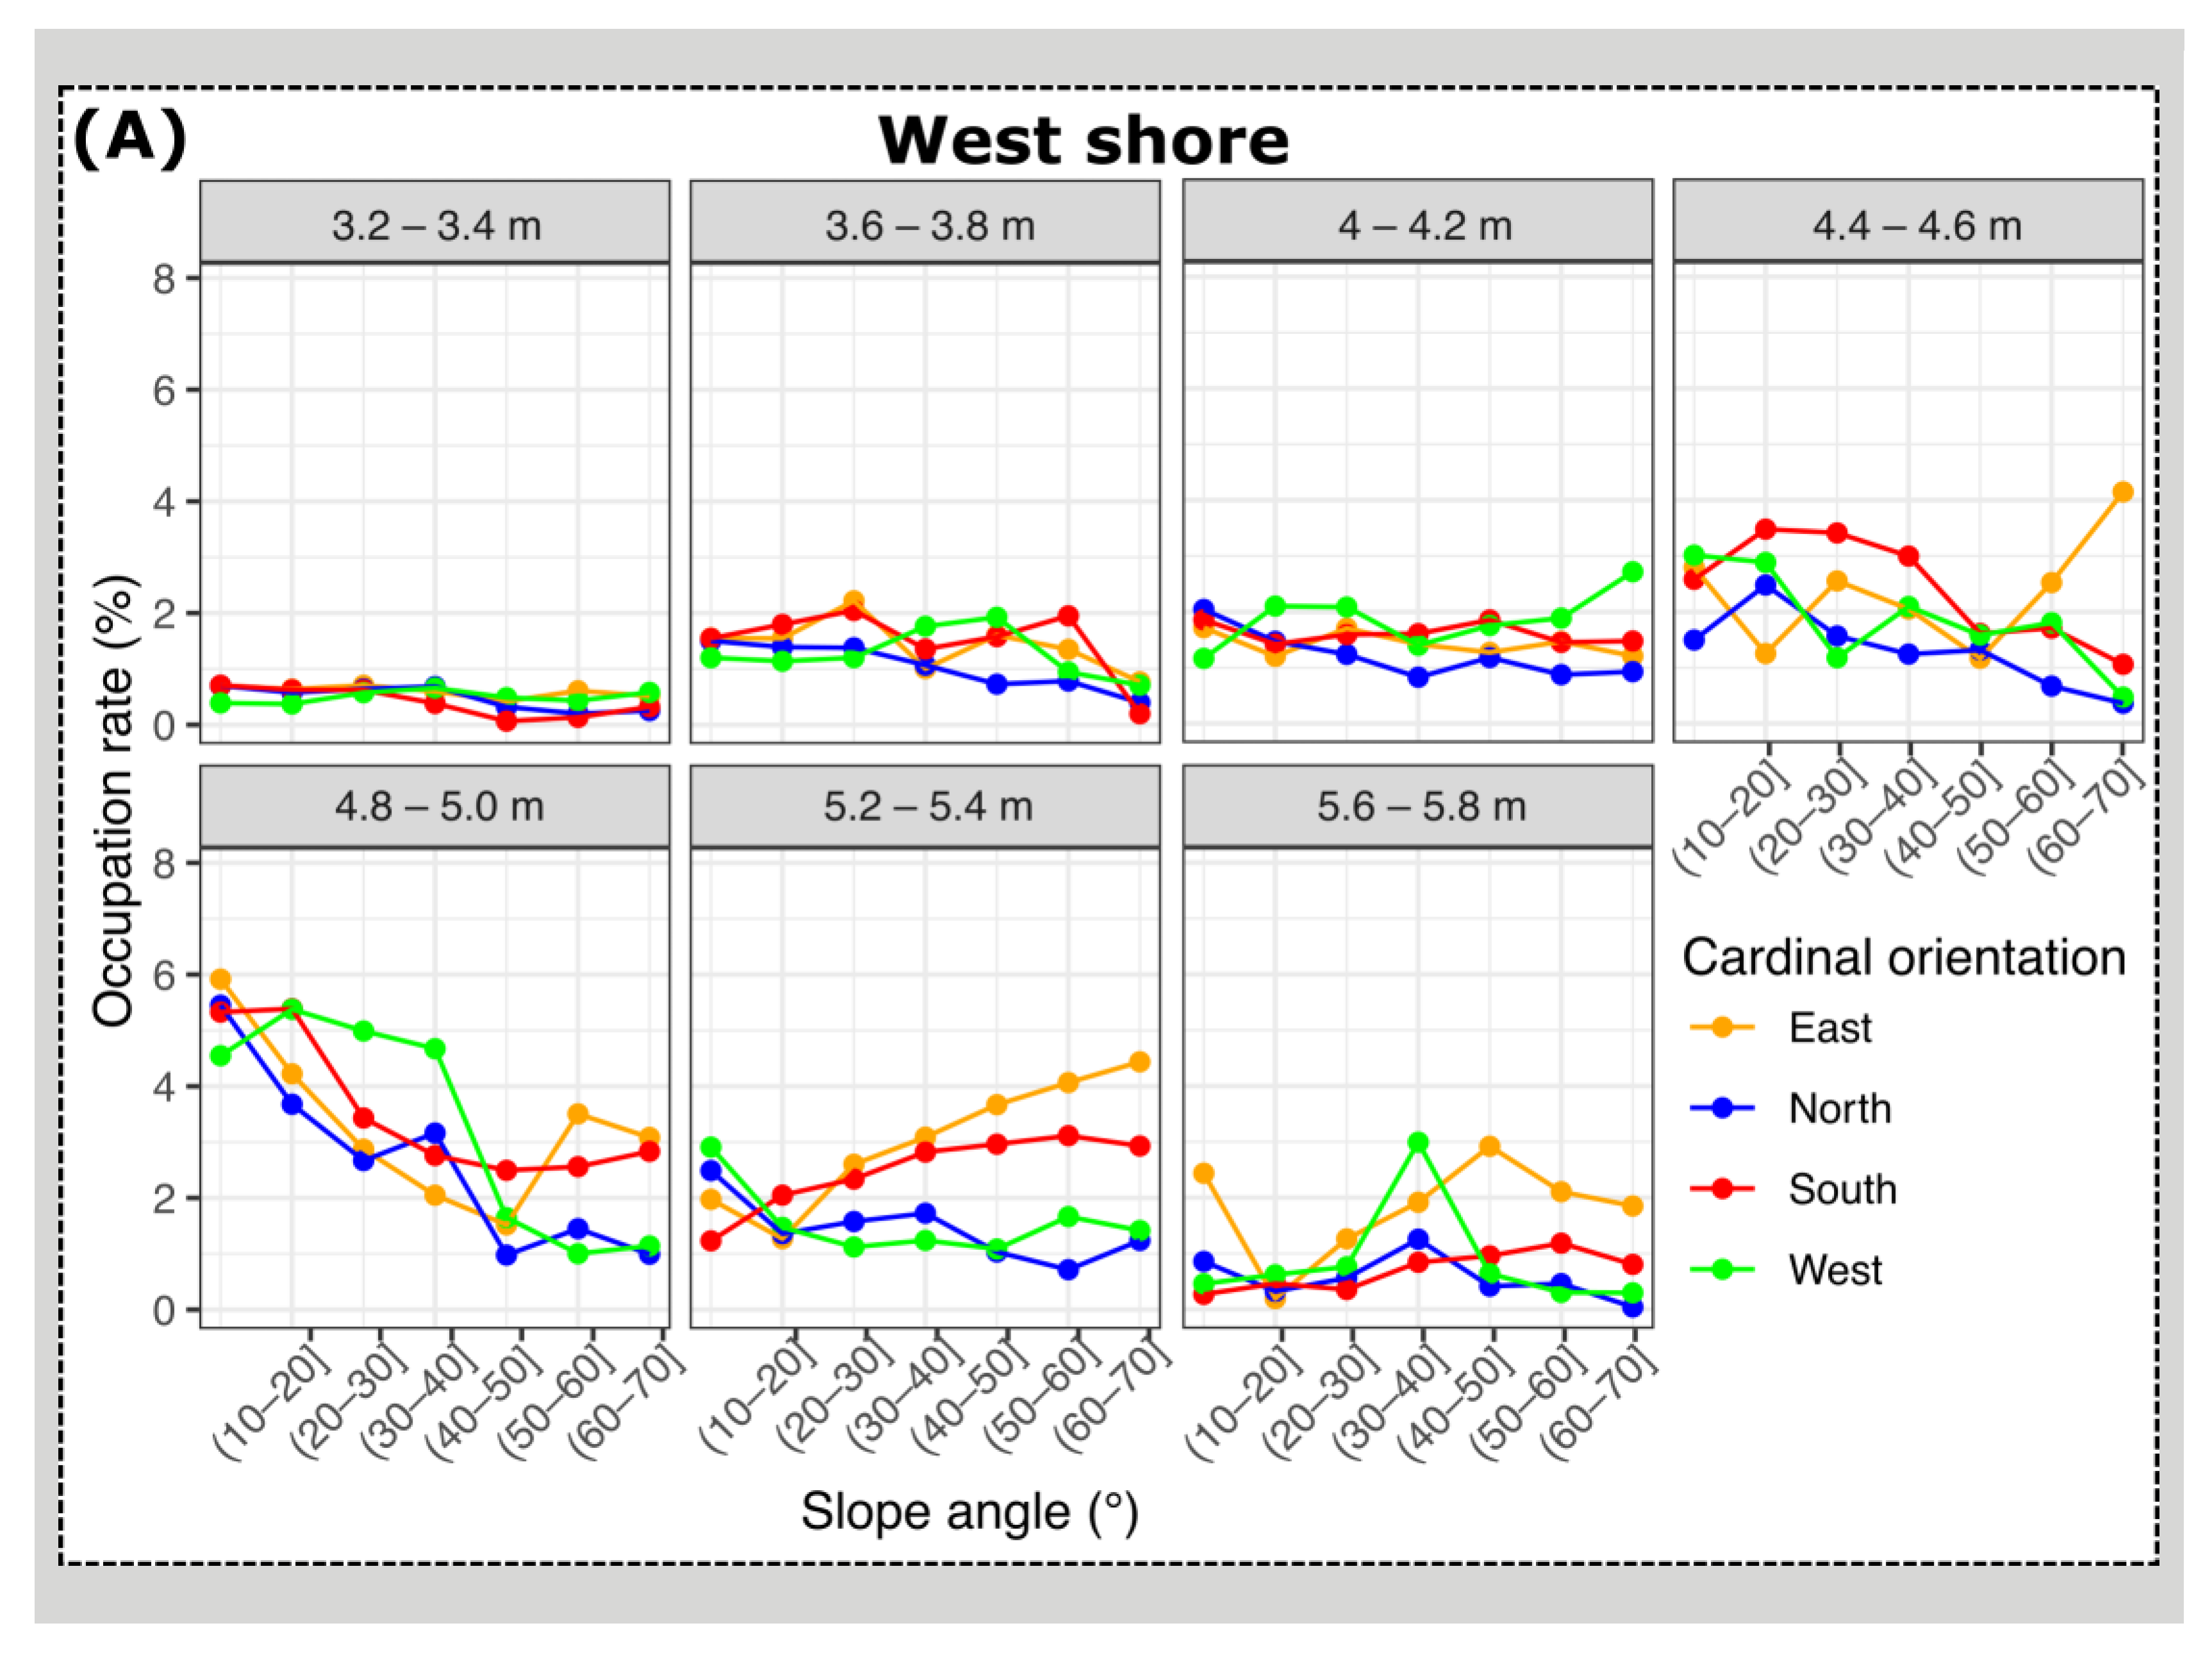
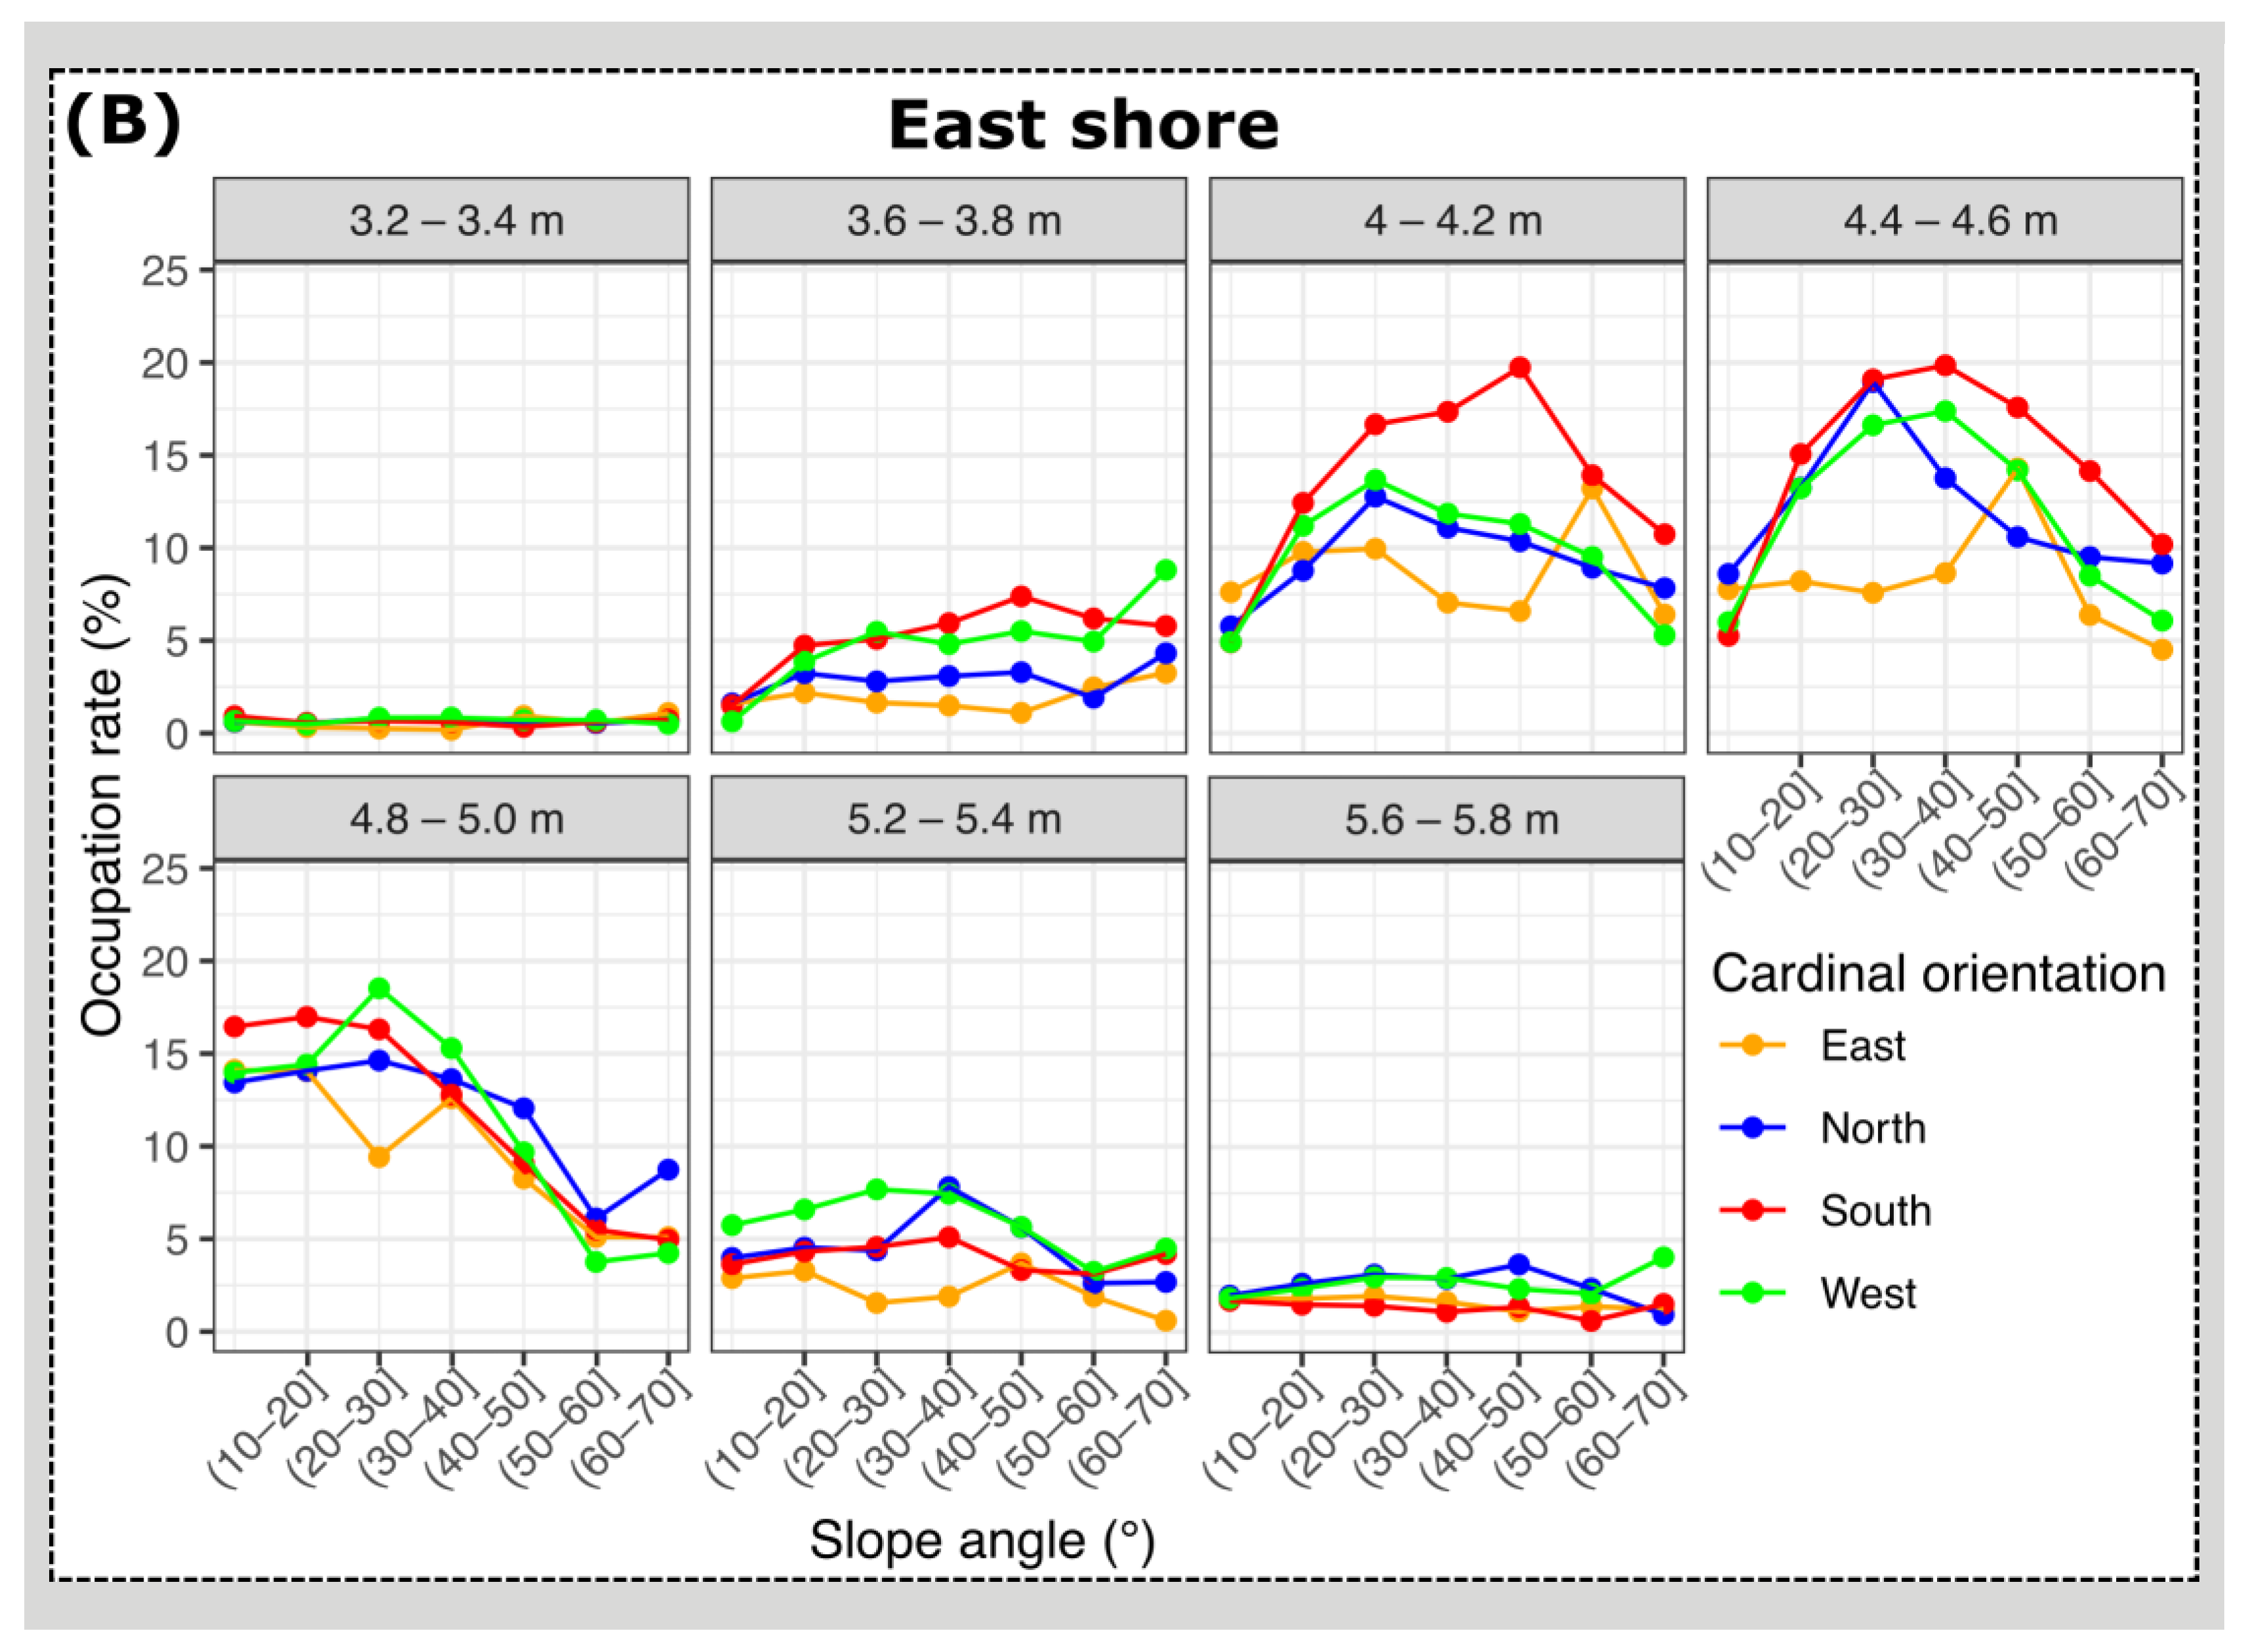
3.2. Mussel Habitat Preferences

The area occupied by mussels varied along the intertidal height gradient with a unimodal distribution centered at approximately 4.5 m above the LAT. The higher surface occupied by mussels in the center of their distribution height range was not associated with a higher availability of area (Figure 6). There was no clear limitation of surface availability and a higher occupation rate in the center of the intertidal height range indicated a preference for distribution in this zone (Figure 6). In the west shore, the mussel occupation rate was higher at an intertidal height of between 4.6 and 5 m, whereas in the east shore the occupation rate increased downward, between 4.2 and 4.6 m height (Figure 6). The intertidal zone of mussel distribution corresponded to a range of immersion time percentage between 19% and 63% (Figure 6).
There were differences in occupation rate between primary orientations, which depended not only on the slope angle but also on the intertidal height and rocky shore (Figure 7). In general, the occupation rate showed no evident pattern at the limits of mussel distribution, i.e., below 3.6 and above 5.2 m height. In the center of their intertidal range of distribution on the west shore, the occupation rate decreased with an increasing slope, particularly in microhabitats oriented to the east and south compared to orientations to the west and, to a greater extent, to the north (Figure 7A). In contrast, on the east shore, the occupation rate increased at intermediate slopes, particularly in microhabitats oriented to the south and east (Figure 7B).

4. Discussion

Our results showed that drone images are suitable for identifying and mapping mussels with a high resolution (1 cm) using the new MVI proposed. M. galloprovincialis distribution was highly restricted to a determined intertidal height range, and the total occupied area varied greatly between the two studied rocky shores. Different occupation rates among microhabitats indicate the importance of the interaction between topographic microhabitat conditions (slope, orientation, and intertidal height) in promoting intertidal species development. Here, we discuss the developed approach and the potential causes of the observed relationships between the topographic conditions and the distribution of M. galloprovincialis on two rocky shores.

4.1. Mussel Distribution along the Variable Intertidal Height, Slope, and Orientation Features

The observed unimodal distribution of mussels along the intertidal range between 3.32 and 5.80 m height above the LAT, on both shores, indicated an optimum intertidal range for population development. This optimum intertidal range is well-known in the intertidal ecology community but has been poorly described quantitatively. Generally, mussel-occupied areas are estimated based on transect surveys as the proportion of occupied area in quadrat or plot samples, but without quantifying the available area along the entire intertidal zone (e.g., [43,44,45]). Here, the advantage of drone images for characterizing the total area provides useful and accurate quantitative information on the occupation rate, excluding the effect of differences in available surface and facilitating comparisons between sites.
The zonation of benthic species is driven by a combination of biotic (e.g., predation, intra- and inter-specific competition) and abiotic factors (e.g., temperature, water dynamics) [46,47,48,49,50,51,52]. Temperature and immersion time drive the thermal stress and desiccation, which are more likely to occur in the upper zone of the intertidal area, increasing the probability of mortality [50,53,54]. Consequently, mussels increase the anaerobic respiration rate, ammonium excretion, and the production of stress proteins, such as heat shock proteins (HSPs), at the upper intertidal zone [55,56,57,58]. Feeding rate is a linear function of immersion time and therefore topography. Therefore, mussels in the upper part of the shore would be deprived of food and would experience more stressful conditions, making the habitat unsuitable, as opposed to the lower part of the shore. In Le Petit Minou, the upper limit of mussels’ distribution corresponded to an immersion time percentage of about 18%. Such immersion time may be linked to the minimum immersion time required for balancing the energetic metabolism of individuals in the upper intertidal [50]. Further analysis of metabolic energetic balance depending on local food and temperature conditions, such as using energy budget theory (DEB) models (e.g., [59,60,61]), could help to determine the bioenergetic mechanism behind the upper limit of distribution of the species. Nevertheless, immersion time alone is not sufficient to explain the occupation rate, and the lower boundary of mussels’ distribution should be related to other factors, such as predation, competition for space [62,63], and sand dynamics [64,65].
Microhabitat slope and orientation interact with intertidal height to determine the occupation rate of mussels. In our study site, such an interaction resulted in a preference for the occupation of south-oriented microhabitats on both rocky shores, especially in the central intertidal height, although this was less clear on the west shore where the maximum occupation rate of the mussels was low. South-oriented areas present higher solar radiation and generally a higher substrate temperature [3,23,66], suggesting that these microhabitats provide better conditions for M. galloprovincialis development. Nevertheless, the lower preference for south-oriented microhabitats on the west shore indicates that conditions of south-oriented microhabitats depend on the shore. In the central intertidal range of mussel presence, a high occupation rate also occurred in west-oriented microhabitats on the east shore. The west shore is exposed earlier to the sun than the east shore as a result of the mesoscale topography of the site, i.e., due to the general slope of the coast at the scale of each shore (e.g., 100 m). The opposite occurs during the afternoon, i.e., the west shore becomes shaded earlier than the east. Such differences could influence the observed shore-dependent preference for the distribution of mussels and would also explain the high occupation rate observed in west-oriented microhabitats on the central intertidal range of mussels’ presence on the East shore.
The total occupied area of the mussels is generally higher on wave-exposed shores than on sheltered shores [67,68]. This fact could explain the higher occupied area in the east as this shore is likely more exposed to waves than the west. However, when analyzing the occupied area among microhabitats, the higher mussel occupation rate at orientation south-to-west is likely related to a factor other than wave exposure. Wave exposure has been shown to drive occupation between shores at the mesoscale, but such an effect was not evident at a higher resolution on Perna perna mussel populations [69]. Water force can vary over short distances [1,2,70] and has been shown to influence the growth of the P. perna mussel on intertidal rocky shores [71]. However, the water force is not directly associated with high-resolution substrate orientation or slope [70], and thus might not drive the preference for the occupation of south-to-west substrate-oriented microhabitats in our study site. Further characterization of the study site is necessary to evaluate the role of high-resolution water force in driving mussel distribution. Other habitat conditions related to sun exposure, such as the temperature, could also promote individual and population growth differently on both shores. For instance, evidence of a faster growth rate in the east could be related to the higher total occupied area on this shore, since faster mussel growth has been associated with areas of higher abundance [45]. A slower individual growth rate occurs in the west shore than in the east, which suggests higher thermal stressing conditions, despite some indices of higher stress in the east (based on the condition index) during the warmer months of 2019 [31]. The predominant role of temperature on growth rate difference between shores is based on the assumption that other factors such as food availability or turbidity would not vary sufficiently at the site. At the population level, the effect of slope, orientation, and immersion time should play a role in processes such as resistance to dislodgement by waves, aggregation, recruitment, and reproduction. Furthermore, mussel density can affect the growth rate through the process of self-thinning [46,72,73,74]. Nevertheless, this process would probably not relate to the observed differences in the occupied area in our study site because the crowding of mussel aggregations is relatively low and shows no important spatial variation [31].
The relationship between orientation, slope, and intertidal height position in relation to the presence of mussels and its occupation rate cannot be generalized and must vary in other sites. The differences observed between the two near rocky shores studied here demonstrated the importance of mesoscale and microscale features and interactions between both scales that determine non-linear patterns. Consequently, sites with different conditions, such as mesoscale orientation, latitude, and water exposure, would present different patterns of mussel distribution. Integrating both mesoscales and microhabitat scales will help to disentangle the causes of such differences among rocky shores.

4.2. Approach Advantages and Limitations

The use of drone images showed a very good compromise between resolution and the extent of the studied area. The high performance of the supervised classification indicated the relevance of drone image analyses and the developed index, MVI, for monitoring the distribution of an ecosystem engineer species, Mytilus sp. MVI would also be useful for identifying species with bodies or structures in blue colors, such as some sea stars, sea urchins, or crabs. Additionally, the double use of images from the dataset for creating the orthomosaic and the DSM enable complementary analyses. This is fundamental in environments where topography plays a role in the distribution of species.
With respect to transferability and reproducibility, some limitations of the approach are due to the variable performance observed depending on the image dataset. Particularly for temporal analysis, differences in weather conditions of cloud cover and humidity, as well as differences in the time, would increase the difficulty of identifying the species, as well as resulting in a probable increase in the loss of studied area due to masking shadows. Solar zenith and sun altitude position are linked to the month of the year, which determine the effect of shaded areas on the estimation of the species distribution area. For instance, Gomes et al. [16] included specific classes to identify shaded and/or wet mussel pixels and improve the identification of mussel distribution. The image classification based on only RGB would likely be difficult in sites where algae are more abundant and mix with mussel populations. The interference between algae color properties and mussel identification was already observed in the lower intertidal at Le Petit Minou, but the large height zonation between species allowed the exclusion of false positives through masking by height. Nevertheless, some false positives were still associated with algae in intertidal pools. The use of other image properties, such as the red edge (RE), near-infrared (NIR), and surface structure, has been shown to improve intertidal image classification [14]. In addition, drone surveys with resolution below one centimeter could also be used for identifying the presence of species by complementing the RGB color band properties of image cells with the surface structure of mussel individuals using the approach known as ‘object-based identification analyses’ (OBIA) [75]. This and other methods such as hyperspectral images could improve performance in particular cases/sites where algae and mussels are mixed.
The approach used to determine the occupied area based on orthomosaics was based on the bi-dimensional distribution and could introduce bias due to minimizing the surface by the “top view”. To improve such analysis, it would be recommended to work with the 3D model, rather than the 2.5D DSM, to better take steep and vertical surfaces into account. However, the high resolution used here may limit a 3D analysis over the entire studied area due to the high volume of information and computing capacity required.

4.3. Insights into Intertidal Population Monitoring

The use of drone images for mapping mussel distribution was accurate and could provide more information on spatial occupation patterns than on-ground quadrat surveys. Murfitt et al. [11] indicated that mapping species with drone images can be faster than with on-ground quadrat surveys. In addition, methods using drone images allow a complete determination of the occupied surface, potentially reducing the bias associated with an estimation based upon on-ground quadrats. Thus, aerial images are suitable for monitoring mussel intertidal populations on rocky shores and would improve our understanding of their distribution and dynamics.
Mussel populations have experienced mortality events in the last years (reviewed in [76]) and monitoring them with image analyses, using drones as shown here or other portable systems (e.g., [77]), could allow assessing their dynamics over time. The Brittany region is not an exception, and events of high mussel mortality have been observed on farms. A reduction of the mussel-occupied area in sites close to Le Petit Minou, such as in Le Conquet, was observed in the last years (J. Flye-Sainte-Marie, personal communication). In the French Brittany region, diseases were observed to affect population mortality during recent years (e.g., in Brest in 2017 [78] and in North Brittany [79]). Caza et al. [80] suggested that an increase in temperature will accelerate the horizontal transmission of cancer in mussels. All these potential factors coupled with spatial assessments of mussel-occupied area applying drone images analysis, e.g., the method presented in this study, should be targeted in future monitoring initiatives. In addition, a model based on global climate change scenarios predicted changes in the limits of distribution of M. galloprovincialis as well as M. edulis on the northwest European coast [58,81]. Monitoring larger areas could validate such predictions and improve population state assessment at the biogeographic scale.
To optimize monitoring efforts, we need appropriate tools and target species that provide good indicators of changes in the long term. For instance, a long-term analysis of oyster dynamics showed the effect of climate conditions linked to the occurrence of positive North Atlantic oscillation (NAO+) atmospheric circulation regimes on their population mortality [82]. Besides, mussels are a target species due to their wide distribution, their sensitivity to environmental changes, and their sessile condition, which provides localized information, making them climate “sentinels” of coastal ecosystems.

5. Conclusions

Our results highlighted the combined effect of microhabitats and mesoscale terrain conditions on mussel population ecology. There was not a linear relationship between terrain attributes at the microhabitat scale and mussel occupancy between rocky shores mainly due to differences between shores related to mesoscale terrain attributes, which imply contrasted stressing conditions. Consequently, high differences in the total occupied area were observed between rocky shores, despite being close in space. Such effects of meso- and micro-topographic features could also play a role in the dynamics of occupied areas. Thus, the next steps will be to monitor the observed distribution by applying the mussel mapping approach presented here through time and assess the temporal changes. Furthermore, assessing and exploring the mosaic distribution of microclimate conditions (e.g., [83]), considering the meso- and micro-scale topographic structure, could explain the direct causes and mechanisms of the population distribution and structure. Finally, we suggest using drone image analysis methods to monitor long-term changes in sentinel sessile species.

Supplementary Materials

The following supporting information can be downloaded at: https://www.mdpi.com/article/10.3390/rs14215441/s1, Figure S1: Frequency distribution of cells classified as potential mussel-occupied area. Figure S2: Density distribution of the cells with mussels’ MVI values along the intertidal height gradient. Figure S3: Distribution of cells with particular slope and orientation attributes in the west and east rocky shores at different spatial resolutions. Table S1: Microhabitat conditions in the available cells in the west and east rocky shore (20 × 20 cm resolution). Table S2: Microhabitat conditions in the cells occupied by mussels in the west and east rocky shore (1 × 1 cm resolution).

Author Contributions

Conceptualization, R.V.B., C.B., F.J. and Y.T.; data curation, R.V.B., M.J., Y.K. and J.A.; formal analysis, R.V.B., Y.K. and Y.T.; funding acquisition, R.V.B., C.B., F.J. and Y.T.; investigation, R.V.B., Y.K. and Y.T.; methodology, R.V.B., M.J., Y.K., J.A. and Y.T.; project administration, R.V.B., M.J. and Y.T.; resources, C.B. and Y.T.; software, R.V.B., M.J. and Y.K.; supervision, C.B., F.J. and Y.T.; validation, R.V.B., M.J., Y.K. and Y.T.; visualization, R.V.B.; writing—original draft, R.V.B.; writing—review and editing, R.V.B., M.J., C.B., Y.K., F.J., J.A. and Y.T. All authors have read and agreed to the published version of the manuscript.

Funding

This research was funded by Region Bretagne, Université de Bretagne Occidentale (UBO), Brest, France, and the European Institute for Marine Studies (IUEM), Plouzane, France.

Data Availability Statement

The data presented in this study are available in the Supplementary Material.

Acknowledgments

R.V.B. benefited from the financial support of the Region Bretagne and Université de Bretagne Occidentale (UBO). Y.K. was funded by an IUEM master’s fellowship. The authors warmly acknowledge Magdalena Georgieva for English editing. The authors also acknowledge the five reviewers for their comments that helped to improve this manuscript.

Conflicts of Interest

The authors declare no conflict of interest.

References

  1. O’Donnell, M.J.; Denny, M.W. Hydrodynamic Forces and Surface Topography: Centimeter-Scale Spatial Variation in Wave Forces. Limnol. Oceanogr. 2008, 53, 579–588. [Google Scholar] [CrossRef] [Green Version]
  2. Burel, T.; Schaal, G.; Grall, J.; Le Duff, M.; Chapalain, G.; Schmitt, B.; Gemin, M.; Boucher, O.; Ar Gall, E. Small-Scale Effects of Hydrodynamics on the Structure of Intertidal Macroalgal Communities: A Novel Approach. Estuar. Coast. Shelf Sci. 2019, 226, 106290. [Google Scholar] [CrossRef]
  3. Helmuth, B.; Broitman, B.R.; Blanchette, C.A.; Gilman, S.; Halpin, P.; Harley, C.D.G.; O’Donnell, M.J.; Hofmann, G.E.; Menge, B.; Strickland, D. Mosaic Patterns of Thermal Stress in the Rocky Intertidal Zone: Implications for Climate Change. Ecol. Monogr. 2006, 76, 461–479. [Google Scholar] [CrossRef] [Green Version]
  4. Meager, J.; Schlacher, T.; Green, M. Topographic Complexity and Landscape temperature Patterns Create a Dynamic Habitat Structure on a Rocky Intertidal Shore. Mar. Ecol. Prog. Ser. 2011, 428, 1–12. [Google Scholar] [CrossRef] [Green Version]
  5. Bouchet, P.J.; Meeuwig, J.J.; Kent, C.P.S.; Letessier, T.B.; Jenner, C.K. Topographic Determinants of Mobile Vertebrate Predator Hotspots: Current Knowledge and Future Directions. Biol. Rev. 2015, 90, 699–728. [Google Scholar] [CrossRef] [PubMed]
  6. Reichwaldt, E.S.; Ghadouani, A. Can Mussels Be Used as Sentinel Organisms for Characterization of Pollution in Urban Water Systems? Hydrol. Earth Syst. Sci. 2016, 20, 2679–2689. [Google Scholar] [CrossRef] [Green Version]
  7. Beyer, J.; Green, N.W.; Brooks, S.; Allan, I.J.; Ruus, A.; Gomes, T.; Bråte, I.L.N.; Schøyen, M. Blue Mussels (Mytilus edulis Spp.) as Sentinel Organisms in Coastal Pollution Monitoring: A Review. Mar. Environ. Res. 2017, 130, 338–365. [Google Scholar] [CrossRef] [PubMed]
  8. Herlyn, M. Quantitative Assessment of Intertidal Blue Mussel (Mytilus edulis L.) Stocks: Combined Methods of Remote Sensing, Field Investigation and Sampling. J. Sea Res. 2005, 53, 243–253. [Google Scholar] [CrossRef]
  9. Folmer, E.O.; Drent, J.; Troost, K.; Büttger, H.; Dankers, N.; Jansen, J.; van Stralen, M.; Millat, G.; Herlyn, M.; Philippart, C.J.M. Large-Scale Spatial Dynamics of Intertidal Mussel (Mytilus edulis L.) Bed Coverage in the German and Dutch Wadden Sea. Ecosystems 2014, 17, 550–566. [Google Scholar] [CrossRef] [Green Version]
  10. D’Urban Jackson, T.; Williams, G.J.; Walker-Springett, G.; Davies, A.J. Three-Dimensional Digital Mapping of Ecosystems: A New Era in Spatial Ecology. Proc. R. Soc. B Biol. Sci. 2020, 287, 20192383. [Google Scholar] [CrossRef] [PubMed]
  11. Murfitt, S.L.; Allan, B.M.; Bellgrove, A.; Rattray, A.; Young, M.A.; Ierodiaconou, D. Applications of Unmanned Aerial Vehicles in Intertidal Reef Monitoring. Sci. Rep. 2017, 7, 10259. [Google Scholar] [CrossRef] [PubMed] [Green Version]
  12. Bajjouk, T.; Jauzein, C.; Drumetz, L.; Dalla Mura, M.; Duval, A.; Dubois, S.F. Hyperspectral and Lidar: Complementary Tools to Identify Benthic Features and Assess the Ecological Status of Sabellaria alveolata Reefs. Front. Mar. Sci. 2020, 7, 804. [Google Scholar] [CrossRef]
  13. Sejr, M.K.; Mouritsen, K.N.; Krause-Jensen, D.; Olesen, B.; Blicher, M.E.; Thyrring, J. Small Scale Factors Modify Impacts of Temperature, Ice Scour and Waves and Drive Rocky Intertidal Community Structure in a Greenland Fjord. Front. Mar. Sci. 2021, 7, 607135. [Google Scholar] [CrossRef]
  14. Collin, A.; Dubois, S.; James, D.; Houet, T. Improving Intertidal Reef Mapping Using UAV Surface, Red Edge, and Near-Infrared Data. Drones 2019, 3, 67. [Google Scholar] [CrossRef] [Green Version]
  15. Jackson-Bué, T.; Williams, G.J.; Walker-Springett, G.; Rowlands, S.J.; Davies, A.J. Three-Dimensional Mapping Reveals Scale-Dependent Dynamics in Biogenic Reef Habitat Structure. Remote Sens. Ecol. Conserv. 2021, 7, 621–637. [Google Scholar] [CrossRef]
  16. Gomes, I.; Peteiro, L.; Bueno-Pardo, J.; Albuquerque, R.; Pérez-Jorge, S.; Oliveira, E.R.; Alves, F.L.; Queiroga, H. What’s a Picture Really Worth? On the Use of Drone Aerial Imagery to Estimate Intertidal Rocky Shore Mussel Demographic Parameters. Estuar. Coast. Shelf Sci. 2018, 213, 185–198. [Google Scholar] [CrossRef]
  17. Kaplanis, N.J.; Edwards, C.B.; Eynaud, Y.; Smith, J.E. Future Sea-Level Rise Drives Rocky Intertidal Habitat Loss and Benthic Community Change. PeerJ 2020, 8, e9186. [Google Scholar] [CrossRef]
  18. Anderson, K.; Gaston, K.J. Lightweight Unmanned Aerial Vehicles Will Revolutionize Spatial Ecology. Front. Ecol. Environ. 2013, 11, 138–146. [Google Scholar] [CrossRef] [Green Version]
  19. Yang, J.; El-Kassaby, Y.A.; Guan, W. The Effect of Slope Aspect on Vegetation Attributes in a Mountainous Dry Valley, Southwest China. Sci. Rep. 2020, 10, 16465. [Google Scholar] [CrossRef] [PubMed]
  20. Nadal-Romero, E.; Petrlic, K.; Verachtert, E.; Bochet, E.; Poesen, J. Effects of Slope Angle and Aspect on Plant Cover and Species Richness in a Humid Mediterranean Badland. Earth Surf. Process. Landf. 2014, 39, 1705–1716. [Google Scholar] [CrossRef]
  21. Bochet, E.; García-Fayos, P.; Poesen, J. Topographic Thresholds for Plant Colonization on Semi-Arid Eroded Slopes. Earth Surf. Process. Landf. 2009, 34, 1758–1771. [Google Scholar] [CrossRef]
  22. Lozano-García, B.; Parras-Alcántara, L.; Brevik, E.C. Impact of Topographic Aspect and Vegetation (Native and Reforested Areas) on Soil Organic Carbon and Nitrogen Budgets in Mediterranean Natural Areas. Sci. Total Environ. 2016, 544, 963–970. [Google Scholar] [CrossRef] [PubMed]
  23. Seabra, R.; Wethey, D.S.; Santos, A.M.; Lima, F.P. Side Matters: Microhabitat Influence on Intertidal Heat Stress over a Large Geographical Scale. J. Exp. Mar. Biol. Ecol. 2011, 400, 200–208. [Google Scholar] [CrossRef]
  24. Guichard, F.; Halpin, P.M.; Allison, G.W.; Lubchenco, J.; Menge, B.A. Mussel Disturbance Dynamics: Signatures of Oceanographic Forcing from Local Interactions. Am. Nat. 2003, 161, 889–904. [Google Scholar] [CrossRef] [PubMed] [Green Version]
  25. Blanchette, C.A.; Helmuth, B.; Gaines, S.D. Spatial Patterns of Growth in the Mussel, Mytilus californianus, across a Major Oceanographic and Biogeographic Boundary at Point Conception, California, USA. J. Exp. Mar. Biol. Ecol. 2007, 340, 126–148. [Google Scholar] [CrossRef]
  26. Oróstica, M.H.; Wyness, A.J.; Monsinjon, J.R.; Nicastro, K.R.; Zardi, G.I.; Barker, C.; McQuaid, C.D. Effects of Habitat Quality on Abundance, Size and Growth of Mussel Recruits. Hydrobiologia 2022, 849, 4341–4356. [Google Scholar] [CrossRef] [PubMed]
  27. Harley, C. Tidal Dynamics, Topographic Orientation, and Temperature-Mediated Mass Mortalities on Rocky Shores. Mar. Ecol. Prog. Ser. 2008, 371, 37–46. [Google Scholar] [CrossRef] [Green Version]
  28. Carrington, E.; Moeser, G.M.; Dimond, J.; Mello, J.J.; Boller, M.L. Seasonal Disturbance to Mussel Beds: Field Test of a Mechanistic Model Predicting Wave Dislodgment. Limnol. Oceanogr. 2009, 54, 978–986. [Google Scholar] [CrossRef]
  29. Bierne, N.; Borsa, P.; Daguin, C.; Jollivet, D.; Viard, F.; Bonhomme, F.; David, P. Introgression Patterns in the Mosaic Hybrid Zone between Mytilus edulis and M. galloprovincialis. Mol. Ecol. 2003, 12, 447–461. [Google Scholar] [CrossRef] [PubMed]
  30. Simon, A.; Arbiol, C.; Nielsen, E.E.; Couteau, J.; Sussarellu, R.; Burgeot, T.; Bernard, I.; Coolen, J.W.P.; Lamy, J.-B.; Robert, S.; et al. Replicated Anthropogenic Hybridisations Reveal Parallel Patterns of Admixture in Marine Mussels. Evol. Appl. 2020, 13, 575–599. [Google Scholar] [CrossRef]
  31. Barbosa, R.V.; Bacher, C.; Jean, F.; Thomas, Y. Linking Individual and Population Patterns of Rocky-Shore Mussels. PeerJ 2021, 9, e12550. [Google Scholar] [CrossRef] [PubMed]
  32. Jaud, M.; Passot, S.; Allemand, P.; Le Dantec, N.; Grandjean, P.; Delacourt, C. Suggestions to Limit Geometric Distortions in the Reconstruction of Linear Coastal Landforms by SfM Photogrammetry with PhotoScan® and MicMac® for UAV Surveys with Restricted GCPs Pattern. Drones 2019, 3, 2. [Google Scholar] [CrossRef] [Green Version]
  33. Fonstad, M.A.; Dietrich, J.T.; Courville, B.C.; Jensen, J.L.; Carbonneau, P.E. Topographic Structure from Motion: A New Development in Photogrammetric Measurement. Earth Surf. Process. Landf. 2013, 38, 421–430. [Google Scholar] [CrossRef] [Green Version]
  34. Hijmans, R.J.; van Etten, J. Raster: Geographic Analysis and Modeling with Raster Data. R Package Version2.0-12. 2012. Available online: http://CRAN.R-Project.or/Package=raster (accessed on 30 March 2021).
  35. Grohmann, C.H. Effects of Spatial Resolution on Slope and Aspect Derivation for Regional-Scale Analysis. Comput. Geosci. 2015, 77, 111–117. [Google Scholar] [CrossRef] [Green Version]
  36. Chang, K.; Tsai, B. The Effect of DEM Resolution on Slope and Aspect Mapping. Cartogr. Geogr. Inf. Syst. 1991, 18, 69–77. [Google Scholar] [CrossRef]
  37. Benaglia, T.; Chauveau, D.; Hunter, D.R.; Young, D.S. Mixtools: An R Package for Analyzing Mixture Models. J. Stat. Softw. 2009, 32, 1–29. [Google Scholar] [CrossRef] [Green Version]
  38. Thrun, M.; Hansen-Goos, O.; Ultsch, A. AdaptGauss: Gaussian Mixture Models (GMM). R Package. 2020. Available online: https://CRAN.R-project.org/package=AdaptGauss (accessed on 20 October 2020).
  39. Congalton, R.G. A Review of Assessing the Accuracy of Classifications of Remotely Sensed Data. Remote Sens. Environ. 1991, 37, 35–46. [Google Scholar] [CrossRef]
  40. Kruskal, W.H.; Wallis, W.A. Use of Ranks in One-Criterion Variance Analysis. J. Am. Stat. Assoc. 1952, 47, 583–621. [Google Scholar] [CrossRef]
  41. Cohen, J. A Coefficient of Agreement for Nominal Scales. Educ. Psychol. Meas. 1960, 20, 37–46. [Google Scholar] [CrossRef]
  42. R Core Team. R: A Language and Environment for Statistical Computing; R Foundation for Statistical Computing: Vienna, Austria, 2021; Available online: https://www.R-project.org (accessed on 1 March 2021).
  43. Thyrring, J.; Wegeberg, S.; Blicher, M.E.; Krause-Jensen, D.; Høgslund, S.; Olesen, B.; Jozef Jr., W.; Mouritsen, K.N.; Peck, L.S.; Sejr, M.K. Latitudinal Patterns in Intertidal Ecosystem Structure in West Greenland Suggest Resilience to Climate Change. Ecography 2021, 44, 1156–1168. [Google Scholar] [CrossRef]
  44. Blicher, M.E.; Sejr, M.K.; Høgslund, S. Population Structure of Mytilus edulis in the Intertidal Zone in a Sub-Arctic Fjord, SW Greenland. Mar. Ecol. Prog. Ser. 2013, 487, 89–100. [Google Scholar] [CrossRef] [Green Version]
  45. Blanchette, C.A.; Gaines, S.D. Distribution, Abundance, Size and Recruitment of the Mussel, Mytilus californianus, across a Major Oceanographic and Biogeographic Boundary at Point Conception, California, USA. J. Exp. Mar. Biol. Ecol. 2007, 340, 268–279. [Google Scholar] [CrossRef]
  46. Gascoigne, J.C.; Beadman, H.A.; Saurel, C.; Kaiser, M.J. Density Dependence, Spatial Scale and Patterning in Sessile Biota. Oecologia 2005, 145, 371–381. [Google Scholar] [CrossRef]
  47. Alunno-Bruscia, M.; Petraitis, P.S.; Bourget, E.; Fréchette, M. Body Size-Density Relationship for Mytilus edulis in an Experimental Food-Regulated Situation. Oikos 2000, 90, 28–42. [Google Scholar] [CrossRef] [Green Version]
  48. Beukema, J.; Flach, E. Factors Controlling the Upper and Lower Limits of the Intertidal Distribution of Two Corophium Species in the Wadden Sea. Mar. Ecol. Prog. Ser. 1995, 125, 117–126. [Google Scholar] [CrossRef]
  49. Connell, J.H. The Influence of Interspecific Competition and Other Factors on the Distribution of the Barnacle Chthamalus Stellatus. Ecology 1961, 42, 710–723. [Google Scholar] [CrossRef] [Green Version]
  50. Somero, G.N. Thermal Physiology and Vertical Zonation of Intertidal Animals: Optima, Limits, and Costs of Living. Integr. Comp. Biol. 2002, 42, 780–789. [Google Scholar] [CrossRef] [PubMed] [Green Version]
  51. Suchanek, T.H. The Ecology of Mytilus Edulis L. in Exposed Rocky Intertidal Communities. J. Exp. Mar. Biol. Ecol. 1978, 31, 105–120. [Google Scholar] [CrossRef]
  52. Foster, B.A. Tolerance of High Temperatures by Some Intertidal Barnacles. Mar. Biol. 1969, 4, 326–332. [Google Scholar] [CrossRef]
  53. Hopkins, G.A.; Prince, M.; Cahill, P.L.; Fletcher, L.M.; Atalah, J. Desiccation as a Mitigation Tool to Manage Biofouling Risks: Trials on Temperate Taxa to Elucidate Factors Influencing Mortality Rates. Biofouling 2016, 32, 1–11. [Google Scholar] [CrossRef]
  54. Foster, B.A. On the Determinants of the Upper Limit of Intertidal Distribution of Barnacles (Crustacea: Cirripedia). J. Anim. Ecol. 1971, 40, 33–48. [Google Scholar] [CrossRef]
  55. Roberts, D.A.; Hofmann, G.E.; Somero, G.N. Heat-Shock Protein Expression in Mytilus californianus: Acclimatization (Seasonal and Tidal-Height Comparisons) and Acclimation Effects. Biol. Bull. 1997, 192, 309–320. [Google Scholar] [CrossRef] [PubMed]
  56. Buckley, B.A.; Owen, M.-E.; Hofmann, G.E. Adjusting the Thermostat: The Threshold Induction Temperature for the Heat-Shock Response in Intertidal Mussels (Genus Mytilus) Changes as a Function of Thermal History. J. Exp. Biol. 2001, 204, 3571–3579. [Google Scholar] [CrossRef] [PubMed]
  57. Lockwood, B.L.; Sanders, J.G.; Somero, G.N. Transcriptomic Responses to Heat Stress in Invasive and Native Blue Mussels (Genus Mytilus): Molecular Correlates of Invasive Success. J. Exp. Biol. 2010, 213, 3548–3558. [Google Scholar] [CrossRef] [PubMed] [Green Version]
  58. De Vooys, C.G.N.; De Zwaan, A. The Rate of Oxygen Consumption and Ammonia Excretion by Mytilus edulis after Various Periods of Exposure to Air. Comp. Biochem. Physiol. A Physiol. 1978, 60, 343–347. [Google Scholar] [CrossRef]
  59. Thomas, Y.; Bacher, C. Assessing the Sensitivity of Bivalve Populations to Global Warming Using an Individual-Based Modelling Approach. Glob. Change Biol. 2018, 24, 4581–4597. [Google Scholar] [CrossRef] [Green Version]
  60. Monaco, C.J.; McQuaid, C.D. Applicability of Dynamic Energy Budget (DEB) Models across Steep Environmental Gradients. Sci. Rep. 2018, 8, 16384. [Google Scholar] [CrossRef] [Green Version]
  61. Thomas, Y.; Mazurié, J.; Alunno-Bruscia, M.; Bacher, C.; Bouget, J.-F.; Gohin, F.; Pouvreau, S.; Struski, C. Modelling Spatio-Temporal Variability of Mytilus edulis (L.) Growth by Forcing a Dynamic Energy Budget Model with Satellite-Derived Environmental Data. J. Sea Res. 2011, 66, 308–317. [Google Scholar] [CrossRef] [Green Version]
  62. Rius, M.; McQuaid, C.D. Wave Action and Competitive Interaction between the Invasive Mussel Mytilus Galloprovincialis and the Indigenous Perna Perna in South Africa. Mar. Biol. 2006, 150, 69–78. [Google Scholar] [CrossRef]
  63. Moritsch, M.M. Expansion of Intertidal Mussel Beds Following Disease-Driven Reduction of a Keystone Predator. Mar. Environ. Res. 2021, 169, 105363. [Google Scholar] [CrossRef]
  64. Zardi, G.I.; Nicastro, K.R.; McQuaid, C.D.; Erlandsson, J. Sand and Wave Induced Mortality in Invasive (Mytilus galloprovincialis) and Indigenous (Perna perna) Mussels. Mar. Biol. 2008, 153, 853–858. [Google Scholar] [CrossRef]
  65. Bagur, M.; Gutiérrez, J.L.; González, J.A.; Arribas, L.P.; Palomo, M.G. Physical Rather than Biotic Factors Set the Lower Limit of Mussel Beds in a Horizontal Rocky Intertidal Platform. J. Exp. Mar. Biol. Ecol. 2022, 548, 151680. [Google Scholar] [CrossRef]
  66. Denny, M.W.; Dowd, W.W.; Bilir, L.; Mach, K.J. Spreading the Risk: Small-Scale Body Temperature Variation among Intertidal Organisms and Its Implications for Species Persistence. J. Exp. Mar. Biol. Ecol. 2011, 400, 175–190. [Google Scholar] [CrossRef]
  67. McQuaid, C.; Lindsay, T. Effect of Wave Exposure on Growth and Mortality Rates of the Mussel Perna Perna: Bottom-up Regulation of Intertidal Populations. Mar. Ecol. Prog. Ser. 2000, 206, 147–154. [Google Scholar] [CrossRef] [Green Version]
  68. McQuaid, C.; Branch, G. Trophic Structure of Rocky Intertidal Communities Response to Wave Action and Implications for Energy Flow. Mar. Ecol. Prog. Ser. 1985, 22, 153–161. [Google Scholar] [CrossRef]
  69. Erlandsson, J.; McQuaid, C.D.; Kostylev, V.E. Contrasting Spatial Heterogeneity of Sessile Organisms within Mussel (Perna Perna L.) Beds in Relation to Topographic Variability. J. Exp. Mar. Biol. Ecol. 2005, 314, 79–97. [Google Scholar] [CrossRef]
  70. Focht, R.C.; Shima, J.S. Acceleration Loggers Reveal Fine-Scale Heterogeneity in Wave Exposure along an Open Coast. Estuar. Coast. Shelf Sci. 2020, 233, 106507. [Google Scholar] [CrossRef]
  71. McQuaid, C.D.; Mostert, B.P. The Effects of Within-Shore Water Movement on Growth of the Intertidal Mussel Perna perna: An Experimental Field Test of Bottom-up Control at Centimetre Scales. J. Exp. Mar. Biol. Ecol. 2010, 384, 119–123. [Google Scholar] [CrossRef]
  72. Guiñez, R. A Review on Self-Thinning in Mussels. Rev. Biol. Mar. Oceanogr. 2005, 40, 1–6. [Google Scholar] [CrossRef]
  73. Hughes, R.N.; Griffiths, C.L. Self-Thinning in Barnacles and Mussels: The Geometry of Packing. Am. Nat. 1988, 132, 484–491. [Google Scholar] [CrossRef]
  74. Cubillo, A.M.; Peteiro, L.G.; Fernández-Reiriz, M.J.; Labarta, U. Influence of Stocking Density on Growth of Mussels (Mytilus galloprovincialis) in Suspended Culture. Aquaculture 2012, 342–343, 103–111. [Google Scholar] [CrossRef] [Green Version]
  75. Blaschke, T. Object Based Image Analysis for Remote Sensing. ISPRS J. Photogramm. Remote Sens. 2010, 65, 2–16. [Google Scholar] [CrossRef] [Green Version]
  76. Lupo, C.; Bougeard, S.; Le Bihan, V.; Blin, J.L.; Allain, G.; Azéma, P.; Benoit, F.; Béchemin, C.; Bernard, I.; Blachier, P.; et al. Mortality of Marine Mussels Mytilus edulis and M. galloprovincialis: Systematic Literature Review of Risk Factors and Recommendations for Future Research. Rev. Aquac. 2021, 13, 504–536. [Google Scholar] [CrossRef]
  77. Jaud, M.; Bertin, S.; Beauverger, M.; Augereau, E.; Delacourt, C. RTK GNSS-Assisted Terrestrial SfM Photogrammetry without GCP: Application to Coastal Morphodynamics Monitoring. Remote Sens. 2020, 12, 1889. [Google Scholar] [CrossRef]
  78. Charles, M.; Bernard, I.; Villalba, A.; Oden, E.; Burioli, E.A.V.; Allain, G.; Trancart, S.; Bouchart, V.; Houssin, M. High Mortality of Mussels in Northern Brittany—Evaluation of the Involvement of Pathogens, Pathological Conditions and Pollutants. J. Invertebr. Pathol. 2020, 170, 107308. [Google Scholar] [CrossRef] [PubMed]
  79. Baden, S.; Hernroth, B.; Lindahl, O. Declining Populations of Mytilus Spp. in North Atlantic Coastal Waters—A Swedish Perspective. J. Shellfish Res. 2021, 40, 269–296. [Google Scholar] [CrossRef]
  80. Caza, F.; Bernet, E.; Veyrier, F.J.; Betoulle, S.; St-Pierre, Y. Hemocytes Released in Seawater Act as Trojan Horses for Spreading of Bacterial Infections in Mussels. Sci. Rep. 2020, 10, 19696. [Google Scholar] [CrossRef]
  81. Thomas, Y.; Razafimahefa, N.R.; Ménesguen, A.; Bacher, C. Multi-Scale Interaction Processes Modulate the Population Response of a Benthic Species to Global Warming. Ecol. Model. 2020, 436, 109295. [Google Scholar] [CrossRef]
  82. Thomas, Y.; Cassou, C.; Gernez, P.; Pouvreau, S. Oysters as Sentinels of Climate Variability and Climate Change in Coastal Ecosystems. Environ. Res. Lett. 2018, 13, 104009. [Google Scholar] [CrossRef]
  83. Choi, F.; Gouhier, T.; Lima, F.; Rilov, G.; Seabra, R.; Helmuth, B. Mapping Physiology: Biophysical Mechanisms Define Scales of Climate Change Impacts. Conserv. Physiol. 2019, 7, coz028. [Google Scholar] [CrossRef]
Figure 1. (A) Study site location, Le Petit Minou, France, and (B) the west and east rocky-shore areas surveyed by drone in Le Petit Minou.
Remotesensing 14 05441 g001
Figure 2. Workflow for mapping mussel distribution based on orthomosaic RGB bands.
Remotesensing 14 05441 g002
Figure 3. Le Petit Minou study site (A) and the distribution of the proportion of available area (%) with specific (B) intertidal height, (C) slope (°), and (D) orientation (°) along the intertidal zone (0–8 m above LAT) from the west and east shores. The maps show the spatial distribution of these topographic features, and the central plots show the summarized percentage of the available area within a particular range of each topographic feature on the west and east shores.
Remotesensing 14 05441 g003
Figure 4. Distribution of area with specific slope and orientation combinations regarding the available area (left panel), the area occupied by mussels (central panel), and the corresponding occupation rate (%) (right panel) along the intertidal zone from the west and east shores in June 2019.
Remotesensing 14 05441 g004
Figure 5. Mussel occupation distribution (June 2019) in the west and east rocky shores in Le Petit Minou, France. Inset images from the west (top panels) and east shores (bottom panels) show the resultant identification of mussel aggregations from orthomosaics. Yellow squares indicate the location of inset images.
Remotesensing 14 05441 g005
Figure 6. Mussels’ occupation rate (%) (vertical bars) and mean immersion time (%) (continuous black line) along the intertidal height gradient on the west and east shores.
Remotesensing 14 05441 g006
Figure 7. Mean mussel occupation rate (%) on microhabitats with different slope angles depending on the primary orientation (color line) and intertidal height (panels) on the west (A) and east shores (B).
Remotesensing 14 05441 g007aRemotesensing 14 05441 g007b
Table 1. Overall accuracy and Kappa index showing the performance of the supervised classification results performed for each rocky shore.
Rocky ShoreOverall Accuracy (%)Kappa Index
West0.980.93
East0.930.80
Publisher’s Note: MDPI stays neutral with regard to jurisdictional claims in published maps and institutional affiliations.

