Abstract
Urban green space (e.g., parks, farmland, gardens, etc.) design in different urban functional regions (e.g., residential land, commercial land, etc.) depends on different planning purposes. The changes in urban green spaces are highly related to urban land-use changes (e.g., from residential land to commercial land). However, the investigation of urban green space patterns in response to urban land-use changes has been ignored. This research takes Hangzhou city, a typical example in terms of urbanization, population growth, economic development, and land-use changes, as the study site, aiming to explore the landscape patterns of urban green space changes with different urban land-use changes. The results showed that urban green spaces increased from 2017 to 2021, and the growth was mainly concentrated in the urban core area, indicating that the city has made remarkable achievements in the planning of green spaces. Specifically, the increase in urban green spaces in the first ring belt was mainly related to the old town transformation program in the residential land. The change from the residence parcels to the business parcels determined the increase in green spaces in the second and third ring belts, probably because of the attractiveness of customers. In addition, a large number of open-space parcels have changed to business parcels around the urban periphery, which might be due to the transformation from farmland to impervious surfaces. Combined with the urban land-use and green-space policies, the findings highlighted that a reasonable urban land-use layout can promote the optimization and layout of urban green spaces. The private sector (e.g., shopping malls) can also contribute to the increase in green spaces. The understanding of urban green landscapes with different urban land-use changes can provide references for analyzing and optimizing green space in other cities experiencing rapid urban land-use changes.
1. Introduction
According to the UN Department of Economic and Social Affairs (UNDESA), Sustainable Development Goal (SDG) 11.7 aims to provide universal access to accessible urban green spaces [1,2,3]. Upgrading poor-quality urban green-space landscapes, especially for undeveloped regions, is thus needed. The urban green-space planning and management of most regions in China are still at the initial stages and have ample space for further improvement [4,5]. Large and medium-sized cities have an advantage in terms of governmental support, economic investment, and practical research for green-space planning and management [6,7]. For instance, Hangzhou has dedicated itself to protecting urban green space to realize sustainable development [8,9]. Urban land use and greening policies such as “the old town transformation” and “Hangzhou urban green space system plan” are formulated to develop urban green-space landscapes [10]. The understanding of urban green-space patterns in response to urban land-use changes in these cities is valuable for guiding small cities to improve their urban green-space system.
Urban green space refers to all urban land covered by vegetation of any kind, e.g., parks, forests, farmland, and gardens [11,12]. It contains a variety of benefits including physical health benefits, psychological health benefits, socioeconomic benefits, and environmental benefits [12,13,14,15]. For instance, the increasing area of urban green space is highly correlated with the reduction in urban heat islands (UHIs) [16]. Moreover, there is a strong correlation between urban green space quantity and gross domestic product [17]. The rapid urbanization in China significantly affects urban green-space patterns, causing an increase in exposure to the ecosystem and environmental hazards (e.g., urban heat islands, urban flooding, urban heat waves) [18,19,20].
Previous efforts mainly focused on the investigation of urban green-space patterns in response to urban land-cover changes (i.e., physical aspects of urbanization) [21]. However, few studies have examined the urban green-space patterns with urban land-use changes (e.g., socioeconomic aspects of urbanization). In this context, this research first obtained the urban land-use maps in 2017 and 2021 based on a random forest (RF) classifier by integrating the OpenStreetMap (OSM) road network, 10 m Sentinel-2A images, and points of interest (POI). Then, we calculated the normalized difference vegetation index (NDVI) index of Gaofen-2 images to extract the urban green space information from 2017 and 2021. Finally, we investigated the landscape patterns of urban green spaces with different urban land-use changes by comprehensive analysis (e.g., landscape analysis, hotspot analysis, and green-space ratio analysis). The integration of approaches focusing on different perspectives can provide a more holistic view of understanding the urban green-space changes and responses to the urban green-space changes.
2. Materials and Methods
2.1. Study Site
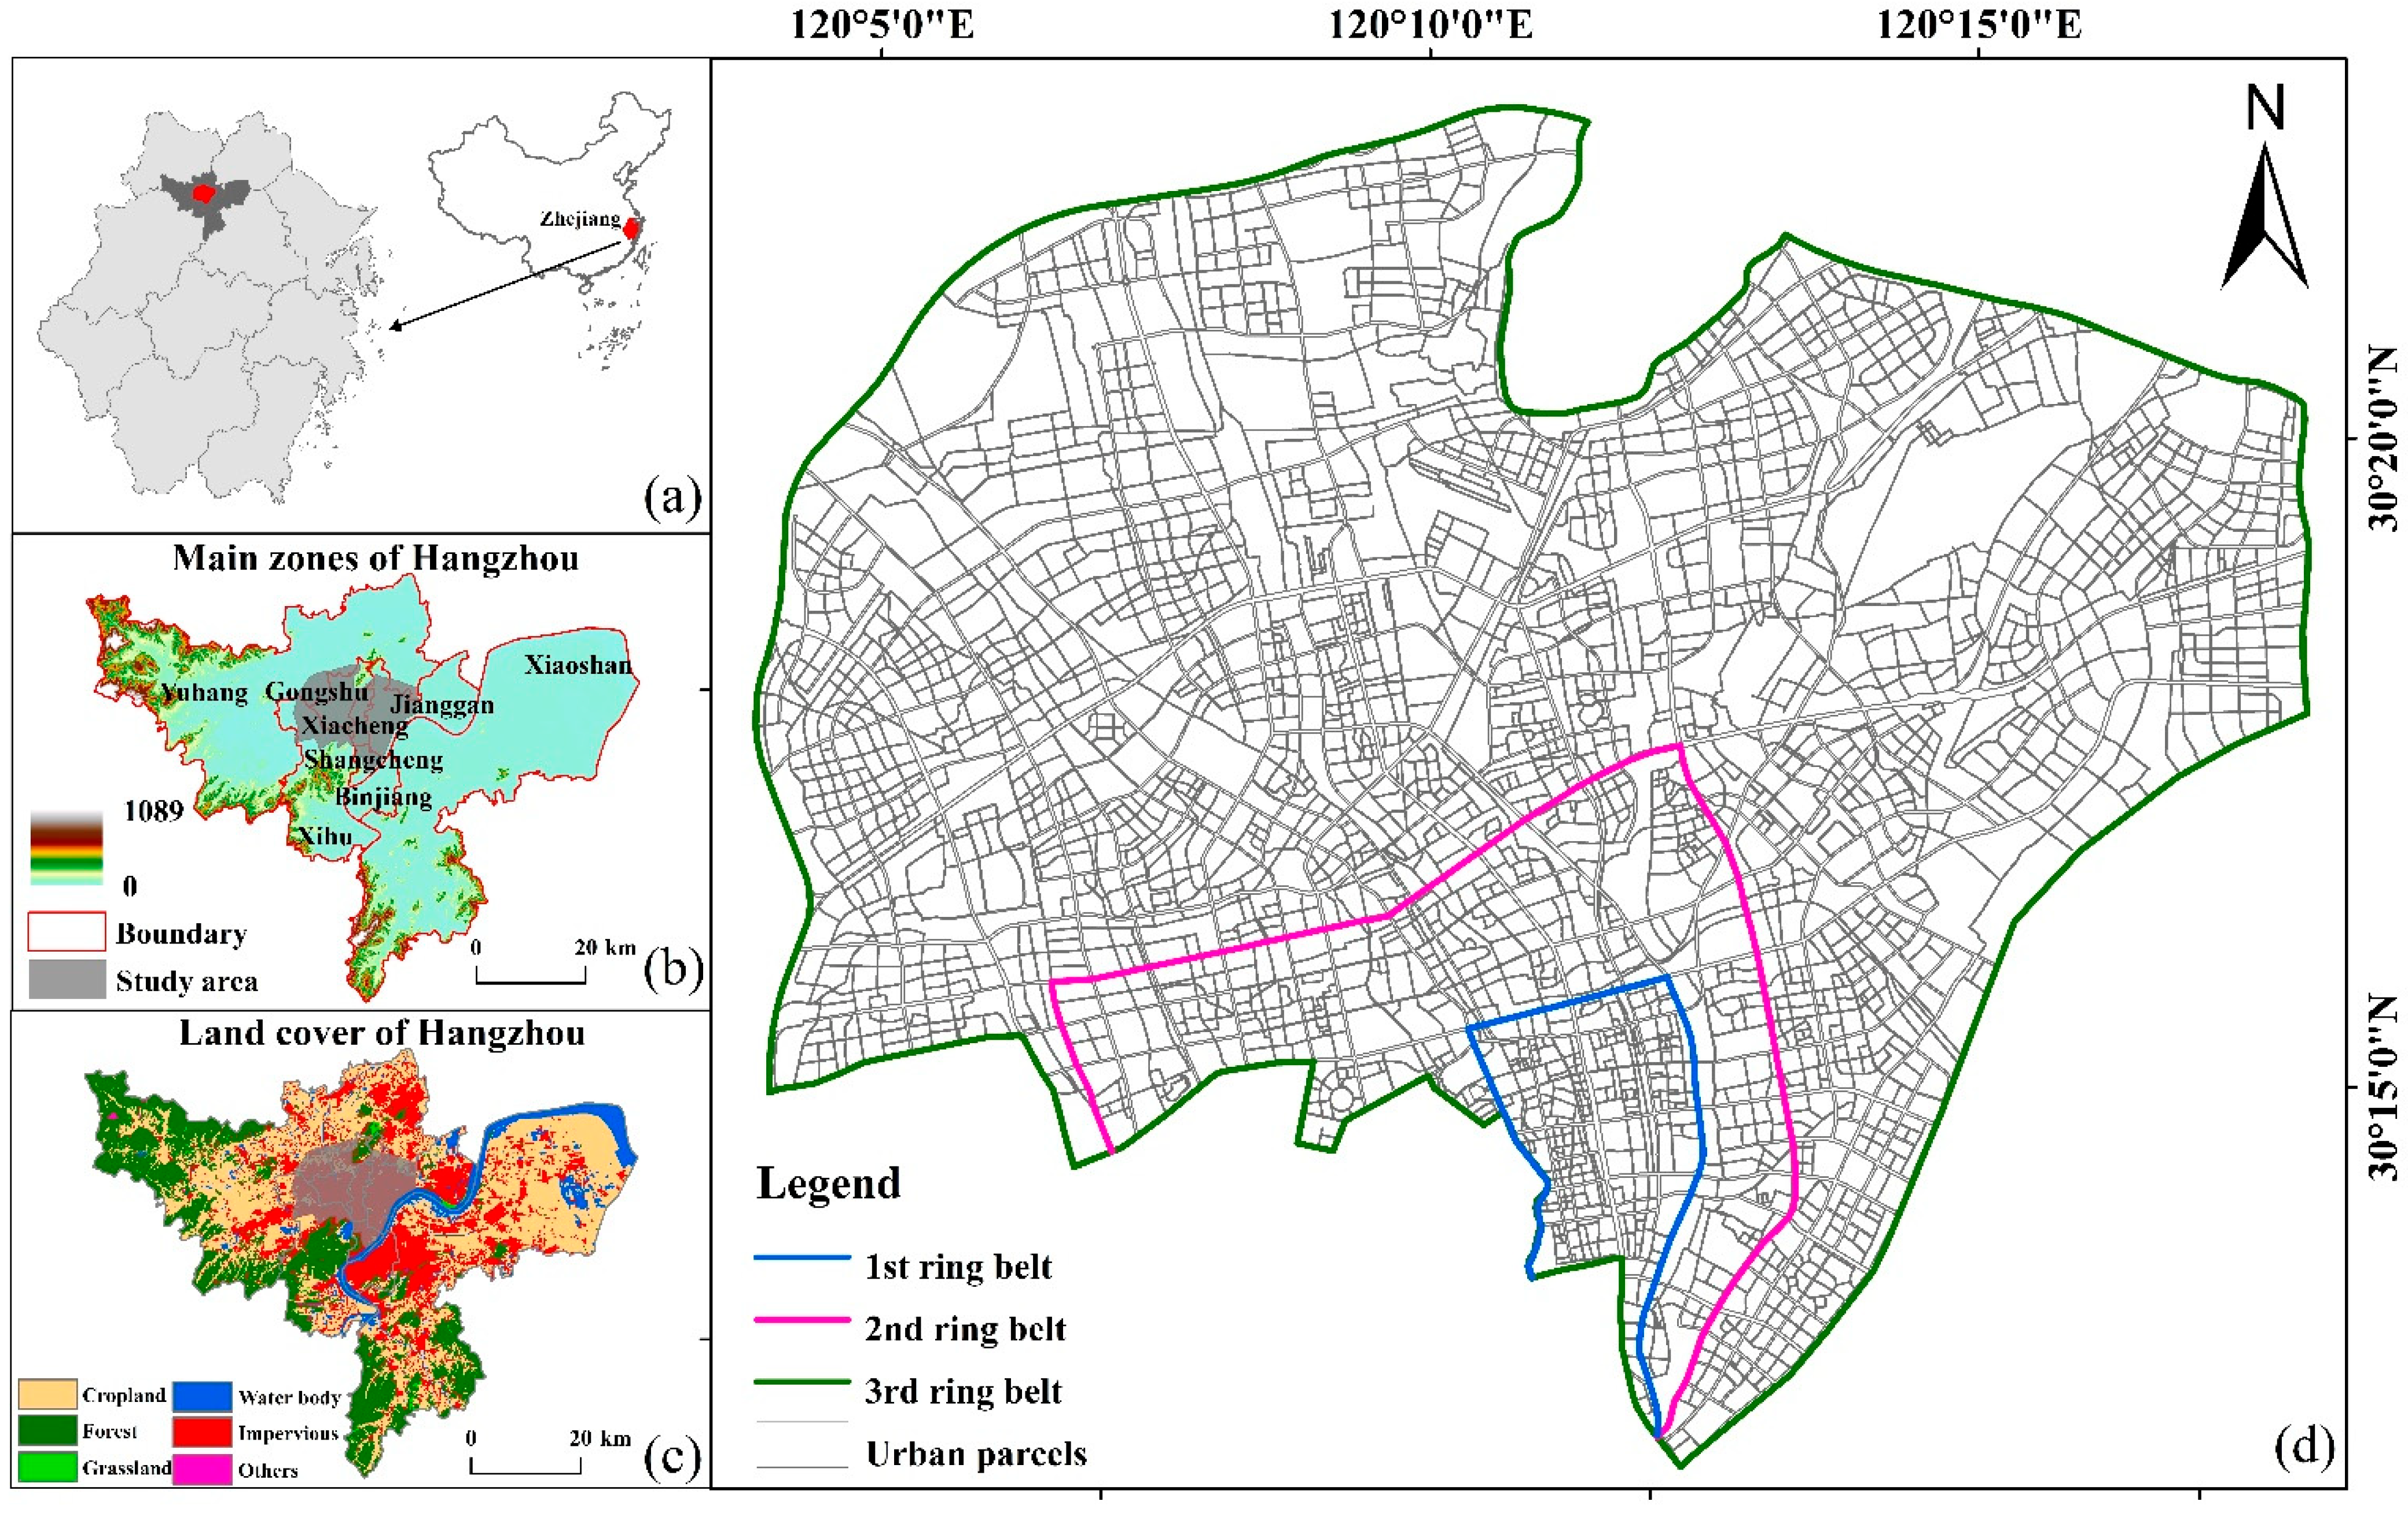
Hangzhou is located in the northwestern part of Zhejiang province, which plays a significant role in the Yangtze River Delta Urban Agglomeration in East China. Hangzhou comprises 10 districts, 1 county-level city, and 2 counties. This study only focuses on the most central urban districts, which are Shangcheng District, Gongshu District, and part of Xihu District. This research selects the area surrounded by the third ring (i.e., the Hangzhou belt highway) as the study site (Figure 1). The study area was divided into three units including the 1st ring belt, 2nd ring belt, and 3rd ring belt for further analysis. The population in this region accounts for 45% of the total population in Hangzhou city, which is one of the most representative regions of urban land-use change and socioeconomic development [22,23]. In the past three decades, large amounts of farmland and bareland around the urban periphery changed to construction land, inspired by rapid urbanization [24]. On the other hand, large amounts of green spaces including vertical and horizontal green spaces in internal urban zones are gradually increasing.
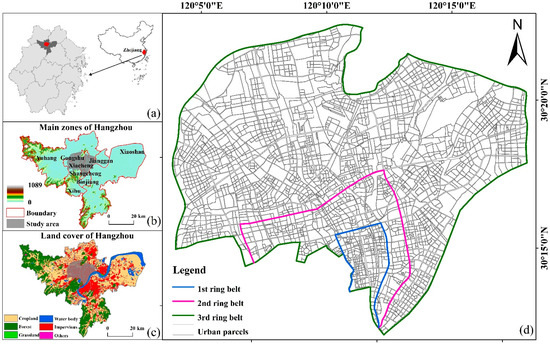
Figure 1.
Study area. (a) Location of the study area; (b) DEM of Hangzhou city; (c) land cover of Hangzhou city; (d) urban parcels of the study area.
2.2. Datasets
2.2.1. Gaofen-2 Images
GF-2 images were produced by the China Academy of Space Technology, with a Ground Sampling Distance of 0.81 m in panchromatic and 3.24 m in multispectral bands on a swath of 45 km [23]. GF-2 imagery is an ideal data source for urban green-space classification. This research uses two scenes of GF-2 high-resolution images in Hangzhou, which were acquired on 10 October 2017 and 27 September 2021, respectively. Both scenes were preprocessed with a quick atmospheric correction method and geometrical rectification in ENVI 5.3.
2.2.2. Sentinel-2A Images
Sentinel-2 is a high-resolution (10 m), multi-spectral, remote-sensing satellite [25]. We selected Sentinel-2A Level 1C images, from 1 January 2017 to 31 December 2017 and from 1 January 2021 to 31 August 2021, for urban land-use classification. The dataset has been processed with radiometric and geometric corrections, which are available from the Google Earth Engine (GEE) cloud computing platform [26].
2.2.3. OpenStreetMap (OSM) Network Data
The OSM road network data has been utilized as a promising dataset for capturing urban functional patterns [27,28,29]. The OSM road network data are in vector format and contain different classes of roads with different road sizes [30]. This research utilized 2021 OSM road network data to delineate the urban parcels in urban land-use mapping. We further manually checked the OSM road network data to guarantee the accuracy of the mapping results.
2.2.4. Points of Interest (POI) Data
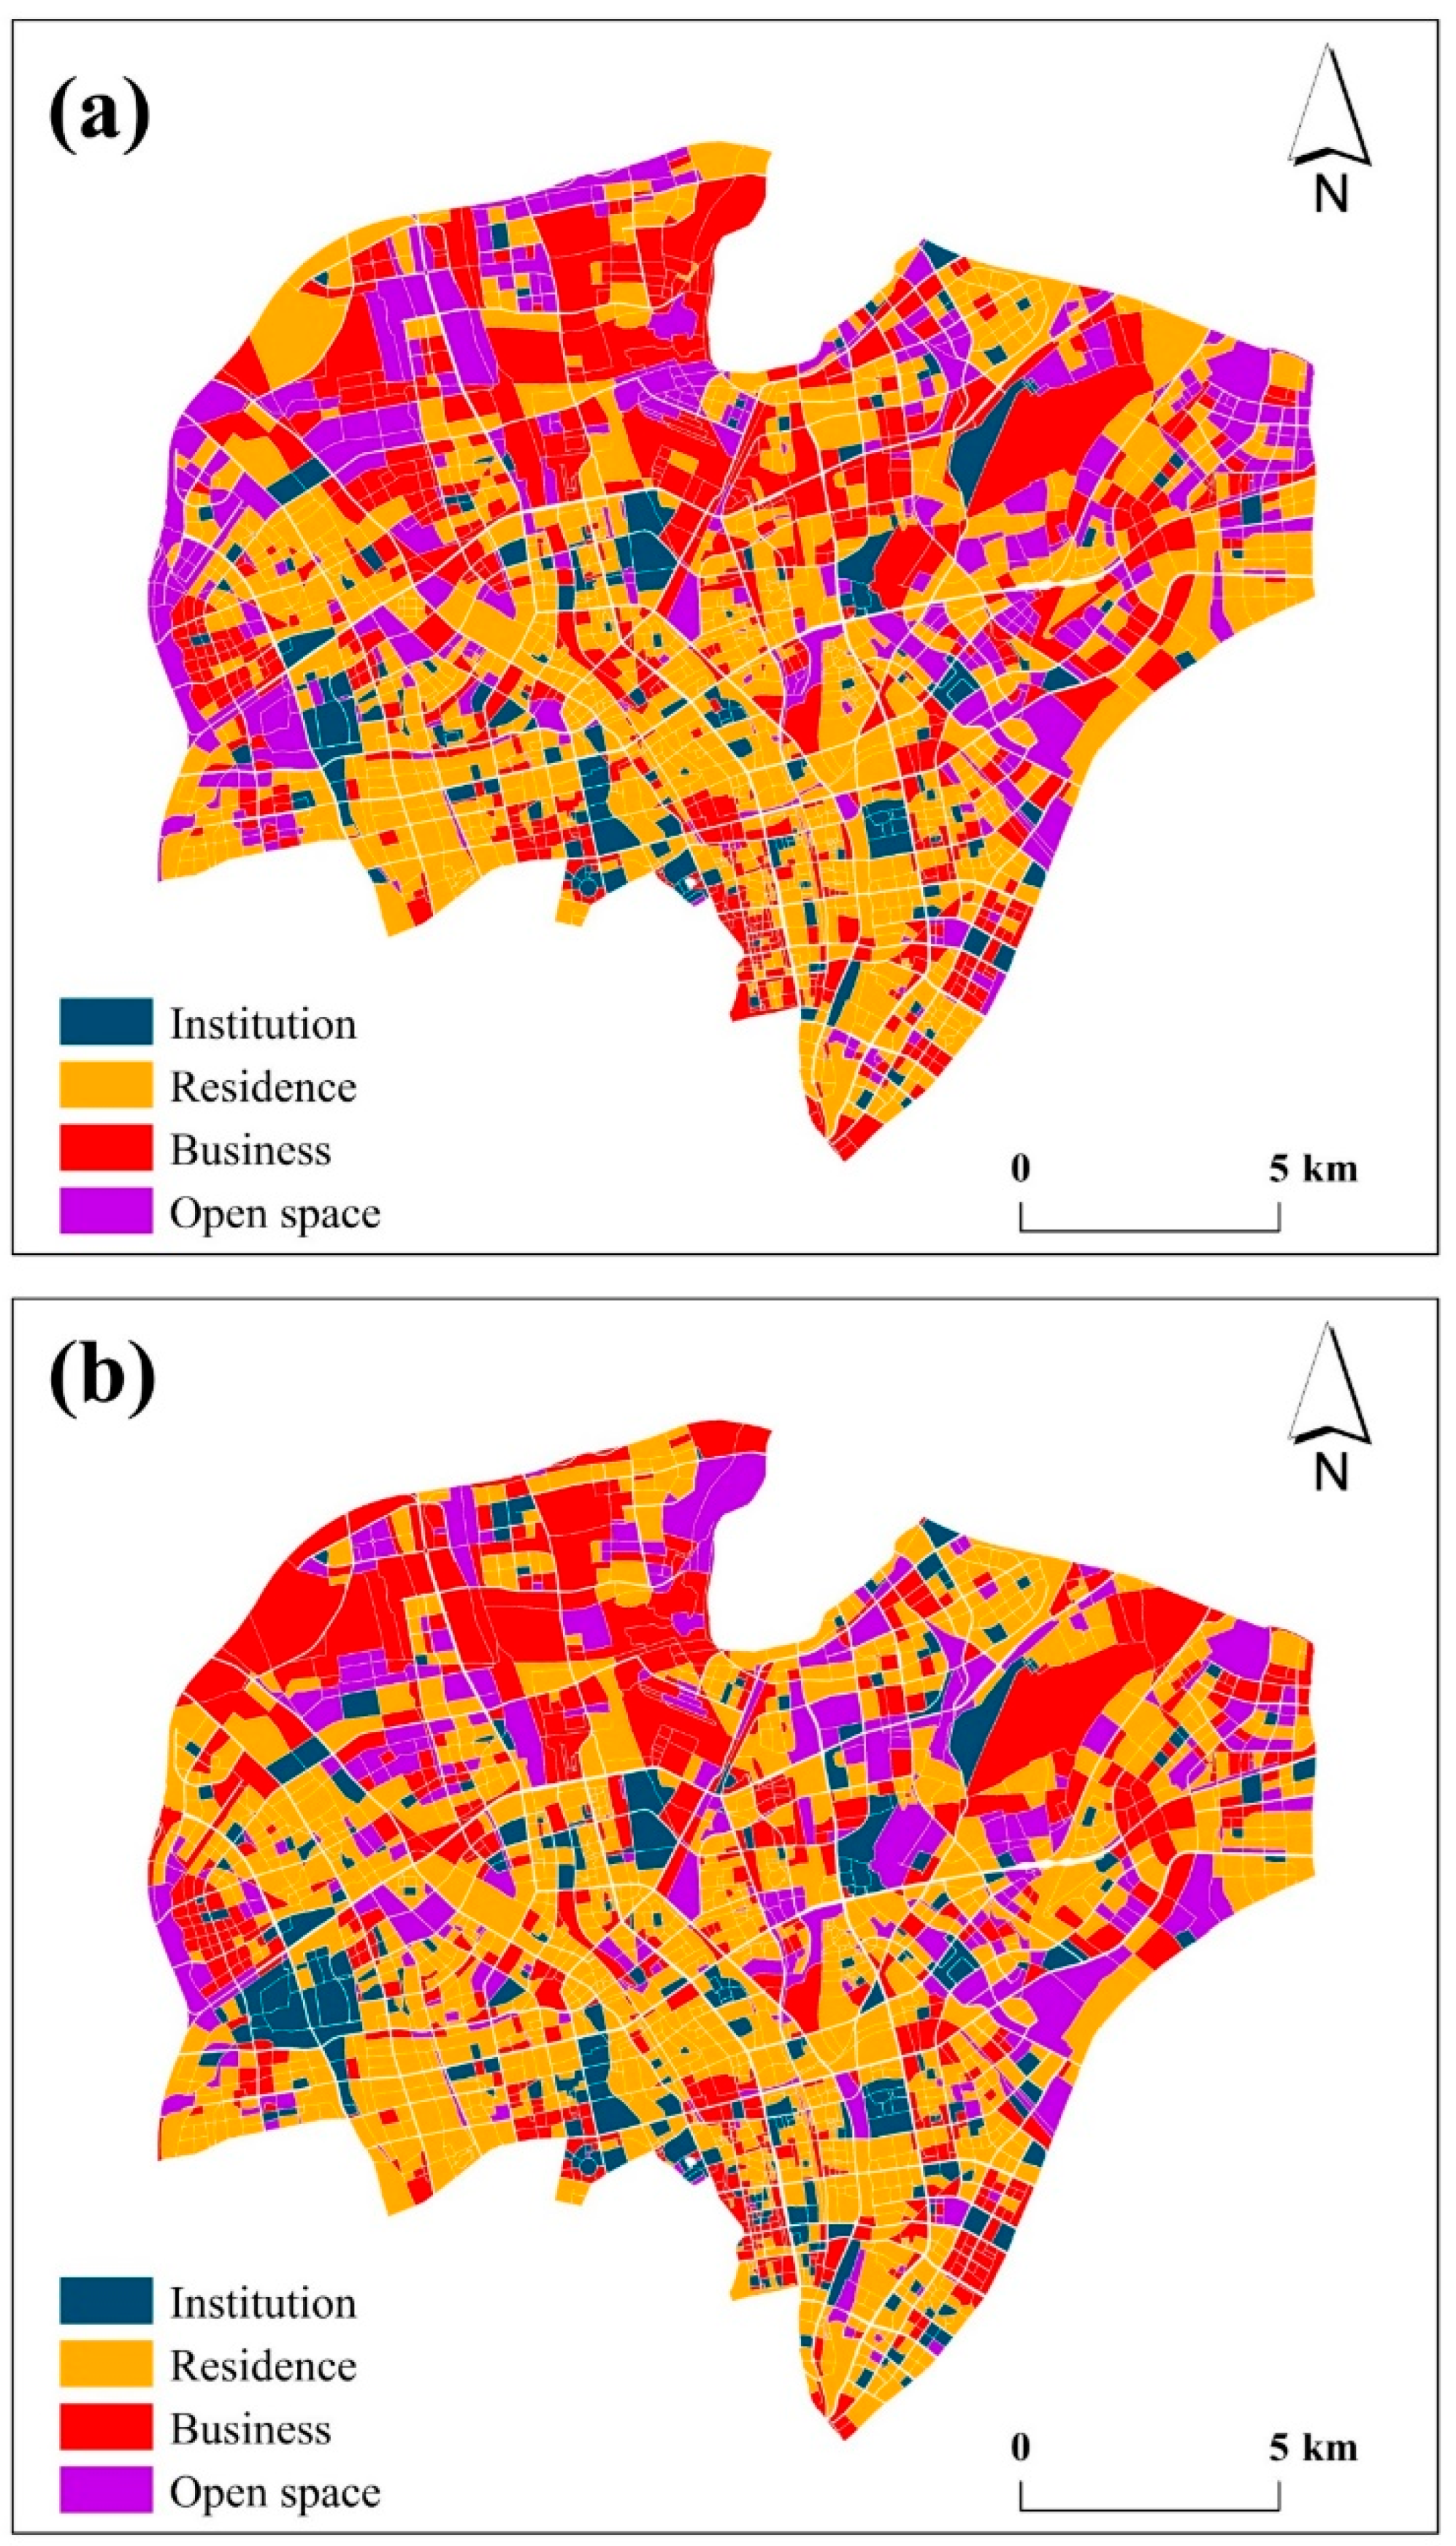
POIs are the basis for most of the data supporting location-based applications. POIs contain abundant information, including land-use category geographic locations, and other features (e.g., address, telephone, and postcode) [31,32]. This research utilized POIs in 2017 and 2021 for mapping urban land-use maps in Hangzhou city. We further merged the classification system into four urban land-use types, namely, institution, residence, business, and open space. These are used for analysis for two reasons: (1) they represent the most important socioeconomic activities of Hangzhou city, and (2) the green spaces in these urban land-use types played important social, environmental, and ecological roles for urban residents. In this research, the open-space parcels mainly include bare lands, farmlands, parks, squares, and unused lands. We included farmland within the confines of urban green space because farmland can also provide ecological and environmental benefits to cities. In addition, there is a large amount of farmland at the edge of the study area, and its land-use change has an important impact on green-space research.
2.3. Methods
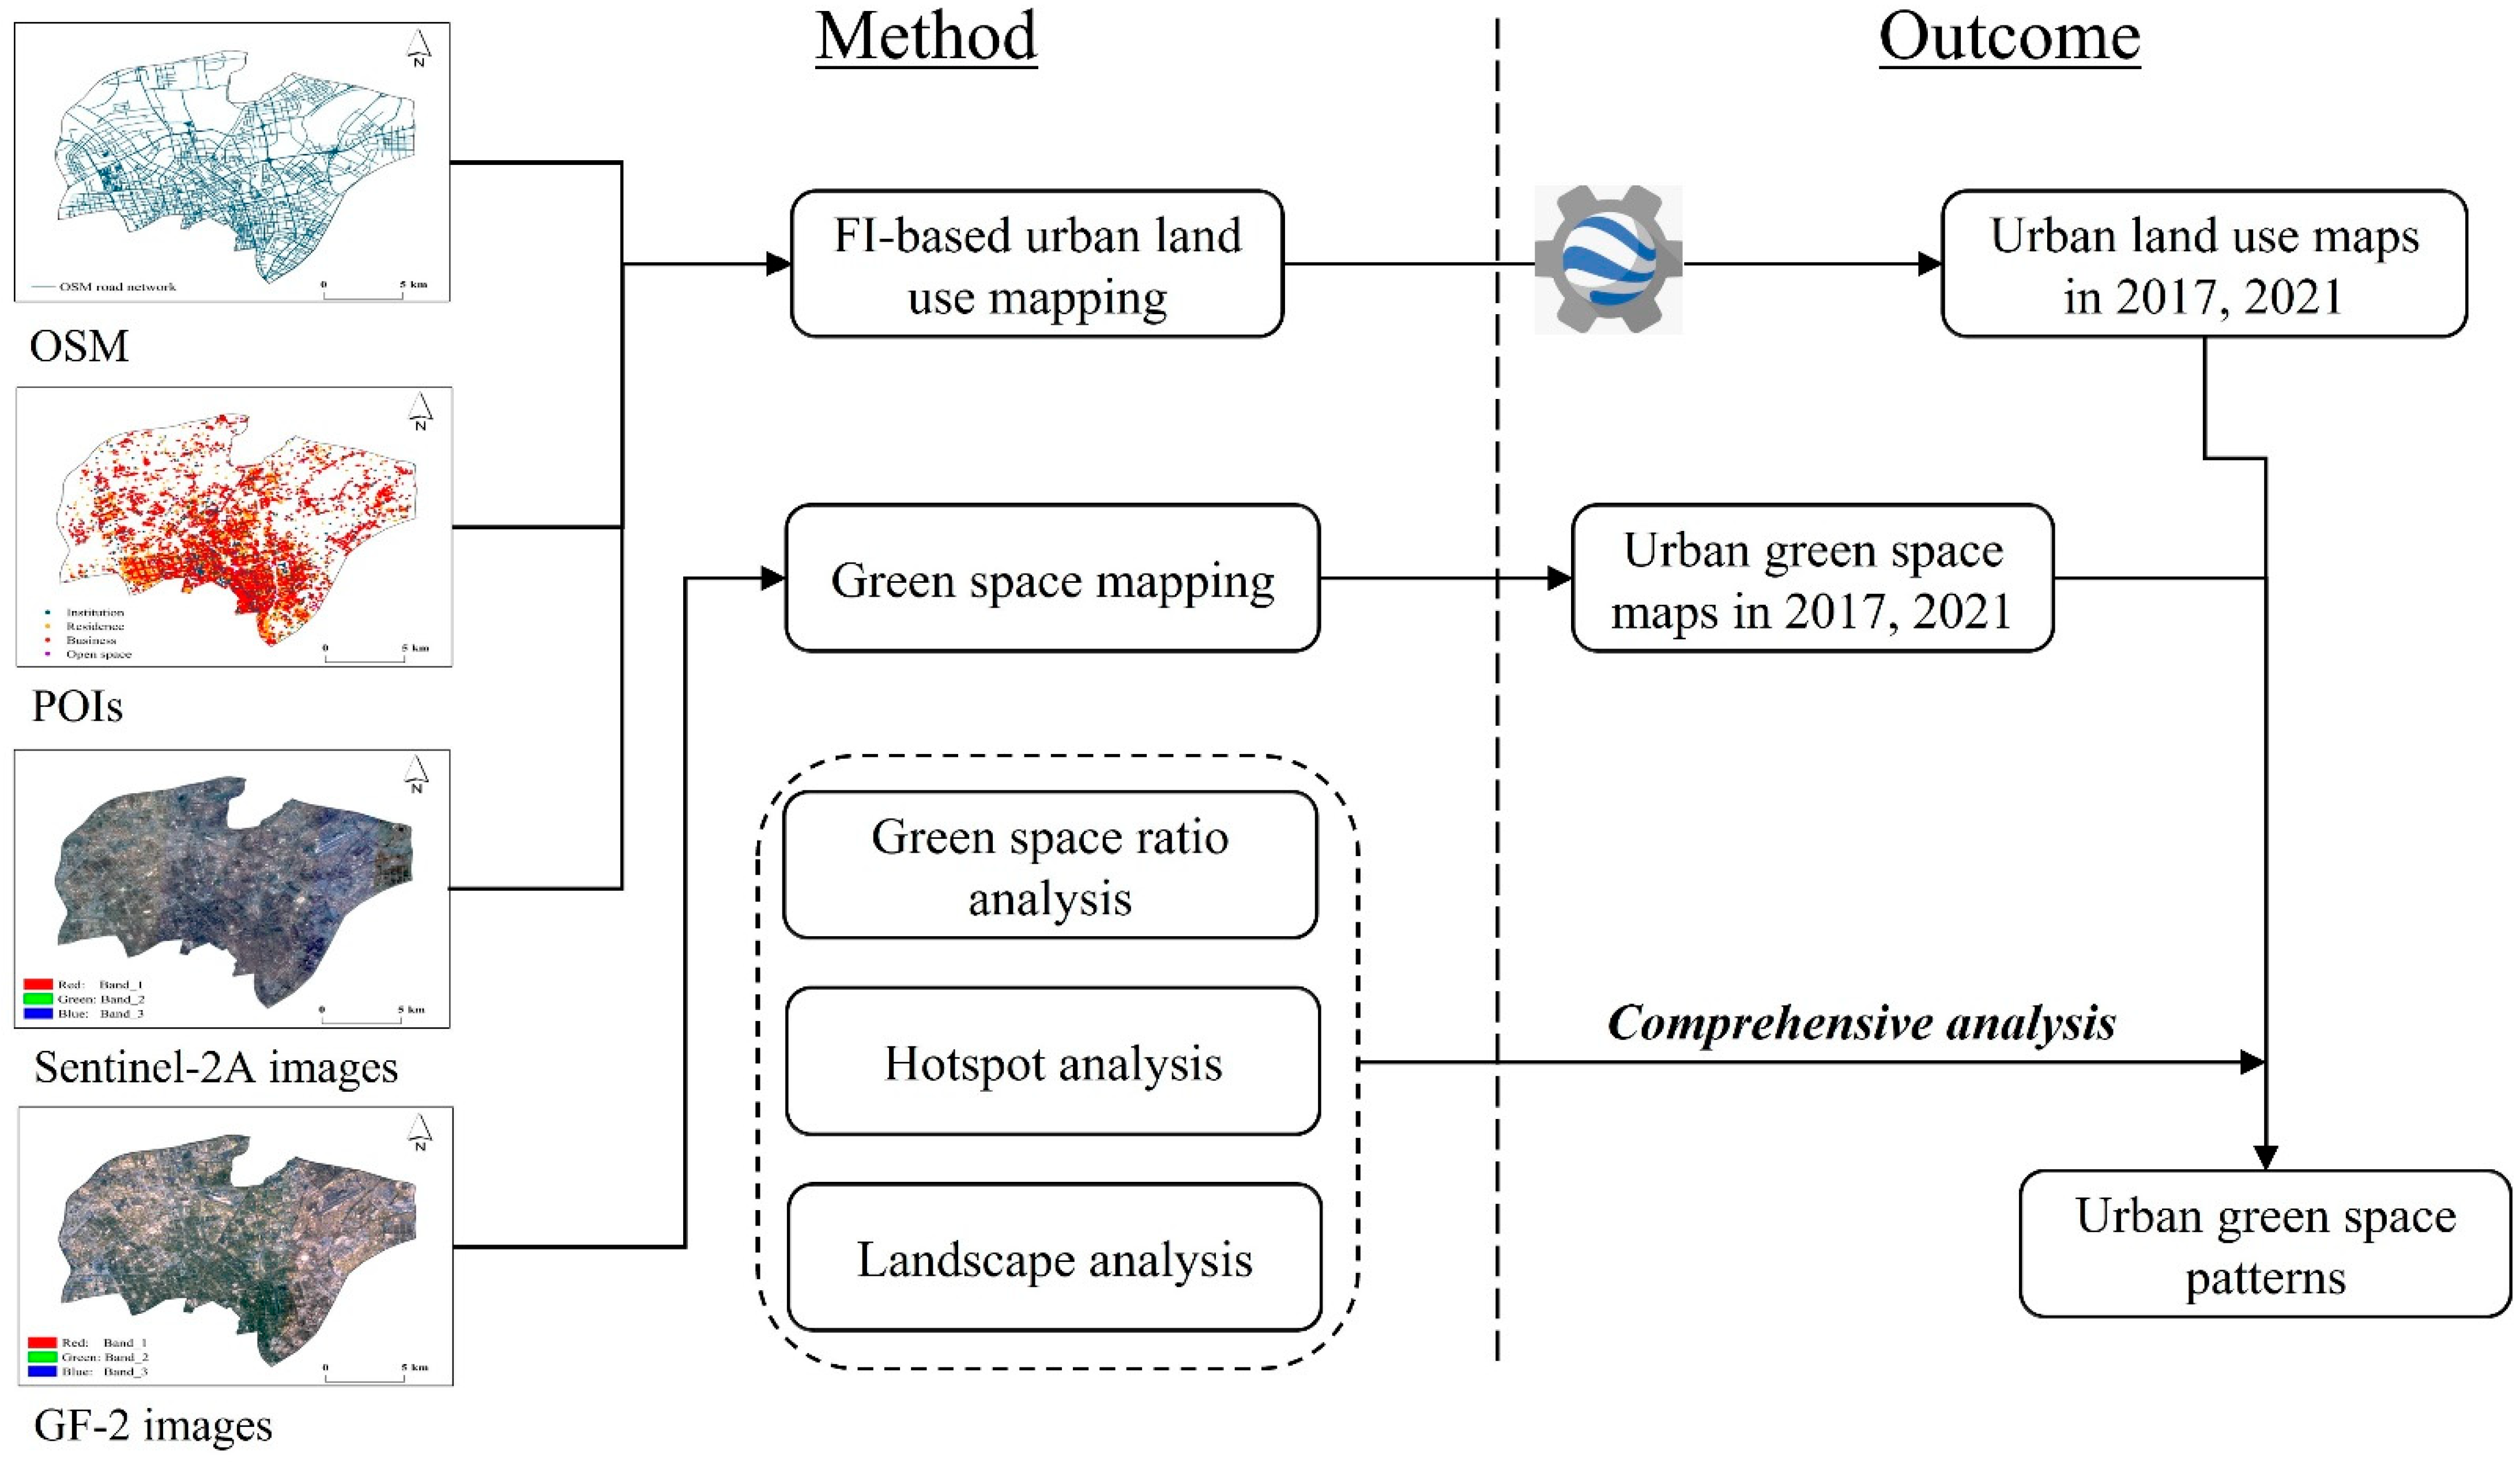
This research first categorized urban land use into institution, residence, business, and open space in Hangzhou city. Then, we extracted the urban green space information by calculating the NDVI index. Lastly, this research overlaid the urban land-use maps and urban green-space maps to investigate the changes in urban green-space patterns by integrating statistical analysis (e.g., green-space ratio), geospatial analysis (e.g., hotspot analysis), and landscape analysis (e.g., landscape metrics) (Figure 2).
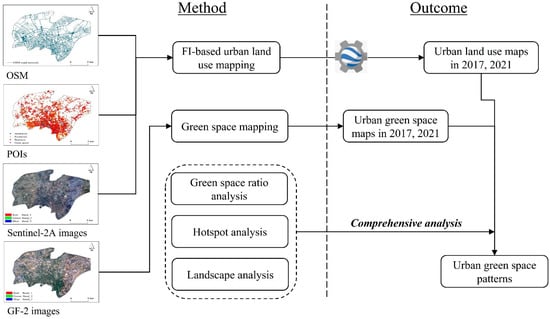
Figure 2.
Methodology workflow.
2.3.1. FI-Based Urban Land-Use Mapping
Urban land-use maps were produced by using the feature integration (FI) approach [33,34] (Figure 3). The FI-based method was used to classify urban land-use categories by integrating 18 remote sensing (RS) and geospatial big data (GBD) features based on the random forest (RF) classifier (see the Supplementary Materials). Specifically, this research utilized Sentinel-2A images, OSM road network data, and POIs for urban land-use mapping.

Figure 3.
Urban land-use maps: (a) 2017 urban land-use map; (b) 2021 urban land-use map.
The unit of the urban land-use maps was parcel-based, according to the method of the automated identification and characterization of parcels (AICP) [27]. The OSM road network data were used to delineate the urban land-use parcels. It should be noted that the urban parcels used in 2017 were the same as the urban parcels in 2021 to unify the basic units. The reason for this is that the 2021 OSM road network was developed based on the 2017 OSM road network according to the OSM operating system.
All the operations in the FI-based classification were realized using the GEE platform. We selected the training and testing samples by using the Baidu map, Baidu street view, and a field survey. This research randomly selected 800 samples in 2021 and 800 samples in 2017 for training and testing (Supplementary Materials). The 2017 and 2021 urban land uses were classified relatively well, with an estimated overall accuracy of 0.817 ± 0.032 and 0.802 ± 0.034, respectively (Supplementary Materials). We further checked the 2017 and 2021 urban land-use maps by visual interpretation to obtain high-accuracy products.
2.3.2. Green-Space Mapping
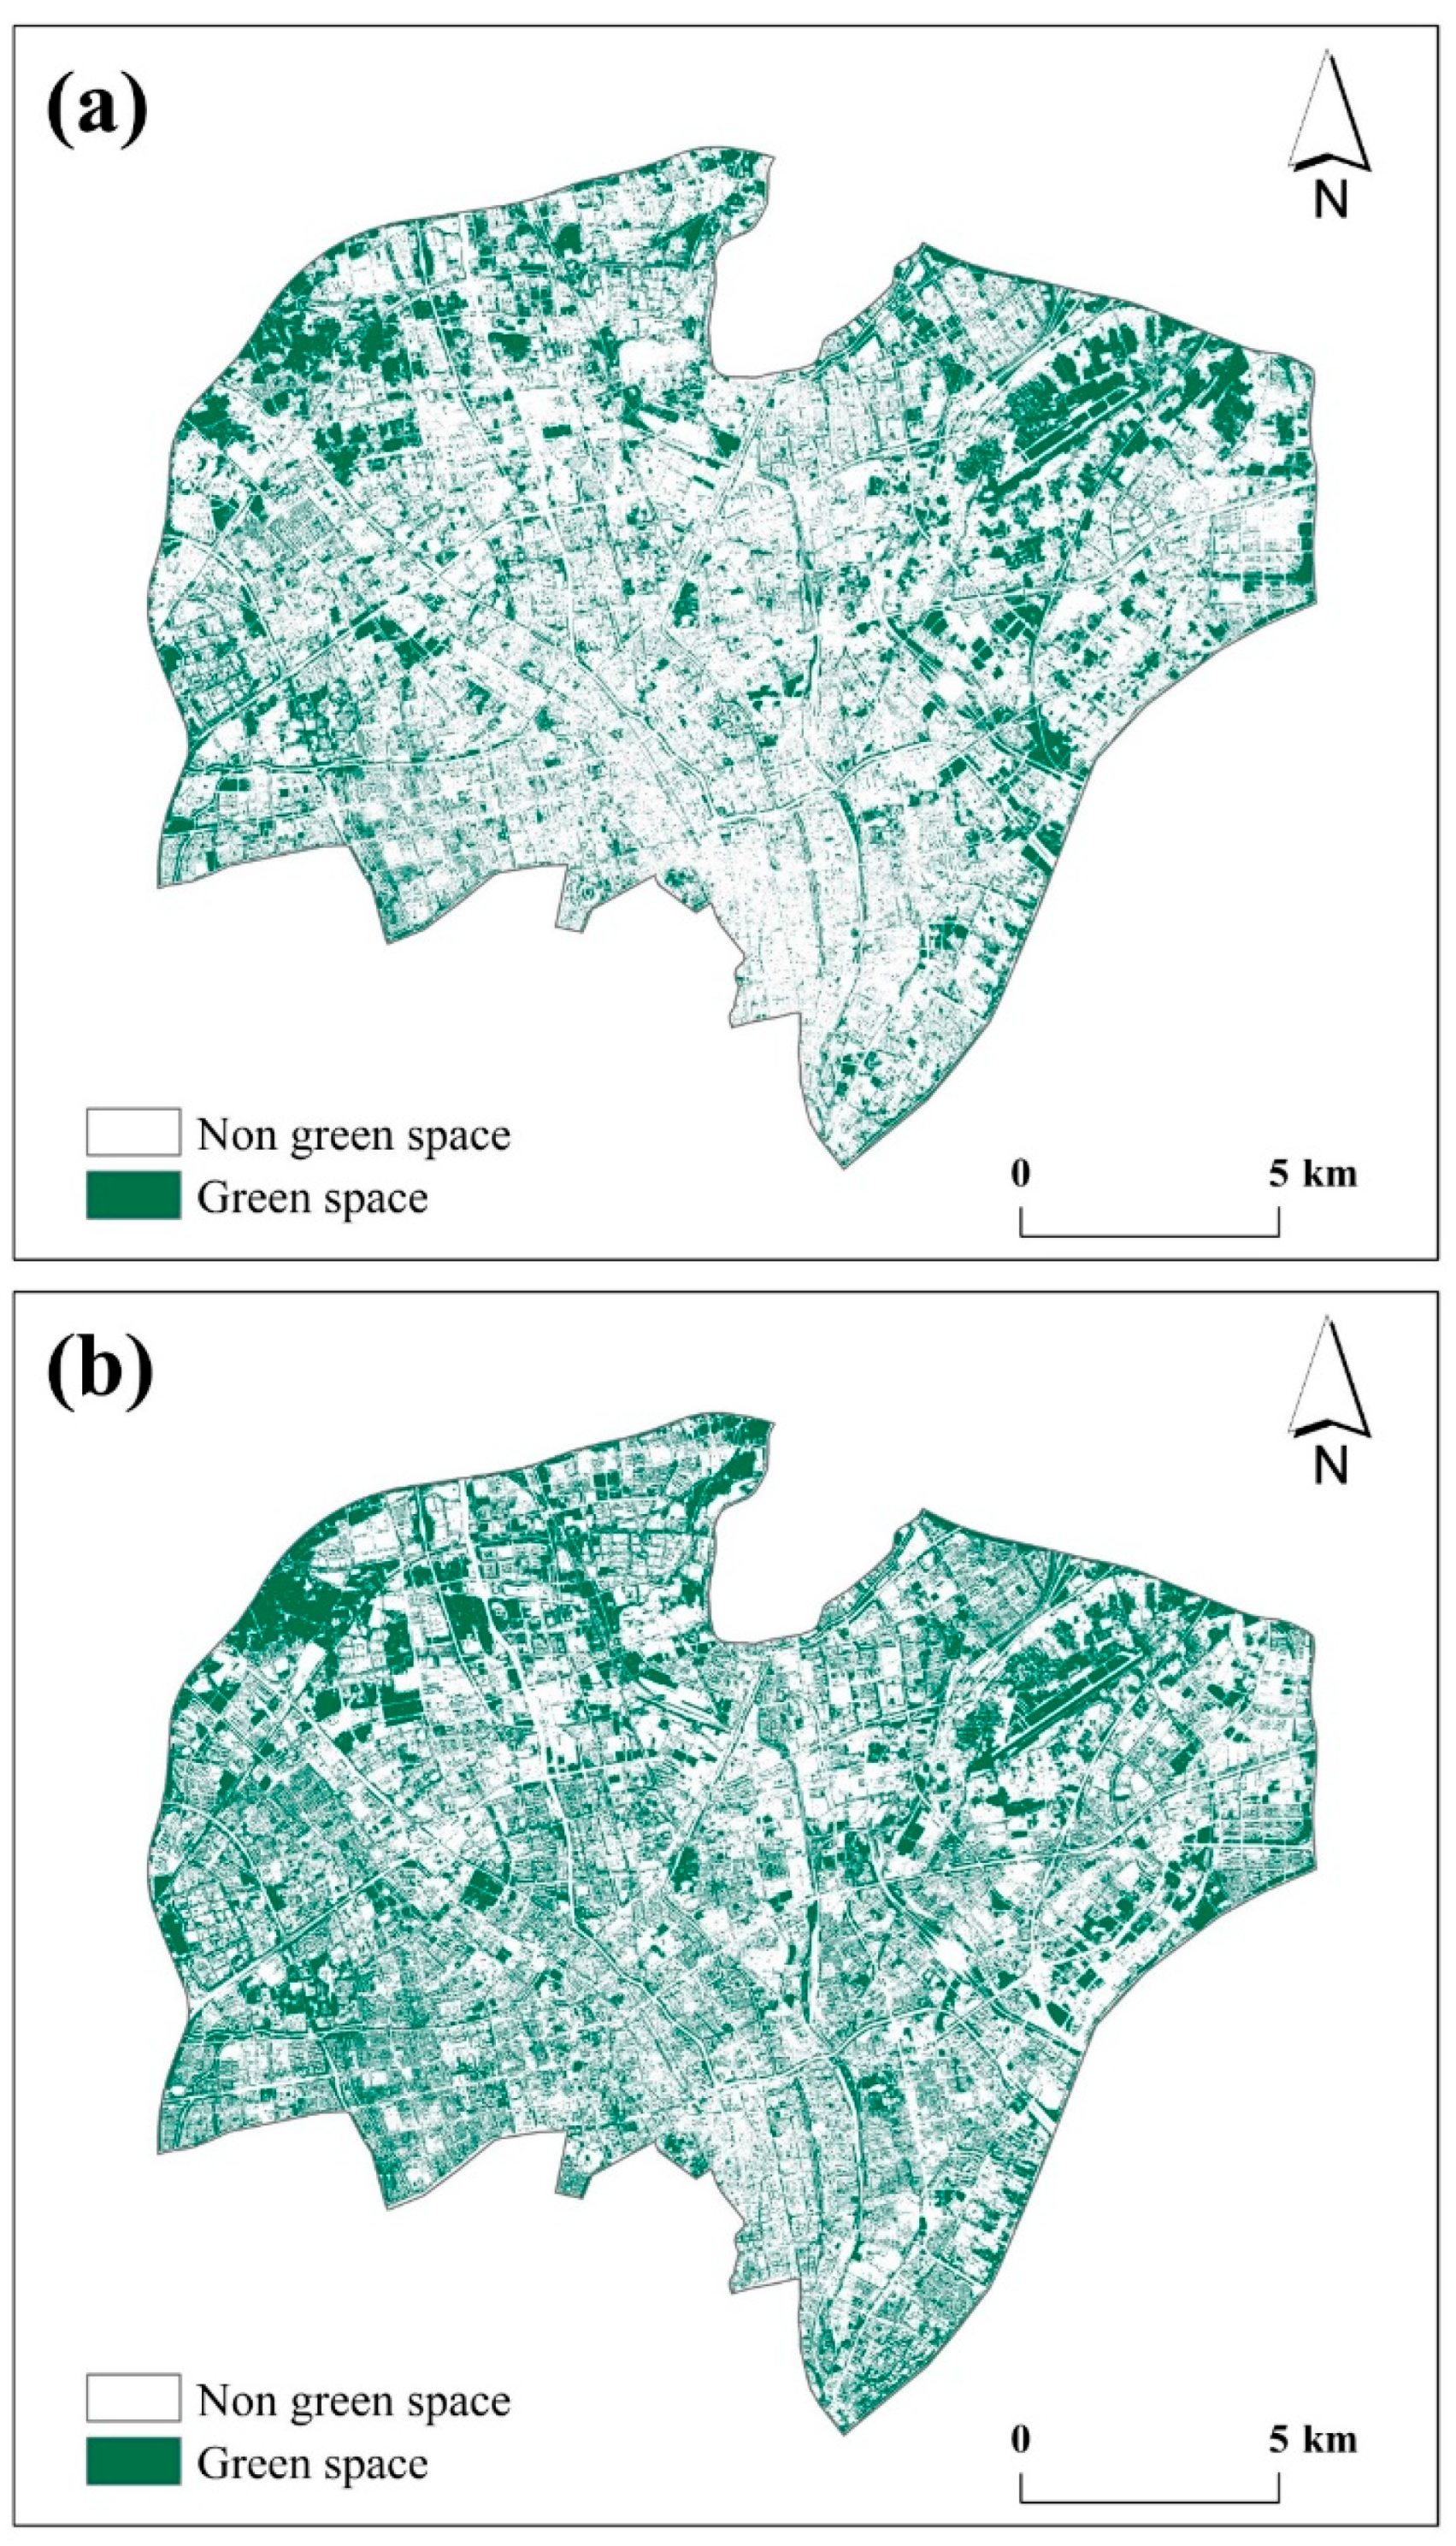
This research maps urban green space by calculating the normalized difference vegetation index (NDVI) of GF-2 high-resolution images (Figure 4).
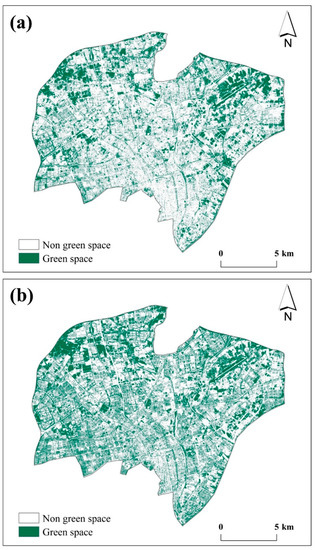
Figure 4.
Urban green-space maps: (a) 2017 urban green-space map; (b) 2021 urban green-space map.
NDVI has proven to be one of the most effective indices for classifying green space since green spaces absorb most of the red light that hits them while reflecting much of the near-infrared light [35,36]. The NDVI index is calculated using an equation, as follows:
where NIR represents the near-infrared channel and RED is the red channel. The result for the calculation of NDVI generally ranges from (−1, 1). A higher number of NIR means a higher possibility of urban green spaces. A careful investigation of the NDVI outputs with GF-2 images on the background revealed the fact that all green-covered areas in the study area had NDVI values above 0.52 in 2017 and 0.48 in 2021. Thus, keeping 0.52 and 0.48 as the thresholds, the urban green spaces were extracted, i.e., all pixels having an NDVI of 0.52 and above were classified as urban green spaces in 2017 and the pixels having an NDVI of 0.48 and above were classified as urban green spaces in 2021. The accuracy assessment was carried out using a random sampling strategy. The test samples were selected by visual interpretation based on Google Earth. Following the approach discussed by Stehman and Foody [37], this research randomly selected 1000 samples in 2017 and 1000 samples in 2021 for testing from the list of points (see the Supplementary Materials). The 2017 and 2021 urban green spaces were classified relatively well, with an estimated overall accuracy of 0.967 ± 0.012 and 0.977 ± 0.010, respectively (Supplementary Materials).
2.3.3. Comprehensive Analysis
- (1)
- Green-space ratio analysis
The index is defined as the ratio of an area covered by vegetation to the whole area. This research calculates the green-space ratio in different urban land-use types (i.e., institution, residence, business, and open space) to capture the changes in urban green-space patterns with urban land-use changes from 2017 to 2021. The urban green-space ratio for the total area, 1st ring belt, 2nd ring belt, and 3rd ring belt are calculated, respectively.
- (2)
- Hotspot analysis
This research utilizes the Getis-Ord hotspot of the ArcGIS tool to identify the hotspots and coldspots of urban green spaces in different regions in Hangzhou city. Hotspot analysis utilizes a series of weighted features and identifies statistically significant hotspots and coldspots using Getis-Ord Gi* statistics, which calculates the GiZScore and GiPValue for the selected parameters [38]. Here, this research uses a percentage of confidence level above 90% to identify the hot/cold spots of urban green space.
- (3)
- Landscape analysis
Landscape metrics are often used to detect and quantify the landscape patterns of urban green spaces [39,40,41]. According to Table 1, this research selects six landscape metrics including four class-level metrics (i.e., patch density (PD), largest patch index (LPI), mean shape index (SHAPE_MN), and patch cohesion index (COHESION)) and two landscape-level metrics (i.e., contagion index (CONTAG) and Shannon’s Evenness Index (SHEI)) by referencing earlier work reported in many studies [42,43]. Among these, PD, LPI, and SHAPE_MN can represent the fragmentation and complexity of urban green-space patches [43,44]; COHESION could reflect the connectivity [45]; CONTAG presents the connectivity of the total landscape [46]; and SHEI presents the distribution of landscapes [47].

Table 1.
Description of the landscape metrics used in this study [48].
3. Results
3.1. Changes in Urban Green-Space Patterns
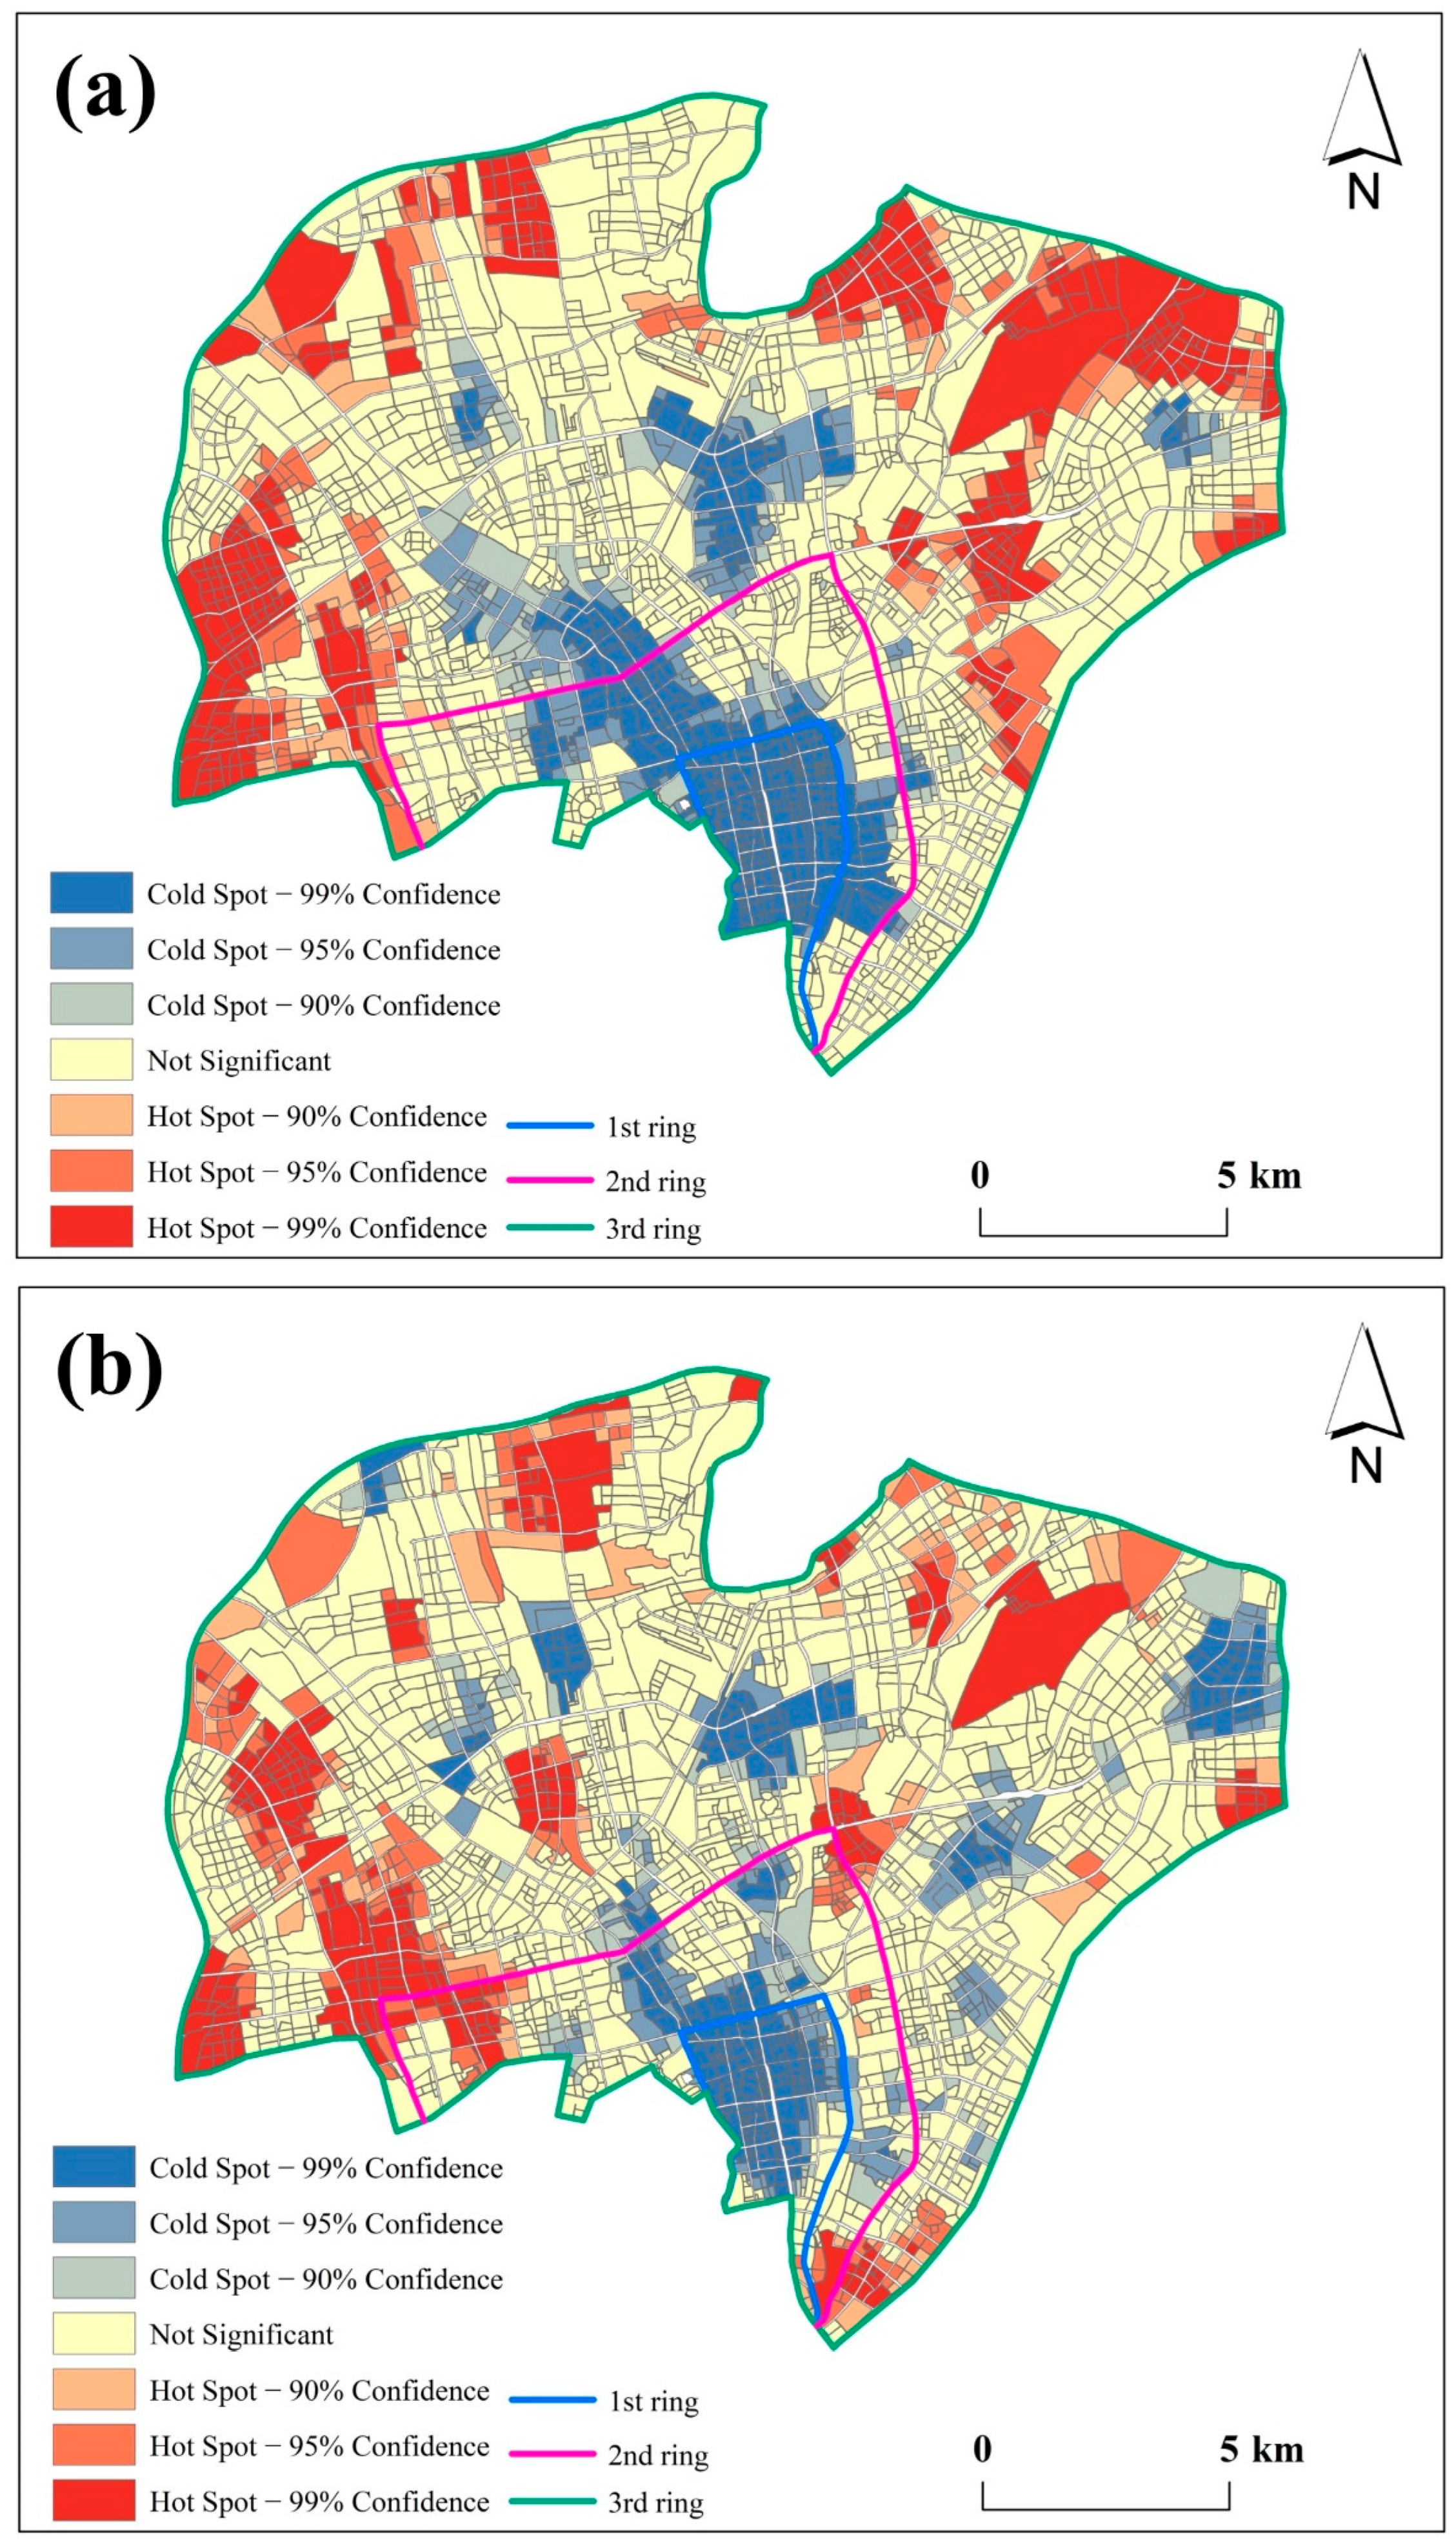
Figure 5a presents the hotspot analysis of the urban green spaces in Hangzhou city in 2017. The distribution of spatial clustering differed by region in the 2017 hotspots map. Specifically, the clusters of hotspots tended to occur in the urban periphery (i.e., third ring belt), except for the southern part of the city, while the coldspots of low-value regions were mostly found in the city center (i.e., first ring belt and second ring belt). Compared with the 2017 hotspots map, the number of high-value and low-value regions was more likely to undergo a greater change in the 2021 hotspots map (Figure 5b). It was found that the hot-/coldspots of urban green-space coverage are distributed more dispersedly. The clusters of hotspots increased in the second ring belt, and coldspots decreased in the first ring and second ring belt.
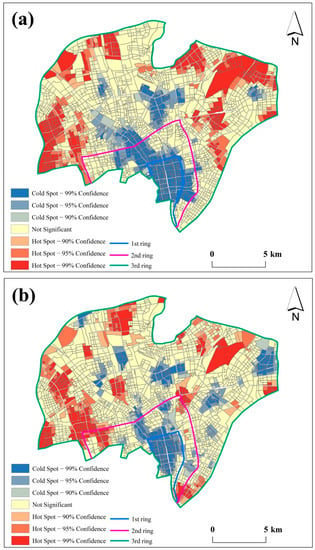
Figure 5.
Hotspot analysis of urban green-space patterns at ring levels in 2017 (a) and 2021 (b).
Referring to the urban land-use maps in 2017 and 2021, the decrease in urban greenspaces around the urban periphery was mainly due to the decrease in open-space parcels. During 2017 and 2021, a large amount of farmland was transformed into impervious surfaces for construction purposes, while the decrease in the coldspot regions in the city center is probably due to the increase in the institution and residence parcels. The residence and institution parcels have the potential to have a higher ratio of urban green space than other urban land-use categories. In addition, the increase in coldspots within the third ring belt is mainly attributed to the functional transformation of the urban parcels (e.g., the transformation from open space to residence). There will be fewer green spaces in the urban parcels under construction.
It is shown that the overall area of urban green space increased significantly from 67.19 km2 (29%) in 2017 to 86.63 km2 (38%) in 2021 (Table 2). Among different ring belts, the growing ratio of urban green-space patches in the first ring belt was the highest (14%), while the ratio of the increased urban green space in the third ring belt was the lowest (7%).

Table 2.
Analysis of urban green-space area and the ratio at ring levels in 2017 and 2021.
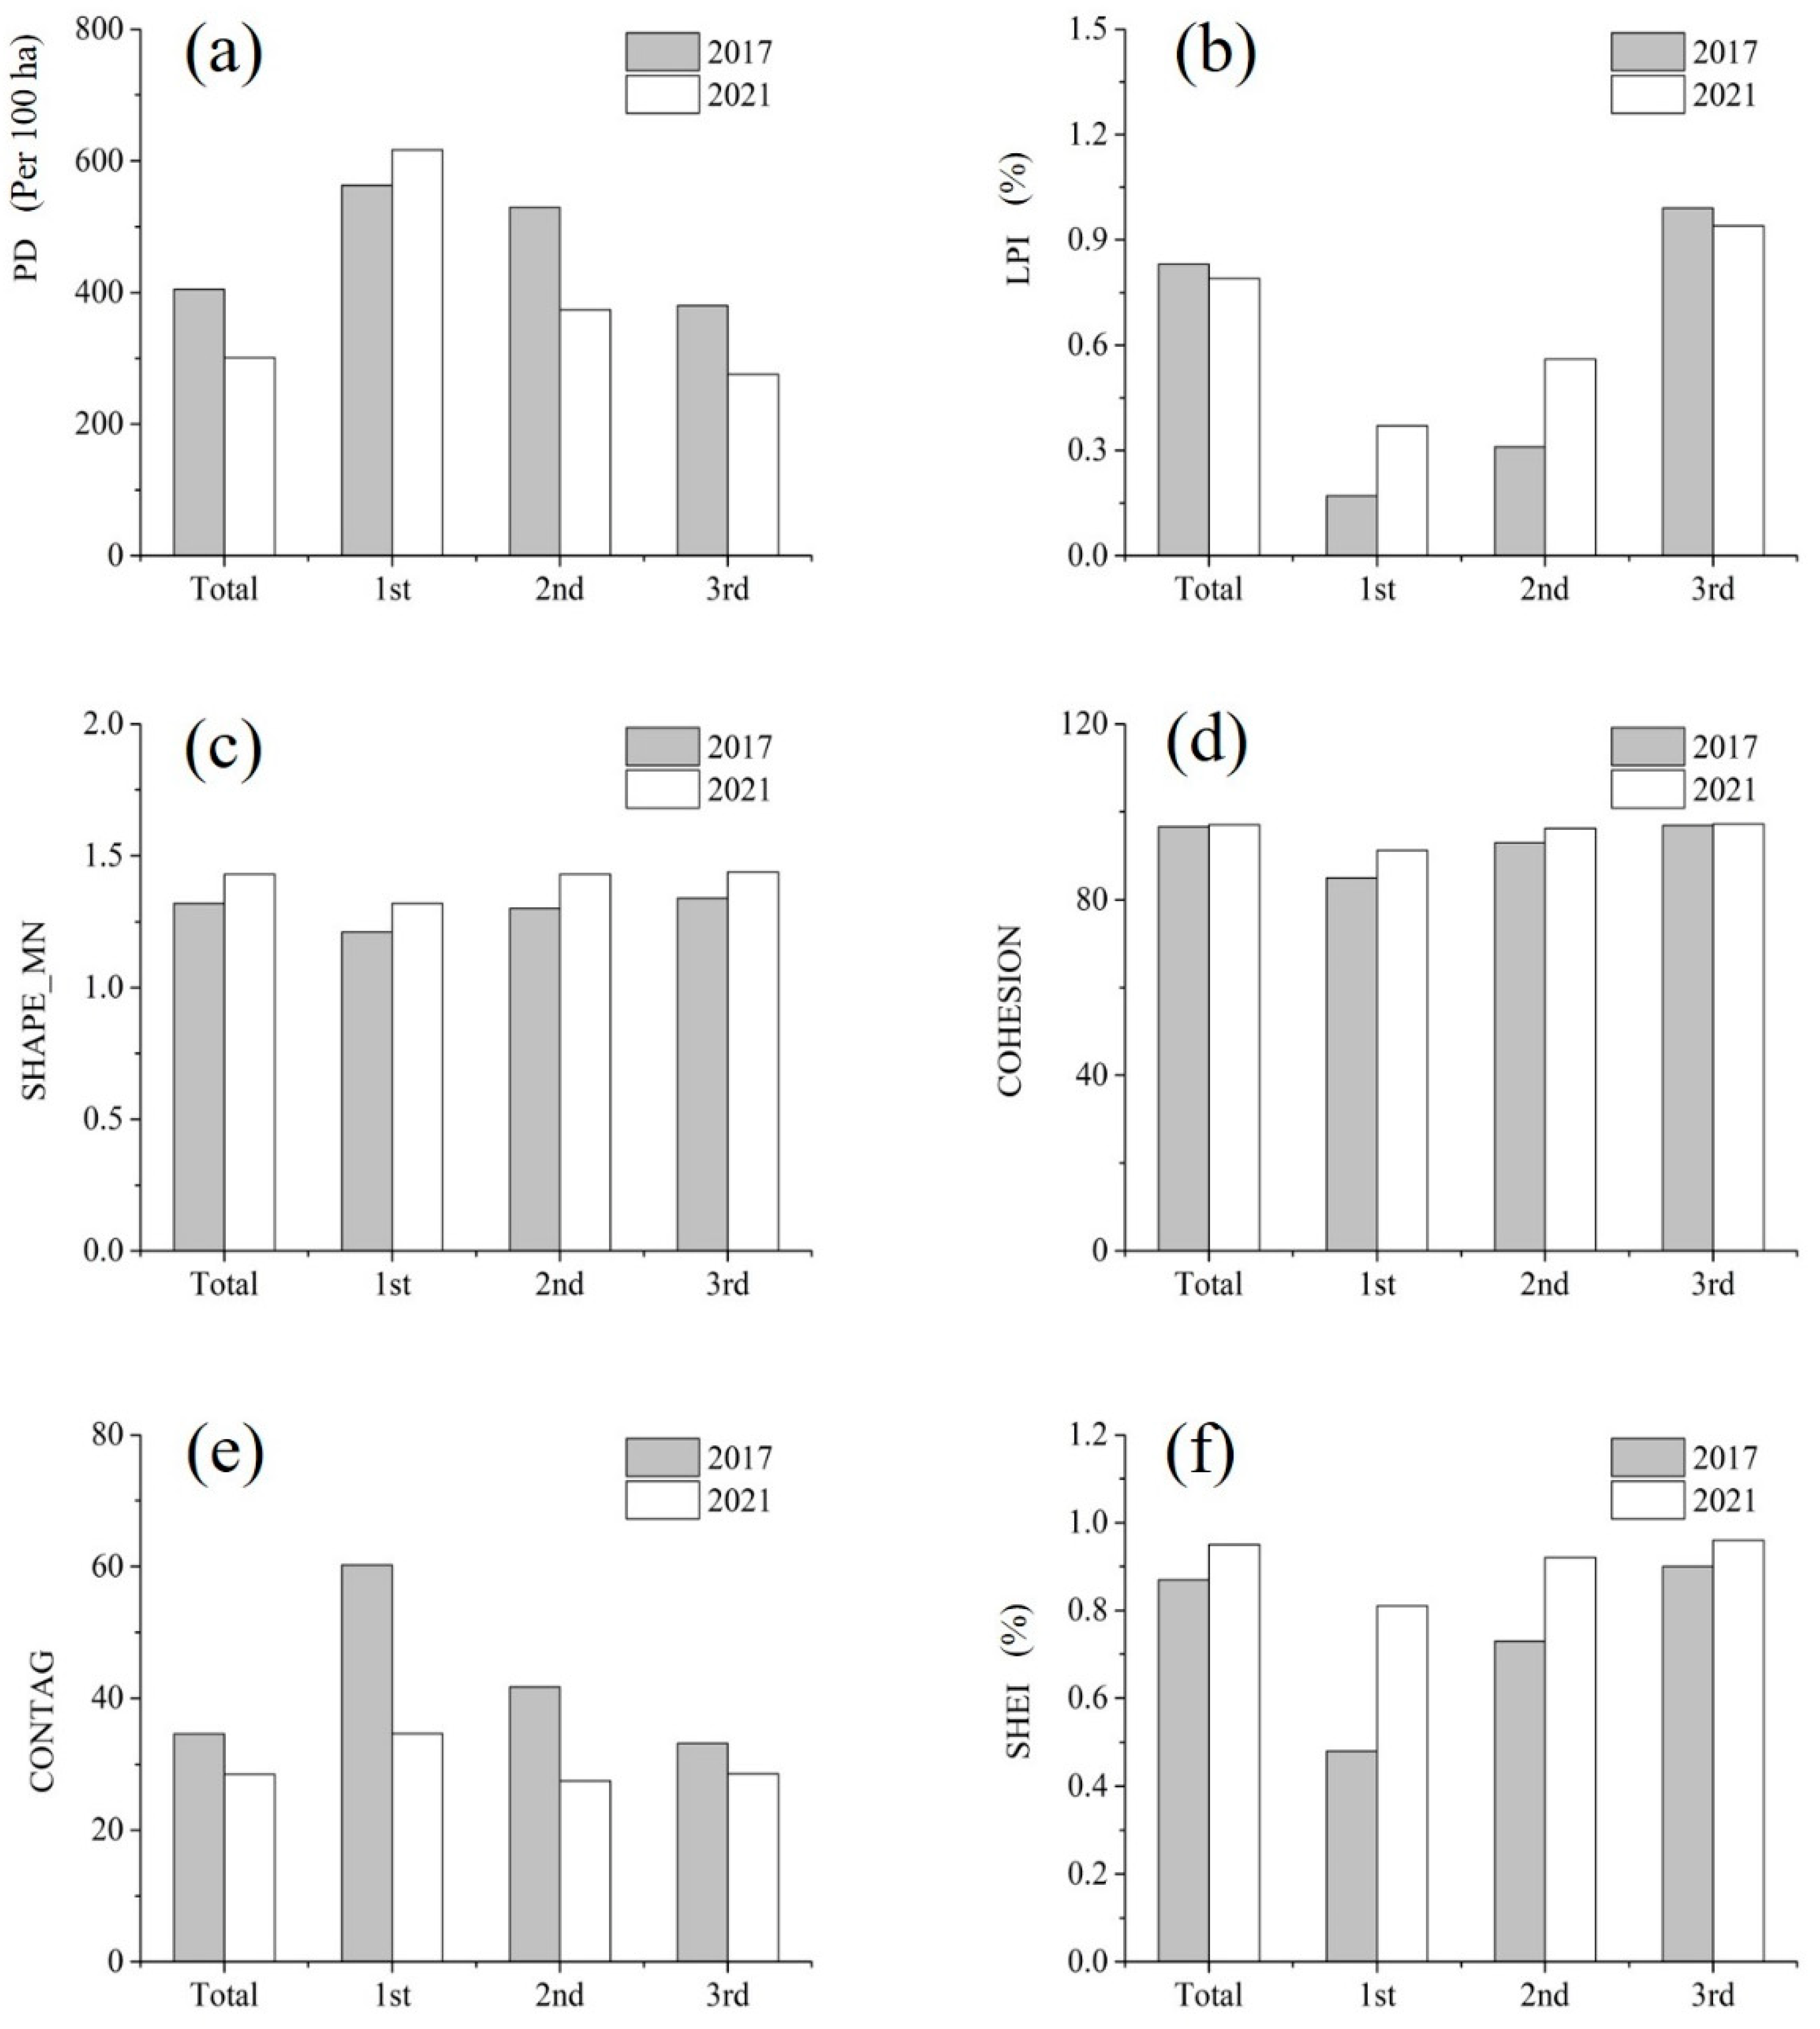
Fragstats 4.2 was utilized to calculate the class-level and landscape-level metrics of urban green-space patches in Hangzhou city for 2017 and 2021 (Figure 6). Specifically, PD in 2017 was higher than in 2021 (Figure 6a). However, the PD of urban green space in the first ring belt increased by around 9%. This is probably due to the construction of green infrastructures within the old town region, especially in the residence parcels. The LPI in the second ring belt and third ring belt increased, indicating some large parklands that appeared (Figure 6b). The emergence of diversified urban green-space design (e.g., horizontal greenery and vertical greenery) has led to a rise in the complexity of the green-space patches (Figure 6c). The design of green-space layouts in different urban land-use types focuses on different functions. For instance, the green-space patches in the business parcels focus on decoration and entertainment functions rather than ecological values. The COHESION of urban green-space patches increased slightly from 2017 to 2021 (Figure 6d). The CONTAG displays a downward trend, and the SHEI increased, indicating that the urban green-space patches become more evenly dispersed (Figure 6e,f).
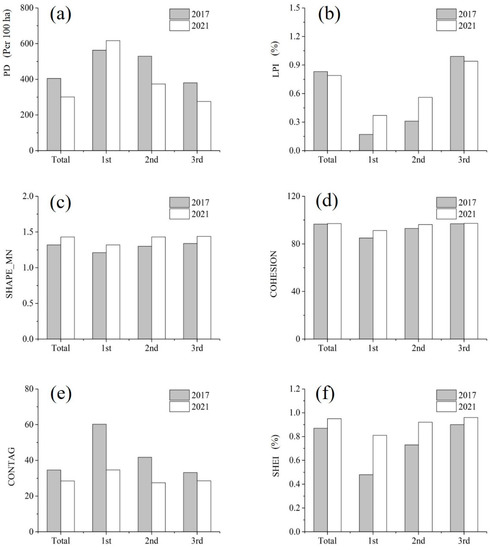
Figure 6.
Landscape analysis of urban green-space patterns at ring levels in 2017 and 2021. (a) PD of urban green spaces from 2017 to 2021; (b) LPI of urban green spaces from 2017 to 2021; (c) SHAPE_MN of urban green spaces from 2017 to 2021; (d) COHESION of urban green spaces from 2017 to 2021; (e) CONTAG of urban green spaces from 2017 to 2021; (f) SHEI of urban green spaces from 2017 to 2021.
3.2. Changes in Urban Green-Space Patterns with Different Urban Land-Use Changes
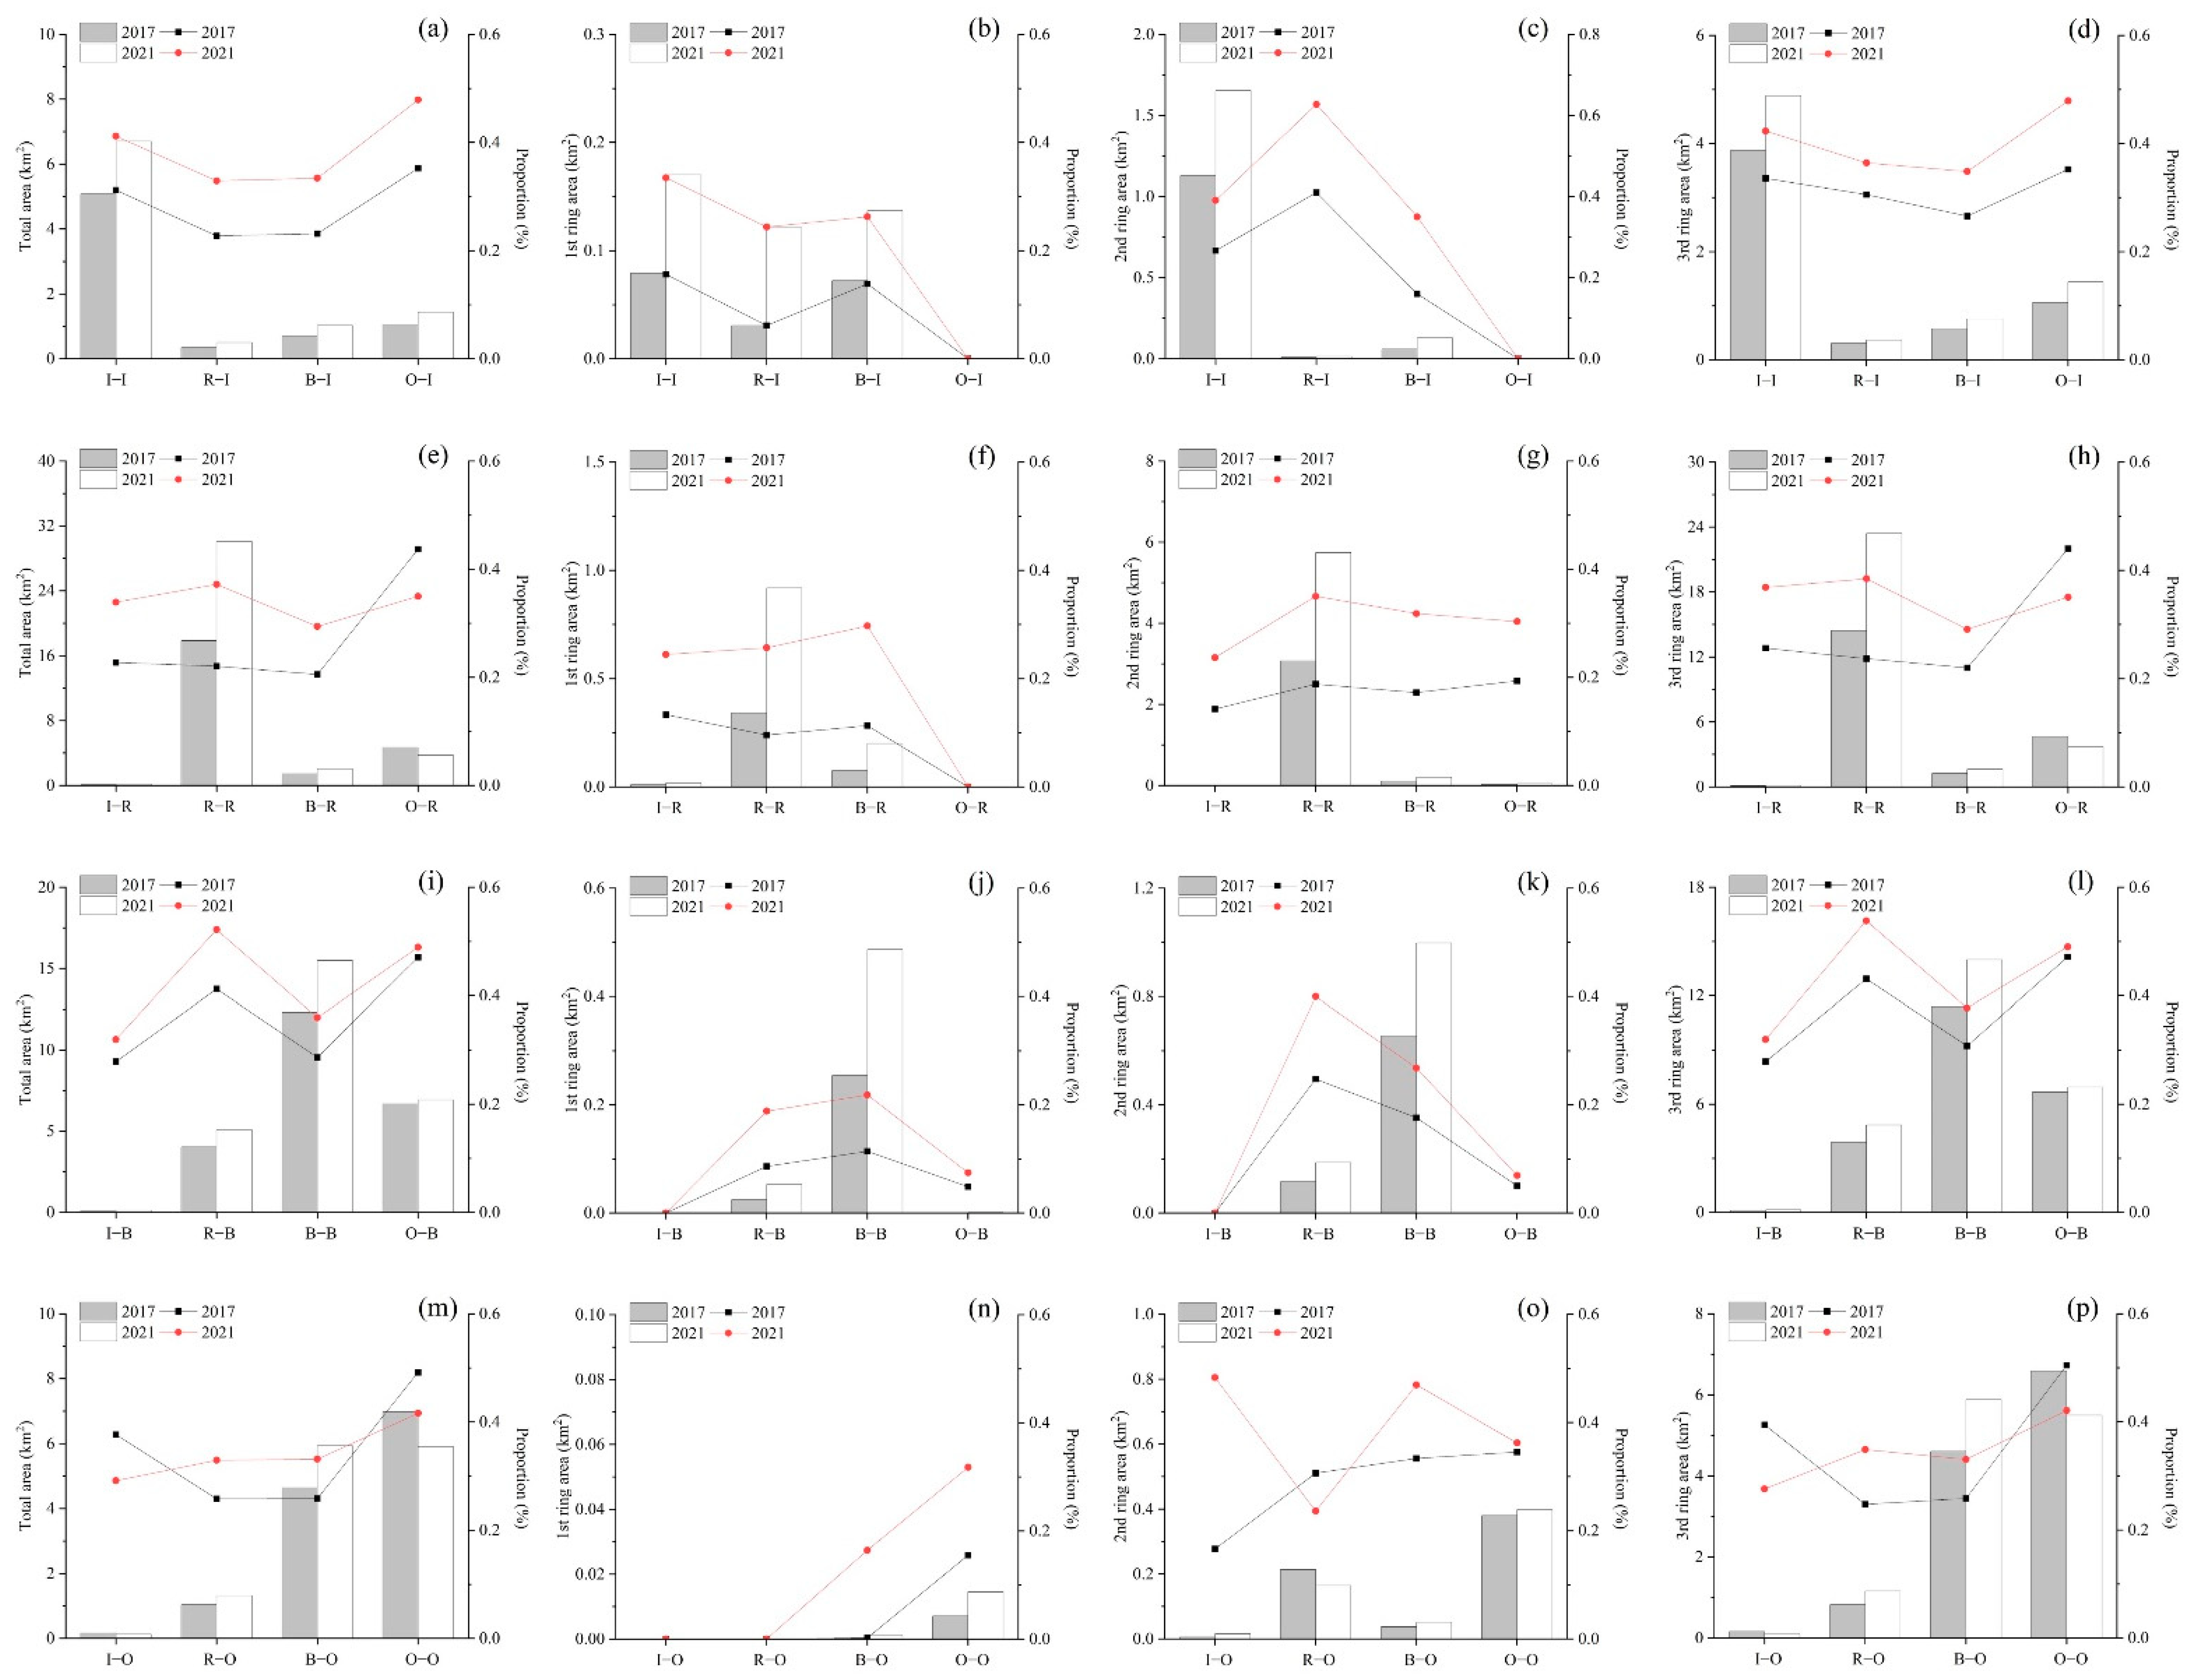
The green-space ratios were calculated in different urban land-use change types from 2017 to 2021 at different ring levels (Figure 7). The increase in urban green space in the institution parcels is largely dependent on the unchanged institution parcels, indicating well-planned urban green spaces inside the institution parcels (Figure 7a). The change from the residence and business parcels to the institution parcels has also determined the increase in green spaces in the first ring belt, probably because of the urban renewal project within the old town area. Moreover, the increase in the green-space ratio in the residence parcels is significant and is mainly distributed in the unchanged residence parcels from 2017 to 2021 (Figure 7e). It can be seen that the proportion of urban green space in newly built residence parcels is at a high level. The increase in the green-space ratio in the business parcels is mainly transformed from the residence parcels, business parcels, and open-space parcels (Figure 7i). This is probably due to the attractiveness of customers, especially in the second and third ring belts. The green-space ratio in the open-space parcels decreased from 0.16 km2 in 2017 to 0.12 km2 in 2021 in the unchanged open-space parcels, which is mainly related to the decrease in farmland in the third ring belt (Figure 7m). In addition, the change from the institution parcels has also led to a decrease in green spaces, probably due to the relocation of some institutions.
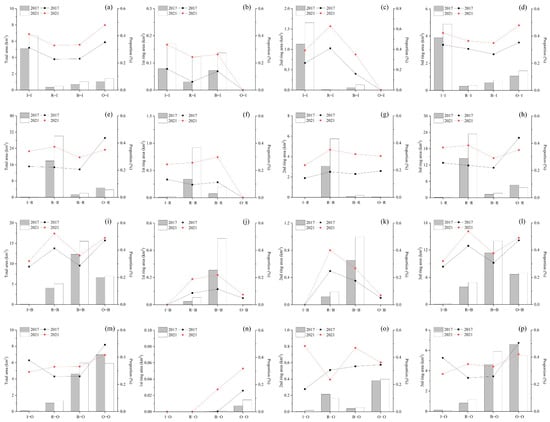
Figure 7.
Green-space ratios in different urban land-use change types. (a–d) Green-space ratios in the institution parcels transformed from the four urban land-use types at different ring levels; (e–h) green-space ratios in the residence parcels transformed from the four urban land-use types at different ring levels; (i–l) green-space ratios in the business parcels transformed from the four urban land-use types at different ring levels; (m–p) green-space ratios in the open-space parcels transformed from the four urban land-use types at different ring levels. (I: institution; R: residence; B: business; O: open space).
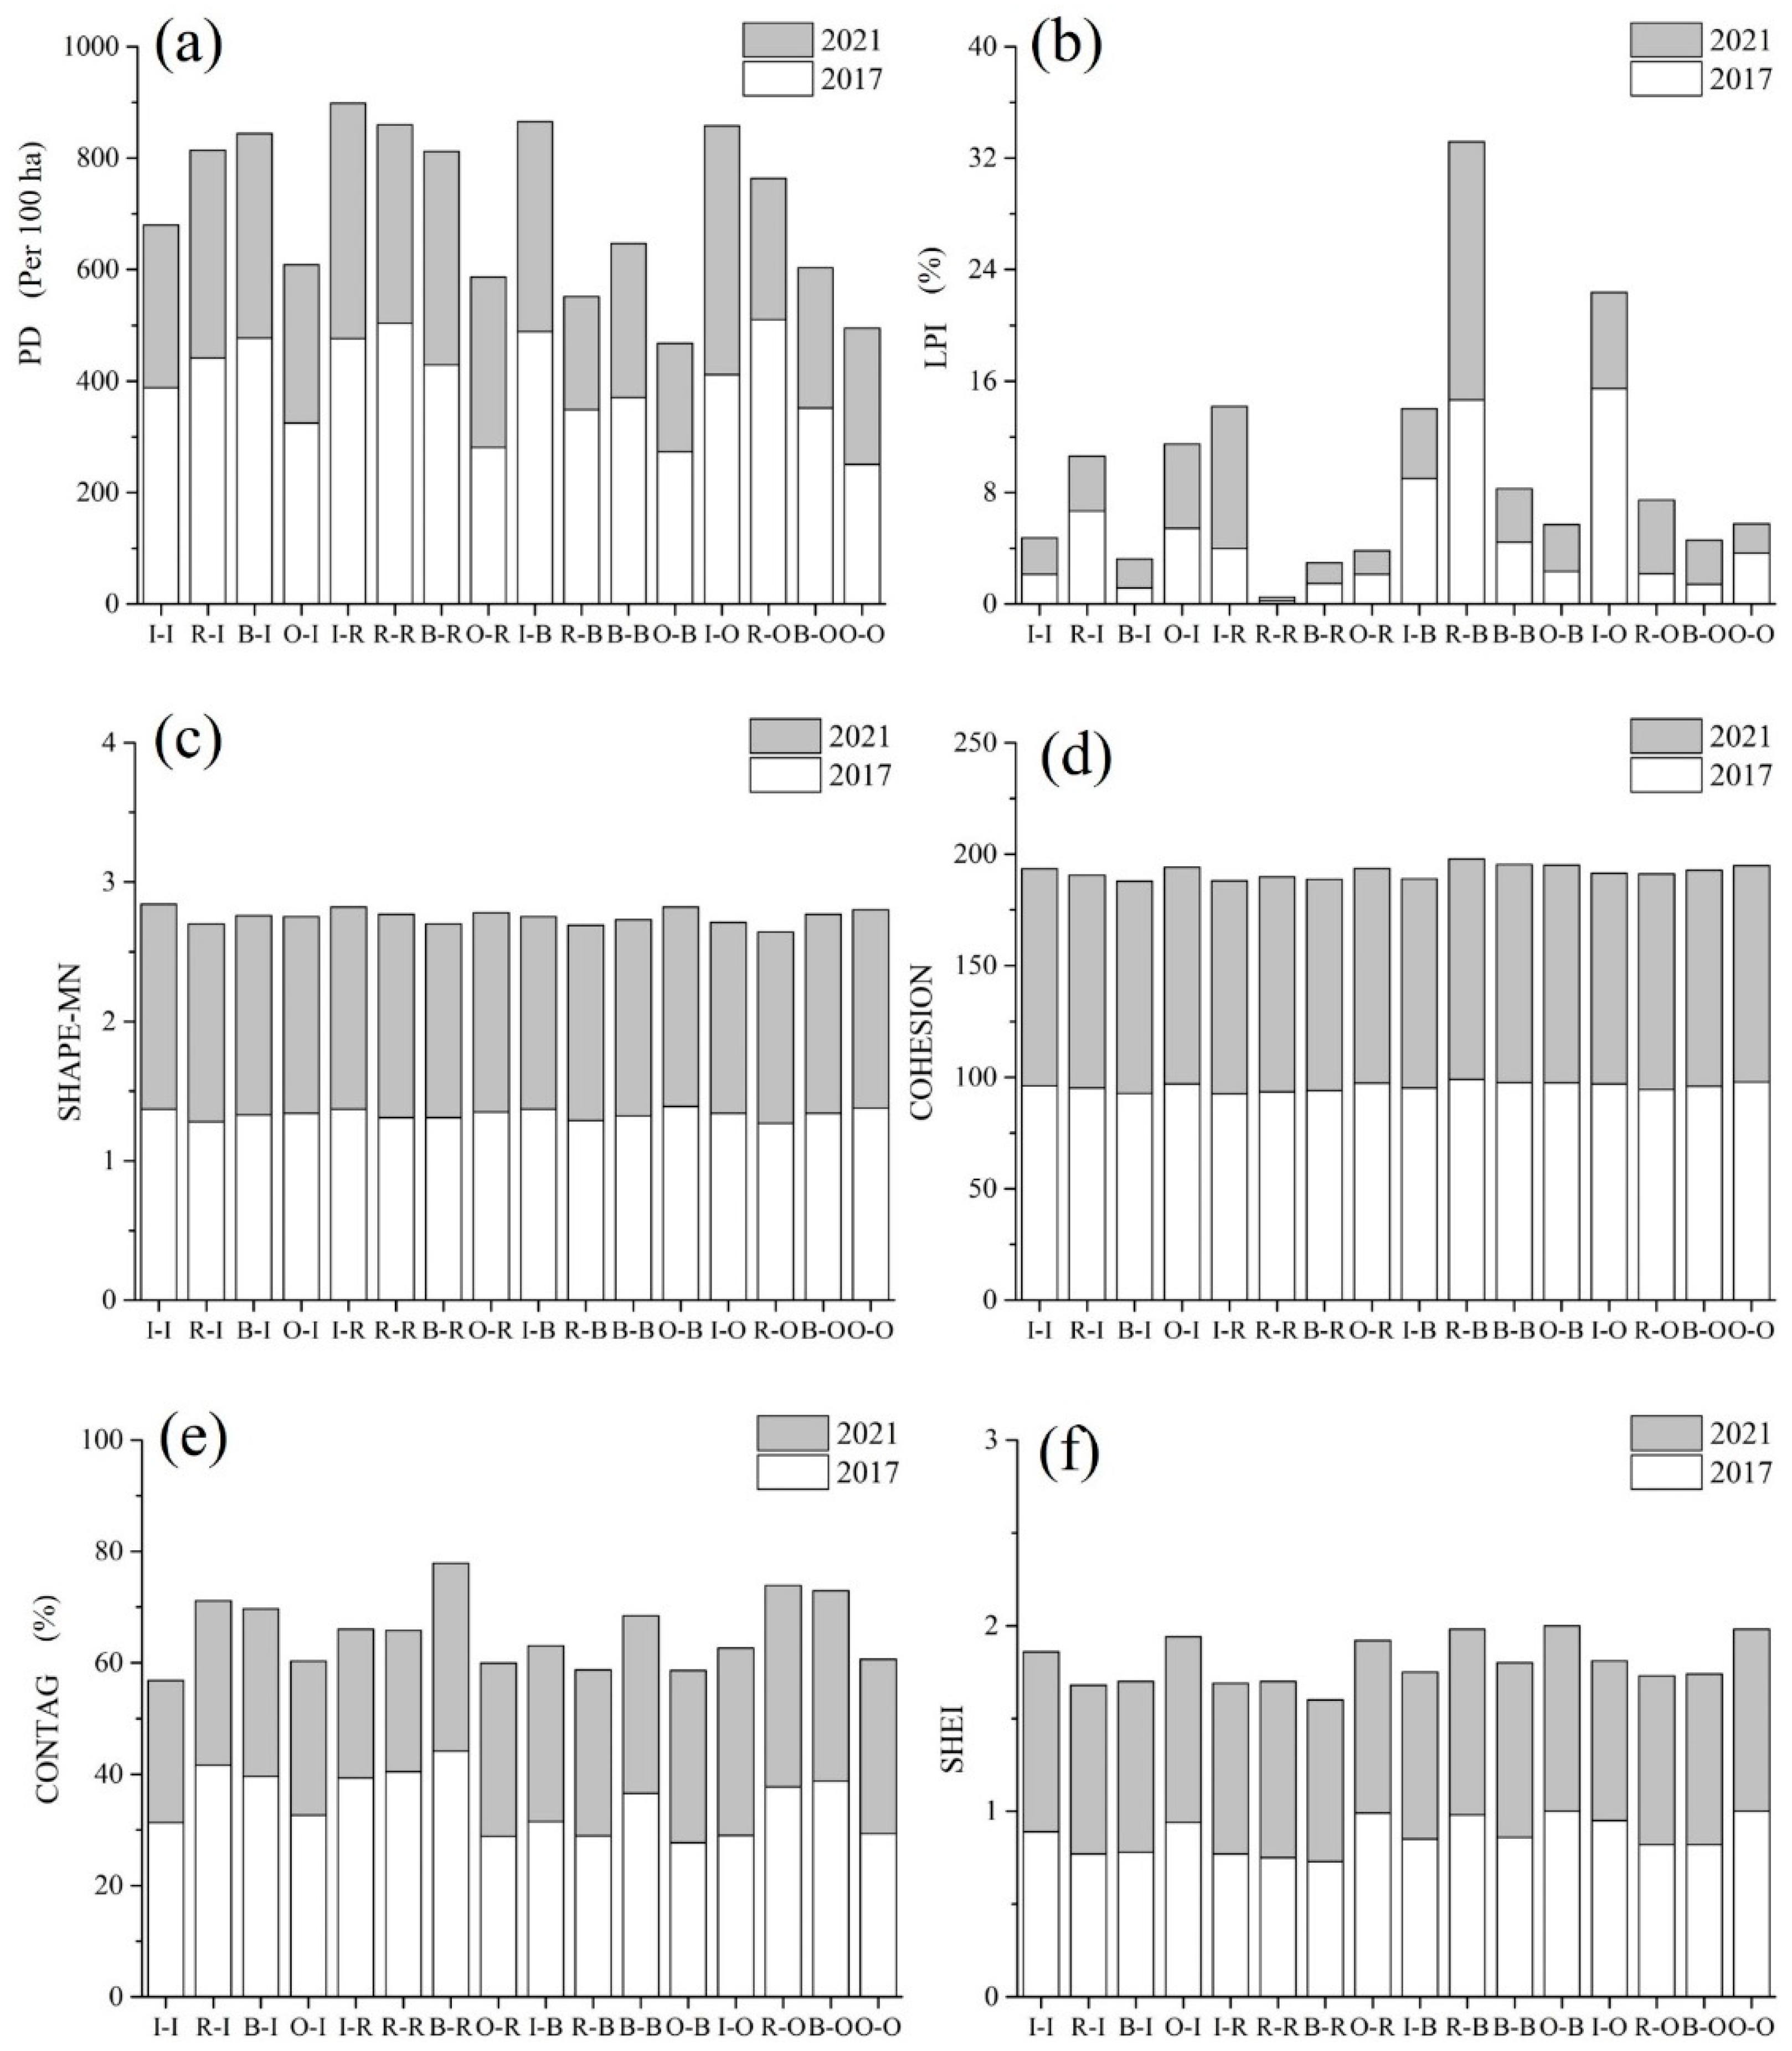
Figure 8 represents the landscape analysis of urban green space in different urban land-use change types in 2017 and 2021. Among them, the changes in the PD and LPI values for all patches varied greatly, while the changes in the SHAPE_MN, COHESION, CONTAG, and SHEI values were less obvious. It can be noted that the PD values for the institution parcels transformed from the four urban land-use types all decreased, suggesting reduced fragmentation in urban parcels. In addition, the SHAPE_MN, COHESION, and SHEI values for all patches increased, indicating more complex, more aggregated, and less dominant green-space patches in the institution parcels in 2021. The CONTAG values for all green-space patches decreased, which means the patches became uneven across the landscape. Specifically, the urban green-space patches in the residence parcels transformed from the open-space parcels, becoming more fragmented, more even, and more dominant. This is probably because the residence parcels transformed from the residence parcels are still in the demolition stage. Unlike the institution and residence parcels in 2021, the urban green-space patches in the business parcels in 2021 show less dominance. In addition, the green-space landscape in the open-space parcels transformed from the residence and business parcels is less fragmented, more complex, less even, and less dominant.
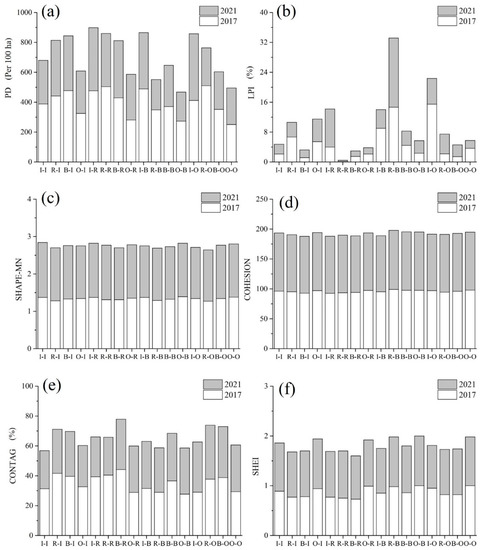
Figure 8.
Landscape analysis of urban green space within different urban land-use change types. (I: institution; R: residence; B: business; O: open space) (a) PD of urban green spaces from 2017 to 2021; (b) LPI of urban green spaces from 2017 to 2021; (c) SHAPE_MN of urban green spaces from 2017 to 2021; (d) COHESION of urban green spaces from 2017 to 2021; (e) CONTAG of urban green spaces from 2017 to 2021; (f) SHEI of urban green spaces from 2017 to 2021.
4. Discussion
In this study, we overlapped the urban land-use map (Figure 3) and the urban green-space map (Figure 4) for investigating the changes in urban green-space patterns through comprehensive analysis (e.g., hotspot analysis, green-space ratio analysis, and landscape analysis). The results showed that the integration of approaches focusing on different perspectives can provide a more holistic view of understanding the urban green-space patterns and their changes and thereby may enhance our understanding of the socioeconomic impacts of urban land-use changes.
The implementation of greening and land-use policies drives changes in urban green space and urban land-use patterns in Hangzhou city [49,50]. Among them, the “Hangzhou Urban Green Space System Plan (2002–2020)” aims to optimize the construction of green-space infrastructure in residential areas and improve existing plazas and parks [51].To be more specific, the urban green-space ratio of residential areas in the urban periphery should not be less than 35%, and that in the urban cores should not be less than 30%. As for the institution parcels, the urban green-space ratio should not be less than 35%. The urban green-space ratios of business parcels should not be less than 30%. It can be noted from the urban green-space ratio analysis that the urban green-space area in urban centers increased significantly between 2017 and 2021. The ratios of urban green space for the four urban land-use types (e.g., institution, residence, business, and open space) in 2017 were 31%, 24%, 26%, and 46%, respectively, while in 2021, the ratios increased to 40%, 36%, 41%, and 36%, respectively. In addition, according to the “Hangzhou Urban Master Plan (2001–2020)”, the government has made a reasonable allocation of district parks and community parks around the communities to improve the living quality of urban residents [52]. Furthermore, green corridors have been built to increase the connectivity of urban green-space patches [53]. The aggregation and connectivity of the urban green-space patches, as well as the socioeconomic benefits of urban green spaces, have been significantly improved. The “old town transformation” policy issued in 2017 has also greatly improved the urban green-space landscape in the city center and alleviated the ecological and environmental pressure [54,55]. To achieve economic efficiency and environmentally friendly development, the government championed the demolition of old town regions and built urban green space (e.g., green-space parks and green infrastructures) within residential and commercial land instead [56]. The growing ratio of urban green space in the old town regions was the highest (14%) compared to the other regions in Hangzhou city. The landscape patterns of urban green space in the urban core region were also improved according to the class-level and landscape-level metrics analysis. It also should be noted that the private sector has begun to spontaneously increase the urban green-space areas, although the government has planned the minimum green-space area for various urban land use. For example, the ratio of urban green space for business parcels increased from 26% in 2017 to 41% in 2021. The green-space ratio in business parcels has far exceeded the minimum value set by the government (30%).
5. Conclusions
This research investigates the changes in urban green-space patterns with different urban land-use changes (e.g., from open space to residential) by using a comprehensive analysis. The results demonstrated that the changes in urban land-use patterns are affected by urban land-use changes in Hangzhou city. In general, urban green spaces increased from 2017 to 2021, and the growth was mainly concentrated in the urban core area, indicating that the city has made remarkable achievements in the planning of green spaces. Specifically, the increase in urban green spaces in the first ring belt was mainly related to the old town transformation program in the residential land. The change from the residence parcels to the business parcels determined the increase in green spaces in the second and third ring belts, probably because of the attractiveness of customers. In addition, a large number of open-space parcels have changed to business parcels around the urban periphery, which might be due to the transformation from farmland to impervious surfaces. Lastly, this study verifies that the private sector (e.g., shopping malls) can contribute to the increase in green spaces, an issue that is usually realized by the state. Reasonable urban land-use layouts can promote the optimization and layout of urban green spaces. The understanding of urban green landscapes with different urban land-use changes can provide references for analyzing and optimizing green space in other cities experiencing rapid urban land-use changes.
Supplementary Materials
The following supporting information can be downloaded at: https://www.mdpi.com/article/10.3390/rs14215410/s1, Figure S1. Training and testing samples of urban land use mapping: (a) urban land use samples in 2017; (b) urban land use samples in 2021; Figure S2. Training and testing samples of urban green space mapping: (a) urban green space samples in 2017; (b) urban green space samples in 2021; Table S1. RS and GBD features used in FI-based classification; Table S2. Confusion matrix of FI-based classification results in 2017 (I: Institution; R: Residence; B: Business; O: Open Space). UA: users accuracy; PA: producers accuracy; OA: overall accuracy; π_j is the class proportion according to the classified map; Table S3. Confusion matrix of FI-based classification results in 2021 (I: Institution; R: Residence; B: Business; O: Open Space). UA: users accuracy; PA: producers accuracy; OA: overall accuracy; π_j is the class proportion according to the classified map; Table S4. Confusion matrix of the urban green space mapping results in 2017. UA: users accuracy; PA: producers accuracy; OA: overall accuracy; π_j is the class proportion according to the classified map (N: Non-green space; G: Green space); Table S5. Confusion matrix of the urban green space mapping results in 2021. UA: users accuracy; PA: producers accuracy; OA: overall accuracy; π_j is the class proportion according to the classified map (N: Non-green space; G: Green space).
Author Contributions
Conceptualization, J.Y.; methodology, J.Y.; data analysis, J.Y.; writing—original draft preparation, J.Y.; writing—review and editing, P.F., A.C.; supervision, Z.L., J.D. All authors have read and agreed to the published version of the manuscript.
Funding
This research received no external funding.
Institutional Review Board Statement
Not applicable.
Informed Consent Statement
Not applicable.
Data Availability Statement
Not applicable.
Acknowledgments
J.Y. acknowledges a Ph.D. scholarship provided by the University of Nottingham Ningbo China and the Institute for Geographic Sciences and Natural Resources Research, Chinese Academy of Sciences.
Conflicts of Interest
The authors declare no conflict of interest.
References
- Kwon, O.H.; Hong, I.; Yang, J.; Wohn, D.Y.; Jung, W.S.; Cha, M. Urban green space and happiness in developed countries. EPJ Data Sci. 2021, 10, 28–41. [Google Scholar] [CrossRef] [PubMed]
- Haas, J.; Ban, Y.F. Urban growth and environmental impacts in Jing-Jin-Ji, the Yangtze, River Delta and the Pearl River Delta. Int. J. Appl. Earth Obs. 2014, 30, 42–55. [Google Scholar] [CrossRef]
- Kondo, M.C.; Fluehr, J.M.; McKeon, T.; Branas, C.C. Urban green space and its impact on human health. Int. J. Environ. Res. Public Health 2018, 15, 445. [Google Scholar] [CrossRef]
- Sperandelli, D.I.; Dupas, F.A.; Dias Pons, N.A. Dynamics of urban sprawl, vacant land, and green spaces on the metropolitan fringe of São Paulo, Brazil. J. Urban Plan. Dev. 2013, 139, 274–279. [Google Scholar] [CrossRef]
- Yu, Z.; Wang, Y.; Deng, J.; Shen, Z.; Wang, K.; Zhu, J.; Gan, M. Dynamics of hierarchical urban green space patches and implications for management policy. Sensors 2017, 17, 1304. [Google Scholar] [CrossRef]
- Aram, F.; García, E.H.; Solgi, E.; Mansournia, S. Urban green space cooling effect in cities. Heliyon 2019, 5, e01339. [Google Scholar] [CrossRef]
- Heidt, V.; Neef, M. Benefits of urban green space for improving urban climate. In Ecology, Planning, and Management of Urban Forests; Springer: Berlin/Heidelberg, Germany, 2008; pp. 84–96. [Google Scholar]
- Kuang, W.; Dou, Y. Investigating the patterns and dynamics of urban green space in China’s 70 major cities using satellite remote sensing. Remote Sens. 2020, 12, 1929. [Google Scholar] [CrossRef]
- Song, X.; Feng, Q.; Xia, F.; Li, X.; Scheffran, J. Impacts of changing urban land-use structure on sustainable city growth in China: A population-density dynamics perspective. Habitat Int. 2021, 107, 102296. [Google Scholar] [CrossRef]
- Liu, S.; Zhang, X.; Feng, Y.; Xie, H.; Jiang, L.; Lei, Z. Spatiotemporal dynamics of urban green space influenced by rapid urbanization and land use policies in Shanghai. Forests 2021, 12, 476. [Google Scholar] [CrossRef]
- Haaland, C.; van Den Bosch, C.K. Challenges and strategies for urban green-space planning in cities undergoing densification: A review. Urban For. Urban Green. 2015, 14, 760–771. [Google Scholar] [CrossRef]
- Astell-Burt, T.; Feng, X. Association of urban green space with mental health and general health among adults in Australia. JAMA Netw. Open 2019, 2, e198209. [Google Scholar] [CrossRef]
- Lee, A.C.; Maheswaran, R. The health benefits of urban green spaces: A review of the evidence. J. Public Health 2011, 33, 212–222. [Google Scholar] [CrossRef]
- Wolch, J.R.; Byrne, J.; Newell, J.P. Urban green space, public health, and environmental justice: The challenge of making cities ‘just green enough’. Landsc. Urban Plan. 2014, 125, 234–244. [Google Scholar] [CrossRef]
- Sikorska, D.; Łaszkiewicz, E.; Krauze, K.; Sikorski, P. The role of informal green spaces in reducing inequalities in urban green space availability to children and seniors. Environ. Sci. Policy 2020, 108, 144–154. [Google Scholar] [CrossRef]
- Meng, Q.; Zhang, L.; Sun, Z.; Meng, F.; Wang, L.; Sun, Y. Characterizing spatial and temporal trends of surface urban heat island effect in an urban main built-up area: A 12-year case study in Beijing, China. Remote Sens. Environ. 2018, 204, 826–837. [Google Scholar] [CrossRef]
- Chen, T.; Huang, Q.; Liu, M.; Li, M.; Qu, L.A.; Deng, S.; Chen, D. Decreasing Net Primary Productivity in Response to Urbanization in Liaoning Province, China. Sustainability 2017, 9, 162. [Google Scholar] [CrossRef]
- Chen, B.; Wu, S.; Song, Y.; Webster, C.; Xu, B.; Gong, P. Contrasting inequality in human exposure to greenspace between cities of Global North and Global South. Nat. Commun. 2022, 13, 4636. [Google Scholar] [CrossRef]
- Xu, C.; Chen, G.; Huang, Q.; Su, M.; Rong, Q.; Yue, W.; Haase, D. Can improving the spatial equity of urban green space mitigate the effect of urban heat islands? An empirical study. Sci. Total Environ. 2022, 841, 156687. [Google Scholar] [CrossRef]
- Mukherjee, M.; Takara, K. Urban green space as a countermeasure to increasing urban risk and the UGS-3CC resilience framework. Int. J. Disaster Risk Reduct. 2018, 28, 854–861. [Google Scholar] [CrossRef]
- Tang, H.Z.; Liu, W.P.; Yun, W.J. Spatiotemporal dynamics of green spaces in the Beijing–Tianjin–Hebei region in the past 20 years. Sustainability 2018, 10, 2949. [Google Scholar] [CrossRef]
- Li, D.; Lu, D.; Wu, M.; Shao, X.; Wei, J. Examining land cover and greenness dynamics in Hangzhou Bay in 1985–2016 using Landsat time-series data. Remote Sens. 2017, 10, 32. [Google Scholar] [CrossRef]
- Mao, W.; Lu, D.; Hou, L.; Liu, X.; Yue, W. Comparison of machine-learning methods for urban land-use mapping in Hangzhou city, China. Remote Sens. 2020, 12, 2817. [Google Scholar] [CrossRef]
- An, Y.; Tsou, J.Y.; Wong, K.; Zhang, Y.; Liu, D.; Li, Y. Detecting land use changes in a rapidly developing city during 1990–2017 using satellite imagery: A case study in Hangzhou Urban area, China. Sustainability 2018, 10, 3303. [Google Scholar] [CrossRef]
- Adiri, Z.; Lhissou, R.; El Harti, A.; Jellouli, A.; Chakouri, M. Recent advances in the use of public domain satellite imagery for mineral exploration: A review of Landsat-8 and Sentinel-2 applications. Ore Geol. Rev. 2020, 117, 103332–103365. [Google Scholar] [CrossRef]
- Canty, M.J.; Nielsen, A.A.; Conradsen, K.; Skriver, H. Statistical analysis of changes in Sentinel-1 time series on the Google Earth Engine. Remote Sens. 2019, 12, 46. [Google Scholar] [CrossRef]
- Liu, X.; Long, Y. Automated identification and characterization of parcels with OpenStreetMap and points of interest. Environ. Plan. B Plan. Des. 2015, 43, 498–510. [Google Scholar] [CrossRef]
- Zong, L.; He, S.; Lian, J.; Bie, Q.; Wang, X.; Dong, J.; Xie, Y. Detailed mapping of urban land use based on multi-source data: A case study of lanzhou. Remote Sens. 2020, 12, 1987. [Google Scholar] [CrossRef]
- Zhu, Q.; Lei, Y.; Sun, X.; Guan, Q.; Zhong, Y.; Zhang, L.; Li, D. Knowledge-guided land pattern depiction for urban land use mapping: A case study of Chinese cities. Remote Sens. Environ. 2022, 272, 112916. [Google Scholar] [CrossRef]
- Zhao, W.Z.; Bo, Y.C.; Chen, J.G.; Tiede, D.; Blaschke, T.; Emery, W.J. Exploring semantic elements for urban scene recognition: Deep integration of high-resolution imagery and OpenStreetMap (OSM). ISPRS J. Photogramm. Remote Sens. 2019, 151, 237–250. [Google Scholar] [CrossRef]
- Xu, S.Y.; Qing, L.B.; Han, L.M.; Liu, M.; Peng, Y.H.; Shen, L.F. A new remote sensing images and point-of-interest fused (RPF) model for sensing urban functional regions. Remote Sens. 2020, 12, 1032. [Google Scholar] [CrossRef]
- Xu, Y.; Zhou, B.; Jin, S.; Xie, X.; Chen, Z.; Hu, S.; He, N. A framework for urban land use classification by integrating the spatial context of points of interest and graph convolutional neural network method. Comput. Environ. Urban Syst. 2022, 95, 101807. [Google Scholar] [CrossRef]
- Yin, J.D.; Fu, P.; Hamm, N.A.S.; Li, Z.C.; You, N.S.; He, Y.L.; Cheshmehzangi, A.; Dong, J.W. Decision-level and feature-level integration of remote sensing and geospatial big data for urban land use mapping. Remote Sens. 2021, 13, 1579. [Google Scholar] [CrossRef]
- Yin, J.D.; Dong, J.W.; Hamm, N.A.S.; Li, Z.C.; Wang, J.H.; Xing, H.F.; Fu, P. Integrating remote sensing and geospatial big data for urban land use mapping: A review. Int. J. Appl. Earth Obs. 2021, 103, 102514–102525. [Google Scholar] [CrossRef]
- Zhu, X.; Gao, M.; Zhang, R.; Zhang, B. Quantifying emotional differences in urban green spaces extracted from photos on social networking sites: A study of 34 parks in three cities in northern China. Urban For. Urban Green. 2021, 62, 127133. [Google Scholar] [CrossRef]
- Wang, H.; Hu, Y.; Tang, L.; Zhuo, Q. Distribution of urban blue and green space in beijing and its influence factors. Sustainability 2020, 12, 2252. [Google Scholar] [CrossRef]
- Stehman, S.V.; Foody, G.M. Key issues in rigorous accuracy assessment of land cover products. Remote Sens. Environ. 2019, 231, 111199–111222. [Google Scholar] [CrossRef]
- Wang, X.; Zhang, Y.; Zhang, J.; Fu, C.; Zhang, X. Progress in urban metabolism research and hotspot analysis based on CiteSpace analysis. J. Clean. Prod. 2021, 281, 125224. [Google Scholar] [CrossRef]
- Uuemaa, E.; Antrop, M.; Roosaare, J.; Marja, R.; Mander, Ü. Landscape metrics and indices: An overview of their use in landscape research. Living Rev. Landsc. Res. 2009, 3, 1–28. [Google Scholar] [CrossRef]
- Herold, M.; Scepan, J.; Clarke, K.C. The use of remote sensing and landscape metrics to describe structures and changes in urban land uses. Environ. Plan. A 2002, 34, 1443–1458. [Google Scholar] [CrossRef]
- Kumar, M.; Denis, D.M.; Singh, S.K.; Szabó, S.; Suryavanshi, S. Landscape metrics for assessment of land cover change and fragmentation of a heterogeneous watershed. Remote Sens. Appl. Soc. Environ. 2018, 10, 224–233. [Google Scholar] [CrossRef]
- Xing, H.; Meng, Y. Integrating landscape metrics and socioeconomic features for urban functional region classification. Comput. Environ. Urban Syst. 2018, 72, 134–145. [Google Scholar] [CrossRef]
- Zhang, Q.; Chen, C.; Wang, J.; Yang, D.; Zhang, Y.; Wang, Z.; Gao, M. The spatial granularity effect, changing landscape patterns, and suitable landscape metrics in the Three Gorges Reservoir Area, 1995–2015. Ecol. Indic. 2020, 114, 106259. [Google Scholar] [CrossRef]
- Bosch, M.; Jaligot, R.; Chenal, J. Spatiotemporal patterns of urbanization in three Swiss urban agglomerations: Insights from landscape metrics, growth modes and fractal analysis. Landsc. Ecol. 2020, 35, 879–891. [Google Scholar] [CrossRef]
- Inkoom, J.N.; Frank, S.; Greve, K.; Walz, U.; Fürst, C. Suitability of different landscape metrics for the assessments of patchy landscapes in West Africa. Ecol. Indic. 2018, 85, 117–127. [Google Scholar] [CrossRef]
- Miller, J.D.; Stewart, E.; Hess, T.; Brewer, T. Evaluating landscape metrics for characterising hydrological response to storm events in urbanised catchments. Urban Water J. 2020, 17, 247–258. [Google Scholar] [CrossRef]
- Pindral, S.; Kot, R.; Hulisz, P.; Charzyński, P. Landscape metrics as a tool for analysis of urban pedodiversity. Land Degrad. Dev. 2020, 31, 2281–2294. [Google Scholar] [CrossRef]
- McGarigal, K.; Cushman, S.A. Comparative evaluation of experimental approaches to the study of habitat fragmentation effects. Ecol. Appl. 2002, 12, 335–345. [Google Scholar] [CrossRef]
- Schipperijn, J.; Ekholm, O.; Stigsdotter, U.K.; Toftager, M.; Bentsen, P.; Kamper-Jørgensen, F.; Randrup, T.B. Factors influencing the use of green space: Results from a Danish national representative survey. Landsc. Urban Plan. 2010, 95, 130–137. [Google Scholar] [CrossRef]
- Zhang, W.; Yang, J.; Ma, L.; Huang, C. Factors affecting the use of urban green spaces for physical activities: Views of young urban residents in Beijing. Urban For. Urban Green. 2015, 14, 851–857. [Google Scholar] [CrossRef]
- Sun, Y.; Saha, S.; Tost, H.; Kong, X.; Xu, C. Literature Review Reveals a Global Access Inequity to Urban Green Spaces. Sustainability 2022, 14, 1062. [Google Scholar] [CrossRef]
- Shao, Z.; Spit, T.; Jin, Z.; Bakker, M.; Wu, Q. Can the land use master plan control urban expansion and protect farmland in China? A case study of Nanjing. Growth Chang. 2018, 49, 512–531. [Google Scholar] [CrossRef]
- Liu, Q.; Zhu, Z.; Zeng, X.; Zhuo, Z.; Ye, B.; Fang, L.; Huang, Q.; Lai, P. The impact of landscape complexity on preference ratings and eye fixation of various urban green space settings. Urban For. Urban Green. 2021, 66, 127411. [Google Scholar] [CrossRef]
- Liu, Y.; Li, J.; Yang, Y. Strategic adjustment of land use policy under the economic transformation. Land Use Policy 2018, 74, 5–14. [Google Scholar] [CrossRef]
- Zhang, W.; Zhang, X.; Wu, G. The network governance of urban renewal: A comparative analysis of two cities in China. Land Use Policy 2021, 106, 105448. [Google Scholar] [CrossRef]
- Chan, E.; Lee, G.K. Critical factors for improving social sustainability of urban renewal projects. Soc. Indic. Res. 2008, 85, 243–256. [Google Scholar] [CrossRef]
Publisher’s Note: MDPI stays neutral with regard to jurisdictional claims in published maps and institutional affiliations. |
© 2022 by the authors. Licensee MDPI, Basel, Switzerland. This article is an open access article distributed under the terms and conditions of the Creative Commons Attribution (CC BY) license (https://creativecommons.org/licenses/by/4.0/).

