Article

Increased Mass Loss of Glaciers in the Sawir Mountains of Central Asia between 1959 and 2021

1
State Key Laboratory of Cryosphere Science, Northwest Institute of Eco-Environment and Resources, Chinese Academy of Sciences, Lanzhou 730000, China
2
University of Chinese Academy of Sciences, Beijing 100049, China
*
Author to whom correspondence should be addressed.
Remote Sens. 2022, 14(21), 5406; https://doi.org/10.3390/rs14215406
Submission received: 21 September 2022 / Revised: 21 October 2022 / Accepted: 25 October 2022 / Published: 28 October 2022

Abstract

:
Glacier mass balance can be regarded as a major direct index of climate variations. In this paper, a geodetic method was used to evaluate the mass balance of Sawir glaciers based on topographic map DEM (Digital Elevation Model), SRTM 30 m DEM, ASTER 30 m DEM, and Sentinel-1 Synthetic Aperture Radar 10 m DEM between 1959–2021, in order to explore the response to climatic alterations. In the case of Muz Taw glacier, the first comprehensive dataset concerning mass-balance readings for the 2014–2021 period was provided based on the eight-year consecutive field measurements. The glaciological average mass balance reached –883.4 ± 130 mm a–1 during this period. The geodetic mass balance for all glaciers of the Sawir Mountain range was −0.43 ± 0.12 m w. e. a−1 between 1959 and 2000, and accelerated to −0.56 ± 0.13 m w. e. a−1 between 2000 and 2021. A comparison of field measurements and remote-sensing approaches for determining the Muz Taw glacier’s mass balance between 2014–2021 proves the feasibility of the remote-sensing approach, which involves mass-balance monitoring based on DEMdata. In addition, our findings support the contention that air temperature is the dominant factor for accelerated glacier mass loss and surface elevation change.

1. Introduction

Globally, mountain glaciers have faced continuous mass losses due to multidecadal variations in climate and meteorological conditions. These losses impact the water resource availability prominently [1,2,3]. The Sawir Mountain range is a watershed between inland Xinjiang and the Arctic Ocean water system [4,5]. As the glaciers of the Sawir Mountains are a crucial freshwater resource, their melting will undoubtedly lead to water shortages and ecological imbalances, threatening the well-being of people, livestock, and wildlife living in the area [6,7]. Carrying out a quantitative assessment of glacier mass changes can help the management of water reserves, reduce disaster risk, and provide data to support the development of local environmental policies.
In-situ observations of the Sawir Mountains region are difficult because of harsh meteorological conditions and treacherous terrain. So far, the glacier mass balance has scarcely been explored for the Sawir Mountains region [8]. To remedy this, in 2014, the Chinese Academy of Sciences Institute established the Integrated Observatory for the Science and Sustainable Development of the Altay Mountain Cryosphere, which has been recording in-situ observation data ever since. Unlike remote sensing satellites, which can acquire large-scale information and assess glacier changes over the entire region, in-situ data can only cover only a single glacier, this approach is an effective method of validating results derived from geodetic methods [9].
The Ulkhunurastu River is a transboundary international river between China and Kazakhstan, originates from the Muz Taw in Jimnai County, which has seen accelerated glacier change in recent years. Glacier changes can affect precipitation and lead to increased fluctuations in runoff. This has implications for national boundary delineation, water resource development and use, and local economic, political, and scientific implications. However, few scholars have studied glaciers in the Sawir range at present. For example, Huai et al. investigated changes in the area and volume of the Sawir Mountain glaciers in China based on topographic maps, glacier inventories, remote sensing image data, and ground-penetrating radar (GPR) data [10]. Wang et al. analyzed the change in glacier area in response to climate in the Sawir Mountains based on Landsat remote sensing image data from 1977 to 2017 [11]. Xu et al. analyzed the changes in the mass balance of the Sawir Mountains Muz Taw glaciers for three consecutive years from 2017 to 2020 based on multi-temporal geodesy, which indicated that the mass balance of these glaciers is negative [12]. The above studies focused on changes in the glacier area, length, and thickness, as well as the changes in the mass balance of a single glacier in a short series. However, there is still a lack of long time-series studies on the mass balance of glacier complexes in this region.
In this paper, using the in-situ measured mass balance data acquired for the Sawir Mountains’ Muz Taw glacier from 2014 to 2021, we analysed the glacier mass balance for the abovementioned glacier, as well as the causes of the changes. Further, the reliability of the multi-source geodetic method was assessed, which is utilized for exploring the variations of glacier surface altitude for the Sawir Mountains from 1959 to 2021. This study is the publication of eight-year field observations in the region, and the data presented here can refine important parameters needed to model glacier dynamics in the region (e.g., glacier zone meteorology, hydrological data, mass balance, surface elevation changes, etc.)

2. Study Site

The Sawir Mountains span China and Kazakhstan and the range is an independent transition belt of the Tianshan and Altay Mountains, about 200 km from these two regions [4,13]. In accordance with the Second Chinese Glacier Inventory, there are 12 glaciers in the Chinese Sawir Mountains covering the region of 9.2 km2, whose mean glacier area is 0.80 km2. At the glacier terminus positions, the altitude varies from 3030 to 3725 m a.s.l, and the altitude of the snow lines is between 3310 and 3410 m a.s.l [12]. The continental glaciers in the Altay Mountains accumulate from November to March, ablation from April to October [14].
The Muz Taw glacier (Figure 1b) with coordinates 85°33′40″E, 47°3′44″N is a northeast-facing valley glacier [15] situated on the northern slope of Sawir Mountains, it is the only monitored glacier in the Sawir Mountains. The 2021 Sentinel-1SAR data demonstrate that the glacier is 2.93 ± 0.13 km2 in area and is 3.41 ± 0.16 km long. The Muz Taw glacier altitude is from 3137 to 3818 m a.s.l, ice volume is 0.28 km3, and mean ice thickness is up to 66 m [11,15]. Moreover, the Muz Taw glacier is influenced by the northern branch of the westerly belt, based on meteorological data (2010–2021) from the Grassland station (about 3 km distant, at an elevation of 3149 m a.s.l). There is a significant seasonal air temperature difference, and the interannual air temperature variation rate is 0.10 °C/10a. The monthly air temperature in the glacier area fluctuates between –20.2 °C (January) and 6.1 °C (July), and the annual mean air temperature is –5.7 °C. The monthly precipitation is highest (89 mm) in July and lowest (16 mm) in December, with an average annual precipitation of 402 mm.

3. Data and Methods

3.1. Geodetic Mass Balance

3.1.1. Digital Elevation Models (DEMs)

Four DEMs (topographic map DEM, SRTM_DEM, ASTER_DEM, and Sentinel-1 Synthetic Aperture Radar DEM) were adopted for estimating the changes in glacier surface elevation for the Sawir Mountains (Table 1). In addition, the topographic map data were collected in 1959, and the scale was 1:100,000. The contour lines in the topographic map were digitized manually using ArcGIS (Esri, Redlands, CA, USA) and then turned into a 30-m cell size DEM using triangular irregular network (TIN) polygons [16].
Geospatial data cloud service platform (http://www.usgs.gov (accessed on 1 January 2021) [17] was the source of the SRTM_DEM data measured by C− C-band and X− X-band satellite−borne imaging radar.
To extract the DEMs for the Sawir Mountains in 2014, the Advanced Spaceborne Thermal Emission and Reflection Radiometer (ASTER) on Terra Level 1A (L1A) (NASA/METI/AIST/Japan Space systems and U.S./Japan ASTER Science Team, 2001) (Band 3 N and Band 3B) was applied. The Sawir Mountains are often covered with clouds, and we could only find a few high-quality stereoscopic images in all the ASTER images obtained. Rather than the traditional automatic approach [18], this study manually selected control points on ground and tie points with Google Earth to process the DEMs, taking the SRTM_DEM (JPL, 2020) from 2000 as the reference.
Sentinel-1 Synthetic Aperture Radar (S-1 SAR) from the European Space Agency (ESA), which was accessed via Project Copernicus (https://www.copernicus.eu/en/project (accessed on 22 July 2021)), operates in C-band (central frequency = 5.405 GHz) with 6–12day repeated cycles, without consideration of day and night or atmospheric situations [19]. The spatial resolution of range and azimuth directions of ground range detected (GRD) data at level 1 is 20 by 22 m. The GRD products were monitored, multi-looked, and projected to the geometry of the ground ranges. Then, the radar backscatter intensity was calibrated and scaled using the SNAP API algorithms [20,21]. To create DEM from sentinel 1 data with snap software, the fundamental procedures are TOPS Split, which condenses the SLC data into a single sub-swath and some predetermined bursts, co-registration by Back Geocoding, ESD, and interferogram formation (including the elimination of the flat-Earth phase “flat”) [21]. The study required the use of a stand-alone statistical-based network-flow algorithm for phase unwrapping; the phase is unwrapped outside SNAP. After being imported into SNAP, the unwrapped phase is converted to metric units, given an external reference DEM, and geocoded using Range Doppler terrain correction.

3.1.2. Geodetic Mass Balance Calculation

Topographic map DEM (TYPO_DEM), ASTER_DEM, and Sentinel-1 DEM were co-registered to SRTM_DEM [22].
The data registration method proposed by Nuth [22] was then used. The results are shown in Table 2. After DEM data registration, owing to the difference in spatial resolution, different DEM data still have a certain elevation deviation. The study found that the relationship between elevation difference caused by spatial resolution and maximum curvature of the terrain is similar in glacier and non-glacier regions, but a high-resolution DEM is needed [23,24]. In this study, the maximum curvature of the terrain was extracted with the support of ENVI 4.8 software using Sentinel DEM. The non-glacial area was selected as the area of interest using ArcMap 10.3 software (Environment System Research Institute, ESRI, Redlands, CA, USA), followed by uniform extraction of points of interest in the non-glacial area and obtaining the difference in elevation of each point. The relationship between the difference in elevation and the maximum curvature of the terrain was obtained by linear fitting. Correction of glacier region elevations according to the maximum curvature relationship of the terrain in each DEM glacier region.
Geodetic methods were employed to derive the glacier mass balance based on multiple DEM differences. The geodetic mass balance was obtained by comparing the DEM data at different periods in the same region based on the area and density of the glacier [25,26]. The formula is as follows:
B N = ρ S g i = 1 N Δ h i S i
where BN is the geodetic mass balance, ρ refers to the density (850 ± 60 kg·m−3), The mass balance of a glacier is related not only to the size of the glacier area parameter but also directly to the average density (ρ) of snow and ice. It has been shown that the ρ range varies from 100 kg·m−3 to 917 kg·m−3; ρ is not measured in most studies [26]. Sg indicates the glacier region, N represents the total number of pixels, i denotes the difference in altitude between periods, and Si stands for the dimensions of a single pixel.

3.1.3. Uncertainty Assessment

The uncertainty of glacial mass balance ( σ Δ M ) was quantified from Formula (2):
σ Δ M = σ Δ M , r 2 + σ Δ M , s 2
where σ Δ M , r is the quadratic sum of the random errors and σ Δ M , s is systematic errors. The mitigation of systematic errors involves multiplying the result by a constant. In terms of random errors, we needed to consider the errors in elevation change rate ( σ d h / d t ), glacier area ( σ A ), and glacier density ( σ ρ , g ). We operated on the premise that the three kinds of uncertainty are independent of each other. The uncertainty in glacier area was 15% based on remote sensing pictures of glacier inventory [27]. Besides, the errors of glacier area σ A = 0.18A arise from the glacier retreating and surging. There are continental glaciers in the Sawir Mountains with the density error of σ ρ , g = 60 kg m−3 [28]. Brun et al. developed a technique for calculating uncertainty in the rates of altitude variation (2017). With the glaciological area in the Sawir Mountains exceeding the associated correlated area Acor, the altitude variation rate uncertainty can be presented:
σ d h / d t = σ Δ h , s A cor 5 A
where σ Δ h indicates the standard altitude variation error of the off-glacier region, 1 is the spatial correlated length (set to 500 m in this paper), and Acor = π 1 2 is the correlated area. The error in glacier volume change ( σ Δ V ) is therefore expressed as follows:
σ Δ V = A ( σ d h / d t ( p + 5 ( 1 p ) ) ) 2 + ( σ A A d h d t ) 2
where p refers to the observed region fraction, and factor 5 indicates the altitude variation uncertainty in the non-observed regions. Therefore, we can calculate the random error as follows:
σ Δ M , r = ( σ Δ V ρ g ) 2 + ( Δ V d t σ ρ , g ) 2 A
where Δ V represents the change in glacier volume. The random errors arising from factors present in the Sawir Mountains accounted for approximately 20% of the glacier mass balance. For the sake of convenience, this study applied 25% to be the overall uncertainty of the entire range as well as its sub-regions.

3.2. Glaciological Mass Balance

In the current work, the traditional stake/snowpit method was adopted to accomplish the mass-balance assessment on the Muz Taw glacier. The proposed approach makes use of a portable steam auger to place a minimum number of 25 stakes on the glacier surface, in 9 rows of 2 or 3 stakes each, with a spacing range of 100–200 m, and an average of 12–18 stakes/km2. It meets the basic observation requirements for the mass balance of glaciers. Initial observations of mass balance were made in late August 2014. Subsequent observations were made in late August or early September each year, ensuring one measurement per full year, which is referred to as a mass balance year. In the glacier ablation area, measurements are taken at pole points exposed to the snow and ice surface (accuracy in cm). Snow pits are excavated near each pole to the glacier ice surface to measure the thickness and density of the snow and as well as to describe the snow-firn and superimposed ice profile levels and their structural features. In the glacier accumulation area, the glacier net accumulation is directly observed by digging pits to observe snow-firn and ice crystals. It is worth noting that the snow pits should be dug at least as far as the fouling surface formed by the former mass balance year-end. Additionally, the the height of the stakes, density, and Structural features of ice flakes and snow-firn should be measured in layers and observed for the same period of time as the direct observation of the ablation areas.
In contrast to the glacier ablation area, it is difficult to observe the snow-firn, and ice crystals as this requires accurate identification of the ablation surface or fouling surface in late summer. Considering the influence of frequent summer precipitation events on the glacier surface, many fouling surfaces develop during the year. Therefore, artificial fouling surfaces (in the form of rain) need to be taken in the upper part of the glacier for correction. The calculation of glaciological specific mass balance is presented: [29]:
bn = bs + bice + bsi
where bs stands for the snow mass balance, and bice, bsi refer separately to the mass balances of glacier ice and superimposed ice. With the aim of calculating the glacier-wide mass balance, we converted the snow pit and stake height measurements in conjunction with the densities of snow (200 kg·m−3), firn (360 kg·m−3) and ice into water equivalent (w.e.).
Uncertainties in glaciological mass balances consist of systematic and random errors and arise primarily from uncertainties in spatial interpolation, point measurements, as well as glacier reference zone. As the study period in the present study is every two years, glacier reference region uncertainty is negligible, and, thus, measured snow–firn density and stake readings are the main causes of point measurement uncertainty. Huss et al. (2009) [30] calculated ± 0.1 and ± 0.3 m w.e. as the stake reading uncertainties for the accumulative and ablation regions. The mean stake reading error adopted for this study is ± 0.2 m w.e. In a study by Andreassen et al. (2016) [31], the error for glacier observation snow accumulation was determined to be 0.05 m w.e., while the uncertainty in point measurement was 0.25 m w.e. Because of the steep terrain in the high-altitude region of the Muz Taw glacier, researchers cannot reach the site to make measurements; therefore, measured data comes mainly from the ablation zone, which is the main reason for spatial interpolation uncertainty. For this reason, we conservatively estimated the spatial interpolation uncertainty to be 0.1 m w. e. a–1 for this study and, finally, calculated its glaciological uncertainty as ± 0.13 m w. e. a–1 [32].

3.3. Glacier Area

The glacier outline in the investigated periods must be acquired to analyze the mass balance, so we selected remote sensing images from June to August from the Landsat-7 and Sentinel-1 data. The acquisition periods were the 2000 and 2021 glacier melt seasons. The U.S. Geological Survey (http://www.usgs.gov (accessed on 22 July 2021)) was the source of image data, and the Google Earth Engine (GEE) was employed to analyze the imagery quickly and efficiently and integrate the geospatial data that could be made available for use in this study.
The uncertainty of manually drawn glacier edges is a function of several parameters, including picture quality, clouds, snow cover, as well as mountain shadows [33]. Through calculating the number of pixels traversed by the glacier edges, it was found that the delineation uncertainty of the Sawir Mountains’ glacier region in 2000 and 2020 was 4.70% and 4.86%, respectively.

3.4. Meteorological Data

The available automatic weather station data of the Muz Taw glacier cover a short period, so we used meteorological data from the Jimunai station (Elevation: 984 m, 1961–2021) and Hebukesai’er station (Elevation: 1292 m, 1961–2021) (CMDC; http://data.cma.cn/ (accessed on 23 July 2021)) to analyze regional climate change. These stations are approximately 45 km northeast and 36 km southwest of the Muz Taw glacier, respectively.

4. Results

4.1. Glacier Area Change

The past 62 years have seen prominent and persistent retreat of the Sawir Mountains’ glaciers, whose area has shrunk from 16.84 ± 0.79 km2 to 9.11 ± 0.42 km2 from 1959 to 2021, representing a total reduction of 7.73 ± 0.38 km2, an overall glacier area loss rate of 45.90%, and an average reduction of 0.12 km2·a−1. In addition, the average annual glacier reduction rate presented an increasing trend (Figure 2a), and from 2000 to 2021, the decrease in the glacier area notably accelerated. The Muz Taw glacier exhibited an area reduction at the rate of 31% during the 62-year study period (from 4.27 ± 0.2 km2 in 1959 to 2.93 ± 0.14 km2 in 2021).

4.2. Changes in Glacier Surface Elevation and Geodetic Mass Balance (1959–2021)

Figure 3 displays the temporal and spatial variations of surface altitude change for the Sawir Mountain glaciers from 1959 to 2000 and from 2000 to 2021. With the annual average surface elevation change of −0.56 ± 0.14 m·a−1, the surface elevation change for the glaciers was −34.89 ± 0.87 m. The cumulative mass balance between 1959–2021 was −29.65 ± 0.74 m w. e. for the glaciers. The 1959–to–2000 variation of glacier surface elevation was −20.73 ± 0.51 m, with the average change of −0.51 ± 0.12 m·a−1. Meanwhile, the mass balance was up to −17.62 ± 0.25 m w. e., showing a mean of −0.43 ± 0.1 m w. e. a−1. From 2000 to 2021, the glacier altitude variation was −14.01 ± 0.25 m, with the average change of −0.67 ± 0.16 m·a−1, while the mass balance was −11.90 ± 0.29 m w. e., showing a mean of −0.56 ± 0.14 m w. e. a−1. This suggests that glacier mass loss was much more rapid from 2000 to 2021 than before 2000. On the basis of spatiotemporal geodesic data, the 2017–2018 mass balance in the ablation zone of the surveyed glacier was −1.33 ± 0.33 m w. e. a−1 [12]. The obtained values (−1.25 ± 0.31 m w. e. a−1/2000−2021) conform to the ablation zone’s mass balance at the elevation of 3100–3300 m a.s.l.
Considerable elevation variation can be found in the ablation area, while the elevation variation is relatively small in high-altitude regions. From 1959 to 2021, 85.83% of the glacier surface was in a state of decline, 68.71% from 1959 to 2000, and 74.79% from 2000 to 2021. The rate of surface elevation decline increased from 2000 to 2021.
Figure 4 presents the correlation between changes in the mass balance, altitude, and glacier area in 100-m elevation increments. Glacier area changes are found to be focused within elevations of 3200 to 3700 m a.s.l, and areas with a change of more than 0.5 km2 are 3250−3550 m a.s.l, accounting for 68.13%. The figure also illustrates that the mass balance loss rate is abnormal between 3650 and 3750 m a.s.l, being lower than at other elevations, which may be related to glacier movement. According to the glacier elevation data, the contour lines between 3650 m a.s.l and 3750 m a.s.l are relatively close, indicating that steep surface and rapid movement of the glacier. Consequently, the solid precipitation is high, resulting in an increasingly lower mass loss in the altitude interval.

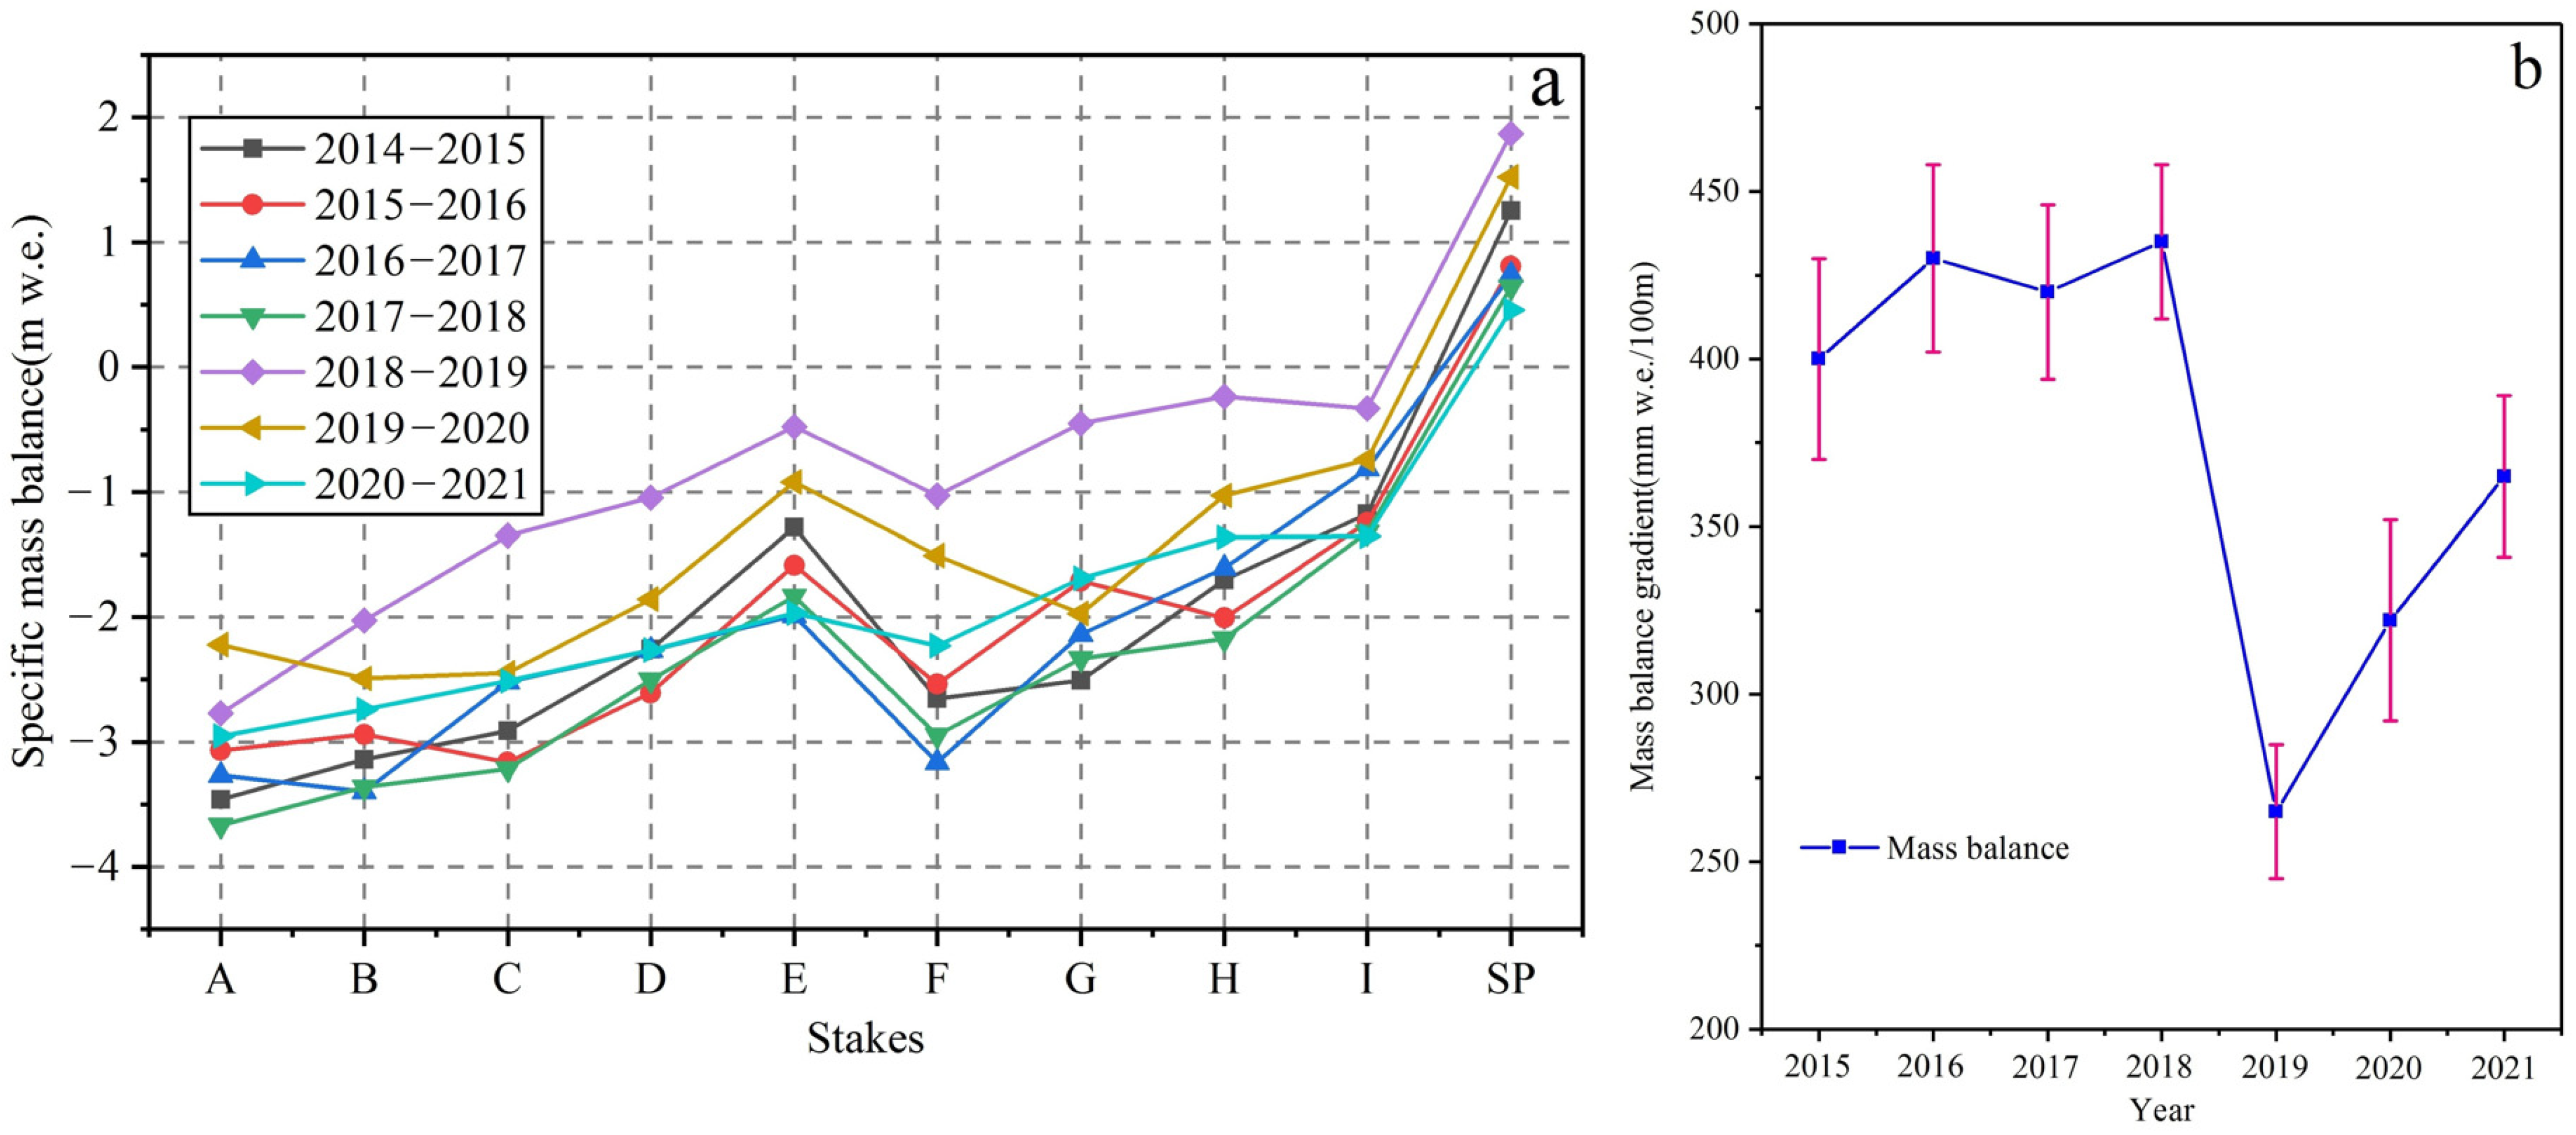
4.3. Glaciological Mass Balance (2014–2021)

For the Muz Taw glacier, negative mass balance was noted in the ablation zone (A-I), while positive mass balance was observed in the accumulation zone (snow pits 1 and 2) from 2014 to 2021. The single-point mass balance has a high consistency at the same altitude, and the mass balance curve shows an overall increasing trend along the altitude with a consistent gradient from year to year (Figure 5a). The single-point mass-balance scope for the surveyed glacier was between –3669 and 1900 mm w.e., with the average value of –1756 mm w.e. across these seven years. The mass balance change shows a certain pattern spatially below row E. The closer it to the terminus, the stronger the change in mass balance. In contrast, above row F, the change of mass balance weakens with the increase in altitude. This is because the elevation of the glacier terminus is low and is susceptible to the influence of low altitude air temperature, while rows G, H, and I are close to the accumulation area and are susceptible to ice avalanches, avalanches, and topography. From 2014 to 2021, large inter-annual mass-balance variabilities were observed for the Muz Taw glacier, seperately showing –821 ± 130 mm w.e., –975 ± 130 mm w.e., –1192 ± 130 mm w.e., –1286 ± 130 mm w.e., –310 ± 130 mm w.e., –666 ± 130 mm w.e., as well as –934 ± 130 mm w.e. The average mass balance reached –883.4 ± 130 mm a–1 during the same period.
The altitude-dependent mass balance variation, i.e., the gradient for glacier mass balance, can reflect local climate change [34], and to study this further, the association between the multi-year average mass balance of the observation sites on the Muz Taw glacier and their elevation is calculated here. The multi-year mass balance is used mainly because extremes exist at individual observation sites due to the topography and other factors. The average smooths out these extremes. According to the findings, the mass loss of the Muz Taw glacier lowers when the elevation increases (R2 = 0.823, p < 0.01). The maximum gradient for the Muz Taw glacier mass balance from 2014 to 2021, when analyzed from the perspective of single-point mass balance in Figure 5b, is –435 ± 25 mm w. e. (100 m)–1, and the minimum value reaches –265 ± 20 mm w. e. (100 m)–1, with the mean being –376 ± 24 mm w. e. (100 m)–1.

5. Discussion

5.1. Comparison of Geodetic and Glaciological Mass Balances

This study is the first where the GMB is evaluated for such a long period in a Central Asia region. However, the geodetic mass balance record from the Sawir Mountains’ glaciers must be verified, and the simplest approach to do this is to estimate the glaciological mass balance at set intervals.
The Muz Taw glacier’s glaciological mass balance is the only measured mass balance in the Sawir Mountains region that can be utilized in analyzing how the climatic alteration impact the glaciers and water supplies. For the geodetic versus glaciological mass balance validation (Figure 6), Zemp and colleagues (2013, Eqns19–21) [35] determined that both mass balances are more constant if the reduced discrepancy (δ) is closer to zero (the values vary from 0.03 to 0.22). The consistency between the two mass balances can be regarded to be good (F) because it is in the 95% (|δ| < 1.96) CIs. Therefore, the present study compared the geodetic versus glaciological mass balances for individual ablation stakes from 2014 to 2021 and found that the correlation coefficient (R2 > 0.85), with the RMSEs varying between 0.60–1.20 m w. e. a−1, as displayed in Figure 6.

5.2. Comparison with Neighboring Mountain Glaciers

Over the past few decades, the continental-type glaciers of Central Asia have been characterized by rapid retreat and sustained mass loss [33]. Because the climate is warming, the mass-balance volumes of the aforementioned glaciers have been negative for a few decades, causing their ice volume to decrease greatly. The mean mass balance loss in the Altay Mountains (85° E–94° E, 46° N–52° N) was –0.32 ± 0.09 m w. e. a−1 for a 2000–2011 period [36]. With the 2000–to–2016 rate of mass loss being −0.28 ± 0.2 m w. e. a–1, the glacier mass loss rate in the Tianshan Mountains (76° E–86° E, 41° N–45° N) is similar [18]. In addition, the Sawir Mountains exhibit notably higher (−0.88 ± 0.13 m w. e. a−1) glacier mass loss than that in other regions (Table 3). Comparing our results with the other glaciers under observation, we confirm that the Muz Taw glacier has experienced mass loss over the decades, and this mass loss is twice that of the other glaciers. Small glaciers are more prone to lose mass quickly, according to the special report on the ocean and cryosphere (SROCC) [37]. The Sawir Mountain range glaciers in this research region is less than 1 km2 in area, occupying 71.43% of the whole number of regional glaciers. In addition, the apparently high rate of glacier retreat in the Sawir Mountains is also related to the relatively high regional temperatures and the low altitude of the glacier terminus.

5.3. Glacier Morphology and Geometry

Glacier changes are closely related to glacier morphology and geometry. In 1959–2021, the size of the area resulted in different trends of glacier changes. The area of glacier ranges ≤ 0.1 km2 decreased and then increased, the area of glaciers in the range of 0.1–0.5 km2 increased and then decreased, and the area of glacier ranges > 0.5 km2 continued to decrease. Glacier melting causes larger glaciers to break up into smaller glaciers, so the area of small glaciers becomes larger. Further statistical studies of single glacier areas and their rates of change show that the rate of glacier area retreat decreases and stabilizes with increasing glacier area size. Glaciers on aspect in the study area were in retreat (1959–2021) with the most severe retreat on the south slope (85.35%), followed by the southeast (83.46%), southwest (83.21%), and north slopes (38.56%), and the least retreat on the northeast slope (30.78%). Glaciers on the southerly slope receive more solar radiation and retreat more, while glaciers on the northerly slope are more likely to develop and accumulate. Combined with the DEM data, the glacier terminus elevation on the south slope (3493 m a.s.l) is 333 m higher than the glacier terminal elevation on the north slope (3160 m a.s.l), but the glacier ablation rate on the south slope is twice as high as that on the north slope, so the glacier terminal elevation is not the main factor of the glacier ablation difference. The higher ablation rate of glaciers on the south slope is also related to the different sizes of single glaciers. The average area of glaciers on the south slope is 0.33 km2, while the average area of glaciers on the north slope is 1.68 km2, resulting in a higher ablation rate of glaciers on the south slope of Sawir mountain. In addition, the majority of glacier slopes are 5° to 40°, accounting for 90.37% of the total area. Glaciers on all slopes are in retreat, but the retreat rates vary greatly among slopes, with retreat rates of 5° to 15° (37.5%), 15° to 25° (44.6%), 25° to 35° (53.3%), and 35° to 40° (58.2%), respectively. The results showed that the retreat rate showed an increasing trend as the slope increased.

5.4. Climate Background

The region can be mostly impacted by polar continental air masses in winter and by water vapor from the East Asian monsoon in summer. Westerlies affect the region throughout the year, especially in winter [39]. There is a significant seasonal air temperature difference, indicating that air temperature is the dominant factor for accelerated glacier mass loss and elevation change. Given the location of the study area, the data from two meteorological stations in Jimnai and Haboksair were selected for analysis in this paper. Data from 2 weather stations were selected for a long time series climate change analysis, which, although is not a good and accurate reflection of possible changes of air temperature exactly at studied glaciers, however it can be used to explore the climatic context of the whole region. Figure 7 presents a comparative analysis of the average annual versus summer-time air temperatures for the two meteorological stations from 1961 to 2021. The annual average air temperature and summer average air temperature within this period were 4.17 °C and 18.86 °C, separately (Figure 7). Additionally, the regional warming process started gradually in the 1980s and further intensified after 2000 (JH), which corresponds to the onset of accelerated retreat of regional glaciers. To analyze the process of air temperature change, this paper takes 2000 as the node and divides the period in two. The annual average air temperatures of 1961–2000 and 2000–2021 are separately 3.78 °C and 4.93 °C, and the corresponding warming rates are +0.41 °C/10a and +0.45 °C/10a. Compared with 1961–2001, the air temperature rose relatively rapidly in 2000–2021 (Figure 7a). The average summer air temperatures in 1961–2000 and 2000–2021 were 18.49 °C and 19.53 °C, separately, and the corresponding rates of warming were +0.29 + °C/10a and +0.38 °C/10a, with the average summer air temperature rising nearly 1.1 °C more rapidly after 2000 compared with before 2000 (Figure 7b). Overall, the region showed an increasing tendency in air temperature from 1961 to 2021 on both annual and seasonal scales, both of which exceeded the global mean warming rate (0.12 °C/10a, 1951–2012s) [36].

6. Conclusions

The glaciers of the Sawir Mountains are an important local freshwater resource that is closely related to regional water reserves and Ecological balance. However, studies on detailed glacier mass changes are still vacant. This study presents the first data on glaciological and long-time series of geodetic mass balance estimates.
The traditional stake/snowpit method was adopted to measure the Muz Taw glacier’s mass balance from 2014 to 2021 in this study. The single-point glacier mass balance varied between –3669 and 1.872 mm w.e., We learned that the average value over the seven years is –1756 mm w.e. and the average mass balance of –883.4 ± 0.13 mm a−1 during the same period. Based on multi-source DEM data from 1959 to 2021, the glacier surface elevation of the Sawir Mountains significantly decreased (−0.56 ± 0.14 m·a−1), −34.89 ± 0.87 m, and the corresponding cumulative mass balance was −29.65 ± 0.74 m w. e., so the annual average mass balance was −0.47 ± 0.11 m w. e. a−1. The inversion results of the comparative analysis of geodetic and glaciological mass balance changes for the period 2014–2021 are good (the correlation coefficient R2 > 0.85). This demonstrates the feasibility of using multivariate DEM data to assess the glaciological mass balance.
Overall, air temperature showed an increasing trend on both annual and seasonal scales from 1961–2021. Air temperature is the dominant factor in glacier retreat in the region. Besides, the increase in air temperature (+0.45 °C/10a) from 2000 to 2021 is relatively accelerated from 1961 to 2000 (+0.41 °C/10a). Comparisons with glacier changes in other regions show significantly higher rates of glacier retreat in the Sawir Mountains, which are associated with relatively higher regional temperatures, a higher proportion of smaller glaciers, and lower elevations at the glacier terminus. The study found that glacier retreat is most severe on the south slope, with a retreat rate of 85.35%, and that glacier retreat tends to increase with slope, reaching a maximum at 35° to 40° (58.2%).
Water resource problems in the Sawir Mountains region due to glacier changes have become very serious. Observations of regional glacier advance and retreat, glacier mass accumulation and ablation, and indicators of glacier velocity, temperature and ice thickness have become an urgent need for future research. GPR, UAV, and glacier monitoring towers will be integrated based on existing observations to further strengthen ground observations. These can be used to effectively conduct seasonal and monthly scale glacier surface coverage surveys, enrich glacier information, and research tools, and further reduce computational errors.

Author Contributions

C.B. and F.W.; methodology C.B. and F.W.; software, C.B., Y.B. and S.Y.; validation, F.W.; formal analysis, C.B. and L.W., investigation, F.W.; resource P.W., C.X. and X.Y.; data curation, C.B. and F.W.; writing original draft preparation, C.B. and F.W.; funding acquisition F.W., P.W., C.X. and X.Y. All authors have read and agreed to the published version of the manuscript.

Funding

We thank the Third Comprehensive Scientific Expedition of Xinjiang Uyghur Autonmous Region (2022xjkk0802), the National Natural Science Foundation of China (42001066, 42001067), the State Key Laboratory of Cryospheric Science (SKLCS-ZZ-2022), and the Open-end Foundation for National Cryosphere Desert Data Center (20D05), the Youth Innovation Promotion Association of Chinese Academy of Sciences (Y2021110).

Data Availability Statement

Not applicable.

Acknowledgments

We thank the NASA, NIMA, and CIAT for providing the version 4.1 SRTM data, and the CMDS for providing the meteorology data.

Conflicts of Interest

The authors declare no conflict of interest.

References

  1. Kaser, G.; Grosshauser, M.; Marzeion, B. Contribution Potential of Glaciers to Water Availability in Different Climate Regimes. Proc. Natl. Acad. Sci. USA 2010, 107, 20223–20227. [Google Scholar] [CrossRef] [Green Version]
  2. Gardner, A.S.; Moholdt, G.; Cogley, J.G.; Wouters, B.; Arendt, A.A.; Wahr, J.; Berthier, E.; Hock, R.; Pfeffer, W.T.; Kaser, G.; et al. A Reconciled Estimate of Glacier Contributions to Sea Level Rise: 2003 to 2009. Science 2013, 340, 852–857. [Google Scholar] [CrossRef] [Green Version]
  3. Solomina, O.N.; Bradley, R.S.; Jomelli, V.; Geirsdottir, A.; Kaufman, D.S.; Koch, J.; McKay, N.P.; Masiokas, M.; Miller, G.; Nesje, A.; et al. Glacier fluctuations during the past 2000 years. Quat. Sci. Rev. 2016, 149, 61–90. [Google Scholar] [CrossRef] [Green Version]
  4. Wang, L.; Liu, C.; Kang, X.; You, G.X. Fundamental features of modern glaciers in the Altay Mountain of China: A cast study of Halasi Glacier. J. Glaciol. Geocryol. 1983, 5, 27–38. [Google Scholar]
  5. Kamp, U.; Pan, C.G. Inventory of Glaciers in Mongolia, Derived from Landsat Imagery from 1989 to 2011. Geogr. Ann. Ser. A Phys. Geogr. 2015, 97, 653–669. [Google Scholar] [CrossRef]
  6. Shen, Y.; Su, H.; Wang, Y.; Mao, W.M.; Wang, S.D.; Han, P.; Wang, W.; Li, Z.Q. The responses of glaciers and snow cover to climate change in Xinjing (I): Hydrological effect. J. Glaciol. Geocryol. 2013, 35, 513–527. [Google Scholar]
  7. Li, Z.; Li, K.; Wang, L. Study on recent glacier changes and their impact on water resources in Xinjiang, northwestern China. Quat. Sci. 2010, 30, 96–106. [Google Scholar]
  8. Dehecq, A.; Gourmelen, N.; Gardner, A.S.; Brun, F.; Goldberg, D.; Nienow, P.W.; Berthier, E.; Vincent, C.; Wagnon, P.; Trouvé, E. Twenty-first century glacier slowdown driven by mass loss in High Mountain Asia. Nat. Geosci. 2019, 12, 22–27. [Google Scholar] [CrossRef]
  9. Hugonnet, R.; McNabb, R.; Berthier, E.; Menounos, B.; Nuth, C.; Girod, L.; Farinotti, D.; Huss, M.; Dussaillant, I.; Brun, F.; et al. Accelerated global glacier mass loss in the early twenty-first century. Nature 2021, 592, 726–731. [Google Scholar] [CrossRef]
  10. Huai, B.; Li, Z.; Wang, F.; Wang, P. Variation of glaciers in the Sawuer Mountain within Chinese territory during 1959–2013. J. Glaciol. Geocryol. 2015, 37, 1141–1149. [Google Scholar]
  11. Wang, Y.; Zhao, J.; Li, Z.; Zhang, M. Glacier changes in the Sawuer Mountain during 1977–2017 and their response to climate change. J. Nat. Resour. 2019, 34, 802–814. [Google Scholar] [CrossRef]
  12. Xu, C.; Li, Z.; Wang, F.; Mu, J. Spatio–Temporal Changes of Mass Balance in the Ablation Area of the Muz Taw Glacier, Sawir Mountains, from Multi–Temporal Terrestrial Geodetic Surveys. Remote Sens. 2021, 13, 1465. [Google Scholar] [CrossRef]
  13. Wang, Z. New statistical figures and distribution feature of glaciers on the various mountains in China. J. Glaciol. Geocryol. 1988, 11, 8–14. [Google Scholar]
  14. Shi, Y. Concise China Glacier Inventory; Shanghai Science Popularization Press: Shanghai, China, 2005; pp. 1–490. [Google Scholar]
  15. Wang, F.; Yue, X.; Wang, L.; Li, H.; Du, Z.; Ming, J.; Li, Z. Applying artificial snowfall to reduce the melting of the Muz Taw Glacier, Sawir Mountains. Cryosphere 2020, 14, 2597–2606. [Google Scholar] [CrossRef]
  16. Wang, P.; Li, Z.; Li, H.; Wang, W.; Zhou, P.; Wang, L. Characteristics of a partially debris-covered glacier and its response to atmospheric warming in Mt. Tomor, Tien Shan, China. Glob. Planet. Chang. 2017, 159, 11–24, ISSN 0921-8181. [Google Scholar] [CrossRef]
  17. Farr, T.G.; Rosen, P.A.; Caro, E.; Crippen, R.; Duren, R.; Hensley, S.; Kobrick, M.; Paller, M.; Rodriguez, E.; Roth, L.; et al. The shuttle radar topography mission. Rev. Geophys. 2007, 45, 1–43. [Google Scholar] [CrossRef] [Green Version]
  18. Brun, F.; Berthier, E.; Wagnon, P.; Kaab, A.; Treichler, D. A spatially resolved estimate of High Mountain Asia glacier mass balances from 2000 to 2016. Nat. Geosci. 2017, 10, 668–673. [Google Scholar] [CrossRef] [Green Version]
  19. Massonnet, D.; Feigl, K.L. Radar interferometryand its application to changes in the Earth’s surface. Rev. Geophys. 1998, 36, 441–500. [Google Scholar] [CrossRef] [Green Version]
  20. Wangchuk, S.; Bolch, T.; Zawadzki, J. Towards automated mapping and monitoring of potentially dangerous glacial lakes in Bhutan Himalaya using Sentinel-1 Synthetic Aperture Radar data. Int. J. Remote Sens. 2019, 40, 4642–4667. [Google Scholar] [CrossRef]
  21. Peters, M. How to Use the SNAP API from Python. 2020. Available online: https://senbox.atlassian.net/wiki/spaces/SNAP/pages/19300362/HowþtoþusetheSNAPþAPIþfromþPython (accessed on 22 July 2021).
  22. Nuth, C.; Kääb, A. Co–registration and bias corrections of satellite elevation data sets for quantifying glacier thickness change. Cryosphere 2011, 5, 271. [Google Scholar] [CrossRef] [Green Version]
  23. Paul, F. Calculation of glacier elevation changes with SRTM: Is there an elevation–dependent bias. J. Glaciol. 2008, 54, 945–946. [Google Scholar] [CrossRef] [Green Version]
  24. Gardelle, J.; Berthier, E.; Arnaud, Y. Impact of resolution and radar penetration on glacier elevation changes computed from DEM differencing. J. Glaciol. 2012, 58, 419–422. [Google Scholar] [CrossRef] [Green Version]
  25. Thibert, E.; Blanc, R.; Vincent, C.; Eckert, N. Instruments and Methods Glaciological and volumetric mass–balance measurements: Error analysis over 51 years for Glacier de Sarennes, French Alps. J. Glaciol. 2008, 54, 522–532. [Google Scholar] [CrossRef] [Green Version]
  26. Fischer, A. Comparison of direct and geodetic mass balances on a multi–annual time scale. Cryosphere 2010, 5, 107–124. [Google Scholar] [CrossRef] [Green Version]
  27. Nuimura, T.; Sakai, A.; Taniguchi, K.; Nagai, H.; Lamsal, D.; Tsutaki, S.; Kozawa, A.; Hoshina, Y.; Takenaka, S.; Omiya, S.; et al. The GAMDAM glacier inventory: A quality-controlled inventory of Asian glaciers. Cryosphere 2015, 9, 849–864. [Google Scholar] [CrossRef]
  28. Zemp, M.; Hoelzle, M.; Haeberli, W. Six decades of glacier mass-balance observations: A review of the worldwide monitoring network. Ann. Glaciol. 2009, 50, 101–111. [Google Scholar] [CrossRef] [Green Version]
  29. Wang, P.; Li, Z.; Li, H.; Yao, H.; Xu, C.; Zhou, P.; Jin, S.; Wang, W. Analyses of recent observations of Urumqi Glacier No.1, Chinese Tianshan Mountains. Environ. Earth Sci. 2016, 75, 720. [Google Scholar] [CrossRef]
  30. Huss, M.; Bauder, A.; Funk, M. Homogenization of long term mass balance time series. Ann. Glaciol. 2009, 50, 198–206. [Google Scholar] [CrossRef] [Green Version]
  31. Andreassen, L.M.; Elvehøy, H.; Kjøllmoen, B.; Engeset, R.V. Reanalysis of long-term series of glaciological and geodetic mass balance for 10 Norwegian glaciers. Cryosphere 2016, 10, 535–552. [Google Scholar] [CrossRef] [Green Version]
  32. Xu, C.; Li, Z.; Wang, P.; Anjum, M.N.; Li, H.; Wang, F. Detailed comparison of glaciological and geodetic mass balances for Urumqi Glacier No.1, eastern Tien Shan, China, from 1981 to 2015. Cold Reg. Sci. Technol. 2018, 155, 137–148, ISSN 0165-232X. [Google Scholar] [CrossRef]
  33. Bolch, T.; Pieczonka, T.; Benn, D.I. Multi-decadal Mass Loss of Glaciers in the Everest Area (Nepal Himalaya) Derived from Stereo Imagery. Cryosphere 2011, 5, 349–358. [Google Scholar] [CrossRef] [Green Version]
  34. Haeberli, W. Historical evolution and operational aspects of worldwide glacier monitoring. In Into the Second Century of Worldwide Glacier Monitoring: Prospects and Strategies (Studies and Reports in Hydrology); Haeberli, W., Hoelzle, M., Suter, S., Eds.; UNESCO: Paris, France, 1998; Volume 56, pp. 35–51. [Google Scholar]
  35. Zemp, M.; Thibert, E.; Huss, M.; Stumm, D.; Rolstad Denby, C.; Nuth, C.; Nussbaumer, S.U.; Moholdt, G.; Mercer, A.; Mayer, C.; et al. Reanalysing glacier mass balance measurement series. Cryosphere 2013, 7, 1227–1245. [Google Scholar] [CrossRef] [Green Version]
  36. Dahe, Q.; Stocker, T. Highlights of the IPCC Working Group I Fifth Assessment Report. Adv. Clim. Chang. Res. 2014, 10, 1–6. [Google Scholar]
  37. Chang, J.; Wang, N.; Li, Z.; Yang, D. Accelerated Shrinkage of Glaciers in the Altai Mountains from 2000 to 2020. Front. Earth Sci. 2022, 10, 919051. [Google Scholar] [CrossRef]
  38. Zhang, H.; Li, Z.; Zhou, P.; Zhu, X.; Wang, L. Mass-balance observations and reconstruction for Haxilegen Glacier No.51, eastern Tien Shan, from 1999 to 2015. J. Glaciol. 2018, 64, 689–699. [Google Scholar] [CrossRef] [Green Version]
  39. Zhang, Y.; Gao, T.; Kang, S.; Sprenger, M.; Tao, S.; Du, W.; Yang, J.; Wang, F.; Meng, W. Effects of black carbon and mineral dust on glacial melting on the MuzTaw glacier, Central Asia. Sci. Total Environ. 2020, 740, 140056. [Google Scholar] [CrossRef]
Figure 1. The study area of the Sawir Mountains and its geographical location (a); and distribution of glaciers in the Sawir Mountains (b) (the background is from Google Earth). Specifically, the Muz Taw glacier is marked on the map (red points represent ablated stakes).
Remotesensing 14 05406 g001
Figure 2. (a,b) Change in glacier area and terminus of all glaciers in the Sawir Mountains and the Muz Taw glacier from 1959 to 2021.
Remotesensing 14 05406 g002
Figure 3. Glacier Surface elevation change of the Sawir Mountains’ glaciers from 1959 to 2000, and from 2000 to 2021.
Remotesensing 14 05406 g003
Figure 4. Area and mass balance changes with elevation from 1959 to 2021. The bar chart and broken line chart show changes in the glacier area as well as the mass balance at different altitudes, respectively.
Remotesensing 14 05406 g004
Figure 5. Single-point mass-balance variations for the Muz Taw Glacier stakes from 2014 to 2021 (a); altitude-dependent annual variation of mass-balance gradients for the Muz Taw Glacier (b); based on the point and altitude band measurements.
Remotesensing 14 05406 g005
Figure 6. The Muz Taw glacier glaciological glacier surface elevation changes from 2014 to 2021 (a); The Muz Taw glacier Geodetic mass balance and glaciological mass balance of stakes from 2014 to 2021 (b).
Remotesensing 14 05406 g006
Figure 7. Interannual variation of annual air temperature (a) and summer air temperature (b) in the Sawir Mountains (The blue line represents Air temperature average value in 1960-2000, The red line represents Air temperature average value in 2000–2021).
Remotesensing 14 05406 g007
Table 1. Data sources for observations of the Sawir Mountains.
DataScale/ResolutionDateApplication
Topographic map1:100,0001959DEM and Base image
Shuttle Radar Topography Mission DEM Version 4.1(SRTM 4.1)30 m2000DEM
ASTER_DEM30 m2014DEM
Sentinel−1SAR 10 m2021DEM and Base image
Landsat Multi-Spectral Scanner (MSS)60 m1980Base image
Landsat Thematic Mapper (TM)30 m1990Base image
Landsat Enhanced Thematic Mapper (ETM+)30 m2000; 2010Base image
Table 2. Statistics regarding accuracy of DEMS and the offsets in X, Y, and Z directions of the DEM and vertical errors between 1959 (TOPO DEM), 2000 (SRTM DEM) and 2016 (ASTER DEM).
Accuracy of DEMsOffsets in x, y, and z DirectionsBefore Co-RegistrationAfter Co-RegistrationNSEE
nσDEMx(m)y(m)z(m)MEDSTDVnoglcMEDSTDVnoglc
TOPO DEM100±0.5322.85−1.850.1614.2848.300.7436.2514,4020.300.79
SRTM DEM100±0.3315.26−0.030.154.2921.830.7512.6818,5340.190.63
ASTER DEM100±0.3612.42−0.010.172.6827.880.5315.0219,0870.110.54
Table 3. Comparison of glacier changes in different regions using data from the literature and this paper.
MountainGlacier NameArea (km2)Altitude (m)Main AspectAnnual Air Temperature (°C)PeriodMass Balance
(m w. e. a−1)
Reference
Altay MountainLeviy Aktru glacier5.952665–4030northern−8.22000–2011−0.26 ± 0.1[36]
Maliy Aktru glacier2.732267–3710northern−6.72000–2011−0.31 ± 0.1[36]
Vodopadnity Aktru glacier0.982716–3549northern−6.12000–2011−0.39 ± 0.1[36]
Tianshan MountainUrumqi glacier No.11.593743–4484northern−4.91981–2015−0.46 ± 0.14[38]
Tuyuksu glacier2.283500–4300northern−6.61958–2016−0.38 ± 0.05[38]
Haxilegen Glacier No.511.183490–4000northeast−7.41999–2015−0.32 ± 0.22[38]
Sawir MountainMuz Taw glacier2.933030–3725 northern−5.72014–2021−0.88 ± 0.13This paper
Publisher’s Note: MDPI stays neutral with regard to jurisdictional claims in published maps and institutional affiliations.

