Abstract
Accurate change detection continues to pose challenges due to the continuous renovation of old urban areas and the emergence of cloud cover in coastal areas. There have been numerous methods proposed to detect land-cover changes from optical images. However, there are still many flaws in many existing deep learning methods. In response to the problems of unpredictable change details and the lack of global semantic information in deep learning-based change detection models, a change detection model based on multi-scale and attention is proposed. Firstly, a multi-scale attention module is proposed to effectively obtain multi-scale semantic information to build an end-to-end dual multi-scale attention building change detection model. Secondly, an efficient double-threshold automatic data equalization rule is proposed to address the imbalance of data categories existing in the building change detection dataset, which effectively alleviates the severely skewed data distribution and facilitates the training and convergence of the model. The validation experiments are conducted on three open-source high-resolution building change detection datasets. The experimental results show that the proposed method in this paper can detect the location and area of the actual building changes more accurately and has better results in the detail detection part. This verifies the effectiveness and accuracy of the proposed method.
1. Introduction
As an active element in cities, buildings undergo many changes due to natural or unnatural factors. Monitoring buildings dynamically is essential to extract accurate and efficient information regarding changes [1]. Building change detection refers to the analysis of buildings on two or more time-phased images taken in the same geographical area to obtain information on the changes before and after the state of the building changes [2,3,4]. Additions, demolitions, and alterations are three categories of building modifications. In actual practice, buildings are monitored dynamically, mainly by manual field surveys and visual interpretation, which are highly accurate but inefficient and do not have the problems of real time, practicality, and universality. Building change detection must be automated to meet the growing demand for dynamic monitoring, which saves significant labor, material, and time costs [5].
Earth observation technology has developed rapidly, resulting in a high spatial, spectral, and temporal resolution in remote sensing images. High-resolution multi-temporal remote sensing data can be acquired rapidly from the same or different satellite sensors, providing an important data source for building change detection [6,7,8,9]. A remote sensing system based on optical images can provide timely, accurate, and practical information about changes [10]. Change detection algorithms include direct comparison methods [11,12] and post-classification comparison methods [13,14]. The former uses the time-series image features of the exact location to determine the location and range of the change [15,16]. With the rapid development of deep learning in the image field, traditional classification methods such as principal component analysis, support vector machines, and random forests have gradually been replaced by convolutional neural networks (CNNs) based on their powerful feature extraction capabilities [17,18,19]. Krizhevsky [20] applied a neural network toward image segmentation by replacing the fully connected layer in the AlexNet network with a convolutional layer to achieve pixel-level classification. Foivos et al. [21] constructed a variant of the Dice coefficient. They proposed the FracTAL ResNet for building change detection, which achieved the best accuracy on the LEVIR-CD [22] and WHU [23] datasets. Liu et al. [24] presented a dual-task constrained deep dual convolutional neural network for detecting building changes. The model performs both semantic segmentation and change detection simultaneously. They introduce a dual attention module to enhance the feature representation by interdependence between channels and spatial locations. The model is effective at detecting building changes. Peng et al. [25] used the Google dataset to construct a semi-supervised convolutional neural network for building change detection that utilizes adversarial networks. It effectively solves the problem of requiring a large amount of labeled data for training supervised networks while having high accuracy in detecting changes.
Remote sensing image change detection needs to classify each pair of pixels on the image pair to determine whether it has changed [26]. There are often associations between close pixels, and they influence each other. Therefore, constructing long-distance dependencies and global semantic information is essential for obtaining the final change result [27]. The current deep learning-based framework for building change detection mainly uses the encoder–decoder architecture. This framework extracts features by convolution and pooling downsampling to expand the perceptual domain. Image resolution is recovered by deconvolution or interpolation upsampling. Additionally, the pixel-level classification of images is implemented by combining jump structures to fuse semantic information [28]. Compared with classical change detection methods, the detection effect is significantly improved. However, the current mainstream deep learning-based change detection algorithms still have the following problems: (1) These algorithms expand perceptual fields primarily by controlling the step size of convolution and pooling. Still, downsampling obliterates structured information in images, resulting in poor model prediction on small changes because small objects cannot be recovered for reconstruction. (2) These algorithms rely mainly on convolution to extract features, and the lack of long-distance dependencies between pixels and global semantic information leads to poor model predictions.
This paper proposes a novel multi-scale attention module that can solve the problems of long-distance dependence between pixels and difficulties in obtaining global semantic information. In this paper, an end-to-end dual multi-scale attention network model based on dual neural networks is constructed by combining cavity convolution, which can expand the perceptual domain without reducing the feature map size and prevent the loss of structured information.
2. Materials
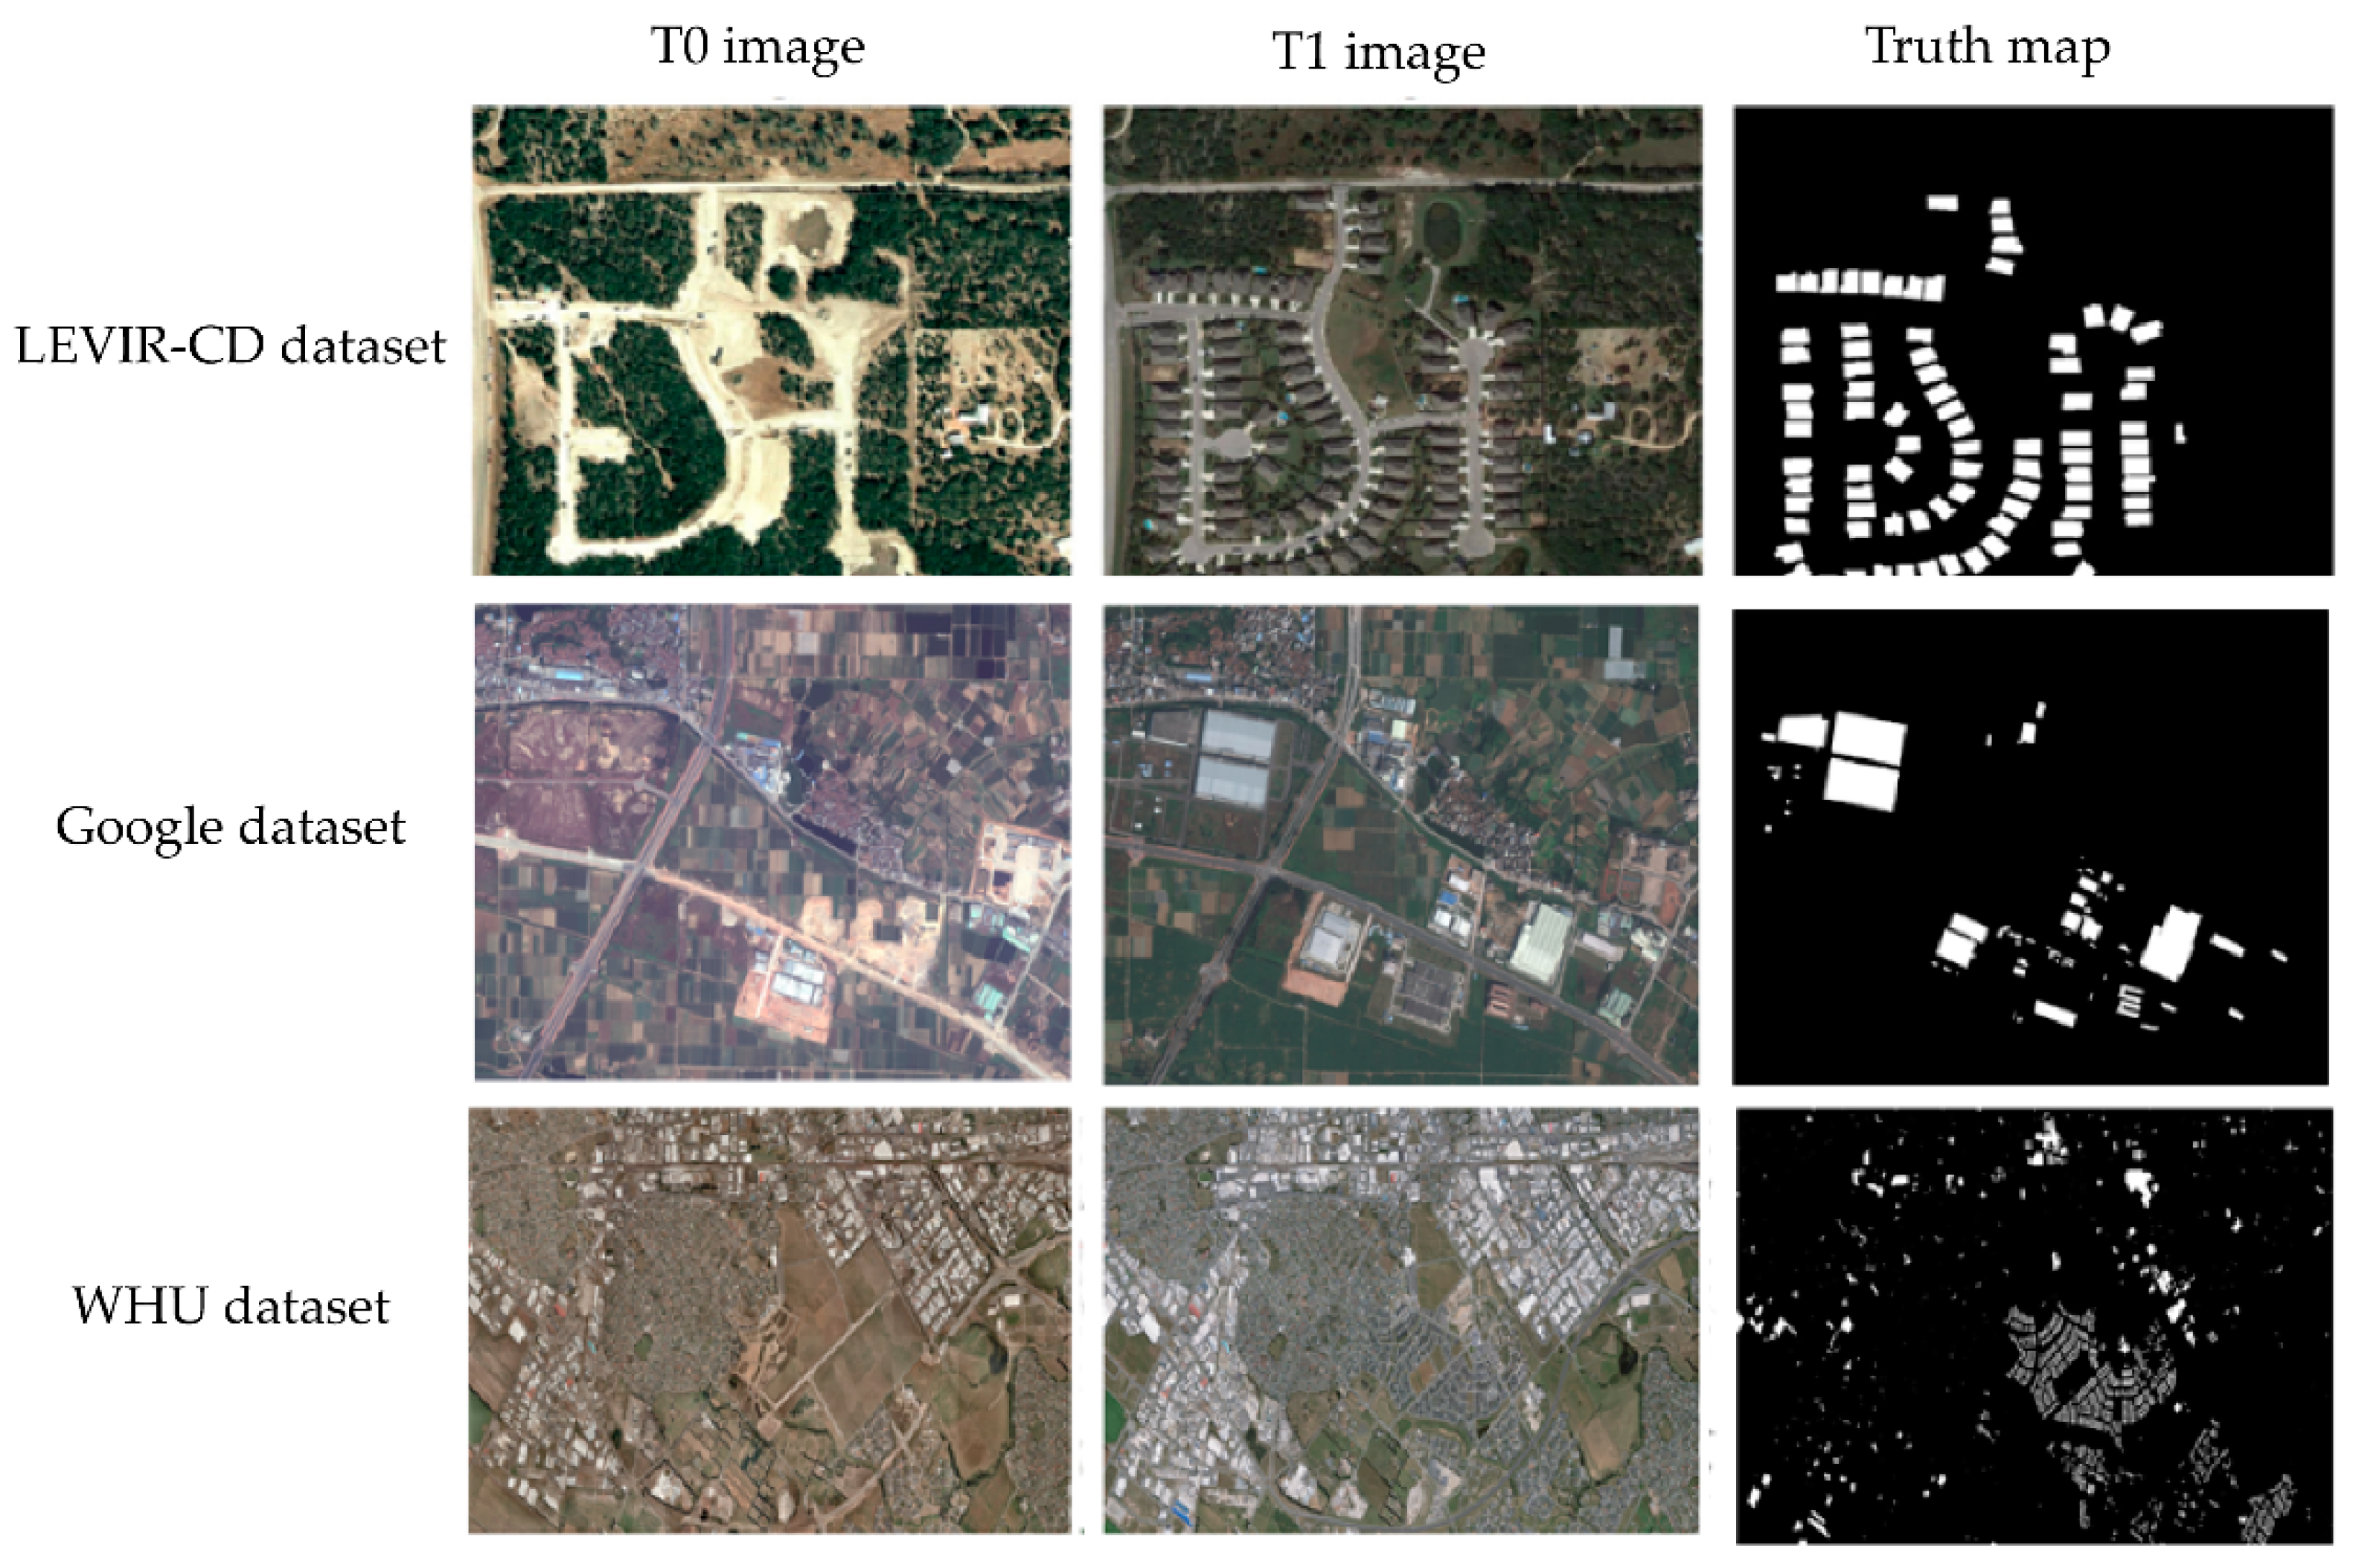
This paper uses three large open-source, high-resolution building change detection datasets as test subjects and for comparative experimental validation. Examples of the datasets are shown in Figure 1 below.
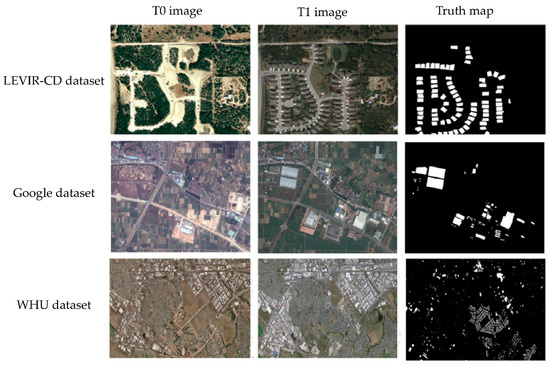
Figure 1.
Some examples of the datasets used in this paper.
- LEVIR-CD dataset
LEVIR-CD is a large-scale open-source remote sensing image building change detection dataset. It comes from Google Earth and contains 637 pairs of remote sensing images of the same area with a resolution size of 1024 × 1024 pixels and a spatial resolution of 0.5 m, including three channels of RGB [29]. The images are from 20 different regions in Texas, USA. The acquisition dates range from 2002 to 2018, with image pairs spanning from 5 to 14 years. The images acquired during the construction of the dataset may not have been taken at the same time in different regions, introducing variations due to seasonal differences and lighting differences in the dataset, resulting in a very challenging task to perform building change detection on this dataset. The LEVIR-CD dataset focuses on building-related changes, mainly the addition of buildings and the loss of buildings, and includes various building types such as villas, high-rise flats, small garages, and large and small warehouses. The LEVIR-CD dataset contains 31,333 individual instances of changing buildings and 30,913,975 pixels of change.
- Google dataset
The Google dataset is an open-source remote sensing image building change detection dataset. It is derived from Google Earth and contains 19 pairs of remotely sensed images of the same area with resolution sizes from 1006 × 1168 to 4936 × 5224 pixels, with a spatial resolution of 0.55 m. It contains three channels of RGB. The images are from the suburbs of Guangzhou, China. It was collected from 2006 to 2019. During the construction of the dataset, there was data variation due to seasonal differences and lighting differences since the collected images may not have been taken simultaneously in different regions. This situation makes it a very challenging task to detect architectural changes on this dataset. The Google dataset focuses on building-related changes, mainly the addition of buildings and the loss of buildings, including a variety of building types such as large industrial areas, large warehouses, residential houses, and small dwellings.
- WHU dataset
The WHU dataset is an open-source aerial image building change detection dataset containing a pair of aerial images of the same area with a resolution size of 32,507 × 15,345 and a spatial resolution of 0.3 m, containing three channels of RGB. Images from Christchurch, New Zealand, covering 20.5 km2, were acquired in 2012 and 2016 and included 12,796 individual buildings in the 2012 image and 16,077 buildings in the 2014 image, which were hit by a 6.3 magnitude earthquake in February 2011. Reconstruction began the following year. The WHU dataset focuses on building-related changes, mainly the addition of buildings and the loss of buildings, and includes a variety of building types, such as industrial and residential areas.
3. Methods
This paper proposes a novel multi-scale attention module for optical images. This module aims to illustrate the lack of long-range inter-pixel dependence in deep learning change detection algorithms, as well as the low prediction accuracy of the model at small changes. This module overcomes the difficulties of obtaining global semantic information and long-range inter-pixel dependencies. Together with dilated convolution, the module expands the perceptual domain without reducing the size of the feature map and prevents the loss of structured information. Finally, a dual multi-scale attention network model for building change detection in remote sensing images is constructed using dual neural networks.
3.1. Multi-Scale Attention Module
This paper proposes a multi-scale attention module. The role of the multi-scale attention module is to capture long-range multi-scale dependencies and global semantic information.
Each pair of pixels must be classified for intensive prediction tasks, such as detecting changes in images. It is essential to solve the dependencies between long distances and the acquisition of global information; therefore, global information must be acquired over long distances. Convolutional and pooling layers with different step sizes in the coding stage are used to solve this problem by reducing the resolution of images and expanding the perceptual field to capture semantic information at longer distances. However, multiple pooling operations can lead to the loss of structural information and the inability to decode small targets.
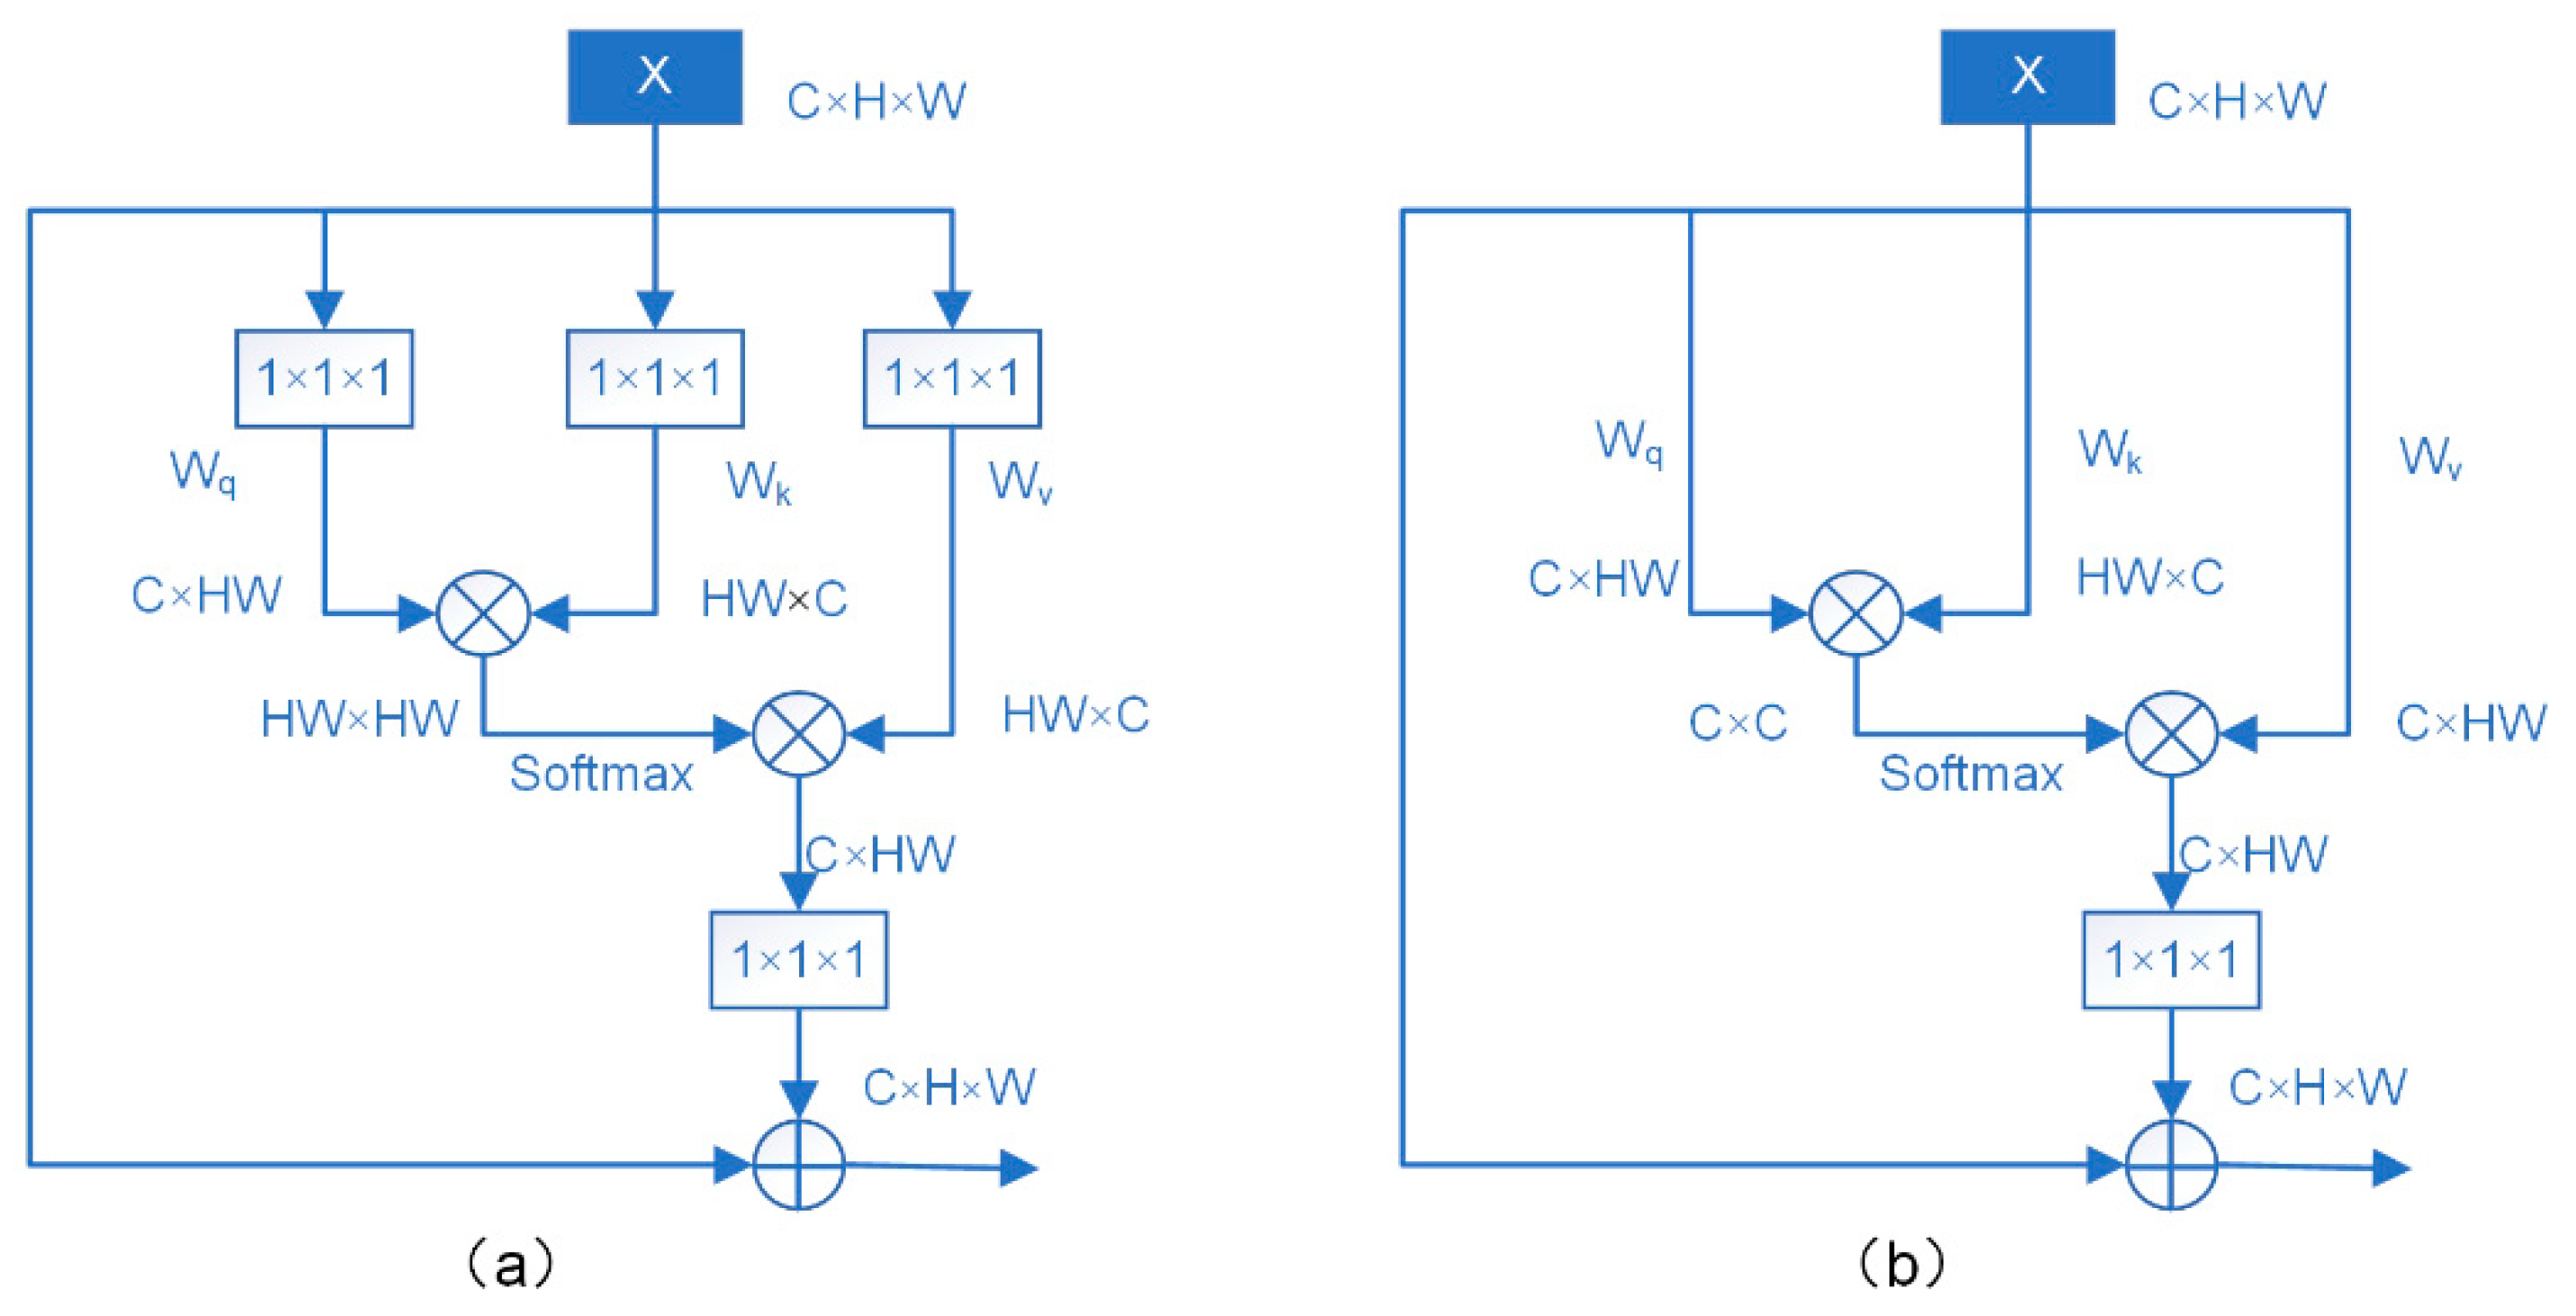
With the nonlocal neural networks proposed in [30], attention is introduced to computer vision. Good results are achieved in image classification, video tracking, and semantic segmentation. Figure 2a shows how the nonlocal module characterizes the inter-pixel relationship by computing the similarity between any two pixels on the feature map and using the Softmax function. Following the attention mechanism, the inter-pixel relationships are global. In one way, this nonlocal operation is equivalent to noise reduction, which removes noise in the feature map. In another way, it can acquire long-distance dependencies and global semantic information, compared to classical convolution, which aggregates local information continuously. The authors of [31] describe the nonlocal module as a location-based attention mechanism model that deals with the correlation between each location and all other locations. Softmax creates a feature map of HW × HW and then acts on this feature map to generate the correlation between pixels at each location and pixels at any other location, thus constructing the global semantic information based upon the location. This idea led to constructing a channel-based model, as shown in Figure 2b. This function considers the correlation between each channel and every other channel, and by computing a C × C feature map, it computes the correlation between channels and thus generates the global semantic information based on channels.
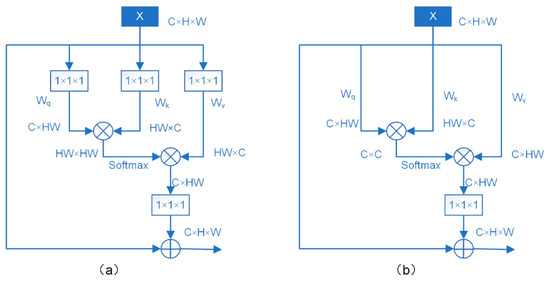
Figure 2.
(a) Non-local module; (b) the channel-base attention module.
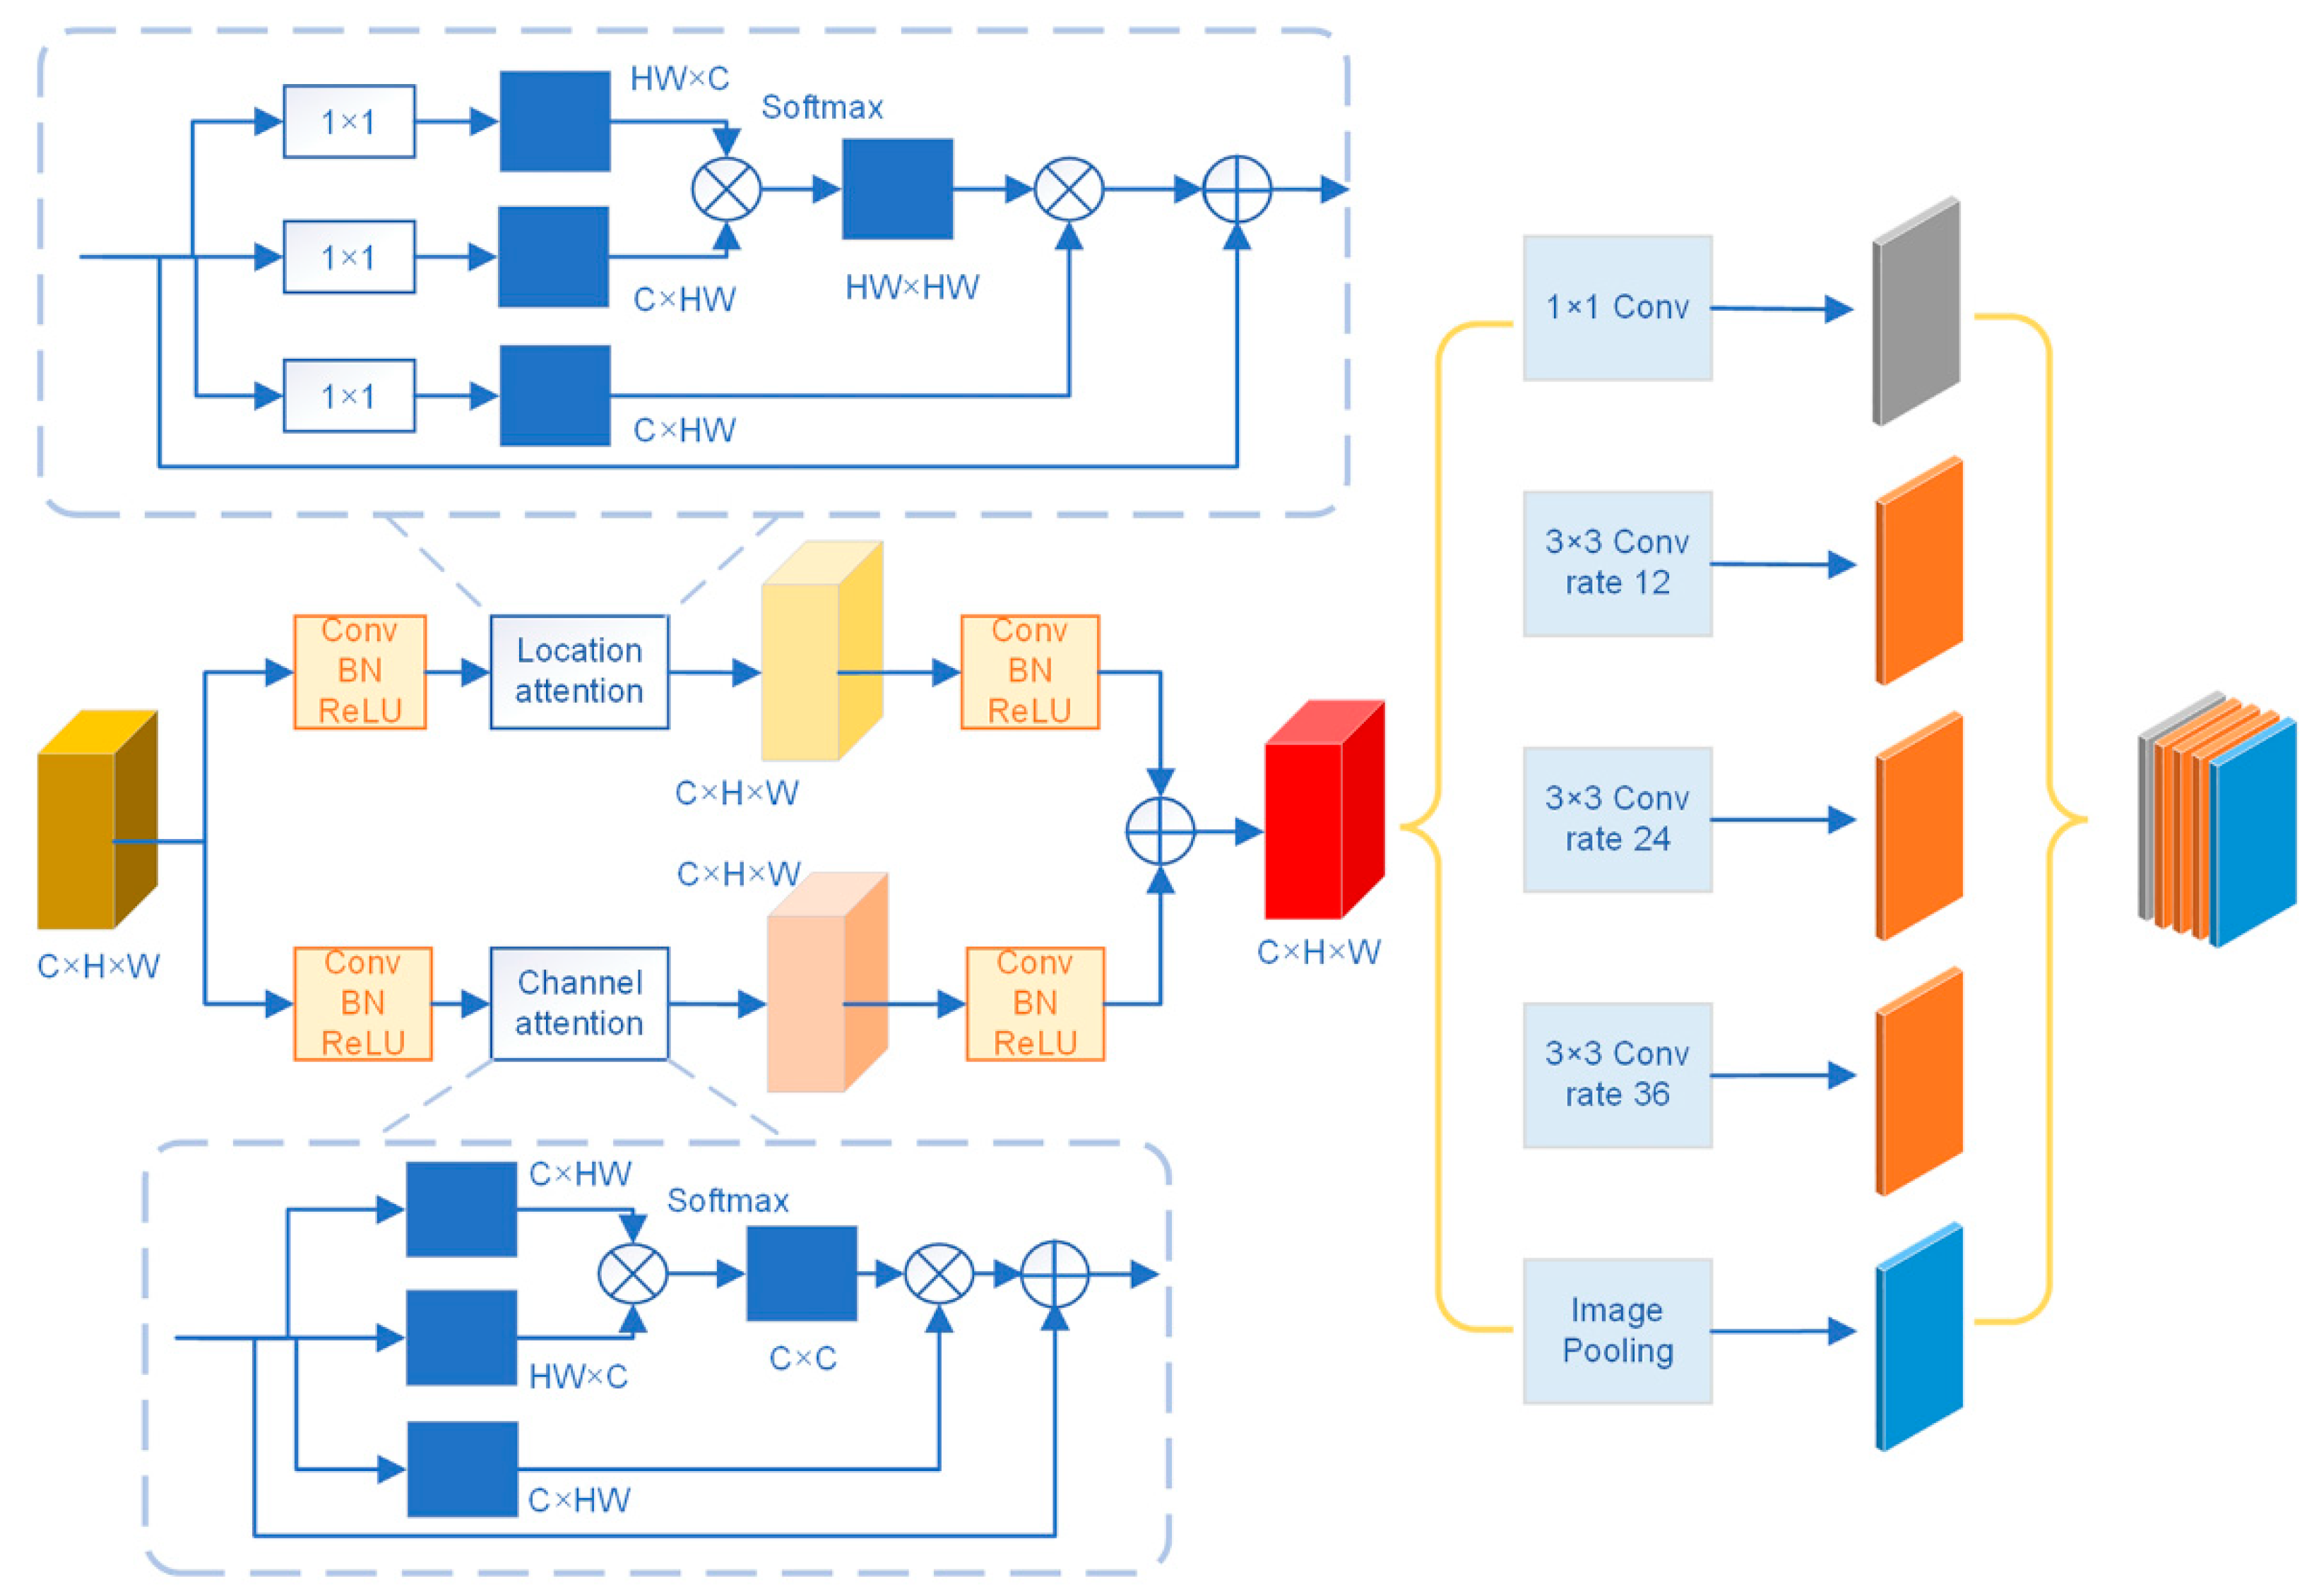
This paper introduces the above two attention mechanism sub-modules into the building change detection network. Figure 3 shows a multi-scale attention mechanism module for improving change detection accuracy.
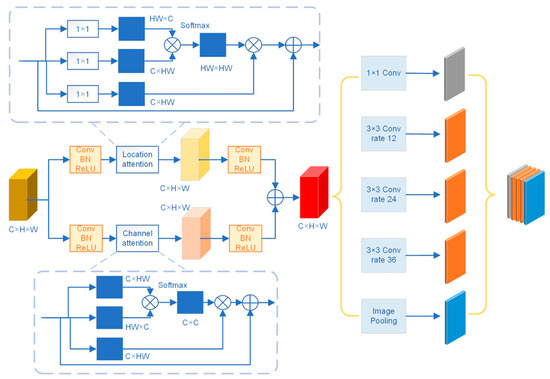
Figure 3.
Multi-scale attention mechanism module.
ResNet34 extracts feature maps of size C × H × W, which are passed through the location-based attention mechanism and channel-based attention mechanism sub-modules after convolution and nonlinear activation. In the location-based attention mechanism sub-module, the feature maps are compressed using three 1 × 1 convolution layers to reduce complexity. A represents the original graph. Next, three infographics with dimensions HW × C, C × HW, and C × HW are developed using deformations and dimensional transformations denoted by B, C, and D. The matrix multiplication of B and C yields an information graph of HW × HW. In this graph, the correlation between positions within the global range is characterized by the Softmax function. This graph illustrates the long-range dependencies. After matrix multiplication with dimension D, it is possible to consider the operation of matrix multiplication as a weighting operation. The sum of all the values in the infographic of HW × HW is 1. The graph represents the similarity between locations. The higher the similarity, the stronger the dependency between a location and other locations. The more gain values the location obtains in matrix multiplication, the more attention the location receives. Then we multiply by the scale factor α, a learnable parameter, and set it to 0. To express the above operation as C × H × W, we use the following formula:
In the above equation, i is the number of rows and j is the number of columns. The function describes the influence of the ith position on the jth position. The greater the similarity, the greater their similarity of position in a global context. According to Equation (1), the result for each location is the original feature plus a weighted sum based on all locations. The results obtain global semantic information from location-based attention mechanisms with different sensitivities for different locations. We can improve the pixel classification error problem with different class boundaries and achieve great results for pixel-based classification tasks.
In the sub-module of channel-based attention mechanisms, A represents the original graph. The featured graph is transformed through deformation and dimensionality into three infographics of dimensions C × HW, HW × C, and C × HW. To generate an infographic for C × C, B and C are multiplied using the matrix multiplication technique. This infographic uses the Softmax function to characterize the correlation between channels in the global range and determine the dependencies between channels. In general, the higher the similarity, the stronger the dependency between the channel and other channels, and the higher the gain value of the channel in the matrix multiplication, the greater the attention gained. We multiply the scale factor β, a learnable parameter, and set it to 0. Following its deformation to C × H × W, the above operation can be expressed as follows:
The number i indicates the number of rows, and the number j indicates the number of columns. The parameter characterizes the influence of the ith channel on the jth channel. The more similar they are, the higher the channel similarity at the global scale. According to Equation (3), the result for each channel is the original channel plus a weighted sum based on all channels. The sub-module of channel-based attention mechanisms models semantic dependencies over long distances and gives weight to different channels to improve feature discrimination.
3.2. Multi-Scale Information Extraction Module
An important issue in the change detection process is accurately classifying each pixel that constitutes an object at different scales in an image. This study uses the atrous spatial pyramid pooling (ASPP) module for multi-scale information extraction. By downsampling the ASPP module by a factor of 8, it includes a 1 × 1 convolution and three 3 × 3 dilated convolutions with expansions from [12,24], as well as a global averaging pooling to obtain image-level features as a way to capture multi-scale features. Dilated convolutions tend to degenerate to simple 1 × 1 convolutions with only the center of the convolution kernel being valid. Therefore, image-level features are added, and a pooling operation is performed on the entire global image. The result is passed through a 1 × 1 convolution using bilinear upsampling, and the module can capture multi-scale features efficiently.
3.3. Dual Multi-Scale Attention Building Change Detection Model
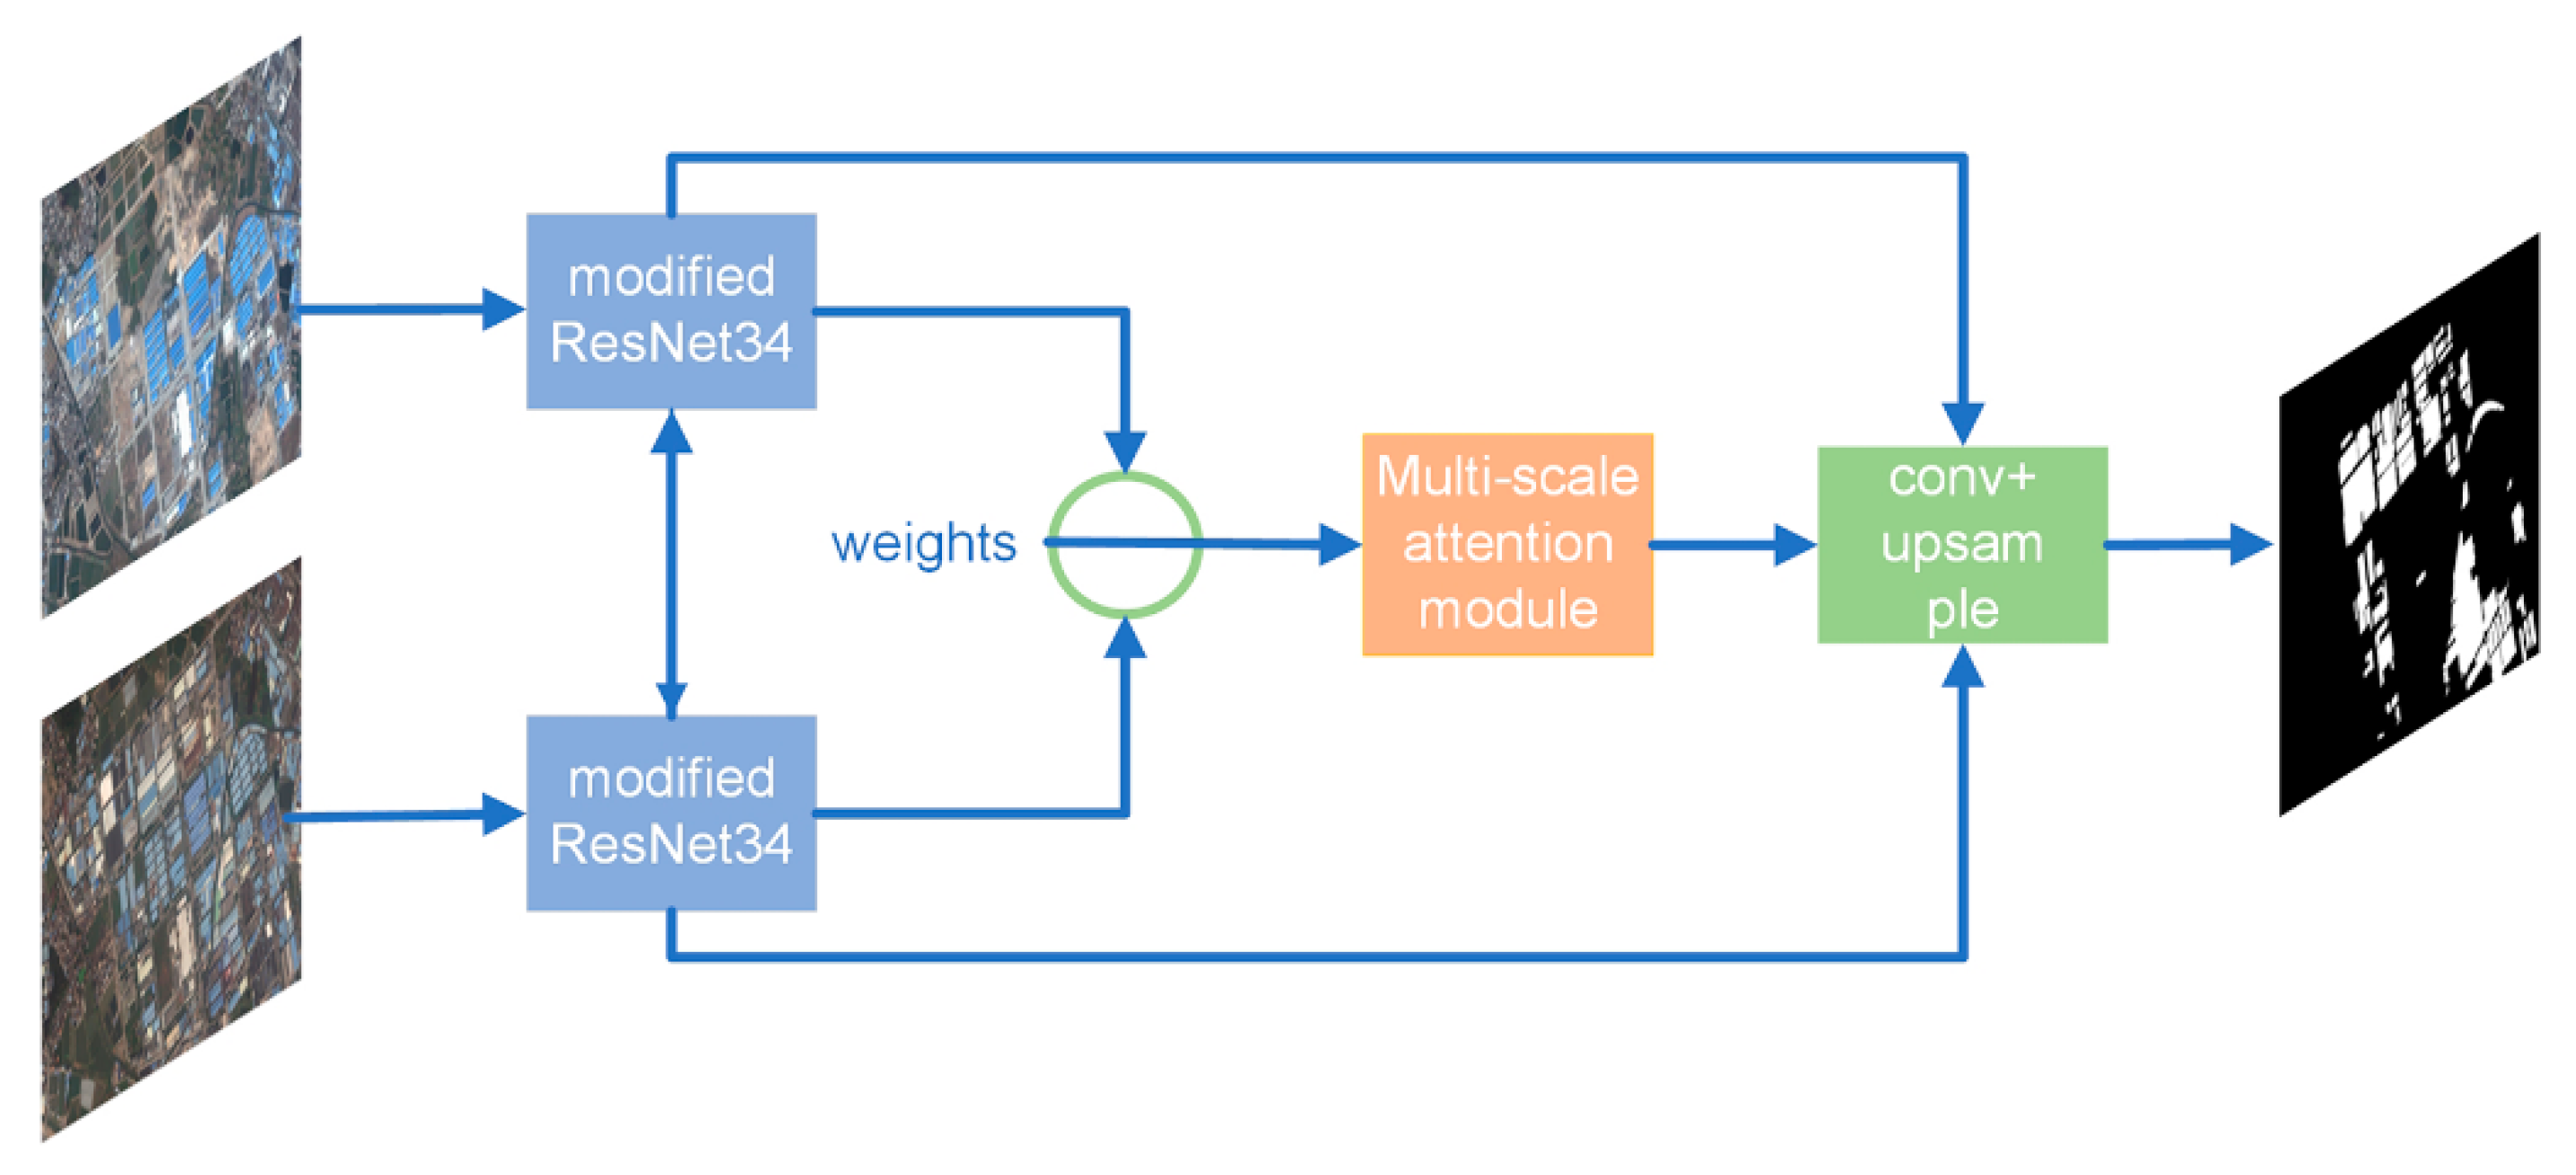
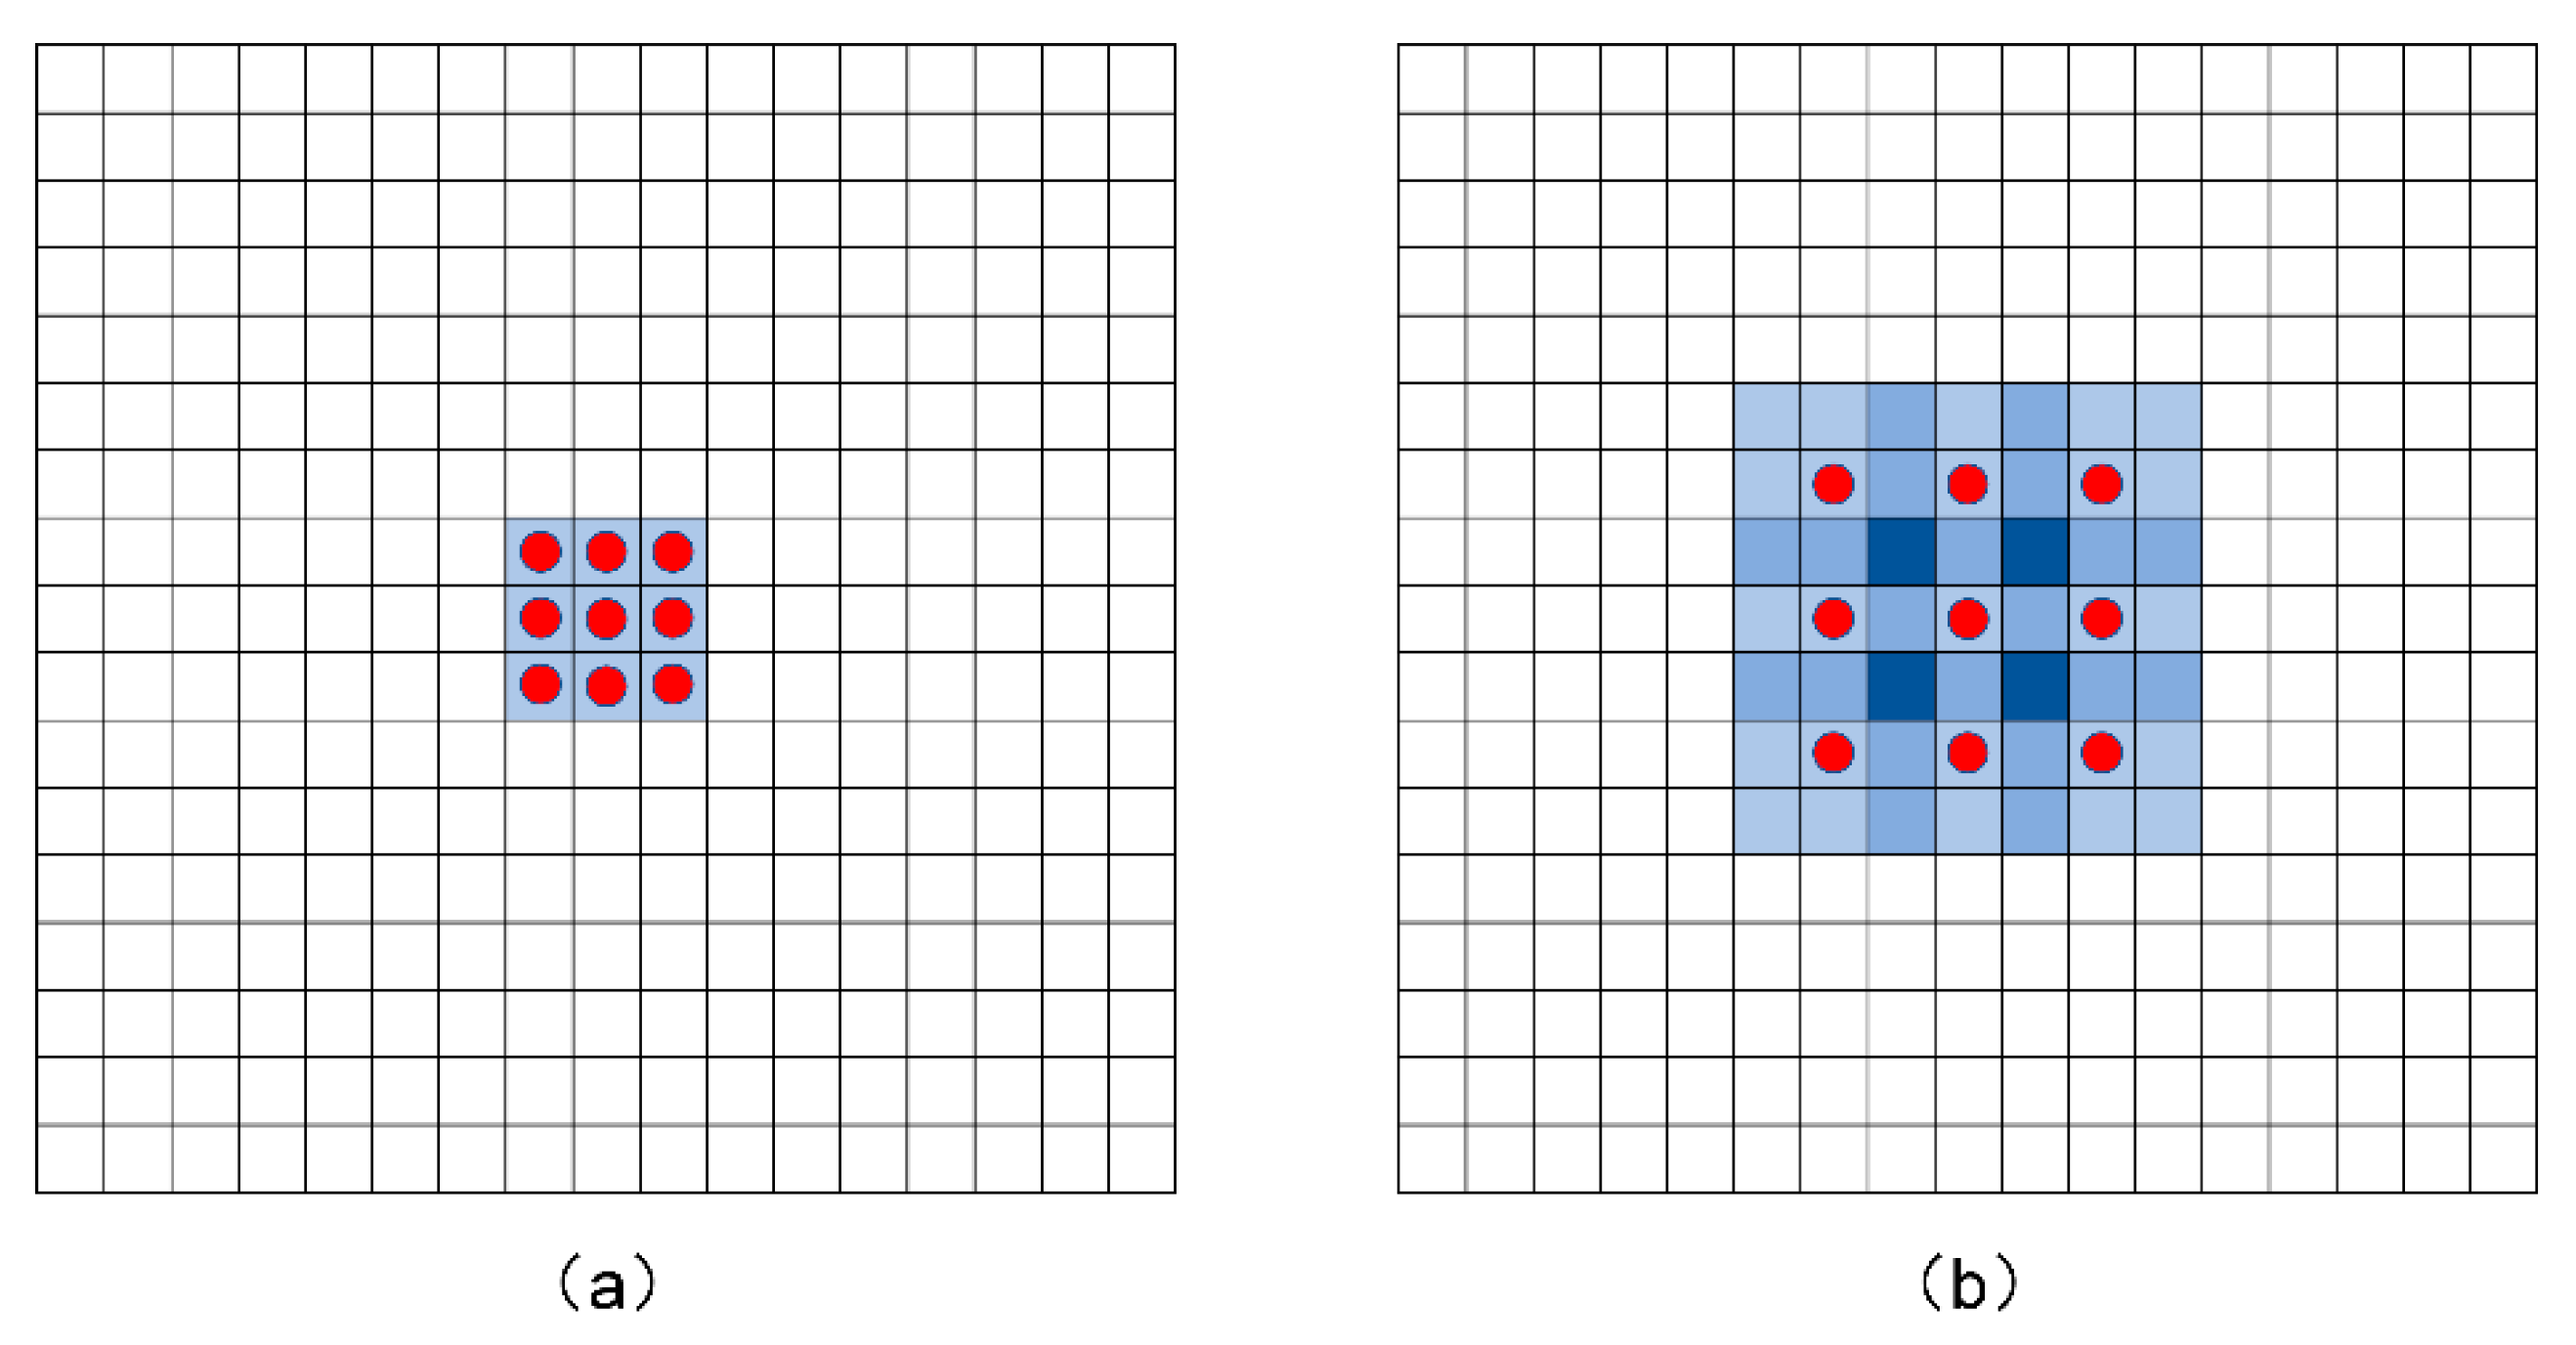
The structure of the dual multi-scale attention building change detection network is shown in Figure 4. A dual attention module consists of two modules: an attention module for position attention and an attention module for channel attention. The position attention module emphasizes spatial information, whereas the channel attention module emphasizes correlation information. The multi-scale attention model consists of an encoder–decoder system built on a backbone FCN and a multi-scale attention module. The backbone full convolutional network can use VGG, Res-Net, DenseNet, and Xception. They use convolutional layers instead of fully connected layers, and their main role is to extract features. To prevent the loss of structural information due to excessive downsampling operations, ResNet34 is replaced by null convolution by removing the downsampling operations of the conv_4 and conv_5 structures to maintain the resolution of the feature map without degradation. The difference between null convolution and conventional convolution is shown in Figure 5. Figure 5a shows the normal convolution, while Figure 5b shows the 3 × 3 null convolution with an expansion rate of 2. The convolution kernel is still 3 × 3, but it is equivalent to a 7 × 7 convolution kernel due to the presence of the null.
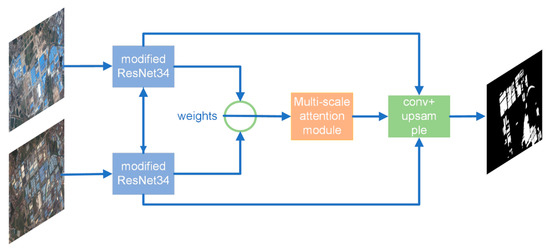
Figure 4.
Dual multi-scale attention network.
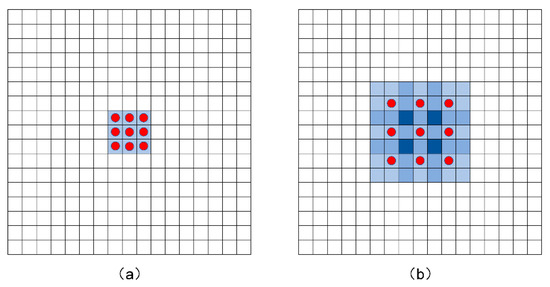
Figure 5.
The contrast between dilated convolution and traditional convolution. (a) normal convolution, (b) 3 × 3 null convolution with an expansion rate of 2.
The dual neural network is a class of neural networks with the same structure and shared parameters [32]. It has the characteristics of using dual-temporal remote sensing image input data in the building change detection task. Therefore, this study combines dual neural networks to construct a building change detection model structure with dual-stream input. The structure is based on the modified ResNet34 mentioned above. The two branch networks have the same structure and shared parameters. The dual-temporal images enter the two branch networks separately to extract features and then perform a subtraction operation to highlight the differences in features. This is beneficial for subsequent building change detection.
The dual multi-scale attention building change detection network extracts features in remote sensing image pairs through each conv_x structure of ResNet34 in the encoding stage. The multi-scale attention module performs the generation of long-range inter-pixel semantic relationship information and the integration of global information on the basis of the acquired features. The fusion of multi-scale information is performed afterward. In the decoding stage, this paper fuses low-level semantic information and high-level information containing long-range inter-pixel semantic relations by a stepwise upsampling process combined with a hopping structure. This provides more accurate information for the change detection task of dense prediction. Finally, we use the sigmoid function to generate a change map.
4. Results
The experimental equipment in this paper is a 64-bit Ubuntu 18.04 TLS system, configured with a 12 G 1080Ti graphics card, 16 G RAM, and an 8-core Intel i7-6700 CPU, developed on PyTorch. The backbone network is a variant of ResNet34, using the Kaiming initialization method to initialize the model parameters and the Ranger optimizer to optimize the network, which is an efficient and synergistic combination of RAdam and LookAhead. The loss function used was a binary cross-entropy loss function (BCE Loss). The initial learning rate was set to 0.005. The input size of the network was (3, 256, 256), the batch size was set to 4, and 50 rounds were trained.
4.1. Dataset Preprocessing and Equalization
The three datasets used in this study were the LEVIR-CD building change detection dataset, the Google building change detection dataset, and the WHU building change detection dataset. The initial data distributions for these three building change detection datasets are shown in Table 1 below.

Table 1.
Initial data distribution of building change detection datasets.
It can be seen that the ratio of initial unchanged samples to changed samples in the three datasets, LEVIR-CD, Google, and WHU, is above 10:1 and even reaches 22:1, which is extremely unbalanced in the distribution of samples in the dataset from Table 1. This study proposes an automated double-threshold rule for change detection, data enhancement, and data equalization to effectively solve this problem. The rule counts the sample label categories within the window by setting a sliding window. When the percentage of change samples is higher than a certain threshold, data enhancement such as redundant cutting, rotation, scaling, and shifting are performed in the sliding window. The sliding window data is removed when the change samples are below a certain threshold. Data within the two thresholds are not manipulated.
In the actual processing of the three building change detection datasets, this study set a high threshold of 60% and a low threshold of 1% by counting the categories of samples within the sliding window. In this paper, when the proportion of change samples within the sliding window is higher than 60%, the sliding window is subjected to data enhancement processes such as 90° rotation, 180° rotation, 270° rotation, horizontal flip, and vertical flip. Meanwhile, when the proportion of change samples within the sliding window is lower than 1%, the sliding window is removed. The data distributions of the three processed building change detection datasets are shown in Table 2 below.

Table 2.
Processed data distribution of building change detection datasets.
As can be seen from Table 2, the problem of the extremely unbalanced distribution of sample categories for the initial data was effectively mitigated. The ratio of the initial unchanged samples to the changed sample categories decreases from more than 10:1 to less than 8:1. The double-threshold data balancing rule can effectively automate data enhancement and balancing tasks, which is beneficial to model convergence and training.
Considering the limitation of the GPU, large images cannot be trained directly on the convolutional neural network. In this study, the high-resolution images were cropped into 256 × 256 pixel size images, and the final LEVIR-CD dataset obtained a training set of 40,000 pairs, a validation set of 4000 pairs, and a test set of 4000 pairs; the Google dataset obtained a training set of 48,000 pairs, a validation set of 4000 pairs, and 4000 pairs for the test set; and the WHU dataset obtained a training set of 16,000 pairs, a validation set of 2000 pairs, and a test set of 2000 pairs.
4.2. Change Detection Results of the LEVIR-CD Dataset
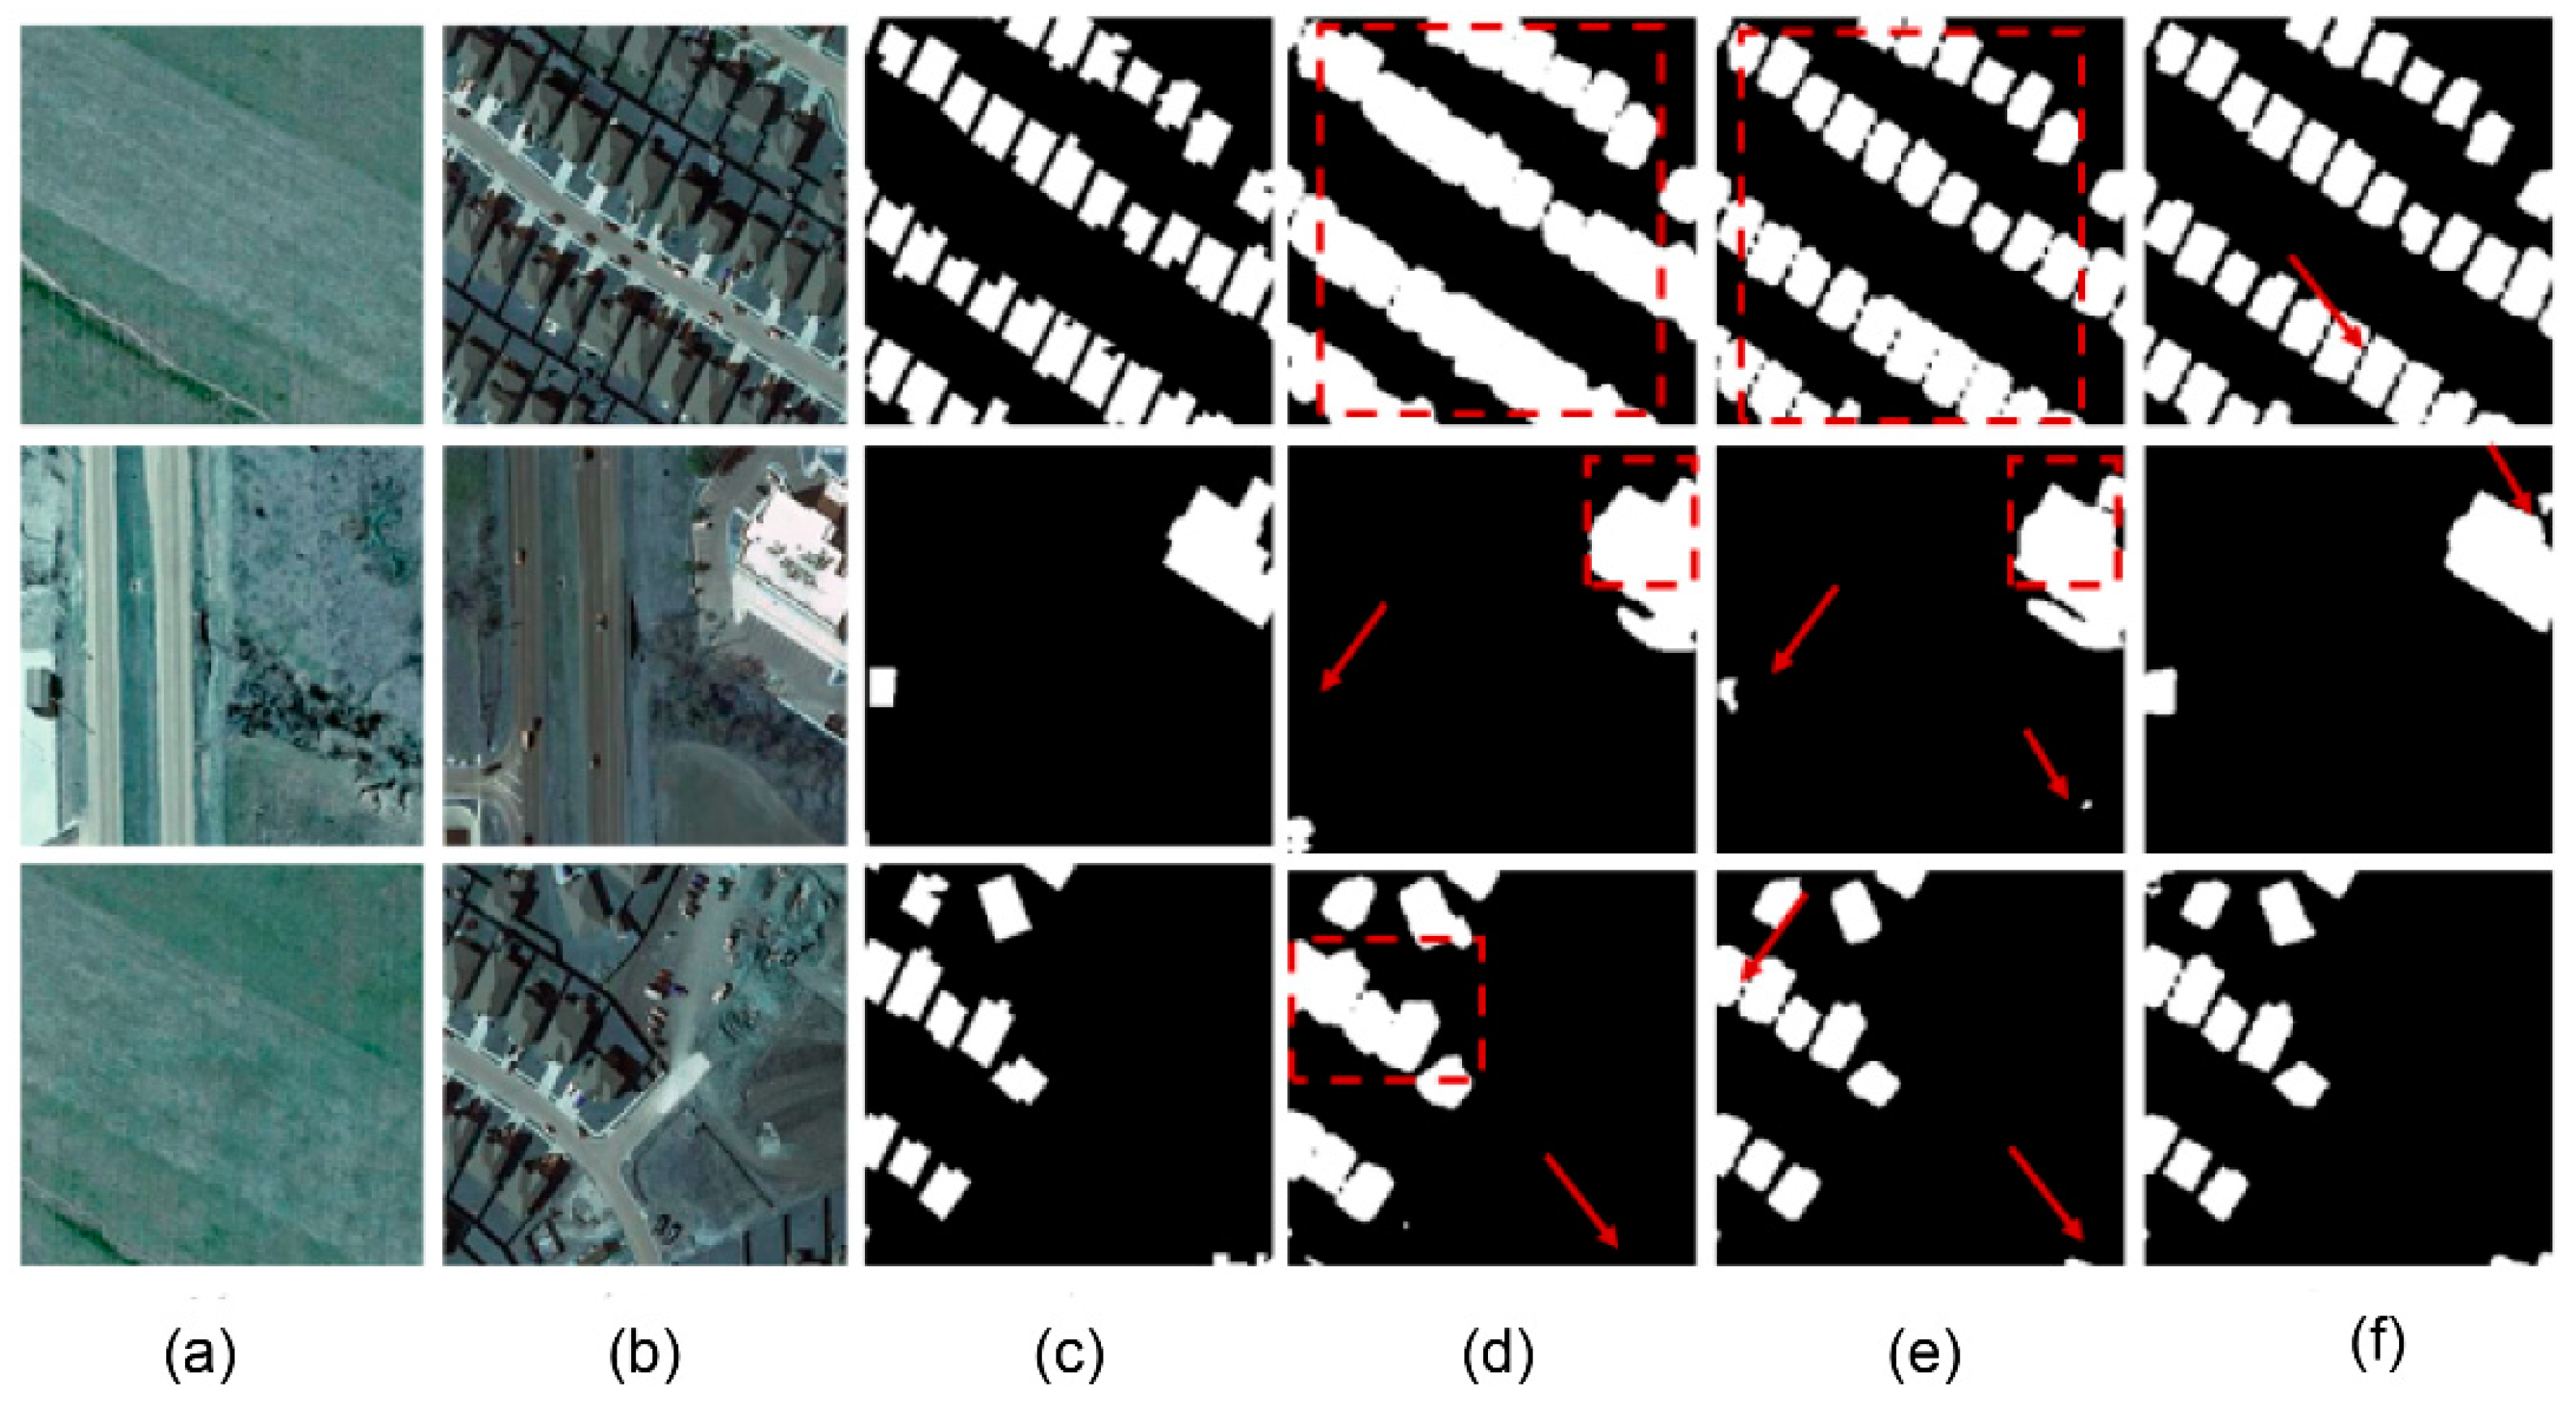
The change detection results of the LEVIR-CD dataset are shown in Figure 6. In the first column of images, FC-Siam-diff and UNet++ have serious boundary prediction problems, with obvious boundary-to-boundary connections, whereas the multi-scale attentional building change detection network proposed in this paper was more accurate in predicting changes without obvious boundary connections, which was good for dense building change detection. In the second column of images, FC-Siam-diff and UNet++ were incorrect in detecting and predicting building changes and boundaries. In contrast, the multi-scale attentional change detection network proposed in this paper is more accurate in predicting changes. Still, there were a few building predictions that were missing due to the presence of shadows. The third column of images shows that FC-Siam-diff and UNet++ have some prediction errors between dense building boundaries and boundaries, and there are errors and omissions for smaller buildings, while the dual multi-scale attentional building change detection network proposed in this paper is more accurate in predicting building changes.
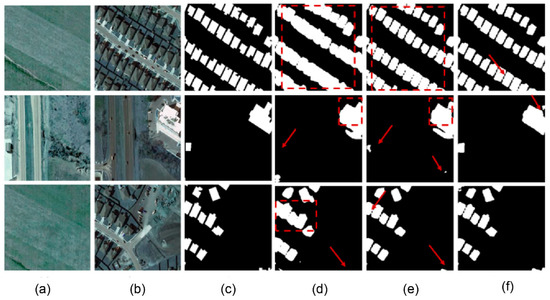
Figure 6.
Comparison example of model experiment results on the LEVIR-CD dataset. From left to right: (a) Image T1, (b) Image T2, (c) truth map of change detection, (d) the result of FC-Siam-diff, (e) the result of Unet++, and (f) the result of this paper. The red rectangular boxes and red arrows mark the differences between the variogram (CM) and the true value graph (GT) given by the model.
4.3. Change Detection Results of the Google Dataset
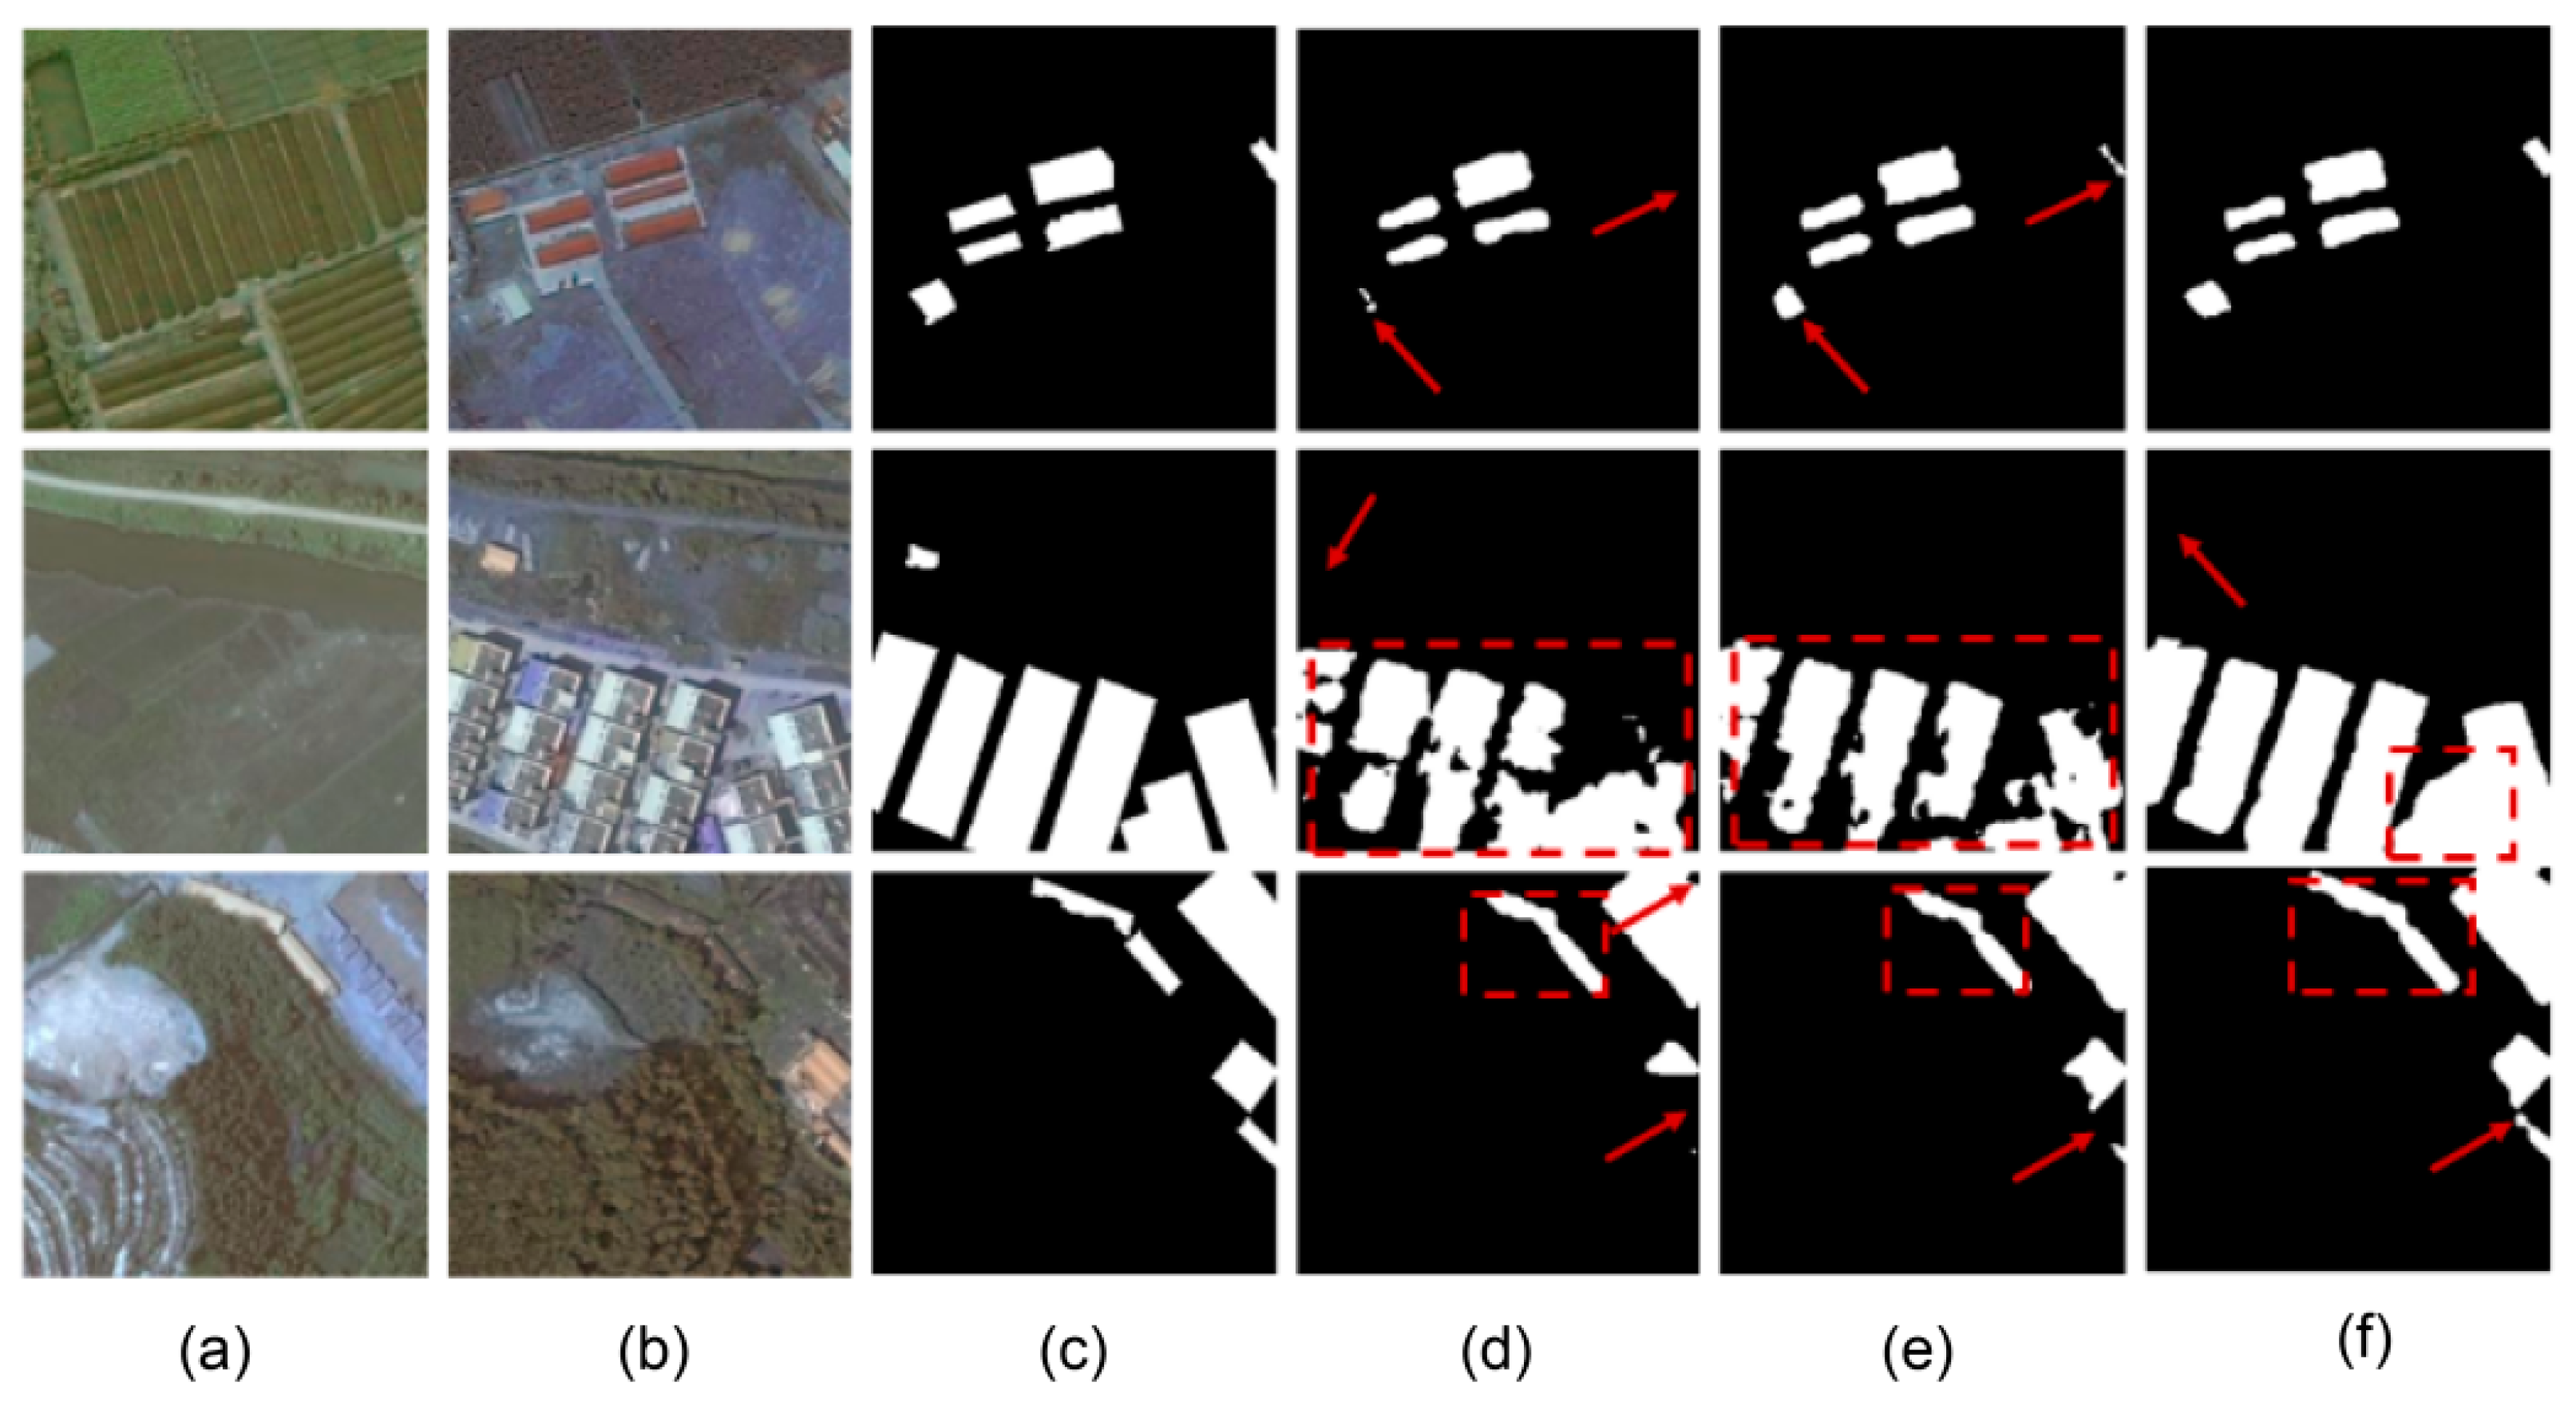
The change detection results of the Google dataset are shown in Figure 7. In the first column of Figure 7, FC-Siam-diff and UNet++ had the problem of incorrect and missed building change detection, whereas the dual multi-scale attentional change detection network proposed in this paper had better accuracy in predicting building changes. The second column of images shows that FC-Siam-diff and UNet++ have shortcomings in detecting changes in the building boundaries, with more voids and connections in the boundaries, while the dual multi-scale attentional change detection network proposed in this paper is more accurate in predicting changes, but there were also some cases of incorrect detection. In the third column of images, FC-Siam-diff and UNet++ have different degrees of detection errors and omissions, while the dual multi-scale attentional change detection network proposed in this paper was more accurate in predicting changes.
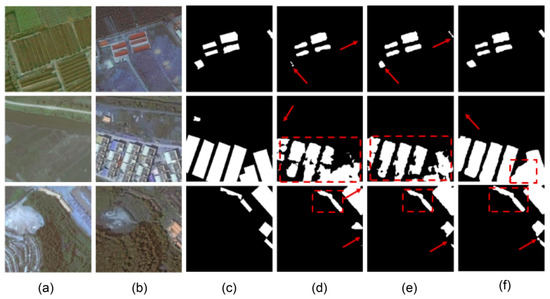
Figure 7.
Comparison example of model experiment results on the Google dataset. (a) Image T1, (b) Image T2, (c) truth map of change detection, (d) the result of FC-Siam-diff, (e) the result of Unet++, and (f) the result of this paper. The red rectangular boxes and red arrows mark the differences between the variogram (CM) and the true value graph (GT) given by the model.
4.4. Change Detection Results of the WHU Dataset
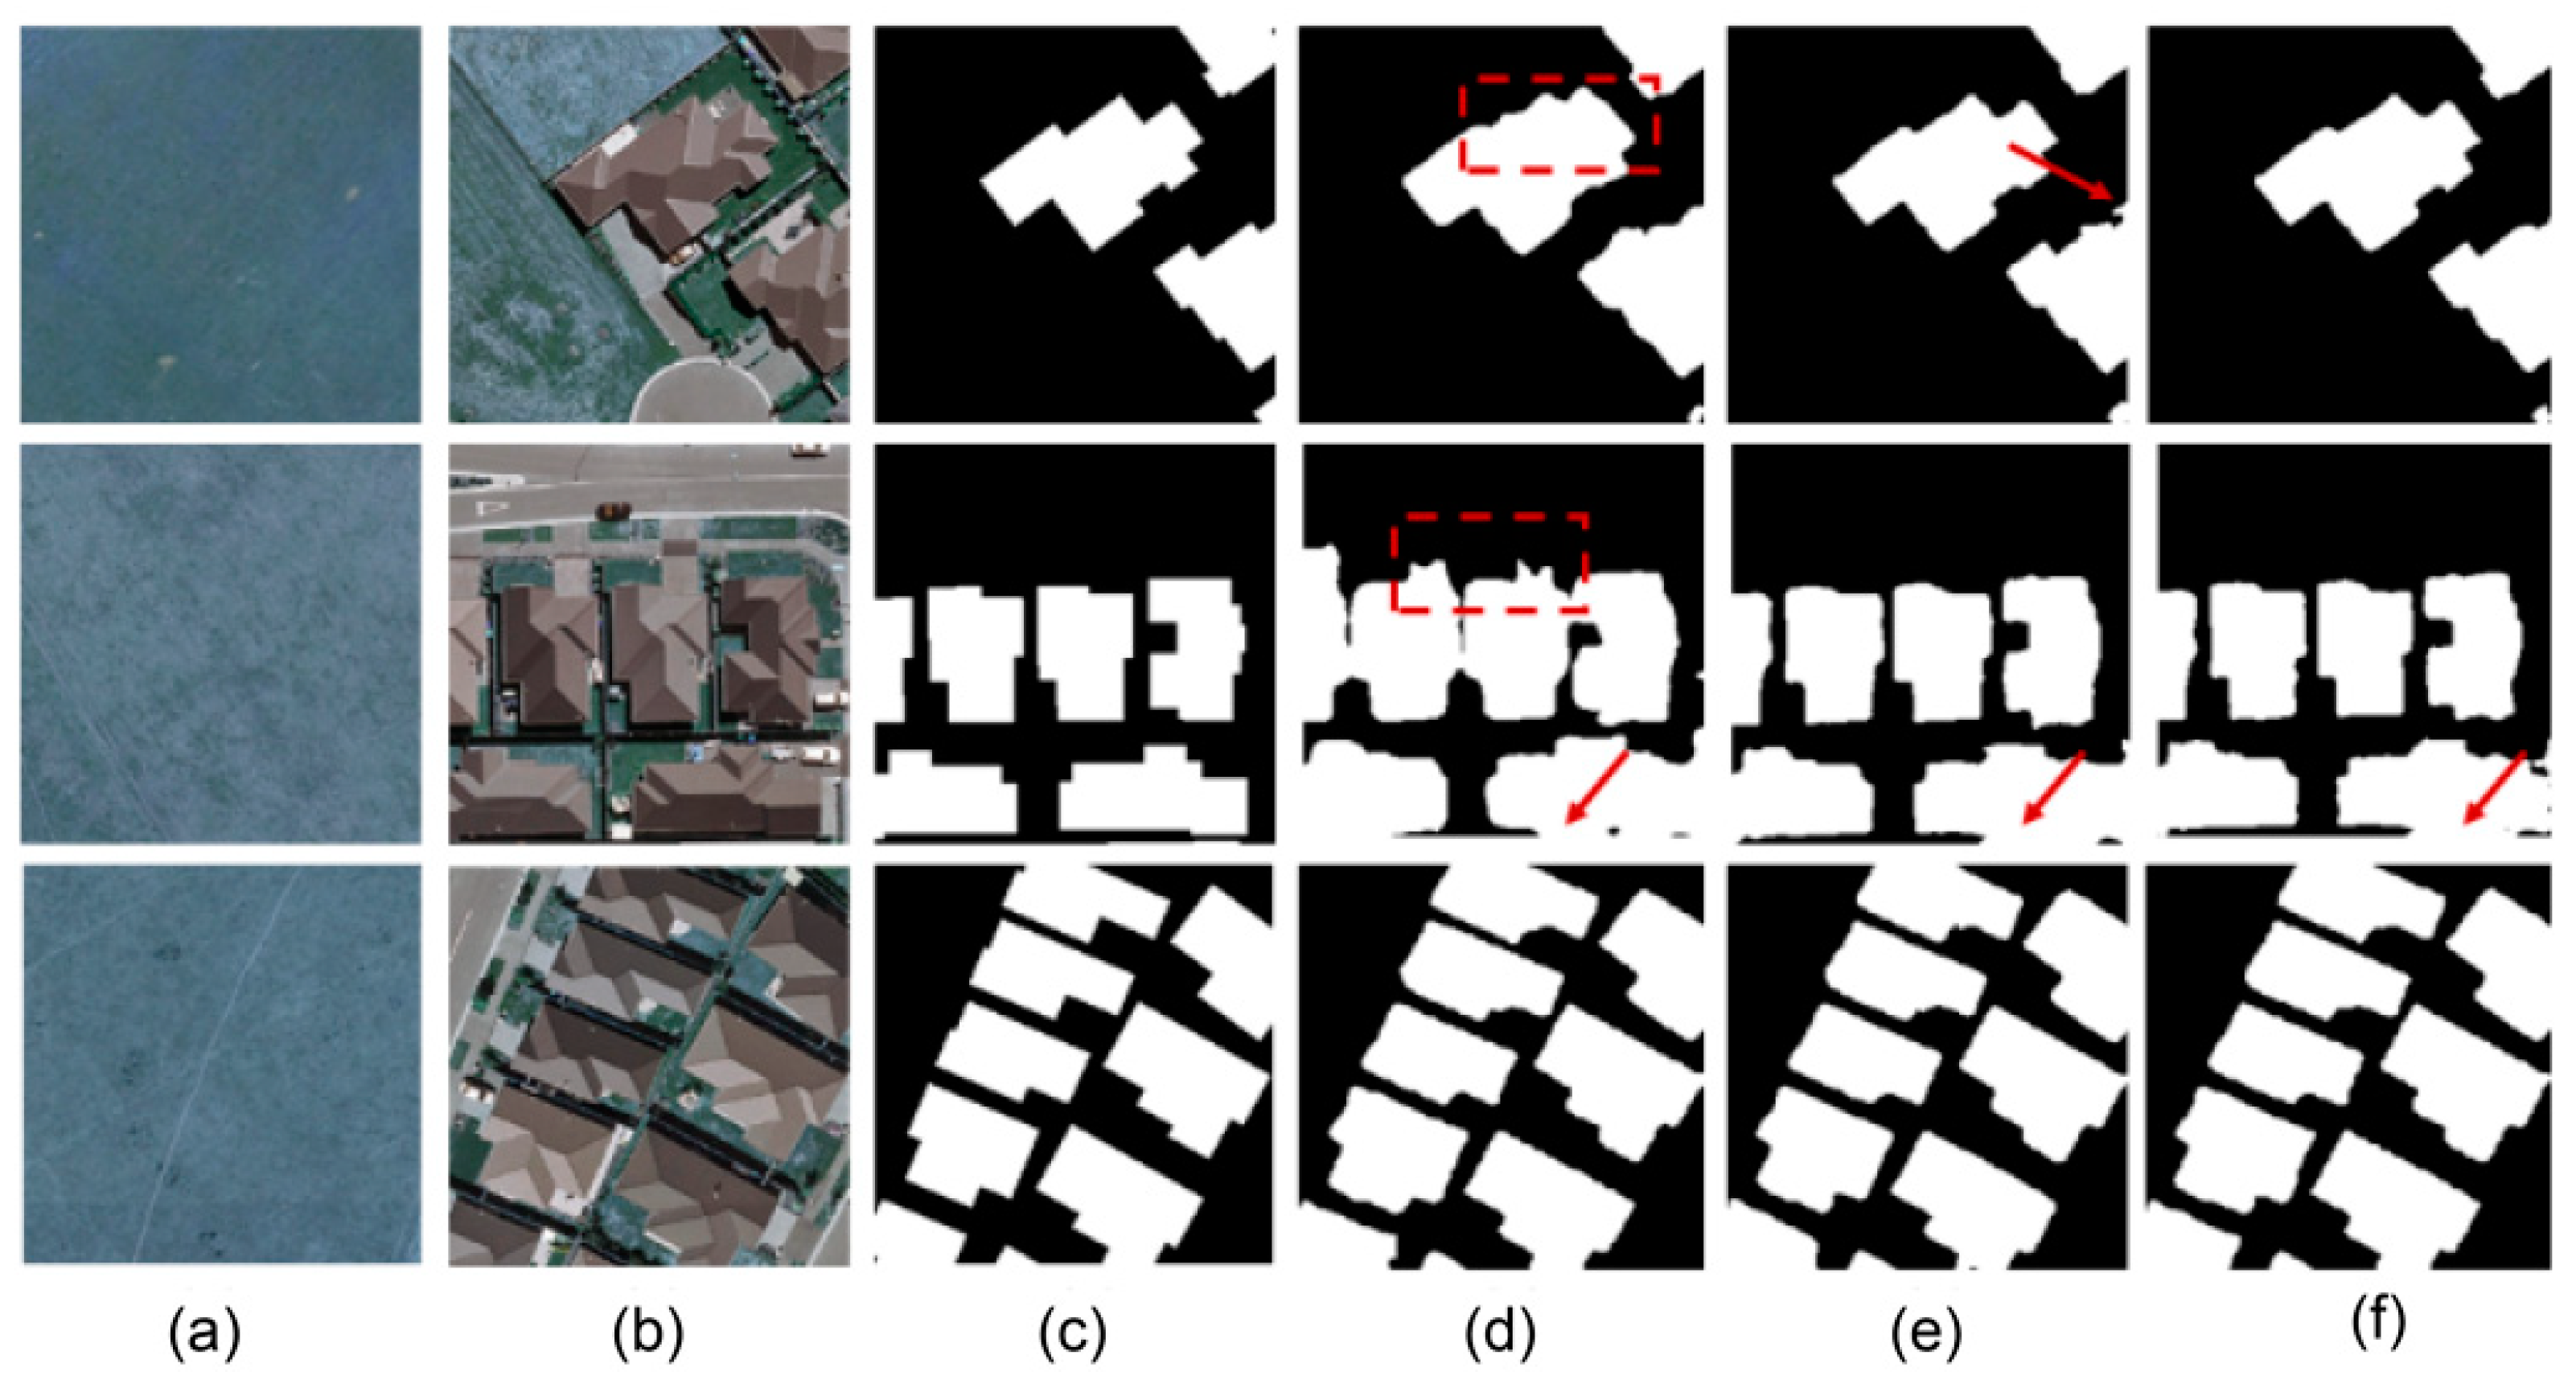
The change detection results of the WHU dataset are shown in Figure 8. As can be seen in the first column of Figure 8, FC-Siam-diff and UNet++ had building boundary detection errors. Building changes were more accurately predicted by the dual multi-scale attention mechanism network proposed in this paper. From the second column of images, FC-Siam-diff and UNet++ had defects in the detection of building boundary changes, and there were certain error detection situations. The dual multi-scale attention mechanism network proposed in this paper predicted changes more accurately, but there were also certain error detection situations. From the third column of images, the FC-Siam-diff, UNet++, and the dual multi-scale attention mechanism network proposed in this paper all predicted relatively accurate changes.
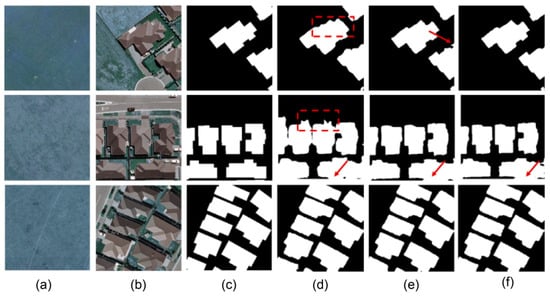
Figure 8.
Comparison example of model experiment results on the WHU dataset. (a) Image T1, (b) Image T2, (c) truth map of change detection, (d) the result of FC-Siam-diff, (e) the result of Unet++, and (f) the result of this paper. The red rectangular boxes and red arrows mark the differences between the variogram (CM) and the true value graph (GT) given by the model.
4.5. Evaluation Using Precision Index
Scholars have proposed many evaluation indexes to assess the quality of change detection results. We calculate the corresponding indexes by comparing the change detection results with the manually annotated true value maps. This paper utilizes precision, recall, F1-score [33,34], and mIOU [35] to evaluate the proposed algorithm’s effectiveness and accuracy for the task of change detection of buildings in remote sensing images.
TP, FP, FN, and TN represent the number of pixels correctly classified as positive cases, the number of pixels incorrectly classified as positive cases, and the number of correctly classified as negative cases, respectively.
The proposed model in this paper is compared with the current major change detection models using four selected evaluation metrics, and the results of the comparison experiments are shown in Table 3. It can be seen that the model proposed in this paper outperforms other change detection models in all four selected evaluation metrics. The experimental results show that the multi-scale attention building change detection network has advantages in the task of detecting building changes in high-resolution remote sensing images.

Table 3.
Experimental results of the proposed model and other building change detection models.
The four evaluation metrics were used to evaluate the performance of the attention mechanism network with different multi-scale parameters, and the results of the comparison experiments are shown in Table 4. The performance of the attention mechanism network with different multi-scale parameters was different. As the scale parameters increase, the performance of the attention mechanism network also improves.

Table 4.
Experimental results of building change detection comparison with different multi-scale parameters.
5. Discussion
The dual multi-scale attentional building change detection model proposed in this paper achieves better results on three open-source building change detection datasets: LEVIR-CD, Google, and WHU. The UNet++ model has a greater improvement compared to mainstream models such as the FC-Siam-diff model. In addition, to verify the performance of the attentional building change detection network with different multi-scale parameters, models with different multi-scale parameters were constructed for experimental comparison, and the experimental structure showed that {12, 24, 36} had the best results. It is analyzed that the change detection model based on the encoding–decoding structure can effectively capture the semantic connotation and combine the upsampling and jumping structure to gradually recover the image resolution for an intensive pixel-by-pixel classification task. However, there are common problems, such as insufficient feature extraction capability in the decoding stage, loss of structural information due to excessive downsampling to capture long-distance dependencies, and lack of global semantic information. This paper proposes feature extraction using ResNet34 in combination with dual neural networks. On top of the powerful feature extraction capability of ResNet34, this paper ensures that the resolution of the image does not continue to decrease with the loss of structural information of the image by replacing the downsampling operation of the const_4 and const_5 structures with null convolution while extending the perceptual field using dual neural networks. The dual neural network is used to extract the two temporal building features separately, highlight the building change information through the subtraction operation, and apply the multi-scale attention module proposed in this paper, which captures the dependencies and global semantic information of multi-scale long-range information through the location-based attention mechanism and the channel-based attention mechanism combined with the multi-scale idea, and combines the jump-link structure for progressive upsampling to recover the resolution of the image. This solves the problems of insufficient feature extraction capability in the decoding stage, loss of structural information due to excessive downsampling to capture long-range dependencies, and lack of global semantic information, which existed in previous major change detection frameworks. In addition, the performance of attention networks with different scale parameters varies. The larger the scale parameter, the better the network model. The input image size in this paper is 256 × 256, and after eight-fold downsampling by ResNet34, the size is 32 × 32, and the different multi-scale parameters are {2, 3, 6}, {3, 6, 12}, {6, 12, 24}, and {12, 24, 36}, respectively. The analysis concluded that the sampling interval of the attention mechanism module varied for different multi-scale parameters, and the larger the sampling interval, the better the model performance. It is suggested that the large sampling interval played a similar role to that of the Dropout technique by deactivating a certain number of neurons to attenuate the co-adaptation of neurons, which improved the model performance.
6. Conclusions
This paper proposes a multi-scale and attention-based change detection model to solve the problems of unpredictable change details and the lack of global semantic information that exist in deep learning-based change detection models. This paper also proposes a multi-scale attention module that can effectively obtain multi-scale semantic information as the basis for building an end-to-end dual multi-scale attention-based change detection model. This paper proposes an efficient dual-threshold automatic data equalization rule for the imbalanced data categories existing in the building change detection dataset. This rule effectively mitigates the severe skew of data distribution and facilitates the training and convergence of the model. Experimental results on three open-source high-resolution building change detection datasets show that the proposed method in this paper can detect the location and area of actual building changes relatively accurately, and the method has better results in the detail detection part, the proposed change detection method applied to optical images has been shown to be more accurate when applied to the LEVIR-CD, Google, and WHU datasets.
Author Contributions
J.Z. analyzed the data and performed the experiments; B.P. provided comments and suggestions on the manuscript and checked the writing; Y.Z. provided the data and analytical tools; Z.L. wrote the manuscript; X.Z. added some experiments. All authors have read and agreed to the published version of the manuscript.
Funding
This research was funded by demonstration project of comprehensive government management and large-scale industrial application of the major special project of CHEOS, grant number 89-Y50G31-9001-22/23.
Data Availability Statement
Not applicable.
Conflicts of Interest
The authors declare no conflict of interest.
References
- Huang, X.; Zhang, L.; Zhu, T. Building change detection from multitemporal high-resolution remotely sensed images based on a morphological building index. IEEE J. Sel. Top. Appl. Earth Obs. Remote Sens. 2013, 7, 105–115. [Google Scholar] [CrossRef]
- Tian, J.; Cui, S.; Reinartz, P. Building change detection based on satellite stereo imagery and digital surface models. IEEE J. Sel. Top. Appl. Earth Obs. Remote Sens. 2013, 52, 406–417. [Google Scholar] [CrossRef]
- Marin, C.; Bovolo, F.; Bruzzone, L. Building change detection in multitemporal very high resolution SAR images. IEEE J. Sel. Top. Appl. Earth Obs. Remote Sens. 2014, 53, 2664–2682. [Google Scholar] [CrossRef]
- Xi, Y.; Luo, Q. A morphology-based method for building change detection using multi-temporal airborne LiDAR data. Remote Sens. Lett. 2018, 9, 131–139. [Google Scholar] [CrossRef]
- Zhu, L.; Shimamura, H.; Tachibana, K.; Li, Y.; Gong, P. Building change detection based on object extraction in dense urban areas. Int. Arch. Photogramm. Remote Sens. Spat. Inf. Sci. 2008, 52, 406–417. [Google Scholar]
- Ye, Y.; Zhou, L.; Zhu, B.; Yang, C.; Sun, M.; Fan, J.; Fu, Z. Feature Decomposition-Optimization-Reorganization Network for Building Change Detection in Remote Sensing Images. Remote Sens. 2022, 14, 722. [Google Scholar] [CrossRef]
- Junsheng, L.; Jianwu, D.; Yangping, W. Mapping. Building change detection by multi-feature fusion from high resolution remote sensing images. Bull. Surv. Mapp. 2019, 10, 105. [Google Scholar]
- Barthelet, E.; Mercier, G.; Denise, L. Building change detection in a couple of optical and SAR high resolution images. In Proceedings of the 2011 IEEE International Geoscience and Remote Sensing Symposium, Vancouver, BC, Canada, 24–29 July 2011; pp. 2393–2396. [Google Scholar]
- Poulain, V.; Inglada, J.; Spigai, M.; Tourneret, J.-Y.; Marthon, P. Fusion of high resolution optical and SAR images with vector data bases for change detection. In Proceedings of the 2009 IEEE International Geoscience and Remote Sensing Symposium, Cape Town, South Africa, 12–17 July 2009; pp. IV-956–IV-959. [Google Scholar]
- Shafique, A.; Cao, G.; Khan, Z.; Asad, M.; Aslam, M. Deep learning-based change detection in remote sensing images: A review. Remote Sens. 2022, 14, 871. [Google Scholar] [CrossRef]
- Chen, J.; Gong, P.; He, C.; Pu, R.; Shi, P. Land-use/land-cover change detection using improved change-vector analysis. Photogramm. Eng. Remote Sens. 2003, 69, 369–379. [Google Scholar] [CrossRef]
- Hu, J.; Zhang, Y. Seasonal change of land-use/land-cover (LULC) detection using MODIS data in rapid urbanization regions: A case study of the pearl river delta region (China). IEEE J. Sel. Top. Appl. Earth Obs. Remote Sens. 2013, 6, 1913–1920. [Google Scholar] [CrossRef]
- Walter, V. Object-based classification of remote sensing data for change detection. ISPRS J. Photogramm. Remote Sens. 2004, 58, 225–238. [Google Scholar] [CrossRef]
- Radke, R.J.; Andra, S.; Al-Kofahi, O.; Roysam, B. Image change detection algorithms: A systematic survey. IEEE Trans. Image Process. 2005, 14, 294–307. [Google Scholar] [CrossRef] [PubMed]
- Bovolo, F.; Bruzzone, L.; Marconcini, M. A novel approach to unsupervised change detection based on a semisupervised SVM and a similarity measure. IEEE Trans. Geosci. Remote Sens. 2008, 46, 2070–2082. [Google Scholar] [CrossRef]
- Nielsen, A.A. The regularized iteratively reweighted MAD method for change detection in multi-and hyperspectral data. IEEE Trans. Image Process. 2007, 16, 463–478. [Google Scholar] [CrossRef] [PubMed]
- Shelhamer, E.; Long, J.; Darrell, T. Fully convolutional networks for semantic segmentation. In Proceedings of the IEEE Conference on Computer Vision and Pattern Recognition, Las Vegas, NV, USA, 27–30 June 2016; Volume 39, pp. 640–651. [Google Scholar]
- Xia, J.; Chanussot, J.; Du, P.; He, X. (Semi-) supervised probabilistic principal component analysis for hyperspectral remote sensing image classification. IEEE J. Sel. Top. Appl. Earth Obs. Remote Sens. 2013, 7, 2224–2236. [Google Scholar] [CrossRef]
- Shin, H.-C.; Roth, H.R.; Gao, M.; Lu, L.; Xu, Z.; Nogues, I.; Yao, J.; Mollura, D.; Summers, R.M. Deep convolutional neural networks for computer-aided detection: CNN architectures, dataset characteristics and transfer learning. IEEE Trans. Med. Imaging 2016, 35, 1285–1298. [Google Scholar] [CrossRef]
- Krizhevsky, A.; Sutskever, I.; Hinton, G.E. Imagenet classification with deep convolutional neural networks. Commun. ACM 2017, 60, 84–90. [Google Scholar] [CrossRef]
- Diakogiannis, F.I.; Waldner, F.; Caccetta, P. Looking for change? Roll the Dice and demand Attention. Remote Sens. 2021, 13, 3707. [Google Scholar] [CrossRef]
- Chen, H.; Shi, Z. A spatial-temporal attention-based method and a new dataset for remote sensing image change detection. Remote Sens. 2020, 12, 1662. [Google Scholar] [CrossRef]
- Ji, S.; Wei, S.; Lu, M. Fully convolutional networks for multisource building extraction from an open aerial and satellite imagery data set. IEEE Trans. Geosci. Remote Sens. 2018, 57, 574–586. [Google Scholar] [CrossRef]
- Liu, Y.; Pang, C.; Zhan, Z.; Zhang, X.; Yang, X. Building change detection for remote sensing images using a dual-task constrained deep siamese convolutional network model. IEEE Geosci. Remote Sens. Lett. 2020, 18, 811–815. [Google Scholar] [CrossRef]
- Peng, D.; Bruzzone, L.; Zhang, Y.; Guan, H.; Ding, H.; Huang, X. SemiCDNet: A semisupervised convolutional neural network for change detection in high resolution remote-sensing images. IEEE Trans. Geosci. Remote Sens. 2020, 59, 5891–5906. [Google Scholar] [CrossRef]
- Khelifi, L.; Mignotte, M. Deep learning for change detection in remote sensing images: Comprehensive review and meta-analysis. IEEE Access 2020, 8, 126385–126400. [Google Scholar] [CrossRef]
- Zhang, M.; Xu, G.; Chen, K.; Yan, M.; Sun, X. Triplet-based semantic relation learning for aerial remote sensing image change detection. IEEE Geosci. Remote Sens. Lett. 2018, 16, 266–270. [Google Scholar] [CrossRef]
- Wang, Q.; Zhang, X.; Chen, G.; Dai, F.; Gong, Y.; Zhu, K. Change detection based on Faster R-CNN for high-resolution remote sensing images. Remote Sens. Lett. 2018, 9, 923–932. [Google Scholar] [CrossRef]
- Song, K.; Jiang, J. AGCDetNet: An attention-guided network for building change detection in high-resolution remote sensing images. IEEE J. Sel. Top. Appl. Earth Obs. Remote Sens. 2021, 14, 4816–4831. [Google Scholar] [CrossRef]
- Wang, X.; Girshick, R.; Gupta, A.; He, K. Non-local neural networks. In Proceedings of Proceedings of the IEEE Conference on Computer Vision and Pattern Recognition, Seattle, WA, USA, 21–23 June 1994; pp. 7794–7803. [Google Scholar]
- Fu, J.; Liu, J.; Tian, H.; Li, Y.; Bao, Y.; Fang, Z.; Lu, H. Dual attention network for scene segmentation. In Proceedings of the IEEE/CVF Conference on Computer Vision and Pattern Recognition, New Orleans, LA, USA, 19–20 June 2022; pp. 3146–3154. [Google Scholar]
- Chen, L.C.; Papandreou, G.; Kokkinos, I.; Murphy, K.; Yuille, A.L. Deeplab: Semantic image segmentation with deep convolutional nets, atrous convolution, and fully connected crfs. IEEE Trans. Pattern Anal. Mach. Intell. 2017, 40, 834–848. [Google Scholar] [CrossRef]
- Chicco, D.; Jurman, G. The advantages of the Matthews correlation coefficient (MCC) over F1 score and accuracy in binary classification evaluation. BMC Genom. 2020, 21, 6. [Google Scholar] [CrossRef]
- Yacouby, R.; Axman, D. Probabilistic extension of precision, recall, and f1 score for more thorough evaluation of classification models. In Proceedings of the First Workshop on Evaluation and Comparison of NLP Systems, virtual, November 2020; pp. 79–91. [Google Scholar]
- Ghorbanzadeh, O.; Blaschke, T. Optimizing Sample Patches Selection of CNN to Improve the mIOU on Landslide Detection. In Proceedings of the GISTAM, Heraklion, Greece, 5 May 2019; pp. 33–40. [Google Scholar]
Publisher’s Note: MDPI stays neutral with regard to jurisdictional claims in published maps and institutional affiliations. |
© 2022 by the authors. Licensee MDPI, Basel, Switzerland. This article is an open access article distributed under the terms and conditions of the Creative Commons Attribution (CC BY) license (https://creativecommons.org/licenses/by/4.0/).

