Abstract
With the rapid development of Moon exploration, the concept of establishing Moon-based station for Earth observation (MBSEO) has received more and more attention. Compared with the space-borne Earth observation method, the MBSEO can observe Earth with advantages of higher stability, longer period, wider range, better integrity, and consistency. The MBSEO can not only cover the entire Earth disc, but also has good observation of the target area (TA) whose radius is several times that of the Earth radius (e.g., plasma-sphere/magnetosphere). Basically, site selection is a prerequisite for MBSEO. In this paper, the time coverage of TA (TCTA), e.g., the whole Earth disc or Earth-related plasma-sphere and magnetosphere, and the time coverage of sunlight (TCS) without topography are briefly presented to show their distribution. However, the unevenly distributed craters on the near side make TCTA and TCS badly affected by complicated topography, thereby causing those sites with a high selection possibility of a single factor to not necessarily be suitable for other factors. For example, potential sites at the low-middle latitude on the near side might have better TCTA and flat topography, but its TCS might be terrible for MBSEO. In order to evaluate the above factors comprehensively, a multi-factor fuzzy evaluation (MFE) method based on a multiple-input single-output (MISO) model will be utilized in the period of 18.6 nutation years. By using the proposed evaluation method, the sites near the dividing line, e.g., Amundsen, can still have the absolute possibility of exceeding 0.6, which was selected as MBSEO in low acceptability of sunlight. A similar situation exists in other areas with weaker sunlight constraint, e.g., Malapert A, in the case that the absolute selection possibility of areas becomes closer if more sunlight is tolerable. The results indicate that the areas with low thermal environment for radiation protection and relatively flat topography will have more possibility to be selected, and those potential sites unevenly distributed in craters can still be picked out through our proposed method.
1. Introduction
With people’s growing appetite for outer space resources and booming Moon exploration activities, public interests in lunar research have increased considerably [1]. Recently, several countries have announced their Moon exploration programs. For instance, the ESA has launched a program named Moon Village, which aims at establishing a Moon base for science, business, mining, and even tourism through international collaboration [2,3]. Meanwhile, NASA has announced a lunar landing mission called Artemis, which is expected to be completed by 2024 [4]. China has also undertaken decades of Chang’E planning [5,6,7]. These programs are deemed as the supplementary of the American Apollo Moon landing project and the Soviet Union lunar landing project that were accomplished decades ago [8,9,10]. In the present, for these lunar exploration programs, the Earth related object (e.g., plasma-sphere/magnetosphere or entire Earth disc) observation from a Moon-based station for Earth observation (MBSEO) is one of the main tasks [11]. Previous researchers have revealed that the MBSEO can provide many advantages (e.g., higher stability, longer cycle, wider range, better integrity, and consistency) over satellites, not only in observing geography phenomena, such as the solid Earth tide, global energy budget, climate, and environmental change, but also for the near-earth space environment [12,13]. The observation of these unique objects will help us to understand more about Earth, human, Moon, solar activity, and so on [14]. All the observations and analysis results contribute to the realization of sustainable development goals (SDGs) for human beings [15].
In most existing studies about MBSEO, the Moon is reckoned as a smooth sphere with a mean radius of about 1738 km or even a mass point for simplification [16], though the ratio of mean Moon radius to mean distance (i.e., from Earth centroid to Moon centroid) is only a small number (0.0046), and the complicated topography of the Moon surface cannot be ignored while conducting the relevant MBSEO research. Among various engineering practices, Moon’s topography is an important factor that should be taken into account. For example, site topographic mapping and rover localization, the subsurface structure, and the stratigraphy of the landing site were discussed for the Chang’E probe [17,18]. In addition, the topography data were also considered for other landing detectors, such as Apollo and Lunar [19]. For the Moon site selection task focusing on MBSEO, complex topography might occlude observing sight and sunlight [20]. Therefore, Moon topography cannot be ignored during site selection.
In the MBSEO research of this paper, three factors, including the topography, the time coverage of sunlight (TCS), and the time coverage of target area (TCTA), are mainly taken into consideration. The topography is represented by slope, an MBSEO with a suitable slope will have a large buffer area that can avoid adverse effects of falling rocks from surrounding steep hills [21]. The TCS primarily affects the thermal environment and energy demand of equipment. From the existing literature, ice water may exist in permanent shadow areas where sunlight cannot reach. In most cases, the lower thermal environment is, the better equipment performance will be. The extreme temperature difference during the day and night calls for high requirements for a tolerance of temperature. Since the widely distributed Helium provides huge power for MBSEO [22], more sunlight is not necessary. Once the MBSEO is equipped with a small natural plant system, the sunlight is a necessary factor to be considered [23]. The TCTA also affects the selection of MBSEO. Generally speaking, the longer observation time is, the better the MBSEO will be. However, complicated topography might allow a site to have longer observation time, but without proper sunlight coverage or slope. Thus, the three factors mentioned above should be considered comprehensively.
In this study, an MFE method based on MISO controller is proposed to consider multiple factors comprehensively. This paper is organized as follows: Section 2 provides a brief analysis of TCS, and TCTA without considering moon topography; Section 3 gives a short analysis of Moon’s topography, especially in areas of interest (e.g., the near side); Section 4 provides a detailed introduction of the MFE method based on the MISO controller; Section 5 illustrates the application of MISO on MBSEO selection among widely distributed areas. As the nutation period caused by the Moon and the cycle of the lunar orbit’s ascending node is about 18.6 years, we thus adopted a simulation period of 1 January 2001 to about 31 July 2019. The last section outlines our conclusions based on the former sections.
2. Time Coverage without Topography
To study the distribution of TCS and TCTA, this paper first ignores the influence of Moon’s topography, that is to say, the Moon is deemed as a smooth sphere whose radius is only about 1738 km. If the observation object is the whole Earth disc, half FOV will be only about 0.90° at apogee and 1.02° at perigee. As shown in Figure 1a, the MBSEO in areas from 80°W to 80°E, 80°S to 80°N can almost observe the whole Earth disc all the time, but only for a partial period in the rest areas.
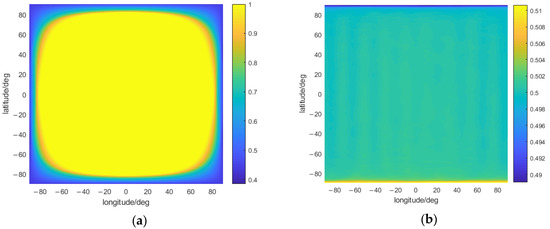
Figure 1.
The mean time coverage of (a) Earth disc observation and (b) sunlight.
Figure 1a also indicates that the areas of lower latitudes have higher Earth disc observation performance than those of higher latitudes. Specifically, the time percentage of Earth disc observation drops sharply from almost 100% to lower than 50% when the latitude is greater than 80° because of the tide lock and curvature occlusion of the Moon surface. As shown in Figure 1b, although the Moon rotation period is about 27.32 Earth days, much longer than the Earth rotation period, the calculation period is approximately equal to the long nutation period (i.e., 18.6 years). The near side almost has the same TCS, except for the two poles with slightly smaller values than other areas. Polar day and night will appear at the poles due to the 1.54° angle between the Moon orbit and the ecliptic orbit.
For other scientific studies, the observed TA centered on Earth’s centroid is the plasma-sphere/magnetosphere shown as the red dotted line in Figure 2. The Earth’s plasma layer locates above the Earth’s ionosphere and extends to an annular plasma area within about 3–6 times that of the Earth’s radius, and its spatial distribution overlaps with Earth’s radiation belt and the ring current area, all of which are important contents of Earth’s inner magnetosphere research [24]. As shown in Figure 2, the MBSEO around the near side can even cover the whole plasma-sphere/magnetosphere compared to the space method, and can be a supplementary gazing observation for deep space.
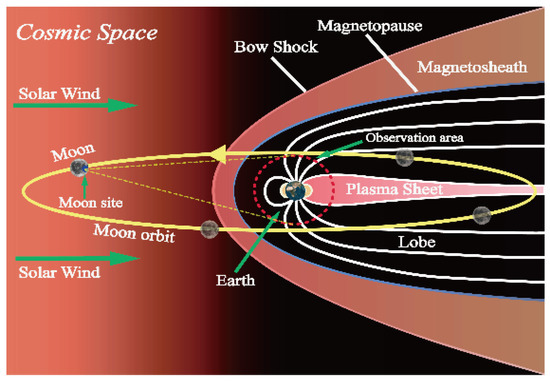
Figure 2.
Other scientific TA except the whole Earth disc.
During Moon’s nutation period, the mean Earth elevation of the near side in Figure 3 shows the uniform boundaries to cover different TAs. Lower elevations tend to cover smaller TAs. Taking the white dotted line of ‘3 Radius’ in Figure 3, for example, the areas inside the white dotted line might cover the whole TA with three times that of the Earth radius all the time, but the areas outside the white dotted line could only cover the whole TA at times. If the TA is about ‘40 Radius’, only the central part of near side can almost cover the whole. The elevation (orientation to Earth centroid) at a higher latitude is much smaller than that at a lower latitude. Different white dotted lines indicate the dividing lines of observation area with multiple Earth radii. The results in Figure 1a and Figure 3 are not exactly the same, mainly because of time-varying elevations caused by complicated Earth–Moon motion, but it is still demonstrated that the dividing lines will be closer to the center of the near side when the TA’s radius becomes larger.
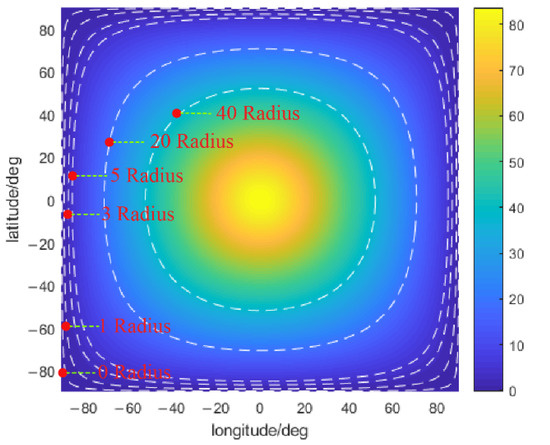
Figure 3.
The approximate dividing lines correspond to different TAs for average Earth centroid’s elevation distribution in the period of 18.6 years.
However, for a specific MBSEO as shown in Figure 4, the topography has great influence not only on FOV of TA, but also on occlusion of sunlight. The bigger the TA is, the more likely the obscured FOV caused by surrounding topography (e.g., hills, uplifts, and potholes) is to exist. A relatively flat area guarantees that there is a buffer area to satisfy the safety requirement of avoiding falling rocks from hills. Although the topography on the near side has smaller changes than other areas (e.g., the far side, the northern hemisphere, and southern hemisphere) mentioned in following section, it is still a factor to be considered in actual operation with permanent shadow and unobservable area. Normally, a crater in Figure 4 can be separated into the shadow area and the lighting area. Some MBSEOs could be established in the lighting area, i.e., some sites that are lighted all time or part time, for easily access to solar energy, while other MBSEOs could be established in the shadow area, especially in the permanent shadow area with lowest thermal environment, in which its energy flows through power cable from solar panel (a device for high-efficiency photoelectric conversion). It should also be noted that the permanent shadow area might have steep topography and even negligible TCTA.
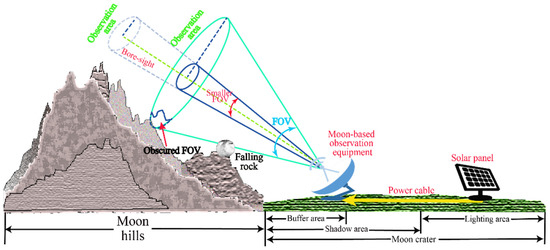
Figure 4.
Observation performances of MBSEO (The figures are made by Adobe Illustrator, a vector graphics software).
Therefore, the time coverage without topography is just an ideal situation, and surrounding topography should be considered in the actual selection of MBSEO. The following Section 3 will give a brief introduction of the Moon’s topography distribution to further warrant the importance of comprehensive consideration of TCTA, TA, topography, etc.
3. Topography of the Moon
The selection of MBSEO has a great relationship with Moon topography. Figure 5 indicates the topography of whole Moon, mainly reflected by Digital Elevation Model (DEM) and slope, are unevenly distributed on the near side, the far side, the northern hemisphere, and the southern hemisphere because of early Earth–Moon interaction and meteorite impacts [25]. The figure is based on Moon topography data of Lunar Orbiter Laser Altimeter (LOLA) with a resolution of 118 m. This resolution is sufficient for presenting the whole Moon topography. Specifically, the areas, e.g., lunar mares with flat topography, are relatively beneficial to MBSEO’s establishment. These so-called lunar mares are basically large, dark, basaltic plains, which account for about 25% of entire surface. Figure 1 also shows that, among the total 22 known lunar mares, only three mares (i.e., Sea of Cleverness, Sea of Moscow, and Eastern Sea) distribute in the far side. The lunar mares on the near side almost distribute in the center region, which account for about 50% of this hemispherical area [26]. Although mountains, valleys, rimae, and rupes largely exist on the near side, especially in the center region, in which the overall topography undulation is still smaller than that on the far side as shown in Table 1.
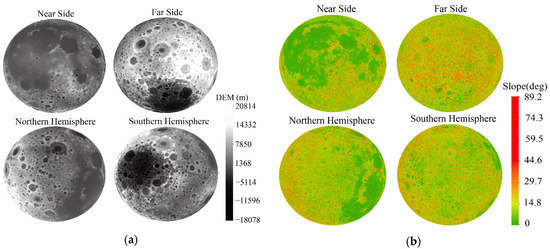
Figure 5.
The (a) DEM and (b) slope of Moon on the near side and far side, and in the northern hemisphere and southern hemisphere, respectively (The figure was created by ArcGIS, Matlab, etc.).

Table 1.
The maximum (Max) value, minimum (Min) value, mean value, and standard deviation (SD) of DEM and slope on the near side, far side, northern hemisphere, and southern hemisphere, respectively.
In Table 1, the topography undulation, expressed in maximum (Max) value, minimum (Min) value, mean value, and standard deviation (SD), shows significant differences not only in the hemisphere, but also in the latitude region of the near side. The topography undulation on the far side, northern hemisphere, and southern hemisphere are bigger than that on the near side, and the topography undulation on the near side over the northern hemisphere is relatively flatter than that over the southern hemisphere. Considering the city building construction criterion in [27], the area with the mean slope lower than 5.32° is better for building construction, and the southern part on the near side might thus not be suitable for MBSEO. However, topography is not the only factor affecting MBSEO’s selection in this paper, TCS and TCTA are the other two factors considered, so the southern part on the near side can still be a candidate of MBSEO.
The complicated topography is characterized by numerous unevenly distributed craters of unequal size and depth as shown in Figure 6, which is caused by the combination of early impacts of asteroids and Earth–Moon reaction [28]. Among all the known 6384 craters on the near side that are derived from the Lunar Impact Crater Database (Center for Lunar Science and Exploration, Lunar and Planetary Institute, Universities Space Research Association (USRA)) as shown in Figure 6 and Table 2, the crater with the biggest radius of 580 km is named Imbrium, while the majority of craters are of a small size less than 10 km and distributed in lunar mare, such as Palus Putredinis, Oceanus Procellarum, Mare Fecunditatis, Sinus Iridum, etc. Meanwhile, there are more craters in the southern part compared to the northern one, showing that the southern hemisphere has a more significant topography undulation.
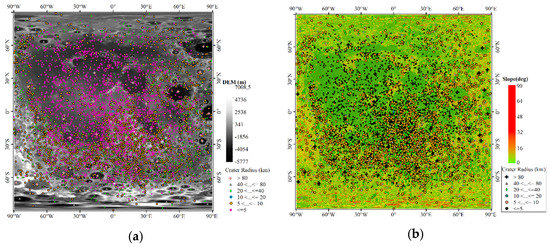
Figure 6.
Craters’ distribution on the near side with (a) DEM basemap and (b) slope basemap.
Table 2.
The distribution of craters on the near side.
Because the moon is locked by Earth’s tide, and only the near side basically enables the observation of Earth and a related deep space environment all the time except for small edge areas, the MBSEO can solely be built on the near side. Combining time coverage without topography in Section 2 and topography distribution in Section 3, and comprehensively analyzing multi-factors (i.e., topography, TCS and TCTA) on MBSEO’s selection, 17 areas are randomly selected on the near side; the 21 areas of past lunar landers are included; 18 areas evenly located on a dividing line of ‘1 Radius’ in Figure 3 are also chosen. The basic information of these areas is expressed in Table A5. After that, a multi-factors evaluation model different from traditional single-factor models will be introduced in the following Section 4 in detail.
4. Evaluation Model
In this paper, a comprehensive MFE model is proposed for MBSEO selection [29], and the factor set is where the subscript signifies the factor index. For example, factor indicates a specific site’s slope , and its fuzzy membership is ; factor indicates the site’s corresponding TCS , and its fuzzy membership is ; factor indicates the site’s corresponding TCTA , and its fuzzy membership is . The subscript is the candidate’s label of MBSEO. These three factors can be calculated from datasets of JPL ephemeris and Chang’E-2 DEM [30]. The DEM’s resolution is about 50 m that can reflect value changes of the selected factors [31,32,33]. This dataset was obtained from a CCD stereo camera at an orbital height of 100 km from about October 2010 to about December 2010. The TCS is calculated in a coordinate system named Moon Station Center (MSC), which is framed on the assumed center station point. The x-axis is parallel to the latitude line of Moon and directed to the east, the y-axis is parallel to the longitude line of Moon and directed to the north, and the z-axis obeys the right-hand rule together with the x- and y-axes. Normally, the TCTA of TA should be calculated with reference to the Moon Station Antenna (MSA), a coordinate system transformed from MSC, with the optical axis (i.e., the z-axis) of MSA being directed towards the Earth’s centroid. In this paper, because the obscured TA mainly lies in the same direction as its azimuth, the TCTA can also be calculated in MSC for simplification.
In MSC, the surrounding sites with the same azimuth as the Sun might be different in elevation compared to the Sun. Once the Sun’s elevation is smaller than the surrounding sites, the MBSEO is deemed as unable to receive light. In addition, once the elevation of TA is smaller than the surrounding sites, the TA can only be partly obscured.
For each factor we select, the higher the number of categories, the more accurate the details of the evaluation results will be. Here in this paper, four categories are introduced to indicate MBSEO’s suitability, namely the high accessibility (HA), intermediate accessibility (IA), low accessibility (LA), and inaccessibility (IC); each criterion is assumed to be of the Gaussian type as shown in Figure 7a.
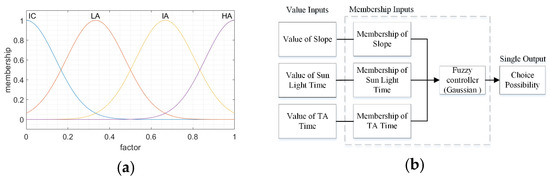
Figure 7.
The diagram of (a) relation between the three factors and their memberships and (b) the MISO fuzzy controller.
For factor , the four categories are HA1, IA1, LA1, and IC1; for factor , the four categories are HA2, IA2, LA2, and IC2; for factor , the four categories are HA3, IA3, LA3, and IC3. Therefore, the fuzzy rule tables contain 64 (i.e., 43) rules. The relationships of respective factors and their memberships satisfy changes as shown in Figure 7a. The statement of MFE is “if and and , then ”; the relation matrix is , where is the transpose matrix of the column vector, and × indicates a Cartesian product. Through the MFE’s statement, a MISO diagram was constructed as displayed in Figure 7b. After the input of actual values, multiple memberships can be converted to a single output through a fuzzy controller.
For a MBSEO, if , or or , the comprehensive evaluation index is zero. For the rest of the MBSEO, the comprehensive evaluation index is calculated from fuzzy rule tables shown in Appendix A.
Through the MFE model, the specific value of each factor can be firstly converted to the corresponding membership value, and then comprehensively converted to a single output (i.e., the choice possibility) in practical application. The membership of slope, TCS, and TCTA in Figure 7b are calculated from the corresponding value in several styles. Here, we adopted a common and understandable way to explain the corresponding membership as follows:
For slope membership, using as maximum tolerable slope for construction of MBSEO, the membership of slope is displayed in Equation (1) below. Considering the slope factor alone, the bigger the site’s slope is, the less likely it will be selected as MBEOS.
For factor , different MBSEOs might have different requirements for sunlight, so two coefficients and were used to indicate the maximum tolerable and the most optimal TCSs, respectively. The membership of sunlight is shown as Equation (2) below, where is the total simulation time window, and is the TCS. In terms of TCS, the longer the distance from TCS to the most optimal point (i.e., ), the more likely the site will not be selected as MBSEO. In particular, for some devices that can only work in permanently shaded areas with the lowest thermal noise environment, the coefficient will be decreased to zero, and Equation (2) below will be degenerated into ; the is also lowered to zero once exceeds . For other devices that require sunlight, the determination of parameters and mainly lies in light influence on observation and requirement. For devices that need to be directly exposed to sunlight, coefficient is often not zero and partly related with the photoelectric conversion efficiency of materials. The existing literature shows that the current highest efficiency of a large mono-crystalline silicon cell is 0.26, while the efficiency of other common poly-silicon cells does not exceed 0.19 [34,35]. For devices that have power transformed from regions nearby, the MBSEO can be established in the permanently shaded area where it is not far away from the lighting area.
For factor , this paper compares the values of TCTA (i.e., ) with DEM and TCTA (i.e., ) without DEM for calculating their memberships as shown in Equation (3) below. Here, the TCTA without DEM is generally deemed as the maximum value because most MBSEOs are assumed to be located in the craters’ bottom where it is often below the Moon geoid, causing the MBSEO to inevitably be obscured by the surrounding topography. is the scale coefficient. That is to say, in terms of TCTA alone, the closer between and , the more likely the site can be selected as suitable MBSEO.
After calculating and processing of membership, these values of membership can be used as inputs in the Fuzzy controller for final absolute evaluation. Compared to the evaluation method with fixed weights, the evaluation approach proposed in this paper is a dynamic one with full consideration of the factors’ changes. The relevant results will be presented in the next Section 5.
5. Results and Discussion
The Moon is locked by the Earth tide, and only a partial area on the near side can cover the whole TA, e.g., the Earth disc and Earth related deep space. For a better understanding of the Moon, the USA (United States of America) has conducted six Apollo lunar landing programs, and the USSR (Union of Soviet Socialist Republics) has conducted five Luna impact and eight lunar landing programs during the past several decades. Similarly, China has also conducted two Chang’e lunar landing programs on the near side. Almost all the landing sites are basically inside or at the edge of a lunar mare. Except for landing positions of three Luna programs (i.e., Luna 5, Luna 7, and Luna 18) that are only estimated because of equipment failure and technical reasons, the mean and SD of DEM and slope about the remaining 18 landing sites are −2107.5 m, 878.1 m, 3.0°, and 1.5°, respectively. In terms of slope, among the total 21 landing sites on the near side, only the Luna 5 program in May, 1965 landed on a site whose slope is 24.56° in the Sea of Clouds, and slopes of the 20 other remaining programs are all less than 5.71°. With respect to DEM, among the total of 21 lander sites on the near side, only the Apollo 16 program in April, 1972 landed on a site whose DEM is more than 0 m in the Descartes Highlands, and DEM of the 20 other remaining programs are all less than −1000 m. Therefore, considering the lander processing alone, the areas with flatter topography seem to be more suitable. The construction of MBSEO and its subsequent device transportation are primarily based on Moon lander programs. In order to better analyze the selection of MBSEO, the past Moon landing sites are included into the analysis of this paper. Some other sites, e.g., 17 small areas in craters and 18 small areas approximately along the dividing line of ‘1 Earth Radius’ observation, are also selected, and the basic information of these sites that are distributed around the near side are showed in Table A5.
In this study, urban architectural design standards are used as construction guidance of MBSEO. The slope of a relatively flat topography is usually less than 10%, that is to say, the maximum slope is about 5.71° [27]. This paper simulated 56 sites and the corresponding surrounding areas. These areas are centered on sites in Table A5, and each area is approximately 22.5 km × 22.5 km. For a better understanding of TCS and TCTA, the simulation period is from 1 January 2001 to 31 July 2019 because the nutation period is about 18.6 years. The simulation results indicate that there are neither permanent shadow areas in the 21 landing sites nor the corresponding obscured FOV of TA with 1, 3, and 5 times that of Earth’s radius. However, for those 17 areas centered in craters labeled ‘Y’ in Table A5, the results are different as shown in Table 3.
Table 3.
Ratios of permanent shadow area and obscured FOV about TA of 1, 3, 5 Earth radius for areas centered in craters.
In Table 3, all the ratios of permanent shadow area and obscured FOV are not zero, and the ratios of obscured FOV increase along with TA. Under the same elevation angle of TA, a bigger FOV makes TA’s fringe more easily reach the surrounding edge of Moon hills, thus making TA partly observed. Especially in Table 3, the higher latitude and longitude of MBSEO is, the bigger the obscured FOV will be. The reason mainly lies in the basically fixed center orientation and smaller elevation of TA. The simulation of other sites labeled “N” also shows the same tendency that is not displayed for simplification. Due to slight changes between Moon site to Sun and Moon site to Earth centroid, the MBSEO in permanent shadow areas that are not far away from solar panel in lighting area can still cause TA to be observed sometime.
Around the flat areas at low-middle latitudes, most TCSs of Moon sites have reached 0.5 together with high TCTAs. In other words, for the MBSEO requiring the lowest sunlight, most of the low-middle latitude areas are not suitable. In Section 4, the sunlight of MBSEO has two styles; one has and a maximum , while the other one has and a maximum . For different sets of and , the valid numbers of areas, i.e., the maximum and minimum MFE outputs after comprehensive evaluation, are shown in the following Table 4.
Table 4.
The valid numbers of areas expressed in Table A5, and the three numbers in brackets correspond to areas labeled “L”, “Y”, “N”, respectively.
Table 4 indicates that a smaller tolerable value in Equation (2) will exclude several candidate areas; and the same trend will be presented with bigger values of TA. Especially for those areas labeled “L”, the tolerable value should increase to about 0.4 once the area has been selected. However, the areas labeled “Y” can have lower values of and . For areas labeled “N”, the valid number is slightly smaller than those labeled “Y” due to the lower ratio of permanent shadow area. Therefore, the candidate areas can be set in areas labeled “Y” for the selection of MBSEO as shown in Table A5.
Figure 8 indicates the maximum comprehensive evaluation outputs in two different maximum tolerable sunlight. When the maximum tolerable sunlight is only 0.01 (a status that much closely to permanently shaded area), the maximum evaluation output changes dramatically for TA with different times that of Earth’s radius as shown in Figure 8a. A site does not necessarily have all better factor values, but a smaller TA has relatively higher evaluation output compared to the bigger one. For those sites far away from poles, e.g., Casatus E, Klaproth C, Newton E, Poncelet P, Simpelius A, and Wapowski, evaluation output for TA with 3 or 5 times that of Earth’s radius might not exist. The comprehensive evaluation output will become bigger along with the increase of maximum tolerable sunlight, which means a reduction in sunlight constraints. For some sites on the Moon, e.g., Klaproth C and Schomberger F, the maximum evaluation output of TA with 5 times that of Earth’s radius might be slightly bigger than that with 3 times that of Earth’s radius, and the reason mainly lies in the speed of TCTA without DEM being faster than that with DEM of bigger TA. When the selection of MBSEO has optimal and maximum tolerable sunlight, the results are different as shown in Figure 9.
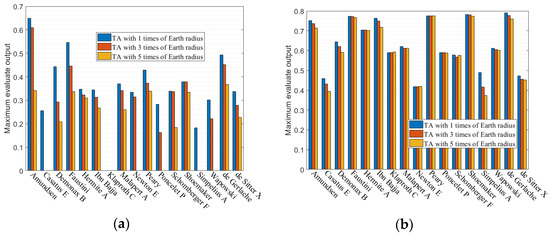
Figure 8.
The maximum comprehensive evaluation output with values, i.e., (a) 0.01 and (b) 0.2, of maximum tolerable sunlight.
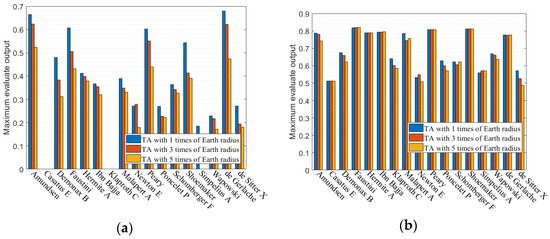
Figure 9.
The maximum comprehensive evaluation output with values, i.e., (a) 0.01 and 0.02 and (b) 0.1 and 0.2, of different optimal and maximum tolerable sunlight.
Figure 9 indicates the maximum comprehensive evaluation outputs in different optimal and maximum tolerable sunlight, suggesting that the increased optimal and maximum tolerable values make maximum comprehensive evaluation outputs of TA with 1, 3 and 5 times that of Earth’s radius get much closer. As shown in Figure 9a, the reduced optimal and maximum tolerable sunlight also makes the output change dramatically.
In the proposed evaluation method, the most important factor is TCTA for those areas with non-zero value of factors, TCS is the less important, and topography is the least important. When the memberships of TCTA is calculated with and without DEM, the memberships of TCTA will thus be different with the same radius. Therefore, the areas, e.g., Amundsen, Faustini, Peary, and de Gerlache located at high latitudes, still have high memberships of TCTA, although these areas cannot have TA be observed all the time. A better performance of MBSEO will be presented with a longer time of TA being observed. The selection of MBSEO should not be located at very high latitudes because low elevation near the poles cannot guarantee that the FOV is not obscured by the surrounding topography. Similarly, the flat areas distributed at the low-middle latitudes will inevitably suffer an adverse influence of sunlight, especially for the equipment that requires a low thermal environment, so the selection of MBSEO could be close to poles but should not be too close. In summary, a feasible way is to select MBSEO at around 80°. Here, in this paper, we choose Malapert A (80.4°S, 3.4°W) for a case analysis. The corresponding DEM, slope, permanent shadow area, and the area within the slope constraint are shown in Figure 10, and the slopes of the area edges including small hills, uplifts, and potholes are usually steeper than other areas. Although the Malapert A is around 80°S, about 1.9% permanent shadow areas exist as shown in Figure 10c. If only considering the slope constraint, 22% of the total areas that have not been excluded still exist as shown in Figure 10d.
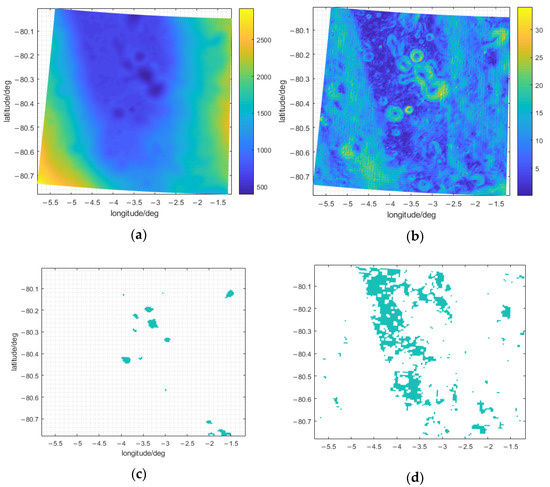
Figure 10.
The distribution of (a) DEM, (b) slope, (c) permanent shadow area and (d) area with slope constraint of the partial area centered in Malapert A.
By using the proposed evaluation method in Malapert A, the comprehensive evaluation output is calculated as shown in Figure 11. These sites with high calculated values are deemed as the candidates of MBSEO. Through the comparison of Figure 11 with Figure 10c–d, the permanent shadow area is neither necessarily within the slope constraint nor has high evaluation output. Therefore, the area that has little sunlight is more likely to be a candidate.
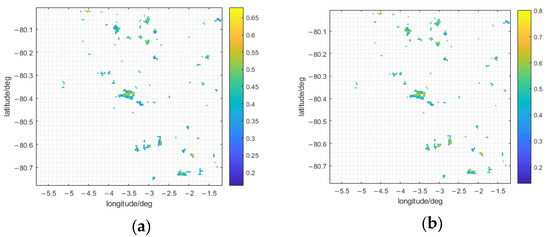
Figure 11.
The selected area is Malapert A shows in Figure 10 and corresponding TA is 1 time that of Earth’s radius; the two scenarios are (a) maximum tolerable sunlight of 0.2, and (b) optimal sunlight 0.1 and maximum tolerable sunlight of 0.2.
In this section, the proposed evaluation method is applied to areas on the near side for the first time. Areas of distinct latitudes and longitudes have different topography conditions, thus resulting in unequal distributions of TCS and TCTA. Commonly, the general equipment in MBSEO prefers a low thermal environment, indicating that the permanent shadow area is the best candidate. However, as shown in Figure 10 and Figure 11, the permanent shadow areas do not necessarily fall within the slope constraints, and they also have low evaluation outputs. As a result, the selection of MBSEO is a comprehensive outcome of multiple factors, and to a large extent, the proposed evaluation method has practical application value.
6. Conclusions
The selection of MBSEO is the comprehensive results of multiple factors, e.g., TCS, TCTA, and topography, instead of a single factor in the actual scenario. In fact, areas of the Moon surface have different characteristics of factors, and a certain area might only have the best value of one factor rather than the remaining factors. Therefore, this paper introduces the MFE model based on the MISO method to conduct a comprehensive analysis on areas centered in the crater for TA observation, e.g., the entire Earth disc and the plasma-sphere/magnetosphere.
Beginning with time coverage without Moon topography, the evenly distributed TCS and TCTA on the near side suggest two features: one is that TCS is basically the same except for two poles because of pole-day and pole-night; two is that TCTA of the area in 80°N–80°S and 80°W–80°E can almost reach 100% when observed TA is only Earth disc. However, the all-time observed areas will decrease and shrink to a central surface along with bigger TAs because of regular elevation without topography.
In addition, craters with unequal size and shape around the near side of Moon exist, thus making the Moon surface have complicated topography that badly affects the selection of MBSEO. The factors’ distribution is (e.g., TCS and TCTA) also influenced by topography. Usually, the topography at a low-middle latitude is relatively flatter than that at a high latitude, so the former is a better candidate for MBSEO once only considering topography. Although the sunlight can influence the energy supply of MBSEO, other energy harvesting methods (e.g., from the power panel in a nearby lighting area) and requirements of a low thermal environment make the area (e.g., at a low-middle latitude) with high TCS not a necessarily better candidate for MBSEO. The TCTA, especially the large TA in Earth related deep-space observation, and TCS will be easily obscured by the surrounding topography. The selection of MBSEO is a comprehensive evaluation of multi-factors, and the area with topography on the near side will show many differences in terms of other factors from those without topography.
Therefore, this paper proposes a dynamic evaluation method in multi-factors after referring to a control algorithm in automation. In this method, the unfixed weight of multi-factors will be used as inputs in the fuzzy controller that consist of numerous fuzzy rules, and then export unique output. To demonstrate the applicability of this method in multi-factors, this paper introduces 56 areas into analysis, which mainly consist of positions of previous landers and other partial areas in the centers of multiple craters. Obviously, the past landers mainly distributed at a low-middle latitude are not necessarily better candidates since there exist strict sunlight constraints that approach permanent shadow statuses. If the sunlight constraint is easy to be met, those landers will become better candidates because of flat topography and relatively high TCTA. The easily-met sunlight constraint also makes the evaluation method of partial areas in the center of multiple craters much closer among various TAs. Regarding the distribution of TCTA and TCS without topography, the adopted example, i.e., crater Malapert A around 80°S, suggests that the highest evaluation output can reach 0.65 and 0.8 under different constraints, and such sites are better choices.
In the model’s design, TCTA is the most important factor, the next one is TCS, and the last one is topography, so the rules in Appendix A show the main diagonal symmetry. During the about 18.6 nutation period, the small value of TCS that is quantified by the maximum tolerable and optimal time can largely exclude those sites in the middle-low latitude areas. Due to lower TCS, the high-latitude areas can be considered as the candidates of MBSEO.
The simulation in this paper also shows that, through the MISO method, we can select a qualified site that has a buffer of surrounding areas to satisfy the safety needs related to avoiding falling rocks on the Moon’s surface. More factors and complex fuzzy rules can also be applied in this MISO method in the future, if more factors need to be considered.
Author Contributions
Conceptualization and summary, Y.D., C.H. and H.G.; language modification, H.J. and K.W.; writing—original draft, G.C. All authors have read and agreed to the published version of the manuscript.
Funding
This research was funded by the Key Project of Frontier Science Research of the Chinese Academy of Sciences (QYZDY-SSW-DQC026) and the National Natural Science Foundation of China (Grant Nos. 41590853, 41501403).
Institutional Review Board Statement
Not applicable.
Informed Consent Statement
Not applicable.
Data Availability Statement
Not applicable.
Acknowledgments
We thank the IAU SOFA Collection for its use, copyright© International Astronomical Union Standards of Fundamental Astronomy (http://www.iausofa.org, 27 August 2021). We thank the JPL for the free access to DE430 and the IERS for free access to EOP data. We thank the USGS for free access to topography data of the global moon (https://planetarymaps.usgs.gov/mosaic/, 10 December 2021). We thank the Chang’E-2 payload team for mission operations and the China National Space Administration for providing the Chang’E-2 data that made this study possible. This data set was processed and produced by the Ground Research and Application System (GRAS) of China’s Lunar and Planetary Exploration Program, provided by China National Space Administration (http://moon.bao.ac.cn, 27 August 2021).
Conflicts of Interest
The authors declare no conflict of interest.
Appendix A
The fuzzy rules used in this study are provided below. When formulating the fuzzy rule table, factor is considered as the main factor, the second factor is , and the third is , so the categories in these tables are symmetrical along the main diagonal.
When factor is IC3, the evaluation output table is as shown in Table A1.
Table A1.
The fuzzy rule table when u3 is IC3.
Table A1.
The fuzzy rule table when u3 is IC3.
| HA2 | IA2 | LA2 | IC2 | |
|---|---|---|---|---|
| HA1 | LA | LA | IC | IC |
| IA1 | LA | IC | IC | IC |
| LA1 | IC | IC | IC | IC |
| IC1 | IC | IC | IC | IC |
When factor u3 is LA3, the evaluation output table is as shown in Table A2.
Table A2.
The fuzzy rule table when u3 is LA3.
Table A2.
The fuzzy rule table when u3 is LA3.
| HA2 | IA2 | LA2 | IC2 | |
|---|---|---|---|---|
| HA1 | LA | LA | LA | LA |
| IA1 | LA | LA | LA | LA |
| LA1 | LA | LA | IC | IC |
| IC1 | LA | LA | IC | IC |
When factor u3 is IA3, the evaluation output table is as shown in Table A3.
Table A3.
The fuzzy rule table when u3 is IA3.
Table A3.
The fuzzy rule table when u3 is IA3.
| HA2 | IA2 | LA2 | IC2 | |
|---|---|---|---|---|
| HA1 | IA | IA | IA | LA |
| IA1 | IA | IA | LA | LA |
| LA1 | IA | LA | LA | IC |
| IC1 | LA | LA | IC | IC |
When factor u3 is HA3, the evaluation output table is as shown in Table A4.
Table A4.
The fuzzy rule table when u3 is HA3.
Table A4.
The fuzzy rule table when u3 is HA3.
| HA2 | IA2 | LA2 | IC2 | |
|---|---|---|---|---|
| HA1 | HA | HA | IA | IA |
| IA1 | HA | HA | IA | LA |
| LA1 | IA | IA | LA | LA |
| IC1 | IA | LA | LA | IC |
Appendix B
Table A5.
The table contains basic information about analyzing areas centered on given sites. Here in the ‘style’ column, ‘L’ indicates the past landers’ center position, ‘Y’ indicates the area centered in a crater, ‘N’ indicates the area centered on a given (Lat, Lon) position, where closest to the assuming closest crater is labeled ‘Center name’. The SD in DEM and slope are both described according to area topography.
| Style | Center Name | Lat (°) | Lon (°) | SD in DEM (m) | SD in Slope (°) |
|---|---|---|---|---|---|
| L | Apollo 11 | 0.67°N | 23.47°E | 81.68 | 2.01 |
| L | Apollo 12 | 3.01°N | 23.42°W | 41.55 | 2.32 |
| L | Apollo 14 | 3.64°S | 17.47°W | 77.61 | 3.19 |
| L | Apollo 15 | 26.13°N | 3.63°E | 457.97 | 8.80 |
| L | Apollo 16 | 8.97°S | 15.49°E | 168.53 | 4.55 |
| L | Apollo 17 | 20.19°N | 30.77°E | 696.93 | 8.45 |
| L | Luna 2 | 29.1°N | 0° | 38.26 | 2.79 |
| L | Luna 5 | 31°N | 8°W | 32.55 | 2.89 |
| L | Luna 7 | 9.8°N | 47.8°W | 27.75 | 3.27 |
| L | Luna 8 | 9.1°N | 63.3°W | 20.98 | 1.99 |
| L | Luna 9 | 7.08°N | 64.37°W | 187.94 | 5.06 |
| L | Luna 13 | 18.87°N | 62.05°W | 12.50 | 1.59 |
| L | Luna 16 | 0.51°S | 56.36°E | 57.36 | 1.84 |
| L | Luna 17 | 38.23°N | 35°W | 15.49 | 1.77 |
| L | Luna 18 | 3.76°N | 56.66°E | 364.38 | 5.27 |
| L | Luna 20 | 3.78°N | 56.62°E | 377.84 | 5.12 |
| L | Luna 21 | 25.99°N | 30.41°E | 134.09 | 3.88 |
| L | Luna 23 | 12.66°N | 62.15°E | 46.70 | 2.13 |
| L | Luna 24 | 12.71°N | 62.21°E | 54.97 | 2.27 |
| L | Chang’e 3 | 44.12°N | 19.51°W | 34.24 | 1.93 |
| L | Chang’e 5 | 43.05°N | 51.91°W | 28.28 | 1.74 |
| Y | Amundsen | 84.3°S | 85.6°E | 295.81 | 6.78 |
| Y | Casatus E | 79.1°S | 53.2°W | 618.57 | 5.39 |
| Y | Demonax B | 81.5°S | 73.9°E | 917.62 | 8.09 |
| Y | Faustini | 87.3°S | 77°E | 961.22 | 7.08 |
| Y | Hermite A | 87.8°N | 47.1°W | 1048.26 | 10.20 |
| Y | Ibn Bajja | 86°S | 72.74°W | 669.04 | 6.53 |
| Y | Klaproth C | 69.1°S | 19.5°W | 389.64 | 5.70 |
| Y | Malapert A | 80.4°S | 3.4°W | 530.89 | 4.91 |
| Y | Newton E | 79.8°S | 36.9°W | 685.82 | 8.26 |
| Y | Peary | 88.6°N | 33°E | 118.45 | 6.51 |
| Y | Poncelet P | 80.6°N | 61.1°W | 239.39 | 4.55 |
| Y | Schomberger F | 80.1°S | 20.8°E | 293.40 | 4.92 |
| Y | Shoemaker | 88.1°S | 44.9°E | 136.47 | 4.30 |
| Y | Simpelius A | 70.1°S | 16.5°E | 161.93 | 5.88 |
| Y | Wapowski | 83.07°S | 53.55°E | 1212.04 | 8.57 |
| Y | de Gerlache | 88.5°S | 87.1°W | 771.11 | 7.30 |
| Y | de Sitter X | 80.3°N | 55.4°E | 440.28 | 6.09 |
| N | Amundsen | 80°S | 80°E | 577.55 | 5.35 |
| N | Balboa B | 20°N | 80°W | 47.19 | 2.44 |
| N | Boussingault T | 40°S | 80°W | 445.20 | 5.66 |
| N | Cannizzaro | 20°N | 80°E | 606.57 | 7.31 |
| N | Dryden W | 80°S | 80°W | 55.89 | 4.00 |
| N | Eichstadt G | 20°S | 80°W | 183.70 | 5.39 |
| N | Hanno C | 60°S | 80°E | 367.50 | 5.32 |
| N | Harkhebi W | 40°S | 80°E | 29.21 | 2.58 |
| N | Hecataeus J | 20°S | 80°E | 695.36 | 5.71 |
| N | Hedin V | 0° | 80°W | 455.50 | 5.48 |
| N | Humboldt N | 60°N | 80°E | 136.75 | 4.38 |
| N | Lavoisier A | 40°N | 80°W | 835.33 | 10.69 |
| N | Nansen F | 80°N | 80°E | 290.19 | 4.19 |
| N | Pingre W | 60°S | 80°W | 593.59 | 6.47 |
| N | Schubert H | 0° | 80°E | 421.96 | 4.17 |
| N | Swift | 80°N | 80°W | 292.72 | 6.42 |
| N | Xenophanes A | 60°N | 80°W | 182.19 | 5.42 |
| N | Zeno E | 40°N | 80°E | 217.15 | 7.46 |
References
- Ding, Y.X.; Guo, H.D.; Liu, G.; Han, C.M.; Lv, M.Y. Constructing a High-Accuracy Geometric Model for Moon-Based Earth Observation. Remote Sens. 2019, 11, 2611. [Google Scholar] [CrossRef]
- Ohtake, M.; Matsunaga, T.; Haruyama, J.; Yokota, Y.; Morota, T.; Honda, C.; Ogawa, Y.; Torii, M.; Miyamoto, H.; Arai, T.; et al. The global distribution of pure anorthosite on the Moon. Nature 2009, 461, 236–240. [Google Scholar] [CrossRef]
- Guo, H.D.; Ding, Y.X.; Guang, L. Moon-based Earth observation. Sci. Bull. 2022. [Google Scholar] [CrossRef]
- Wang, L.W.; Guo, D.W.; Zhang, Z.; Lv, Z.H.; Zhao, M.; Liu, Y. Introduction to NASA’s Artemis Lunar Exploration Program. Spacecr. Recovery Remote Sens. 2020, 41, 1–12. [Google Scholar]
- Ouyang, Z.Y. Scientific Objectives of Chinese Lunar Exploration Project and Development Strategy. Adv. Earth Sci. 2004, 19, 351–358. [Google Scholar]
- Pei, Z.Y.; Liu, J.Z.; Wang, Q.; Kang, Y.; Zou, Y.L.; Zhang, H.; Zhang, Y.H.; He, H.Y.; Wang, Q.; Yang, R.H.; et al. Overview of lunar exploration and International Lunar Research Station. Chin. Sci. Bull. 2020, 65, 2577–2586. (In Chinese) [Google Scholar] [CrossRef]
- Xu, L.; Zou, Y.L.; Jia, Y.Z. China’s Planning for Deep Space Exploration and Lunar Exploration before 2030. Chin. J. Space Sci. 2018, 38, 591–592. [Google Scholar]
- Wolfe, E.W. Geologic setting of Boulder 1, Station 2, Apollo 17 landing site. Moon 1975, 14, 307–314. [Google Scholar] [CrossRef]
- Available online: https://airandspace.si.edu/explore-and-learn/topics/apollo/apollo-program/landing-missions/ (accessed on 1 July 2022).
- Available online: https://nssdc.gsfc.nasa.gov/planetary/lunar/lunarussr.html (accessed on 1 July 2022).
- Zong, Q.G.; Ren, J.; He, J.S.; Wang, L.H. From Earth’s magnetospheres to the outer heliosphere & beyond. J. Deep Space Explor. 2020, 7, 554–559. [Google Scholar]
- Shen, G.Z.; Guo, H.D.; Liu, G.; Zhang, L.; Huang, J. Geometry Numerical Simulation and Analysis for Moon-Based Earth Observation. IEEE J. Sel. Top. Appl. Earth Obs. Remote Sens. 2020, 13, 3381–3393. [Google Scholar] [CrossRef]
- Sui, Y.; Guo, H.D.; Liu, G.; Ren, Y.Z. Analysis of Long-Term Moon-Based Observation Characteristics for Arctic and Antarctic. Remote Sens. 2019, 11, 2805. [Google Scholar] [CrossRef]
- Guo, H.D.; Liu, G.; Ding, Y.X. Moon-based Earth observation: Scientific concept and potential applications. Int. J. Digit. Earth 2018, 11, 546–557. [Google Scholar] [CrossRef]
- Guo, H.D.; Fu, W.X.; Liu, G. Scientific Satellite and Moon-Based Earth Observation for Global Change; Springer: Singapore, 2019. [Google Scholar]
- Shang, H.L.; Ding, Y.X.; Guo, H.D.; Guang, L.; Liu, X.; Wu, J.; Liang, L.; Jiang, H.; Chen, G.C. Simulation of Earth’s Outward Radiative Flux and Its Radiance in Moon-Based View. Remote Sens. 2021, 13, 2535. [Google Scholar] [CrossRef]
- Liu, Z.Q.; Di, K.C.; Li, J.; Xie, J.F.; Cui, X.F.; Xi, L.H.; Wan, W.H.; Peng, M.; Liu, B.; Wang, Y.X.; et al. Landing site topographic mapping and rover localization for Chang’e-4 mission. Sci. China-Inf. Sci. 2020, 63, 170–181. [Google Scholar] [CrossRef]
- Fu, X.H.; Qiao, L.; Zhang, J.; Ling, Z.C.; Li, B. The subsurface structure and stratigraphy of the Chang’E-4 landing site: Orbital evidence from small craters on the Von Kármán crater floor. Res. Astron. Astrophys. 2020, 20, 59–70. [Google Scholar] [CrossRef]
- McCauley, J.F.; Scott, D.H. The geologic setting of the Luna 16 landing site. Earth Planet. Sci. Lett. 1972, 13, 225–232. [Google Scholar] [CrossRef]
- Li, Z.J.; Guo, L.; Peng, K. Research on Site Selection of Manned Lunar Base. Manned Spacefl 2015, 21, 158–162. [Google Scholar]
- Chen, G.Q.; Guo, H.D.; Ding, Y.X.; Shang, H.L.; Lv, M.Y.; Zhang, K. Influence of Topography on the Site Selection of a Moon-Based Earth Observation Station. Sensors 2021, 21, 7198. [Google Scholar] [CrossRef]
- Taylor, L.A.; Kulcinski, G.L. Helium-3 on the Moon for Fusion Energy: The Persian Gulf of the 21st Century. Solar Syst. Res. 1999, 33, 338. [Google Scholar]
- Davide, C.; Mio, T. Plant sprouts on the Moon for first time ever. Nature 2019. [Google Scholar] [CrossRef]
- Wang, H.Z. The Interaction between the Moon and the Earth’s Magnetosphere; Shandong University: Jinan, China, 2018. (In Chinese) [Google Scholar]
- Yao, M.J.; Chen, J.P.; Xu, B.; Ji, J.Z.; Chen, J. Difference Comparison and Evolution Analysis of Lunar Nearside and Farside. J. Earth Sci. Environ. 2017, 39, 428–438. [Google Scholar]
- Wu, H.Z.; Wang, X.Y.; Guo, Z.Y.; Ji, W. Dynamics Explanation About Linear Structure on Lunar Surface and Lunar Mare Distribution. J. Anhui Norm. Univ. (Nat. Sci.) 2012, 35, 562–567. [Google Scholar]
- Wu, Z.Q.; Li, D.H. Fundamentals of City Planning; China Architecture & Building Press: Beijing, China, 2010. [Google Scholar]
- Li, K. Study on Small-Scale Lunar Craters’ Morphology and Degradation; Wuhan University: Wuhan, China, 2013. (In Chinese) [Google Scholar]
- Wang, D.Q.; Deng, Z.D.; Zheng, P.; Xu, G.F. Multi-index evaluation model for water point selection based on remote sensing. J. PLA Univ. Sci. Technol. (Nat. Sci. Ed.) 2014, 15, 67–72. [Google Scholar]
- China National Space Administration. Ground Research and Application System of China’s Lunar and Planetary Exploration Program, Chang’e 2 CCD Cameras Dataset; China National Space Administration: Beijing, China, 2020.
- Mazarico, E.; Neumann, G.A.; Smith, D.E.; Zuber, M.T.; Torrence, M.H. Illumination conditions of the lunar polar regions using LOLA topography. Icarus 2011, 211, 1066–1081. [Google Scholar] [CrossRef]
- Noda, H.; Araki, H.; Goossens, S.; Ishihara, Y.; Matsumoto, K.; Tazawa, S.; Kawano, N.; Sasaki, S. Illumination conditions at the lunar polar regions by KAGUYA (SELENE) laser altimeter. Geophys. Res. Lett. 2008, 35, L24203. [Google Scholar] [CrossRef]
- Rosa, D.D.; Bussey, B.; Cahill, J.T.; Lutz, T.; Crawford, I.A.; Hackwill, T.; Gasselt, S.V.; Neukum, G.; Witte, L.; McGovern, A.; et al. Characterisation of potential landing sites for the European Space Agency’s Lunar Lander project. Planet. Space Sci. 2012, 74, 224–246. [Google Scholar] [CrossRef]
- Ji, Y.J.; Liu, D.; Li, Q. Thermodynamic Efficiency Limits of Semitransparent Solar Cells. J. Inorg. Mater. 2022, 37, 204–208. [Google Scholar] [CrossRef]
- Chen, J.F.; Zhao, S.S.; Gao, T.; Xu, Y.Z.; Zhang, L.; Ding, Y.; Zhang, X.D.; Zhao, Y.; Hou, G.F. High-efficiency Monocrystalline Silicon Solar Cells: Development Trends and Prospects. Mater. Rep. 2019, 33, 110–116. [Google Scholar]


Publisher’s Note: MDPI stays neutral with regard to jurisdictional claims in published maps and institutional affiliations. |
© 2022 by the authors. Licensee MDPI, Basel, Switzerland. This article is an open access article distributed under the terms and conditions of the Creative Commons Attribution (CC BY) license (https://creativecommons.org/licenses/by/4.0/).