Article

Detection and Counting of Maize Leaves Based on Two-Stage Deep Learning with UAV-Based RGB Image

1
College of Information and Technology, Jilin Agricultural University, Changchun 130118, China
2
College of Land Science and Technology, China Agricultural University, Beijing 100193, China
3
Institute of Vegetables and Flowers, Chinese Academy of Agricultural Science, Beijing 100081, China
*
Author to whom correspondence should be addressed.
Remote Sens. 2022, 14(21), 5388; https://doi.org/10.3390/rs14215388
Submission received: 11 September 2022 / Revised: 20 October 2022 / Accepted: 24 October 2022 / Published: 27 October 2022

Abstract

:
Leaf age is an important trait in the process of maize (Zea mays L.) growth. It is significant to estimate the seed activity and yield of maize by counting leaves. Detection and counting of the maize leaves in the field are very difficult due to the complexity of the field scenes and the cross-covering of adjacent seedling leaves. A method was proposed in this study for detecting and counting maize leaves based on deep learning with RGB images collected by unmanned aerial vehicles (UAVs). The Mask R-CNN was used to separate the complete maize seedlings from the complex background to reduce the impact of weeds on leaf counting. We proposed a new loss function SmoothLR for Mask R-CNN to improve the segmentation performance of the model. Then, YOLOv5 was used to detect and count the individual leaves of maize seedlings after segmentation. The 1005 field seedlings images were randomly divided into the training, validation, and test set with the ratio of 7:2:1. The results showed that the segmentation performance of Mask R-CNN with Resnet50 and SmoothLR was better than that with LI Loss. The average precision of the bounding box (Bbox) and mask (Mask) was 96.9% and 95.2%, respectively. The inference time of single image detection and segmentation was 0.05 s and 0.07 s, respectively. YOLOv5 performed better in leaf detection compared with Faster R-CNN and SSD. YOLOv5x with the largest parameter had the best detection performance. The detection precision of fully unfolded leaves and newly appeared leaves was 92.0% and 68.8%, and the recall rates were 84.4% and 50.0%, respectively. The average precision (AP) was 89.6% and 54.0%, respectively. The rates of counting accuracy for newly appeared leaves and fully unfolded leaves were 75.3% and 72.9%, respectively. The experimental results showed the possibility of current research on exploring leaf counting for field-grown crops based on UAV images.

Graphical Abstract

1. Introduction

Maize (Zea mays L.) is one of the main food crops in China [1,2], which can be used as food, feed, and for industrial processing, and its yield is of great significance to agricultural economic benefits [3,4]. The leaves of maize seedlings have a distinct hierarchy. Obtaining leaf age information according to the number of leaves is the most obvious sign to determine the growth and development process of maize from the external morphology of the plant. Currently, the traditional acquisition of the number of maize leaves in the field mainly relies on the observation directly, which is inefficient and labor-intensive. Moreover, it is important to obtain the leaf age of maize efficiently and accurately for the analysis of maize growth due to the short seedling period of maize and the complicated field environment.
With the rapid development of computer vision technology, the current plant phenotype research has become a hot topic, especially based on image processing technology [5,6,7]. Applying deep learning to process the UAV-based RGB image can provide a nondestructive and rapid approach to detect the maize leaves. Compared with the other existing remote sensing platforms, a UAV with an RGB camera has the advantages of small size, low cost, high efficiency, and flexibility [8,9,10,11]. Alzadjali et al. [12] used UAV-obtained images to detect maize tassel in the field. Barreto et al. [13] realized automatic plant counting of sugar beet, maize, and strawberry based on UAV images. Liu et al. [14] realized high-throughput counting of maize seedlings through corner detection, linear regression, and object detection methods.
In recent years, the successful application of deep learning in image analysis can be attributed to the rapid development of feature-extraction-based Convolutional Neural Networks (CNNs) [15]. Relying on the training of substantial datasets, CNNs can improve the image feature extraction ability and has been widely used in image segmentation [16,17,18,19] and detection [20,21,22,23,24,25]. Extensive research has been conducted on crop segmentation by using deep learning methods. Ngugi et al. [26] improved the U-Net network to segment tomato leaves. The test results showed that when the average intersection ratio was 0.97, the F1 score was 0.94. Ma et al. [27] used the SegNet model of a fully convolutional network to segment rice and weeds in the seedling stage with an average pixel accuracy of 0.93, which could classify and identify rice, weeds, and the background in rice field images at the pixel level. However, semantic segmentation models such as U-Net and SegNet can realize pixel-level classification, and it is still difficult to distinguish individuals within the same groups. Mask R-CNN can separate individuals in specific categories based on semantic segmentation [28,29,30], providing technical support for individual object detection compared with the semantic segmentation model. Jia et al. [31] proposed Mask R-CNN to solve the problem of missed fruit detection caused by the overlapping of fruit or sheltering of the leaves on fruits. Accurate identification and segmentation of apple fruits were achieved with an overall accuracy of 97.31% and a recall rate of 95.70%.
Crop growth process monitoring is an important task in agricultural production, among which crop leaves and fruits are common monitoring objects [32]. Vishal et al. [33] applied the YOLOV3 model to count the leaves of potted rice and estimated the total number of leaves by detecting the tip of the rice leaves in the image, with an average precision of 0.82. This study laid a foundation for the counting of leaves of field crops such as wheat, maize, sorghum, and barley. Dobrescu et al. [34] used the ResNet50 network as a feature extractor to perform end-to-end training to predict the number of Arabidopsis thaliana leaves. The root-mean-square error (RMSE) was 0.93 between the measured and the predicted number of leaves, and the coefficient of determination (R2) was 0.95. Miao et al. [35] used a Faster R-CNN detection network to count leaves in seedling images of greenhouse potted maize when the R2 was 0.88. Wang et al. [36] used the channel-pruned YOLOv5s model to detect apple fruit with a recall, precision, and F1 score of 0.88, 0.96, and 0.92 respectively, and the average inference time of a single image was 8 ms. Although the Faster R-CNN model had high detection accuracy, disadvantages were found with computational redundancy and slow speed in the detection stage. In contrast, the YOLOv5 model had the advantages of high detection accuracy and fast inference speed [37,38].
Based on our best knowledge, the current data source of plant leaf count is mainly from greenhouse [39] or on-site field cameras, and the throughput of the measurement is very limited. Crop leaf counting is a further application after obtaining complete individual plants. It is difficult to obtain crop leaves directly by single-object detection or by a segmentation method due to the influence of soil and weeds in the field environment. To reduce the influence of a complex background, researchers put forward the strategy of using the two-stage method to obtain the object [22,40,41,42]. The superposition of two deep learning methods can reduce the amount of information processed, and more accurate and detailed object features can be obtained. Liu et al. [42] developed an integrated CNN-based method for estimating the severity of apple Alternaria leaf blotch in complex field conditions. The complex background was first removed by segmenting the leaves with a segmentation network. The disease was then identified on the segmented leaves with a 96.41% final prediction accuracy.
The early growth stage of maize seedlings in the field was taken as the research object in this study, and the deep learning network was used to realize the leaf counting of maize seedlings under the complex field environment with UAV digital images. The main contributions are as follows: (1) A two-stage deep learning strategy for rapid acquisition of maize leaves in a complex field environment was proposed. (2) A new loss function SmoothLR was proposed to improve the convergence speed and segmentation performance of Mask R-CNN. The improved Mask R-CNN was used to segment the complete foreground of maize seedlings from the complex field background. (3) The YOLOv5 model was used to detect and count the maize leaves and was compared with the mainstream detection model. The counting of leaves based on UAV images guides high-throughput investigation of crop growth period and final yield.

2. Materials and Methods

2.1. UAV Image Acquisition and Preprocessing

The field experiment was located at the Farmland Irrigation Research Institute of the Chinese Academy of Agricultural Sciences, Xinxiang County, Henan Province in China (35°18′N, 113°51′E). The maize inbred lines used in this study contained 492 varieties. The DJI Phantom 4 Pro V2.0 (SZ DJI Technology Co., Shenzhen, China) was used to acquire digital RGB images in June 2020 and 2021, respectively. UAV images in the early growth stage of maize seedlings was acquired with the 2 leaf to 6 leaf stage. The UAV was equipped with a 1-inch 20-megapixel CMOS sensor. A stable solar radiation intensity can reduce the loss of image texture feature information of maize seedlings [14]. Therefore, the flight was conducted from 10:00 am to 1:30 pm. The weather was clear without clouds. The flight altitude was set to 5 m, and the acquired image resolution was 5472 × 3648 pixels.
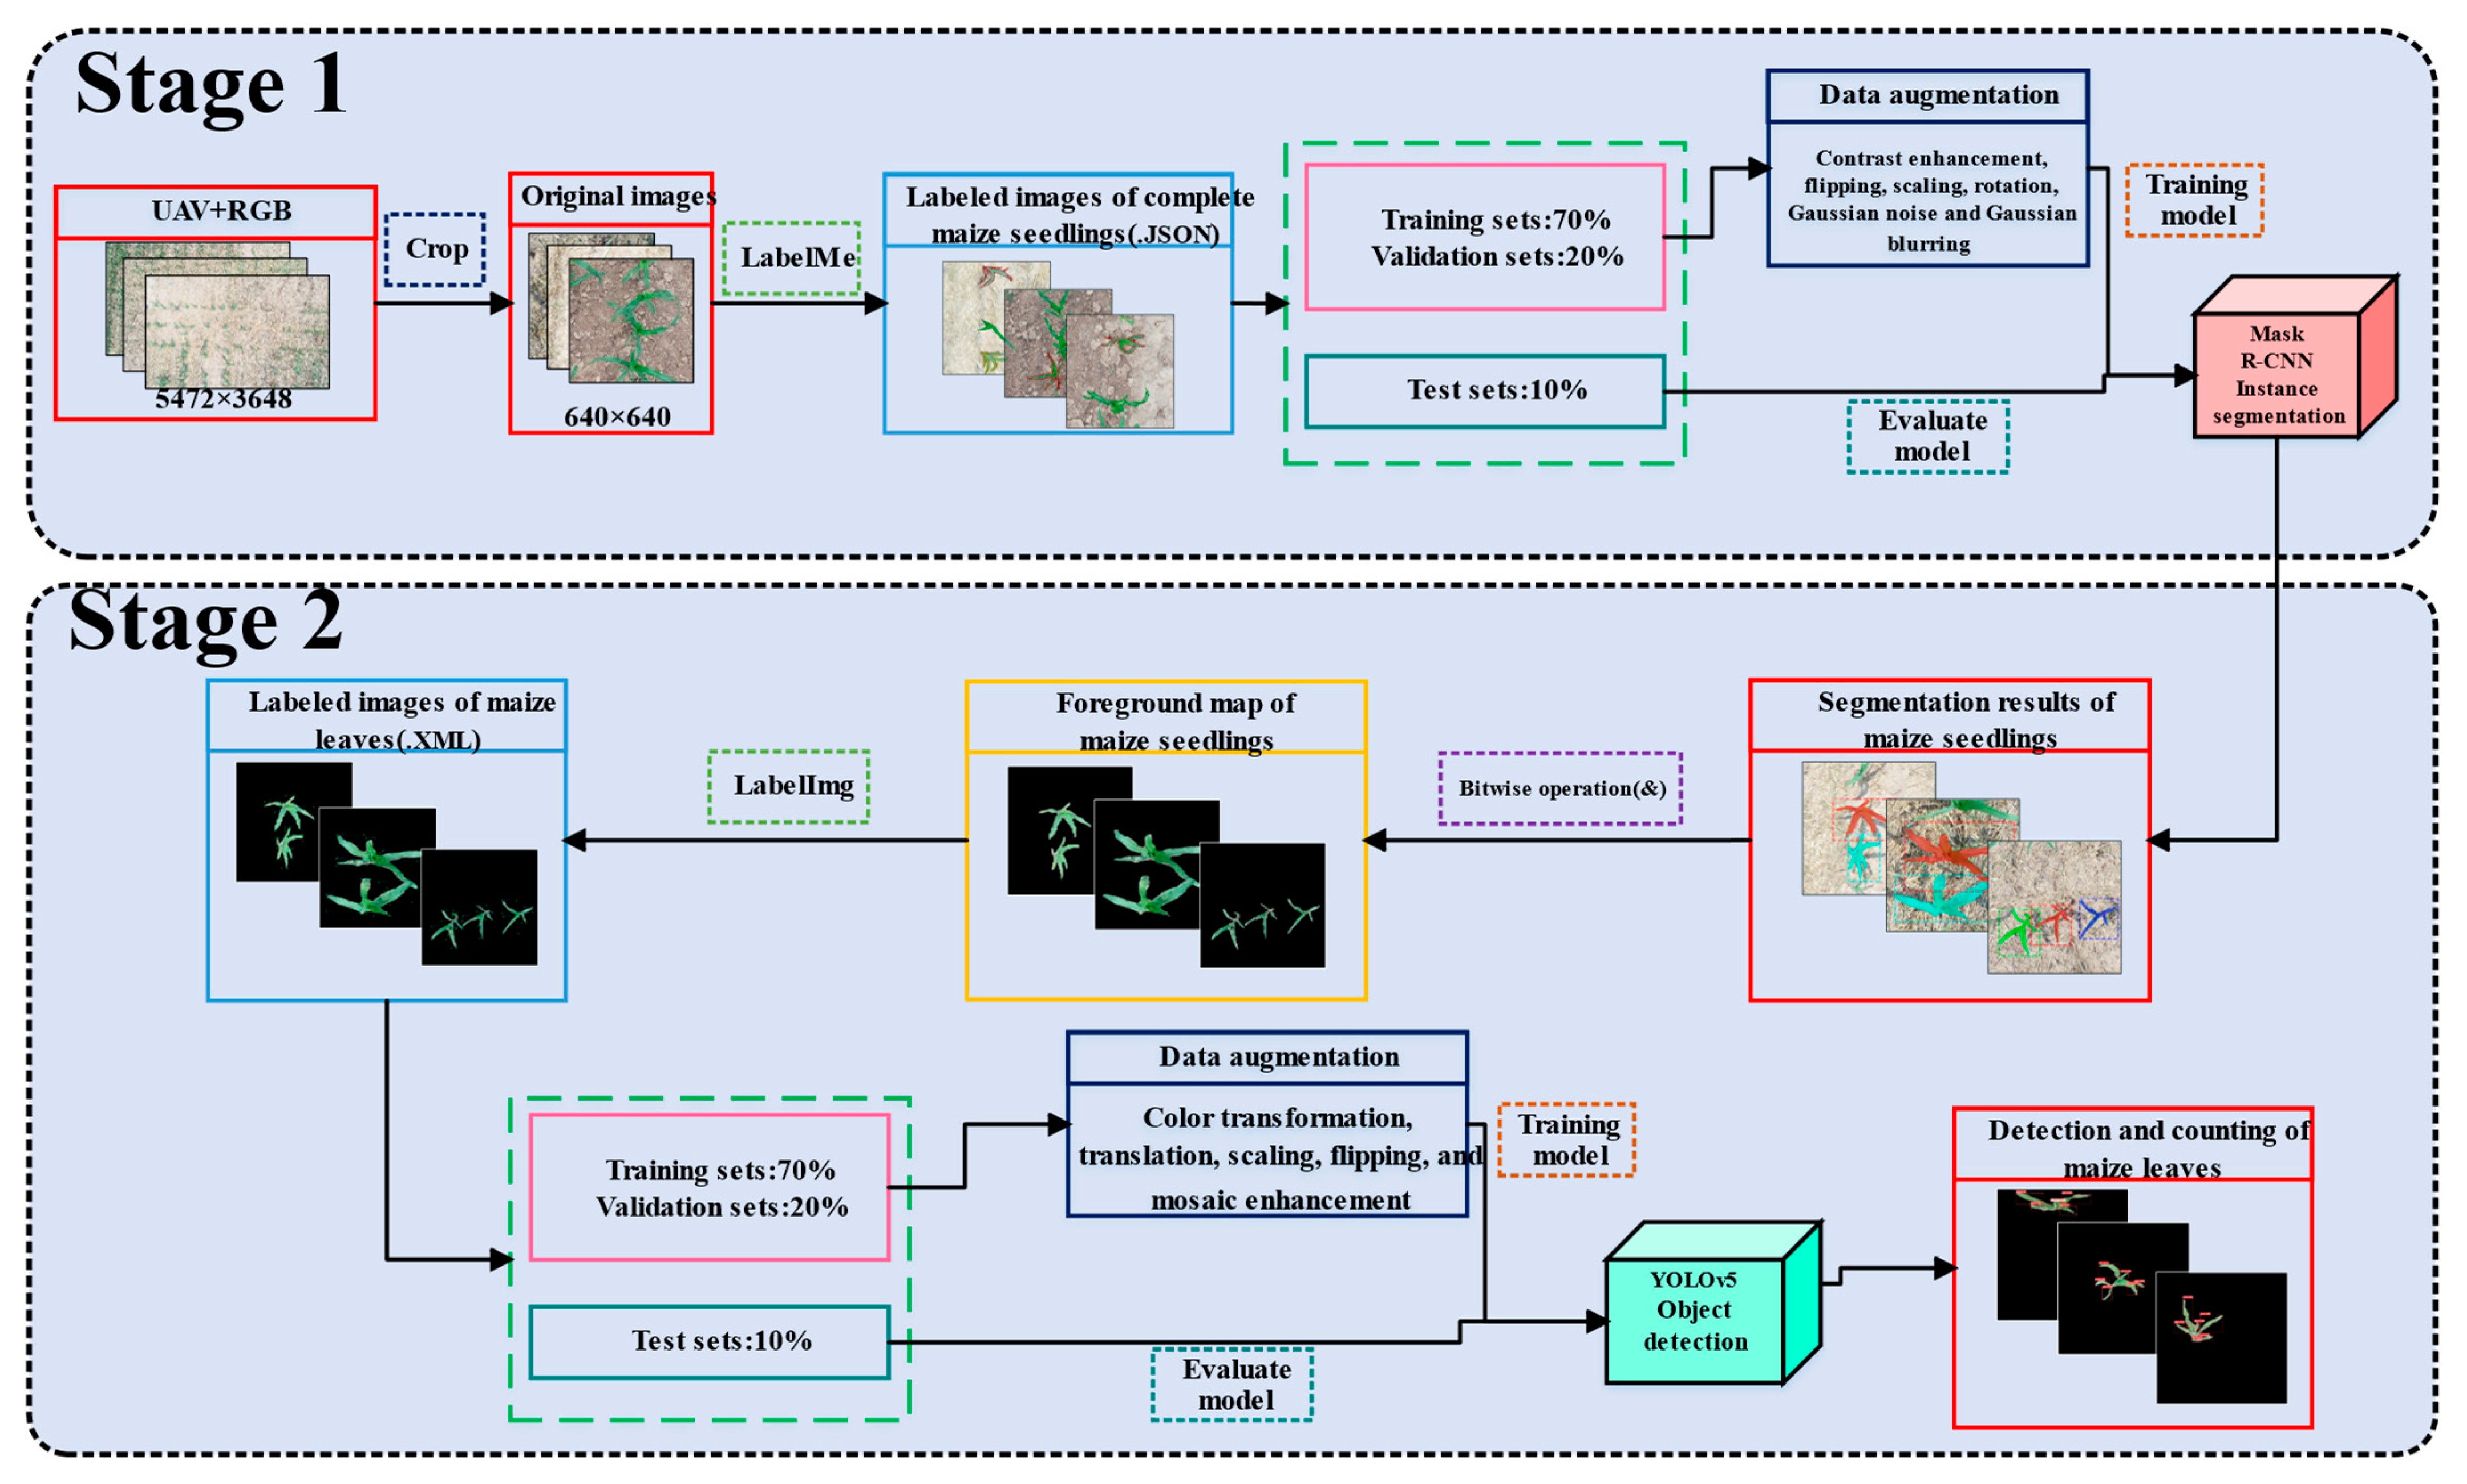
The original images were cropped into 1005 images with 640 × 640 pixels. The training set, validation set, and test set were created according to the ratio of 7:2:1. LabelMe (https://github.com/wkentaro/labelme, accessed on 20 August 2021) [43] was used to label the boundary points of complete maize seedlings in the dataset and generated JSON files. LabelImg (https://github.com/tzutalin/labelImg, accessed on 1 February 2022) [44] was used to label the maize leaves after instance segmentation, and the XML files were generated. The classes of maize leaves were set to fully unfolded leaf (leaf) and newly appeared leaf (new_leaf), as the features of newly appeared leaves and fully unfolded leaves of maize seedlings differed greatly. The newly appeared leaves of maize seedlings are shown in Figure 1, and the red rectangles are the annotation boxes. In data augmentation, contrast enhancement, flipping, scaling, rotation, Gaussian noise, and Gaussian blurring were performed during the training of the instance segmentation model. Finally, 2646, 692, and 101 images were obtained in the training, validation, and test sets, respectively, in the instance segmentation stage. Color transformation, translation, scaling, flipping, and mosaic enhancement operations were performed during the training of the object detection models. Finally, 2963, 847, and 101 images were obtained in the training, validation, and test sets, respectively.

2.2. Overall Design of Leaf Counting

The flowchart is shown in Figure 2 for maize seedlings and leaves detection with the deep learning method. The steps were divided into two stages. In the first stage, the Mask R-CNN (https://github.com/open-mmlab/mmdetection, accessed on 4 January 2022) [45] was used to generate complete maize seedlings masks with the JSON files annotated by LabelMe. When the maize seedling mask was predicted by the model, the maize seedlings foreground was then extracted from the complex background by the bitwise operation (&) of the binary mask with the original image. In the second stage, YOLOv5 (https://github.com/ultralytics/yolov5/tree/v6.0, accessed on 28 February 2022) [46] was used to detect and count the leaves with the XML file annotated by LabelImg as inputs.

2.3. Instance Segmentation Model of Maize Seedlings

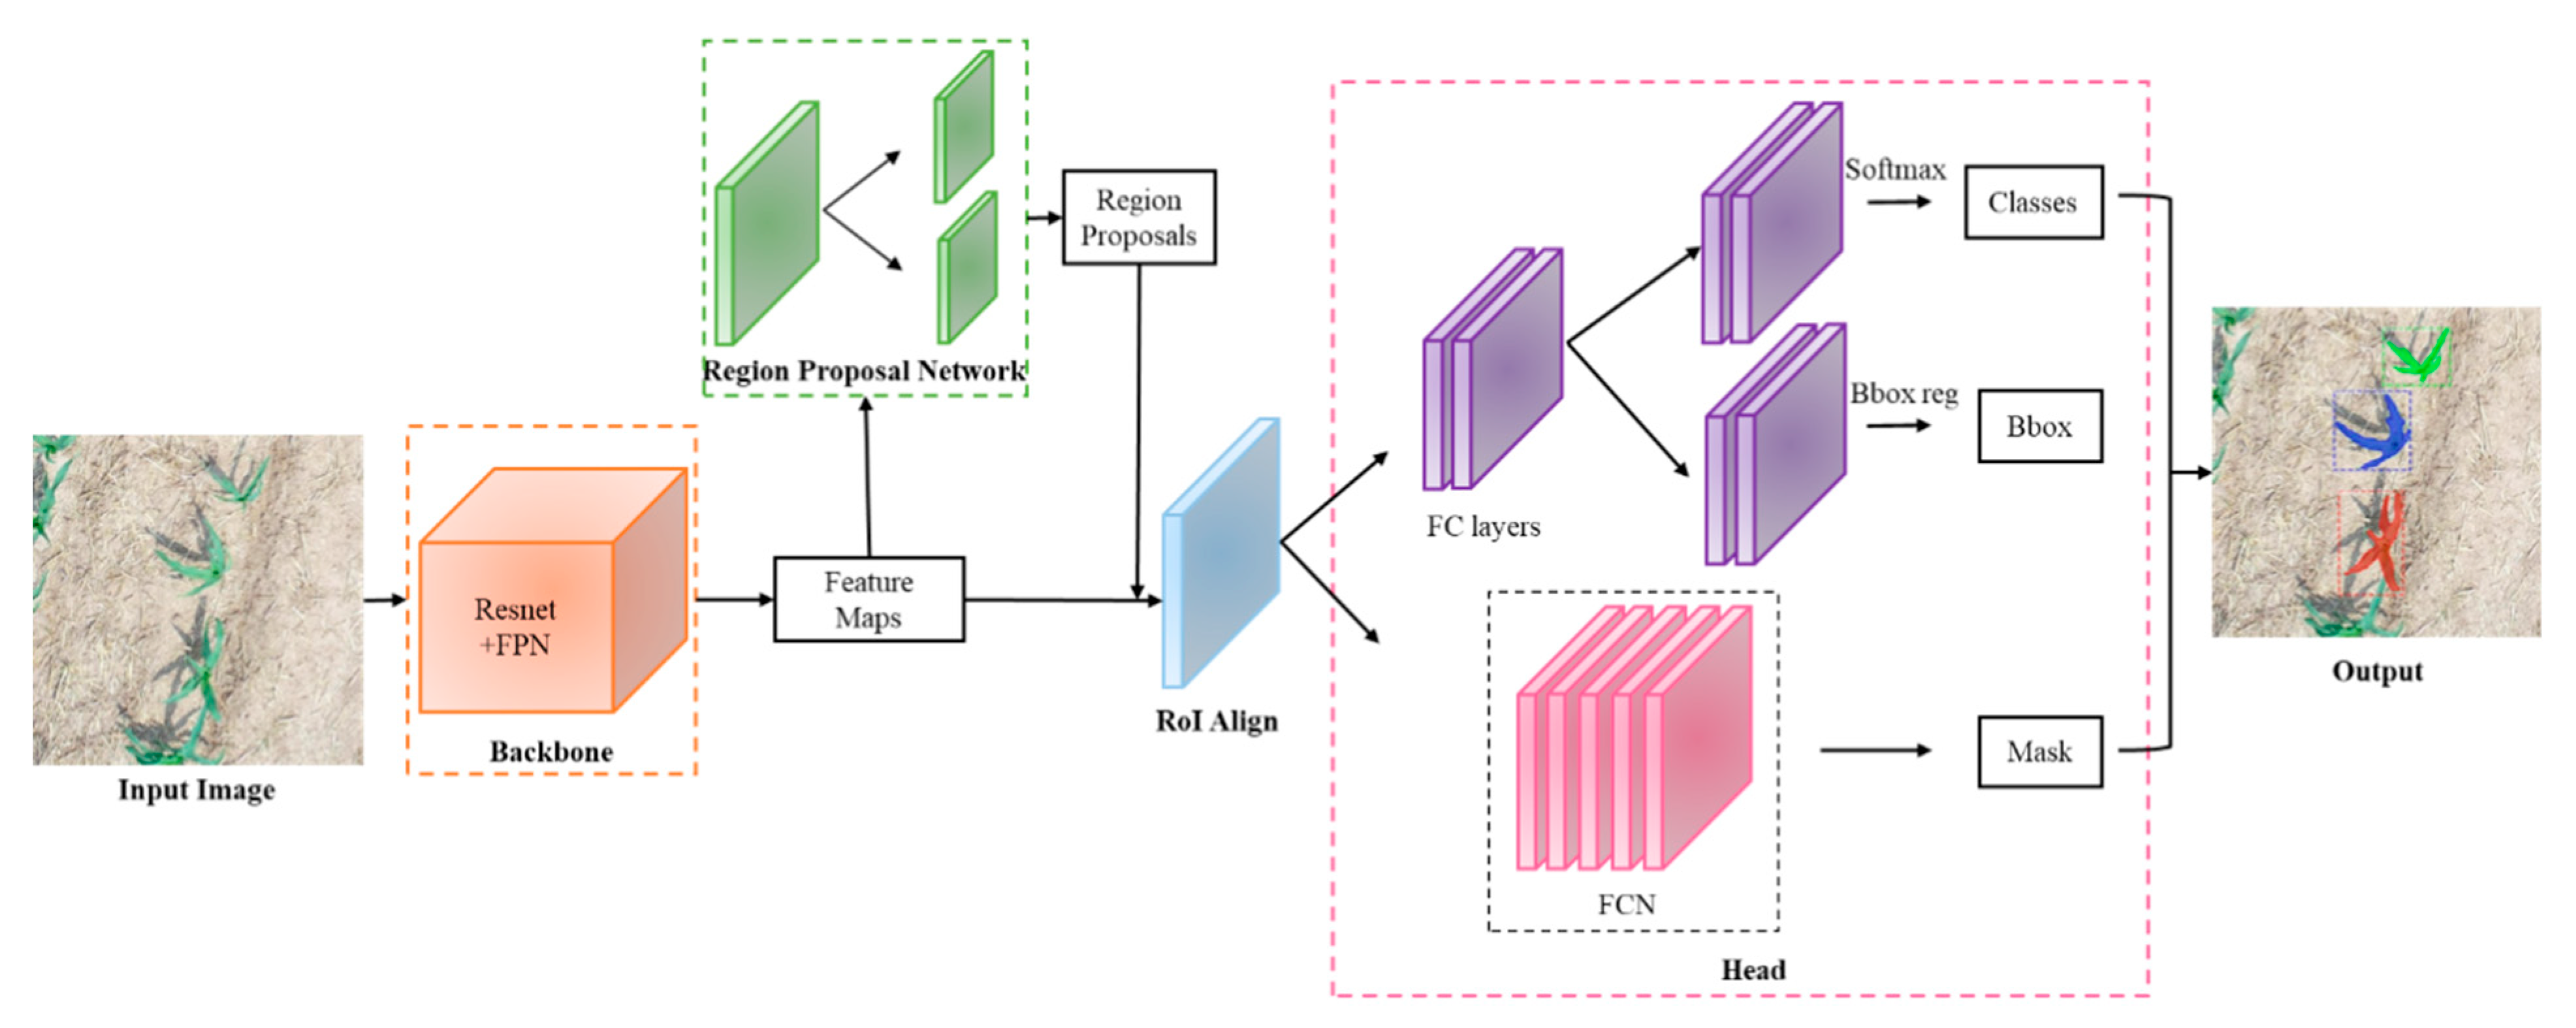
To minimize the impact of the soil background, weed, and overlapping leaves for maize leaf detection, Mask R-CNN was used to segment the complete maize seedlings from UAV images, which provided the basis for the next step of maize leaves detection. The main idea of Mask R-CNN [47] is to add a Fully Convolutional Network (FCN) [48] to the framework of Faster R-CNN [49] to realize instance segmentation. The structure of Mask R-CNN is shown in Figure 3, which is composed of the backbone network, Region Proposal Network (RPN), Region of Interest Align (RoI Align), and output network (Head). The backbone network consists of the residual neural network (Resnet) [50] and the Feature Pyramid Network (FPN) [51]. The features of the input images can be extracted and fused to obtain the corresponding feature map. RPN uses a 3 × 3 sliding window to generate two 1 × 1 convolutional layers on the feature map and obtain bounding box regression and object classification. The non-maximum suppression (NMS) method filters out the anchor box with the highest foreground scores in the feature map. The candidate regions of different sizes are obtained. The size of the candidate region is then unified through RoI Align to ensure that the candidate region matches the weight matrix of the fully connected layer. The final output network has three branches for classification, object detection, and segmentation. The classification branch uses the full connection layer and Softmax classifier to classify the target and output the probability. The bounding box branch uses the full connection layer and bounding box regression to locate the target. The mask branch uses the FCN to realize pixel-to-pixel mask segmentation.
The loss function of the Mask R-CNN has two parts. L R P N is the loss function in the RPN classification regression stage. L H e a d is the loss function at the output network. The total loss L of the model is shown in Equation (1).
L = L R P N + L H e a d
Further, L R P N includes classification loss and object box regression loss (Equation (2)). L H e a d includes classification loss, regression loss, and pixel segmentation loss (Equation (3)).
L R P N = 1 N c l s 1 i L c l s p i , p i + λ 1 1 N r e g 1 i p i L r e g t i , t i
L H e a d = 1 N c l s 2 i L c l s p i , p i + λ 2 1 N r e g 2 i p i L r e g t i , t i + γ 2 1 N m a s k i L m a s k s i , s i
where i is the anchor point; N c l s 1 is the number of classification layers; N r e g 1 is the number of regression layers; N m a s k is the number of segmentation layers; p i is the predicted probability of i ; p i is the true value with the value of 0 or 1; t i are the four parameterized coordinates of the predicted bounding box with the center coordinate value, width, and height of the bounding box; t i are the coordinates of the true value for the bounding box associated with i ; s i and s i represent the binary matrices of the predicted value and true value masks, respectively. L c l s is the classification loss function, L r e g is the regression loss function, L m a s k is the pixel segmentation loss function, and λ 1 , λ 2 , γ 2 are the balance parameters.
To improve the convergence speed and model segmentation performance, a new loss function SmoothLR (Equation (4)) was designed for bounding box regression, which fused L1 Loss and RMSE to replace L1 Loss in the original model. L1 Loss converges quickly in the early stage of training, but the loss value tends to be stable in the late stage, making it difficult for the model to converge to higher accuracy. SmoothLR used L1 Loss in the early stage to speed up the convergence, and RMSE was used in the later stage to reduce the gradient of the model, so the model gradually converged to the optimal solution.
S m o o t h L R = 0.5 x 2 + e p s             i f   x < 1 L 1 0.5                             otherwise .
where x is the difference between the predictions and the ground truth, and the e p s term is used to ensure the loss function stability by avoiding the numerical issue of dividing by 0, with its value set to 0.000001.

2.4. Object Detection Model of Maize Leaves

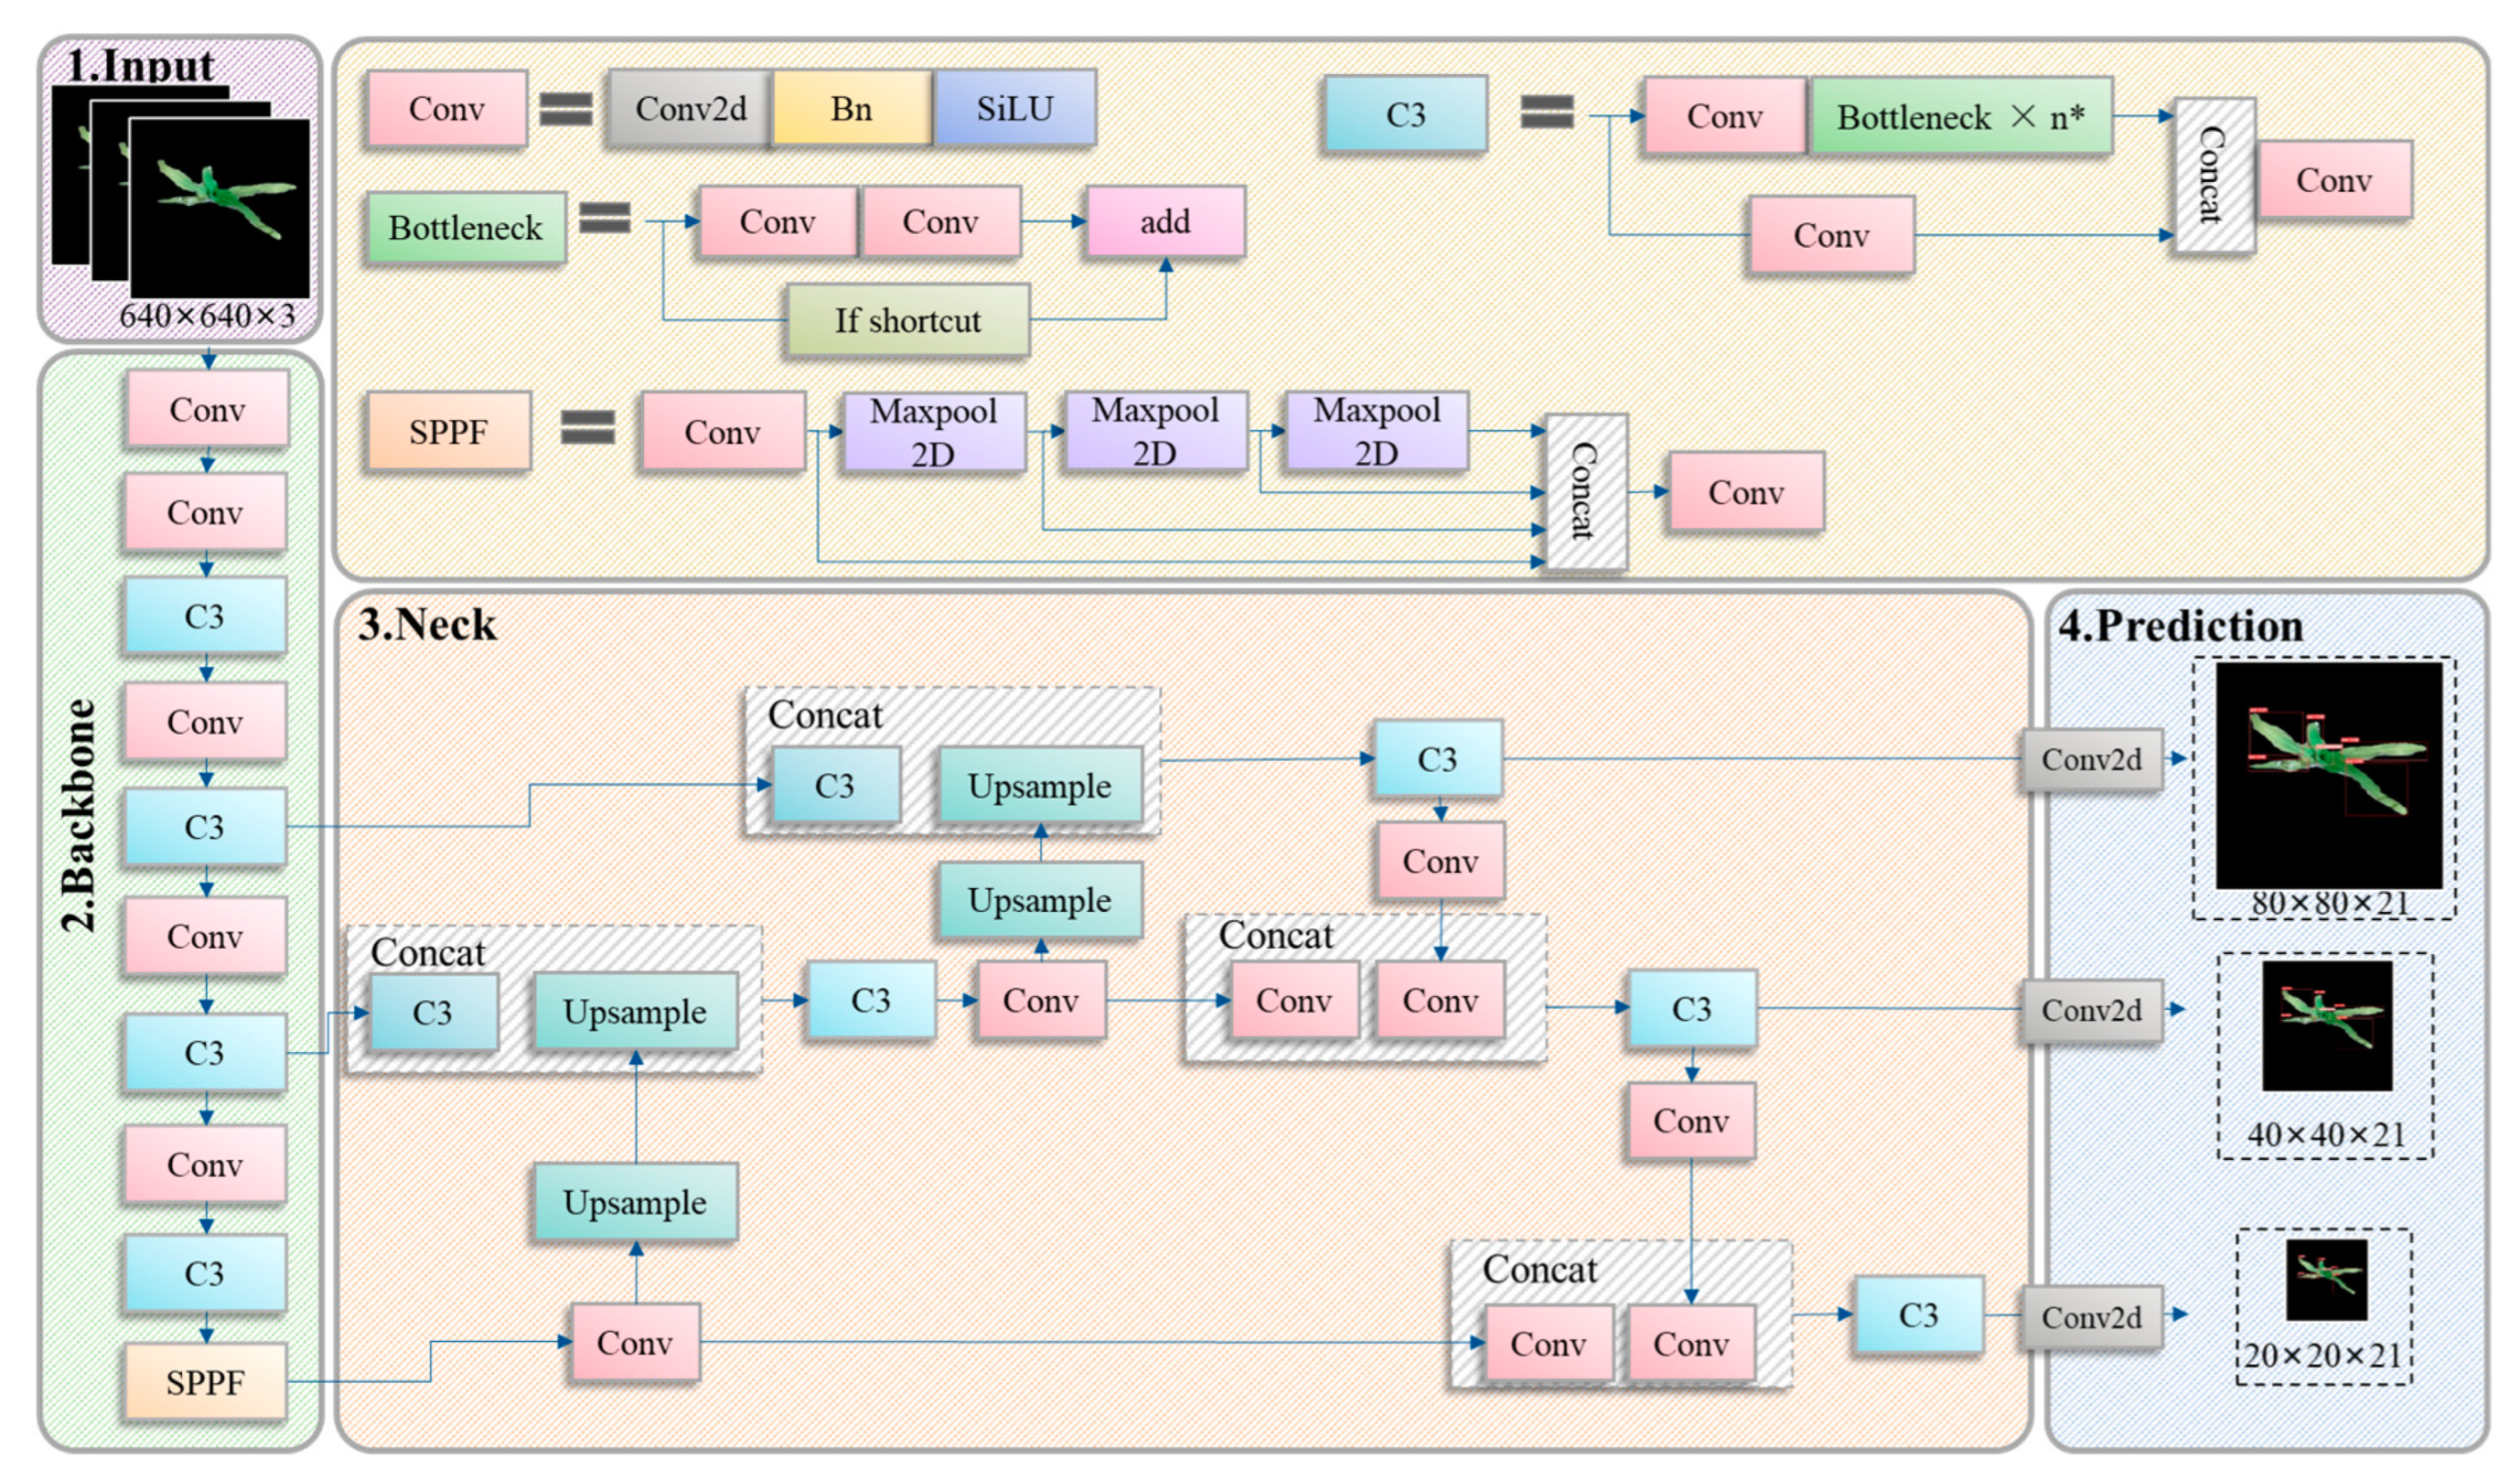
The YOLOv5 model is the latest version of the YOLO series with fast training speed, high detection accuracy, and small model weight file [52]. The YOLOv5 model was used here to train the detection model of the maize leaves, and the network structure is shown in Figure 4. The network structure consists of four parts: the input layer (Input), backbone network (Backbone), neck network (Neck), and prediction network (Prediction). Input includes Mosaic data enhancement, image size processing, and adaptive anchor box calculation. Backbone is composed of the Conv module, C3 module, and SPPF module. The FPN structure is used in the Neck network to fuse high- and low-layer features, which can improve the effect of object detection with different sizes. Prediction receives three feature maps of different sizes, 80 × 80 × 21, 40 × 40 × 21, and 20 × 20 × 21. Candidate boxes are generated on three feature maps with varying scales. Target classification and border regression are then output.

2.5. Parameter Setting for Training

The main hardware configurations of the experimental platform of the two models are: Intel (R) Xeon (R) Gold 6246R CPU with 3.4 GHz and 128 GB RAM; NVIDIA Quadro RTX 8000GPU with 48 GB video memory. The operating environment is Windows 10. Python 3.7 was used with the Pytorch1.7.1 deep learning framework and OpenCV4.5.1 computer vision library. The trained weight file on the ImageNet dataset was used as a pre-trained weight for the Mask R-CNN with the transfer learning idea, which greatly shortened the training time. The trained weight file on the COCO dataset was used as the pre-training weights for the YOLOv5 network, and the training process of the labeled leaf dataset was continued. The training parameters settings of the two models are shown in Table 1.

2.6. Evaluation Metrics

The performance of YOLOv5 was evaluated using Precision (P), Recall (R), Average Precision (AP), and Mean Average Precision (mAP), and the equations are shown in (5)~(8). The AP value is the area enclosed by the P-R curve and the coordinate axis. MAP is the average value of AP for each classification. Generally, the higher the mAP value, the better the model performance. The MAP at different intersections over Union (IOUs) thresholds (0.5, 0.75, and 0.5:0.95) was selected to evaluate the performance of Mask R-CNN, as shown in Equations (8) and (9).
P = T P T P + F P
R = T P T P + F N
A P = 0 1 P R d r
m A P = i = 1 N A P i N
I o U = A r e a   o f   O v e r l a p A r e a   o f   U n i o n
where T P is true positive, i.e., correctly predicted the number of pixels or leaves for maize seedings; F P is false positive, i.e., the background is predicted as the number of pixels of maize seedlings or the number of recognition errors of maize seedlings and leaf classes; F N is false negative, i.e., the pixel number of non-segmented maize seedlings or the number of non-detected leaves of maize seedling; N represents the number of classes of maize leaves and maize seedings; A P i represents the average precision value of the i classifications of leaves and maize seedings.

3. Results

3.1. Instance Segmentation Results of Maize Seedlings

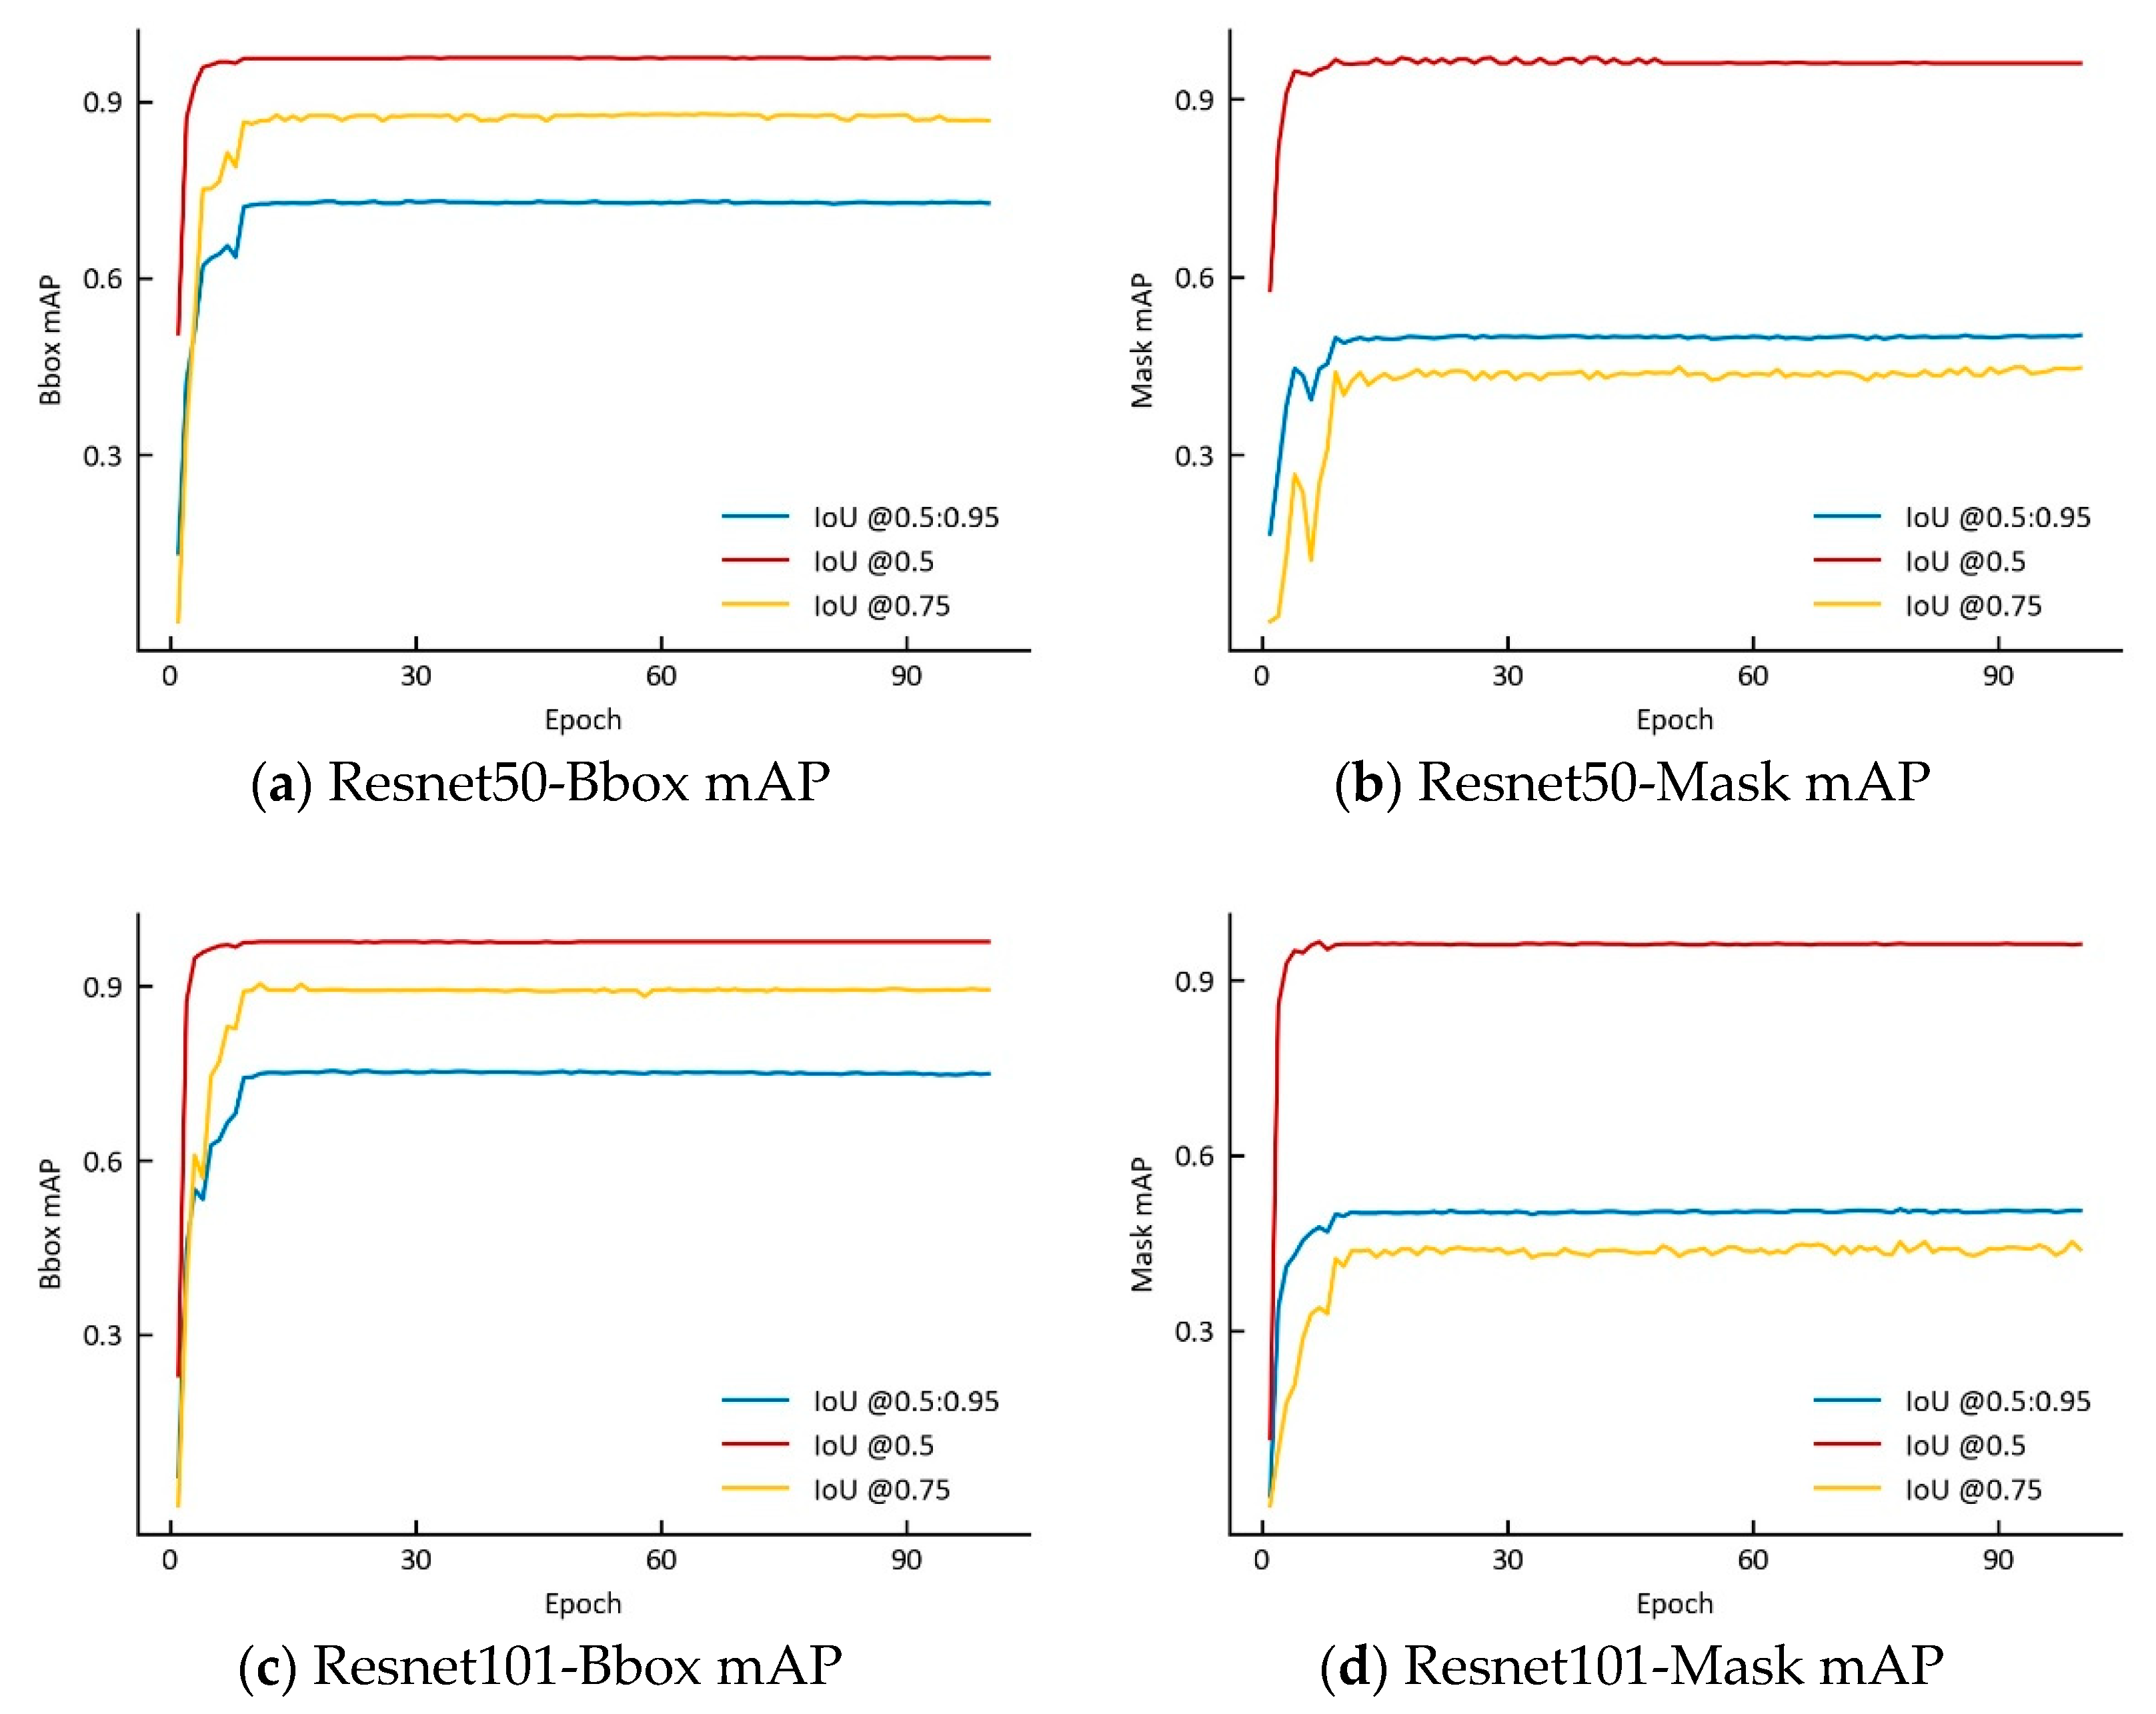
The detection and segmentation performances of the different models on different IoUs (Intersections over Union) are shown in Figure 5 when the loss function was SmoothLR. The Bounding box AP (Bbox AP) and Mask AP of Mask R-CNN gradually improved and tended to be stable with the increase in epoch. The performance of Mask R-CNN with different backbone networks and loss functions was tested on the test set, and the results are shown in Table 2. When the IoU threshold was 0.5, the detection and segmentation results of the Bbox AP and Mask AP of the two models were best. When the loss function was SmoothLR, the segmentation performance and inference times of Mask R-CNN with Resnet50 and Resnet101 as backbone networks were higher than those with L1, and the Bbox AP and Mask AP of Mask R-CNN with Resnet50 were higher compared with those with Resnet101. The average detection and segmentation times of Mask R-CNN with Resnet101 were 0.05 s and 0.08 s for each image, while the values were 0.05 s and 0.07 s, respectively, for each image with Resnet50. The Bbox AP and Mask AP of Mask R-CNN with Resnet50 were 96.9% and 95.2%, respectively, in SmoothLR.
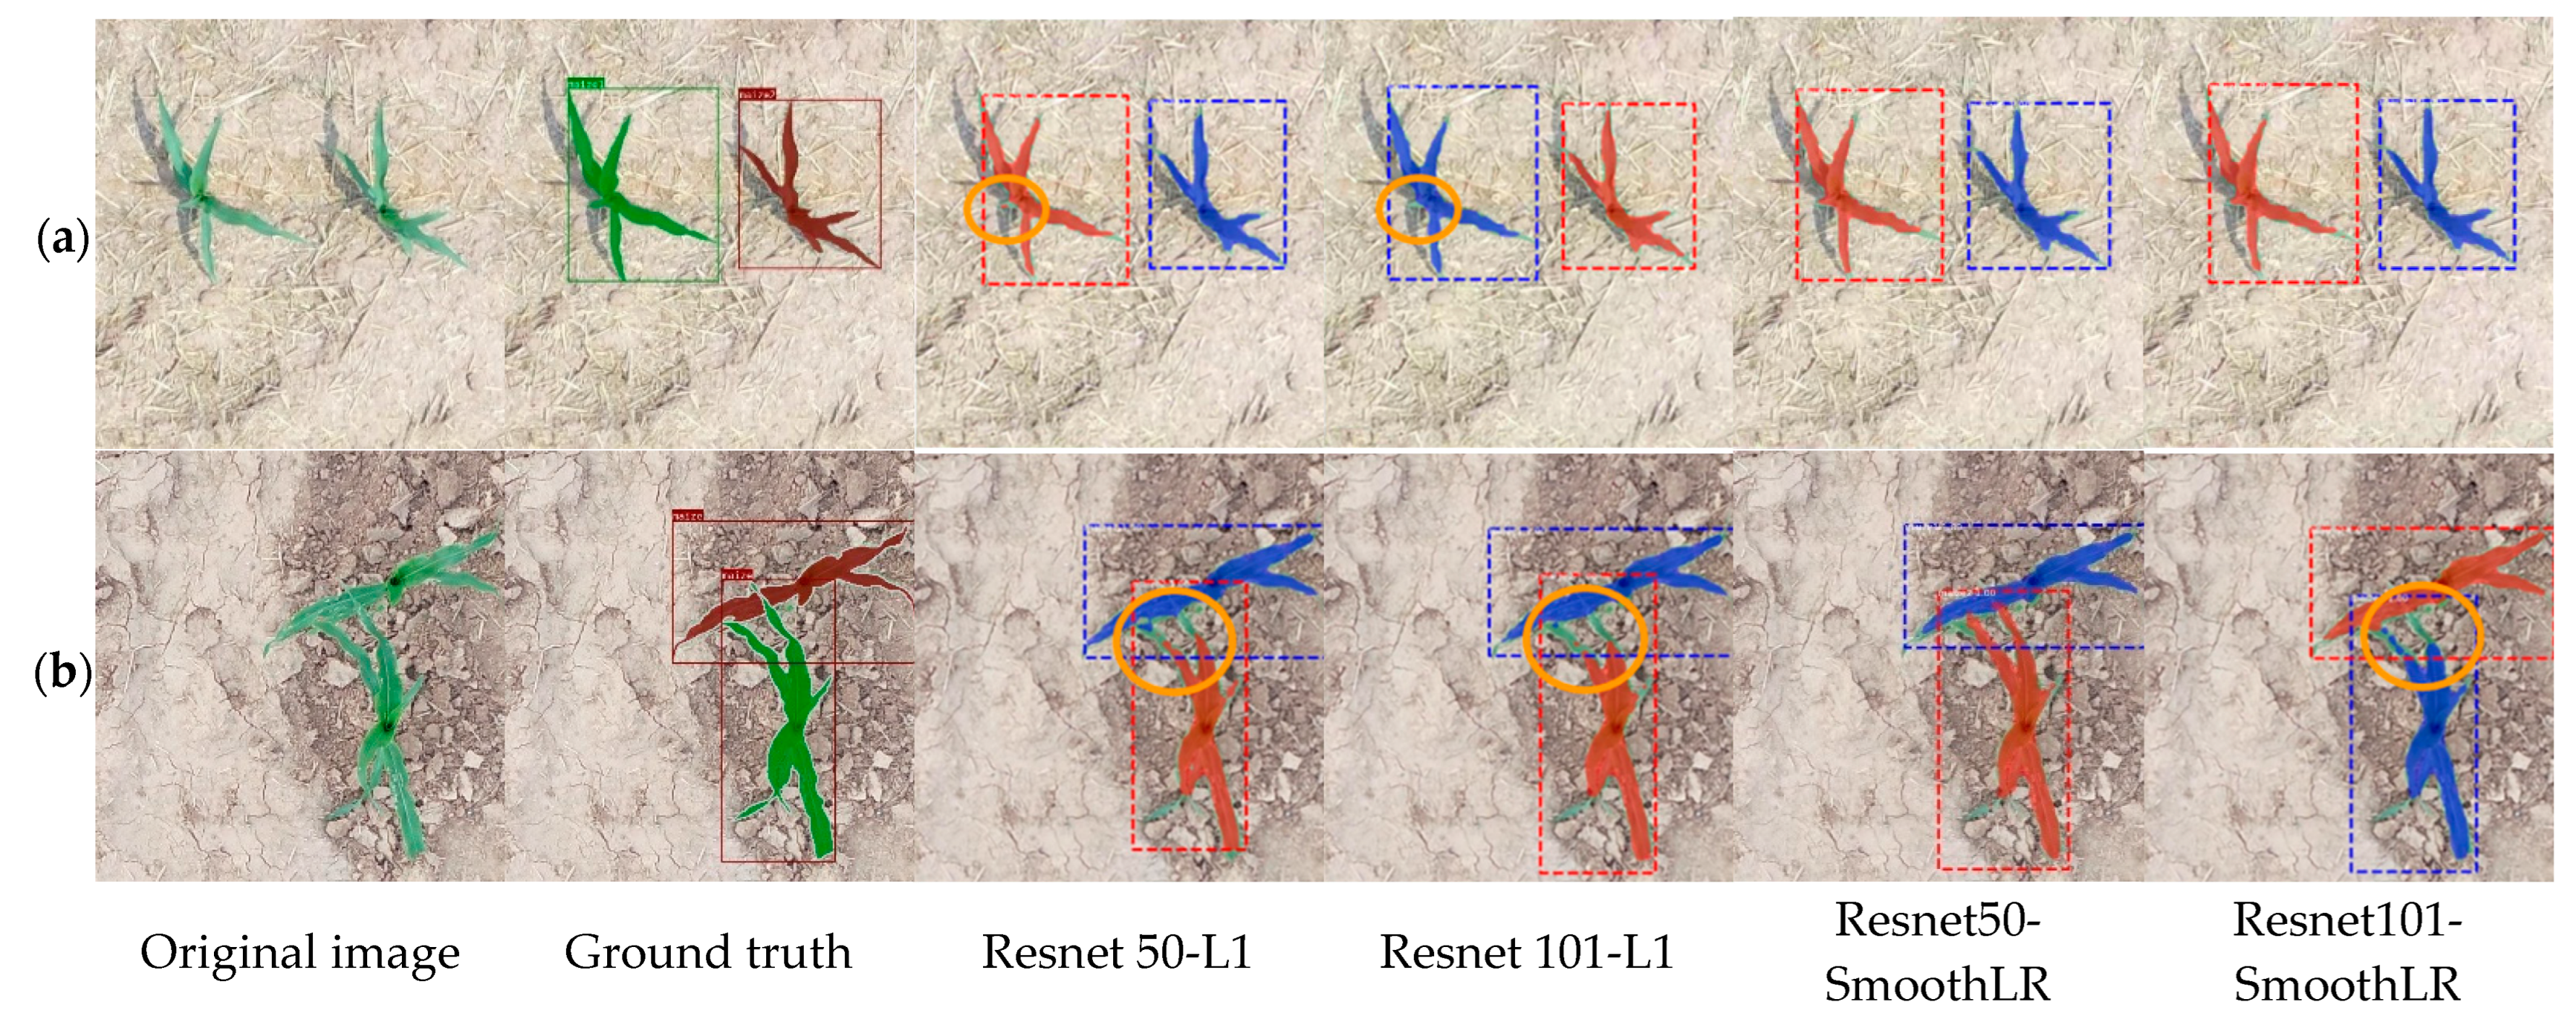
The results of Mask R-CNN with different backbone networks and loss functions for test set images of maize seedling are shown in Figure 6. The contour of the maize seedlings was segmented more completely when the loss function was SmoothLR (Figure 6a). Resnet50 had good segmentation for the overlapping leaf region compared with Resnet101 in SmoothLR (Figure 6b). In summary, the Mask R-CNN model with SmoothLR can better extract the complete maize seedling mask information and effectively reduce the influence of a complex background, compared with the Mask R-CNN model in L1. Therefore, Mask R-CNN with Resnet50 and SmoothLR was selected as the optimal instance segmentation model in this study.

3.2. Object Detection of Maize Leaves with Different Model

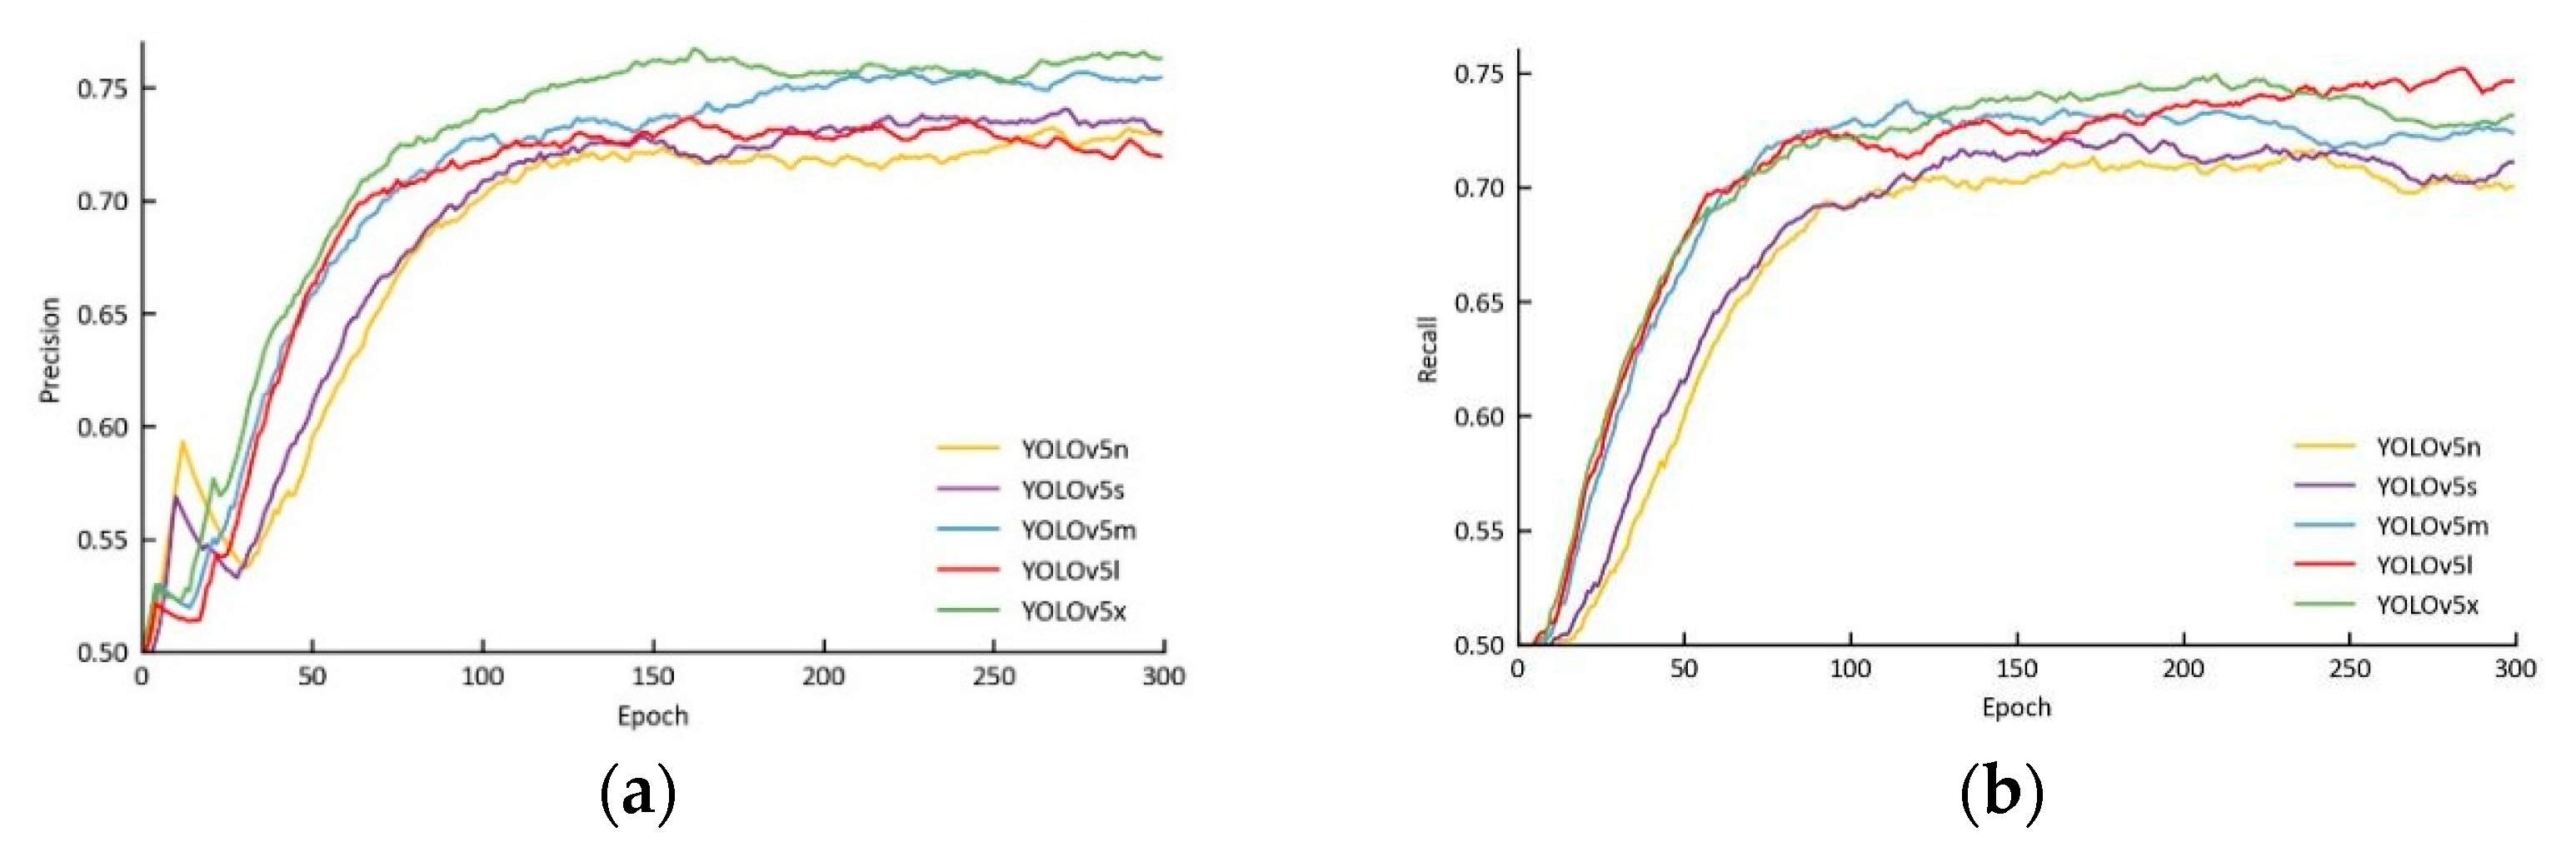
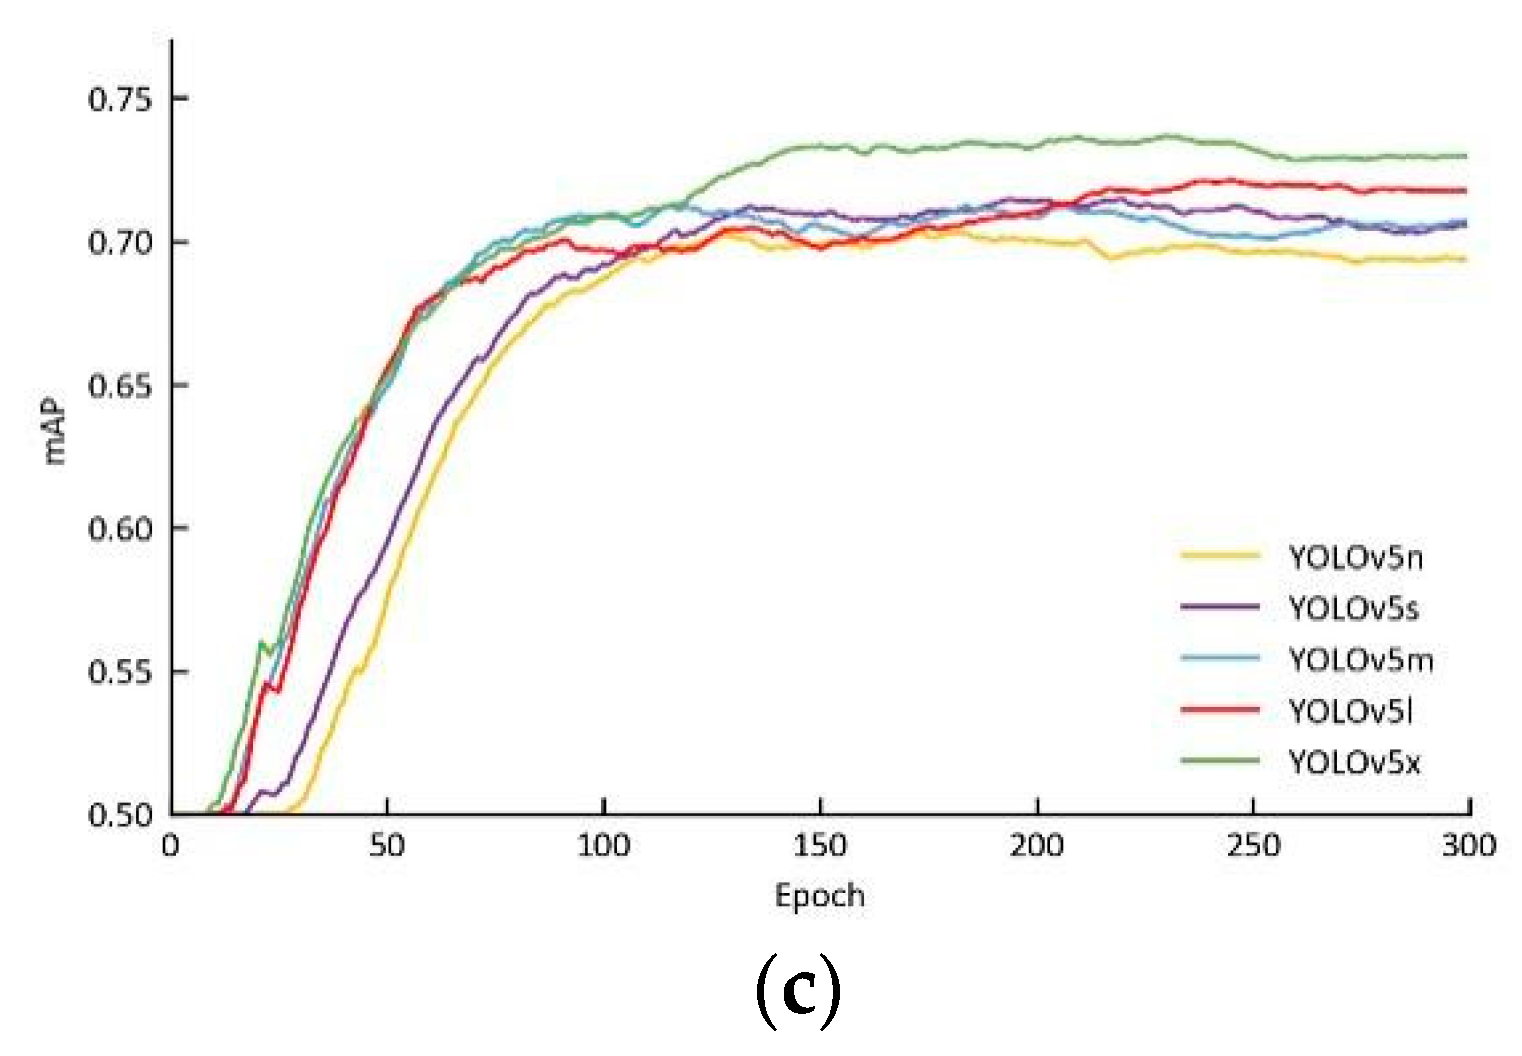
YOLOv5 can be divided into five versions according to different parameter quantities: YOLOv5n, YOLOv5s, YOLOv5m, YOLOv5l, and YOLOv5x. These five networks were compared here with the same training parameters and dataset. The dataset in this stage was the segmented maize seedlings images processed after Mask R-CNN. The variation curves of precision, recall, and mAP with increasing epochs are shown in Figure 7 for the five network models during the training process. The green curve of the YOLOv5x model had higher precision and mAP values after epoch = 150, and the red curve of the YOLOv5l model had a higher recall than the YOLOv5x model after epoch 250. Overall, the performances of YOLOv5l, YOLOv5m, and YOLOv5X were better, and YOLOv5n was worst. The detection performance of the models on the test set is shown in Table 3. Generally, the recall, precision, and AP values of the fully unfolded leaves were higher than those of the newly appeared leaves. Among them, the precision rate of the YOLOv5x model in the newly appeared leaves and fully unfolded leaves were 92.0% and 68.8%, respectively, both of which were higher than those of the other models. However, the recall rate and AP value of the YOLOv5l model in detecting newly appeared leaves and fully unfolded leaves were slightly higher than those of YOLOv5x. On the whole, the comprehensive performance of YOLOv5x was better.
Table 4 shows the maize leaf detection performance of YOLOv5x, Faster R-CNN, and SSD under the same experimental parameter settings and datasets. The performance of the three models in detecting fully unfolded leaves was higher than that of newly appeared leaves. The recall and AP of YOLOv5x were higher than those of Faster R-CNN and SSD, but the precision was slightly lower than that of SSD. Combined with Table 3, it was found that the detection performance of the YOLOv5 model was better than those of Faster R-CNN and SSD.
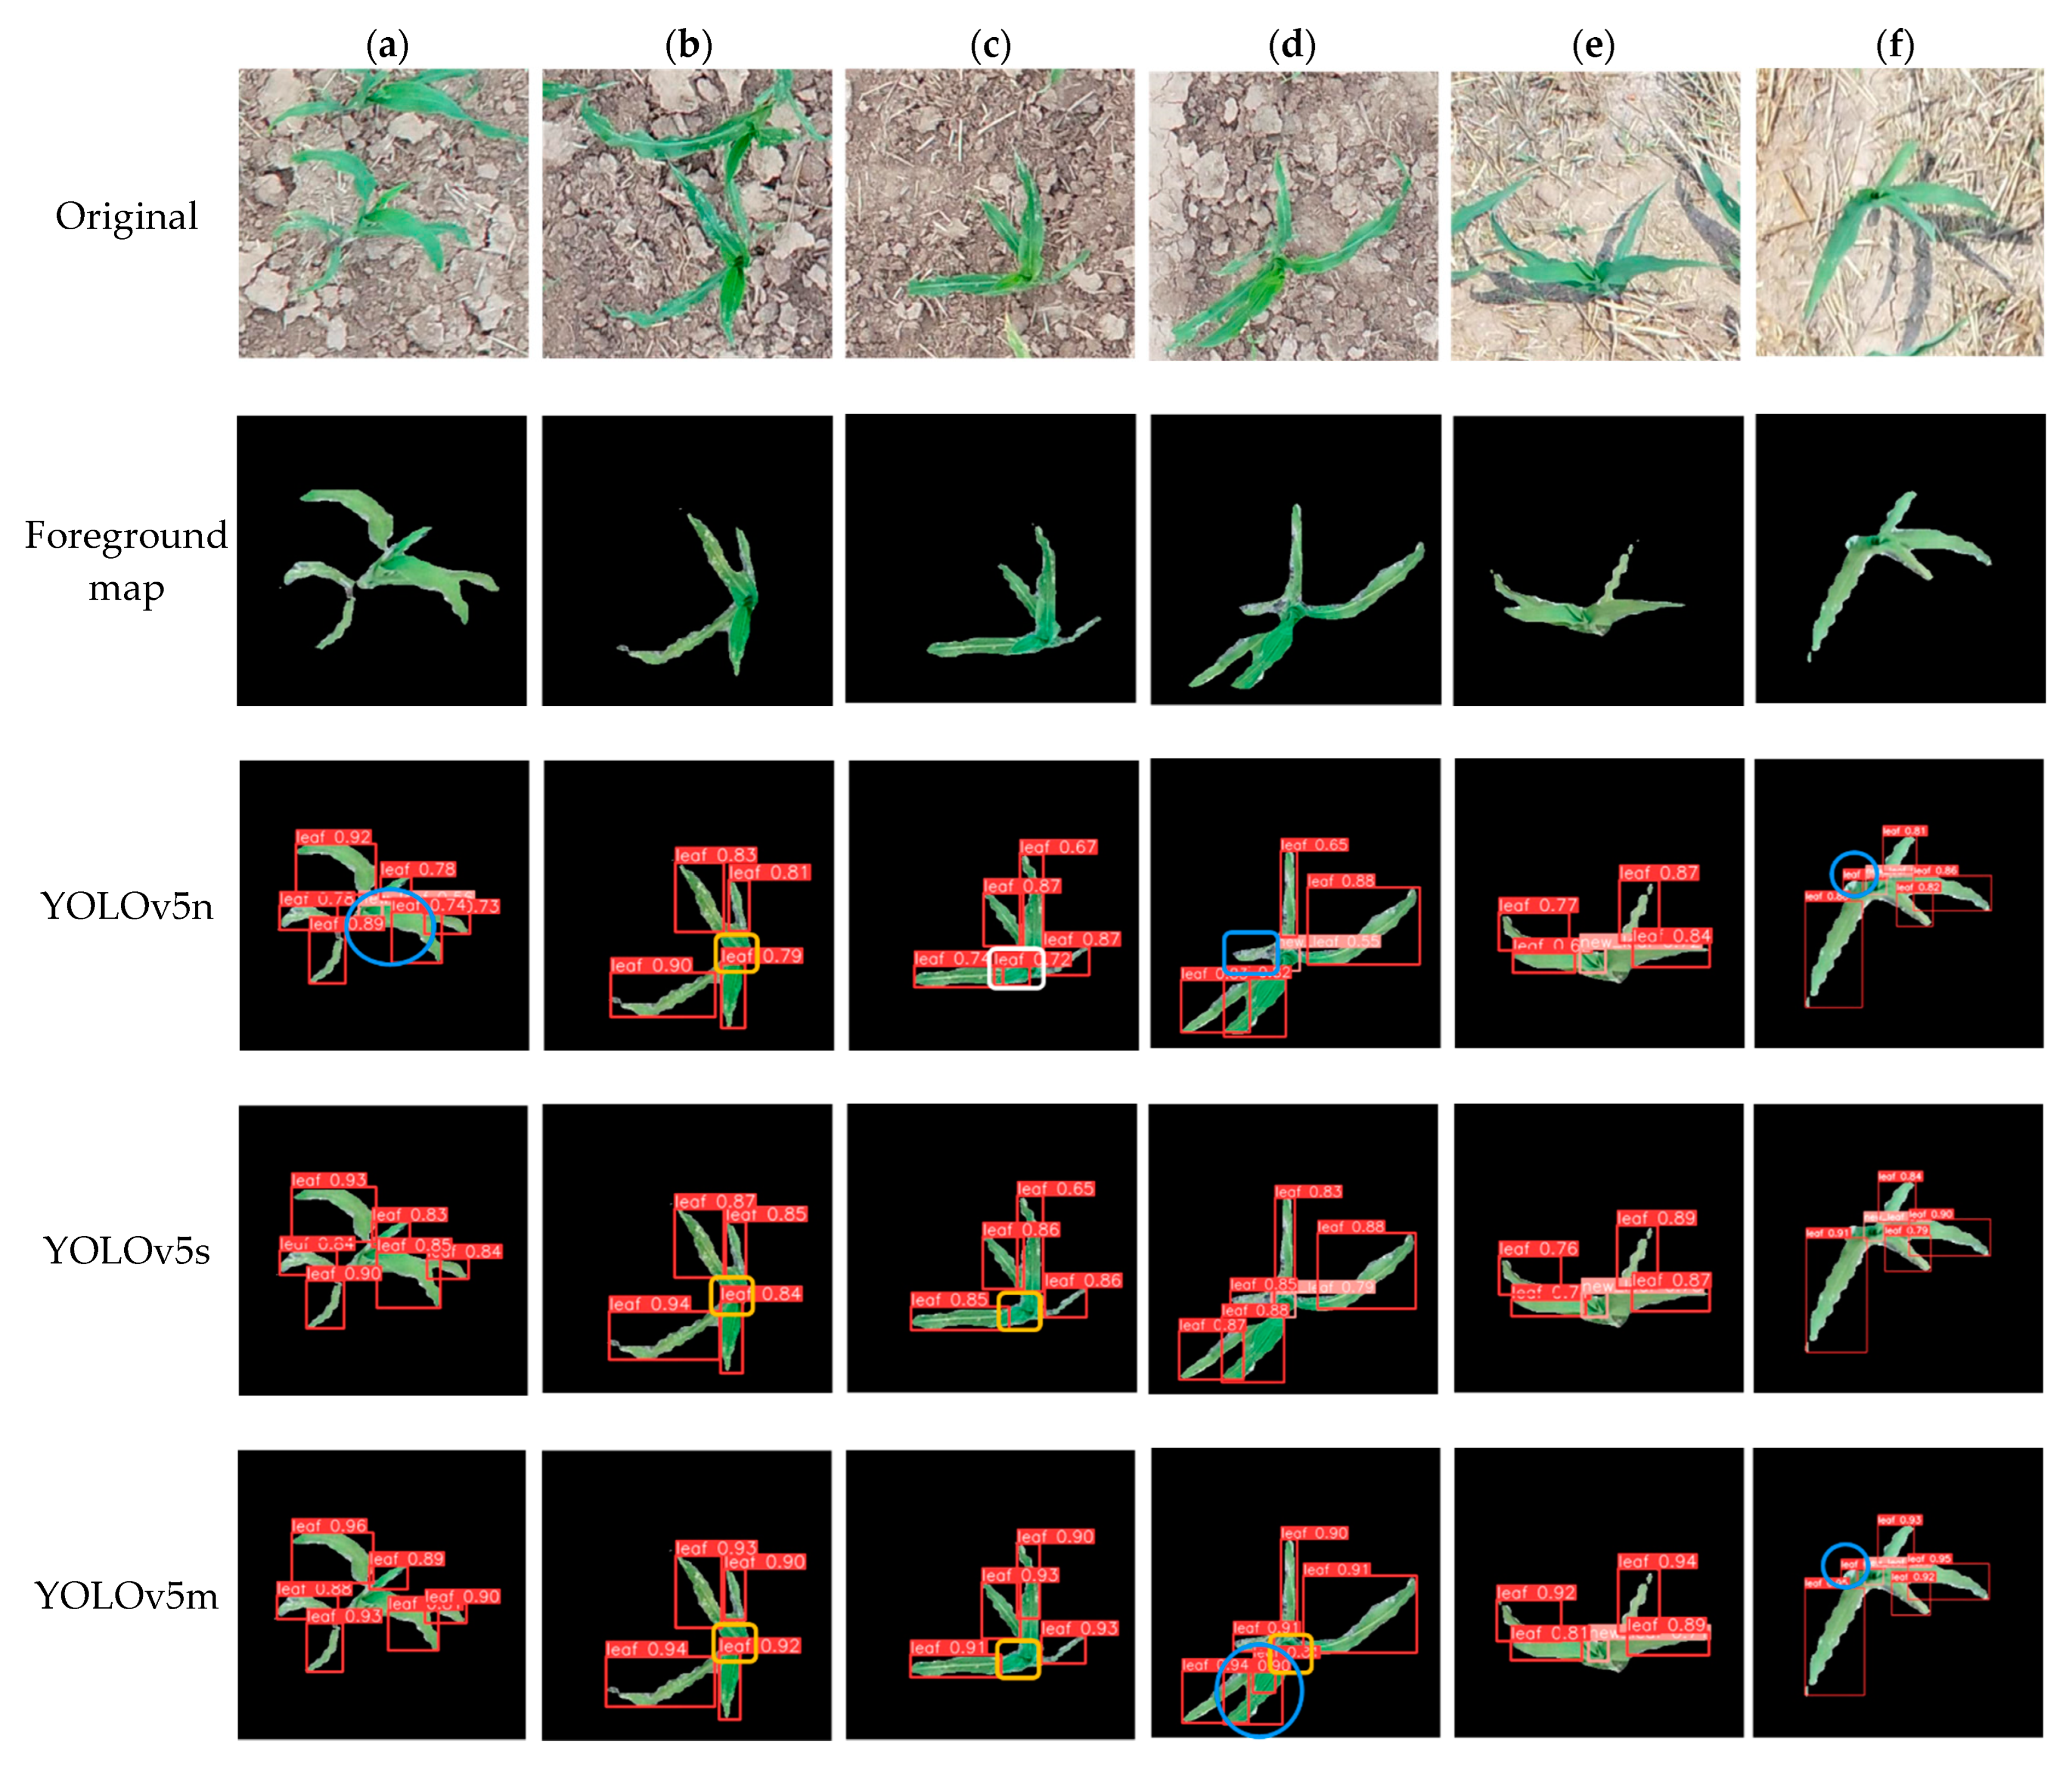
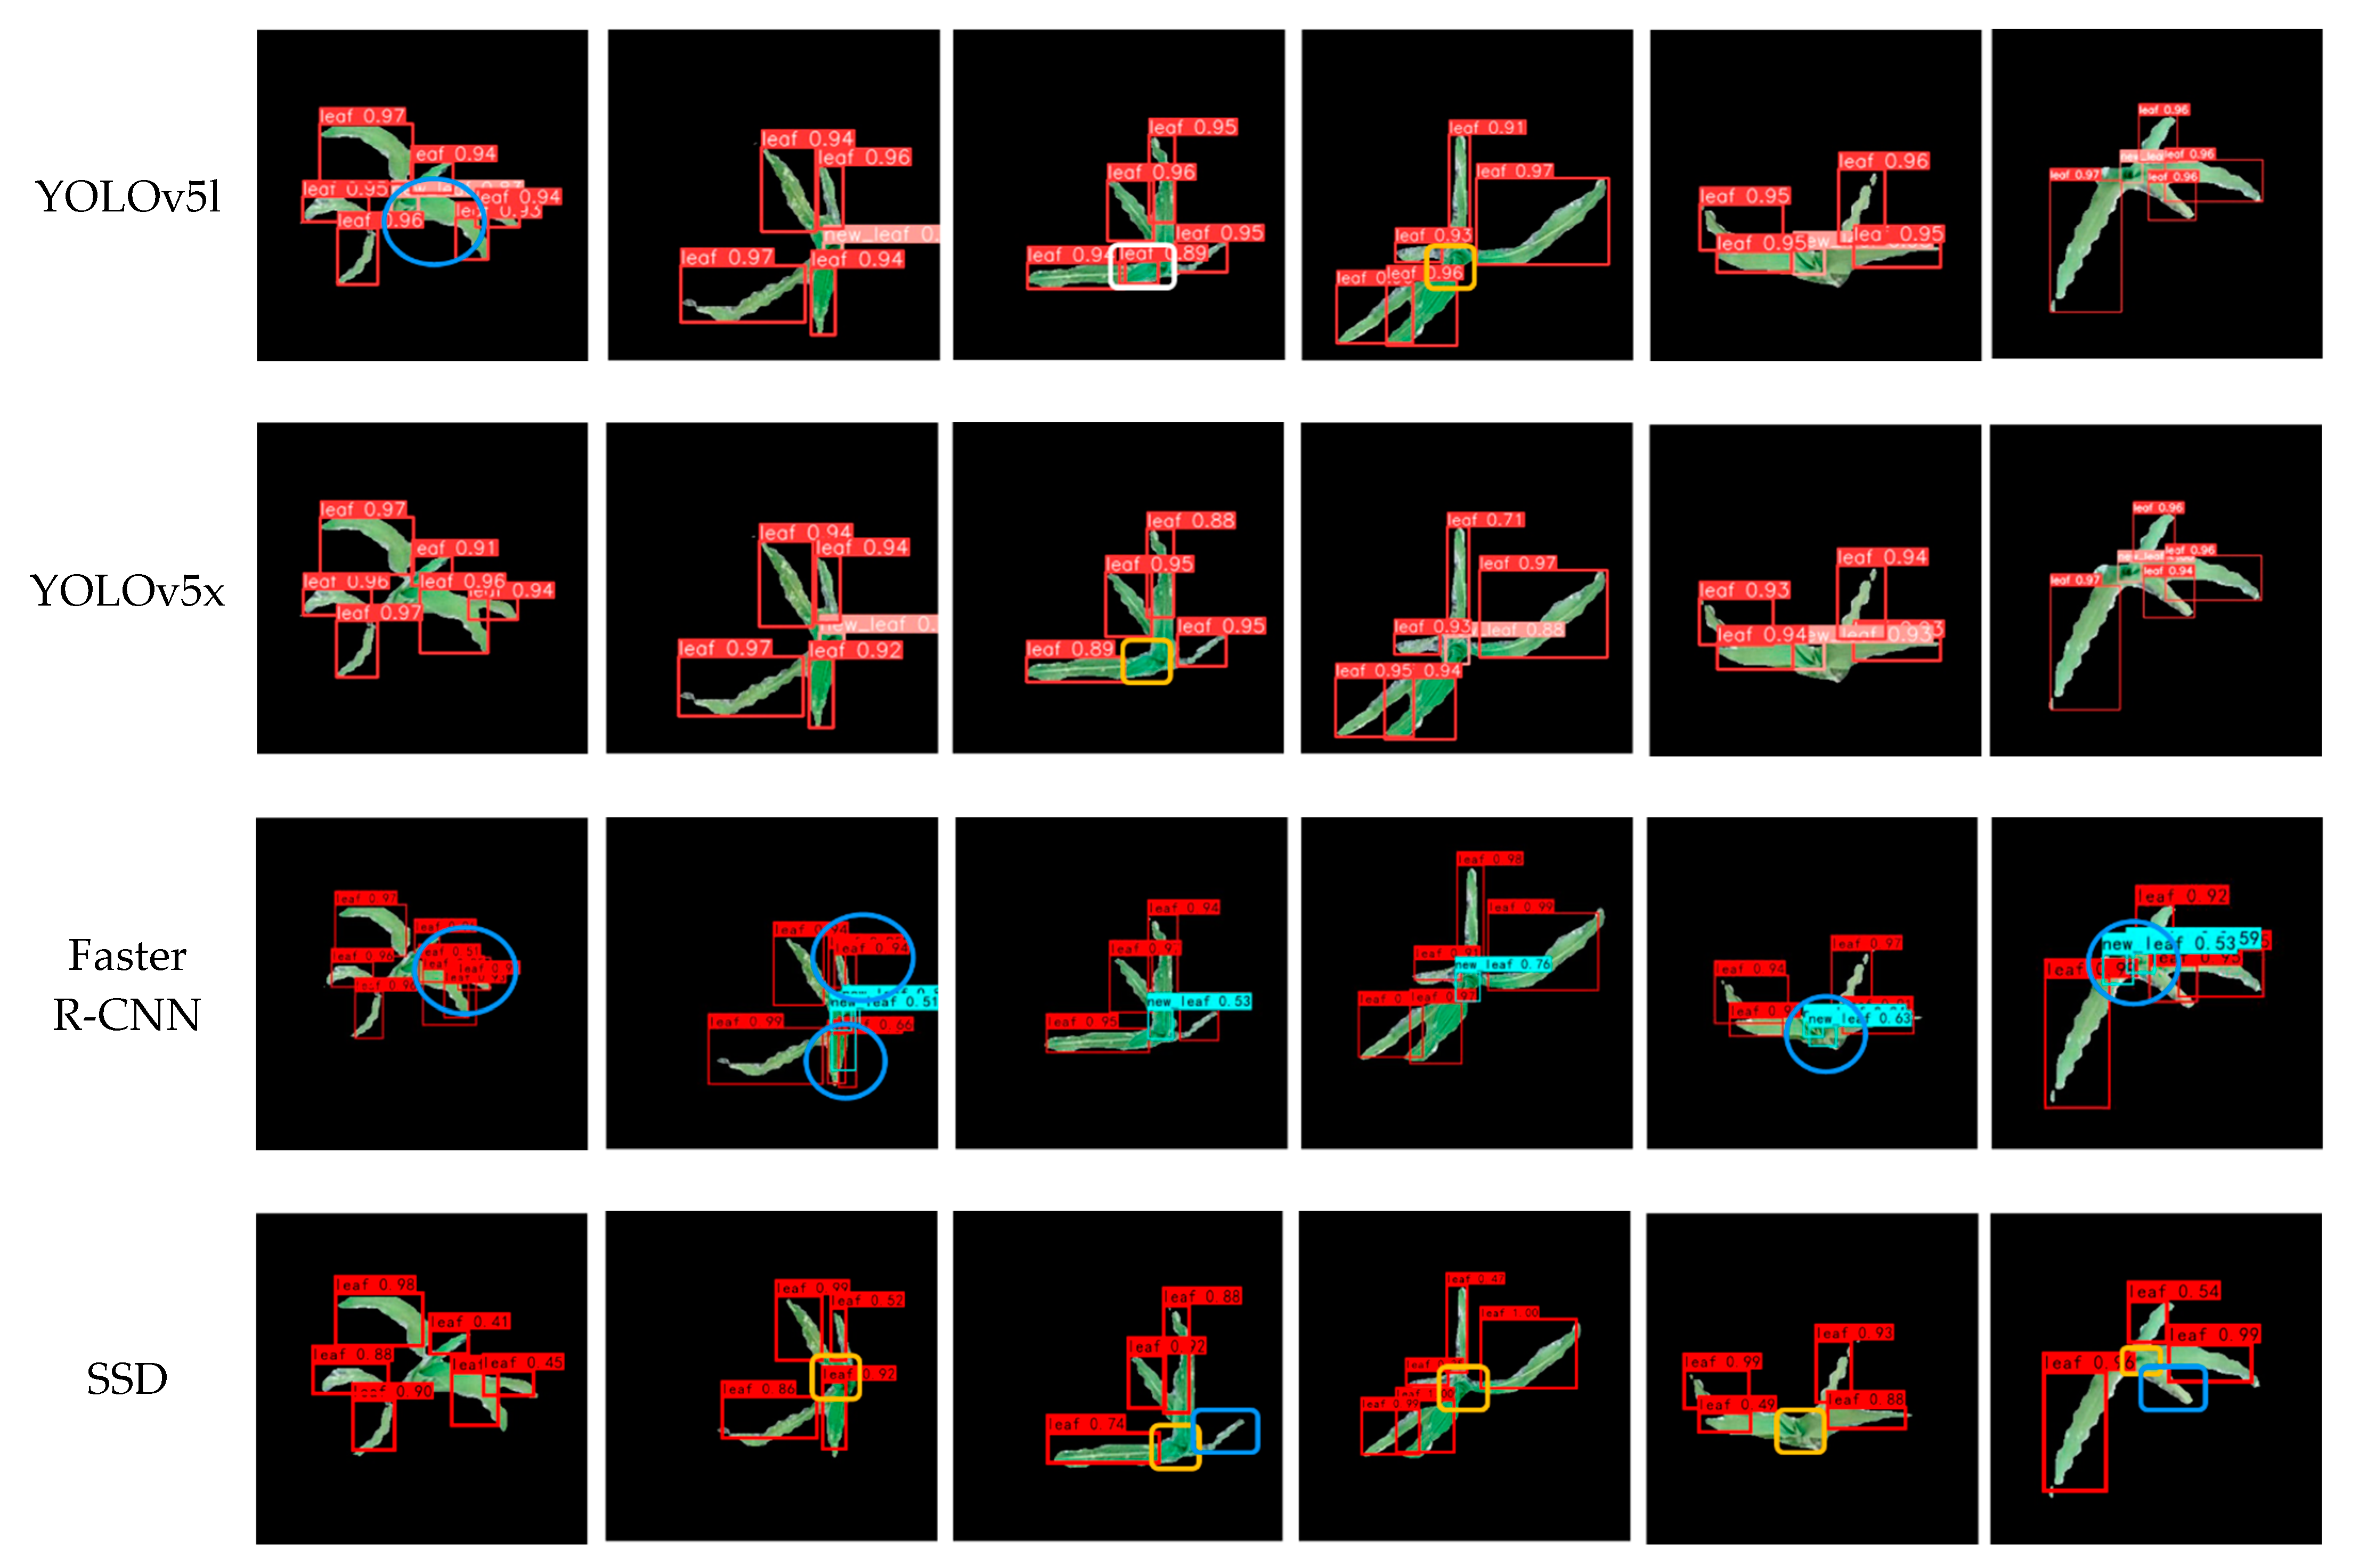
The effect of different object detection models on the detection of maize leaves on the test set is shown in Figure 8. Both YOLOv5n and YOLOv5l misjudged the curled part of the leaf as a newly appeared leaf in the lower right corner within the blue circle (Figure 8a). Missing inspection of newly appeared leaves (yellow color of rectangle) was all found in YOLOv5n, YOLOv5s, and YOLOv5m, probably because the features of the newly appeared leaves were not obvious. Due to the serious overlapping of newly appeared leaves and fully unfolded leaves (Figure 8c), all the above models had poor results in detecting newly appeared leaves, among which YOLOv5n and YOLOv5l had a false detection, mistakenly detecting newly appeared leaves in the white rectangle box as fully unfolded leaves. Faster R-CNN could detect newly appeared leaves, but it always detected leaves repeatedly (Figure 8e,f). Among all models, SSD had the worst ability to detect newly appeared leaves. In contrast, the other three models missed detecting newly appeared leaves in the yellow rectangle box. YOLOv5n, YOLOv5s, and YOLOv5x could accurately identify newly appeared leaves, but YOLOv5n did not detect the fully unfolded leaves on the right side of the image in Figure 8d, probably because the segmented leaves with partial soil background were similar to the maize stems. When the leaves in the image were clear and the newly appeared leaf features were obvious, the leaves could be recognized with the above five models. When the overlapping of leaves was serious or the characteristics of newly appeared leaves were not obvious, the YOLOv5x model could basically detect the fully unfolded leaves and newly appeared leaves in the image accurately, but the other four models showed poor performance.

3.3. Counting Results of Maize Leaves

The original 101 test set images were detected and segmented by the Mask R-CNN to obtain a total of 170 single maize seedling images. The newly appeared leaf count result of each maize seedling was the number of detection boxes of newly appeared leaf, and the count result of fully unfolded leaves was the sum of the number of detection boxes of fully unfolded leaves. The leaf count of the plant was correct when the difference was “0”. Table 5 shows the distribution of the difference between the actual value of leaf counts and the predicted value of fully unfolded leaves in the test set image. When the difference was “−2” and “−1”, it meant the predicted number of leaves was larger than the actual number of leaves. Values of “1” and “2” indicated that the fully unfolded leaf was missed. YOLOv5x and YOLOv5l had the best counting effect, with a counting accuracy of 72.9%, which was 6.4%, 4.1%, and 4.7% higher than those of YOLOv5n, YOLOv5s, and YOLOv5m, respectively.
Table 6 shows the distribution of the difference between the actual value of leaf counts and the predicted value of newly appeared leaves. When the difference was “−1”, it meant that the model predicted one more newly appeared leaf, or a fully unfolded leaf may be mistakenly detected as a newly appeared leaf. The difference was “1”, which meant that the newly appeared leaf was missed. Among them, the accuracy of newly appeared leaf counting of YOLOv5x and YOLOv5m was 75.3%, which was 5.3%, 7.7%, and 1.8% higher than those of YOLOv5n, YOLOv5s, and YOLOv5l, respectively. Overall, the YOLOv5x model outperformed the other models in both newly appeared leaf and fully unfolded leaf counts.

4. Discussion

A complete individual seedling is the premise for accurate leaf age diagnosis. Adjacent maize seedlings may have overlapping leaves in the field. Therefore, it is necessary to accurately separate the individual maize seedlings during the segmentation process. Instance segmentation can assign semantic labels and instance IDs to all pixels [53,54,55], and can recognize individual maize seedlings with overlapping leaves. As the segmentation effect of the maize seedling in the first stage directly affected the subsequent leaf counting, the Mask R-CNN was chosen with better segmentation performance. The detection and segmentation performance of Mask R-CNN with Resnet50 was better than that with Resnet101 (Table 2 and Figure 6). Moreover, for crossed maize seedlings, Mask R-CNN with Resnet50 can better obtain the target mask with more complete segmented pixels. The results agree well with the other research [56,57]. The reason may be that the deeper ResNet101 backbone increases the difficulty of training with the increase in network complexity. The new loss function SmoothLR proposed in this paper improved the segmentation performance of the model, which is consistent with Liu et al. [58]. The Mask R-CNN model met quite well with the requirements of seedling segmentation in the current study, but a long time was required in both the training and testing stages [59]. Therefore, the lightweight instance segmentation model can be improved in the future to reduce the training and testing time of the model under the premise of ensuring the segmentation accuracy.
The phenotypic characteristics of newly appeared leaves and fully unfolded leaves of maize seedlings were quite different. The characteristics of newly appeared leaves were more chaotic and easier to interfere with the model. Therefore, the leaves were divided into fully unfolded leaves and newly appeared leaves. The YOLOv5 network was selected in the leaf detection stage. The foreground images of individual maize seedlings segmented by Mask R-CNN in the first stage were used as the leaf detection data source. The five YOLOv5 models with different parameters were compared (Table 3). The precision of the YOLOv5x model was higher than those of other models for detection of newly appeared leaves and fully unfolded leaves. This result is consistent with Junior et al. [60] and Chen et al. [61]. However, the recall rate and AP value of the YOLOv5l model were higher than those of YOLOv5x. The reason may be that YOLOv5l mistakenly detected newly appeared leaves as fully unfolded leaves. Apart from this, combined with the analysis in Figure 8, the YOLOv5l model also had multiple inspections. Moreover, YOLOv5x had the best comprehensive counting performance in the subsequent counting of newly appeared leaves and fully unfolded leaves of individual maize seedlings. The detection performance of YOLOv5x was also higher than those of Faster R-CNN and SSD (Table 4). Therefore, the YOLOv5x model was finally selected as the network model for the second-stage leaf counting work in this study.
To further explore the feature extraction capabilities of different networks, the graphs of the final feature extraction result for the five YOLOv5 networks are visualized in Figure 9. Five fully unfolded leaves and one newly appeared leaf were in the original image. The most obvious feature of these six leaves was the feature map of the YOLOv5x model. The leaf features were the least obvious in YOLOv5n and YOLOv5s. In summary, compared with the other models, YOLOv5x, with the largest number of parameters, could learn more leaf features and was more suitable for individual leaf detection. Two deep learning models were applied in the current process, which required mask labeling of maize seedlings and bounding box labeling of leaves. The task of dataset labeling was large in the early stage. In the future, the teacher–student model in the semi-supervised strategy will be used [62,63] to train the teacher model with a small number of labeled datasets to predict pseudo-labels, and then to apply the student model to train all datasets.

5. Conclusions

A method of the maize leaf detection model was proposed based on deep learning. The process of the method consisted of two stages. The instance segmentation model was used in the first stage to extract complete maize seedlings by removing the complex background in the field, and provided data support for the next step of leaf detection. In the second stage, the object detection model was used to detect and count the leaves of the maize seedling with the images processed in the first stage. The main conclusions are as follows:
(1) To reduce the influence of weeds and soil background on maize leaf detection, the Mask R-CNN was used to segment the maize seedling images from the complex images captured by the UAV. A new loss function SmoothLR was proposed to improve the segmentation performance of the model. The test results showed that the detection and segmentation performance of the Mask R-CNN with SmoothLR was higher than that of the Mask R-CNN with L1 Loss. When the IoU was 0.5, the Bbox mAP of the Mask R-CNN with Resnet50 and SmoothLR was 96.9%, and the Mask mAP was 95.2%. The inference times for image detection boxes and masks were 0.05s and 0.07s, respectively.
(2) The YOLOv5 model was used to detect the maize seedling leaves obtained after segmentation, and five YOLOv5 networks were compared with different parameters. Faster R-CNN and SSD were also compared with YOLOv5 networks. The test results showed that the comprehensive performance of YOLOv5x in leaf detection and counting was better than those with the other models. The detection precisions of fully unfolded leaves and newly appeared leaves were 92% and 68.8%, the recall rates were 84.4% and 50%, and the APs were 89.6% and 54%, respectively. The counting accuracy rates of newly appeared leaves and fully unfolded leaves were 75.3% and 72.9%, respectively.
The results showed that the method is effective and opens a new way for maize leaf counting with the UAV images. In the future, datasets will be expanded, and the model structure will be improved to achieve better detection performance of maize leaves.

Author Contributions

Conceptualization, X.X., Y.M. and J.Z.; methodology, X.X., Y.M. and J.Z.; software, L.W. and X.L.; validation, L.W., X.L. and Y.L.; formal analysis, M.S.; investigation, L.W. and M.S.; resources, M.S.; writing—original draft preparation, L.W.; writing—review and editing, Y.M., M.S., A.Z.G. and J.Z.; visualization, L.W. and X.L.; supervision, J.Z.; project administration, Y.M.; funding acquisition, X.X. All authors have read and agreed to the published version of the manuscript.

Funding

This research was funded by the Key Technologies Research and Development Program of China (grant number 2021YFD2000103), the Beijing Digital Agriculture Innovation Consortium Project (grant number BAIC10-2022), the Inner Mongolia Science and technology project (grant number 2019ZD024), and the Science and technology development plan project of Jilin Province (grant numbers YDZJ202201ZYTS544 and 20200403176SF).

Data Availability Statement

Not applicable.

Acknowledgments

The authors would like to acknowledge the anonymous reviewers for valuable comments and members of the editorial team for proof carefully.

Conflicts of Interest

The authors declare no conflict of interest.

References

  1. Chen, F.Q.; Ji, X.Z.; Bai, M.X.; Zhuang, Z.L.; Peng, Y.L. Network Analysis of Different Exogenous Hormones on the Regulation of Deep Sowing Tolerance in Maize Seedlings. Front. Plant Sci. 2021, 12, 739101. [Google Scholar] [CrossRef] [PubMed]
  2. Fan, J.H.; Zhou, J.; Wang, B.W.; de Leon, N.; Kaeppler, S.M.; Lima, D.C.; Zhang, Z. Estimation of Maize Yield and Flowering Time Using Multi-Temporal UAV-Based Hyperspectral Data. Remote Sens. 2022, 14, 3052. [Google Scholar] [CrossRef]
  3. Chen, S.; Liu, W.H.; Feng, P.Y.; Ye, T.; Ma, Y.C.; Zhang, Z. Improving Spatial Disaggregation of Crop Yield by Incorporating Machine Learning with Multisource Data: A Case Study of Chinese Maize Yield. Remote Sens. 2022, 14, 2340. [Google Scholar] [CrossRef]
  4. Zermas, D.; Morellas, V.; Mulla, D.; Papanikolopoulos, N. 3D model processing for high throughput phenotype extraction—The case of corn. Comput. Electron. Agric. 2020, 172, 105047. [Google Scholar] [CrossRef]
  5. Li, Z.B.; Guo, R.H.; Li, M.; Chen, Y.R.; Li, G.Y. A review of computer vision technologies for plant phenotyping. Comput. Electron. Agric. 2020, 176, 105672. [Google Scholar] [CrossRef]
  6. Rabab, S.; Badenhorst, P.; Chen, Y.P.; Daetwyler, H.D. A template-free machine vision-based crop row detection algorithm. Precis. Agric. 2021, 22, 124–153. [Google Scholar] [CrossRef]
  7. Roth, L.; Barendregt, C.; Bétrix, C.; Hund, A.; Walter, A. High-throughput field phenotyping of soybean: Spotting an ideotype. Remote Sens. Environ. 2022, 269, 112797. [Google Scholar] [CrossRef]
  8. Bouguettaya, A.; Zarzour, H.; Kechida, A.; Taberkit, A.M. Vehicle Detection From UAV Imagery with Deep Learning: A Review. IEEE Trans. Neural Netw. Learn. Syst. 2021, 1–21. [Google Scholar] [CrossRef] [PubMed]
  9. Ji, Y.S.; Chen, Z.; Cheng, Q.; Liu, R.; Li, M.W.; Yan, X.; Li, G.; Wang, D.; Fu, L.; Ma, Y.; et al. Estimation of plant height and yield based on UAV imagery in faba bean (Vicia faba L.). Plant Methods 2022, 18, 26. [Google Scholar] [CrossRef] [PubMed]
  10. Jiang, Z.; Tu, H.F.; Bai, B.W.; Yang, C.H.; Zhao, B.Q.; Guo, Z.Y.; Liu, Q.; Zhao, H.; Yang, W.N.; Xiong, L.Z.; et al. Combining UAV-RGB high-throughput field phenotyping and genome-wide association study to reveal genetic variation of rice germplasms in dynamic response to drought stress. New Phytol. 2021, 232, 440–455. [Google Scholar] [CrossRef] [PubMed]
  11. Li, L.L.; Qiao, J.W.; Yao, J.; Li, J.; Li, L. Automatic freezing-tolerant rapeseed material recognition using UAV images and deep learning. Plant Methods 2022, 18, 5. [Google Scholar] [CrossRef]
  12. Alzadjali, A.; Alali, M.H.; Veeranampalayam Sivakumar, A.N.; Deogun, J.S.; Scott, S.; Schnable, J.C.; Shi, Y. Maize Tassel Detection from UAV Imagery Using Deep Learning. Front. Robot. AI 2021, 8, 600410. [Google Scholar] [CrossRef] [PubMed]
  13. Barreto, A.; Lottes, P.; Ispizua Yamati, F.R.; Baumgarten, S.; Wolf, N.A.; Stachniss, C.; Mahlein, A.; Paulus, S. Automatic UAV-based counting of seedlings in sugar-beet field and extension to maize and strawberry. Comput. Electron. Agric. 2021, 191, 106493. [Google Scholar] [CrossRef]
  14. Liu, S.B.; Yin, D.M.; Feng, H.K.; Li, Z.H.; Xu, X.B.; Shi, L.; Jin, X.L. Estimating maize seedling number with UAV RGB images and advanced image processing methods. Precis. Agric. 2022, 23, 1604–1632. [Google Scholar] [CrossRef]
  15. Kienbaum, L.; Correa Abondano, M.; Blas, R.; Schmid, K. DeepCob: Precise and high-throughput analysis of maize cob geometry using deep learning with an application in genebank phenomics. Plant Methods 2021, 17, 1–19. [Google Scholar] [CrossRef] [PubMed]
  16. Kang, J.; Liu, L.T.; Zhang, F.C.; Shen, C.; Wang, N.; Shao, L.M. Semantic segmentation model of cotton roots in-situ image based on attention mechanism. Comput. Electron. Agric. 2021, 189, 106370. [Google Scholar] [CrossRef]
  17. Mei, W.Y.; Wang, H.Y.; Fouhey, D.; Zhou, W.Q.; Hinks, I.; Gray, J.M.; Van Berkel, D.; Jain, M. Using Deep Learning and Very-High-Resolution Imagery to Map Smallholder Field Boundaries. Remote Sens. 2022, 14, 3046. [Google Scholar] [CrossRef]
  18. Xu, H.; Blonder, B.; Jodra, M.; Malhi, Y.; Fricker, M. Automated and accurate segmentation of leaf venation networks via deep learning. New Phytol. 2021, 229, 631–648. [Google Scholar] [CrossRef] [PubMed]
  19. Yang, S.; Zheng, L.H.; Yang, H.J.; Zhang, M.; Wu, T.T.; Sun, S.; Tomasetto, F.; Wang, M.J. A synthetic datasets based instance segmentation network for High-throughput soybean pods phenotype investigation. Expert Syst. Appl. 2022, 192, 116403. [Google Scholar] [CrossRef]
  20. Zhang, W.L.; Wang, J.Q.; Liu, Y.X.; Chen, K.Z.; Li, H.B.; Duan, Y.L.; Wu, W.B.; Shi, Y.; Guo, W. Deep-learning-based in-field citrus fruit detection and tracking. Hortic. Res. 2022, 9, uhac003. [Google Scholar] [CrossRef] [PubMed]
  21. Wen, C.J.; Wu, J.S.; Chen, H.R.; Su, H.Q.; Chen, X.; Li, Z.S.; Yang, C. Wheat Spike Detection and Counting in the Field Based on SpikeRetinaNet. Front. Plant Sci. 2022, 13, 821717. [Google Scholar] [CrossRef] [PubMed]
  22. Wang, H.J.; Lin, Y.Y.; Xu, X.J.; Chen, Z.Y.; Wu, Z.H.; Tang, Y.C. A Study on Long-Close Distance Coordination Control Strategy for Litchi Picking. Agronomy 2022, 12, 1520. [Google Scholar] [CrossRef]
  23. Tang, Y.C.; Zhou, H.; Wang, H.J.; Zhang, Y.Q. Fruit detection and positioning technology for a Camellia oleifera C. Abel orchard based on improved YOLOv4-tiny model and binocular stereo vision. Expert Syst. Appl. 2023, 211, 118573. [Google Scholar] [CrossRef]
  24. Tang, Y.C.; Chen, M.Y.; Wang, C.L.; Luo, L.F.; Li, J.H.; Lian, G.P.; Zou, X.J. Recognition and Localization Methods for Vision-Based Fruit Picking Robots: A Review. Front. Plant Sci. 2020, 11, 510. [Google Scholar] [CrossRef]
  25. Liu, Y.L.; Cen, C.J.; Che, Y.P.; Ke, R.; Ma, Y.; Ma, Y.T. Detection of Maize Tassels from UAV RGB Imagery with Faster R-CNN. Remote Sens. 2020, 12, 338. [Google Scholar] [CrossRef] [Green Version]
  26. Ngugi, L.C.; Abdelwahab, M.; Abo-Zahhad, M. Tomato leaf segmentation algorithms for mobile phone applications using deep learning. Comput. Electron. Agric. 2020, 178, 105788. [Google Scholar] [CrossRef]
  27. Ma, X.; Deng, X.W.; Qi, L.; Jiang, Y.; Li, H.W.; Wang, Y.W.; Xing, X.P. Fully convolutional network for rice seedling and weed image segmentation at the seedling stage in paddy fields. PLoS ONE 2019, 14, e215676. [Google Scholar] [CrossRef]
  28. Gan, H.M.; Ou, M.Q.; Li, C.P.; Wang, X.R.; Guo, J.F.; Mao, A.X.; Camila Ceballos, M.; Parsons, T.D.; Liu, K.; Xue, Y.J. Automated detection and analysis of piglet suckling behaviour using high-accuracy amodal instance segmentation. Comput. Electron. Agric. 2022, 199, 107162. [Google Scholar] [CrossRef]
  29. Mendoza, A.; Trullo, R.; Wielhorski, Y. Descriptive modeling of textiles using FE simulations and deep learning. Compos. Sci. Technol. 2021, 213, 108897. [Google Scholar] [CrossRef]
  30. Wagner, F.H.; Dalagnol, R.; Tarabalka, Y.; Segantine, T.Y.F.; Thomé, R.; Hirye, M.C.M. U-Net-Id, an Instance Segmentation Model for Building Extraction from Satellite Images—Case Study in the Joanópolis City, Brazil. Remote Sens. 2020, 12, 1544. [Google Scholar] [CrossRef]
  31. Jia, W.K.; Tian, Y.Y.; Luo, R.; Zhang, Z.H.; Lian, J.; Zheng, Y.J. Detection and segmentation of overlapped fruits based on optimized mask R-CNN application in apple harvesting robot. Comput. Electron. Agric. 2020, 172, 105380. [Google Scholar] [CrossRef]
  32. Soetedjo, A.; Hendriarianti, E. Plant Leaf Detection and Counting in a Greenhouse during Day and Nighttime Using a Raspberry Pi NoIR Camera. Sensors 2021, 21, 6659. [Google Scholar] [CrossRef]
  33. Vishal, M.K.; Banerjee, B.; Saluja, R.; Raju, D.; Chinnusamy, V.; Kumar, S.; Sahoo, R.N.; Adinarayana, J. Leaf Counting in Rice (Oryza sativa L.) Using Object Detection: A Deep Learning Approach. In Proceedings of the IGARSS 2020–2020 IEEE International Geoscience and Remote Sensing Symposium, Waikoloa, HI, USA, 26 September–2 October 2020; pp. 5286–5289. [Google Scholar]
  34. Dobrescu, A.; Giuffrida, M.V.; Tsaftaris, S.A. Doing More with Less: A Multitask Deep Learning Approach in Plant Phenotyping. Front. Plant Sci. 2020, 11, 141–151. [Google Scholar] [CrossRef]
  35. Miao, C.Y.; Guo, A.; Thompson, A.M.; Yang, J.L.; Ge, Y.F.; Schnable, J.C. Automation of leaf counting in maize and sorghum using deep learning. Plant Phenome J. 2021, 4, e20022. [Google Scholar] [CrossRef]
  36. Wang, D.D.; He, D.J. Channel pruned YOLO V5s-based deep learning approach for rapid and accurate apple fruitlet detection before fruit thinning. Biosyst. Eng. 2021, 210, 271–281. [Google Scholar] [CrossRef]
  37. Qi, X.K.; Dong, J.S.; Lan, Y.B.; Zhu, H. Method for Identifying Litchi Picking Position Based on YOLOv5 and PSPNet. Remote Sens. 2022, 14, 2004. [Google Scholar] [CrossRef]
  38. Zhao, J.Q.; Zhang, X.H.; Yan, J.W.; Qiu, X.L.; Yao, X.; Tian, Y.C.; Zhu, Y.; Cao, W.X. A Wheat Spike Detection Method in UAV Images Based on Improved YOLOv5. Remote Sens. 2021, 13, 3095. [Google Scholar] [CrossRef]
  39. Weyler, J.; Milioto, A.; Falck, T.; Behley, J.; Stachniss, C. Joint Plant Instance Detection and Leaf Count Estimation for In-Field Plant Phenotyping. IEEE Robot. Autom. Lett. 2021, 6, 3599–3606. [Google Scholar] [CrossRef]
  40. Wang, C.S.; Du, P.F.; Wu, H.R.; Li, J.X.; Zhao, C.J.; Zhu, H. A cucumber leaf disease severity classification method based on the fusion of DeepLabV3+ and U-Net. Comput. Electron. Agric. 2021, 189, 106373. [Google Scholar] [CrossRef]
  41. Su, W.H.; Zhang, J.J.; Yang, C.; Page, R.; Szinyei, T.; Hirsch, C.D.; Steffenson, B.J. Automatic Evaluation of Wheat Resistance to Fusarium Head Blight Using Dual Mask-RCNN Deep Learning Frameworks in Computer Vision. Remote Sens. 2021, 13, 26. [Google Scholar] [CrossRef]
  42. Liu, B.Y.; Fan, K.J.; Su, W.H.; Peng, Y.K. Two-Stage Convolutional Neural Networks for Diagnosing the Severity of Alternaria Leaf Blotch Disease of the Apple Tree. Remote Sens. 2022, 14, 2519. [Google Scholar] [CrossRef]
  43. Wkentaro, Labelme. Available online: https://github.com/wkentaro/labelme (accessed on 20 August 2021).
  44. Tzutalin. LabelImg. Available online: https://github.com/tzutalin/labelImg (accessed on 1 February 2022).
  45. MMDetection Contributors. OpenMMLab Detection Toolbox and Benchmark [Computer Software]. Available online: https://github.com/open-mmlab/mmdetection (accessed on 4 January 2022).
  46. Ultralytics. YOLOv5. Available online: https://github.com/ultralytics/yolov5/tree/v6.0 (accessed on 28 February 2022).
  47. He, K.M.; Gkioxari, G.; Dollar, P.; Girshick, R. Mask R-CNN. IEEE Trans. Pattern Anal. Mach. Intell. 2020, 42, 386–397. [Google Scholar] [CrossRef] [PubMed]
  48. Long, J.E.; Shelhamer, E.; Darrell, T. Fully Convolutional Networks for Semantic Segmentation. IEEE Trans. Pattern Anal. Mach. Intell. 2015, 640–651. [Google Scholar]
  49. Ren, S.Q.; He, K.M.; Girshick, R.; Sun, J. Faster R-CNN: Towards Real-Time Object Detection with Region Proposal Networks. IEEE Trans. Pattern Anal. Mach. Intell. 2017, 39, 1137–1149. [Google Scholar] [CrossRef] [PubMed] [Green Version]
  50. He, K.M.; Zhang, X.Y.; Ren, S.Q.; Sun, J. Deep Residual Learning for Image Recognition. In Proceedings of the IEEE Conference on Computer Vision and Pattern Recognition, Las Vegas, NV, USA, 27–30 June 2016. [Google Scholar]
  51. Lin, T.Y.; Dollár, P.; Girshick, R.; He, K.M.; Hariharan, B.; Belongie, S. Feature pyramid networks for object detection. In Proceedings of the IEEE Conference on Computer Vision and Pattern Recognition (‘CVPR’17), Kalakaua Ave, HI, USA, 21–26 July 2017; pp. 2117–2125. [Google Scholar]
  52. Qi, J.T.; Liu, X.N.; Liu, K.; Xu, F.R.; Guo, H.; Tian, X.L.; Li, M.; Bao, Z.Y.; Li, Y. An improved YOLOv5 model based on visual attention mechanism: Application to recognition of tomato virus disease. Comput. Electron. Agric. 2022, 194, 106780. [Google Scholar] [CrossRef]
  53. Gu, W.C.; Bai, S.; Kong, L.X. A review on 2D instance segmentation based on deep neural networks. Image Vision Comput. 2022, 120, 104401. [Google Scholar] [CrossRef]
  54. Minaee, S.; Boykov, Y.Y.; Porikli, F.; Plaza, A.J.; Kehtarnavaz, N.; Terzopoulos, D. Image Segmentation Using Deep Learning: A Survey. IEEE Trans. Pattern Anal. Mach. Intell. 2021, 44, 3523–3542. [Google Scholar] [CrossRef]
  55. Lalit, M.; Tomancak, P.; Jug, F. EmbedSeg: Embedding-based Instance Segmentation for Biomedical Microscopy Data. Med. Image Anal. 2022, 81, 102523. [Google Scholar] [CrossRef]
  56. Shen, L.; Chen, S.; Mi, Z.W.; Su, J.Y.; Huang, R.; Song, Y.Y.; Fang, Y.L.; Su, B.F. Identifying veraison process of colored wine grapes in field conditions combining deep learning and image analysis. Comput. Electron. Agric. 2022, 200, 107268. [Google Scholar] [CrossRef]
  57. Zu, L.L.; Zhao, Y.P.; Liu, J.Q.; Su, F.; Zhang, Y.; Liu, P.Z. Detection and Segmentation of Mature Green Tomatoes Based on Mask R-CNN with Automatic Image Acquisition Approach. Sensors 2021, 21, 7842. [Google Scholar] [CrossRef] [PubMed]
  58. Liu, Y.; Zhang, Z.L.; Liu, X.; Wang, L.; Xia, X.H. Efficient image segmentation based on deep learning for mineral image classification. Adv. Powder Technol. 2021, 32, 3885–3903. [Google Scholar] [CrossRef]
  59. Xiao, J.X.; Liu, G.; Wang, K.J.; Si, Y.S. Cow identification in free-stall barns based on an improved Mask R-CNN and an SVM. Comput. Electron. Agric. 2022, 194, 106738. [Google Scholar] [CrossRef]
  60. Junior, L.C.M.; Alfredo, C.; Ulson, J.A.C. Real Time Weed Detection using Computer Vision and Deep Learning. In Proceedings of the 2021 14th IEEE International Conference on Industry Applications (INDUSCON), São Paulo, Brazil, 15–18 August 2021. [Google Scholar]
  61. Chen, Y.C.; Liu, W.B.; Zhang, J.Y. An Enhanced YOLOv5 Model with Attention Module for Vehicle-Pedestrian Detection. In Proceedings of the 2022 IEEE 31st International Symposium on Industrial Electronics (ISIE), Anchorage, AK, USA, 1–3 June 2022. [Google Scholar]
  62. Chen, R.N.; Ma, Y.X.; Liu, L.J.; Chen, N.L.; Cui, Z.M.; Wei, G.D.; Wang, W.P. Semi-supervised anatomical landmark detection via shape-regulated self-training. Neurocomputing 2022, 471, 335–345. [Google Scholar] [CrossRef]
  63. Liu, Y.; Wang, C.Q.; Zhou, Y.J. Camouflaged people detection based on a semi-supervised search identification network. Def. Technol. 2021; in press. [Google Scholar] [CrossRef]
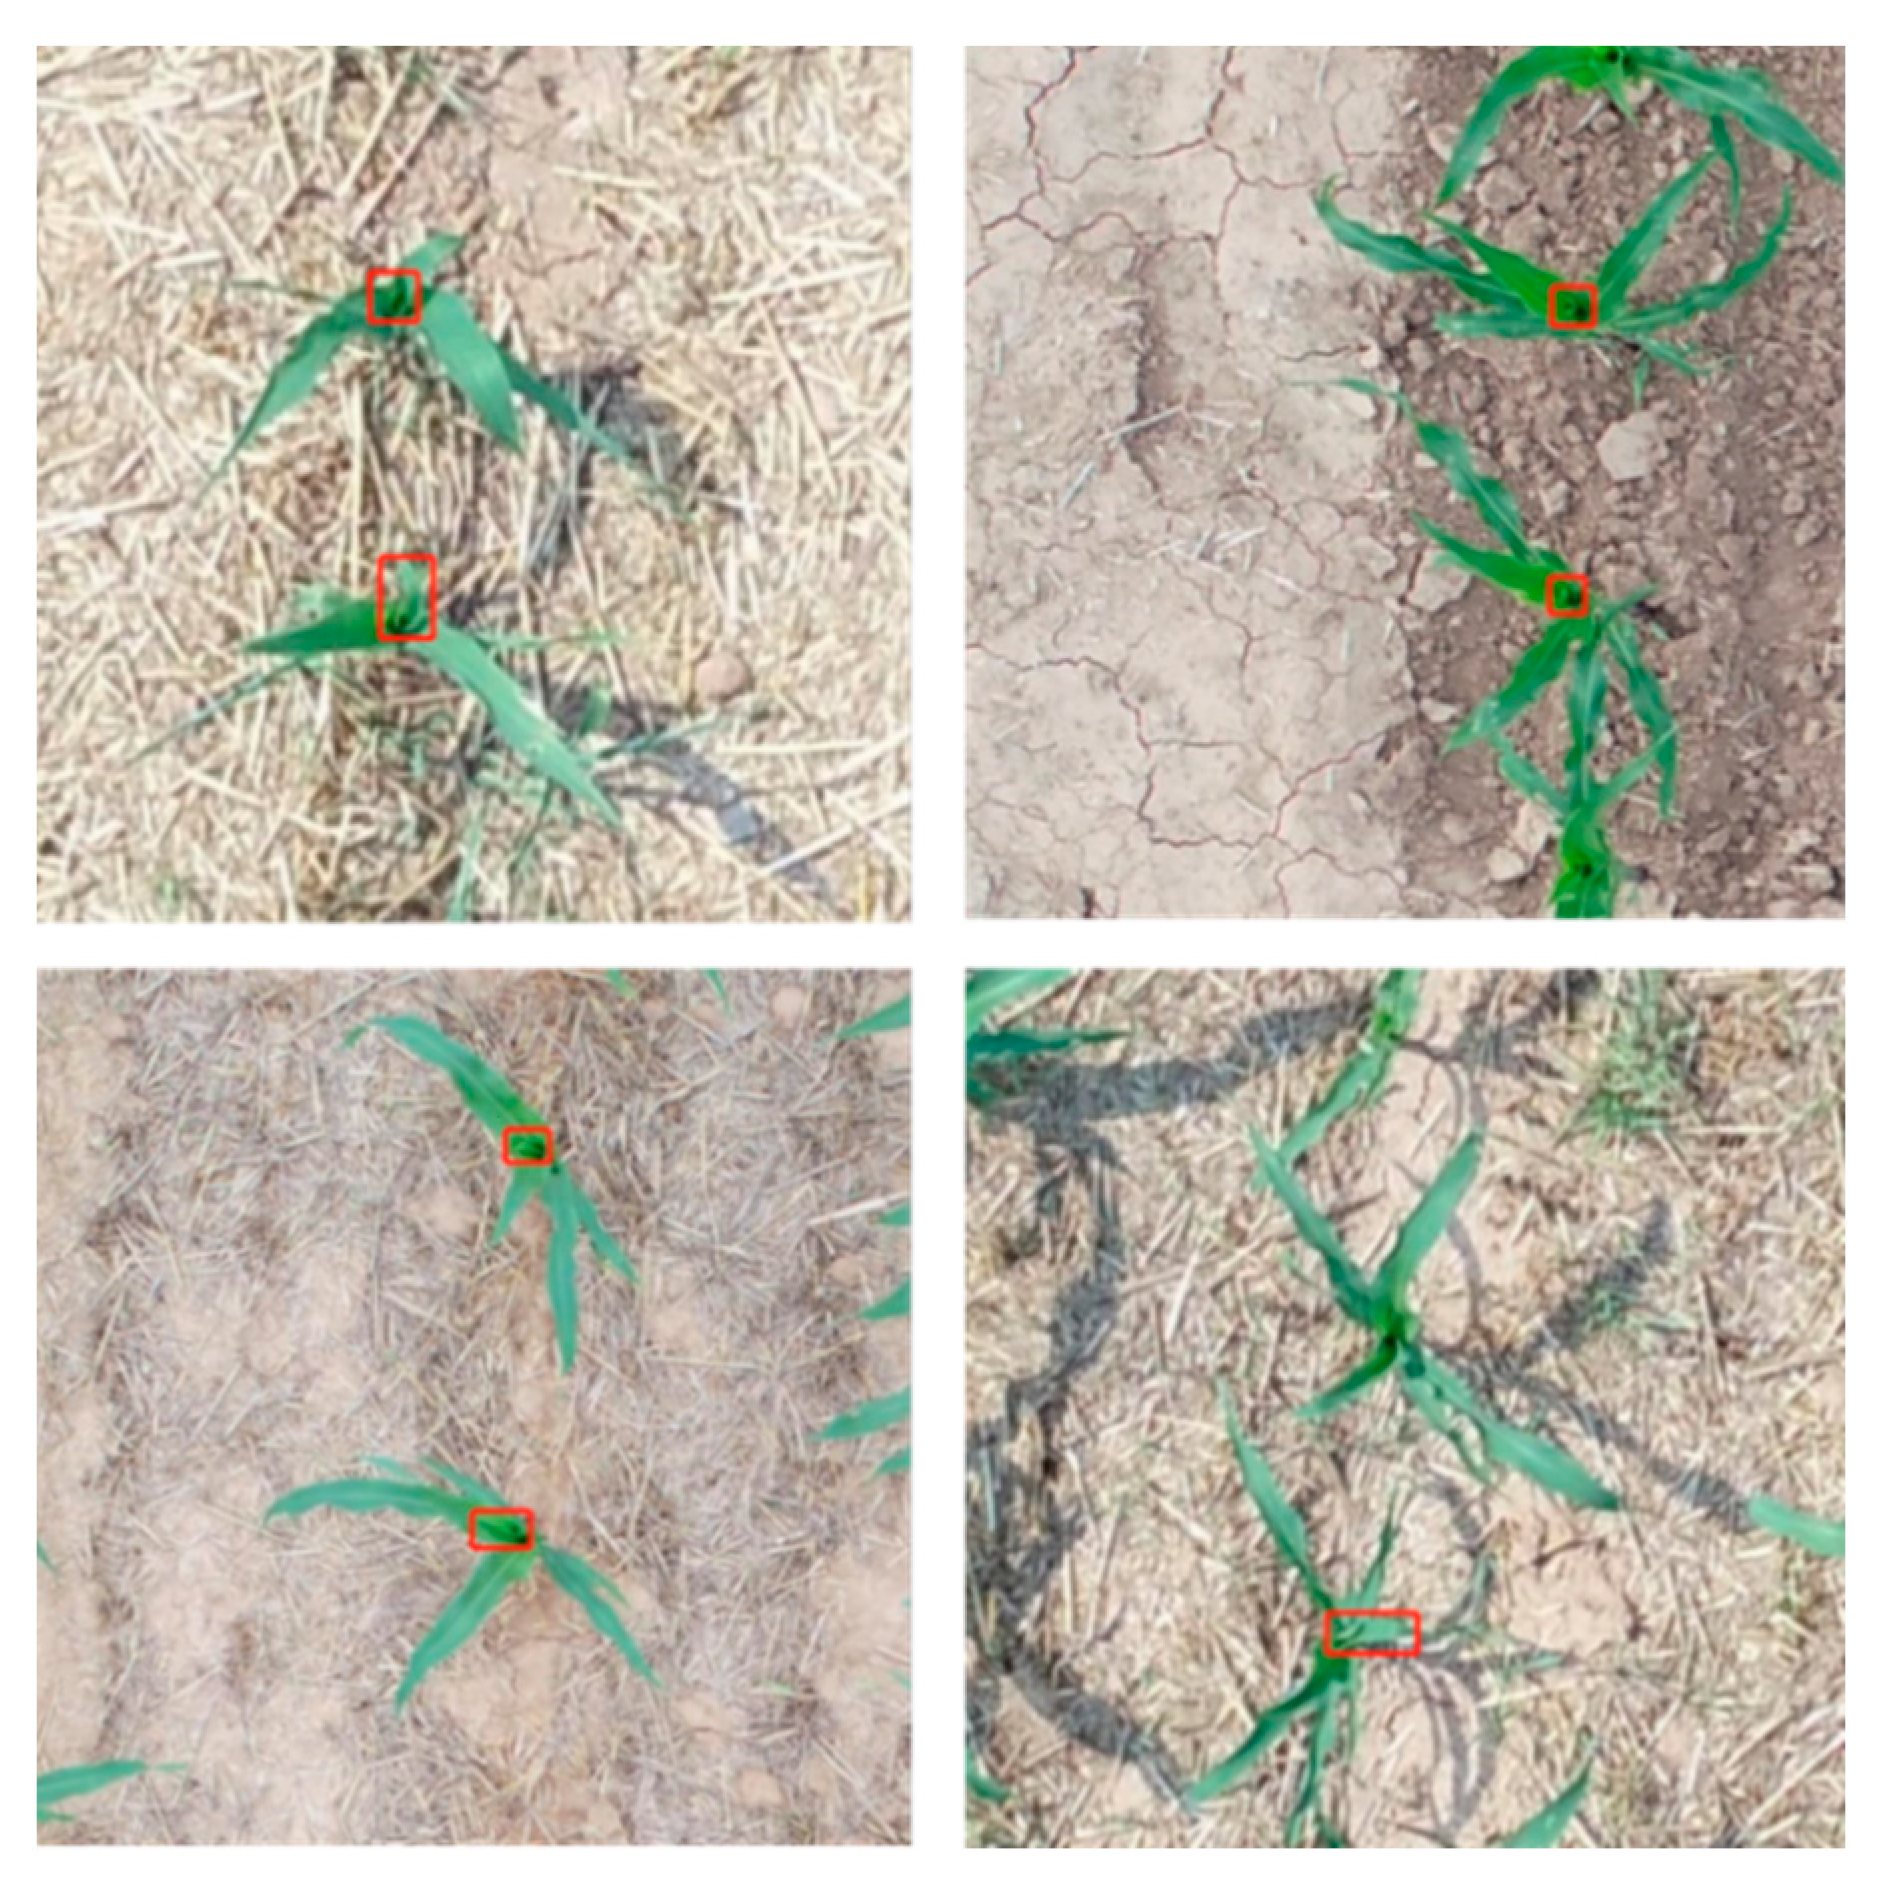
Figure 1. Examples of newly appeared leaf labeling. Newly appeared leaves are in the red rectangular boxes.
Remotesensing 14 05388 g001
Figure 2. Flow chart of maize seedlings and leaves detection.
Remotesensing 14 05388 g002
Figure 3. Mask R-CNN structure.
Remotesensing 14 05388 g003
Figure 4. YOLOv5 network structure. Conv is the convolution module, which consists of Conv2d (convolution unit), BN (batch normalization), and SiLU (activation function). C3 is the bottleneck layer. Bottleneck is the residual block. Maxpool2D is the maximum pooling. SPPF is fast spatial pyramid pooling. Upsample is upsampling. Concat is the channel-connected feature fusion method.
Remotesensing 14 05388 g004
Figure 5. Performance of Mask R-CNN model with Resnet50 and Resnet101 as backbone networks on different IoUs (Intersections over Union) when the loss function is SmoothLR.
Remotesensing 14 05388 g005
Figure 6. Visualization results of instance segmentation of different Mask R-CNN models on the test set. (a) Uncross-covering of adjacent seedling leaves; (b) cross-covering of adjacent seedling leaves. The first column shows the original image, and the second column shows the Ground truth of the mask and detection frame, it colors every maize seeding randomly. The third and fourth columns show the detection segmentation results of Resnet50-L1 and ResNet101-L1, respectively. The fifth and sixth columns show the detection segmentation results of Resnet50-SmoothLR and ResNet101-SmoothLR, respectively.
Remotesensing 14 05388 g006
Figure 7. Comparison of different YOLOv5 models. (a) Precision curve; (b) Recall curve; (c) mAP curve.
Remotesensing 14 05388 g007aRemotesensing 14 05388 g007b
Figure 8. Visualization results of leaf detection for different models on the different test sets. (a) The maize seedlings without newly appeared leaves; (bf) the maize seedlings with newly appeared leaves. The first column is a partial view of the original image. The second column is the segmented individual maize seedling. The remaining columns are the detection results with seven different models. The blue and yellow rectangles are missed fully unfolded leaf and newly appeared leaf inspection. The blue circle is the multi-inspection of leaves. The white rectangular box is the false detection of newly appeared leaf.
Remotesensing 14 05388 g008aRemotesensing 14 05388 g008b
Figure 9. Visualization of the YOLOv5 stage23_C3_features feature map. (a) Original image; (bf) stage23_C3_features feature maps of the five networks.
Remotesensing 14 05388 g009
Table 1. Parameters of Mask R-CNN and YOLOv5.
ModelBatch-SizeLearning RateOptimizerWeight DecayMomentumEpoch
Mask R-CNN120.02SGD0.00010.9100
YOLOv5160.01SGD0.00050.937300
Table 2. Performance of Mask R-CNN model with different backbone networks and loss functions on the test set.
BackboneLoss FunctionmAP0.50 (%)mAP0.75 (%)mAP0.5:0.95 (%)Time (s/img)
BboxMaskBboxMaskBboxMaskBboxMask
Resnet 50L195.793.983.755.871.550.90.060.11
Resnet 101L193.693.384.356.473.051.40.060.08
Resnet 50SmoothLR96.995.282.660.071.451.90.050.07
Resnet 101SmoothLR94.993.587.759.474.652.00.050.08
Note: mAP0.50 is the average mean accuracy rate at IoU = 0.5; mAP0.75 is the average mean accuracy rate at IoU = 0.75; mAP0.5:0.95 is the average mean accuracy rate at IoU = (0.5, 0.55, 0.6, 0.65, 0.7, 0.75, 0.8, 0.85, 0.9, 0.95); time is the average inference time of each image.
Table 3. Test results of leaf detection with different YOLOv5.
ModelPrecision (%)Recall (%)AP (%)mAP (%)
Fully
Unfolded Leaf
Newly Appeared LeafFully
Unfolded Leaf
Newly Appeared LeafFully
Unfolded Leaf
Newly Appeared Leaf
YOLOv5n91.465.984.849.989.453.371.4
YOLOv5s87.858.686.548.389.248.668.9
YOLOv5m90.761.987.154.289.954.372.1
YOLOv5l91.263.885.755.889.757.373.5
YOLOv5x92.068.884.450.089.654.071.8
Table 4. Test results of leaf detection with different object detection models.
ModelPrecision (%)Recall (%)AP (%)mAP (%)
Fully
Unfolded Leaf
Newly Appeared LeafFully
Unfolded Leaf
Newly Appeared LeafFully
Unfolded Leaf
Newly Appeared Leaf
Faster R-CNN40.718.279.948.167.317.342.3
SSD97.283.357.88.272.718.145.4
YOLOv5x92.068.884.450.089.654.071.8
Table 5. The difference distribution in fully unfolded leaf counting.
ModelImagesDifferential ValueAccuracy Rate
−2−1012
YOLOv5n17012011330666.5%
YOLOv5s22811719468.8%
YOLOv5m32611623268.2%
YOLOv5l22512418172.9%
YOLOv5x2161242872.9%
Table 6. The difference distribution in newly appeared leaf counting.
ModelImagesDifferential ValueAccuracy Rate
−101
YOLOv5n17091194270.0%
YOLOv5s91154667.6%
YOLOv5m51283775.3%
YOLOv5l181252773.5%
YOLOv5x111283175.3%
Publisher’s Note: MDPI stays neutral with regard to jurisdictional claims in published maps and institutional affiliations.