Abstract
In this paper, a high-resolution Sentinel-3 synthetic aperture radar altimeter is used to observe ISWs in the Sulu Sea. Based on the advantages of the simultaneous observation of Sentinel-3 OLCI and SRAL, the changes in , SWH, and SSHA caused by the ISWs are quantitatively analyzed. The results show that decreases and then increases after being modulated by the ISWs in the altimeter operation direction; SWH shows a large change; and the change trend of SSHA is the same as that of . Because of the angle between the propagation direction of the ISWs and the SRAL trajectory, the actual position corresponding to the peak power in the waveform detects the ISWs before the nadir, at which time is already modulated by ISWs, resulting in the deviation of . In addition, the sea surface roughness within the SRAL footprint in this case is no longer uniform, which violates the assumption of retracking and leads to the incorrect estimation of geophysical parameters such as SWH and SSHA. With a view to correcting these errors, the effect of ISWs on the retracker must therefore be considered and the model for waveform modified accordingly.
1. Introduction
Internal waves in the ocean are associated with fluctuations that occur in seawater with stable density stratification and are widely distributed in all oceans around the globe as a submesoscale phenomenon [1]. Internal waves generally include internal tidal waves, internal surges, and internal solitary waves (ISWs), among which ISWs display strong nonlinear effects with large amplitudes and flow velocities and have an important influence on marine ecology and marine engineering construction. The British scientist Russell elaborated upon the concept of waves and solitary waves in 1834 and performed the relevant theoretical derivations [2]. Since the 1940s, the emergence of rapid sampling instruments, such as temperature and depth meters, has promoted the scientific study of ISWs.
The rise of remote sensing since the 1960s has improved human understanding of the Earth and resource exploitation. Currently, remote sensing has become the main method for studying ISWs due to its wide coverage, large data volume, and easy processing advantages. The main methods include optical remote sensing, synthetic aperture radar (SAR) remote sensing, and altimeter remote sensing [3,4]. Alpers first proposed the principle of imaging ISWs based on SAR images [4], and SAR images have since become an important data source for studying ISWs. Jackson used a large number of MODIS optical images to study the global distribution of ISWs [5]. However, both SAR images and optical remote sensing images can only provide planar two-dimensional information for ISWs; in their case, only spatial and temporal distributions and generation sources can be identified, and parameter inversion performed [6,7,8].
In addition to the amplitude, propagation speed and wavelength of ISWs, the change in vertical height of the sea surface caused by these waves is an important element in studies of ISWs, especially large-amplitude ISWs, which can cause significant vertical undulations in the sea surface [9]. Studies based on the MIT General Circulation Model (MITgcm) simulations [10] and measured data [11] have shown that ISWs cause changes in the vertical height of the sea surface and influence the redistribution of water quality at the sea surface during propagation. However, the changes in sea surface height cannot be determined from conventional optical or SAR remote sensing images; instead, altimeter-based remote sensing is needed. The radar altimeter, as an active microwave sensor for measuring the height of targets on the Earth’s surface, has been continuously improved in terms of accuracy and can achieve centimeter-level accuracy in sea surface height measurements [12]. Thus, this tool can be used to study sea surface variation due to ISW propagation.
Radar altimeters are currently classified as conventional altimeters, synthetic aperture radar altimeters, or 3D imaging altimeters [13,14]. Conventional radar altimeters have generally met the needs of most oceanic applications and can detect internal tides using measured sea surface height (SSH) data [15]. In 2017, Magalhaes and da Silva found that multiple short-period features of Jason-2 data are consistent with the surface manifestation of ISWs [16] and used quasi-synchronous SAR images to confirm the ability of a high-sampling-rate altimeter to detect ISWs [17]. However, because the footprint of conventional radar altimeters is large and mean SSH measurements are influenced by waves, the detection of irregular and small-scale ISWs in the ocean is not possible. The introduction of SAR altimeters has greatly improved the along-track spatial resolution (300 m) and signal-to-noise ratio of data, making the characteristics of ISWs more apparent. Santos et al. leveraged this advantage and proposed an automatic detection algorithm for ISWs based on Sentinel-3 SRAL [18,19]. Then, Drees built a multimodal deep learning framework based on Sentinel-3 OLCI optical remote sensing images and SRAL data by referring to Santos’ algorithm and dataset [20], and good detection results were obtained. In 2020, Zhang Xudong conducted a case study of ISWs in the South China Sea using simultaneously observed Sentinel-3 OLCI and SRAL data, and found that in the Ku-band was susceptible to modulation by ISWs and that SSH anomalies (SSHAs) displayed significant changes [21]. In 2021, Magalhaes et al. found that the effective surface wave height (SWH) changed along the propagation path of ISWs and concluded that surface wave fragmentation caused this difference [22]. Santos et al. demonstrated in a subsequent experiment that surface wave fragmentation (white waves) caused this change in SWH through a comparative analysis involving Sentinel-2 images [23].
Previous studies have shown that high-spatial-resolution SAR altimeters can observe the sea surface variations caused by ISWs in high detail; however, the amount of data available to previous researchers was small and did not reveal any particular pattern. In this paper, we attempt to use simultaneously obtained Sentinel-3 OLCI and SRAL observations to investigate the ISWs in the Sulu Sea and to accurately obtain the changes in ISWs from Sentinel-3 SRAL altimeter data. The SAR altimeter is demonstrated to be an effective tool for observing ISWs, which exhibit unique characteristics in SAR altimeter data.
The rest of this paper is structured as follows. The introduction is introduced in Section 1. The data are presented in Section 2. The research methodology is described in Section 3. In Section 4, the various characteristics of ISWs in SAR altimeter data are identified. In Section 5, the reasons for ISW variations are discussed in detail. Finally, the findings of this study are summarized in Section 6.
2. Data
2.1. Data introduction
Sentinel-3A and Sentinel-3B were launched on 16 February 2016, and 25 April 2018, with a near-polar sun-synchronous orbit carrying the Ocean and Land Color Instrument (OLCI), Sea–Land Surface Temperature Radiometer (SLSTR), SAR Radar Altimeter (SRAL), Microwave Radiometer (MWR), and Precision Orbit Determination (POD) instruments. Among them, Sentinel-3 includes a sea–land chromatograph (OLCI) that obtains observations simultaneously with the SRAL at the same location on the ocean surface; additionally, the spatial resolution of both instruments is also almost the same (300 m), providing excellent synergy.
The continuous echoes in SAR mode in the SAR altimeter are correlated, and this pulse-to-pulse coherence allows the application of the delayed-Doppler concept [24]. After the SAR altimeter acquires the unprocessed high rate burst echoes, the echoes are coherently processed with a delayed-Doppler algorithm to produce a multi-looked SAR waveform (L1b level data). However, since the pulse signal received by the altimeter is subject to various influences from the antenna, atmosphere and target medium, the waveform obtained is not smooth, and cannot be used to calculate geophysical parameters such as SWH. Instead, a scientific method to fit the waveform ready for calculation is required, in the form of an algorithm which measures geophysical quantities of interest from radar echo waveforms, known as waveform retracking. Secondary data from SRAL are retracked using the SAMOSA model.
SAMOSA assumes that the sea surface is uniform and balanced and assumes that the antenna is pointing at 0°. However, even in the open ocean, this assumption is sporadically broken by the presence of oil slicks, algal blooms, ships, etc. In response, SAMOSA proposes a method to extend the its open-ocean survey to any ocean surface using the mean-square slope parameter and a better initialization of the survey itself [25].
Therefore, the data used in this paper are the secondary SAR-mode data from the ‘SRAL Altimetry Global in NTC’ project by EUMETSAT (http://archive.eumetsat.int/usc/ (accessed on 4 August 2022)). The dataset contains Ku-band-based 20 Hz waveform data, AGC data, sea level anomaly (SSHA) information, significant wave heights (i.e., SWHs), and information for other auxiliary variables.
2.2. Study Area
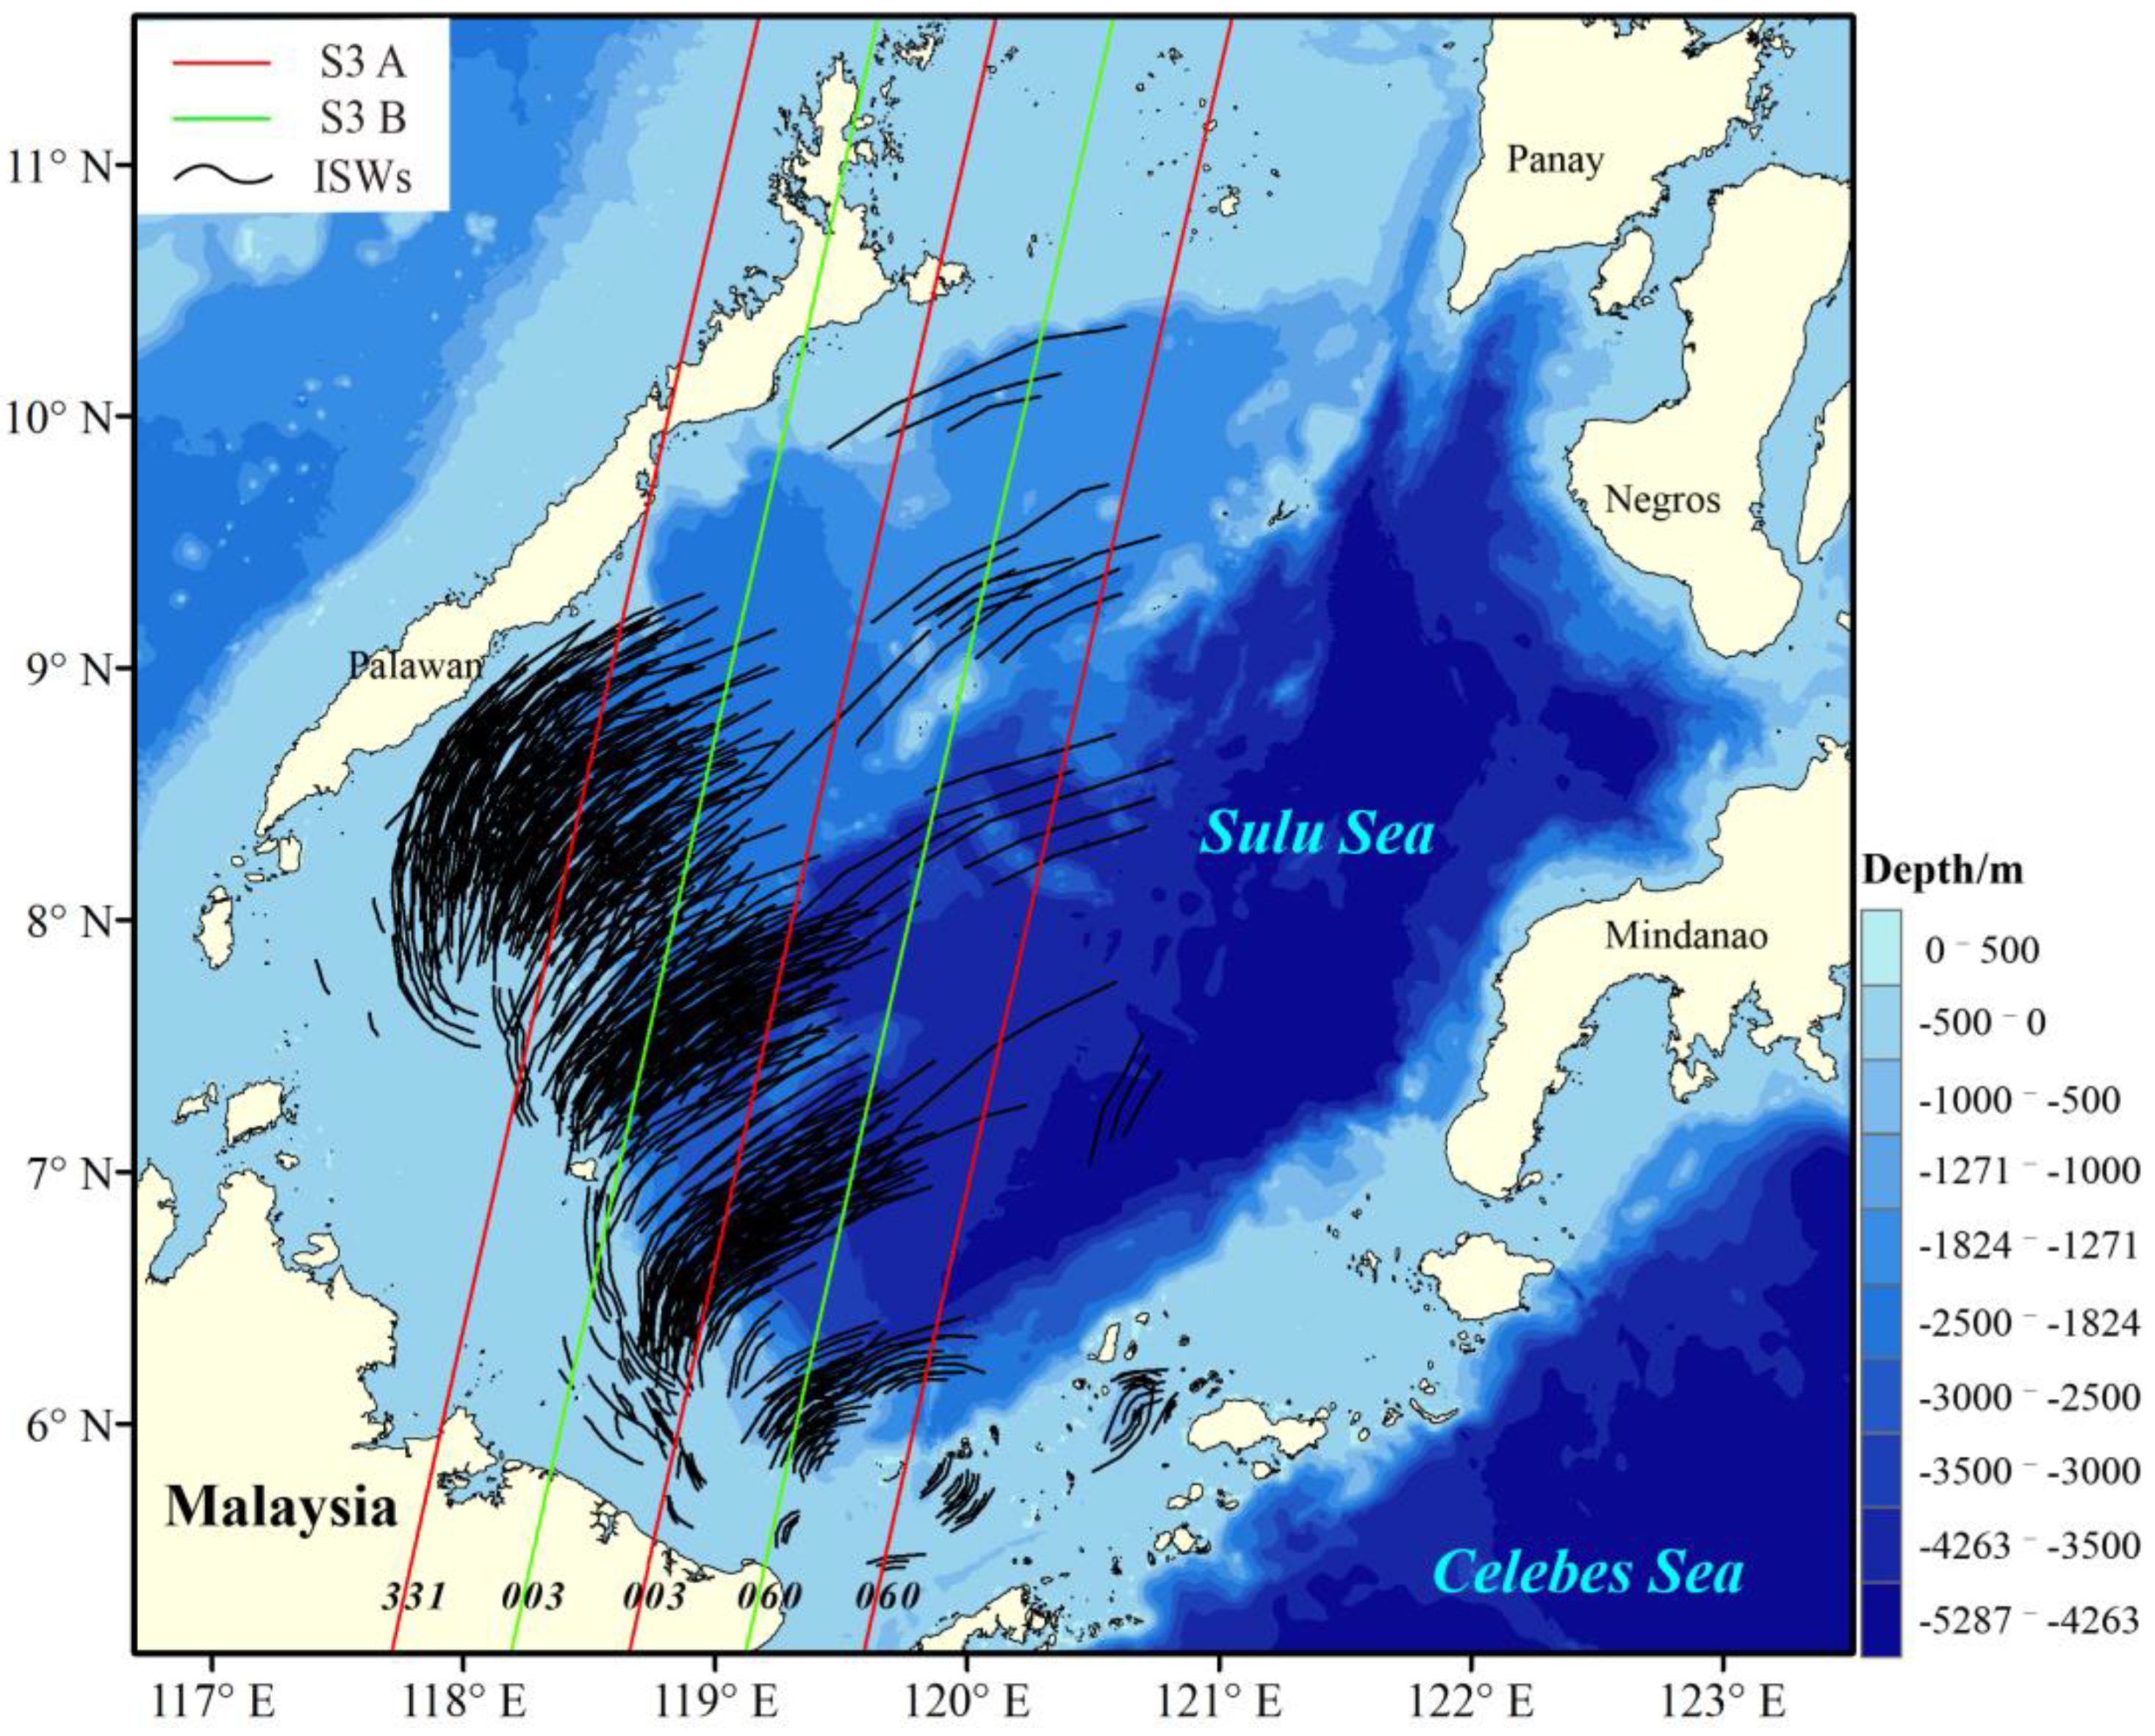
In this paper, the Sulu Sea is selected as the study area, in which large-scale ISWs are frequently generated under the combined effects of strong downwelling [26] and unique seafloor topography. These ISWs have a leading wave crest line of up to 400 km and are mainly generated between the Sulu Archipelago and Malaysia and then propagate northwestward and finally dissipate in Palawan [27]. In addition, most of these ISWs are located in the open sea, and the propagation direction is relatively close to the direction of the SRAL trajectory, which is favorable for the study conducted in this paper. Statistically, there are five tracks of Sentinel-3A/B passing through the region of high ISW generation, as shown in Figure 1.
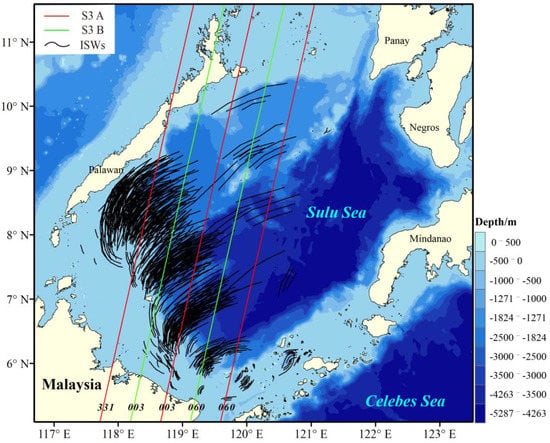
Figure 1.
An overview map of the study area. The ISWs within the Sulu Sea intersect multiple Sentinel-3 tracks, where the black line is the ISW crest line extracted using MODIS remote sensing images and the red and green lines are the tracks of Sentinel-3A and B, respectively, with the track numbers given as subscripts. The color bar indicates the depth of the seawater.
3. Methods
3.1. Method of Feature Selection
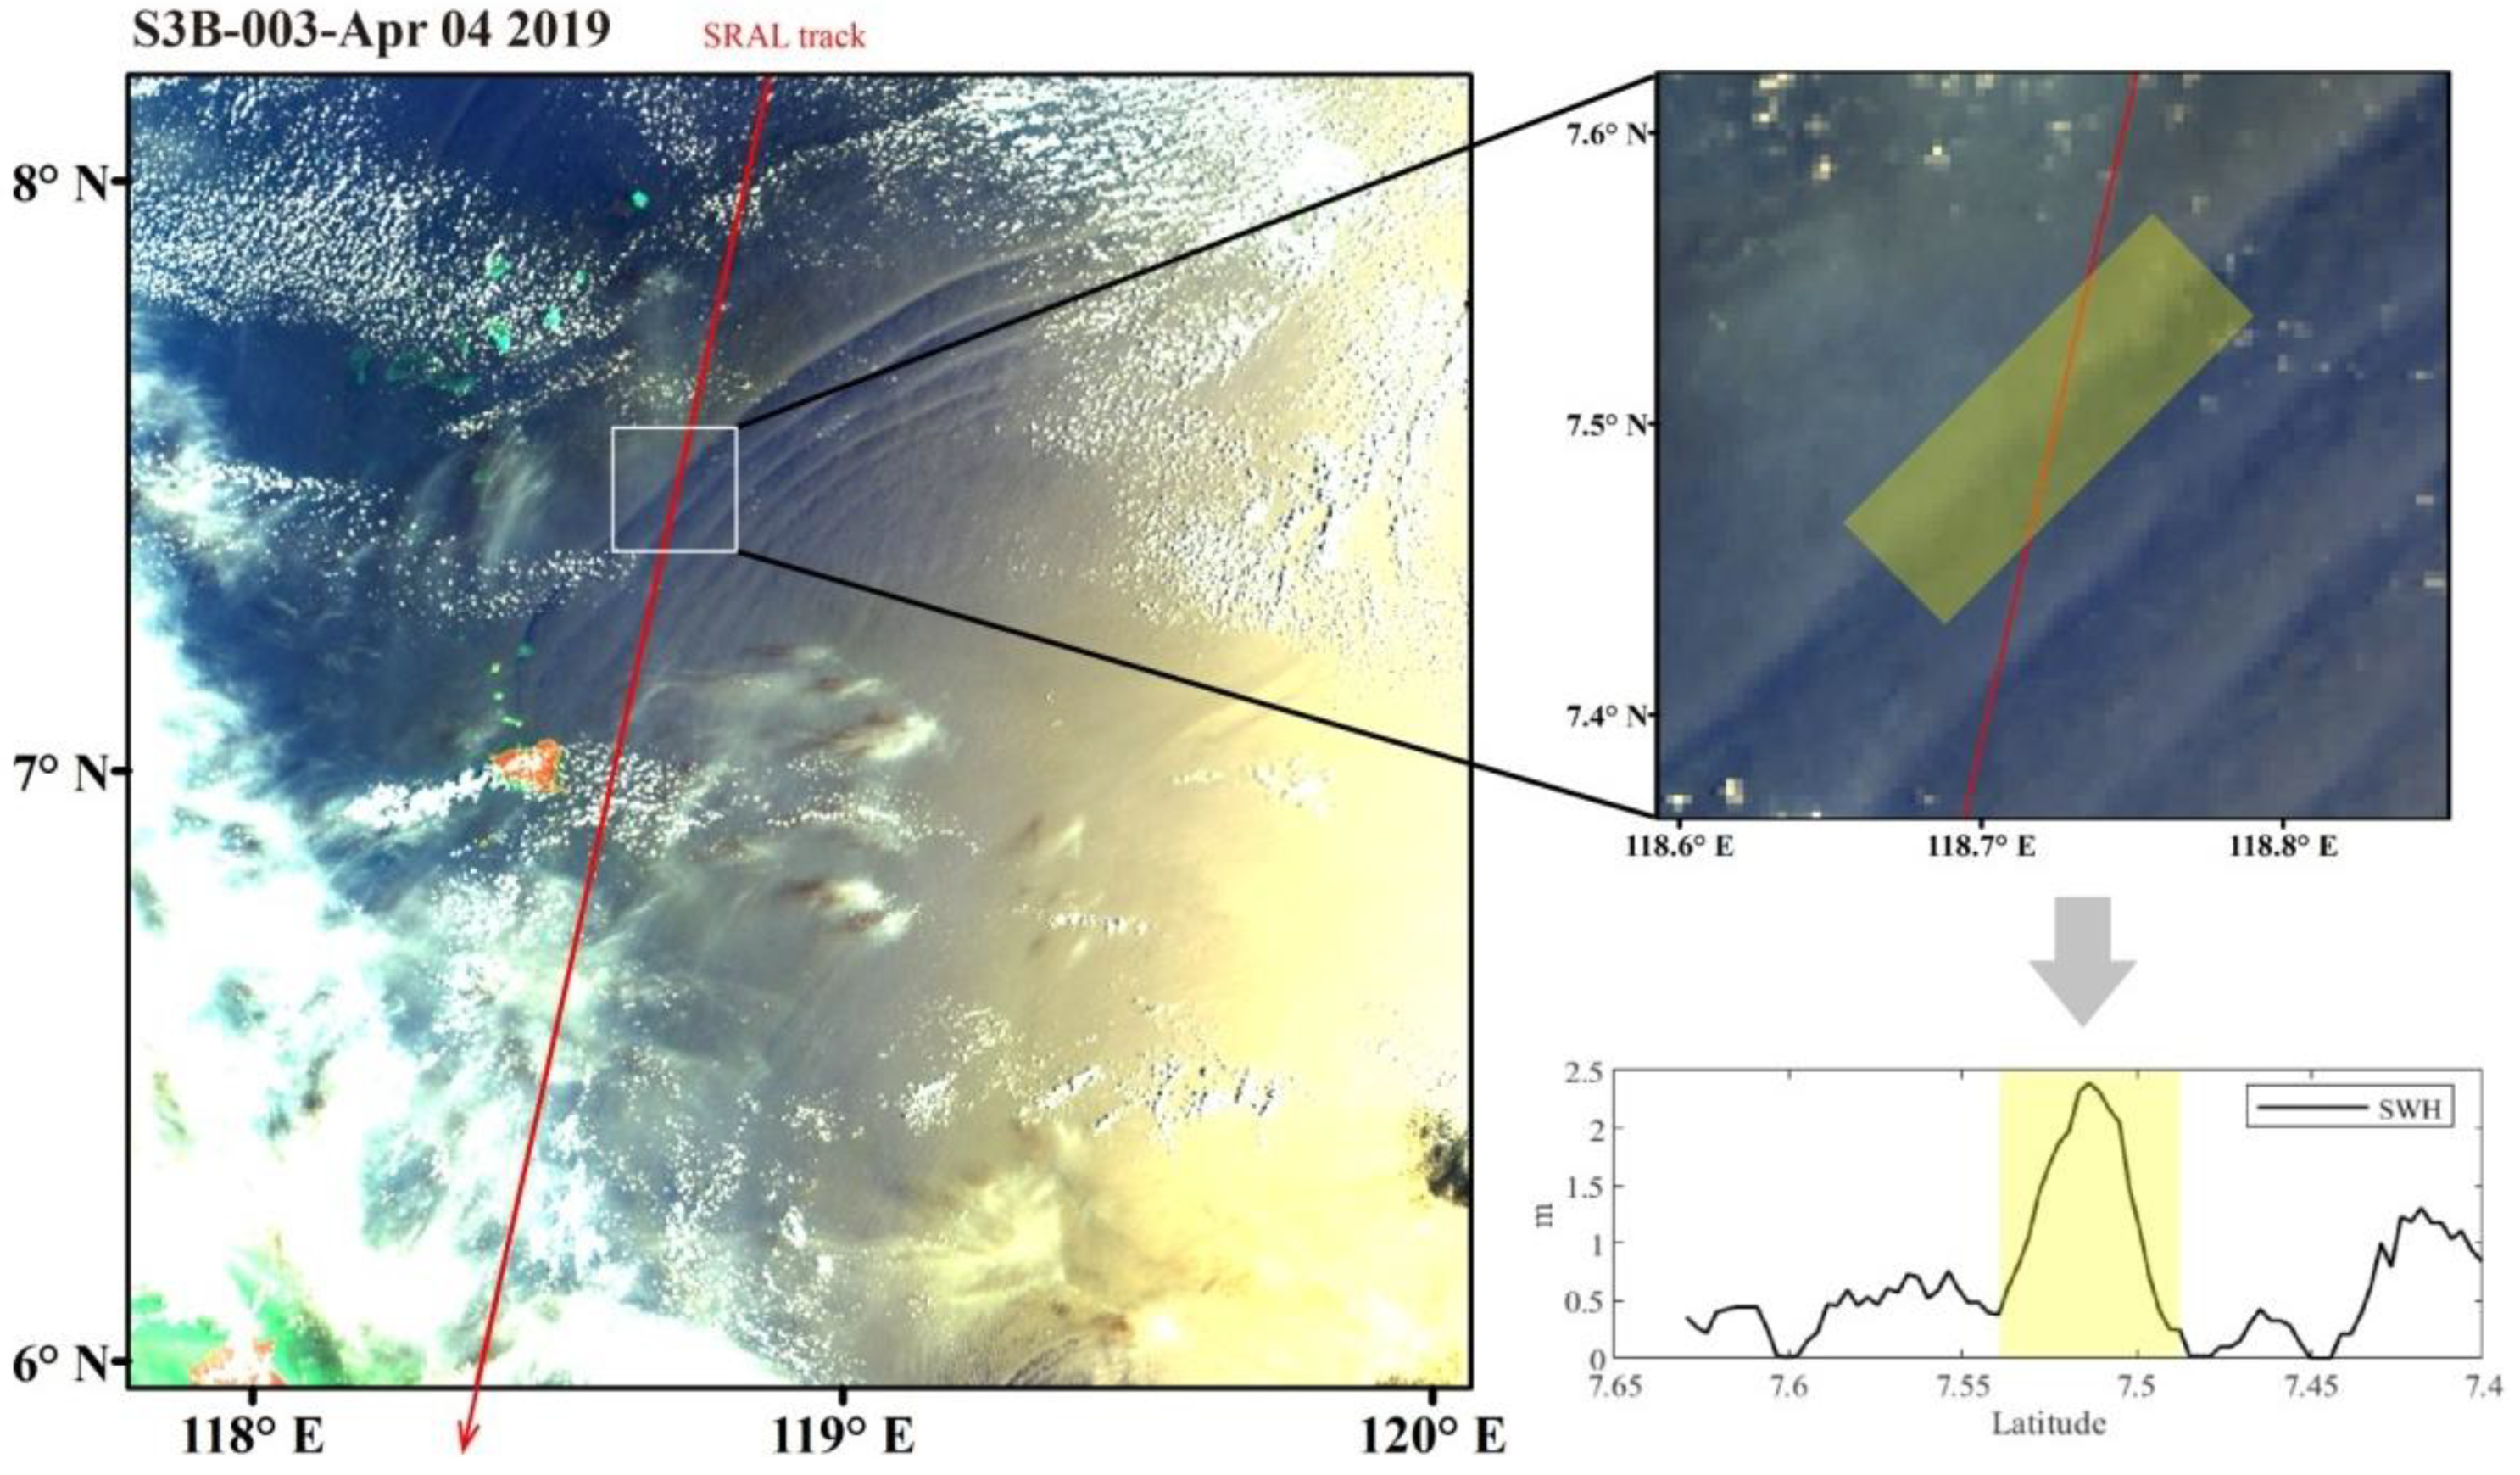
In this paper, based on the simultaneous observations of the Sentinel-3 OLCI and SRAL instruments, an OLCI optical image is first used to search for ISWs in the study area. Then, the optical remote sensing image with ISWs is matched with the SRAL data that were simultaneously obtained (as shown in Figure 2). Because the spatial resolution of the OLCI optical image is similar to the along-track spatial resolution of SRAL data (300 m), the spatial extent of the altimeter-measured ISWs can be directly obtained in the matched image as a way to accurately collect information on the changes in geophysical parameters associated with the altimeter-measured ISWs. In addition, the scale, propagation direction, and other ISW information are used in this paper as auxiliary information for characterization studies.
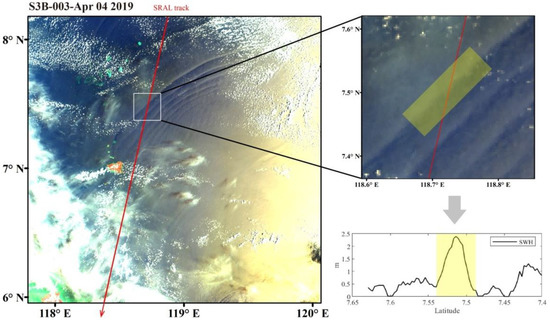
Figure 2.
The image on the left shows the result after matching the OLCI and SRAL data from simultaneous observations, and the schematic method of obtaining the changes in geophysical parameters due to ISWs measured based on SRAL data is shown on the right, where the yellow shaded part is the ISW occurrence region.
3.2. Geometric Relationship between the SRAL Trajectory and ISW Propagation Direction
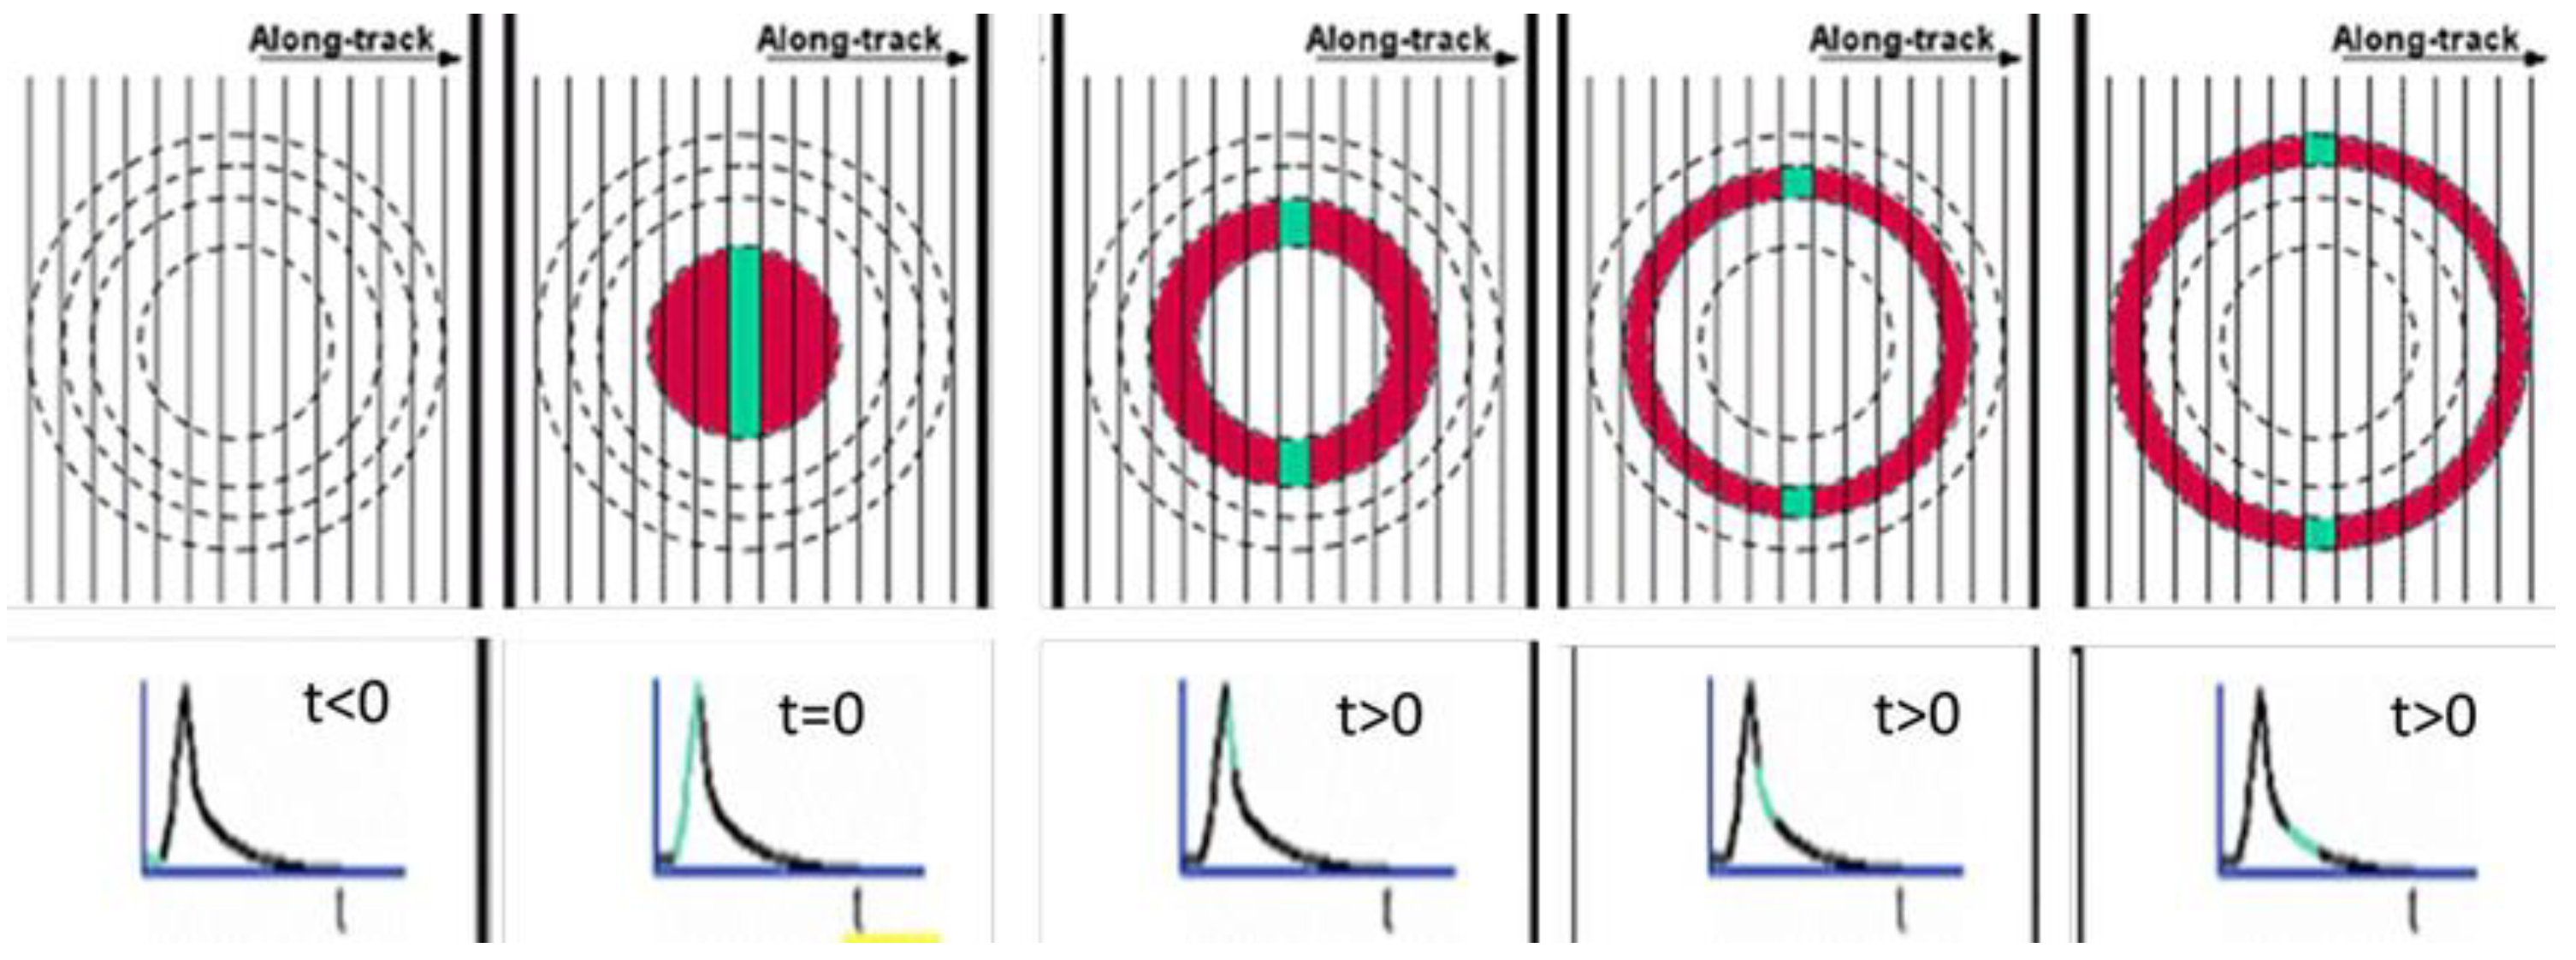
The geometric relationship between the SRAL trajectory and the direction of ISW propagation needs to be considered in conjunction with the operating principle of the SAR altimeter. In SAR mode, pulses are transmitted in bursts with high PRF, and pulses are received at burst intervals. Successive pulses received in the same pulse string are coherent, and the high PRF leads to interpulse coherence in the application of the delay/Doppler concept [28,29], in which the relative Doppler phase between coherent pulses is used to establish a large antenna aperture. As a result, the SAR altimeter will have higher spatial resolution along-track than a conventional altimeter; however, because beam sharpening is only performed in the along-track direction, the size of the illuminated area on the ground that contributes to the multilook waveform is determined by the length of the received waveform in the cross-track direction and the size of the Doppler-limited footprint in the along-track direction, which we refer to as the effective footprint in the text (see Figure 3). Compared to that for the conventional altimeter, the shape of the effective footprint in the SAR mode is narrowed, and the trailing edge of the waveform has a much faster drop rate.
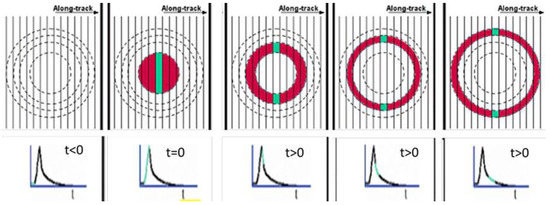
Figure 3.
Evolution of the geometry of the conventional altimeter (red) and SAR altimeter (green) footprints over time [29]; the bottom figure shows a schematic of the echoes received by the SAR altimeter at different times.
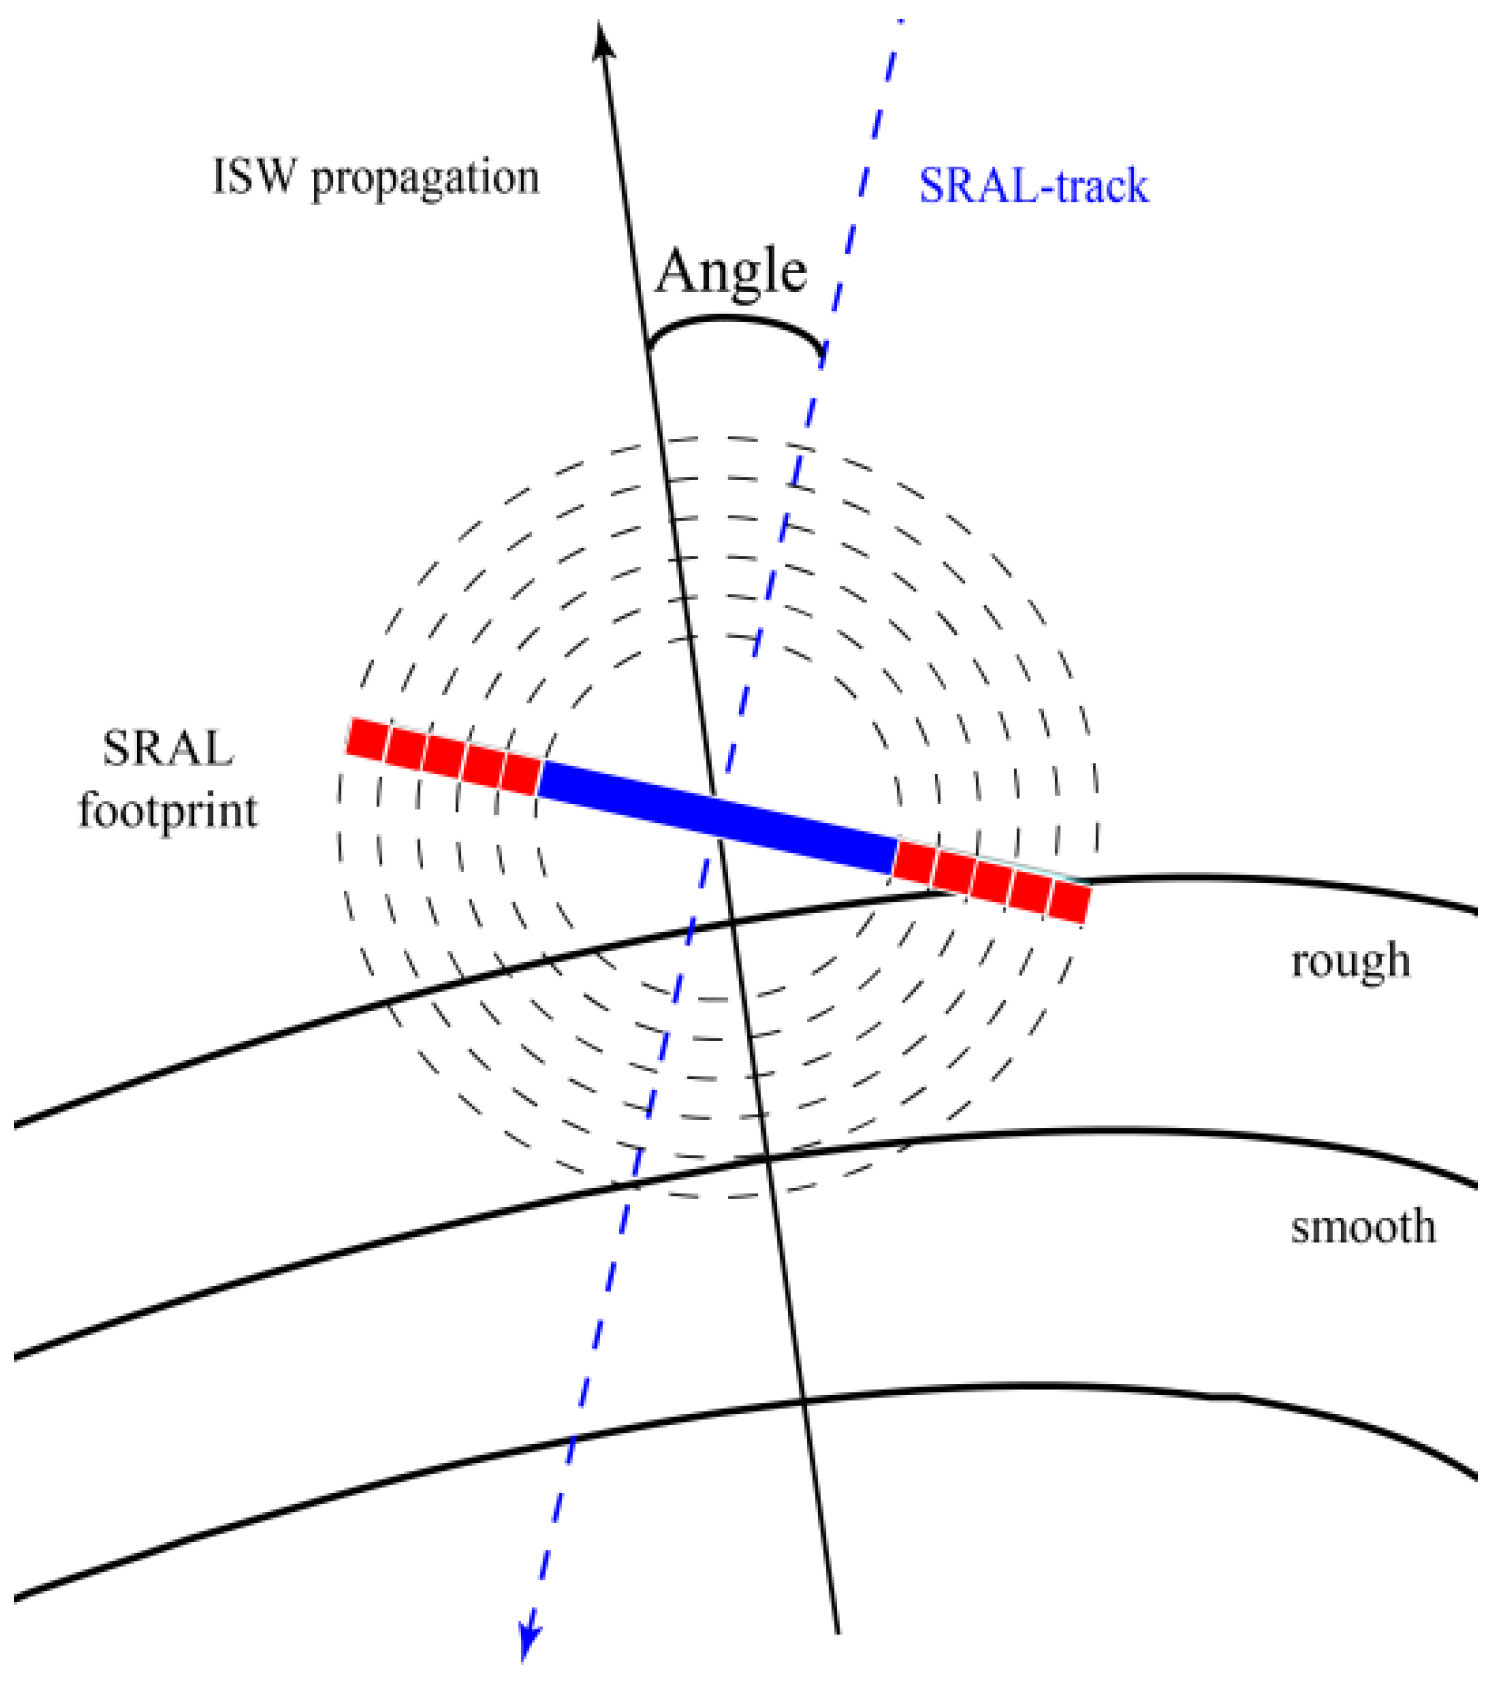
As shown in Figure 4, there is a geometric relationship between the SRAL trajectory and the propagation direction of ISWs, and this geometric relationship is variable because the propagation direction of each ISW can vary greatly. In this paper, the geometric relationship is described by the acute angle between the SRAL trajectory and the ISW propagation direction, and this angle is denoted as the angle (Figure 4). The geometry of the SRAL trajectory and the ISW propagation direction are therefore considered in the characterization studies.
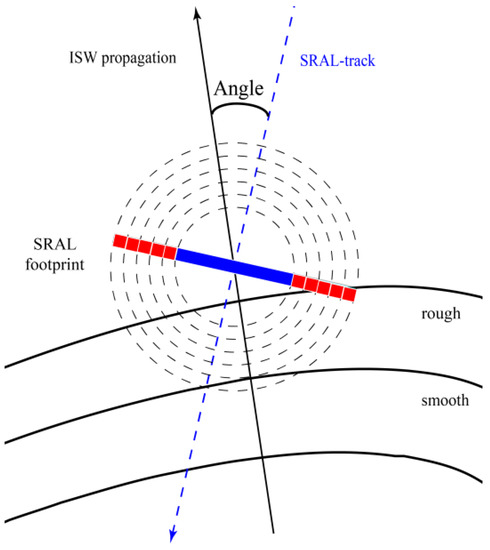
Figure 4.
Schematic diagram of geometric relationships, where the blue dashed line is the SRAL trajectory and the black arrow line is the ISW propagation direction; the circular dashed lines form a schematic diagram of the footprint; the blue part of the thick line corresponds to the footprint range at the front of the echo; and the red parts of the thick line correspond to the footprint range at the back edge of the echo.
4. ISW Characteristics Based on SAR Altimeters
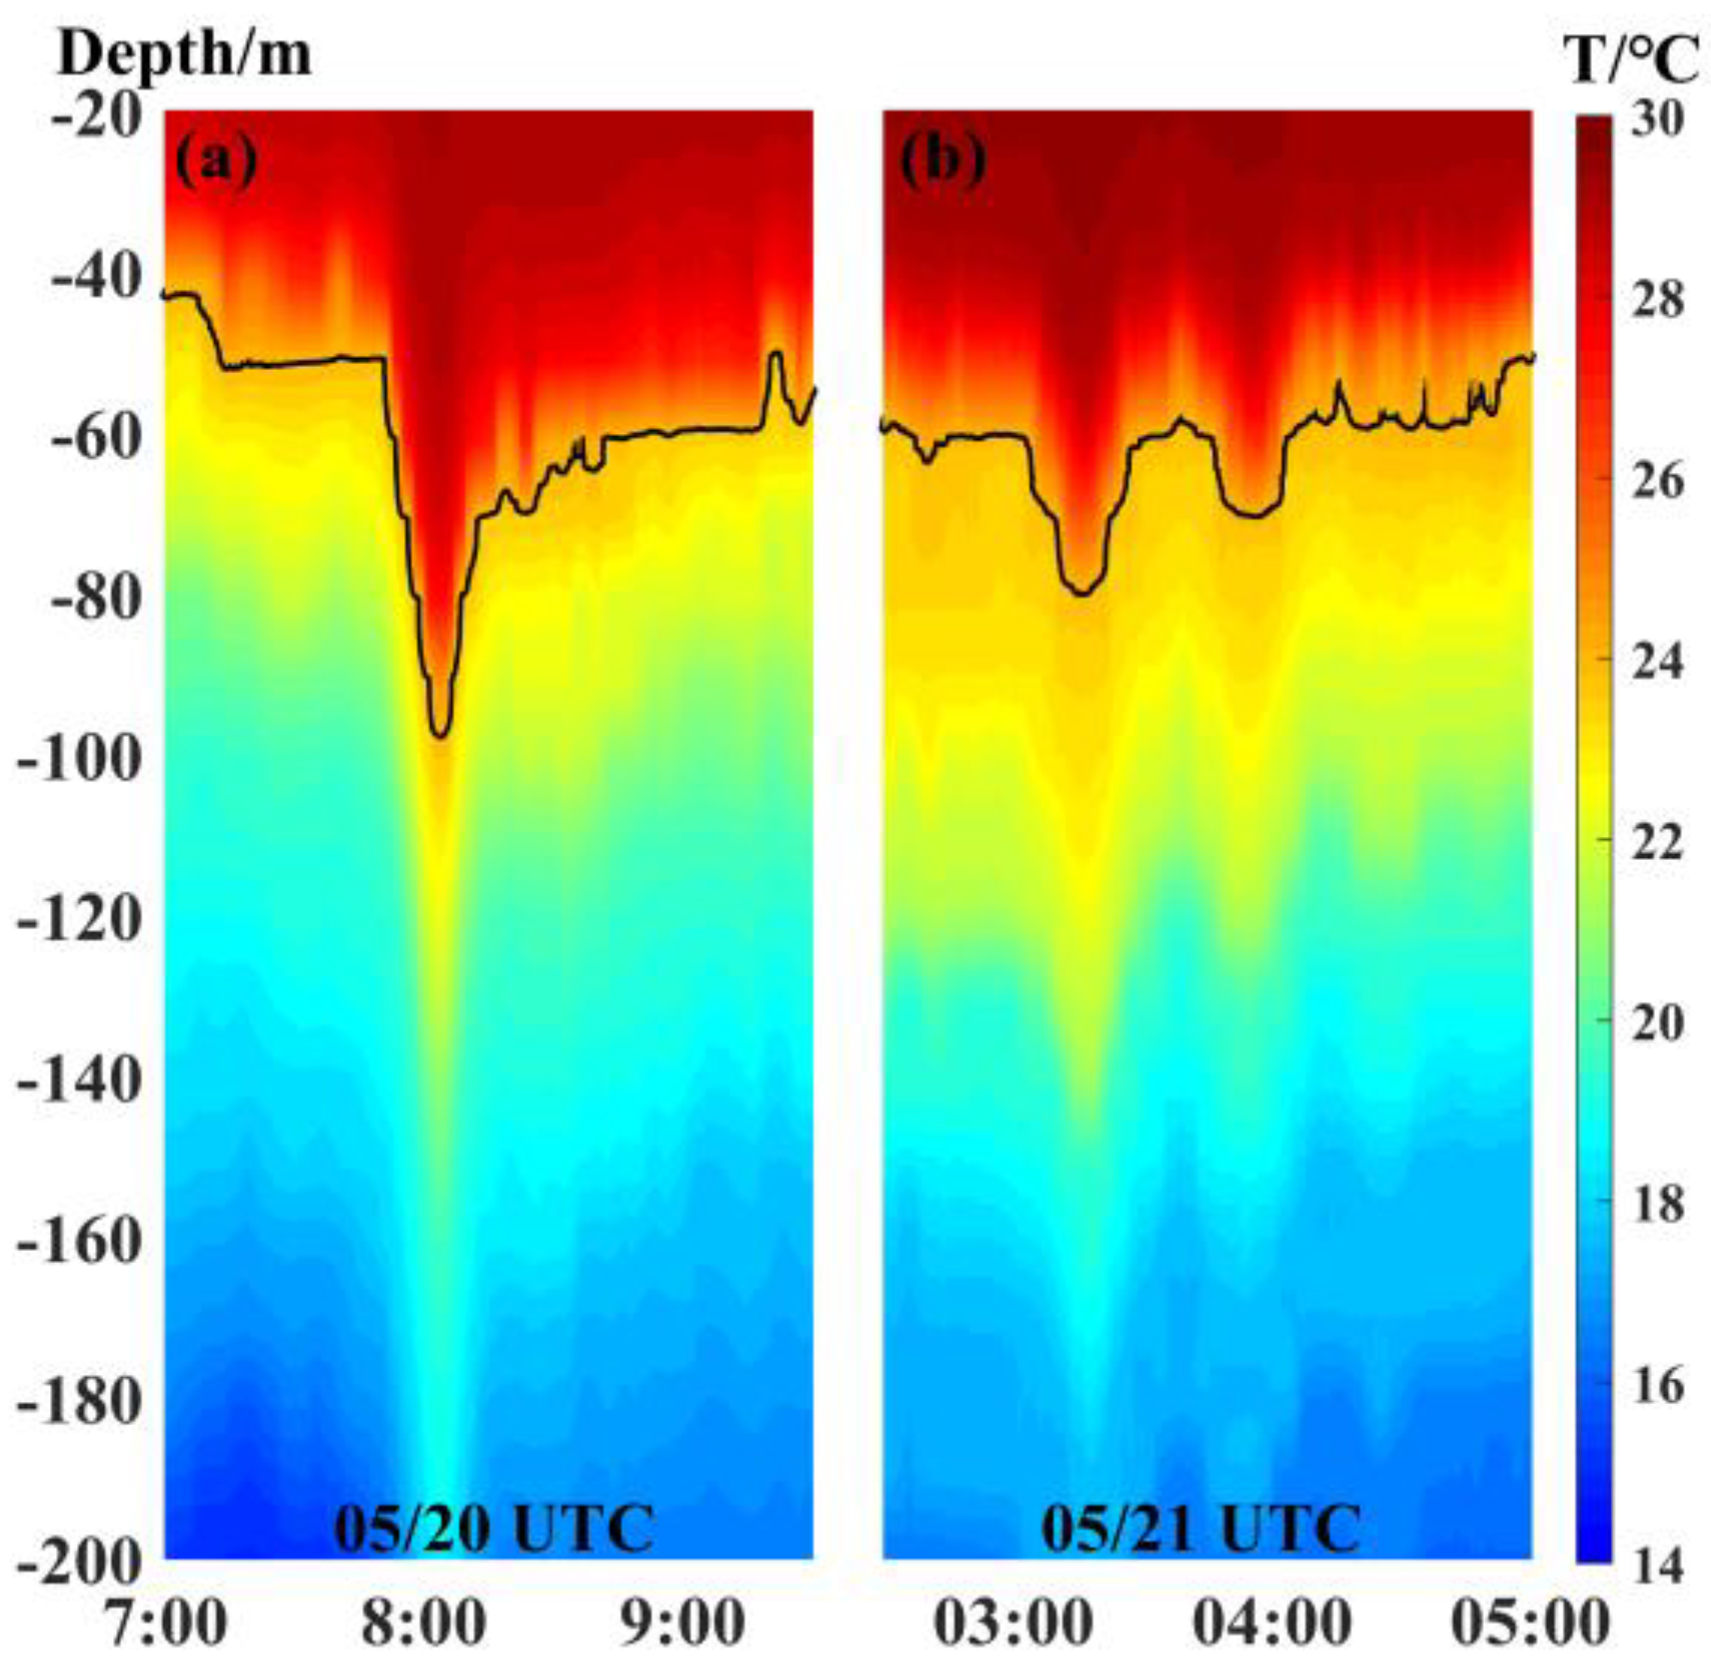
To analyze the characteristics of ISWs in SAR altimeters, it is first necessary to understand the characteristics of ISWs themselves. Figure 5 shows two ISWs observed by Zhang et al. in situ in the South China Sea [30], and the typical shape of the ISWs is shown in the figure. The amplitude of the ISW can be obtained by measuring the downward offset of the density leap layer, and usually, the propagation velocity of the ISW is in the range of 1~3 m/s. Although the ISW occurs below the sea surface, it modulates the surface sea surface, so the ISW can be observed by means of remote sensing. These sea surface variations near the ISW can be compared with the altimeter geophysical parameters retrieved by SRAL.
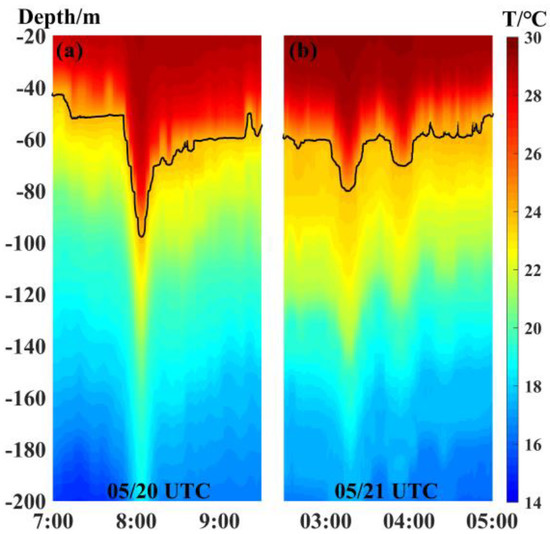
Figure 5.
In situ observation of the ISWs profile by Zhang et al. (a) Incident ISW obtained on 20 May; (b) reflected ISW obtained on 21 May. The figures indicate the depth from high to low and from shallow to deep; the different colors indicate the temperature.
In this paper, based on Sentinel-3 data from the Sulu Sea from June 2017 to October 2021, a total of 39 pairs of SRAL trajectories that intersect ISWs were obtained by screening, processing and matching. Information related to the ISW wave crest line, the locations of the smooth and rough region boundaries, and the width and propagation direction of the leading edge of ISWs were extracted from the matched images according to the method described in Section 3 (Appendix A). Information related to changes in , SWH, and SSHA in the ISW region in the corresponding SRAL data was recorded.
4.1. Variation Characteristics
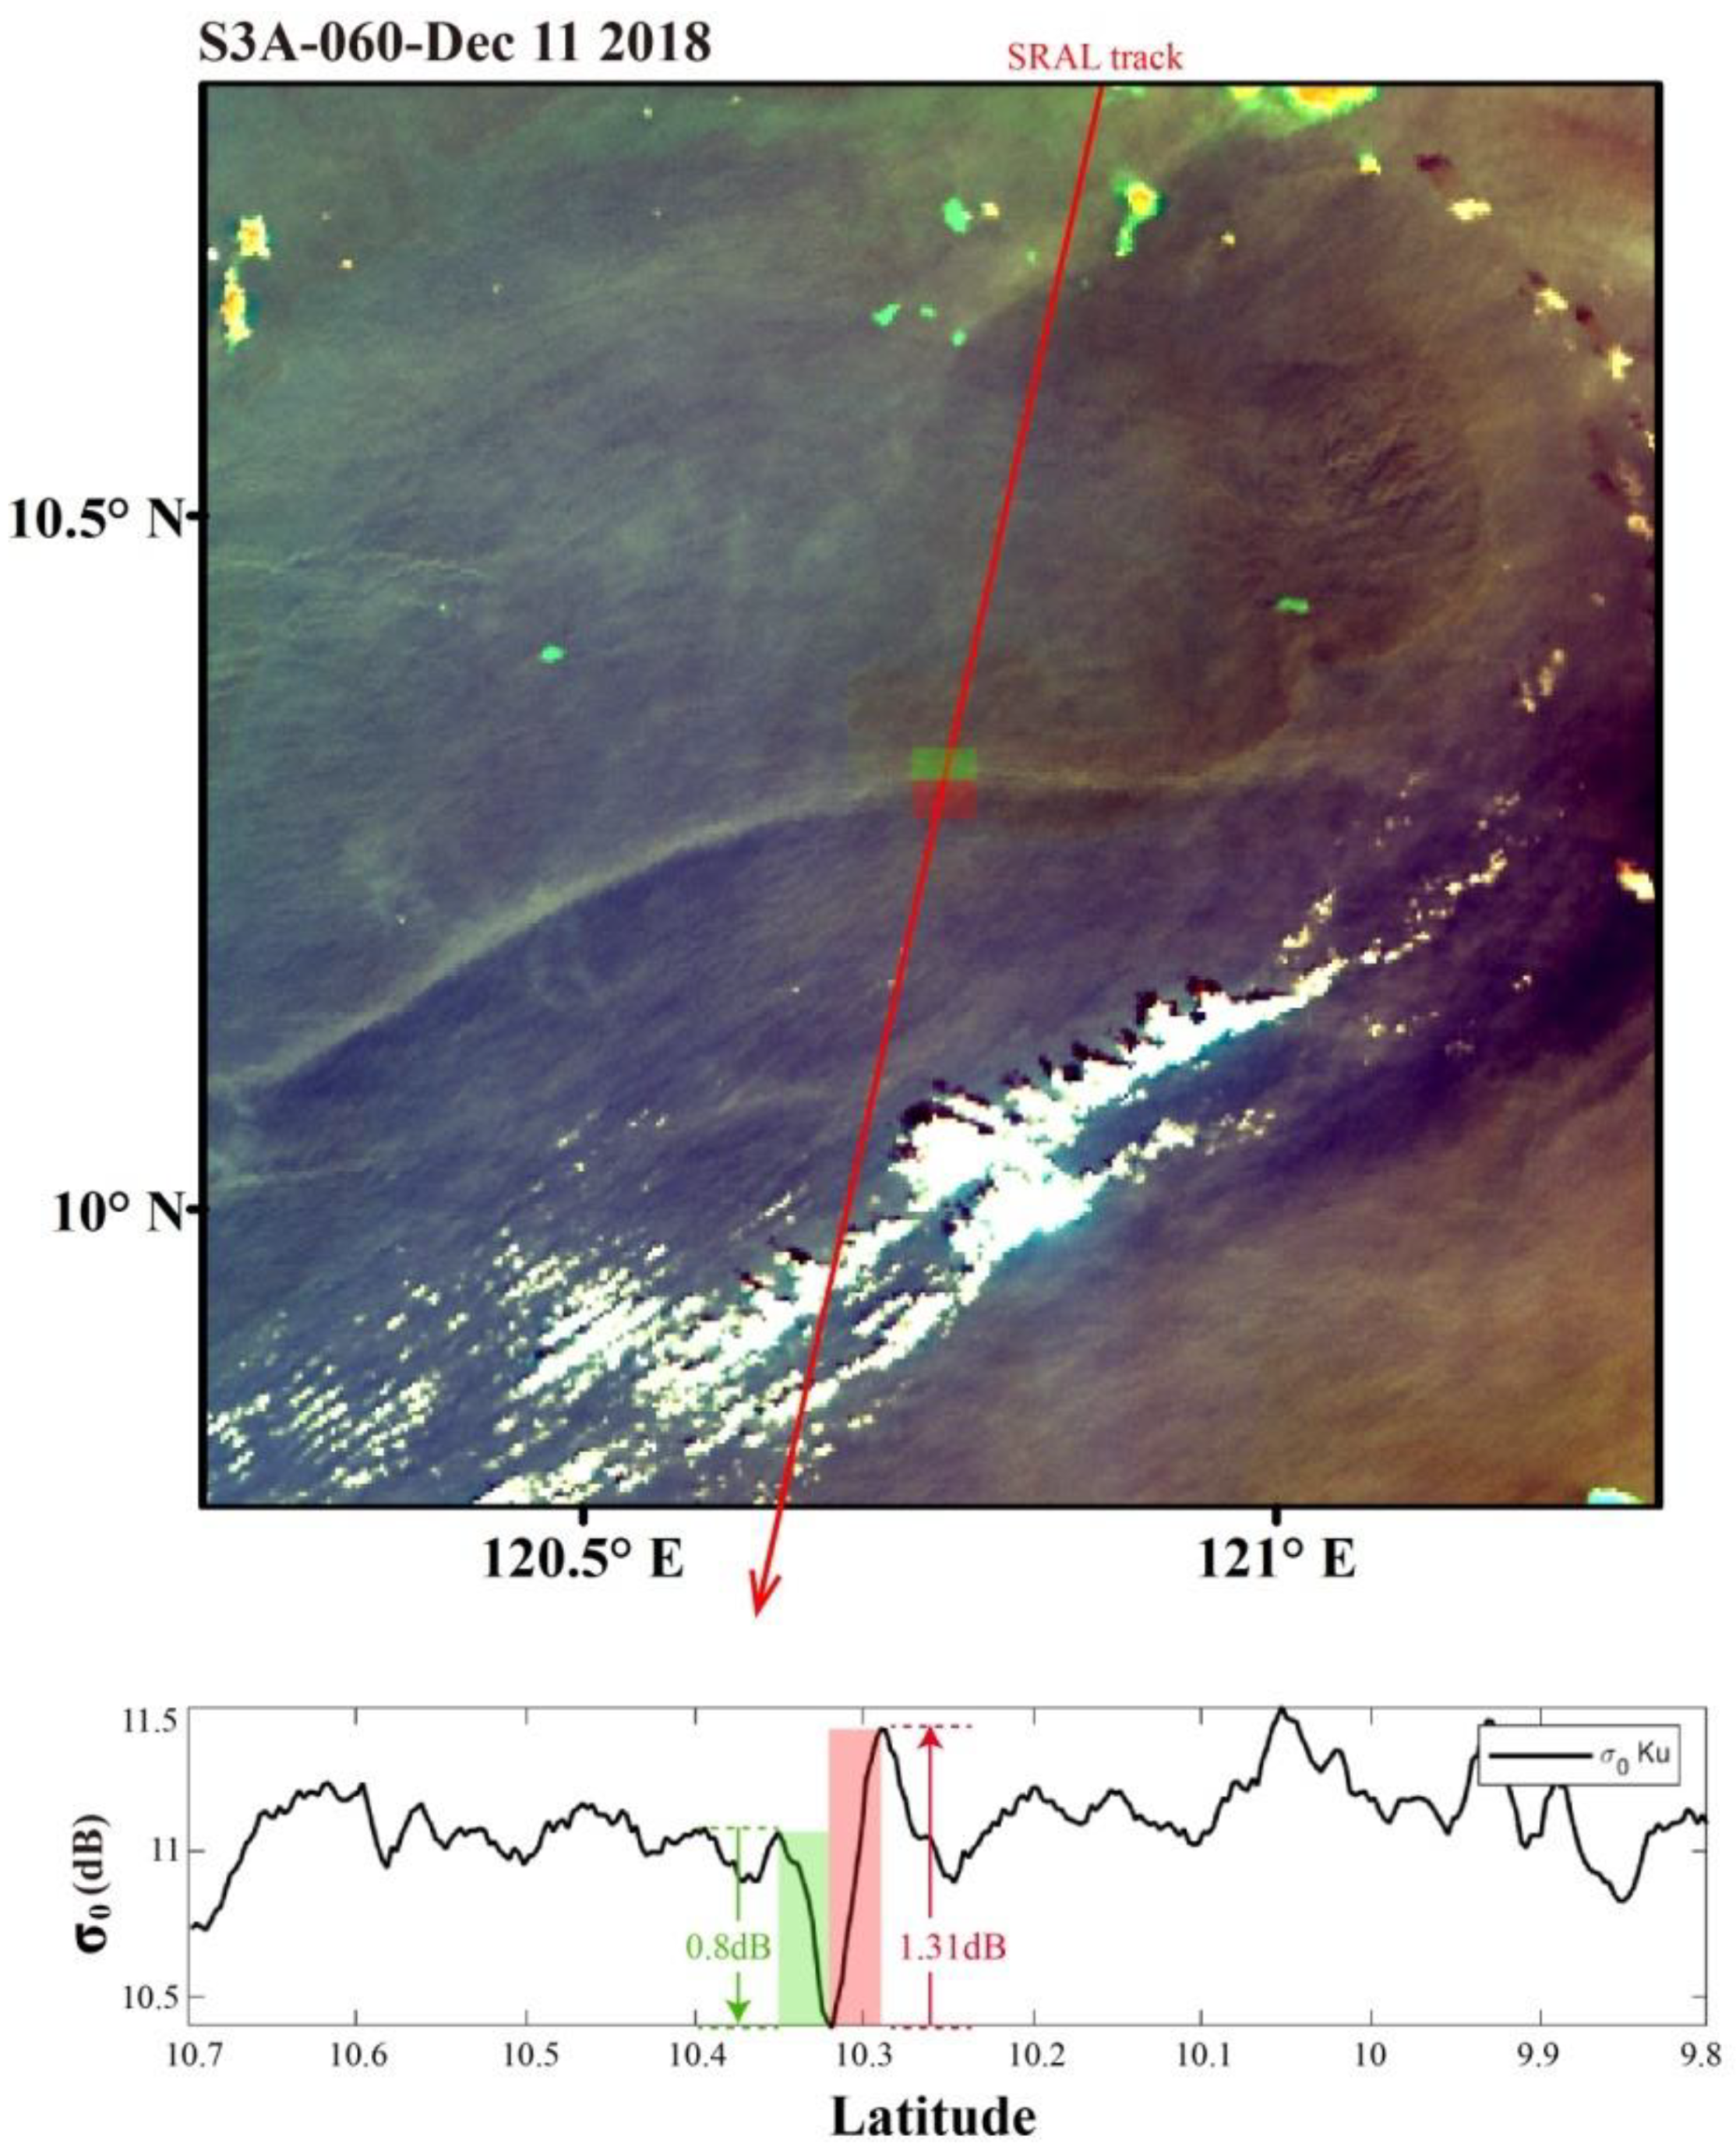
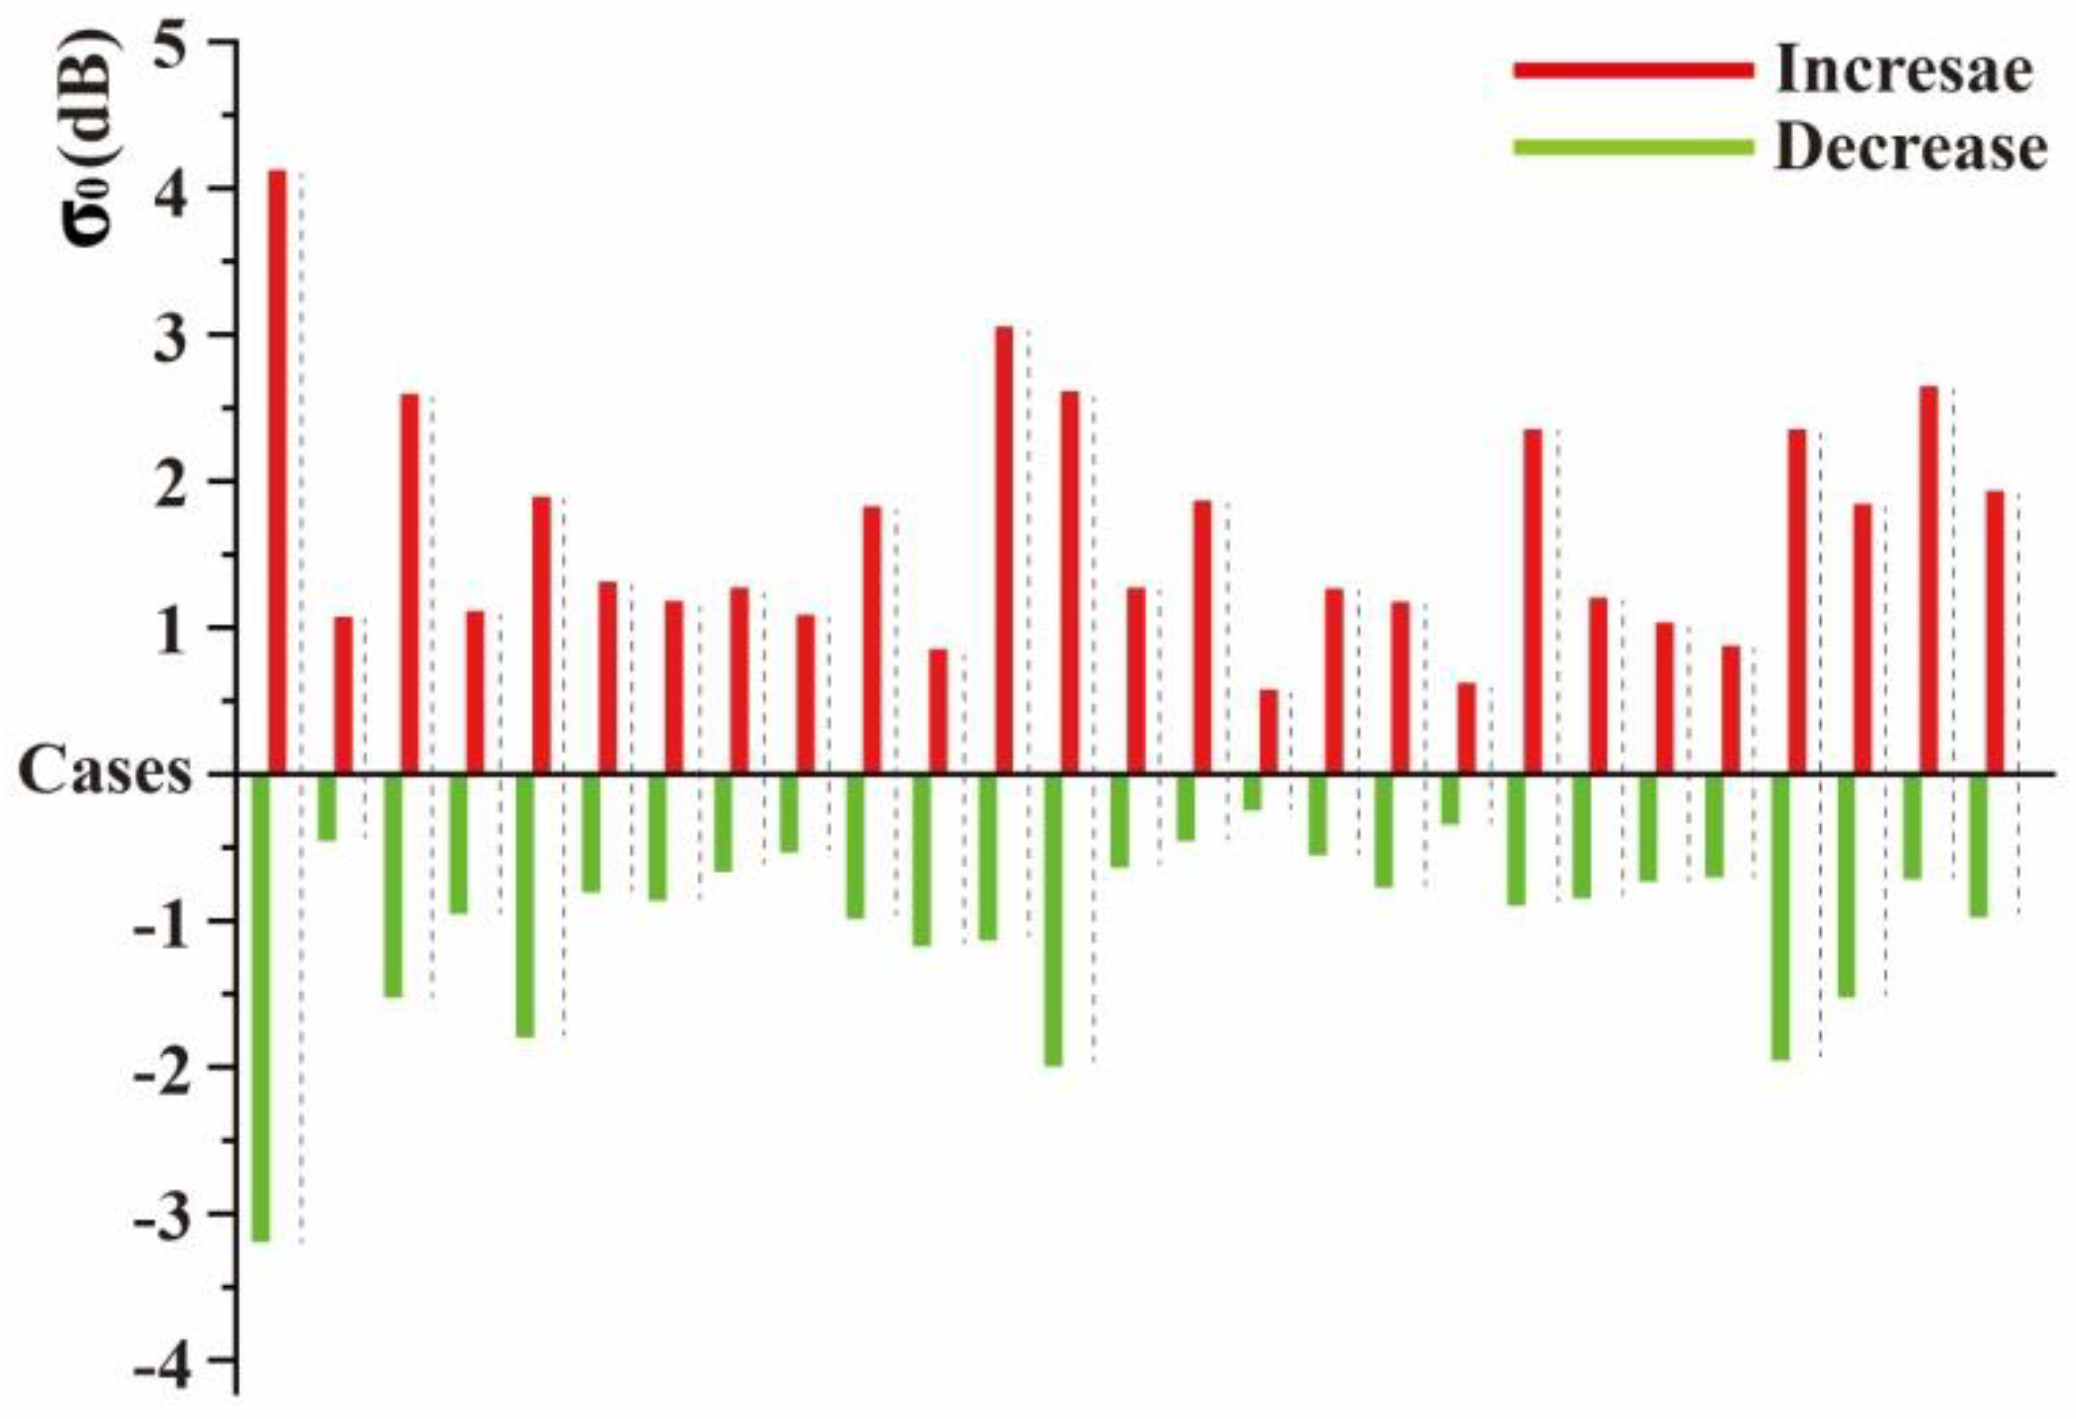
is used to indicate the intensity of the electromagnetic wave signal received by the altimeter. The analysis of this parameter enables us to investigate how the sea surface variation caused by ISWs affects the electromagnetic wave signal. Out of 39 pairs of cases in which the SRAL intersects an ISW, 27 cases clearly show that is modulated by the ISW. In Figure 6, as an example, the scene image was acquired at 01:40 (UTC) on December 11, 2018: it is clearly observed from the corresponding SRAL data that in the ISW region, decreases by 0.8 dB from the smooth state of the background after being modulated by the ISW; it then increases by 1.31 dB after reaching a very small value; and finally, it returns to the initial value in the smooth state. Figure 7 shows the changes in the ISW leading wave in 27 examples, and a greater number of increases are observed than are decreases; moreover, the maximum increase is approximately twice the largest decrease.
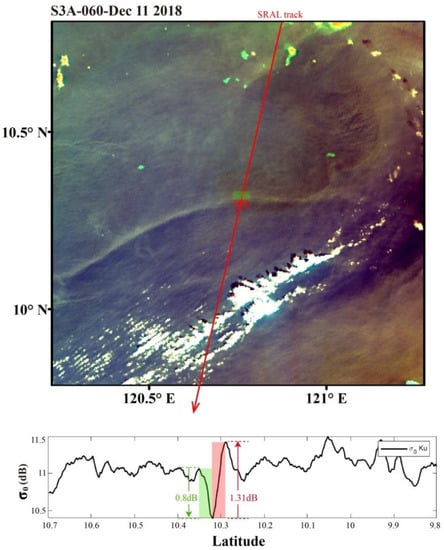
Figure 6.
Simultaneous Sentinel-3 SRAL and OLCI results on 11 December 2018, at 01:40 (UTC) and observations of 20 Hz in the Ku-band in the orbital direction; the regions where is modulated by ISWs are marked with red and green shading, corresponding to the labels in the OLCI image.
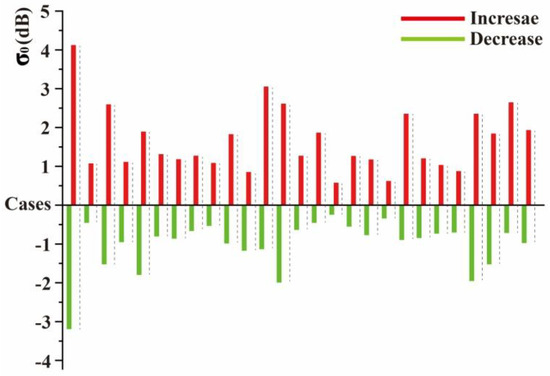
Figure 7.
The specific value changes in the 27 cases in which is clearly modulated by ISWs, with dashed lines separating the cases.
4.2. SWH Variation Characteristics
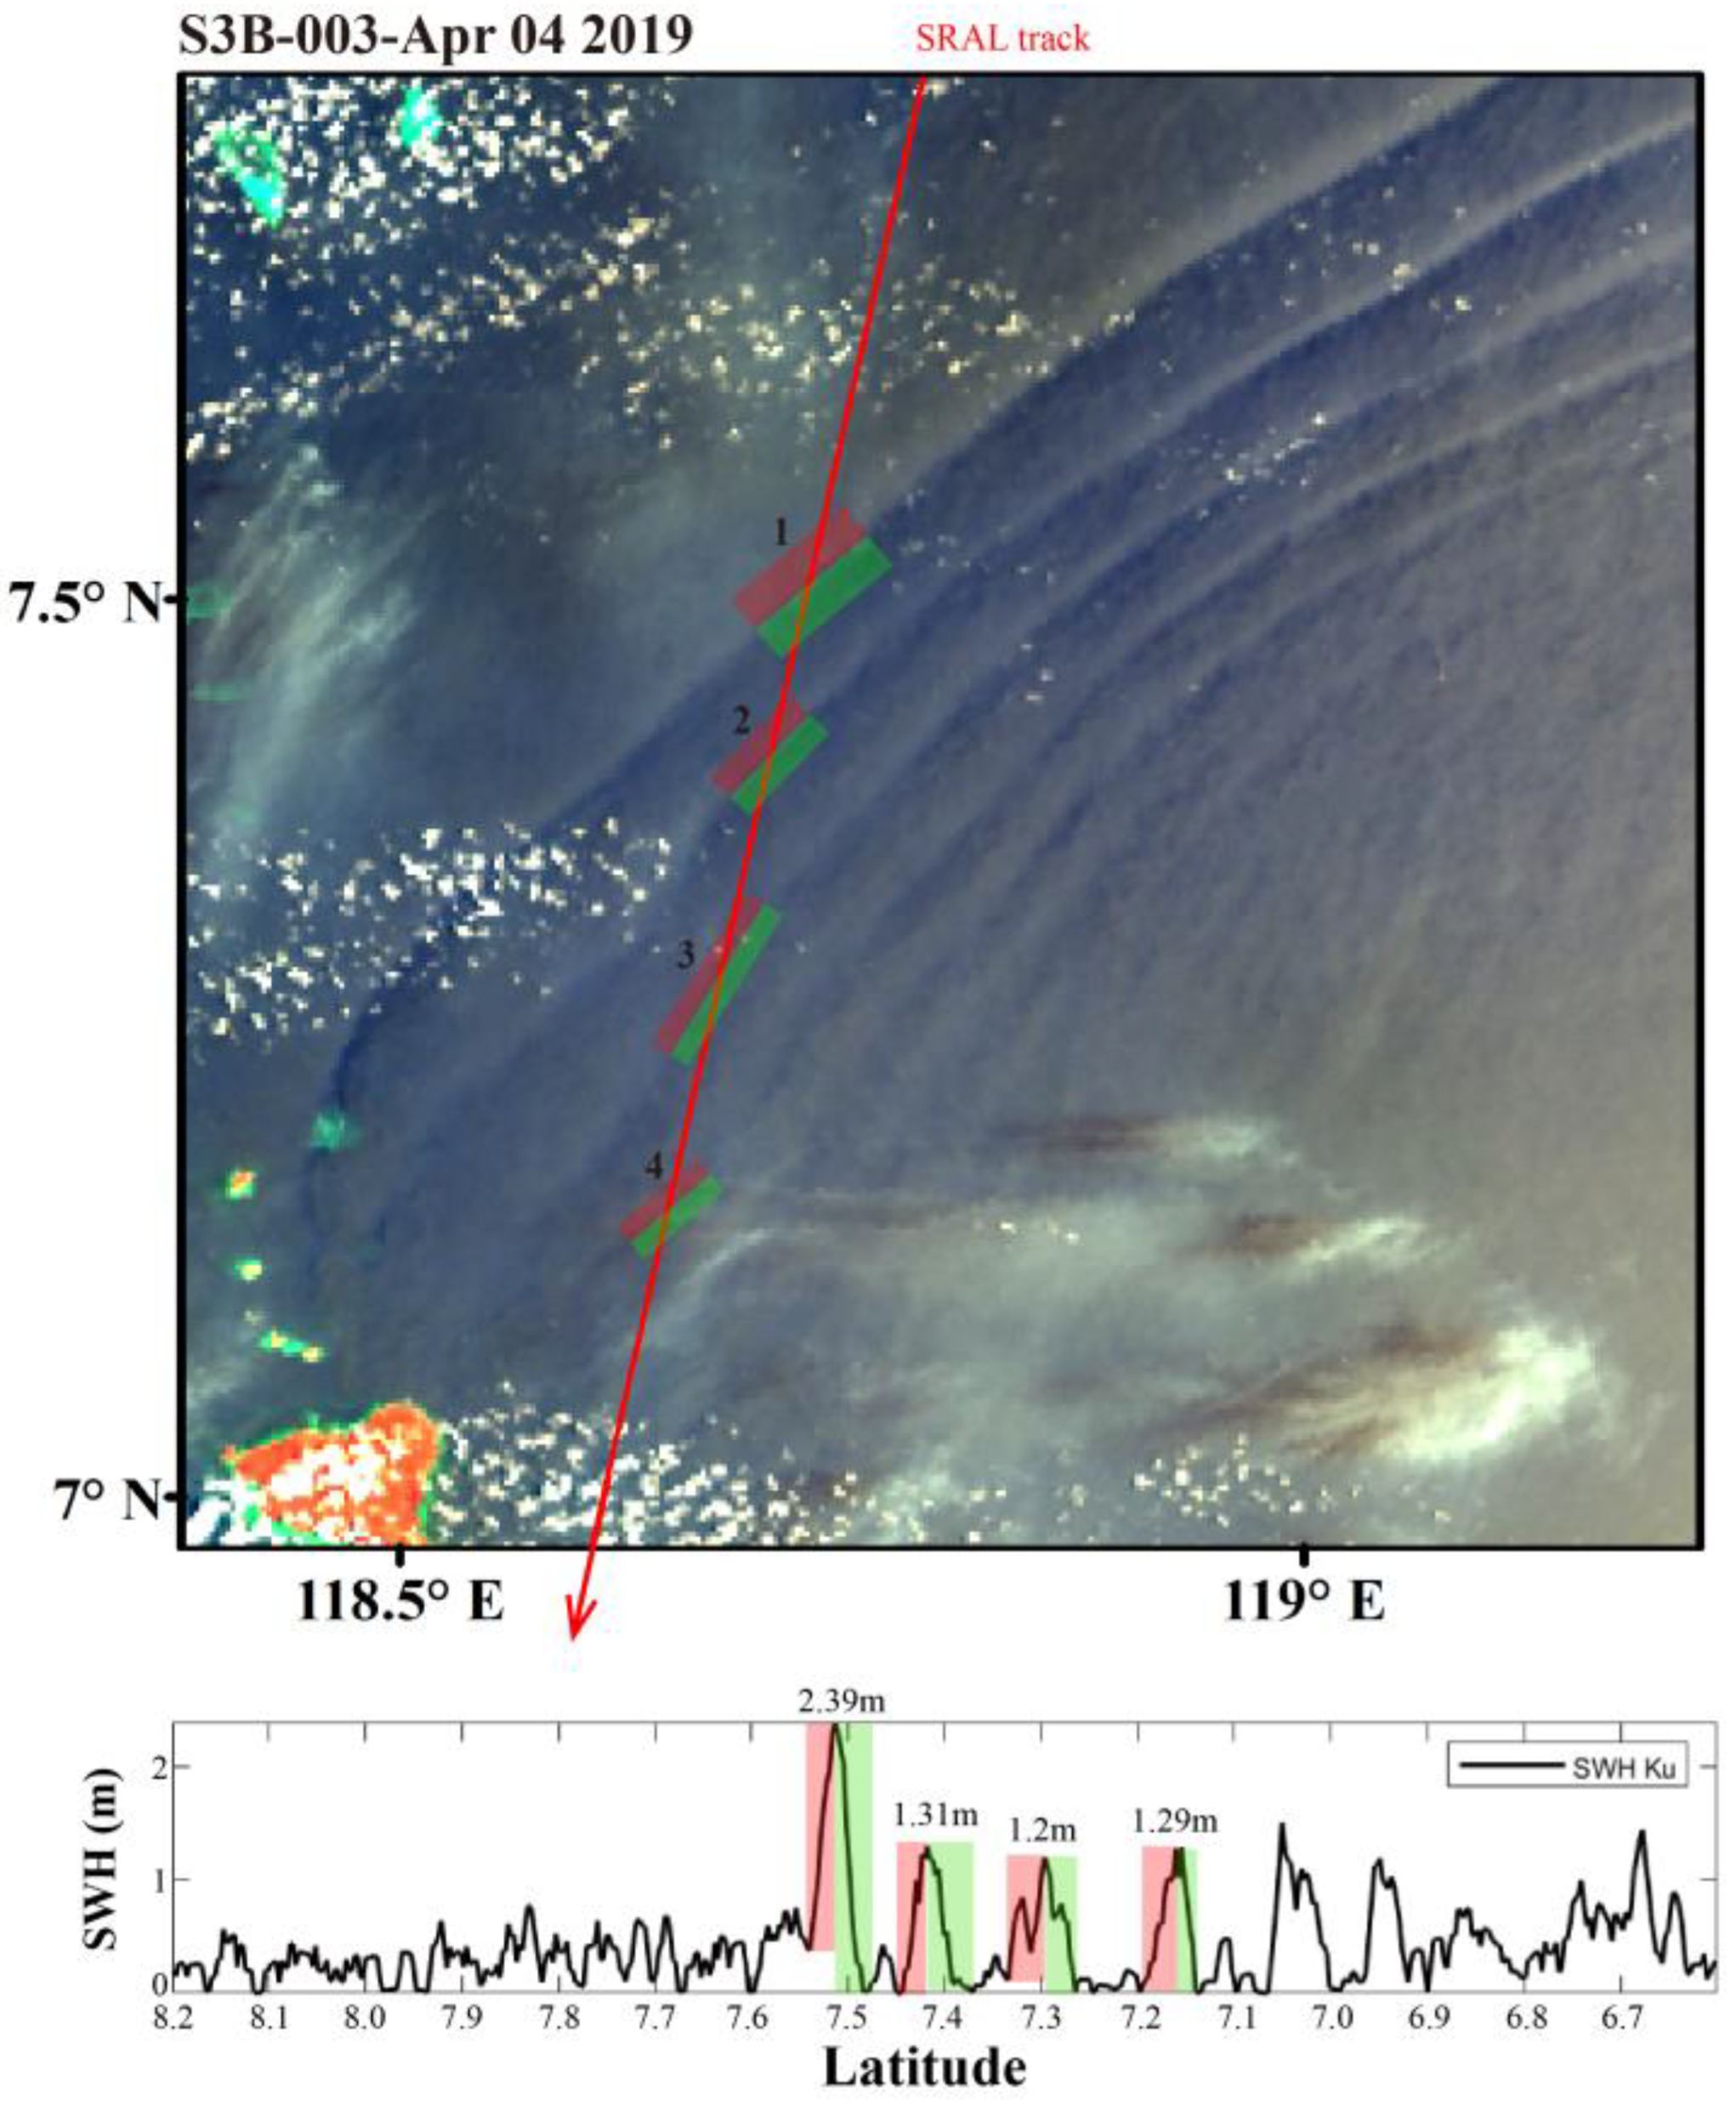
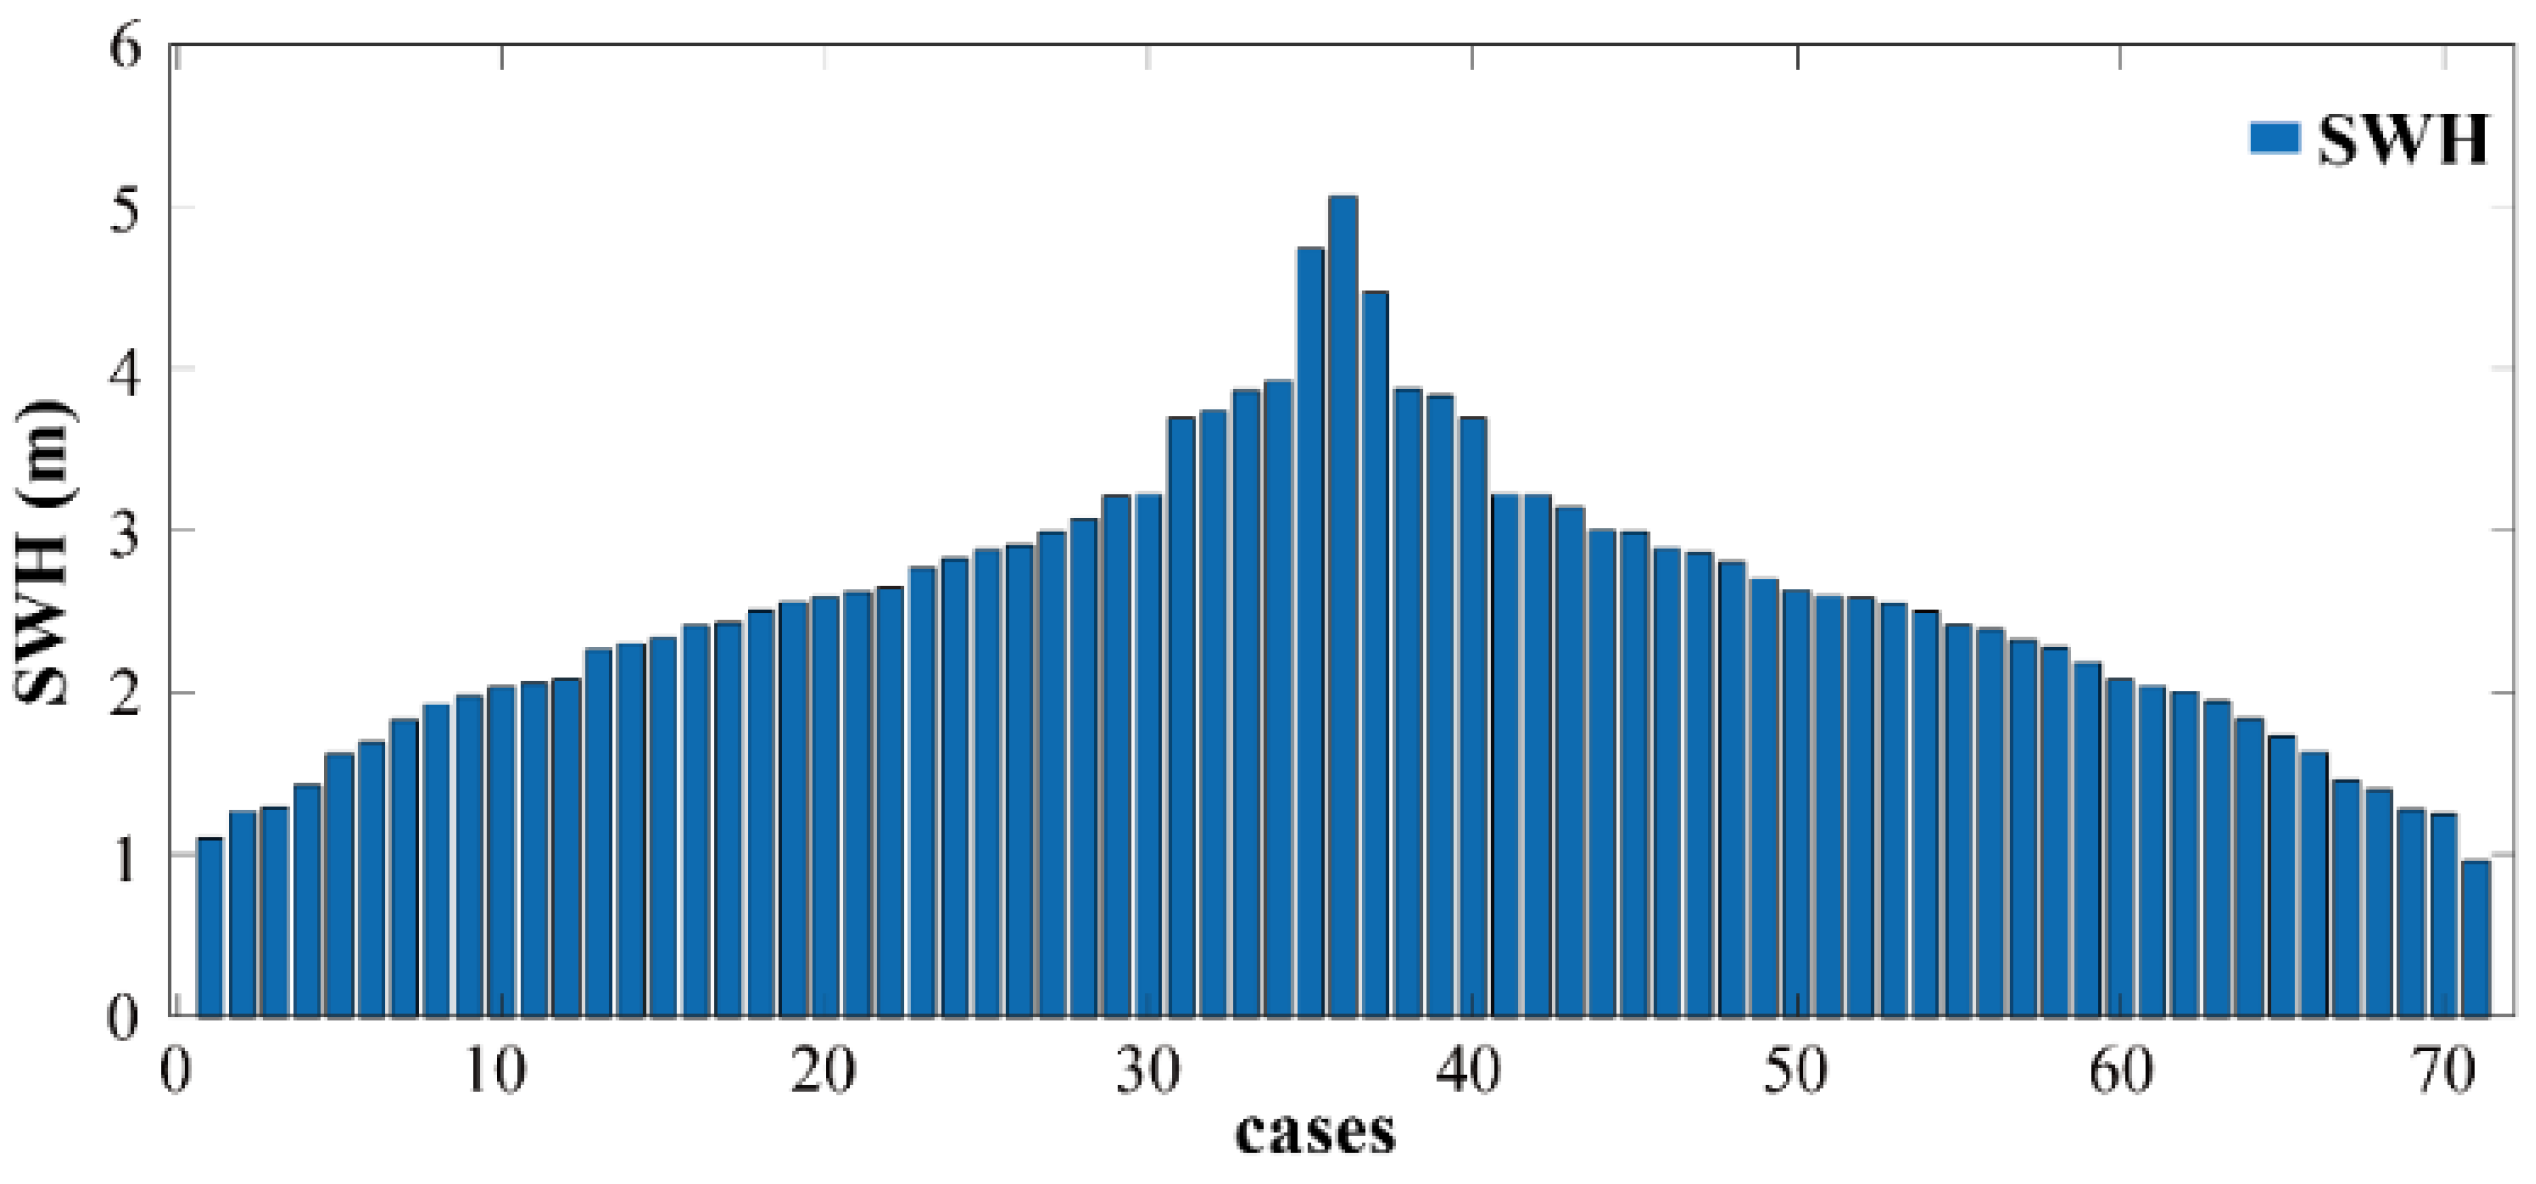
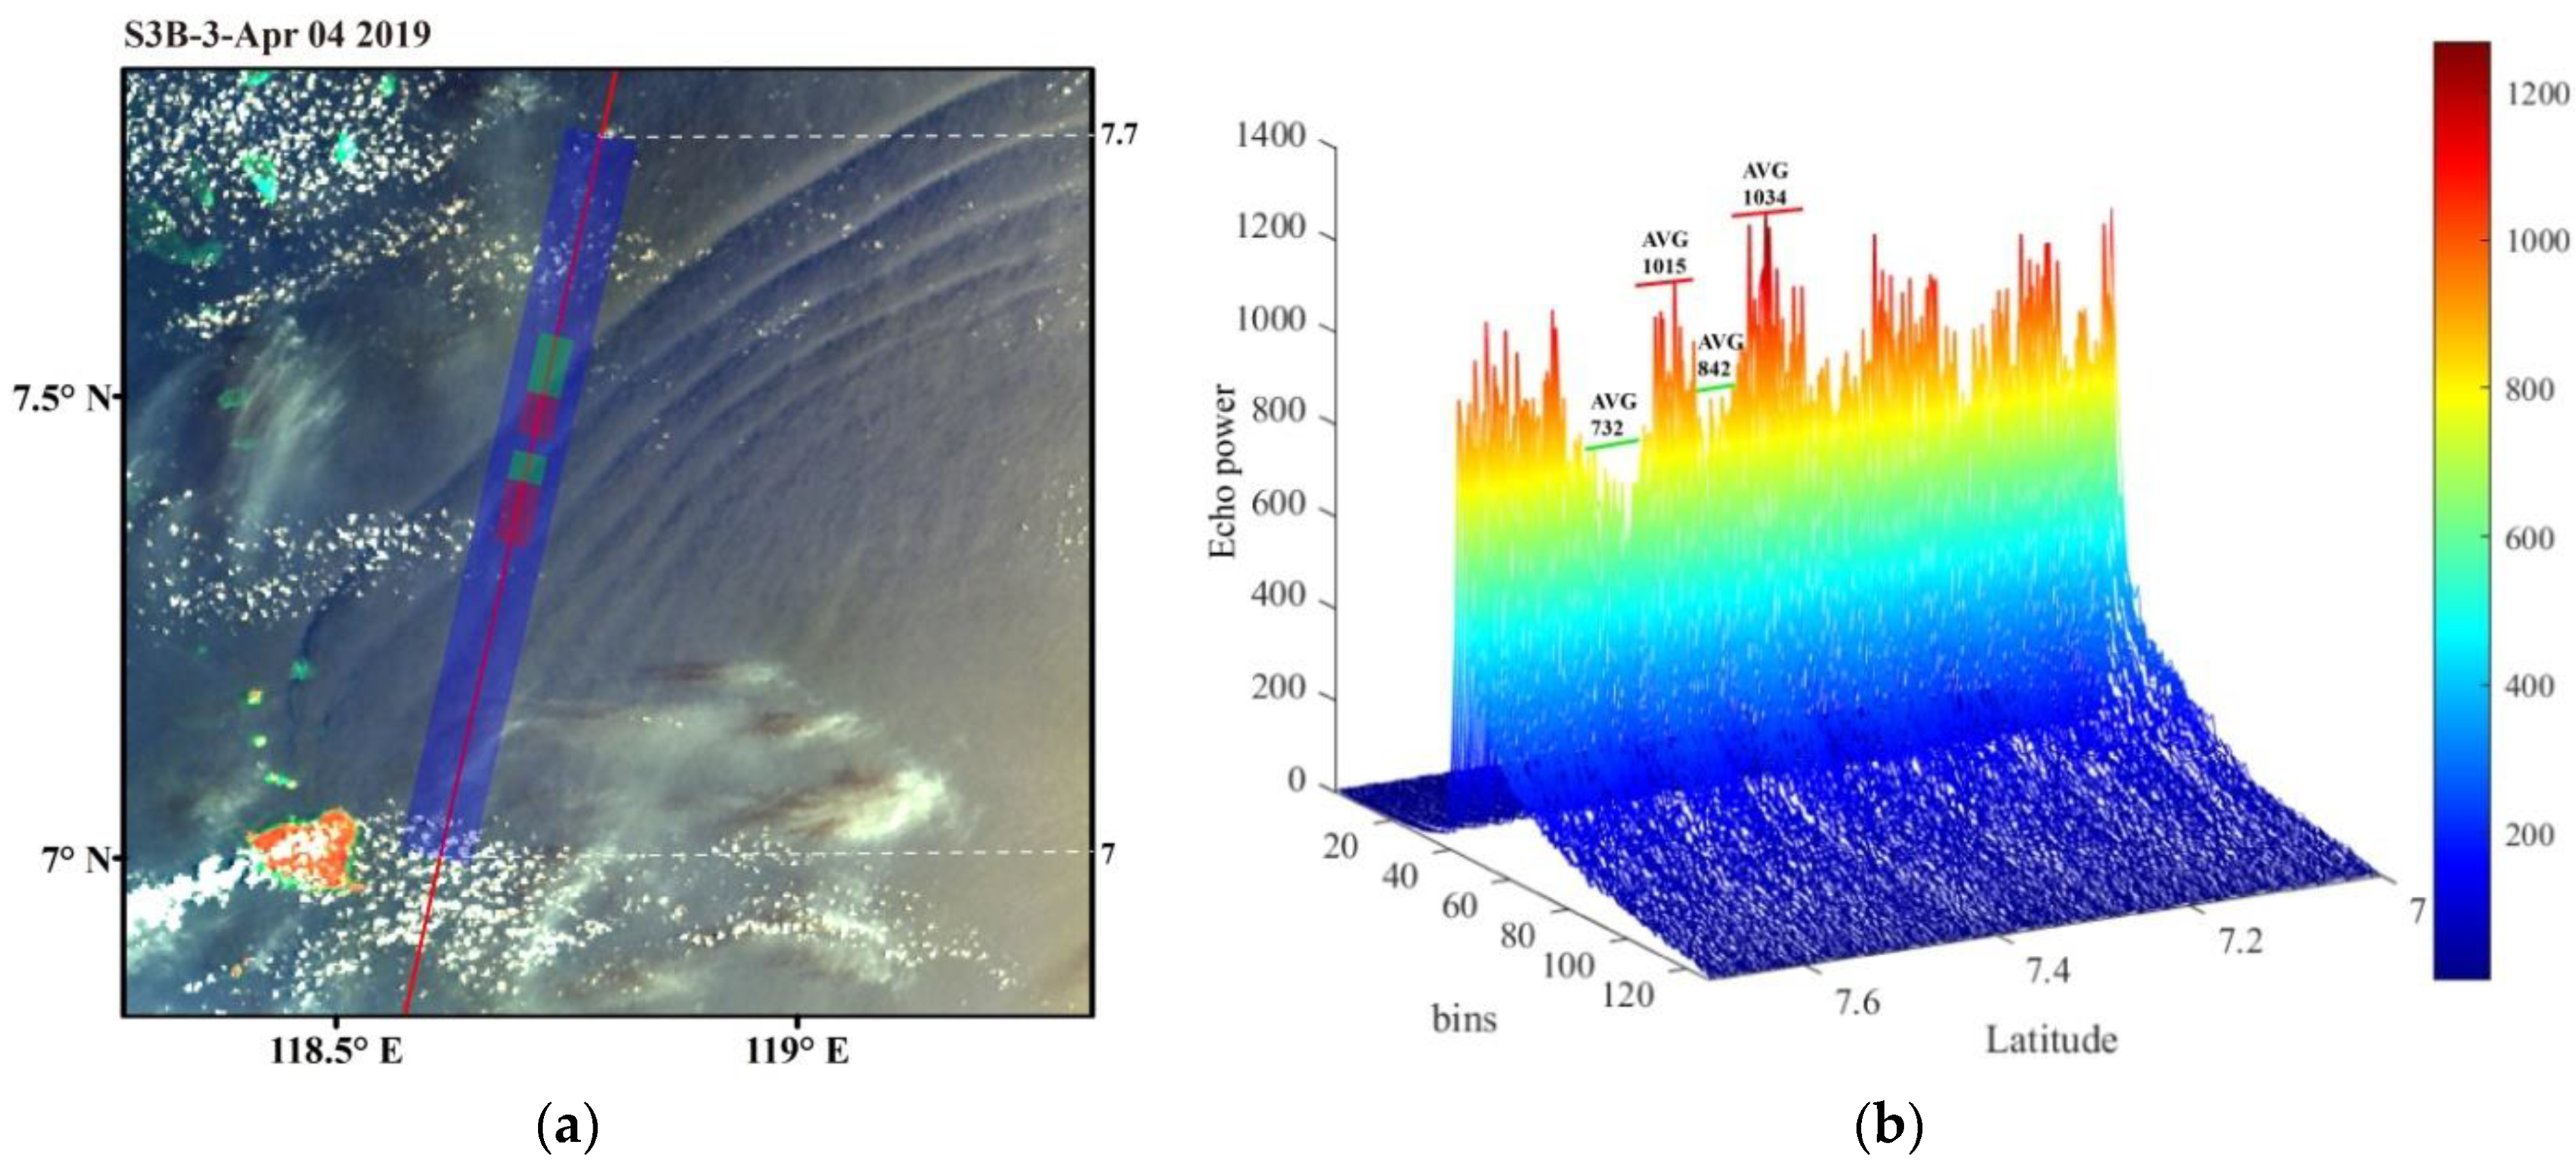
The SWH is an important parameter of the statistical distribution of waves [30]. Since ISWs have convergence and divergence effects on microscale waves during propagation and affect the sea surface roughness, they theoretically change the SWH in the field of view. In 20 of the 43 cases analyzed in this paper, the SWH is clearly modulated by ISWs. In the example shown in Figure 8, the SRAL trajectory acquired at 01:46 (UTC) on 4 April 2019, intersects the ISW series, and it is clear that at least four isolines were observed by the SRAL; this is corroborated by the SRAL data, which are clearly modulated by the ISWs at the corresponding locations. Figure 9 shows the maximum SWH of all isolines in the 20 cases, with an average value of 2.59 m.
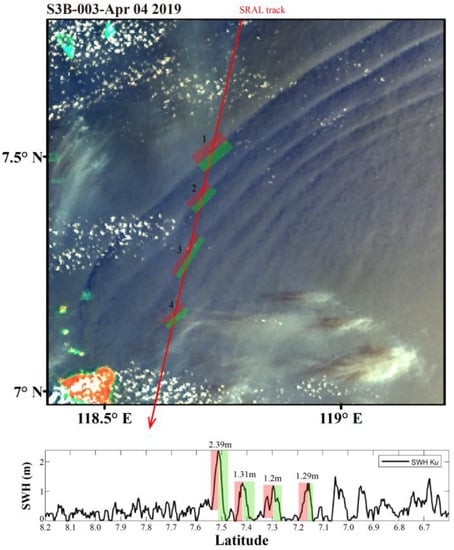
Figure 8.
Simultaneous Sentinel-3 SRAL and OLCI observations on 4 April 2019, at 01:46 (UTC): the rough and smooth regions of isolines are marked with red and green shading and observations of 20 Hz SWH in the Ku-band in the along-track direction; and the four locations where SWH is significantly modulated by ISWs have been marked with red and green shading in the along-track direction at the peaks of ISWs 1~4 in the OLCI image.
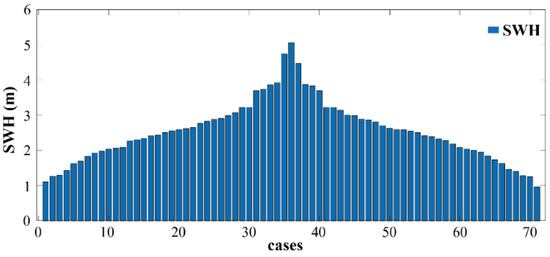
Figure 9.
The maximum SWH of 71 isolated subwaves in 20 cases.
4.3. SSHA Variation Characteristics
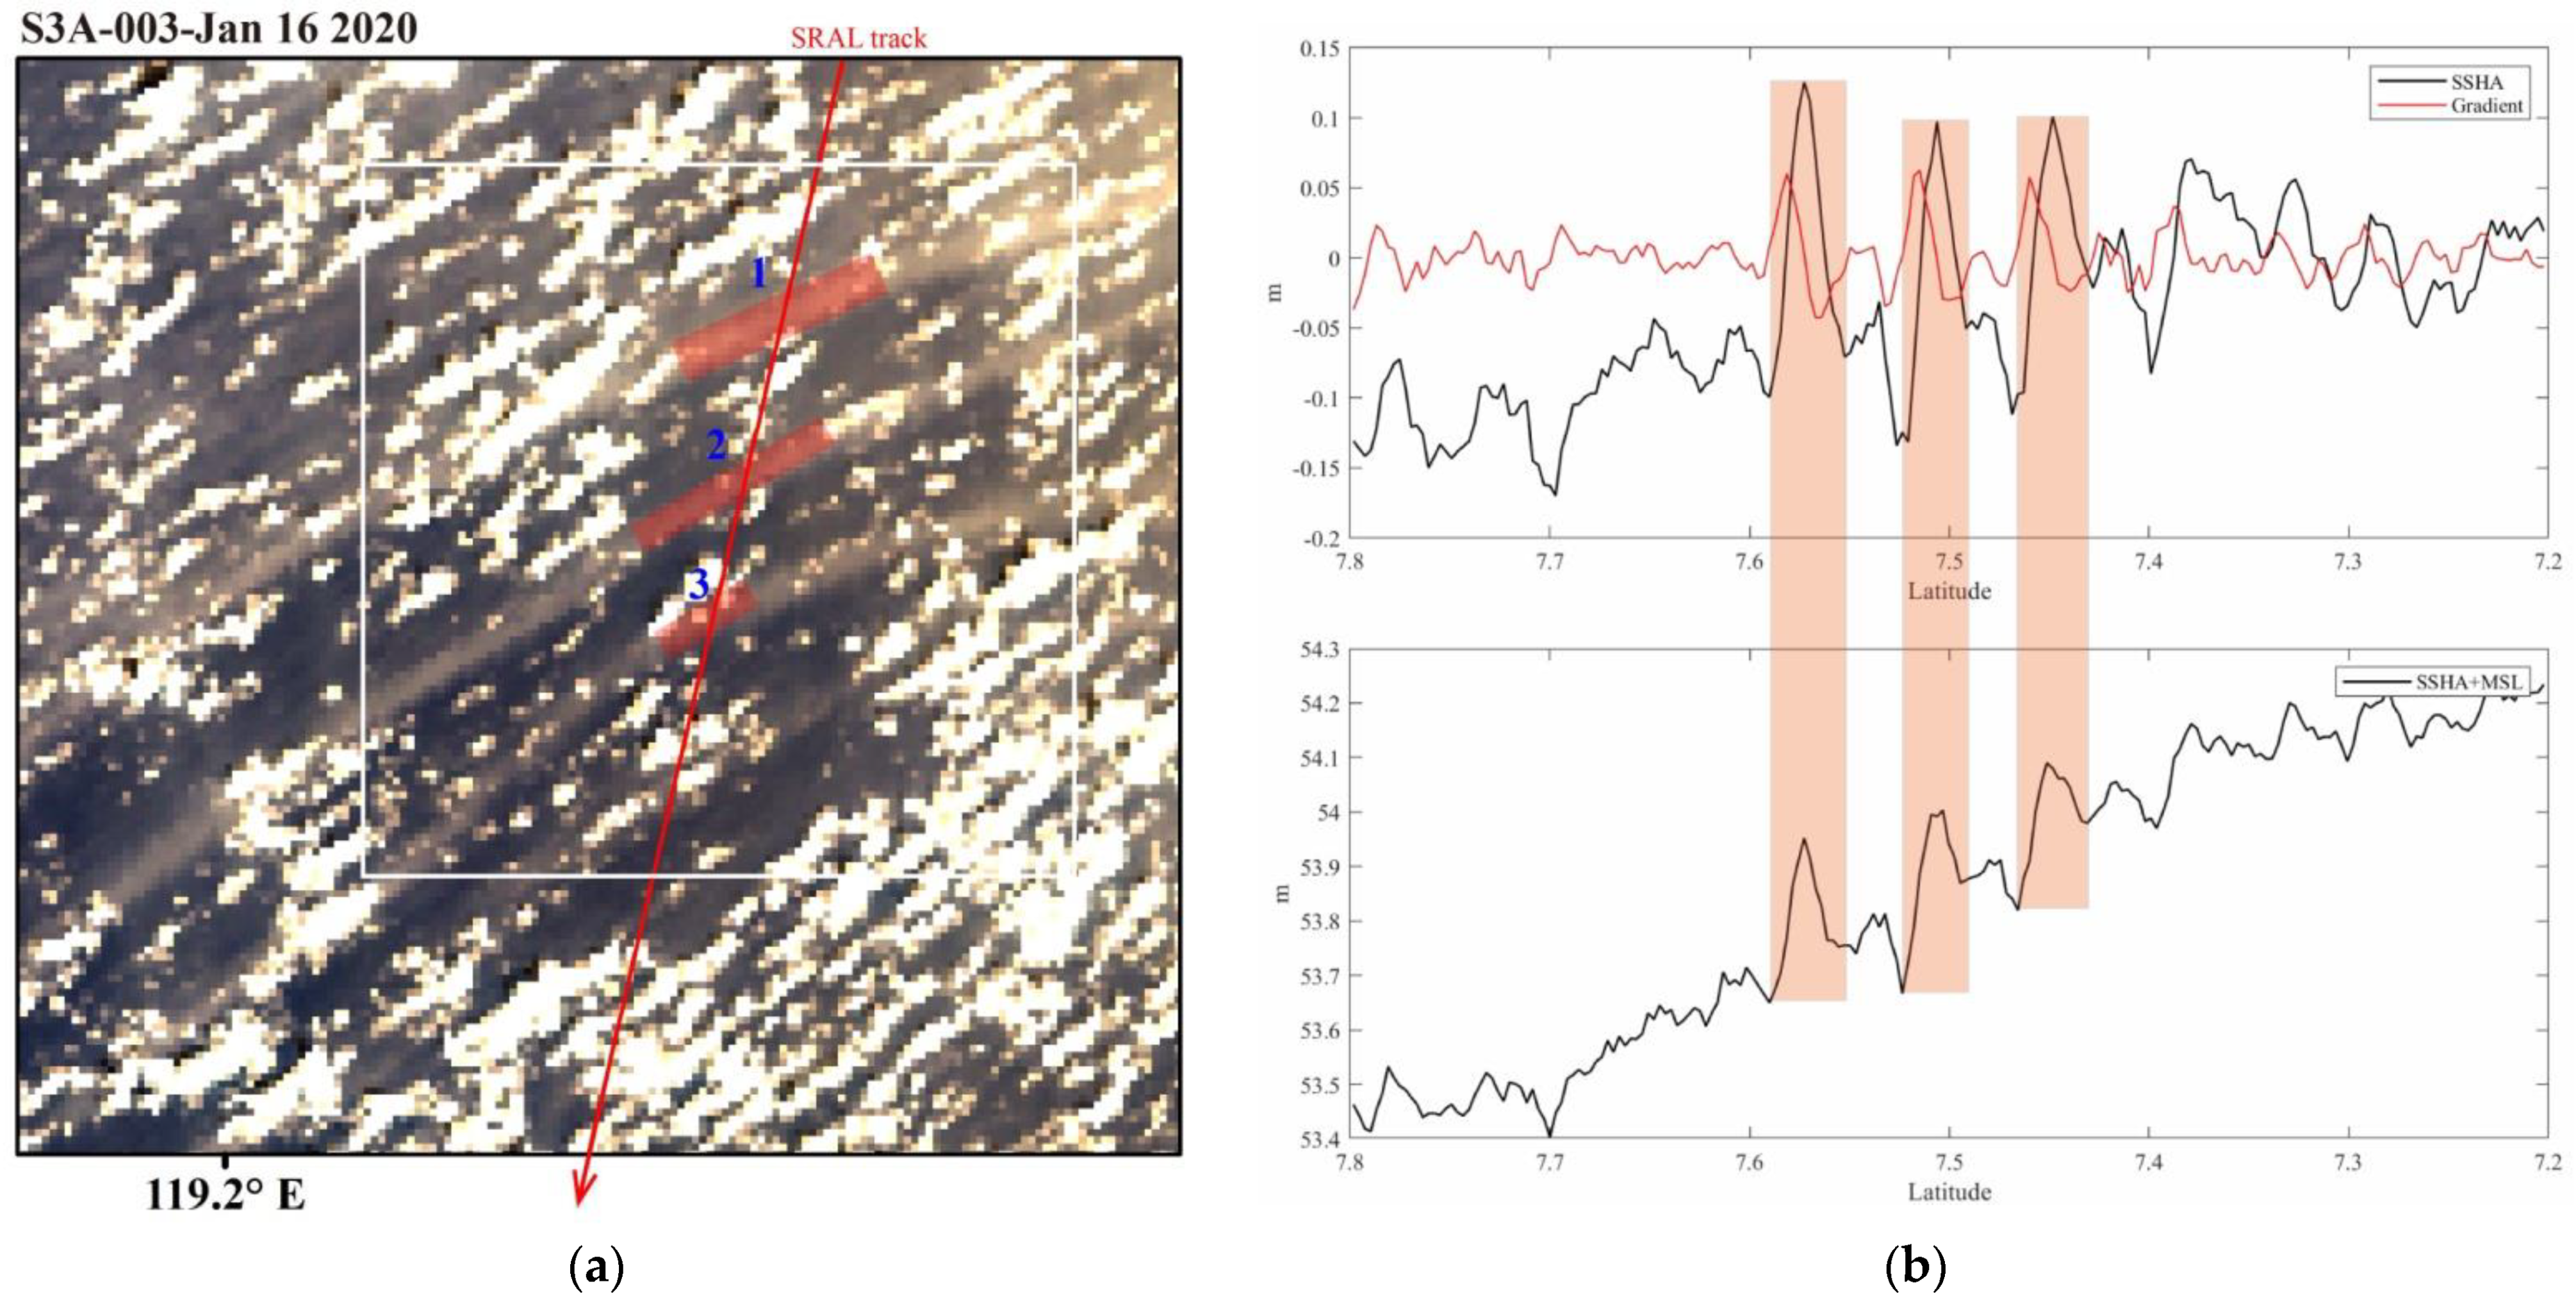
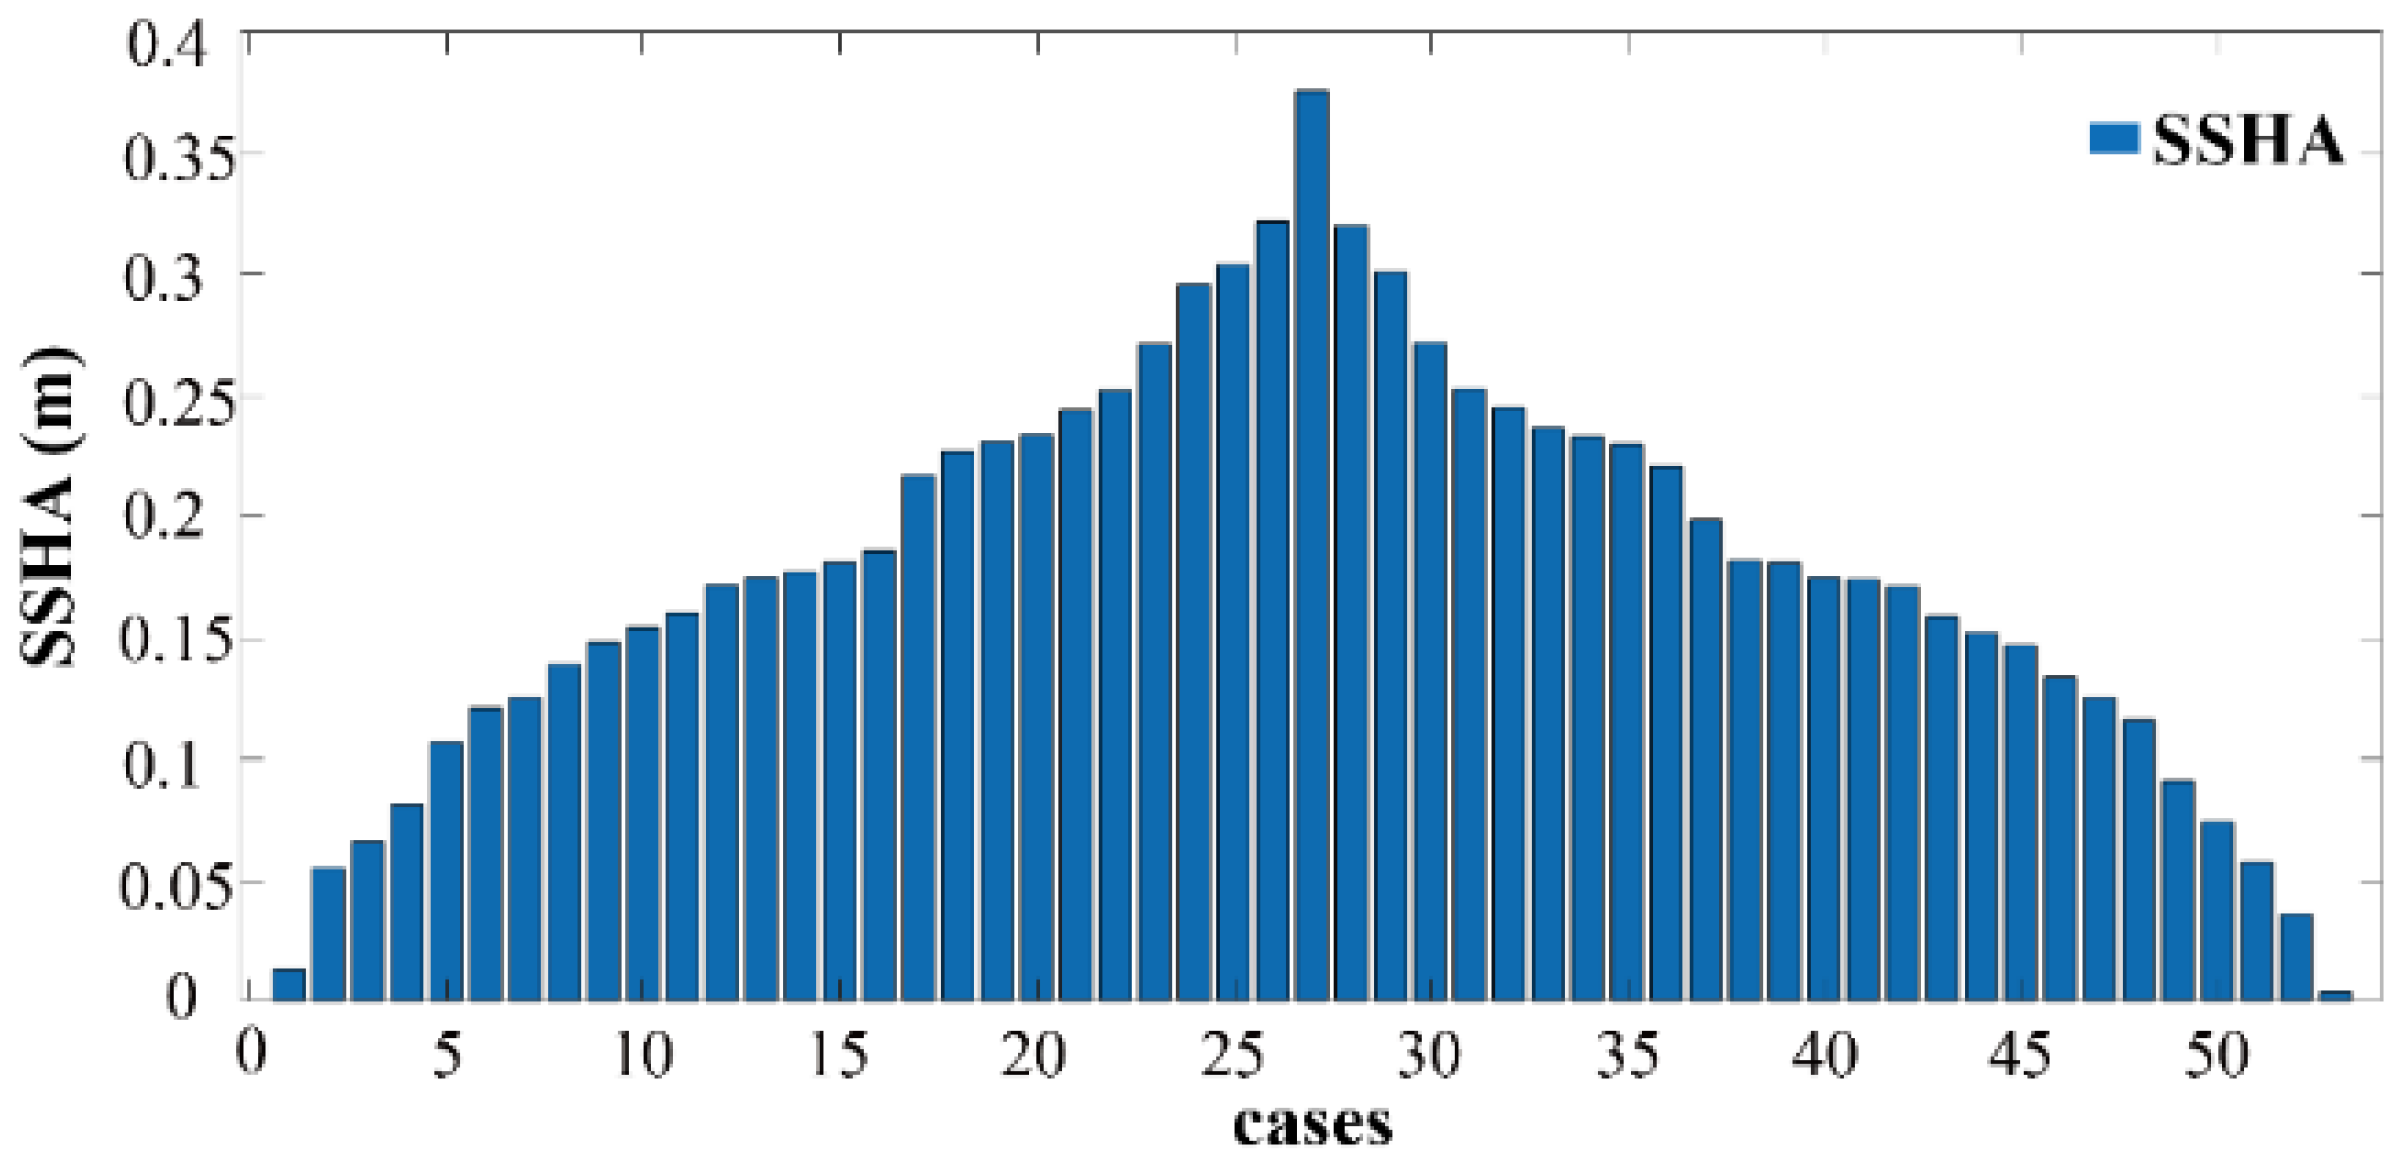
The sea level anomaly is the difference between the sea surface height and the mean sea surface elevation, and the change in the vertical height of the sea surface caused by ISWs can be assessed based on this parameter. In this paper, there are 20 cases in which the SSHA changes significantly when ISWs are encountered, as shown in Figure 10. This figure was acquired on 16 January 2020, at 01:44 (UTC), and although this image contains some clouds, the ISWs can still be identified; moreover, the SSHA changes significantly near the location of each isolated subwave, and the trend of its gradient change is almost the same. Adding the SSHA of this case to the mean sea level (MSL) also reveals the unique characteristics of the ISW-induced variability. In this paper, we also determine the peak SSHAs and their distributions for the 53 wave peaks in Figure 11; however, the peak SSHAs are almost an order of magnitude smaller than the SWHs, and their average value is only 0.179 m, with most values in the range of 0.1–0.3 m.
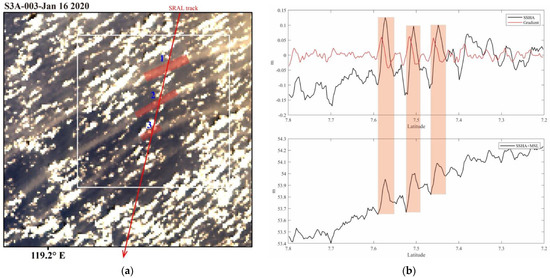
Figure 10.
(a) Simultaneous Sentinel-3 SRAL and OLCI observations on January 16, 2020, at 01:44 (UTC): only the rough region of isolines is visible in the figure. (b) The upper panel shows the black line for the 20 Hz SSHA observation in the Ku-band along the track direction, and the red line indicates the gradient of SSHA variation; the lower panel is the result obtained by summing SSHA and mean sea level (MSL). All the ISW regions are marked with red shading, corresponding to the peaks of 1~3 ISW waves in (a).
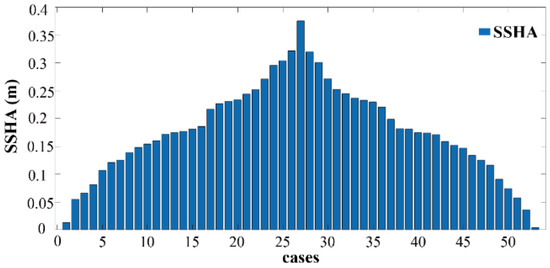
Figure 11.
The maximum SSHAs for 53 subwaves in 20 cases.
5. Discussion
In Section 4, the significant characteristics of the three geophysical parameters modulated by ISWs, namely, SRAL-, SWH, and SSHA, are identified. Notably, SSHAs are consistent with the variation in the vertical heave of the sea surface caused by ISWs, and the measured values are within a reasonable range. However, the variations in and SWH need to be explained in the context of the sea surface variation caused by radiation convergence and divergence, and the reasons for the particular variations in and SWH are explored in this section.
5.1. Analysis of Change Characteristics
The in the secondary data used in this paper is controlled by the AGC, and the retracker provides a small correction to to help obtain accurate results. The typical characteristics of the variation in are shown in Figure 5. In the along-track direction, the SRAL successively measures the sea surface in convergence and divergence areas, and first decreases and then increases and finally returns to a steady state. In contrast, the divergence and dispersion caused by the ISWs during propagation affect the roughness of the sea surface, which is rougher in the irradiated area and smoother in the convergence area. This finding seems to indicate that there is a relationship between and sea surface roughness.
The mean-square slope, is commonly used to describe the surface roughness, and the studied altimeter adopts a nadir point observation mode; thus, the process of receiving an echo signal can be regarded as quasi-specular reflection. The value of the wavenumber range satisfying the specular scattering condition is inversely proportional to the normalized radar backscattering coefficient () [31,32], and Equation (1) can be obtained:
where denotes the effective reflectance and is the effective mean square slope. The effective mean square slope given by Equation (1) differs from the total mean square slope measured by the optical method in that it represents only the integral of the beam slope spectrum, corresponding to the cutoff wave numbers at C- and Ku-band radar wavelengths, respectively. Therefore, these mean square slopes include contributions from all wave facets with dimensions larger than a cutoff wavelength ≈ , where is the radar wavelength. For the Sentinel-3A Ku-band ( = 2.1 cm) and C-band ( = 5.5 cm) altimeters, these cutoff wavelengths are roughly 6.3 cm and 16.5 cm, respectively, which allows isolation of the mean square slope contribution of the small-scale waves between 6.3 cm and 16.5 cm by differencing the estimates from the two frequency bands [19].
Equation (1) shows that becomes larger as the sea surface roughness () decreases, and smaller when the sea surface roughness () increases. In this case, the sea surface roughness increases in the irradiated region, and consequently, measured by the SRAL decreases; additionally, becomes larger when the sea surface roughness decreases in the irradiated region. Since the surface in the irradiated area is less rough than the background surface, increases and becomes higher than that for the average background surface. Therefore, first decreases and then increases in the altimeter operation direction.
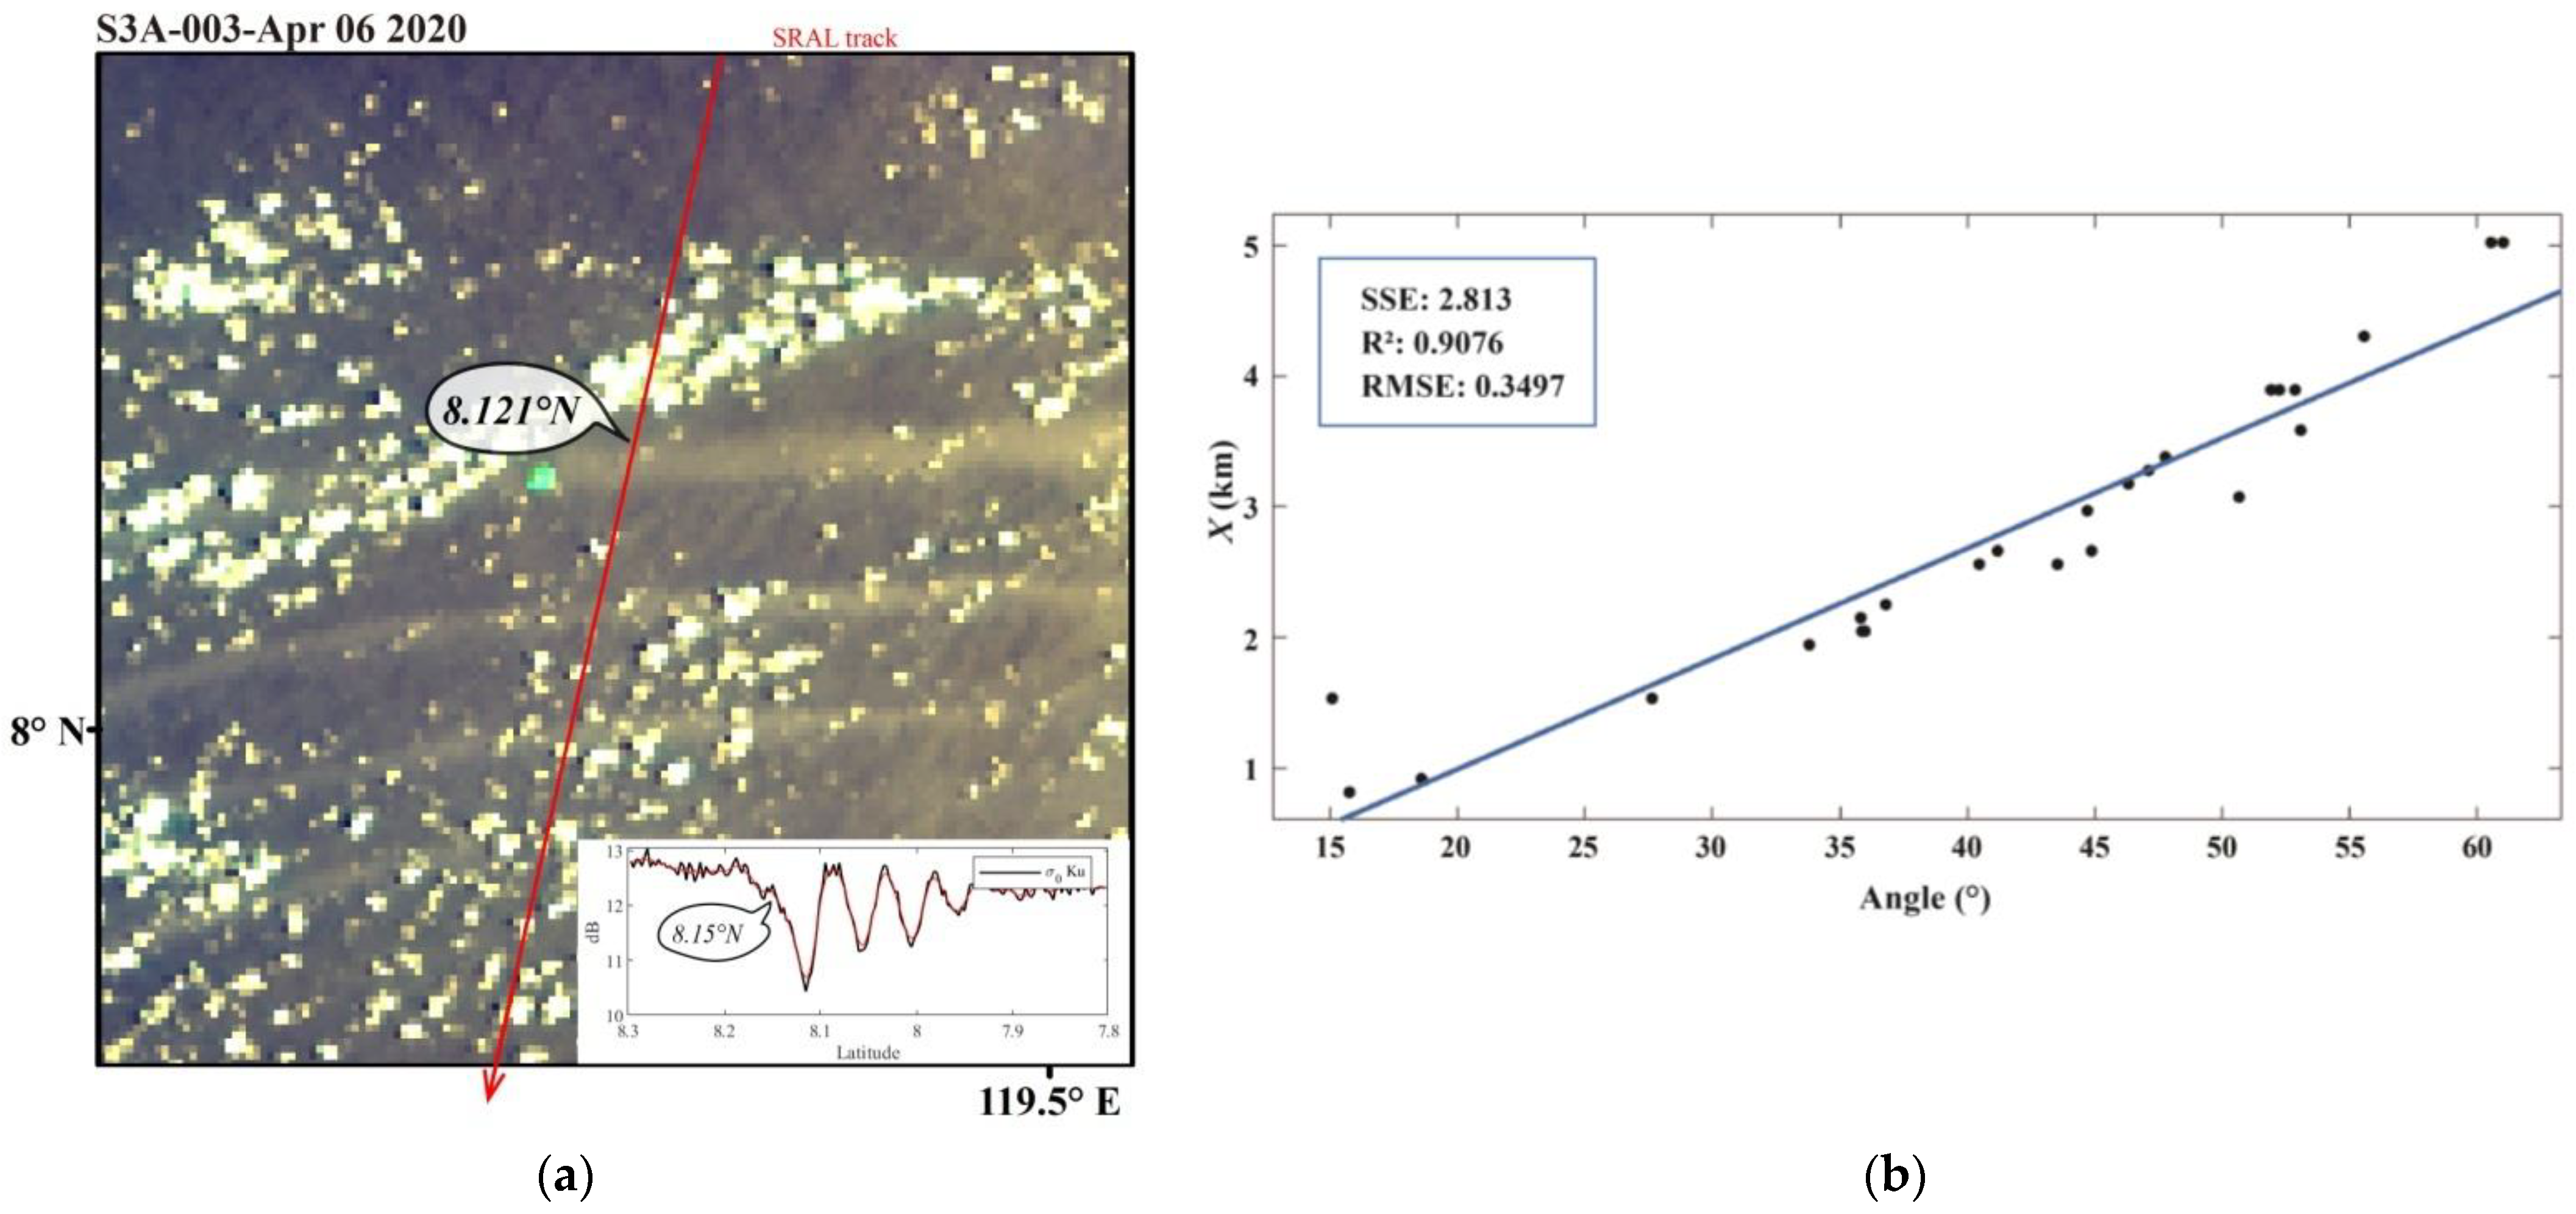
However, according to the statistical results, the position at which is subject to modulation does not coincide with ISWs, and there is always a deviation of several kilometers between these positions (Figure 12a). Based on the analysis, this deviation is considered to be influenced by the geometric relationship between the SRAL trajectory and the ISW propagation direction. In this paper, the deviation distance of in each case is calculated and recorded as X; each angle is also recorded simultaneously. The two parameters mentioned above directly correspond, and the trend of the variation can be fitted. Figure 12b shows that the closer the angle is to 90°, the larger the deviation X is; this deviation may decrease to 0 as the angle approaches 0.
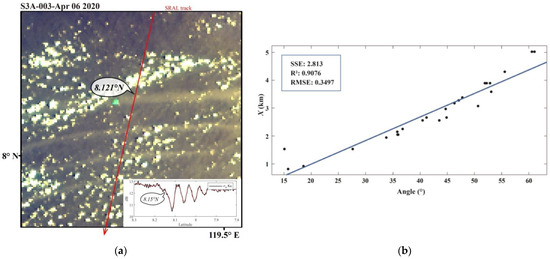
Figure 12.
(a) variations based on simultaneous observations: the lower right corner shows a plot of the variation in in the 20 Hz Ku band in the track direction, where the red line is the result of smoothing the original data (black line). The position where is modulated is 8.15° N; the actual position where an ISW occurs is 8.121° N, with a linear distance of approximately 3 km between the two points. (b) Scatter plot of the angle and the deviation X, where the blue line is the fitting result.
This bias phenomenon is inextricably related to the shape of the effective footprint of the SRAL. Since the shape of the effective footprint can be regarded as a long strip, when angle ≠ 0°, the ISW is detected at the edge of the footprint in the cross-track direction before it is detected near the center point of the phenomenon, and the observed is modulated by the ISW divergence zone and starts to decrease; however, the center point of is still some distance from the ISW at this time. Thus, the point deviates from the actual ISW position.
The above discussion shows that the ISWs change the sea surface roughness, which makes change regularly, and the existence of an angle between the altimeter track and the ISW makes this unique feature deviate. However, in this paper, we find that there is a certain linear relationship between the deviation X of and the angle through Figure 12b, which may help to provide a deeper explanation.
can be expressed by Equation (2) [25]:
where the amplitude is defined as the waveform power after retracking, is the transmitted peak power, and is a parameter calculated from the mean radius of the earth, atmospheric losses, wavelength of the RF carrier, antenna gain, and area of the ground resolution cell. Usually, does not play a decisive role in the variation of during continuous local observations; therefore, only appears to change significantly when the rough sea surface affects the peak power.
The position of the peak power gate corresponding to the effective footprint can be calculated by the propagation speed of the pulse with the time interval from the gate. Before this, however, the starting point of the leading edge must first be determined. As can be seen from Figure 3, when t < 0, the faint echo power in the waveform is thermal noise. In this paper, the starting point of the leading edge will be determined by calculating the difference between consecutive gates [33]: when the difference between two consecutive gates is positive and greater than the first gate with a normalization factor of 1%, i.e., when
where is a vector of differences between successive gates and the numbers are expressed in normalized power units. The end point of the frontier is then found at the first subsequent gate where the difference between successive waveform values becomes negative, i.e., when
In this paper, the width of 25,712 waveform fronts located in the open ocean was calculated according to the above algorithm, and the average value was finally calculated to be ≈8 bins. Therefore, according to Equation (5) [34]
where is the radius of the effective footprint, satellite altitude = 814 km, speed of light = 3 × 10⁸ m/s, reception bandwidth = 320 MHz, and is the distance gate of the multivisual waveform. Bringing in = 8, we obtain ≈ 3.5 km. This means that the position of the peak power gate of the waveform is approximately 3.5 km from the subsatellite point in the cross-track direction; the average value calculated using the deviation X and angle is 3.44 km, which is similar in size, and the theoretical derivation is verified in practice. Therefore, further inferences are obtained in this paper that starts to exhibit the characteristics of ISWs in the along-track direction only when the peak power of the waveform is reduced by the rough sea surface (Figure 13).
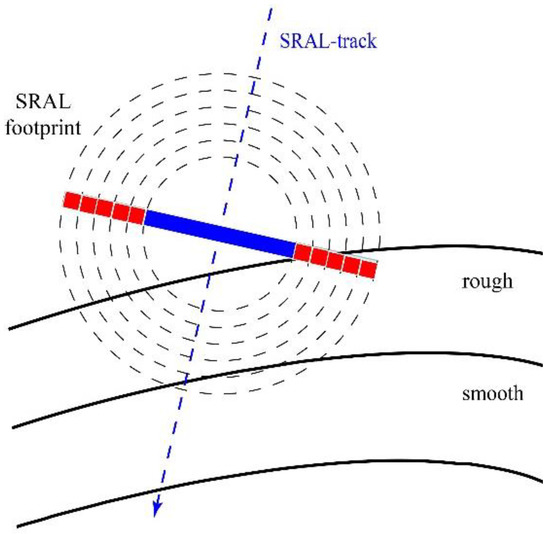
Figure 13.
Schematic diagram of starting to be modulated by ISW: the blue dashed line indicates the direction of the altimeter operation; the blue part of the footprint corresponds to the leading edge of the waveform; and the red part corresponds to the trailing edge of the waveform.
5.2. Analysis of SWH Change Characteristics
SWH is an important parameter in marine research and is defined as 1/3 of the highest wave in the field of view. Because the physical meaning of SWH is different from that of ; changes in SWH also differ, with a trend of increasing and then decreasing in the track direction of the SRAL; and the magnitude of change is large. The data in Section 4 show that the SWH at ISWs is significantly higher than that in nearby seas, and that this variation is short-lived with a large range of variation. Although a large amount of data suggests that this is indeed a unique feature caused by ISWs, these values do not correspond to the actual sea state, and the same phenomenon has been found in cases studied by previous authors [18,19]. In all cases in this paper, the wind speed was less than 10 m/s, so the effect of wind on SWH was first excluded.
We were fortunate to observe the ISWs in northeastern Dongsha on site in July this year and photographed the changes of the sea surface before and after the passage of the ISWs from different incidence angles with a UAV (Figure 14). At first, a large number of whitecaps appeared on the sea surface, which were striped and moved in one direction at a slow speed. When the ISW approached, the ship was swaying slightly more strongly. The scales of these ISWs are large, but from the photos with large incidence angles (Figure 14a), the ISWs caused only a large number of whitecaps, and no large waves appeared on the sea surface. Therefore, it can be concluded that these large SWHs are wrong. In this paper, we infer that these erroneous SWHs are related to the retracking of the waveform.

Figure 14.
(a) ISW taken by UAV with large incidence angle: a large number of waves can be seen breaking and moving in the direction of ISW propagation (the swell was larger on that day, and the lower left corner was not caused by ISW). (b) ISW taken by UAV with small incidence angle: the rough area and smooth area can be clearly distinguished.
The ISW changes the sea surface roughness, which makes the roughness have a strong influence on the return due to the direction in which the altimeter antenna was pointing. Therefore a clear decrease and increase in the peak power can be seen in Figure 15b. These changes in peak power are not problematic in themselves, because they are indeed affected by the different sea surfaces. What is problematic is the retracking model.
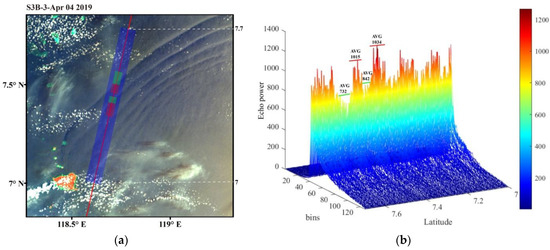
Figure 15.
(a) The full waveforms of the SRAL shaded in blue are selected and shown in (b), where the green and red shaded areas denote the rough and smooth regions of a subwave, respectively; and the average value of the highest echo power in the corresponding region is calculated.
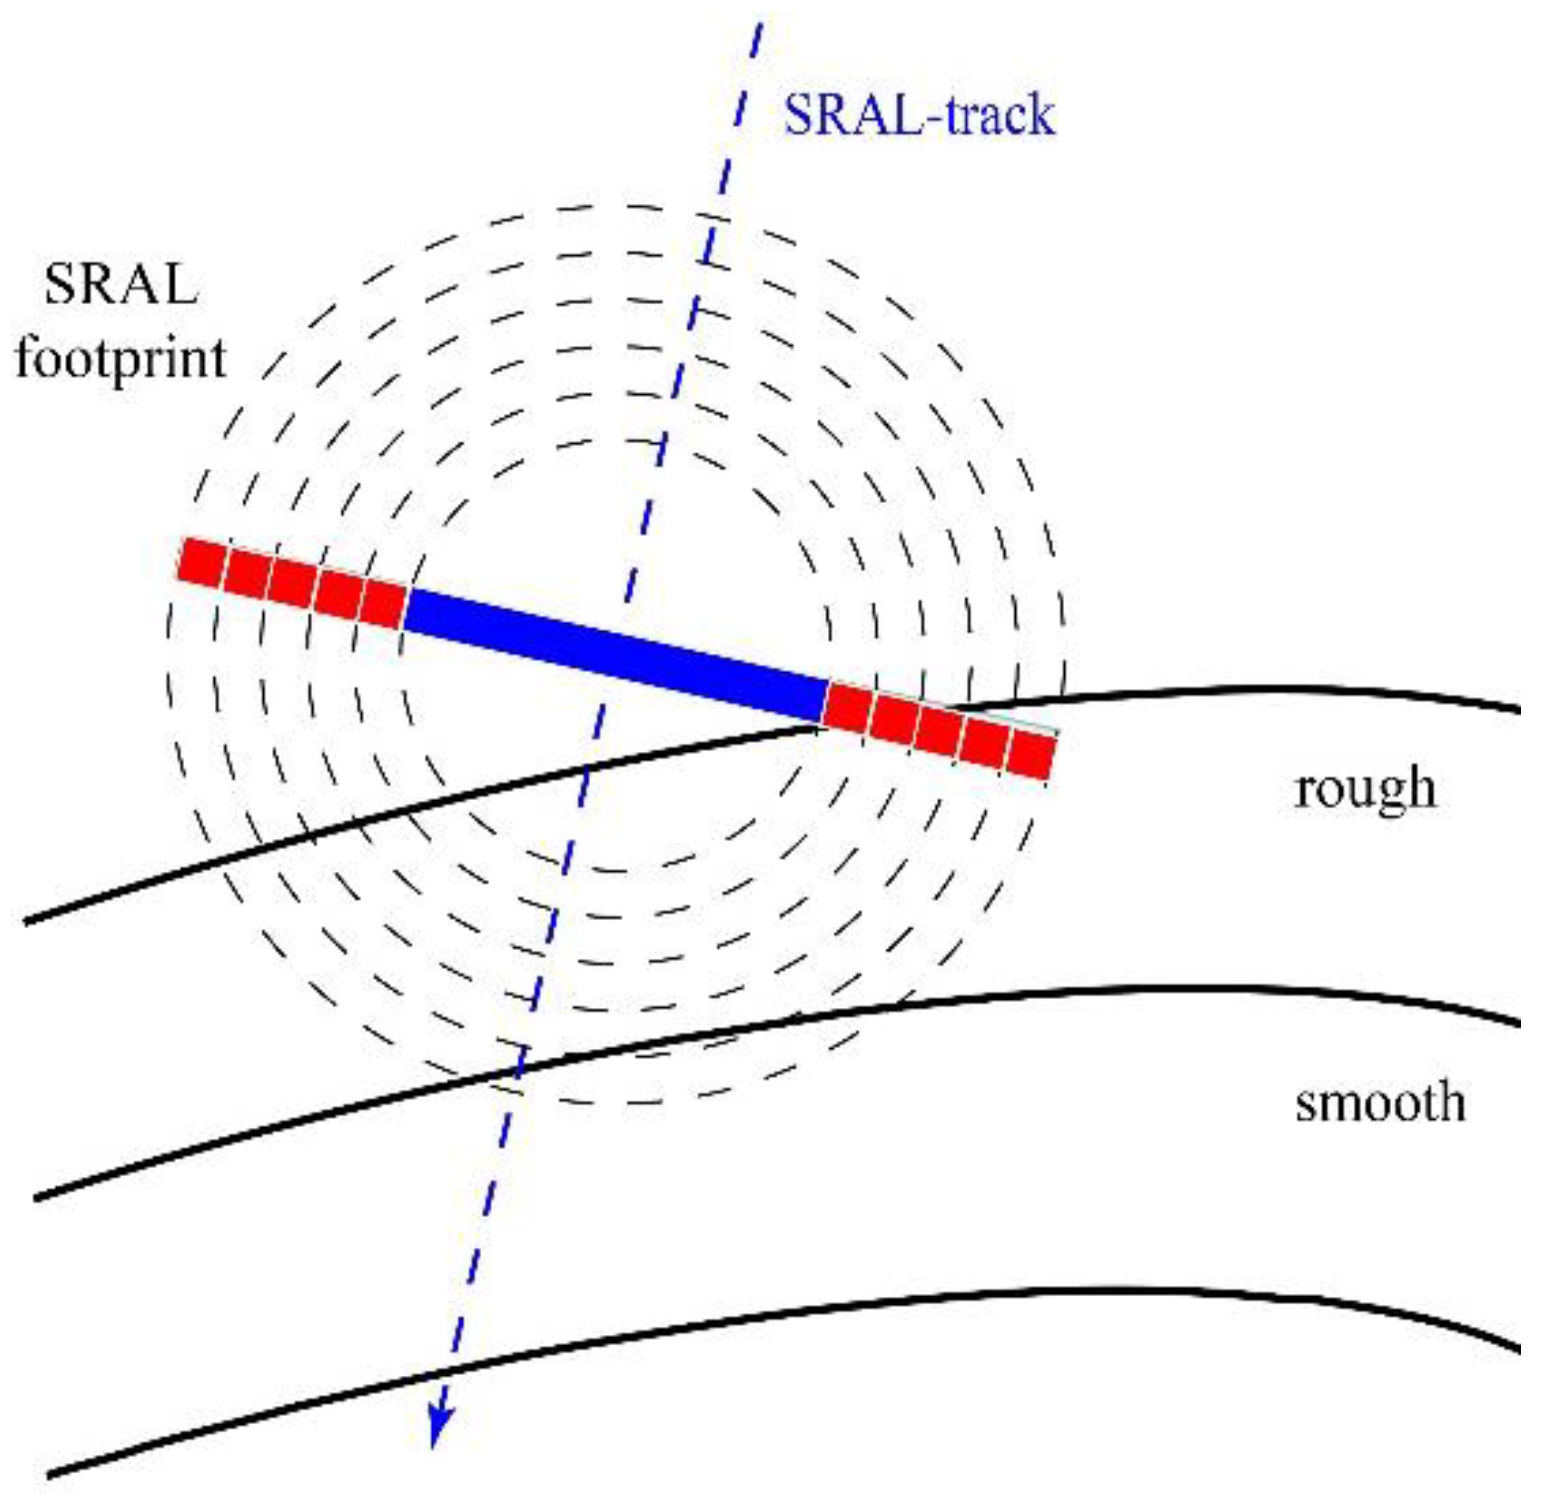
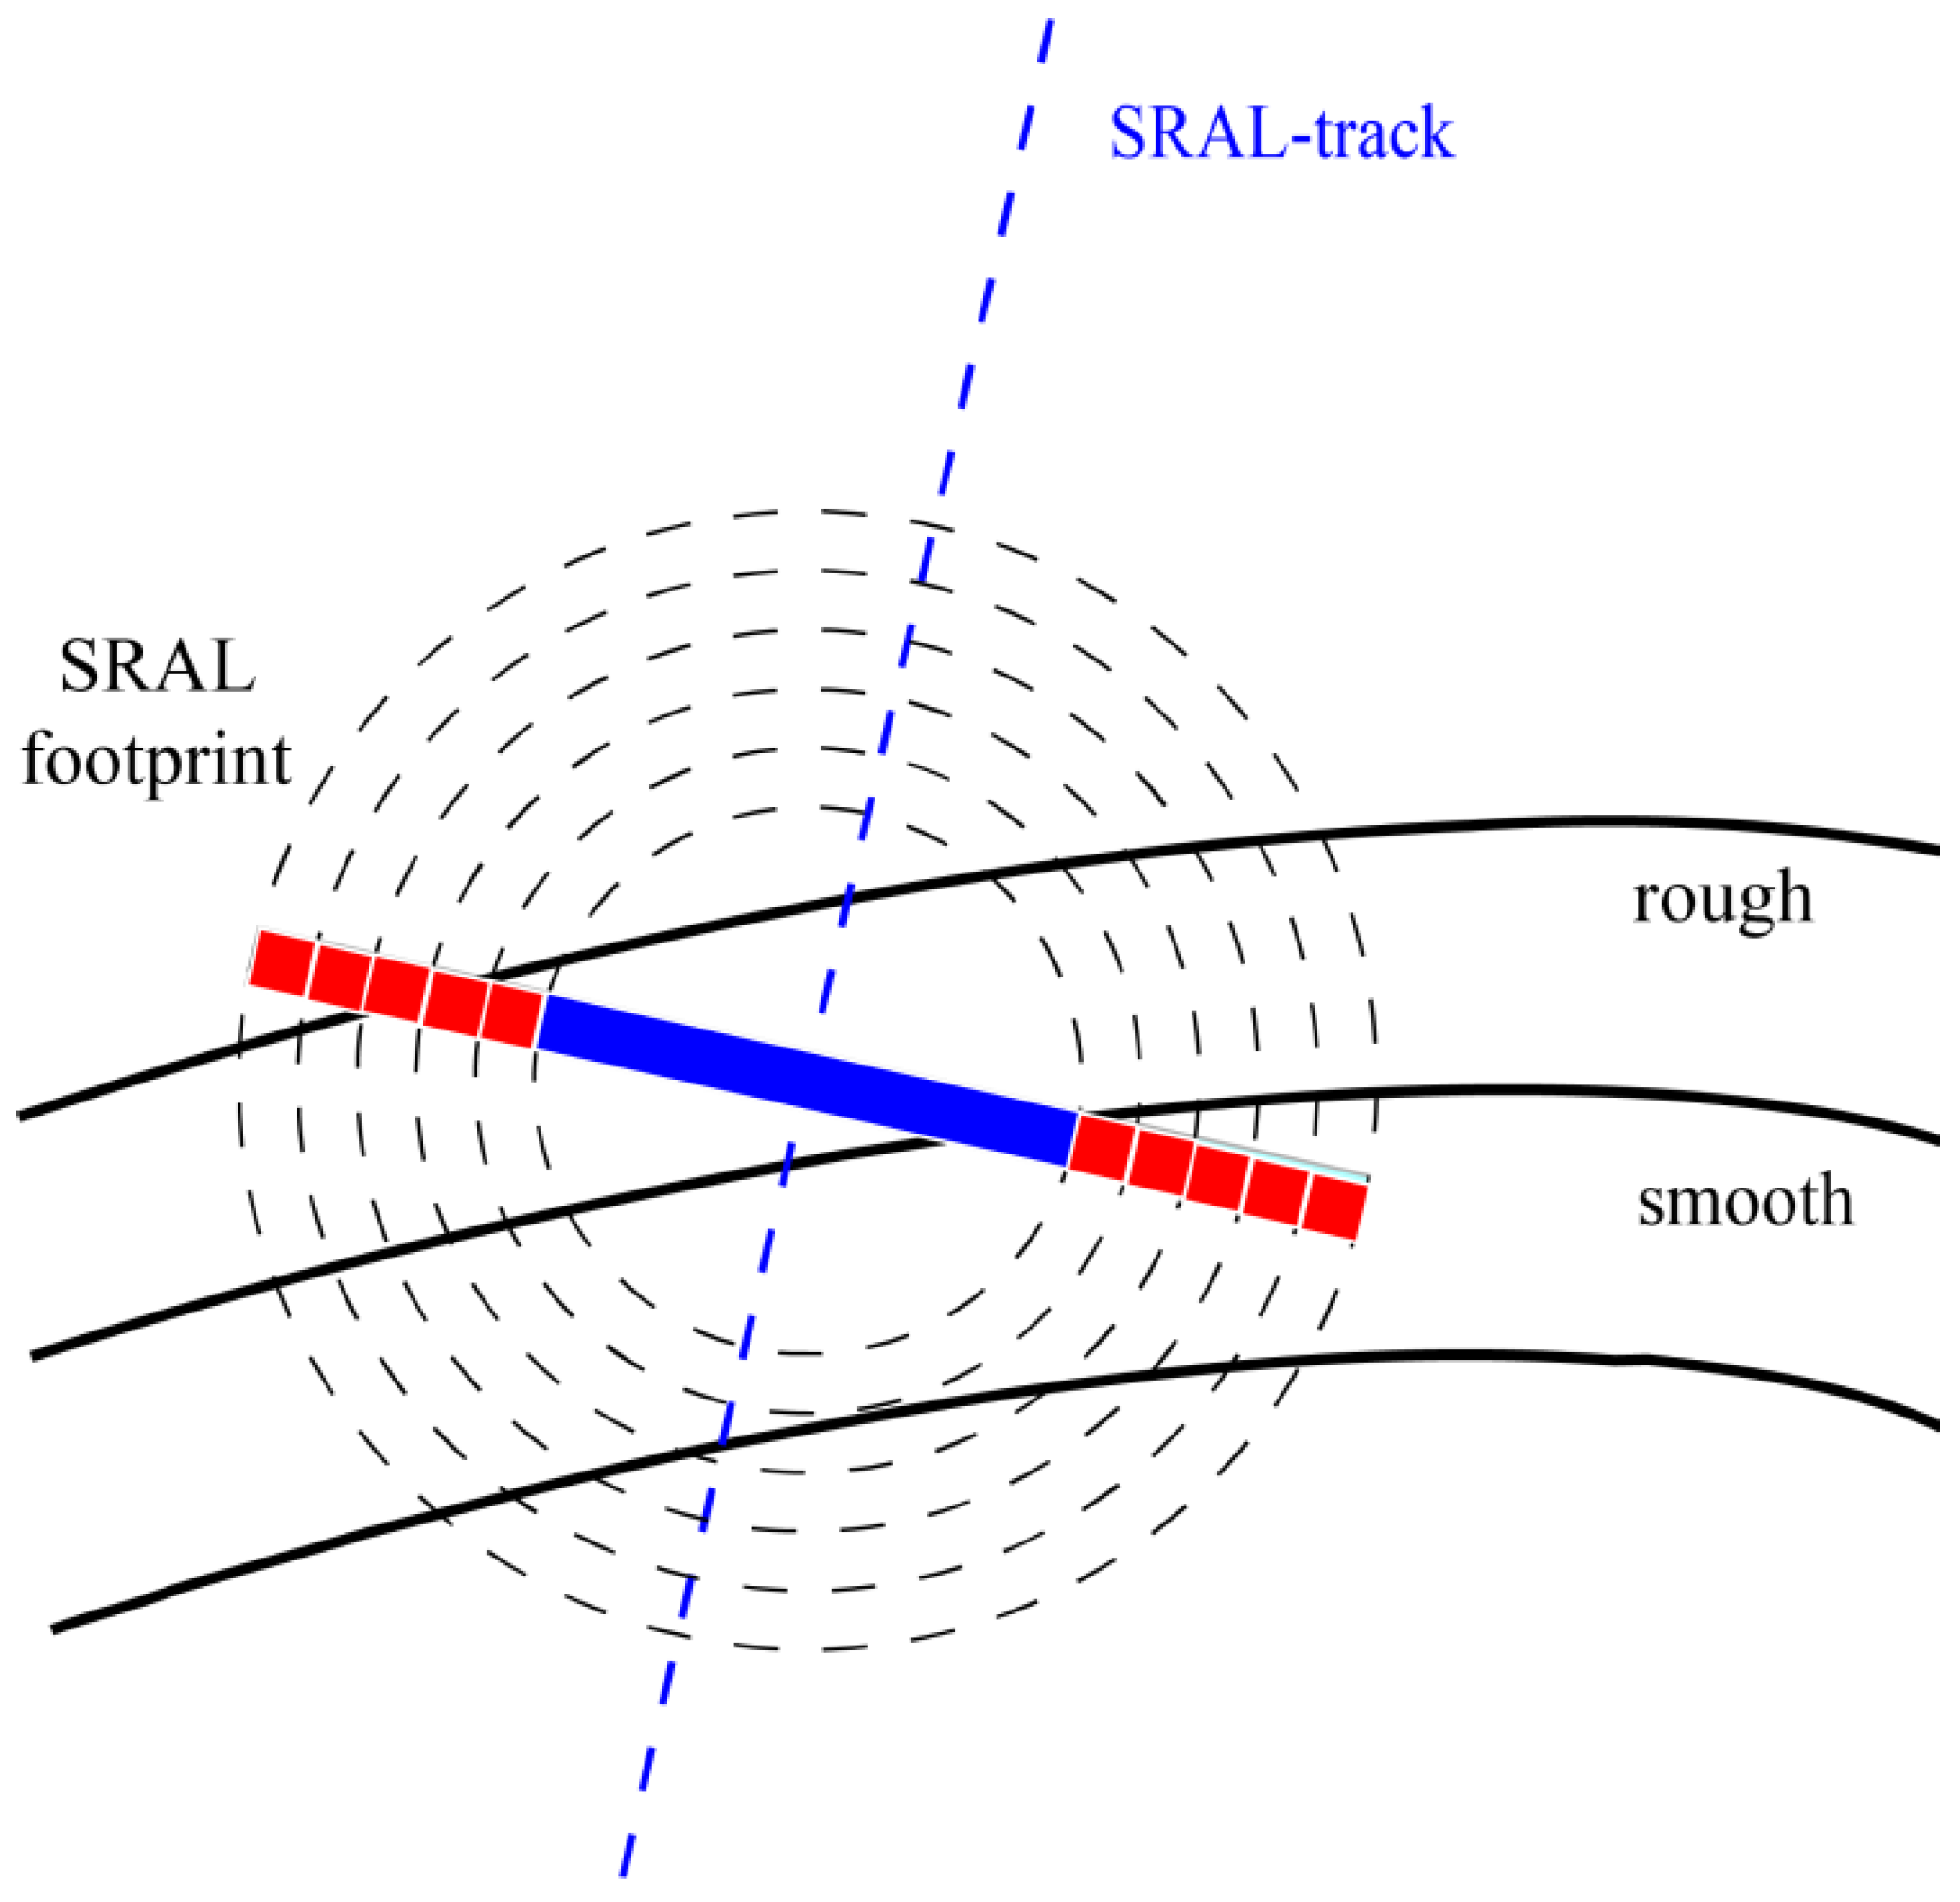
As mentioned in Section 2 of this paper, the assumption of a uniform sea surface is one of the basic assumptions of retracking; although SAMOSA takes into account special cases such as oil slicks, algal blooms, and ships [35], it clearly fails at the location of ISWs. The reason for this is that the ISW surface measured by the altimeter is not homogeneous, and instead is measured as rough and smooth separately. There exists a moment when the effective footprint is split between the rough and smooth areas, making the return power at the leading and trailing edges affected in different directions (as shown in Figure 16), i.e., the return power at the leading edge of the waveform decreases at that moment, while the return power at the trailing edge increases slightly. This effect does not make the waveform appear to be anomalous such as for inshore, ships, oil slicks, etc.: rather, it just slows down the rate of change of leading and trailing edges. Therefore the retracer will consider such a waveform as normal, and the leading-edge slope of such a waveform is necessarily large.
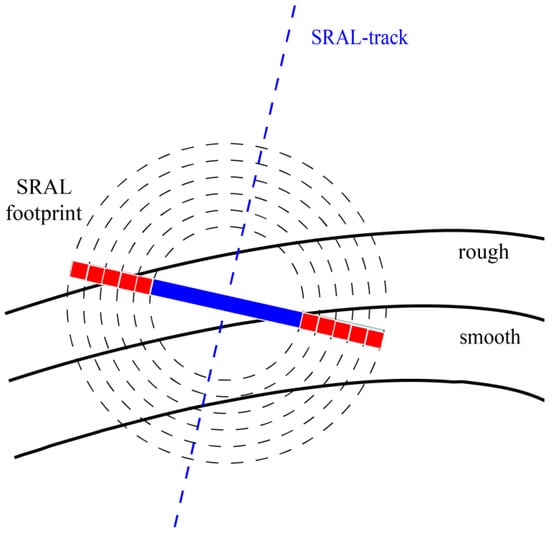
Figure 16.
The effective footprint of ISW surface measured by the altimeter is split between the rough and smooth areas, making the return power at the leading and trailing edges affected in different directions: the blue part of the footprint corresponds to the leading edge of the echo waveform, and the red part corresponds to the trailing edge.
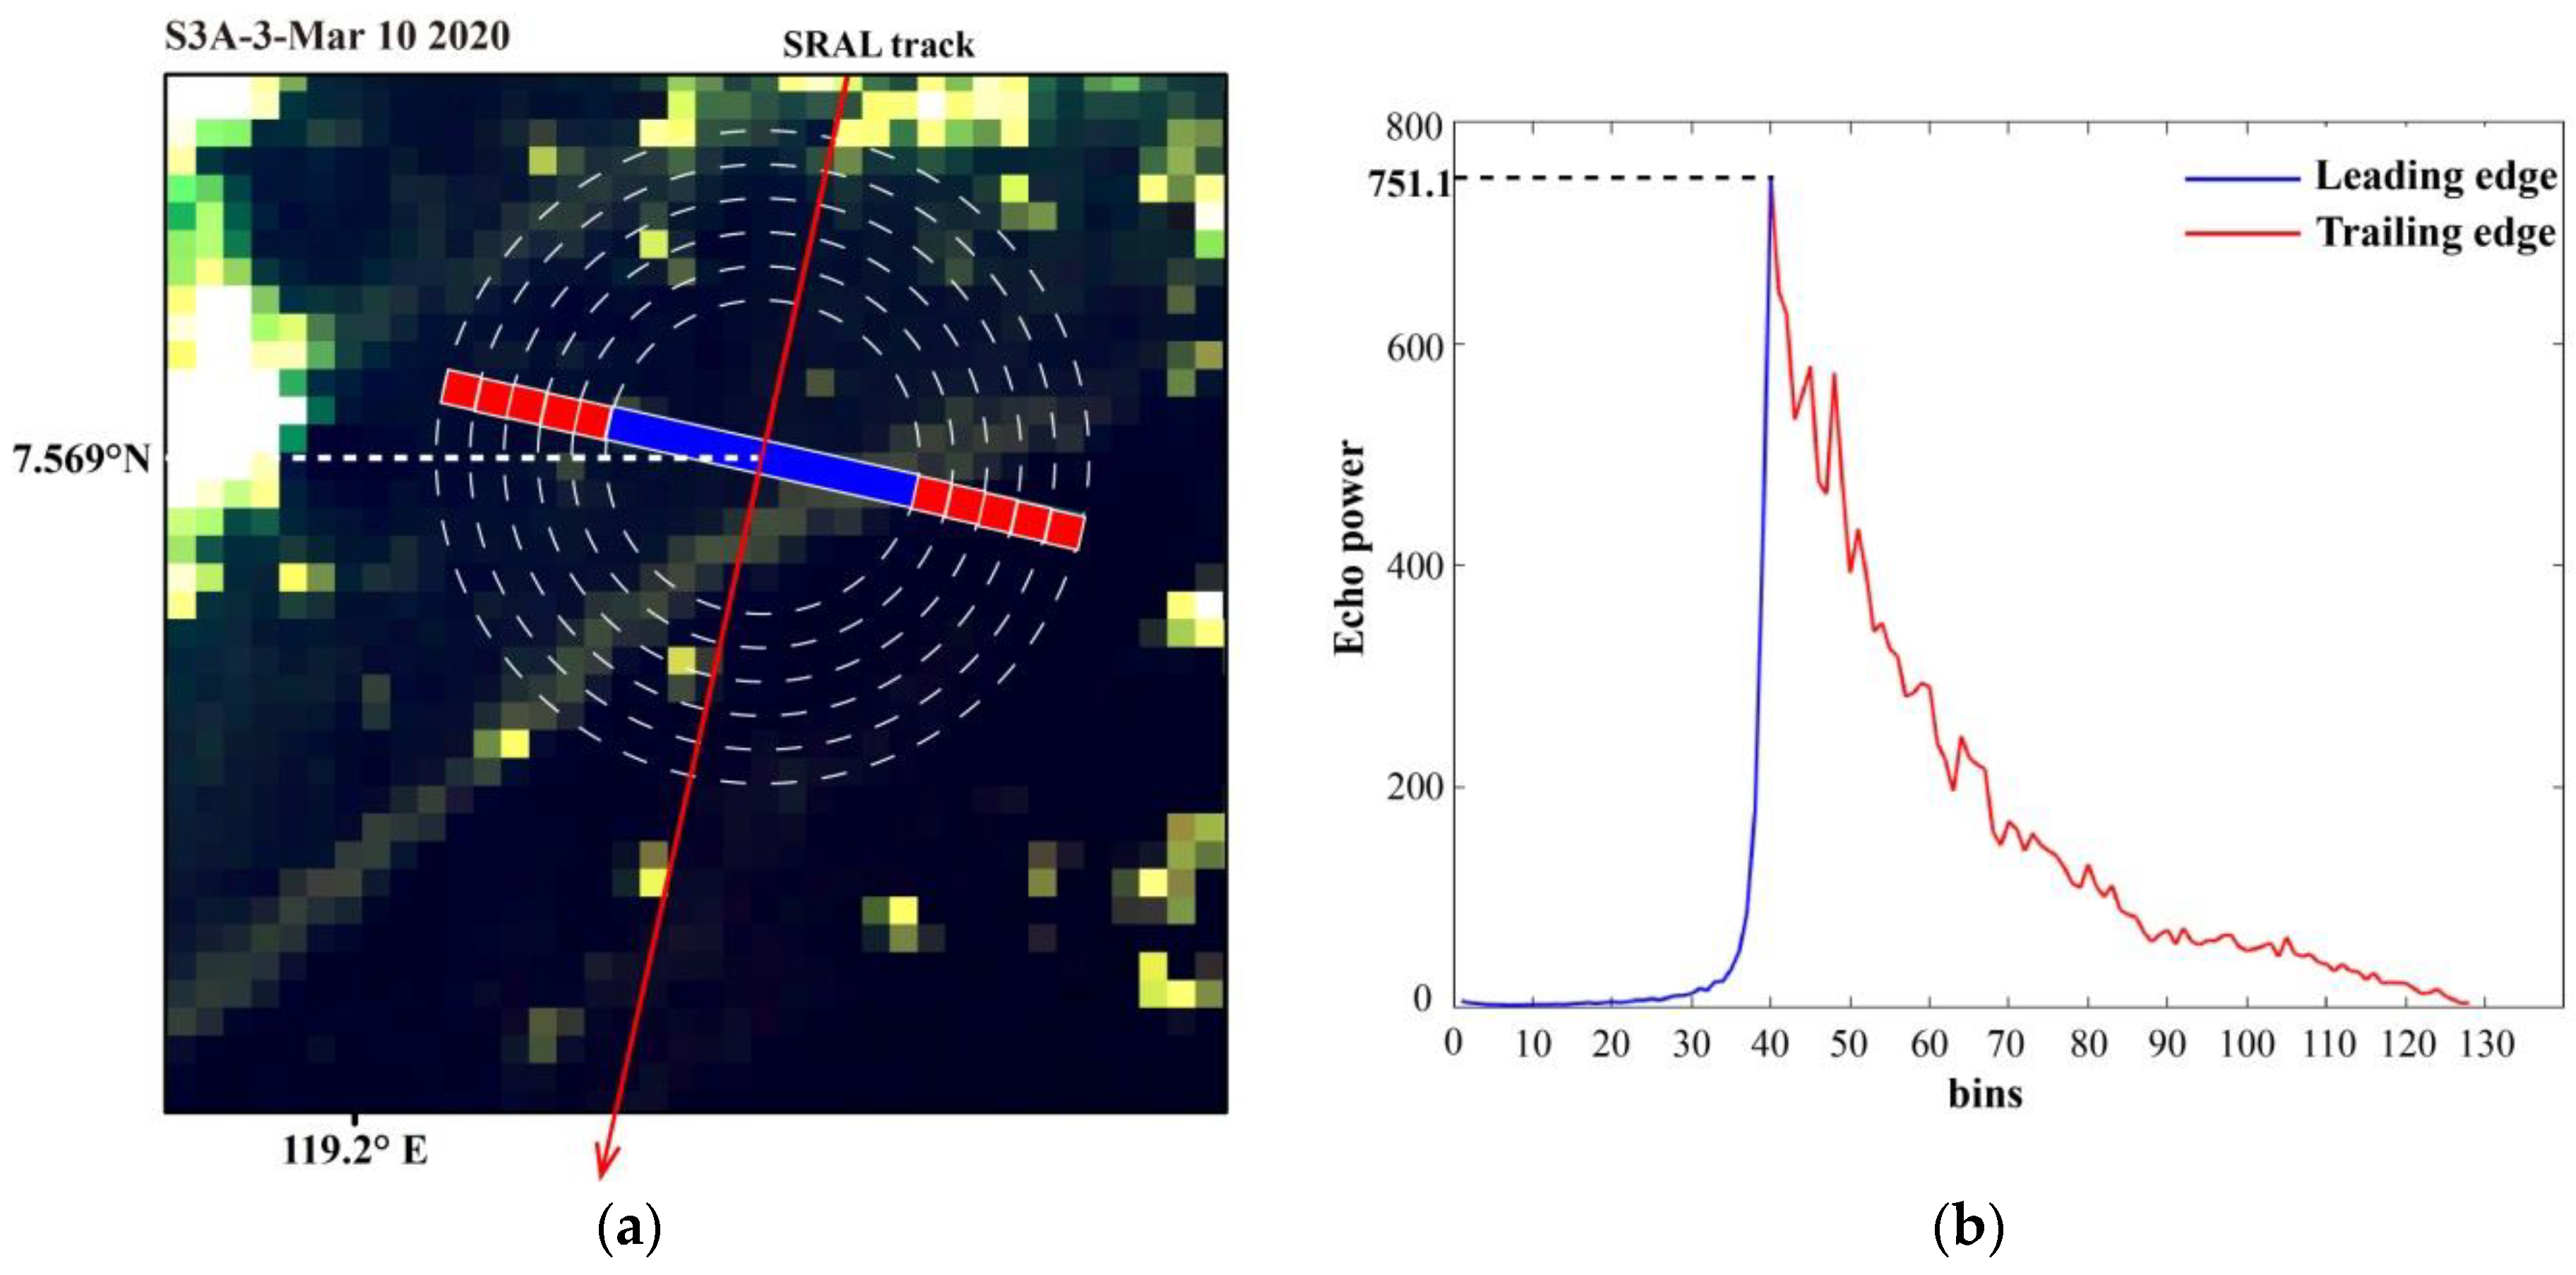
An example of the particular effect of ISWs on the waveform is given as follows. Figure 17 shows an image acquired at 01:44 (UTC) on 10 March 2020, with the selected waveform located at 7.569°N. The SWH at this point is 5.065 m. Due to the poor image quality, only strips of rough ISW areas can be identified in Figure 17a. However, the footprint can be isometrically enlarged, and the results show that the roughness of the sea surface within the footprint corresponding to the leading edge of the echo is high (white stripes), while that corresponding to the trailing edge of the echo is small. The echo waveform in this case is presented in Figure 17b, and the maximum echo power at the end of the leading edge is only 751.1. Additionally, the rate of descent of the whole trailing edge becomes slower, and two noise artifacts can be clearly seen in the 40–50 bins and 60–70 bins at the trailing edge. It can be inferred that the echo power at the leading and trailing edges of the waveform is indeed affected by different processes because the irradiance and dispersion caused by ISWs change the roughness of the sea surface. Additionally, the sea surface areas with different roughness levels act on the leading and trailing edges of the return waveform, causing the leading-edge echo power to decrease, the trailing-edge echo power to slightly increase, and the rate of change to decrease. After retracking, such a waveform will cause the half-power point to shift backward, increasing the leading-edge slope and therefore yielding an abnormal SWH.
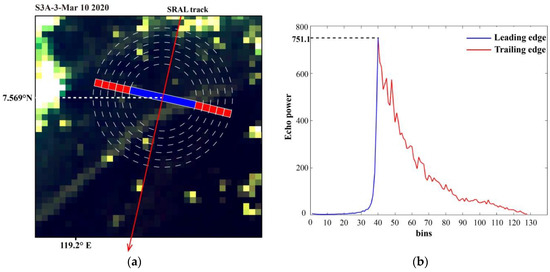
Figure 17.
Image acquired at 01:44 (UTC) on March 10, 2020: (a) the match between the footprint at 7.569° N and the OLCI image, and (b) the echo waveform at this point, where blue and red indicate the echo waveforms at the leading and trailing edges, respectively.
When the altimeter collects measurements, it scans the region from the rough area of an ISW to the smooth area, and the sea surface within the effective footprint includes areas with and without ISW perturbation. The SWH increases and then gradually decreases during this process, and the ISW has a stable effect on the SWH.
Another reason for the abnormal SWH is the geometric relationship between the SRAL operating direction and ISW propagation direction. Clearly, when angle = 0°, the roughness of the sea surface within the effective footprint is the same, the echo power is affected by isotropy, and the measured SWH should be accurate at this time. As long as angle ≠ 0° and <90°, the roughness of the sea surface within the effective footprint is no longer uniform, the retracking model fails, and the SWH is no longer accurate.
6. Summary and Conclusions
In this paper, we take advantage of the simultaneous observations of SRAL and OLCI onboard Sentinel-3 to characterize the variation in geophysical parameters caused by ISWs in the Sulu Sea. The results show that ISWs exhibit significant features related to , SSHA, and SWH in the Ku-band of SRAL data. In the region where ISWs act, decreases and then increases in all directions along the altimeter run; SWH varies greatly in the ISW region; and SSHA reflects the variation in sea surface height caused by ISWs, while having similar characteristics to the variation in .
In this paper, we further explain the characteristics of ISWs in relation to these three geophysical parameters based on the physical properties of ISWs and the observation mechanism of the SRAL. ISWs affect the sea surface roughness during propagation, increasing the roughness in the irradiated zone and decreasing it in the convergence zone. Therefore, the scattered signal received by the altimeter in the convergence zone decreases, and in contrast, the signal received in the divergence zone increases. Thus, decreases first and then increases. In addition, there is greater wave undulation in the rough zone where wave breaking occurs. The SSHA reflects the variation in sea surface height due to internal isolated waves, which decreases, then increases, and then decreases again in the direction of altimeter operation, which is consistent with the characteristics of a descending ISW. In the discussion, we find that the positions modulated by the ISWs do not exactly match the positions of the ISWs in the OLCI optical images and are reduced by the modulation of the ISWs a few kilometers from the ISWs; we also find that the SWH at the ISWs is too high, which does not match the actual sea state. The offset is due to the geometric relationship between the SRAL trajectory and the propagation direction of the ISWs, which results in the leading edge of the footprint being used to detect the ISW rather than the nadir point. Because the peak power of the waveform determines to some extent, starts to decrease only when the location corresponding to the peak power is affected by the rough sea surface, exhibiting the characteristics of the ISW. The SWH error is because the sea surface roughness in the footprint is not uniform when the altimeter detects the ISW, which violates the assumption of the retracker. The retracker fails in this region, and incorrect results are obtained.
In summary, synthetic aperture radar (SAR) altimeters have improved resolution in the along-track direction and are more capable of observing mesoscale ocean phenomena such as ISWs, which also exhibit significant characteristics in SRAL. However, the sea surface roughness variations caused by ISWs make the retrackers ineffective, leading to erroneous estimates of geophysical parameters such as , SWH, and SSHA. These errors need to be corrected by building new retracking models.
Author Contributions
Conceptualization, J.M. and C.Y.; methodology, C.Y.; software, C.Y.; validation, J.M., H.Z. and C.Y.; formal analysis, C.Y.; investigation, C.Y.; resources, J.M., L.S. and C.Y.; data curation, C.Y.; writing—original draft preparation, C.Y.; writing—review and editing, C.Y., H.Z., L.S. and H.W.; visualization, C.Y.; supervision, J.M.; project administration, J.M. and L.S.; funding acquisition, J.M. and L.S. All authors have read and agreed to the published version of the manuscript.
Funding
This research was funded by the National Natural Science Foundation of China (No. U2006207) and the National Natural Science Foundation of China (No. 42006164).
Data Availability Statement
The data presented in this study are openly available in Copernicus Open Access Hub: https://scihub.copernicus.eu/dhus/#/home (accessed on 4 August 2022).
Acknowledgments
C.Y. thanks the First Institute of Oceanography (FIO) and China University of Petroleum (UPC) for opportunities to learn about the delay-Doppler altimeter onboard Sentinel-3A/B. C.Y. also thanks J.M. for guidance on ISWs and altimeters. The authors thank the EUMETSAT Copernicus program for data production.
Conflicts of Interest
The authors declare no conflict of interest.
Appendix A

Table A1.
Information related to the ISW wave crest line, the locations of the smooth and rough region boundaries, and the width and propagation direction of the leading edge of ISWs were extracted from the matched images according to the method described in Section 3.
Table A1.
Information related to the ISW wave crest line, the locations of the smooth and rough region boundaries, and the width and propagation direction of the leading edge of ISWs were extracted from the matched images according to the method described in Section 3.
| Date | Track | ISW Location (E°, N°) | Leading Wave Width (km) | ISW Propagation (°) |
|---|---|---|---|---|
| 20170927 | 3A-331 | 118.424, 8.272 | 2.188 | 31.99 NW |
| 20180308 | 3A-331 | 118.58, 8.969 | 1.652 | 36.16 NW |
| 20180404 | 3A-331 | 118.399, 8.162 | 1.679 | 59.23 NW |
| 20180501 | 3A-331 | 118.485, 8.547 | 2.392 | 59.71 NW |
| 20180505 | 3A-3 | 119.008, 6.669 | 3.565 | 37.13 NW |
| 20180628 | 3A-3 | 119.073, 6.964 | 4.931 | 52.15 NW |
| 20181010 | 3A-331 | 118.51, 8.653 | 2.593 | 48.33 NW |
| 20181110 | 3A-3 | 119.28, 7.886 | 3.582 | 45.68 NW |
| 20181211 | 3A-60 | 120.761, 10.311 | 3.117 | 14.38 NW |
| 20190209 | 3B-3 | 118.91, 8.322 | 3.486 | 23.44 NW |
| 20190222 | 3A-331 | 118.368, 8.031 | 2.852 | 7.96 NW |
| 20190226 | 3A-3 | 119.184, 7.459 | 2.567 | 35.46 NW |
| 20190308 | 3B-3 | 118.968, 8.585 118.687, 7.334 | 2.059 3.531 | 51.53 NW 43.54 NW |
| 20190325 | 3A-3 | 119.465, 8.709 119.238, 7.699 | 2.969 2.826 | 39.13 NW 43.37 NW |
| 20190404 | 3B-3 | 118.727, 7.512 | 3.311 | 54.25 NW |
| 20190421 | 3A-3 | 119.277, 7.873 | 2.013 | 28.84 NW |
| 20190707 | 3A-331 | 118.444, 8.361 | 2.734 | 28.49 NW |
| 20190721 | 3B-3 | 118.977, 8.623 | 2.642 | 34.47 NW |
| 20190817 | 3B-3 | 118.801, 7.838 | 3.486 | 44.98 NW |
| 20190903 | 3A-3 | 118.988, 6.584 | 1.735 | 33.82 NW |
| 20190930 | 3A-3 | 119.318, 8.057 | 2.953 | 26.27 NW |
| 20191220 | 3A-3 | 119.149, 7.302 | 2.396 | 39.85 NW |
| 20191230 | 3B-3 | 118.659, 7.212 | 3.117 | 40.60 NW |
| 20200116 | 3A-3 | 119.211, 7.578 | 3.545 | 34.52 NW |
| 20200126 | 3B-3 | 118.71, 7.435 | 2.056 | 45.77 NW |
| 20200222 | 3B-3 | 118.743, 7.585 | 2.443 | 50.59 NW |
| 20200226 | 3B-60 | 119.526, 6.914 | 3.146 | 43.01 NW |
| 20200310 | 3A-3 | 119.257, 7.783 | 1.421 | 32.45 NW |
| 20200314 | 3A-60 | 120.292, 8.232 120.05, 7.151 | 3.367 3.592 | 49.34 NW 42.20 NW |
| 20200320 | 3B-3 | 118.791, 7.799 | 2.944 | 50.92 NW |
| 20200324 | 3B-60 | 119.558, 7.056 | 3.726 | 46.44 NW |
| 20200406 | 3A-3 | 119.328, 8.103 | 3.094 | 13.71 NW |
| 20200526 | 3A-331 | 118.426, 8.285 | 1.518 | 30.26 NW |
| 20200723 | 3A-3 | 119.026, 6.752 | 2.171 | 54.3 NW |
| 20200919 | 3A-60 | 120.657, 9.85 | 2.878 | 17.21 NW |
| 20201118 | 3B-3 | 118.724, 7.494 | 3.089 | 27.94 NW |
| 20201205 | 3A-3 | 119.239, 7.703 | 2.102 | 34.64 NW |
| 20210211 | 3B-60 | 119.319, 5.986 | 2.465 | 51.76 NW |
| 20210319 | 3A-331 | 118.406, 8.191 | 2.431 | 19.52 NW |
References
- Osborne, A.R.; Burch, T.L. Internal solitons in the Andaman Sea. Science 1980, 208, 451–460. [Google Scholar] [CrossRef] [PubMed]
- Russell, J.S.; Esq, M.A.; Edin, F.R.S. Report on Waves. Report of the 14th Meeting of the British Association for the Advancement of Science, York, London, UK. 1844. Available online: https://www.macs.hw.ac.uk/~chris/Scott-Russell/SR44.pdf (accessed on 4 August 2022).
- Apel, J.R.; Byrne, H.M.; Proni, J.R.; Charnell, R.L. Observations of oceanic internal and surface waves from the earth resources technology satellite. J. Geophys. Res. Oceans 1975, 80, 865–881. [Google Scholar] [CrossRef]
- Alpers, W. Theory of radar imaging of internal waves. Nature 1985, 314, 245–247. [Google Scholar] [CrossRef]
- Li, X.F.; Jackson, C.R.; Pichel, W.G. Internal solitary wave refraction at Dongsha Atoll, South China Sea. Geophys. Res. Lett. 2013, 40, 3128–3132. [Google Scholar] [CrossRef]
- Lu, K.X.; Wang, J.; Zhang, M. Study on prediction of internal solitary waves propagation in the southern Andaman Sea. J. Oceanogr. 2021, 77, 607–613. [Google Scholar] [CrossRef]
- Sun, L.N.; Zhang, J.; Meng, J.M. A study of the spatial-temporal distribution and propagation characteristics of internal waves in the Andaman Sea using MODIS. Acta. Oceanol. Sin. 2019, 38, 121–128. [Google Scholar] [CrossRef]
- Zhang, X.D.; Wang, J.; Sun, L.N.; Meng, J.M. Study on the amplitude inversion of internal waves at Wenchang area of the South China Sea. Acta. Oceanol. Sin. 2016, 35, 14–19. [Google Scholar] [CrossRef]
- Zhang, H.; Fan, C.Q.; Meng, J.M.; Li, S.B.; Sun, L.N. Research on Internal Solitary Wave Detection and Analysis Based on Interferometric Imaging Radar Altimeter Onboard the Tiangong-2 Space Laboratory. Remote Sens. 2021, 14, 174. [Google Scholar] [CrossRef]
- Guo, C.; Chen, X.; Vlasenko, V.; Stashchuk, N. Numerical investigation of internal solitary waves from the Luzon Strait: Generation process, mechanism and three-dimensional effects. Ocean Model. 2011, 38, 203–216. [Google Scholar] [CrossRef]
- Jia, T.; Liang, J.J.; Li, X.M.; Sha, J. SAR observation and numerical simulation of internal solitary wave refraction and reconnection behind the Dongsha Atoll. J. Geophys. Res.-Oceans. 2018, 123, 74–89. [Google Scholar] [CrossRef]
- Shum, C.K.; Ries, J.C.; Tapley, B.D. The accuracy and applications of satellite altimetry. Geophys. J. Int. 1995, 121, 321–336. [Google Scholar] [CrossRef]
- Zhang, Y.H.; Jiang, J.S.; Zhang, H.Y.; Zhang, D.H. Spaceborne imaging altimeter for topographic mapping. In Proceedings of the IEEE 2000 International Geoscience and Remote Sensing Symposium, Honolulu, HI, USA, 24–28 July 2000; pp. 2349–2351. [Google Scholar]
- Zhang, Y.H.; Shi, X.J.; Wang, H.J.; Tan, Y.Y.; Zhai, W.S.; Dong, X.; Kang, X.Y.; Yang, Q.S.; Li, D.; Jiang, J.S. Interferometric imaging radar altimeter on board Chinese Tiangong-2 space laboratory. In Proceedings of the 2018 Asia-Pacific Microwave Conference (APMC), Kyoto, Japan, 6–9 November 2018; pp. 851–853. [Google Scholar]
- Ray, R.D.; Mitchum, G.T. Surface manifestation of internal tides generated near Hawaii. Geophys. Res. Lett. 1996, 23, 2101–2104. [Google Scholar] [CrossRef]
- da Silva, J.C.B.; Cerqueira, A.L.F. A note on radar altimeter signatures of Internal Solitary Waves in the ocean. In Proceedings of the Remote Sensing of the Ocean, Sea Ice, Coastal Waters, and Large Water Regions, Edinburgh, Scotland, UK, 26–27 September 2016; Bostater, C.R., Neyt, X., Nichol, C., Aldred, O., Eds.; SPIE: Bellingham, WA, USA, 2016; Volume 9999, p. 14. [Google Scholar]
- Magalhaes, J.M.; da Silva, J.C.B. Satellite Altimetry Observations of Large-Scale Internal Solitary Waves. IEEE Geosci. Remote S. 2017, 99, 1–5. [Google Scholar] [CrossRef]
- Santos-Ferreira, A.M.; da Silva, J.C.B.; Magalhaes, J.M. SAR Mode Altimetry Observations of Internal Solitary Waves in the Tropical Ocean Part 1: Case Studies. Remote Sens. 2018, 10, 644. [Google Scholar] [CrossRef]
- Santos-Ferreira, A.M.; da Silva, J.C.B.; Srokosz, M. SAR-Mode Altimetry Observations of Internal Solitary Waves in the Tropical Ocean Part 2: A Method of Detection. Remote Sens. 2019, 11, 1339. [Google Scholar] [CrossRef]
- Drees, L.; Kusche, J.; Roscher, R. Multi-modal deep learning with sentinel-3 observations for the detection of oceanic internal waves. ISPRS Ann. Photogramm. Remote Sens. Spat. Inf. Sci. 2020, 2, 813–820. [Google Scholar] [CrossRef]
- Zhang, X.D.; Zhang, J.; Meng, J.M.; Fan, C.Q.; Wang, J. Observation of internal waves with OLCI and SRAL on board Sentinel-3. Acta. Oceanol. Sin. 2020, 39, 56–62. [Google Scholar] [CrossRef]
- Magalhaes, J.M.; Alpers, W.; Santos-Ferreira, A.M.; da Silva, J.C.B. Surface Wave Breaking Caused by Internal Solitary Waves: Effects on Radar Backscattering Measured by SAR and Radar Altimeter. Oceanography 2021, 34, 166–176. [Google Scholar] [CrossRef]
- Santos-Ferreira, A.M.; da Silva, J.C.B.; Magalhaes, J.M.; Amraoui, S.; Moreau, T.; Maraldi, C.; Boy, F.; Picot, N.; Borde, F. Effects of Surface Wave Breaking Caused by Internal Solitary Waves in SAR Altimeter: Sentinel-3 Copernicus Products and Advanced New Products. Remote Sens. 2022, 14, 587. [Google Scholar] [CrossRef]
- Raney, R. The delay/Doppler radar altimeter. IEEE Trans. Geosci. Remote Sens. 1998, 36, 1578–1588. [Google Scholar] [CrossRef]
- Dinardo, S. Techniques and Applications for Satellite SAR Altimetry over Water, Land and Ice. Ph.D. Thesis, Technical University, Berlin, Germany, 2020. [Google Scholar]
- Apel, J.R.; Holbrook, J.R.; Liu, A.K.; Tsia, J.J. The Sulu Sea Internal Soliton Experiment. J. Phys. Oceanogr. 1985, 15, 1625–1651. [Google Scholar] [CrossRef]
- Sun, L.N.; Zhang, J.; Meng, J.M. Analysis of Spatio-Temporal Distribution of Internal Solitary Waves in the South China Sea and Sulu Sea (2010–2015). Adv. Mar. Sci. Chin. 2019, 37, 398–408. [Google Scholar]
- Fu, L.-L.; Cazenave, A. Satellite Altimetry and Earth Sciences: A Handbook of Techniques and Applications; Elsevier: Amsterdam, The Netherlands, 2000; pp. 92–95. [Google Scholar]
- Rosmorduc, V.; Benveniste, J. Radar Altimetry Tutorial; Bronner, E., Dinardo, S., Lauret, O., Maheu, C., Milagro, M., Picot, N., Eds.; CLS: Toulouse, France, 2011; pp. 115–140. [Google Scholar]
- Zhang, H.; Meng, J.M.; Sun, L.N.; Li, S.B. Observations of Reflected Internal Solitary Waves near the Continental Shelf of the Dongsha Atoll. J. Mar. Sci. Eng. 2022, 10, 763. [Google Scholar] [CrossRef]
- Brown, G.S. Quasi-Specular Scattering from the Air-Sea Interface. In Surface Waves and Fluxes; Environmental Fluid Mechanics; Geernaert, G.L., Plant, W.L., Eds.; Springer: Dordrecht, The Netherlands, 1990; Volume 8, pp. 1–39. [Google Scholar]
- Jackson, F.C.; Walton, W.T.; Hines, D.E.; Walter, B.A.; Peng, C.Y. Sea surface mean square slope from Ku-band backscatter data. J. Geophys. Res.-Oceans. 1992, 97, 11411–11427. [Google Scholar] [CrossRef]
- Passaro, M.; Cipollini, P.; Vignudelli, S.; Quartly, G.D.; Snaith, H.M. ALES: A multi-mission adaptive subwaveform retracker for coastal and open ocean altimetry. Remote Sens. Environ. 2014, 145, 173–189. [Google Scholar] [CrossRef]
- Schlembach, F.; Passaro, M.; Dettmering, D.; Bidlot, J.; Seitz, F. Interference-sensitive coastal SAR altimetry retracking strategy for measuring significant wave height. Remote Sens. Environ. 2022, 274, 112968. [Google Scholar] [CrossRef]
- Dinardo, S.; Lucas, B.; Benveniste, J. Sentinel-3 STM SAR ocean retracking algorithm and SAMOSA model. In Proceedings of the 2015 IEEE International Geoscience and Remote Sensing Symposium (IGARSS), Milan, Italy, 26–31 July 2015; pp. 5320–5323. [Google Scholar]
Publisher’s Note: MDPI stays neutral with regard to jurisdictional claims in published maps and institutional affiliations. |
© 2022 by the authors. Licensee MDPI, Basel, Switzerland. This article is an open access article distributed under the terms and conditions of the Creative Commons Attribution (CC BY) license (https://creativecommons.org/licenses/by/4.0/).

