Article

Refining Rates of Active Crustal Deformation in the Upper Plate of Subduction Zones, Implied by Geological and Geodetic Data: The E-Dipping West Crati Fault, Southern Italy

1
Department of Physics and Astronomy, Alma Mater Studiorum University of Bologna, Viale Berti Pichat 6/2, 40127 Bologna, Italy
2
Istituto Nazionale di Geofisica e Vulcanologia, Sezione di Palermo, Via Ugo La Malfa, 153, 90146 Palermo, Italy
3
Istituto Nazionale di Geofisica e Vulcanologia (INGV), Sezione di Bologna, 40128 Bologna, Italy
*
Author to whom correspondence should be addressed.
Remote Sens. 2022, 14(21), 5303; https://doi.org/10.3390/rs14215303
Submission received: 5 September 2022 / Revised: 17 October 2022 / Accepted: 19 October 2022 / Published: 23 October 2022
(This article belongs to the Special Issue Remote Sensing in Earthquake, Tectonics and Seismic Hazards)

Abstract

:
We investigate crustal deformation within the upper plate of the Ionian Subduction Zone (ISZ) at different time scales by (i) refining geodetic rates of crustal extension from continuous Global Navigation Satellite System (GNSS) measurements and (ii) mapping sequence of Late Quaternary raised marine terraces tectonically deformed by the West Crati normal fault, in northern Calabria. This region experienced damaging earthquakes in 1184 (M 6.75) and 1854 (M 6.3), possibly on the E-dipping West Crati fault (WCF) which, however, is not unanimously considered to be a seismogenic source. We report geodetic measurements of extension and strain rates across the strike of the E-dipping WCF and throughout the northern Calabria obtained by using velocities from 18 permanent GNSS stations with a series length longer than 4.5 years. These results suggest that crustal extension may be seismically accommodated in this region by a few normal faults. Furthermore, by applying a synchronous correlation approach, we refine the chronology of understudied tectonically deformed palaeoshorelines mapped on the footwall and along the strike of the WCF, facilitating calculation of the associated fault-controlled uplift rates. Raised Late Quaternary palaeoshorelines are preserved on the footwall of the WCF indicating that “regional” uplift, likely related to the deformation associated either with the subduction or mantle upwelling processes, is affected by local footwall uplift. We show that GIS-based elevations of Late Quaternary palaeoshorelines, as well as temporally constant uplift rates, vary along the strike of the WCF, implying normal faulting activity through time. This suggests that (i) the fault slip rate governing seismic hazard has also been constant over the Late Quaternary, over multiple earthquake cycles, and (ii) our geodetically derived fault throw rate for the WCF is likely a more than reasonable value to be used over longer time scales for an improved seismic hazard assessment. Overall, we emphasize the importance of mapping crustal deformation within the upper plate above subduction zones to avoid unreliable interpretations relating to the mechanism controlling regional uplift.

1. Introduction

Destructive earthquakes with a magnitude higher than nine, such as the 1960 Chile earthquake (M 9.5) [1,2,3], 1964 Alaska earthquake (M 9.2) [1,4], 2004 Sumatra earthquake (M 9.1) [5,6], and 2011 Japan earthquake (M 9.1) [7], have occurred on tectonic plate boundaries associated with subduction of oceanic crust. Processes of subduction produce uplift of the overriding plate that can be recorded by flights of marine terraces that are cut into the land by the sea [8,9]. These terraces record the history of tectonics and sea-level changes over the Quaternary [10]. Data of uplift from overriding plates above active subduction zones are commonly used to derive knowledge on (i) coupling and slip distributions along the subduction interface and (ii) mantle upwelling processes [11,12,13,14,15,16]. However, there is growing evidence showing that overriding plates above subduction zones are affected by crustal deformation seismically accommodated by active faults, recorded by long-term uplifted palaeoshorelines [9,17,18,19,20,21,22,23] and short-term decadal GNSS measurements [24,25,26,27]. These studies, at different timescales, can provide continuous spatial and temporal deformation rates along and across the strike of multiple overriding plate active faults. However, there is little or lack of knowledge on crustal deformation rates through time along and across the strike of the E-dipping West Crati Fault, structurally controlling the Plio–Pleistocene Crati sedimentary basin in northern Calabria (southern Italy) [28]. Indeed, this region lies within the geologically uplifting and seismically deforming overriding plate of the Calabrian-Peloritani Arc above the Ionian Subduction Zone (ISZ), historically hit by damaging upper-plate earthquakes such as the 1184 “Valle del Crati” (M 6.75) and the 1854 “Cosentino” (M 6.3) seismic events [29], possibly rupturing the E-dipping West Crati Fault. Yet, it is still debated if this fault may be considered an active seismogenic source over multiple seismic cycles [30,31]. Moreover, associated throw rates (vertical component of slip rates) for this fault through time, representing key parameters controlling the geography of the seismic hazard and the recurrence rate of earthquakes [32,33,34], are still a matter of debate. Indeed, for the West Crati normal fault, several fault throw rates have been proposed within a range of 0.4–1.4 mm/yr by some authors [28,35,36,37] (throughout this paper, the symbol yr indicates the non-SI unit year). Yet, there is no agreement if these rates were constant or varying through time and consequently on the associated Earthquake Recurrence Intervals (ERI, or Tmean). Furthermore, for the investigated region as well as the entire Calabrian-Peloritani forearc, it is understudied if (i) “regional” uplift, associated with subduction/mantle upwelling processes [9,38,39], is affected by local crustal deformation related to the E-dipping West Crati normal fault and (ii) how these two signals may be discerned. Indeed, flights of Late Quaternary uplifted marine terraces are preserved on the footwall of the West Crati Fault and likely suggest Middle to Late Pleistocene crustal deformation [40,41]. However, rates of uplift and the effect of local active faulting on the “regional” uplift are poorly constrained and still unknown for the investigated region [42].
In the last few decades, the Global Navigation Satellite System (GNSS) has been used for geodetic investigations worldwide because of the growing availability of high-quality time series provided by dense networks [24,43,44,45,46,47,48]. A GNSS time series can generally be modelled as a linear trend affected by noise and seasonal disturbances [48]. Under the condition that the time series are sufficiently long, at least 4.5 yr as minimum series length [49], and adequate noise models are used [50], velocities from GNSS stations can be assessed and in turn used to compute the strain rate at both regional and continental/global scales [24,51]. In particular, northern Calabria was geodetically investigated using time series of permanent GNSS stations having at least 2.5 yr duration and compared the implications of the obtained strain field with the known seismicity [52]. However, previous authors did not focus on the potential role of the active faults, controlling across the strike of the Crati Valley and the northern Calabria in accommodating the ongoing crustal extension at different timescales. Moreover, for some stations, the above-mentioned minimum limit for time series length was not reached.
This paper provides new and refined horizontal and vertical deformation rates at different timescales for the E-dipping West Crati Fault and across the strike of northern Calabria. We challenge to better understand the relationship between historical seismicity, regional uplift, and processes of crustal extension. We attempt for the investigated region to (i) clarify the uplift rate related to subduction/mantle upwelling; (ii) study along-strike uplift rate variations, which, if affected by faulting activity of the West Crati Fault, will confirm Late Quaternary activity on the fault; (iii) investigate tilting rates through time for palaeoshorelines along the strike of the fault to refine gradients of fault displacement; and (iv) estimate fault throw rates from geodetic measurements. Alongside, we also use a new GNSS velocity field to calculate refined values of short-term regional extension and strain rates, in order to assess the internal crustal deformation of the northern Calabria. Finally, we combine our geological and geodetic results to discuss local and regional tectonic implications and seismic hazard assessment within the overriding plate above the ISZ, in terms of regional extensional processes seismically accommodated by a few active normal faults.

2. Material and Methods

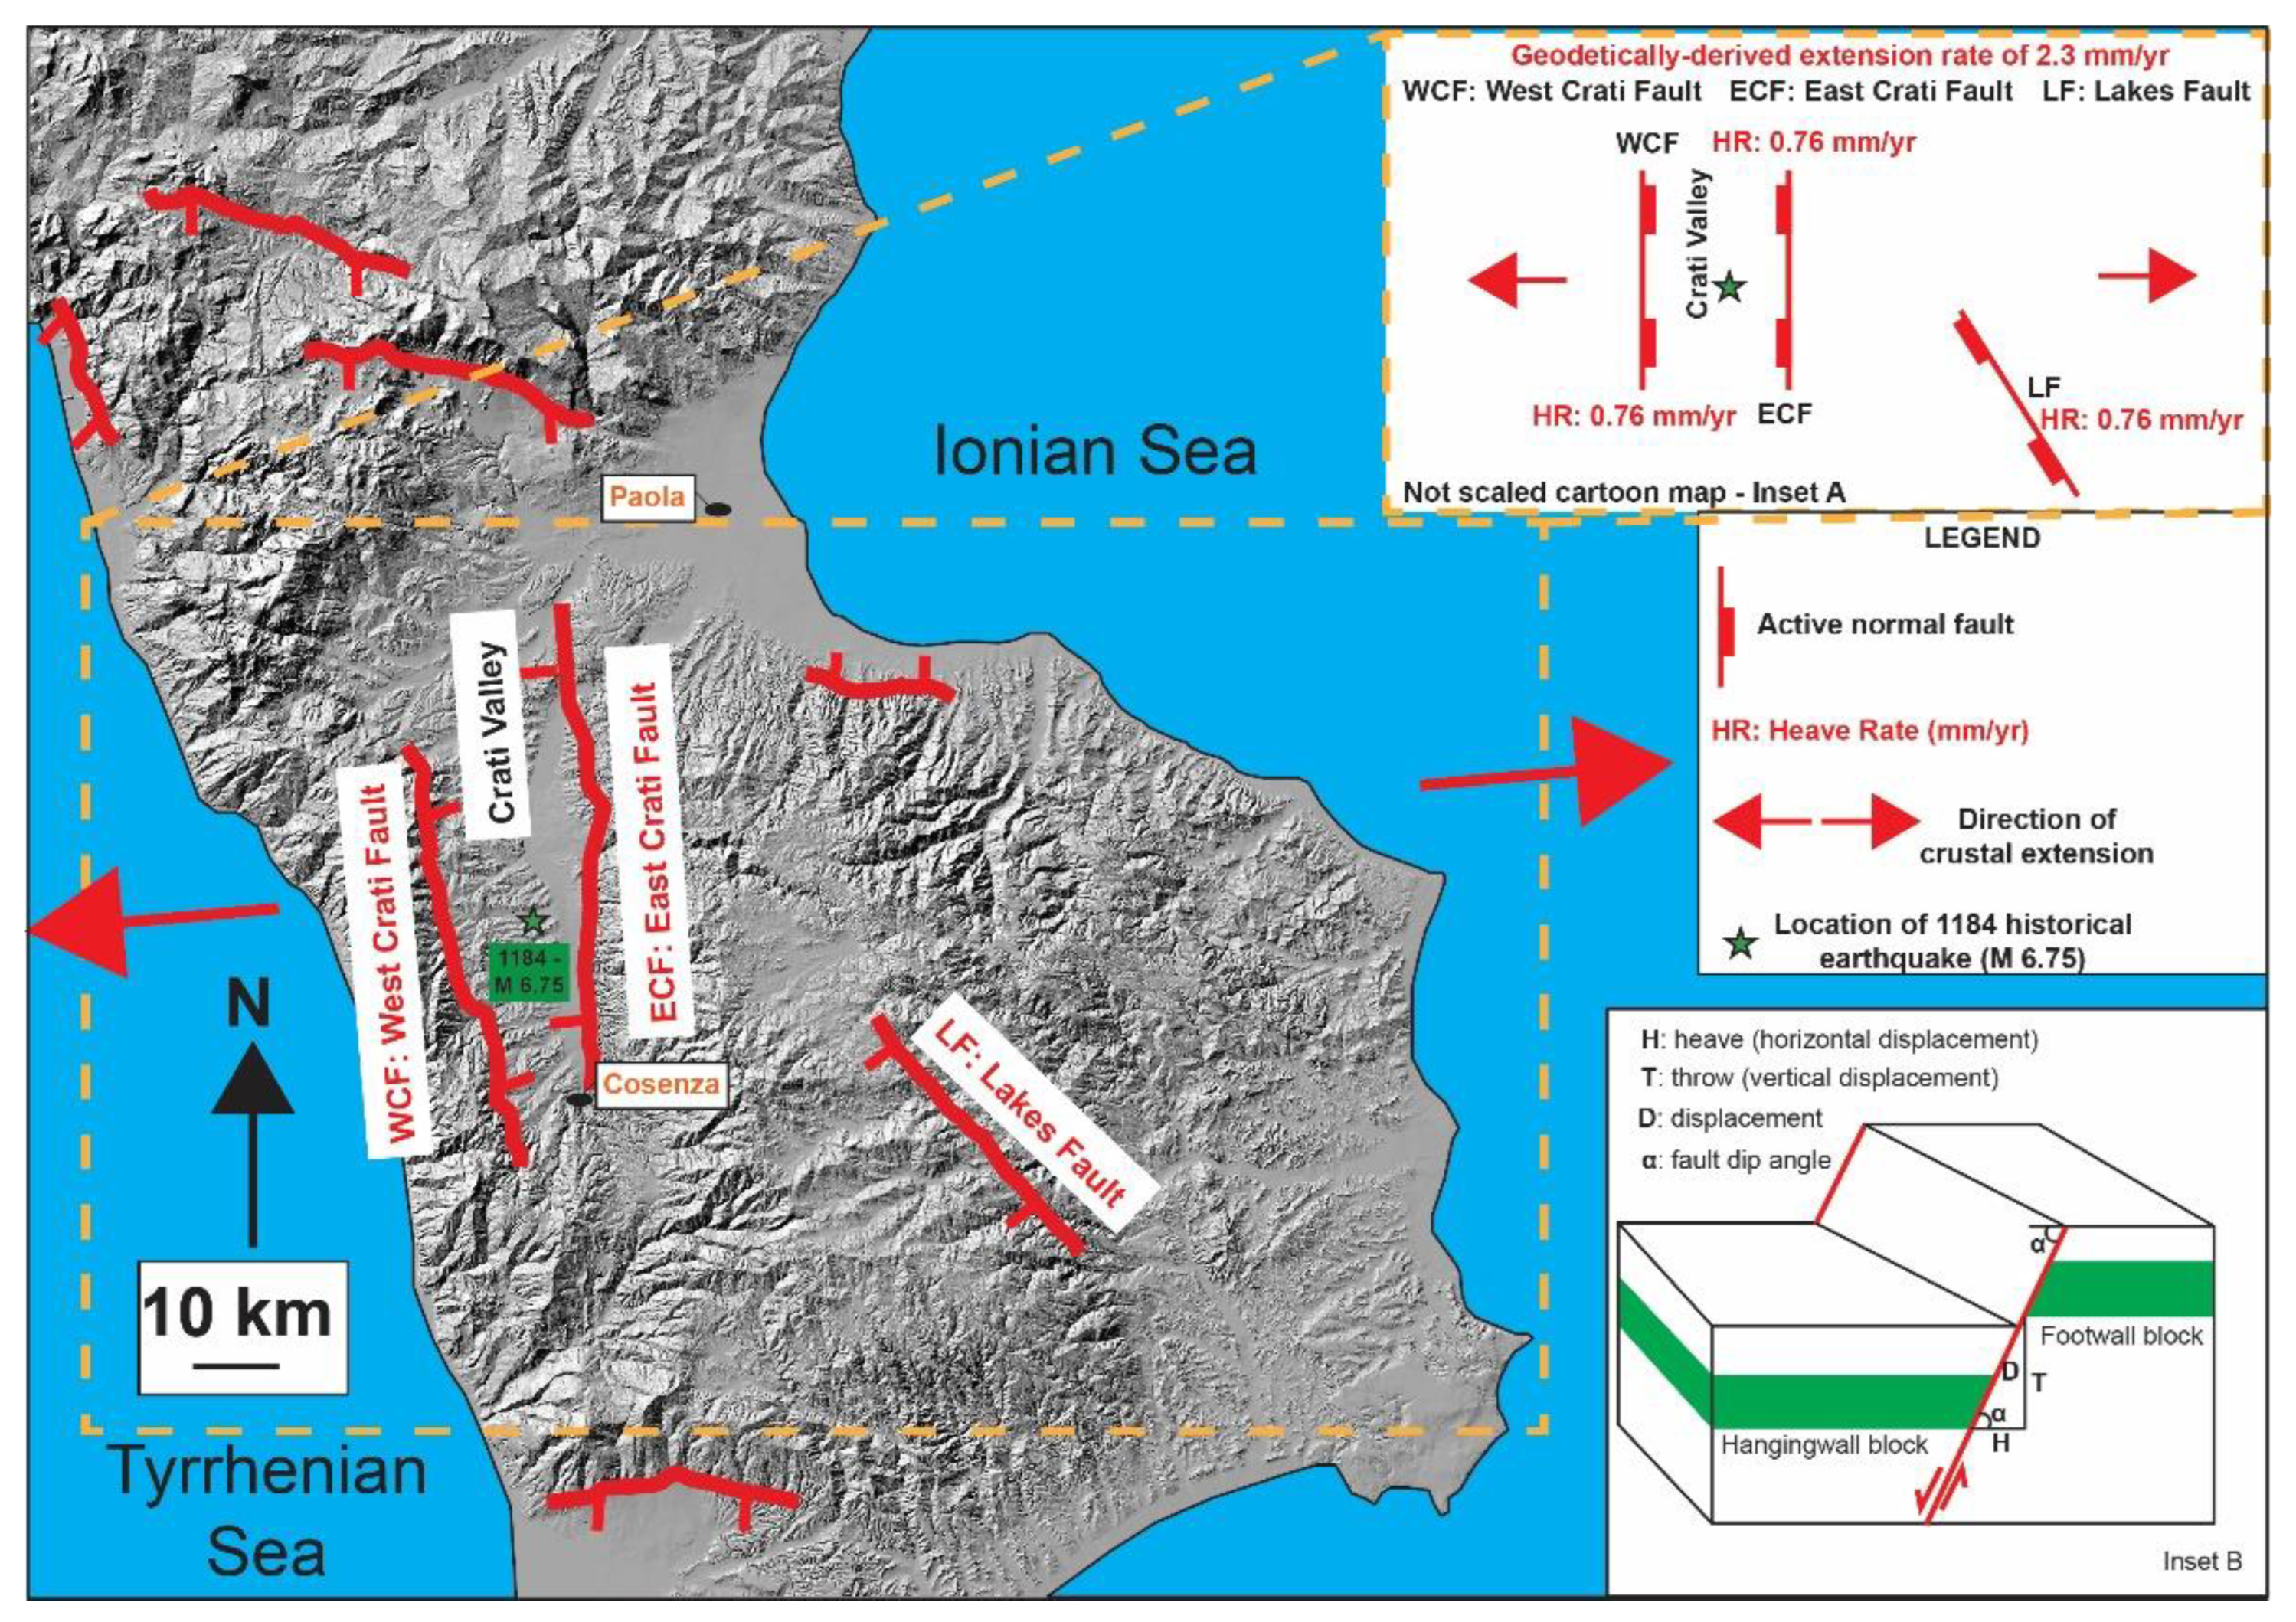
2.1. The E-Dipping West Crati Fault

2.1.1. Geological Background

The geological setting of the fault-controlled Crati Valley is associated with Palaeozoic crystalline basement outcropping on both on the footwalls of the West and East Crati normal faults, representing structural highs as previously shown by some [36]. Since ~5 Ma, post-orogenic deposits such as marine clastic successions are unconformably overlying in places Palaeozoic units [36]. The N–S oriented Crati Valley, structurally representing a graben and bounded by two horsts identified by the footwalls of the West and East Crati normal faults, shows in the lower part of the basin clastic deposits such as conglomerates, sands, and clays of Upper-Miocene–Lower-Pliocene age [36,53]. These deposits are overlaid by fanglomerates, sands, and marine clays of the Early Pleistocene in age [28,36,53]. This succession, within the basin, is topped by Middle Pleistocene–Holocene alluvial deposits. [36].
More in general, the fault-controlled Crati Valley lies within the Calabrian–Peloritani Arc, representing the overriding plate of the ISZ, linking the NW–SE-oriented southern Apennines thrust belt and the E–W oriented Maghrebide thrust belt of northern Sicily [28] (Figure 1). The Calabrian–Peloritani Arc represents one of the most tectonically active regions in the Mediterranean, formed as a response to the ongoing southeastwardly subduction of the Ionian plate beneath Calabria, probably associated with the opening of Tyrrhenian Extensional Basin and the Neogene–Quaternary Africa–Eurasia continental collision [54,55,56,57,58]. Since the Pliocene, processes of crustal extension accommodated by normal faults have fragmented the structural features formed by Neogene shortening producing a geomorphological landscape characterized by structural highs and sedimentary basins [9,59,60,61,62,63,64]. Short-term active extension and uplift are confirmed by GNSS investigations and historical seismicity for the Calabrian–Peloritani Arc [47,52,65,66,67]. Indeed, different rates of extension and strain rate have been proposed from GNSS measurements with values of 3 mm/yr and 65 nstrain/yr across the Messina Strait separating southern Calabria and Sicily [24], where nstrain is the non-SI unit nanostrain, i.e., 10−9 (actually a pure number, not a true unit), and a range of values between 2 mm/yr and 1.4 mm/yr in northern Calabria and 26 nstrain/yr and 18 nstrain/yr [46,52]. Moreover, historical damaging upper-plate earthquakes have been described within the investigated region of the Crati Valley [29]. For example, seismic events have been located within and close to the fault-bounded basin such as the 1184 “Valle del Crati” earthquake (M 6.75), the 1854 “Cosentino” earthquake (M 6.3), and the 1870 “Cosentino” earthquake (M 6.2) (Figure 1).
It is still unclear whether these seismic events have ruptured (or not) the West Crati Fault or other active faults across the strike. Empirical scaling correlations between fault size and expected earthquake magnitude may yet be used to suggest that the ~40 km mapped fault length of the E-dipping West Crati Fault could be capable of producing seismic events as large as Mw 6.7–7 [68,69]. However, this potential seismogenic source is still considered a “Debated Seismogenic Source” within the Database of Individual Seismogenic Sources (DISS) [30,31], even if it shows very similar fault geometry and size to other mapped “Individual Seismogenic Source”, deforming recent sedimentary deposits [9,63]. Indeed, we bear in mind the concept that any evidence of fault movement since the Middle/Late Pleistocene has been accepted by some as the definition of an “active fault” [70,71]. We report that the West Crati Fault could be capable of producing earthquake ruptures affecting the topographic surface because previous authors show kinematic measurements taken from striated fault scarp with dip-slip normal movement, indicating slip at the surface [36].

2.1.2. Raised Middle–Late Quaternary Palaeoshorelines and Existing Age Controls in Northern Calabria, in the Tyrrhenian Side

Regional uplift is affecting the Calabrian–Peloritani Arc above the ISZ, likely due either to the collision/subduction processes or mantle upwelling beneath the crust of Calabria or a combination of these processes [38,39,72]. The main geological signature of interaction between regional uplift and active faulting within the Calabrian–Peloritani Arc is the presence of dramatic flight of marine terraces, formed since the Middle Pleistocene [9,63,73,74,75,76,77,78,79,80,81]. We here focus on evidence that tectonically deformed sequences of palaeoshorelines have been recording the effects of Middle–Late Pleistocene normal faulting activity within the Calabrian–Peloritani Arc [9,63,80,82,83]. Moreover, as previous authors proposed in the past, we recognize on DEM, using 10 m high resolution DEMs [84], seaward-sloping marine surfaces as terraced surfaces cut by wave action, updip bounded by palaeo sea cliff, with their shoreline angle (or inner edge) identifying the palaeo mean sea level at the formation of the terrace [85,86,87,88]. In particular, within the footwall of the West Crati Fault, these palaeoshorelines can be traced parallel to the present-day coastline between the towns of Coreca and Cetraro (Figure 2 and Figure 3). These marine terraces are carved either into calcarenites and clays deposits of Upper Miocene age or in places into the Palaeozoic crystalline basement [41].
Age controls associated with this sequence of marine terraces are limited, and in this section, we review existing constraints as shown in Table 1. Furthermore, these ages are slightly located north compared to the investigated region where local tectonic effect from active faults is less prominent, in Scalea and Grotta del Prete towns (Figure 1). Indeed, these age controls lie between the southern fault tip and the hanging wall of the “Maratea Fault” [89], likely suggesting a quasi-negligible “hangingwall subsidence” local effect. For instance, in Grotta del Prete town, an age of 329 (+196 and −64) ka for the associated marine terrace at 14–22 m.a.s.l has been firstly proposed, implied by U/Th dating on corals (LB 96 sample—Table 1 from Carobene et al., 1991) [90]. However, we discard this age because new investigations have demonstrated that those corals showed re-crystallization, suggesting a younger age of 83.8 ± 3.6 ka (GRP2 sample from [56]) for the same marine terrace [91]. Furthermore, close to Scalea town, a marine terrace mapped at 16 m is assigned to the Marine Isotope Stage 5c (100 ka) implied by U/Th dating measurements on corals (SLC sample—Table 2 from [56]). The latter samples of U/Th absolute dating (GRP2 and SLC) permit suggestion of an averaged uplift rate of ~0.45 mm/yr over the Late Pleistocene [91] for a region just a few kilometres away, north of our investigated area (Figure 1). Furthermore, these latter samples show robust activity ratios for U/Th dating on corals (δ234 Ui) with values of 190 (GRP2) and 335 (SLC), in agreement with present-day oceanic δ234 Ui value of ~145 [19,73].
This lack of absolute age constraints for outcropping yet mapped marine terraces within the footwall of the West Crati normal fault is a common problem for regions affected by relatively low uplift rates [9,19,63,88]. For this reason, it is important to use the knowledge of dated palaeoshorelines to estimate ages of other undated palaeoshorelines. In the past, several authors have tried to estimate uplift rates by applying a “sequential correlation” approach [85,92,93,94,95,96]. This approach is based on the concept that, given a dated palaeoshoreline, the next higher and older palaeoshoreline should belong to the next older glacio-eustatic sea-level highstand; this is shown in previous investigations using raised marine terraces with relatively low uplift rates [95,96,97]. Yet, this approach is prone to erroneous uplift rate derivations because it does not take into account the well-known “re-occupation or overprinting problem” [38] where older marine terraces are re-occupied by subsequent younger and higher palaeo-sea-level highstands, identifying a new marine terrace [9,19,20,63,73,88]. If this is not taken into account, it may lead to incorrect age assignments for undated marine terraces, with likely erroneous uplift rate derivations through time [9]. However, previous investigations have shown a different approach, named “synchronous correlation” approach, whereby given an uplift rate driven by age controls, it allows calculations of all expected/predicted elevations of glacio-eustatic sea-level highstands identified by marine terraces [19,98]. These predicted elevations are correlated with all GIS-based mapped and measured palaeoshoreline elevations synchronously rather than sequentially; this permits overcoming of the “overprinting problem”, allowing more robust scenarios for uplift history to be provided, as widely shown by some within the Mediterranean realm [9,19,20,63,73].
Table 1. Age controls associated with the studied sequence of marine terraces taken from the literature.
Ref.Dating MethodDated Sample DescriptionProfile NumberReported Age (ka)Assigned Highstand (ka)Palaeoshoreline Elevations (m a.s.l)
Carobene et al., 1991, [93]U/Th dating on coralsCladocora coespitosa bearing biocalcarenite is present along almost the entire studied portion of the coast. The deposit appears as a relic of the original one after the action of the marine erosion. […] The age was confirmed by field observations and age determinations carried out in Calabria.”North Profile 18329 (+196 and −64)340 (MIS 9e)14–15
Cerrone et al., 2021, [56]U/Th dating on coralsThe inferred elevation of the platform inner edge is +22 m with a ± 1 m uncertainty because of a colluvial cover. The abrasion platform is mantled by an up to 20 cm thick conglomerate composed of pebble- to boulder-size clasts. The matrix is locally abundant and consists of coarse- to very coarse-grained sandstone. An overlying bioconstruction consists of encrusting algae, bryozoans, gastropod and bivalve shells, and colonial C. caespitosa corals (samples GRP1 and GRP2; Figure 7b). The bioconstructed body is blanketed by coarse-grained sandstones to granule-grade deposits showing horizontally to low-angle lamination; at the top beds are bundled into weakly discordant sets (Figure 7c).North Profile 1883 ± 3.6100 (MIS 5c)22
Cerrone et al., 2021, [56]U/Th dating on coralsA C. caespitosa colony and a flowstone coating a coral bioconstruction have been sampled for U-series dating (samples SLC and SLC05, respectively) […]. At Scalea, the T2 abrasion platform is located at elevations of >12 m (outer edge). For the T2 inner edge, which is hidden by the slope deposits, we inferred an elevation in the range of 16 ± 1 mby integrating GPS measurements with topographic data.North Profile 1898 ± 4.0100 (MIS c)16
Table 2. Values of sea-level highstands derived from Siddall et al. (2003) and Rohling et al. (2014) used to calculate predicted palaeoshoreline elevations iterating values of uplift rate.
Age (ka)Elevation of Highstands (mm)Age (ka)Elevation of Highstands (mm)Age (ka)Elevation of Highstands (mm)
00200−500055010000
30−80000217−300005603000
50−60000240−500059020000
76.5/80−30000285−3000062020000
100−25000310−2200069510000
115−2100034050007405000
119−5000410−500080020000
1255000478085520000
175−300005252000098025000

2.2. Methods

In this section, we present how we investigate (i) refining changes in space and time of uplift and the associated rates along and across the strike of the West Crati Fault and (ii) deriving strain and extension rates from GNSS measurements for investigated region in northern Calabria. This was aimed at better understanding if the regional uplift is affected by local active faulting and if different timescale deformation rates may lead to a refined seismic hazard assessment for the West Crati normal fault and across the strike of the northern Calabria. Below, we describe methodologies used in this study.

2.2.1. Elevation Data from DEM-Based Topographic Analysis of Mapped Marine Terraces

We have carried out detailed GIS-based topographic and geomorphological analysis by using 10 m high resolution digital elevation model (DEM) provided by INGV TINITALY [84]. This approach has been widely proposed where raised marine terraces are used for tectonic and crustal deformation investigations in the Mediterranean realm [9,20,63,73,87]. In particular, we have produced several topographic profiles perpendicular both to the actual coastline and the strike of the fault over the ~40 km extent of the fault (Figure 2 and Figures S1–S4), where each profile intercepts a sequence of marine terraces outcropping on the fault footwall. We have mapped inner edges (or shoreline angles) identifying palaeoshorelines (Figure 3 and Inset A), representing glacio-eustatic palaeo-sea level associated with a highstand. These are confirmed in many locations by the existence of prominent breaks of slope identifying palaeoshoreline inner edges on the DEM, where scarp-like palaeo-sea cliffs bound a seaward sloping flat marine updip. Palaeoshoreline indicators and the topography are used to depict the location of each topographic profile; for instance, areas affected by fluvial incision caused by the coupled action of rivers and uplift are avoided to ascertain that we investigated geomorphological features associated with marine and not fluvial geomorphological features [63]. Indeed, our topographic profiles are produced along uplifting interfluvial areas where marine terraces are better preserved and mapped.

2.2.2. Synchronous Correlation Approach to Model Multiple Glacio-Eustatic Sea-Level Highstands and Multiple Raised Marine Terraces

This method has been widely described by previous studies where uplifted marine terraces are used for tectonic and seismic hazard investigations in the Mediterranean realm and elsewhere, outlined in [9,19,20,63,73,86,88,98]. This approach is based on the concept that glacio-eustatic sea-level highstands, which combined with tectonic uplift are thought to produce marine terraces [10], are unevenly spaced in time, indicating that for a constant uplift rate over time, uplifted marine terraces will be preserved in the landscape unevenly spaced in elevation [19,98]. It is important to highlight that this approach also works if uplift rates change through time as demonstrated by previous studies in Greece and southern Italy [19,99]. Furthermore, re-occupation of marine terraces within regions showing relatively low uplift rates may occur for both constant and fluctuating uplift rate scenarios. Indeed, this occurs where palaeo-sea level at a highstand lies beneath the level of present-day sea level because of reduced volume of global ocean at that particular time, combined with a low uplift rate [73]. These coupled processes imply that younger sea-level highstands with larger volume of global ocean and higher palaeo-sea-level elevation overcome and re-occupy older palaeoshorelines during sea-level rise [38,73]. We report that the synchronous correlation technique overcomes this problem due to the fact that all palaeoshoreline elevations are calculated on topographic profiles, yet sequential correlation tends to mislead for uplift rate calculations in this scenario if the “re-occupation” problem is not taken into account [19,73]. Furthermore, age constraints drive the uplift rate iteration, and it is desirable to have at least one dated palaeoshoreline across the investigated area. This allows us to test the first and simplest assumption of having a constant uplift rate through time and evaluate if the iteratively calculated glacio-eustatic sea-level highstand elevations match the measured and mapped palaeoshoreline elevations [73]. If a robust correlation is not found for the simplest scenario, a changing uplift rate through time is investigated, with iteration of uplift rates driven by age constraints aimed to find the best match with DEM-mapped and measured palaeoshoreline elevations [73]. For the calculation of glacio-eustatic sea-level elevations, well-known sea-level curves for our palaeoshoreline modelling are used (Table 2) [100,101], with negligible differences in terms of uplift rate derivation if different sea-level curves are used [20].
Our topographic analysis of marine terraces is carried out by constructing topographic profiles intercepting the palaeoshorelines from DEM data (Figure 2). In order to perform the synchronous correlation, iteration of uplift rates is enabled by the so-called “Terrace Calculator” built in Excel already available in the literature where data from sea level highstands derived by well-known sea level curves are input [9,63,73]. As previously shown, this “Terrace Calculator” allows using uplift rate (UR) as input data, which is iterated to compute the predicted elevations (PE) of all sea-level highstands using the age of the highstands (T) and the sea-level elevations of each highstand (SLE) using the formula P E = ( U R × T ) + S L E   [9,20,63,73]. In more detail, rates of uplift are iterated for the entire topographic profile, constrained where available by dated palaeoshorelines, in order to find the best match between multiple measured palaeoshoreline elevations and multiple predicted sea-level highstand elevations (within a range of ±10 m). This allows for assigning predicted ages of glacio-eustatic sea-level highstands to undated palaeoshorelines. We then perform linear regression analysis, forcing the R2 value to maximize, to quantify if a correlation exists between the “measured” (or mapped) elevations of all palaeoshorelines from DEM data and the “predicted” (or expected) elevations identifying sea-level highstand elevations implied by iteration of uplift rates driven by age controls and by means of well-accepted sea-level curves for the last ~1 Ma (Table 2) [100,101]. Finally, we replicate this iteration for each topographic profile, constructed across the strike of the marine terraces and along the entire strike of the fault in order to determine the extent of the deformation caused by the fault.

2.2.3. GNSS Data Analysis and Strain Rate Computation

We have studied the crustal deformation for the investigated area by using GNSS measurements. In northern Calabria, there are 32 regionally well-distributed permanent GNSS stations. However, only 19 of them can be considered for our study because they must show a time series of at least 4.5 yr, which is the minimum time-series length compatible with reliable results, as suggested by [49]. Moreover, one station, KROT, is placed on an unstable slope; thus, it cannot be used to estimate strain rates and crustal extension, as already outlined by previous studies [47,52]. For these reasons, we have used 18 GNSS stations for our study, whose main details are summarized in Table 3, and, including the WGS84 coordinates (EPSG 4326), in Table S1 (Supplementary Material). We also report that for the investigated region in northern Calabria, there is no reliable time series from non-permanent GNSS stations to our knowledge.
The time series used for this study were the 24 h final solutions available at Nevada Geodetic Laboratory (NGL) database [102]. These time series have been processed by NGL by means of JPL GipsyX v1.0 software on the basis of several parameters such as nominal troposphere, troposphere delay models from VMF data server, elevation-weighted observations, higher order ionospheric calibrations, improved JPL Repro 3 orbits, and the global reference frame IGS14. Since northern Calabria is close to the southern margin of the Eurasian plate, two plate-fixed reference frames were considered: (i) Eurasian Plate (EU) and African Plate (AF). In both cases, the plate rigid motion has been removed using the Euler poles defined previously by [103], allowing the recognition of plate rotation effects.
We have processed the EU and AF time series for each considered station after having obtained daily positions from NGL, in order to obtain horizontal velocity components in east and north directions and the associated standard deviations (SDs). In particular, for each station and each direction, we have estimated parameters such as (i) the seasonal and half-seasonal components and (ii) models for chosen noises such as white noise and power law noise by means of the maximum likelihood estimation (MLE) method implemented in HECTOR software package [50]. It is important to note that before estimating the above-mentioned parameters, we carried out offset recognition and outlier removal. Specifically, we defined measurements outside three times the interquartile range (IQR) as outliers and therefore removed them.
Once the velocities of the GNSS stations and the corresponding standard deviations were obtained, we then computed the horizontal strain rate field on a regular grid by means of the modified least square (MLS) approach implemented in grid_strain MATLAB toolbox [104]. The contribution of a GNSS station to the strain-rate estimation in a grid point is weighted by exp ( d / d 0 ) / σ v 2 , where σ v is the standard deviation (SD) of the station velocity, d is the station-node distance, and d 0 is a scale factor introduced to define the level of locality of the estimation. This allows for carrying out different analyses focusing, for instance, on the area across either one or more of the faults or on the entire region. We provide, for each scale factor and for each node of the chosen grid: (i) the strain rate, i.e., maximum and minimum principal strain rates ε ˙ max and ε ˙ min ; (ii) the rate of change in area (or dilatation), i.e., the trace of the strain-rate tensor (first invariant of the strain rate tensor) Δ ˙ = ε ˙ max + ε ˙ min ; (iii) the field of the engineering shear rate γ ˙ = ε ˙ max ε ˙ min normalized to Δ ˙ , i.e., γ ˙ / Δ ˙ . Both the rates Δ ˙ and γ ˙ allow the recognition of the zones of the studied area characterized by different behaviour. However, the rate of change in area Δ ˙ neglects nature and geometry of the strain tensor and therefore allows an evaluation of the deformation pattern inside an area having a specific behaviour (extensional or compressional). Instead, the normalized engineering shear rate, γ ˙ , also provides information on the sign of both the principal strains and therefore is particularly suitable to the recognition of the boundaries between areas characterized by different kinematics. Our analysis also provides the uncertainties of the computed parameters and a map of the geometric significance of the results. In particular, the results obtained in a grid node are considered to have high geometric significance if the GNSS stations within the scale factor are distributed on all four 90° quadrants around this node, whereas they are considered to have mid geometric significance if no more than three quadrants are filled. In all the other cases, the results are considered to have low significance. Since the strain rate does not depend on the choice of a specific reference frame, it was computed with the EU velocities only.

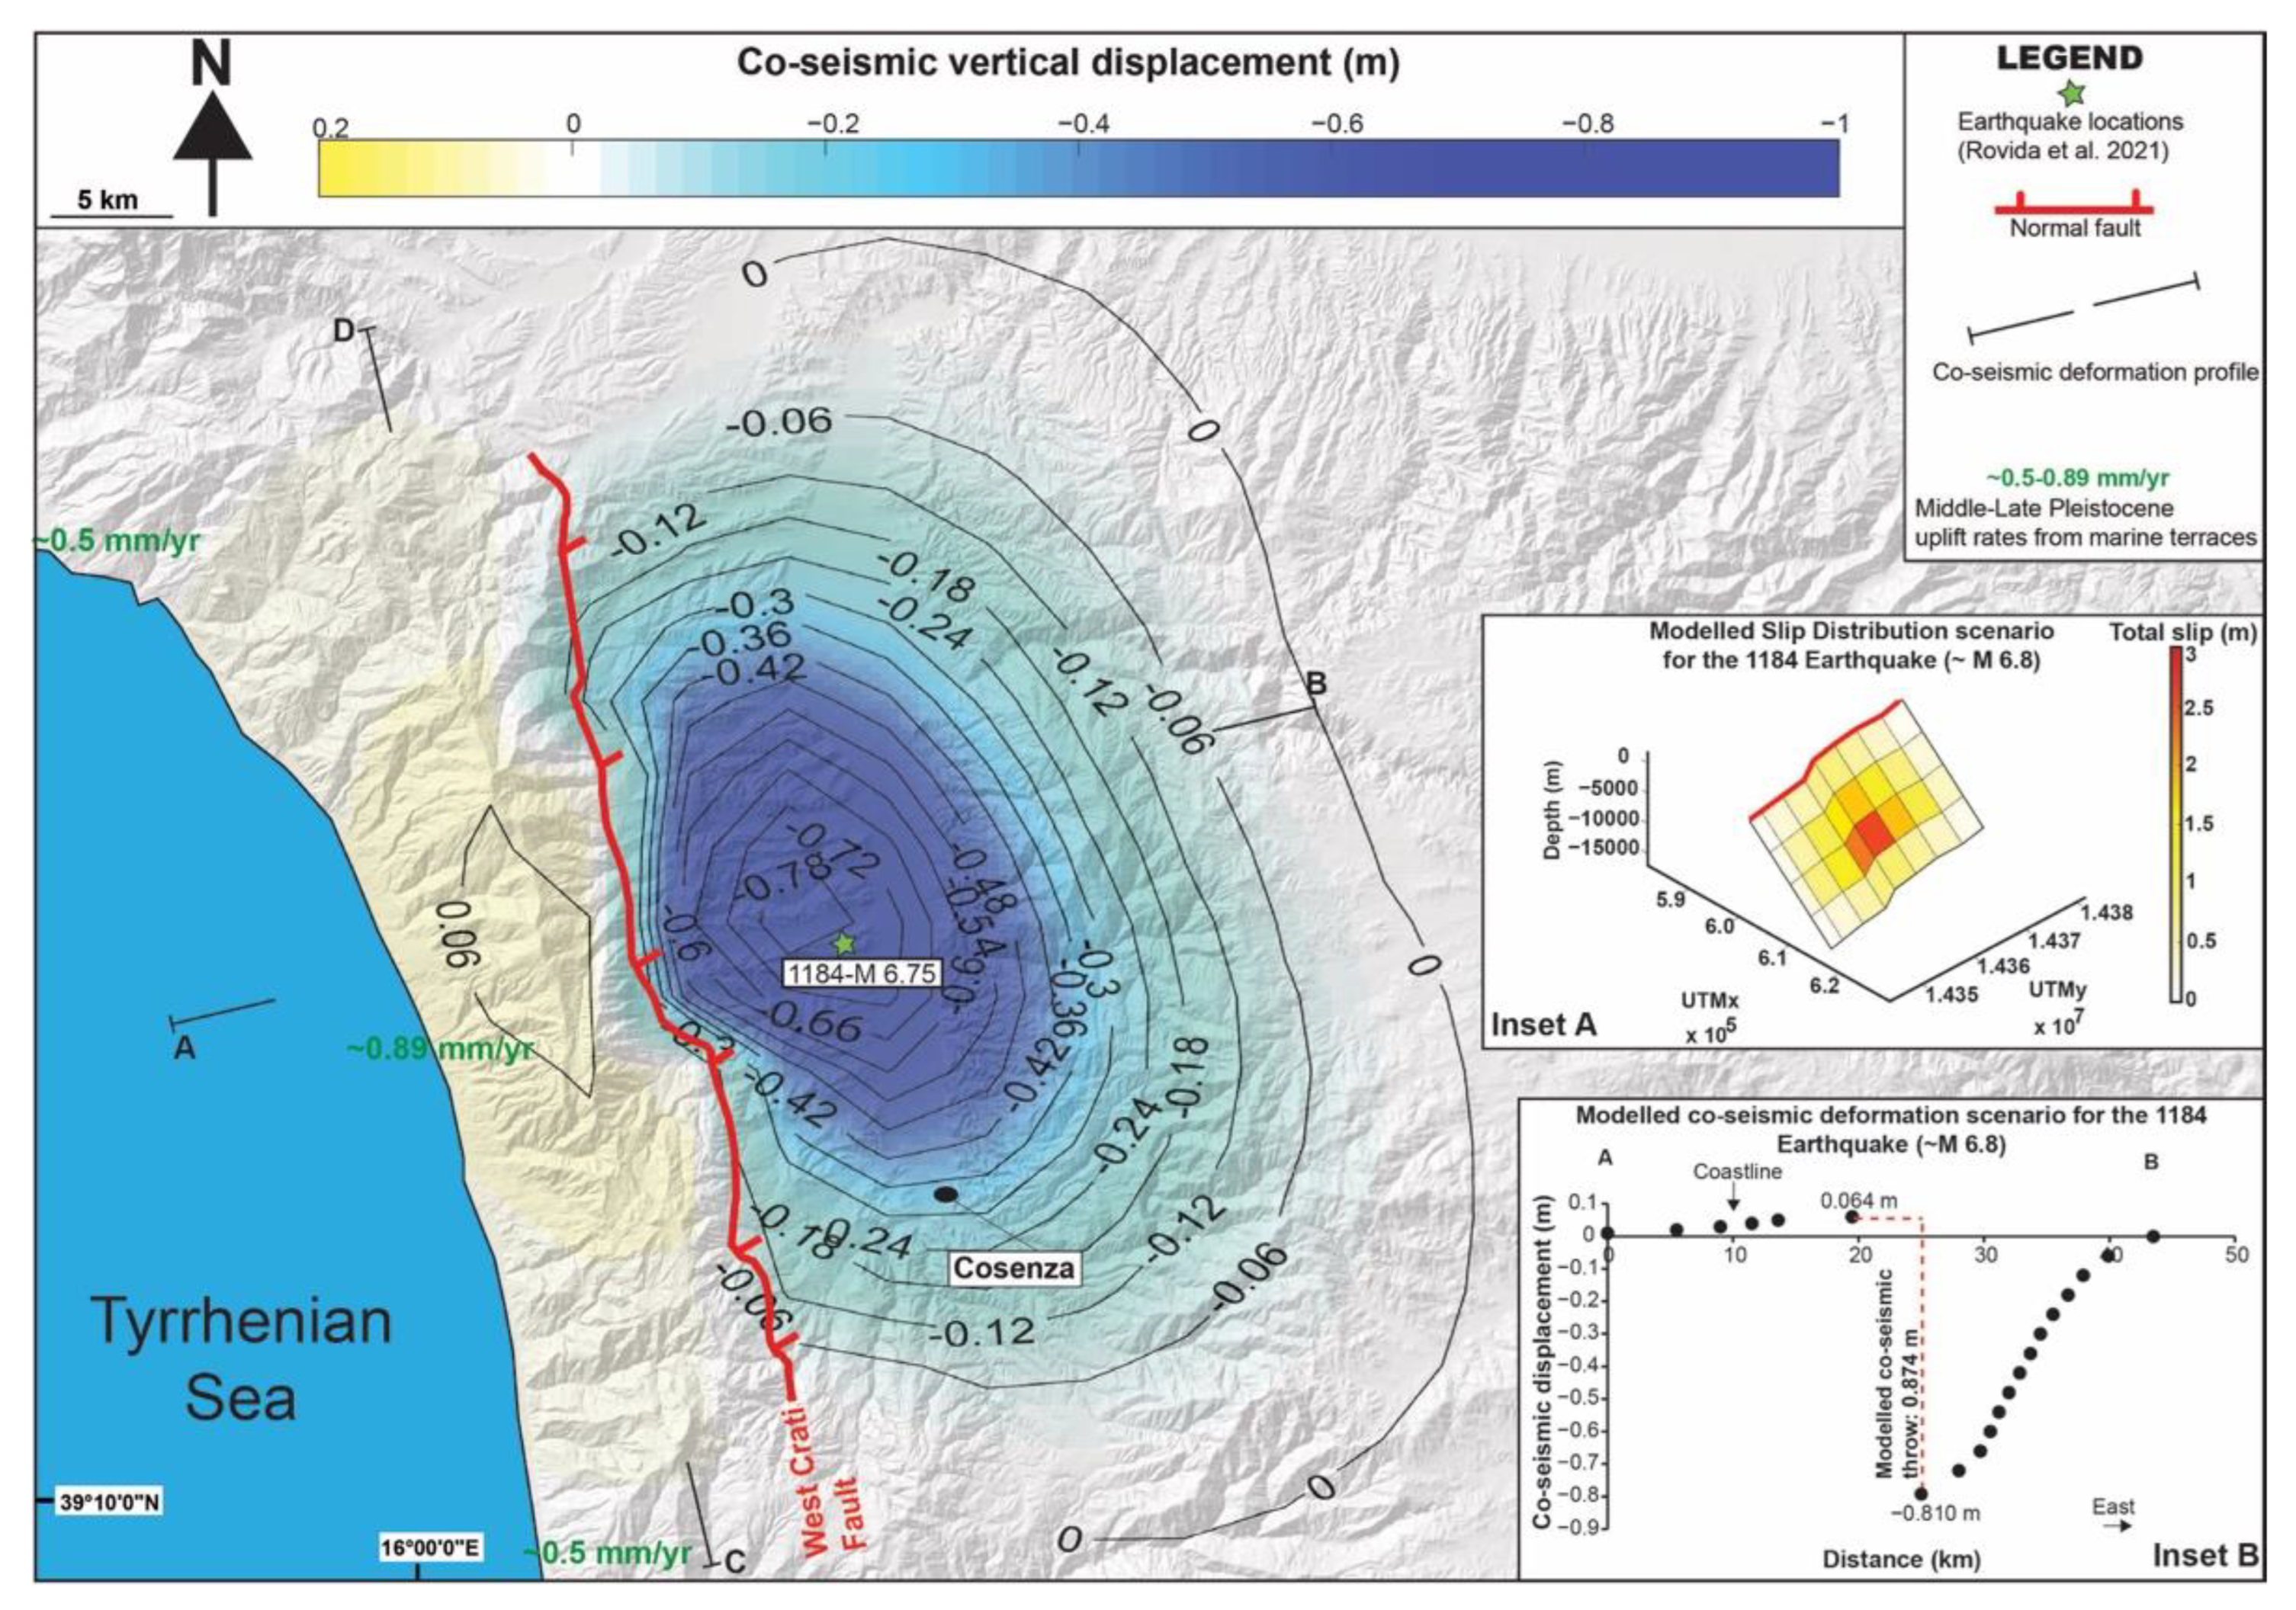
2.2.4. Vertical Co-Seismic Deformation Calculation to Estimate Earthquake Scenarios for the West Crati Fault

In order to (i) investigate possible earthquake scenarios associated with the co-seismic rupture of the entire length (~40 km) of the West Crati Fault and (ii) test if a correlation may exist between co-seismic and long-term crustal deformation, we carried out elastic half-space modelling using Coulomb 3.4 software [105]. We used a modified trace of the fault from [37], according to the geomorphology mapped using Google Earth and high resolution DEMs. The mapped fault trace was used as input information into the modelling using a new MATLAB code [106] into Coulomb 3.4 software proposed in the past for other investigations where curvilinear faults are used to derive co-seismic vertical deformations and Coulomb stress-change calculations, producing corrugated 3D fault surface [73,87,106,107]. Indeed, this code allows for calculations of vertical and horizontal displacements arising from seismic events rupturing active faults with variable-strike geometry [107]. It is important to note that it is well-recognized that geometry of active faults affects Coulomb stress transfer [106,108,109], consequently influencing strain and displacements nearby the causative fault. We then used an averaged value of fault dip angle of 45° for the West Crati Fault, based on several field data provided in the literature [28,36,37,110]. We also used a concentrical slip distribution according to well-known scaling relationships between earthquake magnitude, slip at depth, and fault length [68], as already proposed by some in southern Italy [73,107], to obtain a modelled earthquake magnitude of ~Mw 6.7–6.8, which are values that match magnitudes of the historical earthquakes, within a margin of error, shown in Figure 2. Finally, we correlate co-seismic and long-term crustal deformation along the N–S-oriented West Crati normal fault.

3. Results

In the following, we firstly show that our synchronous correlation technique advocated in the previous section allows us to replicate measured palaeoshoreline elevations by finding the best match with predicted sea-level highstand elevations. We attempt to correlate elevations of palaeoshorelines mapped on the uplifting footwall and along the strike of the West Crati Fault. We therefore use the derived temporal and spatial constraints related to the geometries of palaeoshorelines to derive long-term rates of uplift over the Late Quaternary and how these are associated with displacements on the West Crati normal fault. We finally show refined short-term rates of extension and strain from new GNSS measurements and how these rates relate to the long-term fault-controlled crustal deformation implied by investigating raised marine terraces.

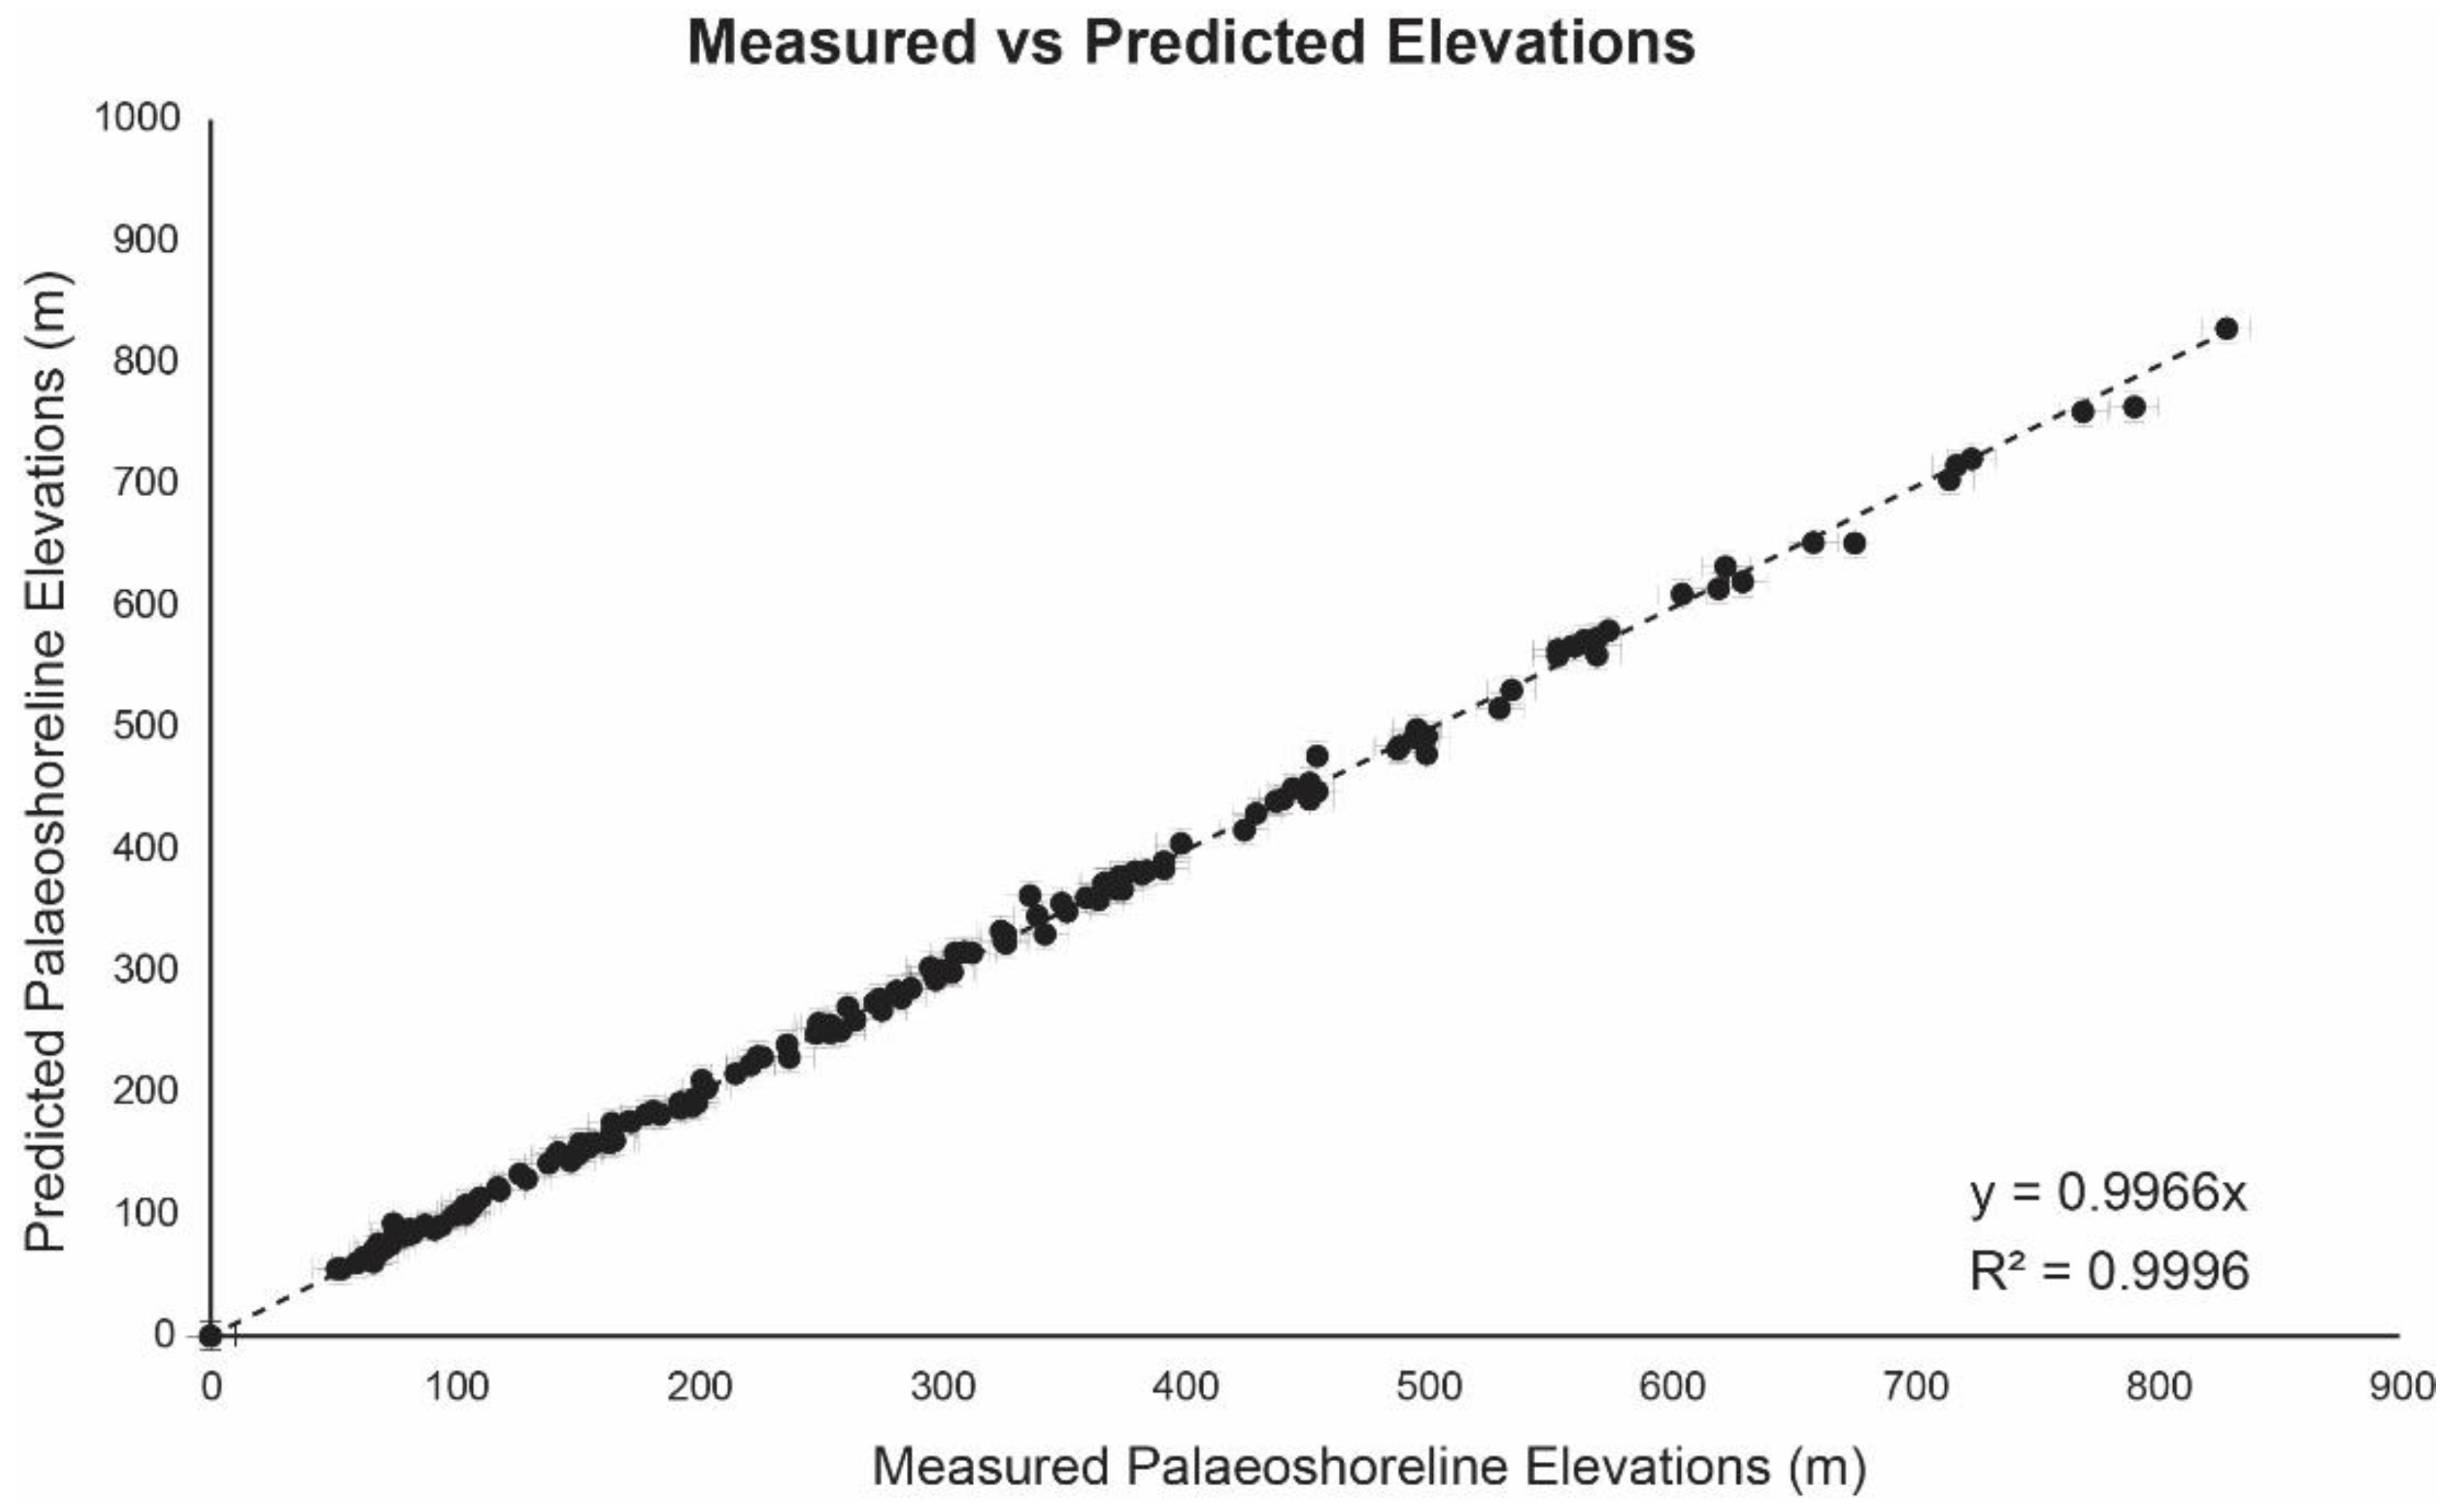
3.1. Synchronous Correlation Modelling to Refine Ages for Undated Marine Terraces

We present our synchronous correlation between DEMs-based palaeoshoreline elevations and those predicted by iterating rates of uplift (Figure 4 and Figures S5–S10). It is important to note that this iteration is driven by age constraints (Table 1) identified north of the northern fault tip of the West Crati Fault (Figure 1); they lie between the hanging wall yet very close to the southern fault tip of the Maratea Fault and over its southern tip, suggesting minimum to negligible deformation from local upper-plate faulting. Indeed, we have iterated rates of uplift to find the best match between mapped and predicted elevations of marine terraces following a few criteria already proposed by previous studies [9,63], such as (i) prominent mapped marine terraces were iteratively assigned to the most common sea-level highstands mapped worldwide (125 ka–MIS 5e, 240 ka–MIS 7e, and 340 ka–MIS 9e, Figure 3) [9,63,73,111] and (ii) maximizing the coefficient of determination, R2 value, showing how well other less clearly mapped marine terraces fit the predicted sea-level elevations. For the first time, refined ages are proposed (Table 4) for mapped yet undated raised marine terraces outcropping on the footwall of the West Crati Fault by applying a synchronous correlation approach, which takes into account the “re-occupation” problem for relatively low uplifting regions such the Calabrian–Peloritani Arc [9,63]. This permits us to investigate marine terrace elevations and associated uplift rates along the strike of the West Crati Fault. Note that we have used 10 m high-resolution DEMs as proposed previously for other studies within the Calabrian–Peloritani Arc [9,63,112] where excellent correlations have been shown between marine terraces mapped on DEMs and in the field, suggesting a reliable robustness of our GIS-based marine terraces mapping for this study.
Figure 5 shows a very robust synchronous correlation between our multiple mapped palaeoshoreline elevations and the predicted ones (Figure 4, Table 2, and Spreadsheet S1) within a margin of error, suggesting we have obtained consistent uplift rate estimates. This is a crucial key observation because it also suggests that rates of uplift mapped on the footwall of the West Crati Fault have been constant through time. Furthermore, we have mapped 17 order of palaeoshorelines, in agreement with previous studies, for the Calabrian–Peloritani Arc [37,38,42,113] associated with the sea-level highstands as old as 100–980 ka (not all mapped within a single topographic profile), as previously recognized elsewhere within the Mediterranean realm [9,19,20,63,73,88]. Evidence in places of marine terraces as old as 980 ka confirm that the investigated region has been uplifting since then, in agreement with previous investigations [37,38]; however, we cannot rule out that the onset of the uplifting process may likely be older. This is in contrast with the previous proposed onset at 700 ka for the “regional” uplift of the Calabrian–Peloritani Arc [38].

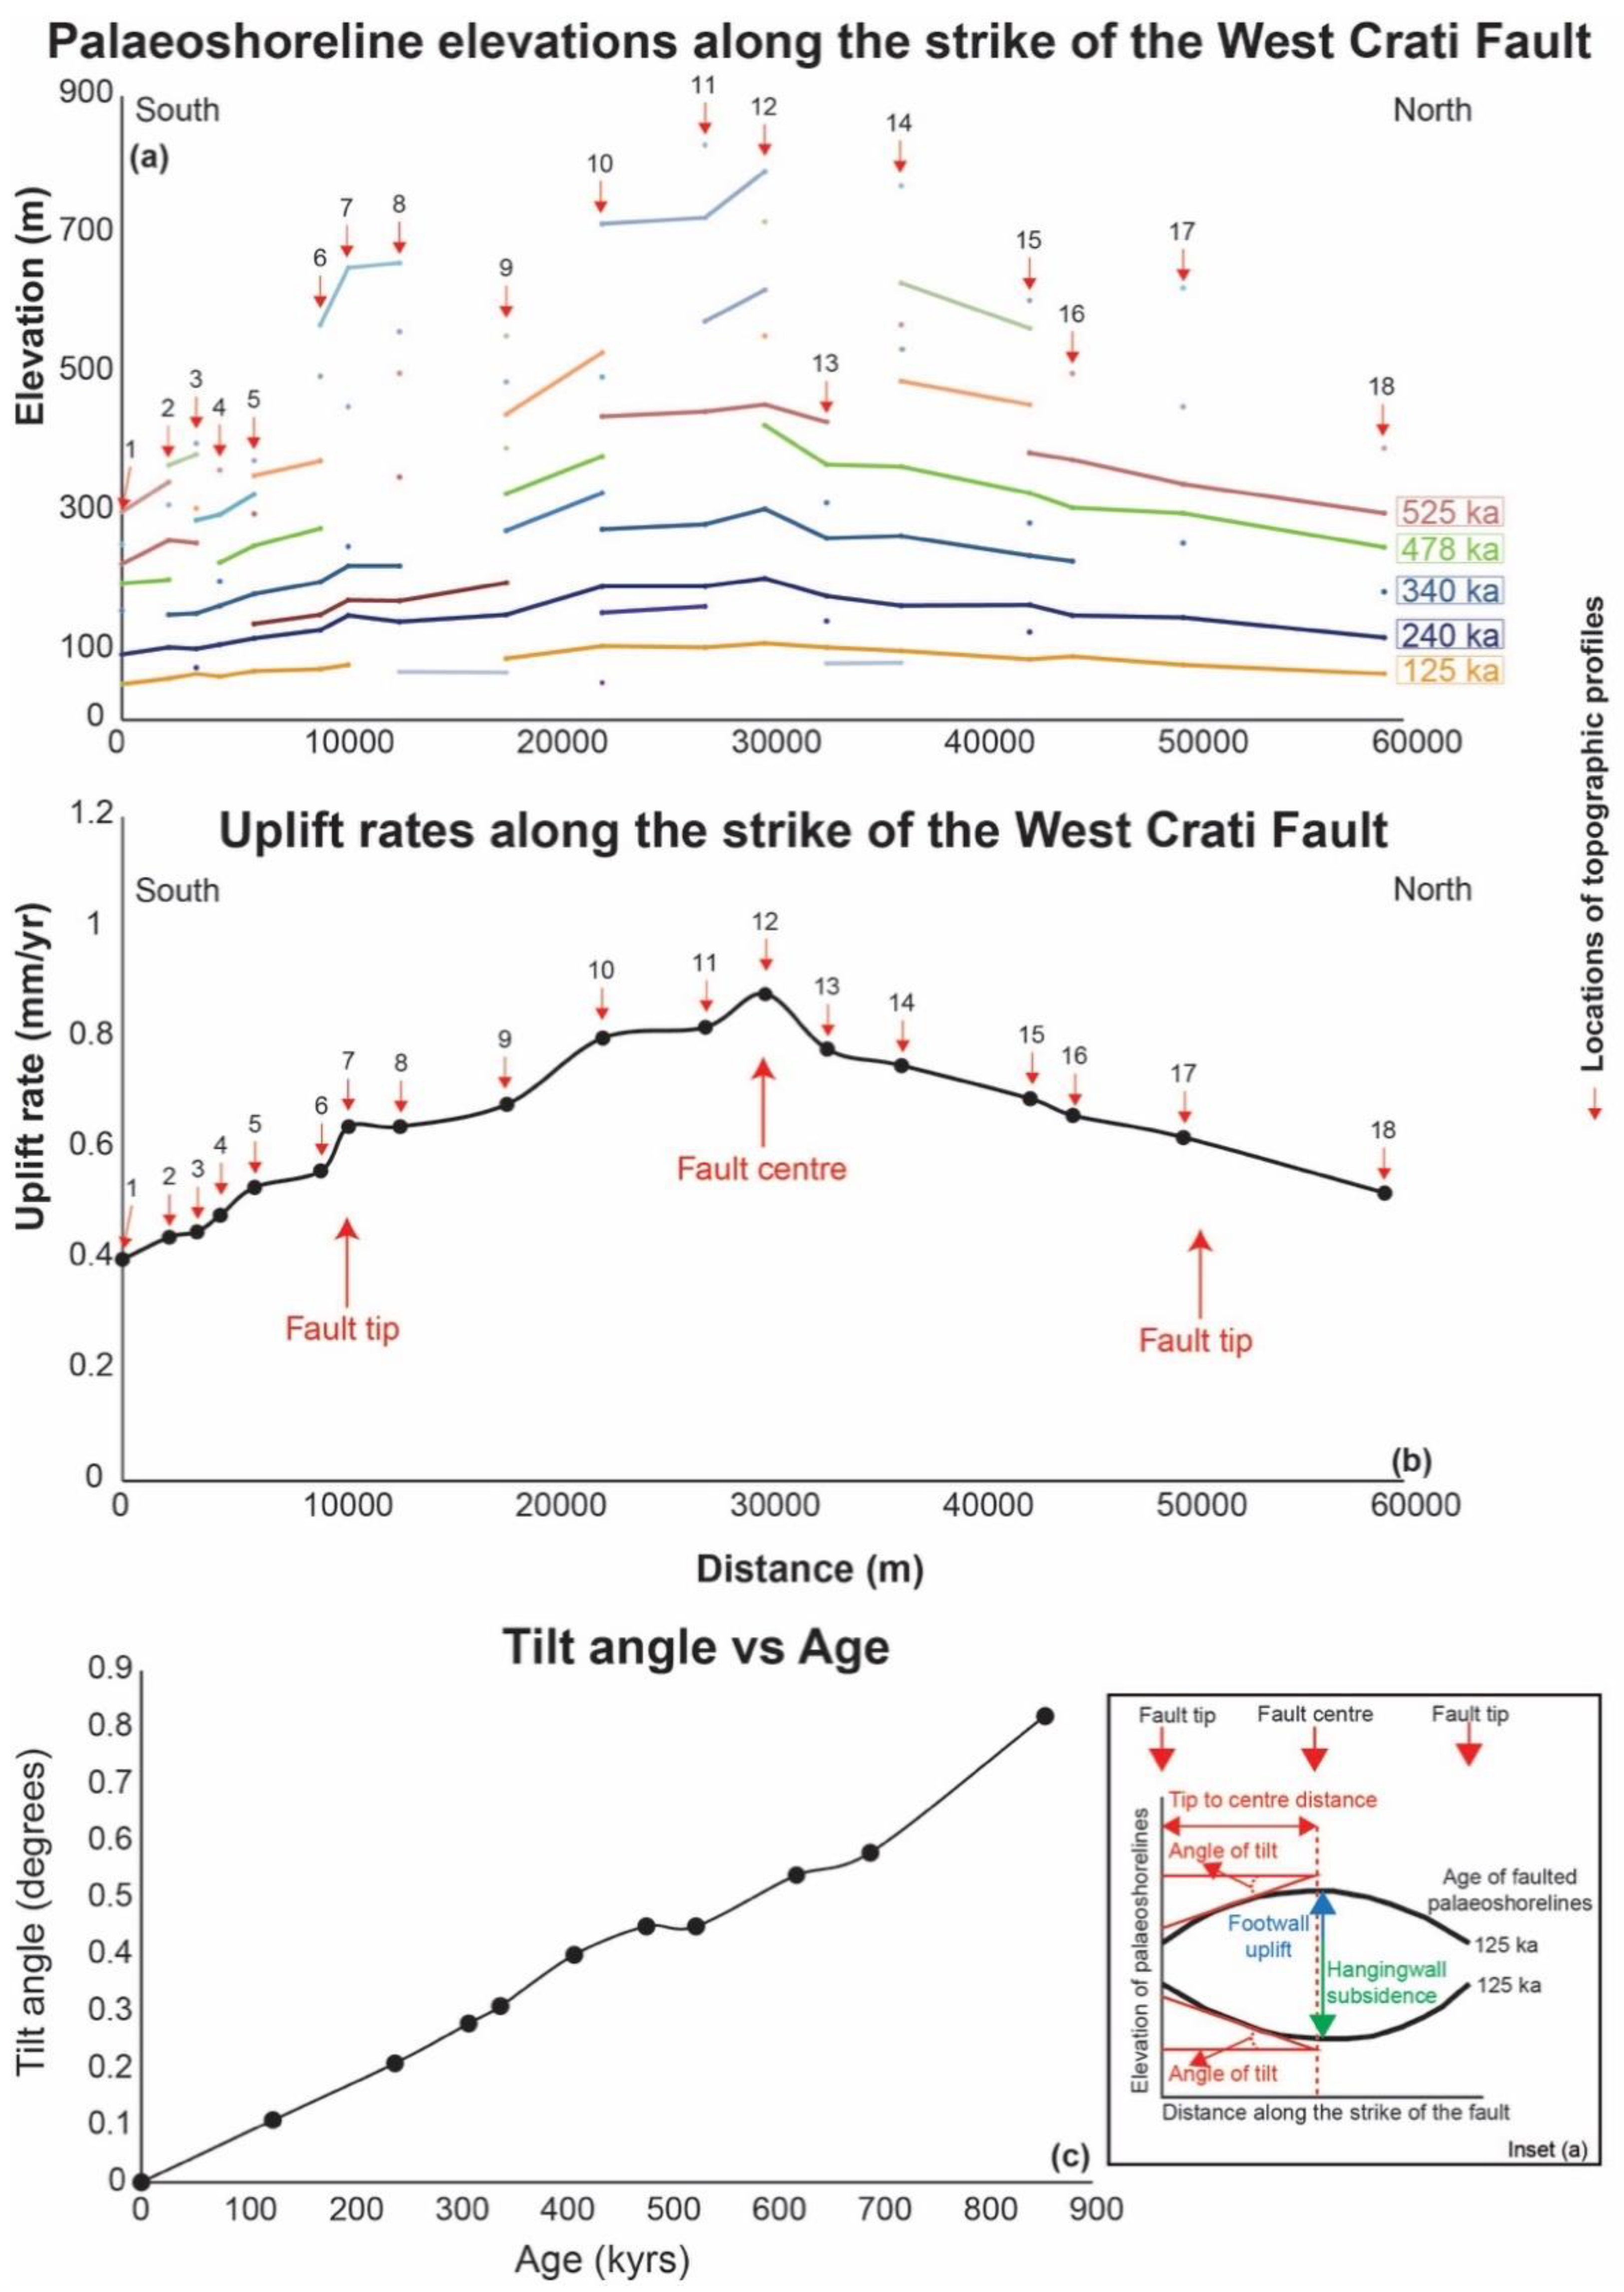
3.2. Uplift and Uplift Rates along the Strike of the West Crati Normal Fault

Figure 6a shows spatial changes of uplift along the strike of the West Crati Fault, which have been recorded by the geometry of the marine terraces. In particular, our synchronous correlation shows that rates of uplift are constant over the Middle–Late Pleistocene yet change spatially, with values of uplift rates between 0.87 mm/yr in the centre of the fault footwall, diminishing towards the fault tips and beyond where the uplift rates are 0.4 (southern tip) and 0.52 (northern tip) mm/yr (Figure 6b). The latter value is not surprising if we consider that [56] show an averaged value of ~0.45 mm/yr where a quasi-negligible effect may be considered from the hanging-wall tectonic subsidence due to the Maratea Fault activity in the northern area. Furthermore, our refined uplift rates are in agreement with previous studies where values of ~0.86 mm/yr had been proposed for this region since the end of the Early Pleistocene (700 ka) [114]. It is important to note that beyond the fault tips, no active faults are mapped, yet a “regional” signal of uplift is recorded (Figure 6b), suggesting that mapped and uplifted marine terraces on the footwall of the West Crati Fault represent a combination of the “regional” uplift signal and the “local” fault-controlled uplift. Moreover, we have tested whether the tilting process of palaeoshorelines (Figure 6a) has occurred over the Middle–Late Pleistocene or anachronously to the formation of all marine terraces. Following an approach from previous investigations [9,20,63], we assess tilting values along the strike of the fault and if these change for different ages of marine terraces; if faulting activity by the West Crati Fault has occurred with time, we would assume older marine terraces to be more tilted compared to younger ones, along the strike of the fault. Indeed, Figure 6c shows that higher and older marine terraces present higher tilt angle values, implying that they have experienced a longer history of faulting activity with a constant rate, a key observation shown by others when marine terraces are used for deriving faulting activity through time [9,20,63].
We interpret the spatially changing (i) palaeoshoreline elevations, (ii) uplift rates and the temporally varying tilting angle values along the strike as evidence to indicate that the West Crati Fault has been active, with a constant rate of deformation, over time during the progressive formation of the investigated sequence of marine terraces. Moreover, it is not surprising to show that higher uplift rates allow the preservation of a higher number of marine terraces (Figure 6a,b), which is a diagnostic stratigraphic evidence to show variations along the strike in fault activity rate, in agreement with other regions deformed by active normal faults [9,19,20,63,85].

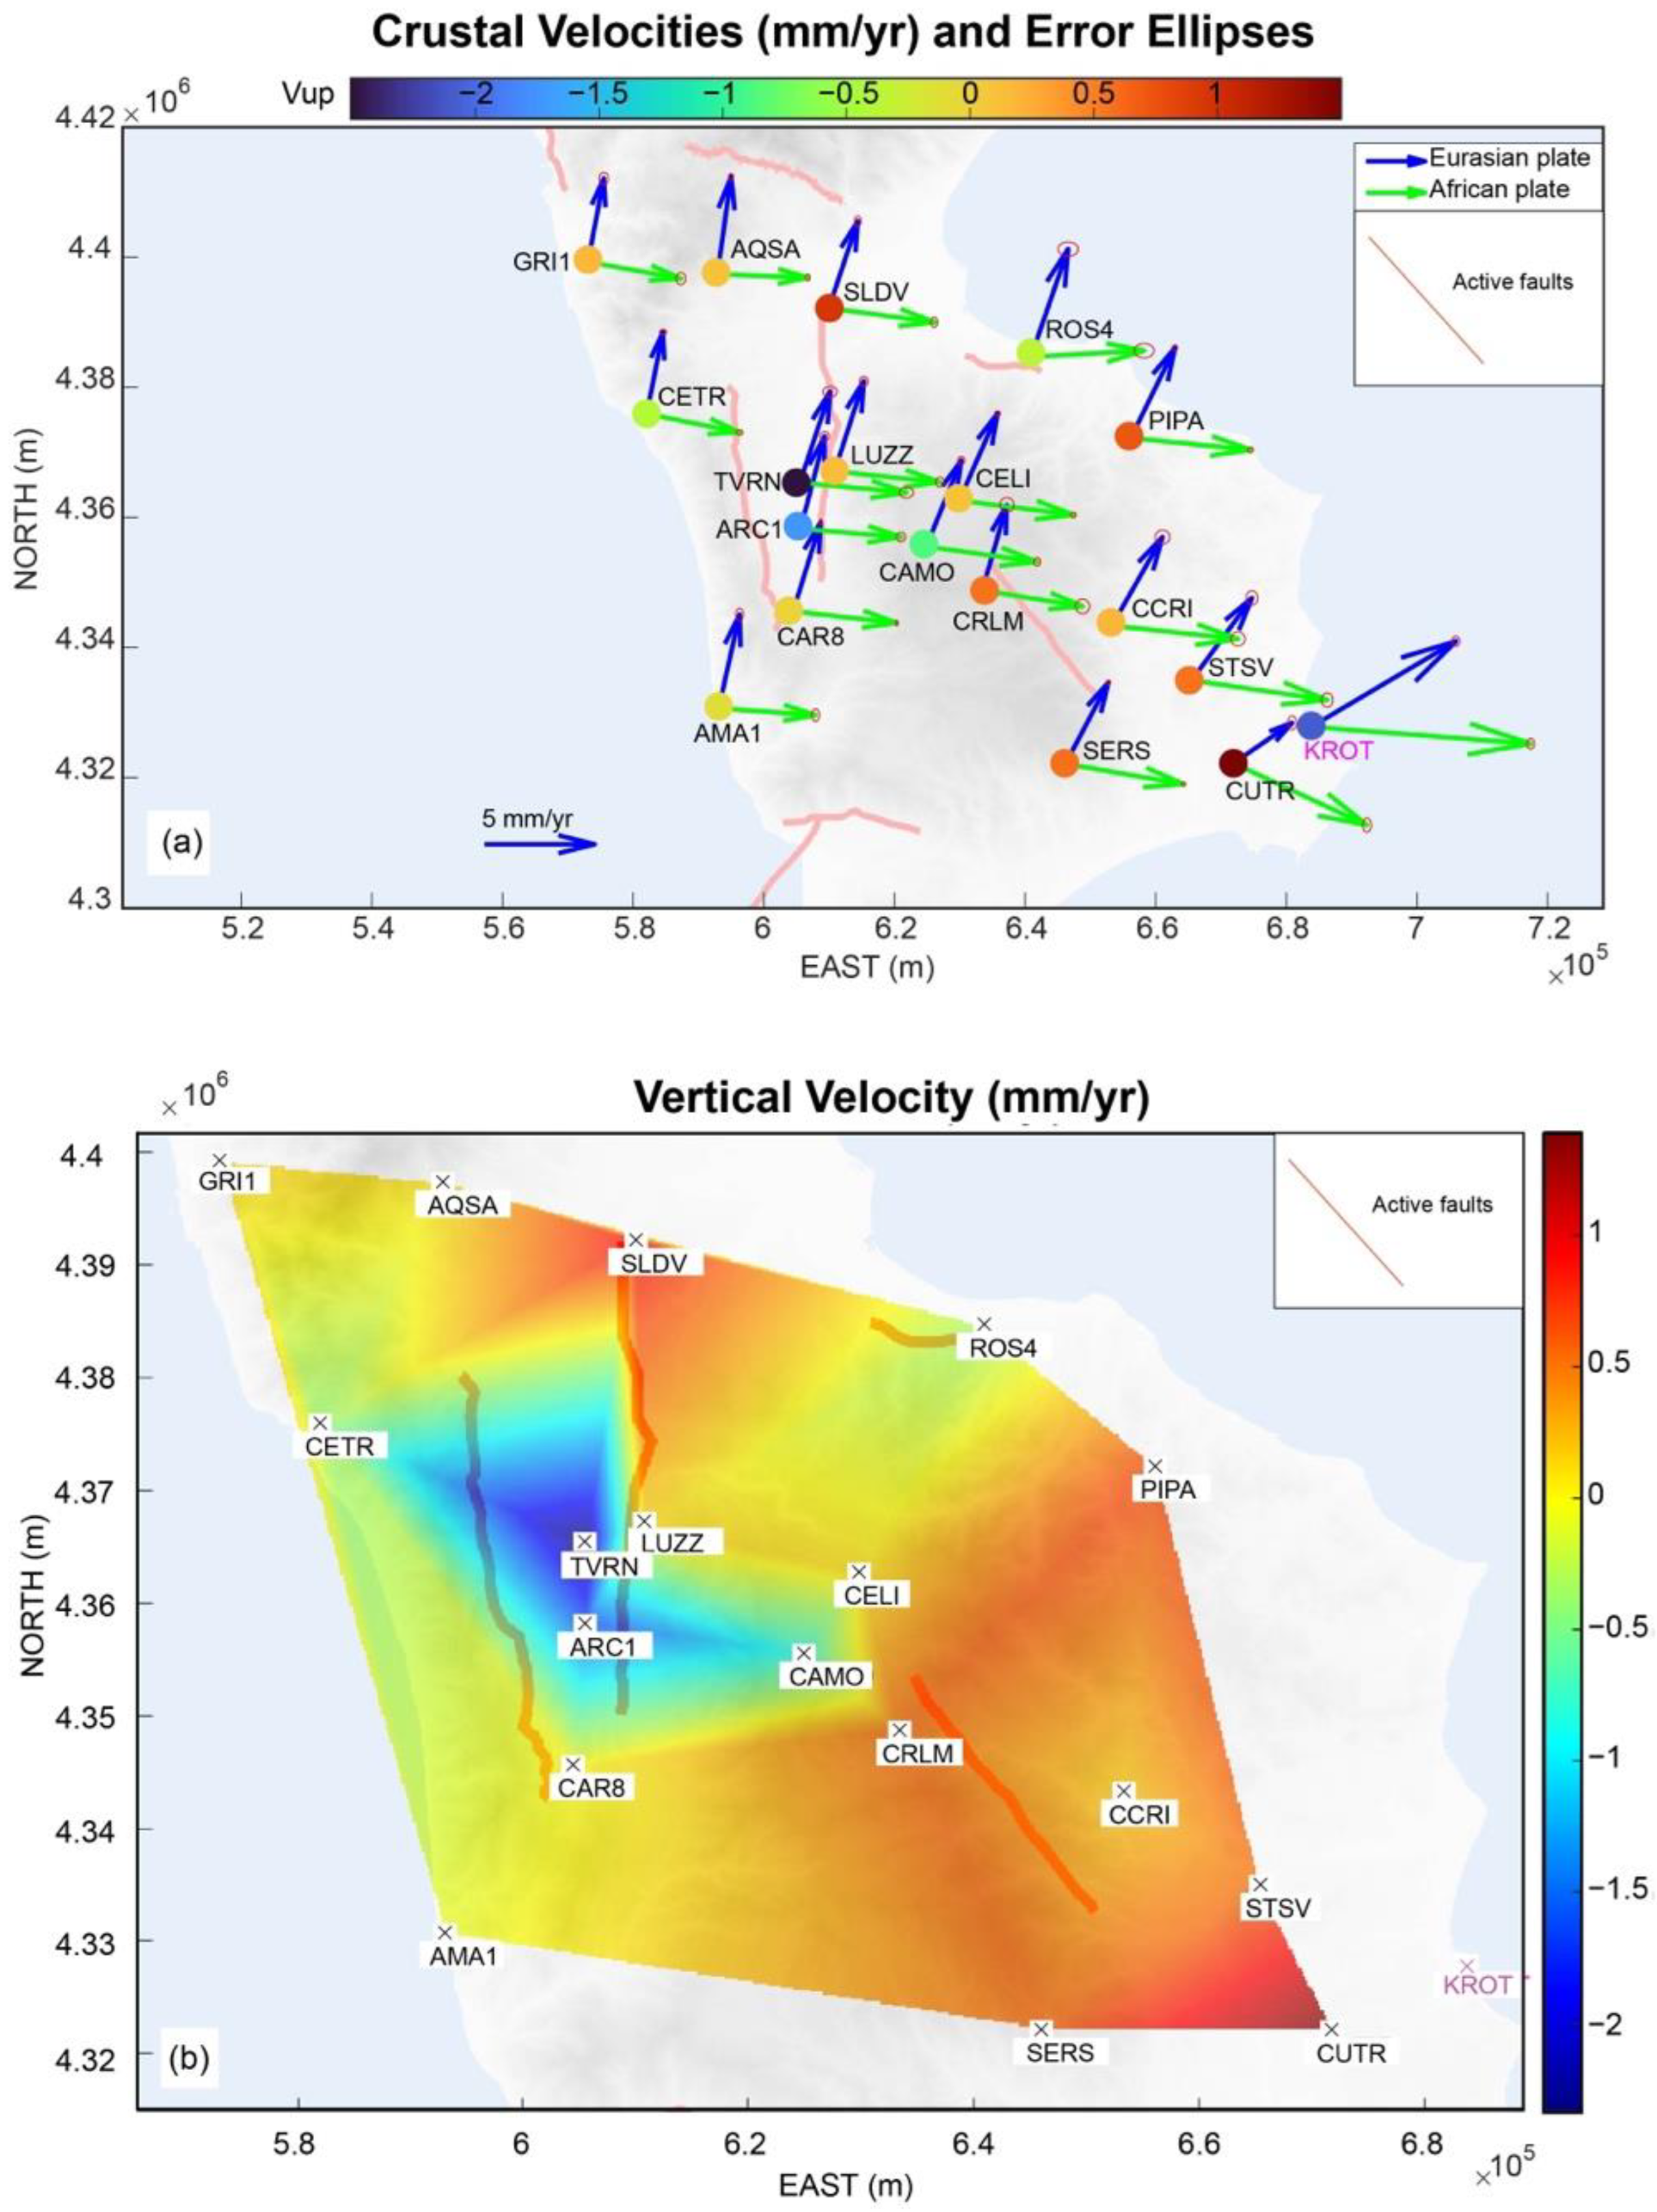
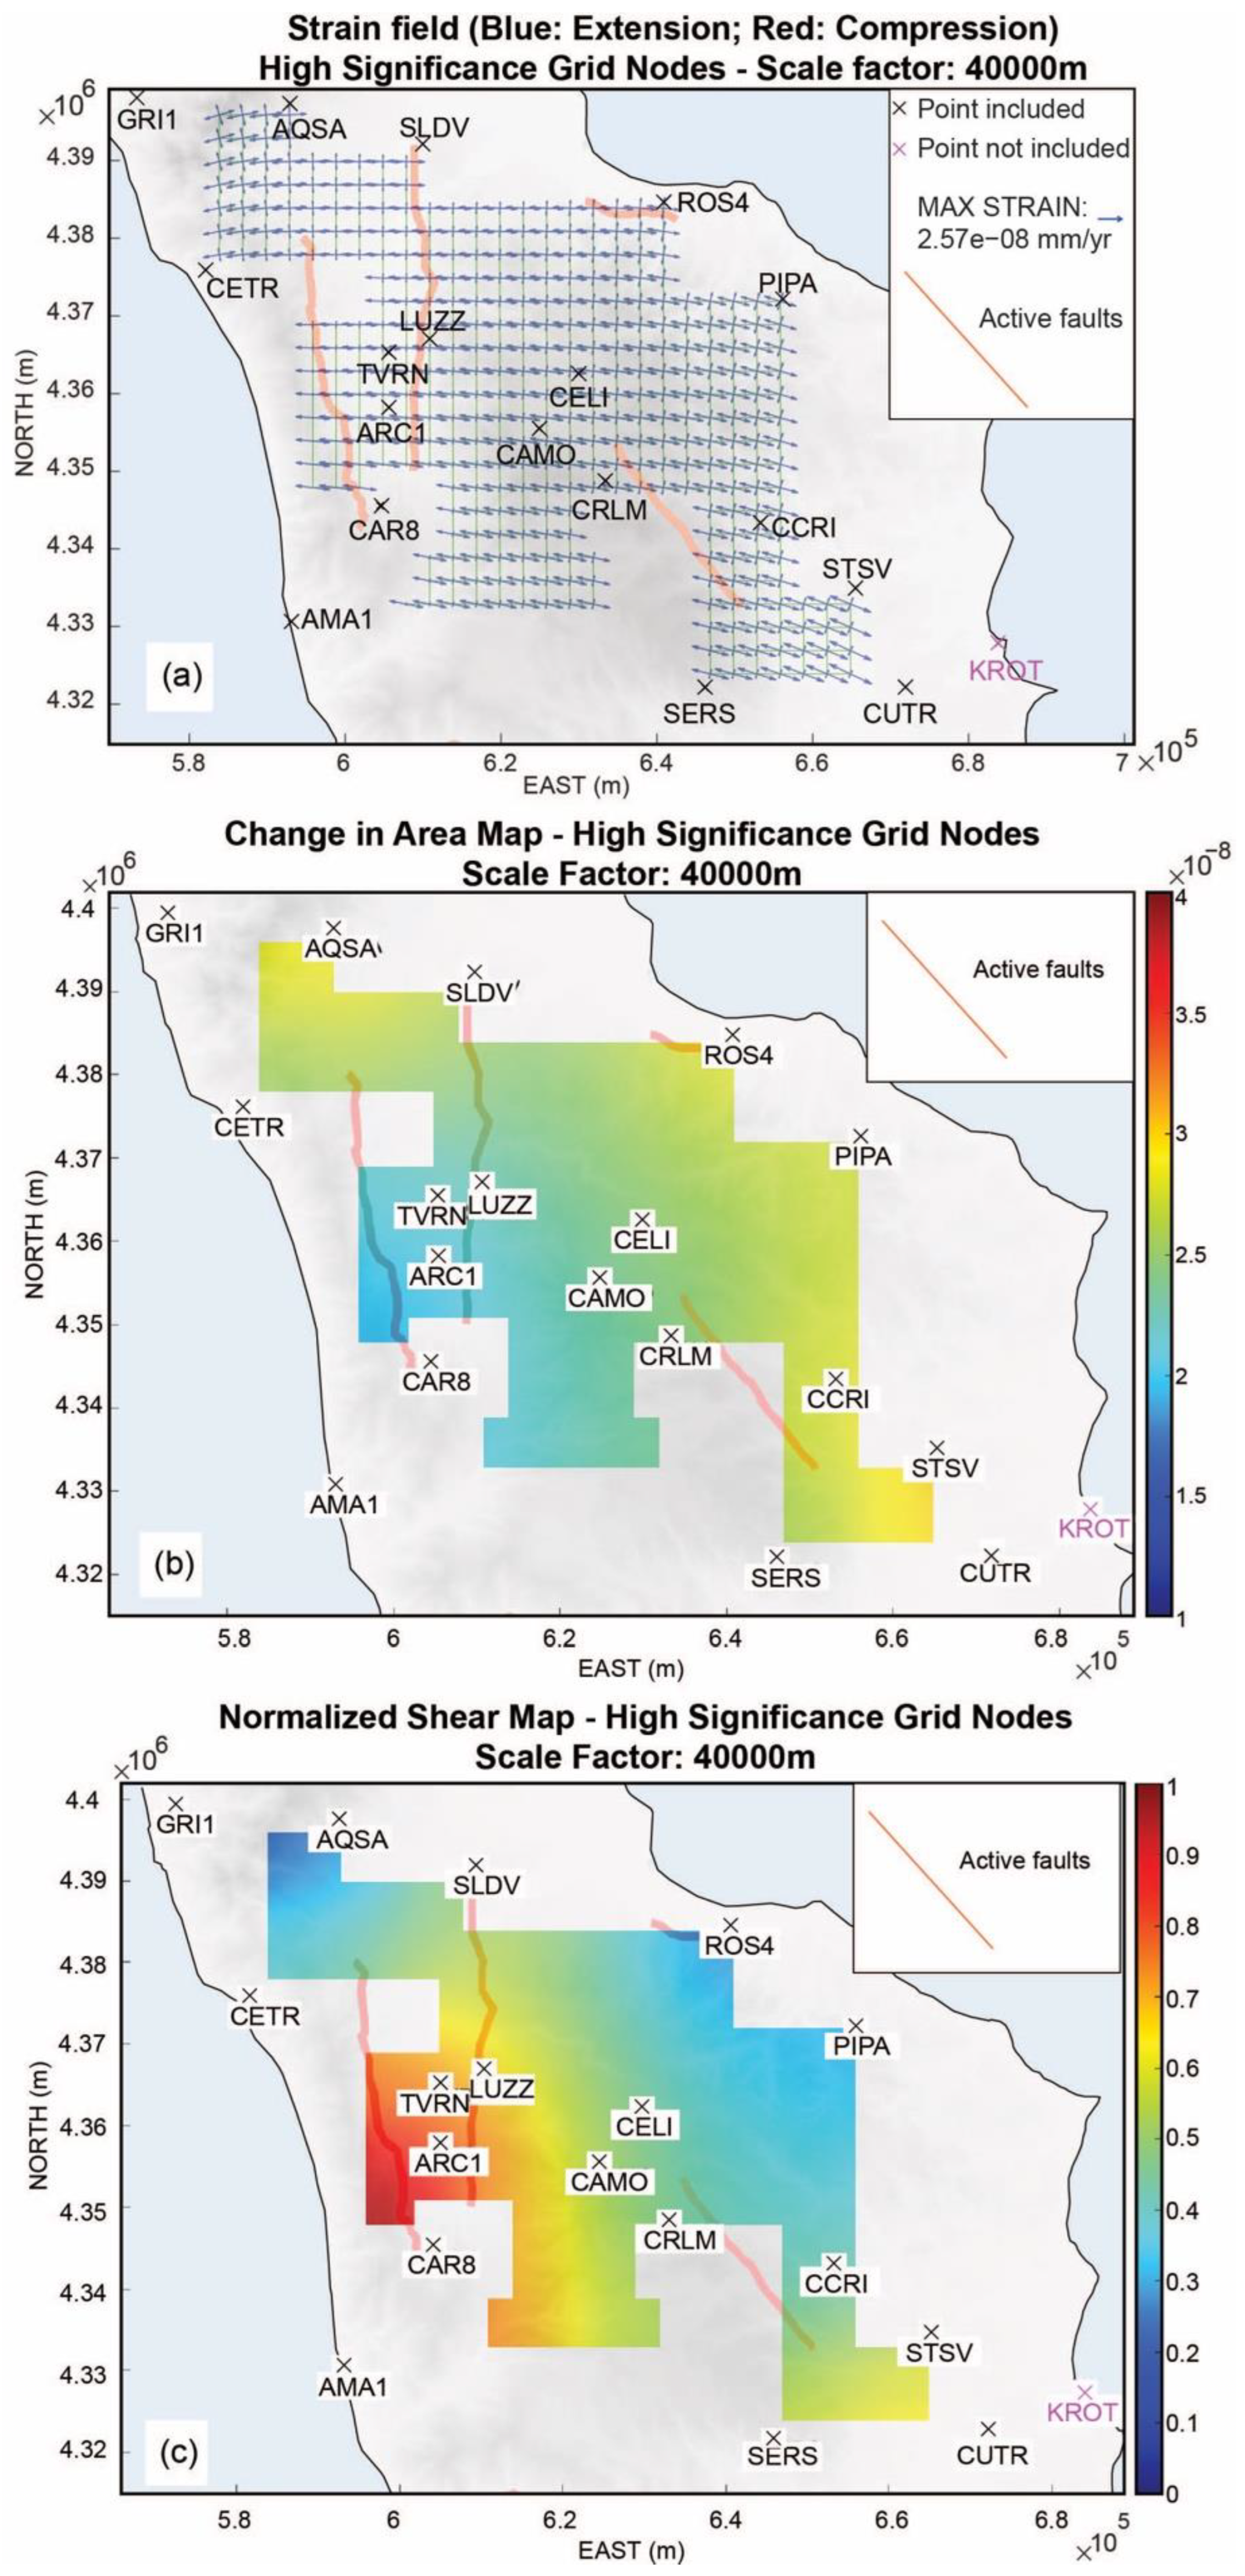
3.3. Strain Rate, Extension Rate, and Vertical Rates from GNSS Measurements

Figure 7a shows the MLE-based horizontal velocity vectors for both EU and AF plate fixed-reference frames, including the corresponding error ellipses, whereas Figure 7b shows a contour plot of the MLE-based vertical velocity.
As already stated, the station KROT (point 32 in Table 3 and Figure 7a) is affected by a motion mainly due to local slope instability; therefore, it cannot be used for the strain-rate computation at a regional scale even if the corresponding time series is 9 yr long. In all figures, the WGS84/UTM33N (EPSG 32633) coordinate system is used. Moreover, in Figure 7 and Figure 8, only those stations whose time series have a duration of at least 4.5 years are shown.
The distance between the stations varies from 5.6 km to 131 km, and the mean distance between the Crati normal faults varies from 12 km to 16 km. Moreover, the stations across the area between these faults are ~20–35 km away from it. In order to have a spatial resolution of the strain-rate field compatible with the minimum distance, a 4 km side grid was chosen. Moreover, the chosen scale factor was 40 km in order to highlight the effect of the stations close to the fault and to reduce that of very distant stations. In Figure 8a, we show the principal directions of the strain rate in the area characterized by high geometric significance, whereas in the large-sized Figure S13 (Supplementary Material), besides the strain-rate tensors in the high geometric grid nodes (solid vectors), the ones in the mid geometric significance nodes are also shown (dotted vectors). The strain rate is nearly everywhere characterized by extension, prominently E–W-oriented. In particular, we show that in the northern part of the Crati Valley the maximum strain rate is ~19 ± 3 nstrain/yr with an angle with respect to the north direction in the range between −88 and −90°; whereas in the southern part of this valley the maximum strain is ~18 ± 2 nstrain/yr, with an angle with respect to the north direction from −81 to −83°. The extension rate in the area between the two faults is 0.2–0.3 mm/yr.
The map of the field of the rate of change in area, also called dilatation (i.e., the sum of principal strain rates, which is the trace of the strain rate tensor and is the first invariant of strain), and of the field of engineering shear rate normalized to the change in area are shown in Figure 8b,c, respectively, where the faults are also shown. Both the plots show the results in the high geometric significance areas. This map highlights that, in the region, there are no areas characterized by peculiar kinematics and that the behaviour is generally homogenous within the investigated region, with subtle variations. In particular, the kinematics of the Crati Valley seems to be similar if compared to neighbouring areas, even if in a N–W portion of the valley the results are characterized by no more than mid geometric significance (i.e., there are stations within the scale factor in three 90° quadrants).
Finally, since the maximum width of the studied area, throughout northern Calabria, is ~90 km, we choose a 100 km scale factor, which allows us the estimation of the corresponding regional strain rate. Indeed, we estimate a mean strain rate of ~21 nstrain/yr, which results in an extension rate at a regional scale of ~2.3 mm/yr in the direction 81–83°.
Finally, we carried out the analysis of the distribution of the vertical velocity components of the 18 considered stations. The corresponding map, computed by linear interpolation of these velocities, is shown in Figure 7b. We highlight that even though the expected behaviour over the Late Quaternary in the area is a widespread uplift [38,110], short-term subsidence is observed in the western coastline of northern Calabria and within the Crati valley. However, it should be noted that, as shown in Table 1, the uncertainties on the vertical velocity components are relatively high. In particular, the uncertainties related to the stations GRI1, AQSA, LUZZ, CELI, CCRI, STSV, and CUTR (affected by uplift) and ROS4, CAR8, and AMA1 (affected by subsidence) have the same order of magnitude of the corresponding values.
This does not happen for the horizontal components, for which the relative error is on average 7%, ranging from 1.5% to 15%.

4. Discussion

In this study, we have refined rates of crustal deformation, at different scales, within the uplifting Calabria–Peloritani Arc, throughout the northern Calabria region, by (i) synchronously correlating multiple raised Middle–Late Pleistocene marine terraces and (ii) computing new strain, extension, and vertical rates from GNSS measurements (Figure 4, Figure 5, Figure 6, Figure 7 and Figure 8). This has permitted us to study the relationship between the “regional” signal of uplift and the “local” effect of faulting activity along and across the strike of the West Crati Fault. We stress that the obtained results agree with the ones obtained by D’Agostino et al. (2011). In particular, there is an agreement between the strain rates computed in the Crati valley both in intensity (18–19 nstrain/yr) and direction (almost E–W). However, our study has used a higher number of stations (18 instead of 12) and longer time series. In particular, as already stated (Table 3), all the time series had a duration of at least 4.5 yr, and 10 out of 18 had a duration of at least 8 yr. The mean duration of all the used time series was 10.8 yr. The percentage of gaps of the used time series was generally in the range 5–12%. Previous authors have demonstrated that a time series should have at least 4.5 yr of duration to provide meaningful time series for geodetic investigations, and 8 yr of minimum duration should be recommended [49]; this is an advance from the viewpoint of GNSS data analysis.
In this section, we now discuss our results in terms of local and regional tectonic implications associated with refined throw rates, Tmean, correlation between potential megathrust earthquakes investigations and intracrustal upper-plate seismic deformation, and possible co-seismic deformation scenario for the West Crati normal fault.

4.1. Local Tectonic Implications: Estimating Geodetic Fault Throw Rate and ERI for the West Crati Fault

The investigated area shows clear evidence that rates of uplift have changed along the strike of the West Crati Fault since the Middle Pleistocene, indicating that this fault has to be considered active, if the definition of “active fault” by some [70,71] is followed. Furthermore, this is not surprising given that this region has been historically hit by damaging seismic events such as the 1184 “Valle del Crati” earthquake (M 6.75) and the 1854 “Cosentino” earthquake (M 6.3) (Figure 1), which may have likely ruptured the West Crati normal fault. However, it is important to note that we cannot rule out that the above-mentioned seismic events may have occurred on the antithetic, W-dipping, East Crati Fault. This would suggest that more investigation is needed, even though for this study this is beyond the scope of the paper.
In this study, it is important to highlight that we are not able to derive direct measurements of long-term fault throw rates from faulted marine terraces, and for this reason we estimate geodetically derived fault throw rates from our geodetic refined strain and extension rates throughout northern Calabria (Figure 7 and Figure 8). Indeed, we know that a seismically active crustal extension accommodated by normal fault systems, between tectonic plate boundaries, needs to accommodate regional deformation rates [115]. This implies that summed deformation rates (throw rates on faults) across all the involved fault segments (i) will equal the regional deformation rates associated with the plate motions and (ii) will be temporally constant if all the same number of faults remains active over time [115]. However, it has also been demonstrated that throw rates on faults can change through time within normal fault systems due to fault interaction processes; this would imply that some faults would accelerate and others would decelerate, changing their throw rates through time to equal the regional deformation [19,32,115,116]. It is important to note that in places within the Calabrian–Peloritani Arc, rates of crustal deformation have been studied at three different timescales, with negligible discrepancies: those measured (i) over a few tens of years (from GNSS measurements), (ii) over a few thousand years (Holocene palaeoseismology), and (iii) over tens to hundreds of thousands of years (deformed Quaternary marine terraces) [9,46,117,118]. This would suggest long-term constant rates of crustal deformation confirmed by some [9,63]. Our results show a constant fault throw rate through time for the West Crati Fault from refined constant fault-controlled uplift rate evidence by modelling uplifted and deformed marine terraces, a crucial key observation for detailing the geography of the seismic hazard in northern Calabria. This suggests that fault interaction across the strike of active faults within the investigated region may be likely ruled out. This may be in contrast with the view of some proposing fault interaction in northern Calabria from fault-controlled uplift rates between 100 and 300 ka, where the timing of changes may be relatively imprecise, as results came from an inversion of river profile data and not absolute dating of deformed horizons [119]. If we then assume that strain and extension are homogenously accommodated across the strike of active faults such as the West and East Crati Faults and the Lakes Fault (Figure 9) with fault throw rates constant through time, deforming northern Calabria, estimates of geodetically derived fault throw rates may likely be more than reasonable values to be used over longer time scales. Note that estimates of geodetic fault throw rates are derived by using a qualitative trigonometric geometrical approach where the heave (H, horizontal component) and the throw (T, vertical component) are equal if the fault dip angle (α) is assumed to be 45° (Figure 9). This would suggest that our regional, geodetically derived extension rate of 2.3 mm/yr accommodated by all three before-mentioned active normal faults with an averaged fault dip angle of 45° would imply throw rates of ~ 0.8 mm/yr (Figure 9, inset A). This value is not surprising, taking into account that throw-rate values measured for other active normal faults that have been accommodating the Plio–Pleistocene crustal extension along the Italian Apennines and the Calabrian Arc are within the range 0.3 to 2.0 mm/year [9,116,120,121].
Furthermore, we have also iterated geodetically derived fault throw rates for the East Crati Fault and Lakes Fault, hypothetically sharing 66% of our total refined computed regional extension (~0.8 × 3 faults ~2.3 mm/yr), iterating their fault dip angles (30° to 60°) (Spreadsheet S2). For instance, given a homogeneously partitioned geodetic heave rate of ~0.8 mm/yr for each fault, we show that for fault dip angles of 60° and 58°, respectively, for the East Crati Fault and Lakes Fault, values in agreement with previous field studies [35,122,123], we obtain geodetic throw rates of ~1.3 for the East Crati Fault and 1.2 mm/yr for the Lakes Fault. These latter geodetic-derived values are in agreement with geological long-term throw rates obtained by previous studies for the same active faults [37,117]. For this reason, we stress that our geodetically derived fault throw rate of ~0.8 mm/yr for the West Crati Fault (with an averaged dip angle of 45° from literature data) may be the most likely scenario for seismic hazard modelling investigations, even for a longer timescale. Furthermore, it is important to stress that debated geological fault throw rates had been proposed within a poorly constrained range between 0.4 and 1.4 mm/yr [28,35,36,37], therefore misleading estimations of Tmean; our proposed geodetically derived throw rate of 0.8 mm/yr agrees with one of these previously proposed geological throw rates [37]. This would also suggest a refined value for the Tmean if well-known empirical correlations between maximum expected magnitude, fault length, and maximum expected displacement are applied [68,69]. Indeed, we are able to estimate a Tmean for the West Crati Fault, considering the length of the fault (~ 40 km) capable of producing earthquakes with a maximum magnitude (M) of 6.8. Given a maximum co-seismic slip event of ~1500 mm in M 6.8, in the centre of the fault and assuming a rupture of the entire fault length, to produce a fault throw rate of ~0.8 mm/yr would imply a Tmean ~1875 yr; this value is not unusual if compared to those describing active normal faults along the Italian territory [9,116].

4.2. Regional Implications for Upper-Plate Crustal Deformation above Subduction Zones

Our results from marine terraces modelling to derive refined long-term fault-controlled uplift rates show that the “regional” uplift from either ongoing subduction or deep-seated (mantle upwelling) processes has been spatially affected by “local” faulting activity; this has been observed throughout the Calabrian–Peloritani Arc [9,63] and should be considered when attempts for seismic hazard assessment for subduction-related megathrust earthquakes are studied. This is crucial if we consider that some studies show that the Ionian subduction may be active [124,125] and then capable of producing megathrust earthquakes, even though it is important to highlight there is an ongoing debate regarding if this subduction zone is either seismically coupled or aseismic. For instance, a previous study has shown an apparent “decoupling” about the crustal deformation occurring on the Calabrian upper plate and deformation on this subduction zone; this is also suggested by the fact that there is no record of strong subduction earthquakes, with a relatively aseismic “zone” at least in the first 30–60 km [112,124,126]. This would agree with the idea proposed by [39,127] of having (i) rising asthenosphere just beneath the Calabrian crust producing uplift and (ii) particular thermal conditions in the crust suggesting a poor coupling between the Ionian subducting plate and the upper plate of the Calabrian arc. From this, some speculation may be carried out on the maximum compressive earthquake (Mw ca. 6.0), where strong shallow crustal earthquakes are limited to the upper plate, while aseismic creep dominates along the subduction interface [112]. Yet, if we assume the Ionian subduction zone as an active one potentially producing megathrust earthquakes as suggested previously, permanent and long-term uplift may be ascribed to several seismic and aseismic processes [128], one of which is the slip along the subduction interface with a locked (or coupled) section [128,129]. If we then assume coupling between the subducting slab and the uplifting and extending upper plate within the Ionian Subduction Zone, long-term uplift may be explained as the result of the interseismic continuous elastic deformation due to locking on the plate interface, as proposed for other regions in the Mediterranean realm [128]. However, more investigations are needed to (i) refine the convergence rate, (ii) quantify the “aseismic” amount of subduction, and (iii) take into account deep-seated processes such as mantle upwelling beneath the Calabrian crust [39] if the interseismic continuous elastic deformation is aimed to be studied for this region. Indeed, it is worth noting that the Ionian subduction associated with the process of slab rollback [130] and, in places, the possibility of mantle upwelling beneath the Calabrian continental crust [127,131] identifies its onset synchronously to the uplift of the investigated forearc since the Middle Pleistocene. However, even though geodetic measurements show a spatially homogeneous uplift for the Calabrian–Peloritani forearc [132] with local geodetic-derived subsidence evidence in places likely controlled by interseismic slip on faults on their shear zone [133], as shown in this study (Figure 7), geological and long-term values of “regional” uplift rates still remain unclear and likely spatially changing throughout the forearc. Indeed, different values of geological uplift rates have been mapped beyond fault tips of upper-plate active faults where the “local” signal from faults should be zero, such as in NE Sicily (0.89 mm/yr) [63], close to Vibo Valentia in the Capo Vaticano Peninsula (1.75 mm/yr) [9] and this study (0.4–0.52 mm/yr). The cause of this variation should be tested, with more detailed mapping of marine terraces beyond and over fault tips of upper-plate active faults, and future investigations should address whether this variation could be either associated with the locations throughout the forearc and their different distances from the subduction zone or locally differential mantle upwelling process.
Moreover, we stress that the forearc shows prominent intracrustal vertical deformation as also shown in this study from long-term uplift measurements. Quaternary deformation has mostly acted in the form of active normal faulting controlling the topography of this region (Figure 1), with topographic structural highs identified by footwalls of active normal faults [9,63,82,134,135]. Indeed, it has been demonstrated that upper-plate seismogenic sources have been affecting the “regional” uplift signal, implying that these normal faults should be better identified and mapped. For this reason, if the “local” signal from active faults is not considered, this may lead to mistaken subduction interface slip distributions and consequently to a misleading seismic hazard assessment for subduction-related megathrust earthquakes. This would improve the seismic hazard assessment associated with both (i) upper-plate seismic deformation and (ii) subduction-related seismic events.

4.3. Co-Seismic Deformation Scenario Associated with the West Crati Fault

We also simulate co-seismic vertical displacement assuming the simplest scenario that the entire ~40 km West Crati Fault would rupture during a seismic event (Figure 10). We performed this by inputting the curvilinear trace of the mapped West Crati Fault into the Coulomb 3.4 software [105], using a relatively new MATLAB code [106]. This code permits us to model vertical displacements arising from earthquakes on faults with variable-strike geometry. Indeed, it is well established that fault geometry influences Coulomb stress transfer [105,106,109] and therefore will influence strain and displacements surrounding the causative fault. We assume an averaged dip angle of 45°, e.g., [35,36], and an assumed maximum slip at a depth of 3 m at around 9–10 km (Figure 10, Inset a), for a total co-seismic rupture of ~40 km long. These parameters are typical for normal faulting-related earthquakes in the Apennines and the Calabrian Forearc [107,136,137,138] to simulate reliable co-seismic vertical displacements.
We show that the co-seismic footwall uplift region (light-yellow-coloured region defined by isolines of co-seismic uplift) coincides with the long-term footwall uplift deformation mapped by looking at raised marine terraces (Figure 10 and Figure S11 for the C-D profile trace and signal variations). This is another piece of evidence suggesting that marine terraces have been likely deformed by successive seismic events over the Late Quaternary. Moreover, the maximum co-seismic subsidence coincides with the estimated location of the 1184 seismic event, as well as its modelled magnitude of 6.75. Note that we estimate a maximum co-seismic uplift and subsidence, in the centre of the West Crati Fault, of 0.064 m and −0.810 m (Figure 10, Inset B), respectively, which are not unusual values if compared with other normal faulting-related earthquakes such as the 2009 L’Aquila earthquake (M 6.3) [139] and the 1983 Borah Peak earthquake (M 7.3) [140]. It is important to stress that the maximum expected displacement of 1500 mm (1.5 m) used to estimate Tmean in Section 4.1, if a ~40 km long fault seismically ruptures, is not the vertical component (throw); it is yet estimated along the displacement D (inset B from Figure 9 for clarification) as suggested by others [68].
We interestingly report that the maximum co-seismic subsidence (dark blue region, Figure 10) coincides with the area where we show the maximum rate of GNSS-derived subsidence within the hanging wall of the fault (Figure 7b).
For this reason, we finally speculate that future works can be made based on an old but simple concept that seismicity rates on brittle faults are controlled by strain rates of viscous deformation at depth on faults’ shear zones [141,142]. Indeed, more investigations are needed to test if GNSS measurements on the hanging wall of the West Crati Fault are showing an active shear zone, slipping at its long-term interseismic rate, causing subsidence at the surface, after having ruled out local non-tectonic signals from GNSS measurements; indeed, slip in the upper crust is driven by slip on viscous shear zones in the lower crust, with the viscous flow process on shear zones, as shown by previous investigations [133,141,143].

5. Conclusions

In this paper, we use (i) refined GNSS measurements and (ii) the synchronous correlation approach for raised marine terraces modelling to refine rates of crustal deformation at different timescales. This has permitted us calculations of improved rates of uplift through time mapped on the footwall of the West Crati Fault, spanning the Late Quaternary. It has been shown that (i) elevations of marine terraces vary along the strike of the investigated fault, (ii) higher uplift rates are mapped in the centre of the fault, suggesting that the West Crati Fault needs to be considered active, and (iii) older and higher marine terraces are more tilted because of experiencing a longer history of faulting activity.
We show a constant fault-controlled uplift rate over the Late Quaternary, implying that the throw rate on this fault is constant over time, a key observation for the long-term seismic hazard assessment. We also present new refined strain and extension rates throughout northern Calabria of 21 nstrain/yr and ~2.3 mm/yr, respectively, across the strike, likely accommodated by the West and East Crati normal faults and the Lakes Fault, suggesting that geodetically derived throw rates may be more the reasonable values to consider for longer timescales. In particular, we qualitatively estimate the throw rate, obtained with a simplified trigonometric approach and assuming an averaged 45° fault dip angle. We stress that a future development will concern the reanalysis of the data (with further lengthened time series) in a 3D approach and using numerical modelling methods proposed by some in the past [24,144] in order to estimate more quantitively geodetic slip rates across the strike of the Crati valley and northern Calabria. Indeed, we qualitatively estimate a fault throw rate and Tmean of ~0.8 mm/yr and ~1875 years for the West Crati Fault, if an averaged fault dip angle of 45° is assumed given the computed extension rate from GNSS measurements. Constant rates over the Quaternary of crustal deformation shown in this study are not surprising if we consider that the quasi-E–W oriented ongoing crustal extension is accommodated by a few active faults across the strike. In other words, if more active faults across the strike are accommodating “distributed” strain, this will gradually change their slip rates over time to maintain the regional deformation rate as described by some in the past [32]. Indeed, the Calabrian–Peloritani Forearc is affected by crustal extension accommodated by a more “localized” strain on a few active faults across the strike.
Finally, we stress that it is crucial to consider upper-plate crustal deformation when slip distributions in the subduction interface are estimated using data of uplift to avoid misleading and erroneous subduction-related earthquakes.

Supplementary Materials

The following supporting information can be downloaded at: Mendeley Data, V1, https://doi.org/10.17632/sf628sb2cn.1, (accessed on 4 September 2022).

Author Contributions

Conceptualization, M.M., G.T. (limited to GNSS data analysis) and E.S.; methodology, M.M., G.T. and E.S.; software, G.T.; validation, M.M., G.T. and E.S.; formal analysis, M.M., G.T. and E.S.; investigation, M.M., G.T. (limited to kinematic analysis) and E.S.; resources, S.C.; data curation, M.M. and G.T.; writing—original draft preparation, M.M. and G.T.; writing—review and editing, M.M., G.T., E.S., L.E., G.L., M.D.D. and S.C.; visualization, M.M. and G.T.; supervision, S.C.; project administration, S.C.; funding acquisition, S.C. All authors have read and agreed to the published version of the manuscript.

Funding

This research received no external funding.

Data Availability Statement

Publicly available datasets were analysed in this study. These data can be found here: http://geodesy.unr.edu/ (Nevada Geodetic Laboratory). The results of data that support the findings of this study are available from the corresponding author, M.M., upon reasonable request.

Acknowledgments

This work was developed during a one-year research fellowship awarded to M.M. at the University of Bologna funded by the project “ECOCZERB_1”. The editor and three anonymous reviewers are thanked for their comments, which were useful to improving the first version of the manuscript. Gerald Roberts from Birkbeck College (University of London) is thanked for his insightful advice and input on how to approach marine terrace investigations associated with active faulting. We also thank Zoe Mildon for sharing her modified Coulomb code for co-seismic vertical displacement calculations. Simone Tarquini from INGV-Pisa (Italy) is thanked for providing 10 m high-resolution digital elevation models.

Conflicts of Interest

The authors declare no conflict of interest.

References

  1. Plafker, G. Alaskan Earthquake of 1964 and Chilean Earthquake of 1960: Implications for Arc Tectonics. J. Geophys. Res. 1972, 77, 901–925. [Google Scholar] [CrossRef]
  2. Lomnitz, C. Major Earthquakes of Chile: A Historical Survey, 1535-1960. Seismol. Res. Lett. 2004, 75, 368–378. [Google Scholar] [CrossRef]
  3. Cisternas, M.; Atwater, B.F.; Torrejón, F.; Sawai, Y.; Machuca, G.; Lagos, M.; Eipert, A.; Youlton, C.; Salgado, I.; Kamataki, T.; et al. Predecessors of the Giant 1960 Chile Earthquake. Nature 2005, 437, 404–407. [Google Scholar] [CrossRef] [PubMed]
  4. Holdahl, S.R.; Sauber, J. Coseismic Slip in the 1964 Prince William Sound Earthquake: A New Geodetic Inversion. Pure Appl. Geophys. PAGEOPH 1994, 142, 55–82. [Google Scholar] [CrossRef]
  5. Subarya, C.; Chlieh, M.; Prawirodirdjo, L.; Avouac, J.-P.; Bock, Y.; Sieh, K.; Meltzner, A.J.; Natawidjaja, D.H.; McCaffrey, R. Plate-Boundary Deformation Associated with the Great Sumatra–Andaman Earthquake. Nature 2006, 440, 46–51. [Google Scholar] [CrossRef] [PubMed] [Green Version]
  6. Singh, S.C.; Carton, H.; Tapponnier, P.; Hananto, N.D.; Chauhan, A.P.S.; Hartoyo, D.; Bayly, M.; Moeljopranoto, S.; Bunting, T.; Christie, P.; et al. Seismic Evidence for Broken Oceanic Crust in the 2004 Sumatra Earthquake Epicentral Region. Nat. Geosci. 2008, 1, 777–781. [Google Scholar] [CrossRef]
  7. Kodaira, S.; No, T.; Nakamura, Y.; Fujiwara, T.; Kaiho, Y.; Miura, S.; Takahashi, N.; Kaneda, Y.; Taira, A. Coseismic Fault Rupture at the Trench Axis during the 2011 Tohoku-Oki Earthquake. Nat. Geosci. 2012, 5, 646–650. [Google Scholar] [CrossRef]
  8. Anderson, R.S.; Densmore, A.L.; Ellis, M.A. The Generation and Degradation of Marine Terraces. Basin Res. 1999, 11, 7–19. [Google Scholar] [CrossRef]
  9. Roberts, G.P.; Meschis, M.; Houghton, S.; Underwood, C.; Briant, R.M. The Implications of Revised Quaternary Palaeoshoreline Chronologies for the Rates of Active Extension and Uplift in the Upper Plate of Subduction Zones. Quat. Sci. Rev. 2013, 78, 169–187. [Google Scholar] [CrossRef]
  10. Lajoie, K.R. Coastal Tectonics. In Active Tectonics: Impact on Society; National Academies Press: Washington, DC, USA, 1986; pp. 95–124. [Google Scholar]
  11. D’Agostino, N.; Jackson, J.A.; Dramis, F.; Funiciello, R. Interactions between Mantle Upwelling, Drainage Evolution and Active Normal Faulting: An Example from the Central Apennines (Italy). Geophys. J. Int. 2001, 147, 475–497. [Google Scholar] [CrossRef]
  12. Faccenna, C.; Becker, T.W.; Miller, M.S.; Serpelloni, E.; Willett, S.D. Isostasy, Dynamic Topography, and the Elevation of the Apennines of Italy. Earth Planet. Sci. Lett. 2014, 407, 163–174. [Google Scholar] [CrossRef]
  13. McCloskey, J.; Nalbant, S.S.; Steacy, S. Indonesian Earthquake: Earthquake Risk from Co-Seismic Stress. Nature 2005, 434, 291. [Google Scholar] [CrossRef] [PubMed]
  14. Meltzner, A.J.; Sieh, K.; Abrams, M.; Agnew, D.C.; Hudnut, K.W.; Avouac, J.-P.; Natawidjaja, D.H. Uplift and Subsidence Associated with the Great Aceh-Andaman Earthquake of 2004. J. Geophys. Res. Solid Earth 2006, 111, no. B2. [Google Scholar] [CrossRef] [Green Version]
  15. Nalbant, S.; McCloskey, J.; Steacy, S.; NicBhloscaidh, M.; Murphy, S. Interseismic Coupling, Stress Evolution, and Earthquake Slip on the Sunda Megathrust. Geophys. Res. Lett. 2013, 40, 4204–4208. [Google Scholar] [CrossRef]
  16. Nic Bhloscaidh, M.; McCloskey, J.; Naylor, M.; Murphy, S.; Lindsay, A. Reconstruction of the Slip Distributions in Historical Earthquakes on the Sunda Megathrust, W. Sumatra. Geophys. J. Int. 2015, 202, 1339–1361. [Google Scholar] [CrossRef] [Green Version]
  17. González-alfaro, J.; Vargas, G.; Ortlieb, L.; González, G.; Ruiz, S.; Báez, J.C.; Mandeng-yogo, M.; Caquineau, S.; Álvarez, G. Abrupt Increase in the Coastal Uplift and Earthquake Rate since ~40 Ka at the Northern Chile Seismic Gap in the Central Andes. Earth Planet. Sci. Lett. 2018, 502, 32–45. [Google Scholar] [CrossRef]
  18. Ott, R.F.; Gallen, S.F.; Wegmann, K.W.; Biswas, R.H.; Herman, F.; Willett, S.D. Pleistocene Terrace Formation, Quaternary Rock Uplift Rates and Geodynamics of the Hellenic Subduction Zone Revealed from Dating of Paleoshorelines on Crete, Greece. Earth Planet. Sci. Lett. 2019, 525, 115757. [Google Scholar] [CrossRef]
  19. Roberts, G.P.; Houghton, S.L.; Underwood, C.; Papanikolaou, I.; Cowie, P.A.; Van Calsteren, P.; Wigley, T.; Cooper, F.J.; McArthur, J.M. Localization of Quaternary Slip Rates in an Active Rift in 105 Years: An Example from Central Greece Constrained by 234U- 230Th Coral Dates from Uplifted Paleoshorelines. J. Geophys. Res. Solid Earth 2009, 114, 1–26. [Google Scholar] [CrossRef] [Green Version]
  20. Robertson, J.; Meschis, M.; Roberts, G.P.; Ganas, A.; Gheorghiu, D. Temporally Constant Quaternary Uplift Rates and Their Relationship with Extensional Upper-Plate Faults in South Crete (Greece), Constrained with 36-Cl Cosmogenic Exposure Dating. Tectonics 2019, 38, 1189–1222. [Google Scholar] [CrossRef] [Green Version]
  21. Saillard, M.; Hall, S.R.; Audin, L.; Farber, D.L.; Hérail, G.; Martinod, J.; Regard, V.; Finkel, R.; Bondoux, F. Non-Steady Long-Term Uplift Rates and Pleistocene Marine Terrace Development along the Andean Margin of Chile (31° S) Inferred from 10 Be Dating. Earth Planet. Sci. Lett. 2009, 277, 50–63. [Google Scholar] [CrossRef]
  22. Shikakura, Y. Marine Terraces Caused by Fast Steady Uplift and Small Coseismic Uplift and the Time-Predictable Model: Case of Kikai Island, Ryukyu Islands, Japan. Earth Planet. Sci. Lett. 2014, 404, 232–237. [Google Scholar] [CrossRef]
  23. Shyu, J.B.H.; Wang, C.; Wang, Y.; Shen, C.; Chiang, H.; Liu, S.; Min, S.; Thu, L.; Than, O.; Thura, S. Upper-Plate Splay Fault Earthquakes along the Arakan Subduction Belt Recorded by Uplifted Coral Microatolls on Northern Ramree Island, Western Myanmar ( Burma ). Earth Planet. Sci. Lett. 2018, 484, 241–252. [Google Scholar] [CrossRef]
  24. Serpelloni, E.; Bürgmann, R.; Anzidei, M.; Baldi, P.; Mastrolembo Ventura, B.; Boschi, E. Strain Accumulation across the Messina Straits and Kinematics of Sicily and Calabria from GPS Data and Dislocation Modeling. Earth Planet. Sci. Lett. 2010, 298, 347–360. [Google Scholar] [CrossRef] [Green Version]
  25. D’Agostino, N.; Mantenuto, S.; D’Anastasio, E.; Giuliani, R.; Mattone, M.; Calcaterra, S.; Gambino, P.; Bonci, L. Evidence for Localized Active Extension in the Central Apennines (Italy) from Global Positioning System Observations. Geology 2011, 39, 291–294. [Google Scholar] [CrossRef]
  26. Briole, P.; Ganas, A.; Elias, P.; Dimitrov, D. The GPS Velocity Field of the Aegean. New Observations, Contribution of the Earthquakes, Crustal Blocks Model. Geophys. J. Int. 2021, 226, 468–492. [Google Scholar] [CrossRef]
  27. Iezzi, F.; Roberts, G.; Faure Walker, J.; Papanikolaou, I.; Ganas, A.; Deligiannakis, G.; Beck, J.; Wolfers, S.; Gheorghiu, D. Temporal and Spatial Earthquake Clustering Revealed through Comparison of Millennial Strain-Rates from 36Cl Cosmogenic Exposure Dating and Decadal GPS Strain-Rate. Sci. Rep. 2021, 11, 23320. [Google Scholar] [CrossRef]
  28. Tortorici, L.; Monaco, C.; Tansi, C.; Cocina, O. Recent and Active Tectonics in the Calabrian Arc (Southern Italy). Tectonophysics 1995, 243, 37–55. [Google Scholar] [CrossRef]
  29. Rovida, A.; Locati, M.; Camassi, R.; Lolli, B.; Gasperini, P. The Italian Earthquake Catalogue CPTI15. Bull. Earthq. Eng. 2020, 18, 2953–2984. [Google Scholar] [CrossRef]
  30. Basili, R.; Valensise, G.; Vannoli, P.; Burrato, P.; Fracassi, U.; Mariano, S.; Tiberti, M.M.; Boschi, E. The Database of Individual Seismogenic Sources (DISS), Version 3: Summarizing 20 Years of Research on Italy’s Earthquake Geology. Tectonophysics 2008, 453, 20–43. [Google Scholar] [CrossRef]
  31. INGV - DISS Working Group. Database of Individual Seismogenic Sources (DISS), Version 3.3.0: A Compilation of Potential Sources for Earthquakes Larger than M 5.5 in Italy and Surrounding Areas. Available online: https://data.ingv.it/dataset/488#additional-metadata (accessed on 4 September 2022).
  32. Cowie, P.A.; Roberts, G.P. Constraining Slip Rates and Spacings for Active Normal Faults. J. Struct. Geol. 2001, 23, 1901–1915. [Google Scholar] [CrossRef]
  33. Cowie, P.A.; Roberts, G.P.; Bull, J.M.; Visini, F. Relationships between Fault Geometry, Slip Rate Variability and Earthquake Recurrence in Extensional Settings. Geophys. J. Int. 2012, 189, 143–160. [Google Scholar] [CrossRef] [Green Version]
  34. Sgambato, C.; Faure Walker, J.P.; Roberts, G.P. Uncertainty in Strain-Rate from Field Measurements of the Geometry, Rates and Kinematics of Active Normal Faults: Implications for Seismic Hazard Assessment. J. Struct. Geol. 2020, 131, 103934. [Google Scholar] [CrossRef]
  35. Spina, V.; Tondi, E.; Mazzoli, S. Complex Basin Development in a Wrench-Dominated Back-Arc Area: Tectonic Evolution of the Crati Basin, Calabria, Italy. J. Geodyn. 2011, 51, 90–109. [Google Scholar] [CrossRef] [Green Version]
  36. Brozzetti, F.; Cirillo, D.; Liberi, F.; Piluso, E.; Faraca, E.; De Nardis, R.; Lavecchia, G. Structural Style of Quaternary Extension in the Crati Valley (Calabrian Arc): Evidence in Support of an East-Dipping Detachment Fault. Ital. J. Geosci. 2017, 136, 434–453. [Google Scholar] [CrossRef]
  37. Roda-Boluda, D.C.; Whittaker, A.C. Structural and Geomorphological Constraints on Active Normal Faulting and Landscape Evolution in Calabria, Italy. J. Geol. Soc. Lond. 2017, 174, 701–720. [Google Scholar] [CrossRef]
  38. Westaway, R. Quaternary Uplift of Southern Italy. J. Geophys. Res. 1993, 98, 741–772. [Google Scholar] [CrossRef]
  39. Gvirtzman, Z.; Nur, A. Plate Detachment, Asthenosphere Upwelling, and Topography across Subduction Zones. Geology 1999, 27, 563. [Google Scholar] [CrossRef]
  40. Carobene, L.; Ferrini, G. Morphological, Sedimentological and Tectonic Features of Diamante-m. Carpinoso Marine Terrace Flight (Tyrrhenian Coast of Northern Calabria, Italy). Earth Surf. Process. Landf. 1993, 18, 225–239. [Google Scholar] [CrossRef]
  41. Robustelli, G.; Muto, F.; Scarciglia, F.; Spina, V.; Critelli, S. Eustatic and Tectonic Control on Late Quaternary Alluvial Fans along the Tyrrhenian Sea Coast of Calabria (South Italy). Quat. Sci. Rev. 2005, 24, 2101–2119. [Google Scholar] [CrossRef]
  42. Ferranti, L.; Antonioli, F.; Mauz, B.; Amorosi, A.; Dai Pra, G.; Mastronuzzi, G.; Monaco, C.; Orrù, P.; Pappalardo, M.; Radtke, U.; et al. Markers of the Last Interglacial Sea-Level High Stand along the Coast of Italy: Tectonic Implications. Quat. Int. 2006, 145–146, 30–54. [Google Scholar] [CrossRef]
  43. Bennett, R.A.; Wernicke, B.P.; Niemi, N.A.; Friedrich, A.M.; Davis, J.L. Contemporary Strain Rates in the Northern Basin and Range Province from GPS Data. Tectonics 2003, 22. [Google Scholar] [CrossRef]
  44. Friedrich, A.M.; Wernicke, B.P.; Niemi, N.A.; Bennett, R.A.; Davis, J.L. Comparison of Geodetic and Geologic Data from the Wasatch Region, Utah, and Implications for the Spectral Character of Earth Deformation at Periods of 10 to 10 Million Years. J. Geophys. Res. Solid Earth 2003, 108, 2199. [Google Scholar] [CrossRef]
  45. McClusky, S.; Reilinger, R.; Mahmoud, S.; Ben Sari, D.; Tealeb, A. GPS Constraints on Africa (Nubia) and Arabia Plate Motions. Geophys. J. Int. 2003, 155, 126–138. [Google Scholar] [CrossRef] [Green Version]
  46. Serpelloni, E.; Anzidei, M.; Baldi, P.; Casula, G.; Galvani, A. Crustal Velocity and Strain-Rate Fields in Italy and Surrounding Regions: New Results from the Analysis of Permanent and Non-Permanent GPS Networks. Geophys. J. Int. 2005, 161, 861–880. [Google Scholar] [CrossRef] [Green Version]
  47. Devoti, R.; Devoti, R.; D’Agostino, N.; Serpelloni, E.; Pietrantonio, G.; Riguzzi, F.; Avallone, A.; Cavaliere, A.; Cheloni, D.; Cecere, G.; et al. A Combined Velocity Field of the Mediterranean Region. Ann. Geophys. 2017, 60, S0215. [Google Scholar] [CrossRef] [Green Version]
  48. Zhang, J.; Bock, Y.; Johnson, H.; Fang, P.; Williams, S.; Genrich, J.; Wdowinski, S.; Behr, J. Southern California Permanent GPS Geodetic Array: Error Analysis of Daily Position Estimates and Site Velocities. J. Geophys. Res. Solid Earth 1997, 102, 18035–18055. [Google Scholar] [CrossRef]
  49. Masson, C.; Mazzotti, S.; Vernant, P. Precision of Continuous GPS Velocities from Statistical Analysis of Synthetic Time Series. Solid Earth 2019, 10, 329–342. [Google Scholar] [CrossRef] [Green Version]
  50. Bos, M.S.; Fernandes, R.M.S.; Williams, S.D.P.; Bastos, L. Fast Error Analysis of Continuous GNSS Observations with Missing Data. J. Geod. 2013, 87, 351–360. [Google Scholar] [CrossRef] [Green Version]
  51. Reilinger, R.; McClusky, S.; Vernant, P.; Lawrence, S.; Ergintav, S.; Cakmak, R.; Ozener, H.; Kadirov, F.; Guliev, I.; Stepanyan, R.; et al. GPS Constraints on Continental Deformation in the Africa-Arabia-Eurasia Continental Collision Zone and Implications for the Dynamics of Plate Interactions. J. Geophys. Res. Solid Earth 2006, 111. [Google Scholar] [CrossRef]
  52. D’Agostino, N.; D’Anastasio, E.; Gervasi, A.; Guerra, I.; Nedimović, M.R.; Seeber, L.; Steckler, M. Forearc Extension and Slow Rollback of the Calabrian Arc from GPS Measurements. Geophys. Res. Lett. 2011, 38. [Google Scholar] [CrossRef]
  53. Cifelli, F.; Mattei, M.; Rossetti, F. Tectonic Evolution of Arcuate Mountain Belts on Top of a Retreating Subduction Slab: The Example of the Calabrian Arc. J. Geophys. Res. 2007, 112. [Google Scholar] [CrossRef] [Green Version]
  54. Dewey, J.F.; Helman, M.L.; Knott, S.D.; Turco, E.; Hutton, D.H.W. Kinematics of the Western Mediterranean. Geol. Soc. Lond. Spec. Publ. 1989, 45, 265–283. [Google Scholar] [CrossRef]
  55. Gutscher, M.-A.; Kopp, H.; Krastel, S.; Bohrmann, G.; Garlan, T.; Zaragosi, S.; Klaucke, I.; Wintersteller, P.; Loubrieu, B.; Le Faou, Y.; et al. Active Tectonics of the Calabrian Subduction Revealed by New Multi-Beam Bathymetric Data and High-Resolution Seismic Profiles in the Ionian Sea (Central Mediterranean). Earth Planet. Sci. Lett. 2017, 461, 61–72. [Google Scholar] [CrossRef] [Green Version]
  56. Malinverno, A.; Ryan, W.B.F. Extension in the Tyrrhenian Sea and Shortening in the Apennines as Result of Arc Migration Driven by Sinking of the Lithosphere. Tectonics 1986, 5, 227–245. [Google Scholar] [CrossRef]
  57. Rehault, J.-P.; Boillot, G.; Mauffret, A. The Western Mediterranean Basin Geological Evolution. Mar. Geol. 1984, 55, 447–477. [Google Scholar] [CrossRef]
  58. Selvaggi, G.; Chiarabba, C. Seismicity and P-Wave Velocity Image of the Southern Tyrrhenian Subduction Zone. Geophys. J. Int. 1995, 121, 818–826. [Google Scholar] [CrossRef] [Green Version]
  59. Ghisetti, F.; Vezzani, L. Different Styles of Deformation in the Calabrian Arc (Southern Italy): Implications for a Seismotectonic Zoning. Tectonophysics 1982, 85, 149–165. [Google Scholar] [CrossRef]
  60. Kastens, K.; Mascle, J.; Auroux, C.; Bonatti, E.; Broglia, C.; Channell, J.; Curzi, P.; Emeis, K.C.; Glacon, G.; Hasegawa, S.; et al. ODP Leg 107 in the Tyrrhenian Sea: Insights into Passive Margin and Back-Arc Basin Evolution. Geol. Soc. Am. Bull. 1988, 100, 1140–1156. [Google Scholar] [CrossRef]
  61. Pepe, F.; Bertotti, G.; Cella, F.; Marsella, E. Rifted Margin Formation in the South Tyrrhenian Sea: A High-Resolution Seismic Profile across the North Sicily Passive Continental Margin. Tectonics 2000, 19, 241–257. [Google Scholar] [CrossRef]
  62. Pepe, F.; Sulli, A.; Agate, M.; Di Maio, D.; Kok, A.; Lo Iacono, C.; Catalano, R. Plio-Pleistocene Geological Evolution of the Northern Sicily Continental Margin (Southern Tyrrhenian Sea): New Insights from High-Resolution, Multi-Electrode Sparker Profiles. Geo-Mar. Lett. 2003, 23, 53–63. [Google Scholar] [CrossRef]
  63. Meschis, M.; Roberts, G.P.; Robertson, J.; Briant, R.M. The Relationships Between Regional Quaternary Uplift, Deformation Across Active Normal Faults, and Historical Seismicity in the Upper Plate of Subduction Zones: The Capo D’Orlando Fault, NE Sicily. Tectonics 2018, 37, 1231–1255. [Google Scholar] [CrossRef] [Green Version]
  64. Trincardi, F.; Zitellini, N. The Rifting of the Tyrrhenian Basin. Geo-Mar. Lett. 1987, 7, 1–6. [Google Scholar] [CrossRef]
  65. Monaco, C.; Tortorici, L. Active Faulting in the Calabrian Arc and Eastern Sicily. J. Geodyn. 2000, 29, 407–424. [Google Scholar] [CrossRef]
  66. Serpelloni, E.; Faccenna, C.; Spada, G.; Dong, D.; Williams, S.D.P. Vertical GPS Ground Motion Rates in the Euro-Mediterranean Region: New Evidence of Velocity Gradients at Different Spatial Scales along the Nubia-Eurasia Plate Boundary. J. Geophys. Res. Solid Earth 2013, 118, 6003–6024. [Google Scholar] [CrossRef] [Green Version]
  67. Mastrolembo Ventura, B.; Serpelloni, E.; Argnani, A.; Bonforte, A.; Bürgmann, R.; Anzidei, M.; Baldi, P.; Puglisi, G. Fast Geodetic Strain-Rates in Eastern Sicily (Southern Italy): New Insights into Block Tectonics and Seismic Potential in the Area of the Great 1693 Earthquake. Earth Planet. Sci. Lett. 2014, 404, 77–88. [Google Scholar] [CrossRef]
  68. Wells, D.L.; Coppersmith, K.J. New Empirical Relationships among Magnitude, Rupture Length, Rupture Width, Rupture Area, and Surface Displacement. Bull. Seismol. Soc. Am. 1994, 84, 974–1002. [Google Scholar]
  69. Galli, P.; Galadini, F.; Pantosti, D. Twenty Years of Paleoseismology in Italy. Earth-Sci. Rev. 2008, 88, 89–117. [Google Scholar] [CrossRef]
  70. Chapman, N.; Berryman, K.; Villamor, P.; Epstein, W.; Cluff, L.; Kawamura, H. Active Faults and Nuclear Power Plants. Eos Trans. Am. Geophys. Union 2014, 95, 33–34. [Google Scholar] [CrossRef]
  71. Yeats, R. Active Faults of the World; Cambridge University Press: Cambridge, UK, 2012; ISBN 9781139035644. [Google Scholar]
  72. Gvirtzman, Z.; Nur, A. Residual Topography, Lithospheric Structure and Sunken Slabs in the Central Mediterranean. Earth Planet. Sci. Lett. 2001, 187, 117–130. [Google Scholar] [CrossRef]
  73. Meschis, M.; Scicchitano, G.; Roberts, G.P.; Robertson, J.; Barreca, G.; Monaco, C.; Spampinato, C.; Sahy, D.; Antonioli, F.; Mildon, Z.K.; et al. Regional Deformation and Offshore Crustal Local Faulting as Combined Processes to Explain Uplift through Time Constrained by Investigating Differentially-uplifted Late Quaternary Palaeoshorelines: The Foreland Hyblean Plateau, SE Sicily. Tectonics 2020. [Google Scholar] [CrossRef]
  74. Balescu, S.; Dumas, B.; Guérémy, P.; Lamothe, M.; Lhénaff, R.; Raffy, J. Thermoluminescence Dating Tests of Pleistocene Sediments from Uplifted Marine Shorelines along the Southwest Coastline of the Calabrian Peninsula (Southern Italy). Palaeogeogr. Palaeoclimatol. Palaeoecol. 1997, 130, 25–41. [Google Scholar] [CrossRef]
  75. Bonardi, G.; Cavazza, W.; Perrone, V.; Rossi, S. Calabria-Peloritani Terrane and Northern Ionian Sea. In Anatomy of an Orogen: The apennines and adjacent mediterranean basins; Springer: Berlin/Heidelberg, Germany, 2001; pp. 287–306. [Google Scholar]
  76. Doglioni, C.; Innocenti, F.; Mariotti, G. Why Mt Etna ? Terra Nov. 2001, 13, 25–31. [Google Scholar] [CrossRef] [Green Version]
  77. Dumas, B.; Gueremy, P.; Hearty, P.J.; Lhenaff, R.; Raffy, J. Morphometric Analysis and Amino Acid Geochronology of Uplifted Shorelines in a Tectonic Region near Reggio Calambria, South Italy. Palaeogeogr. Palaeoclimatol. Palaeoecol. 1988, 68, 273–289. [Google Scholar] [CrossRef]
  78. Dumas, B.; Gueremy, P.; Lhenaff, R.; Raffy, J. Rapid Uplift, Stepped Marine Terraces and Raised Shorelines on the Calabrian Coast of Messina Strait, Italy. Earth Surf. Process. Landf. 1993, 18, 241–256. [Google Scholar] [CrossRef]
  79. Dumas, B.; Guérémy, P.; Raffy, J. Evidence for Sea-Level Oscillations by the “Characteristic Thickness” of Marine Deposits from Raised Terraces of Southern Calabria (Italy). Quat. Sci. Rev. 2005, 24, 2120–2136. [Google Scholar] [CrossRef]
  80. Ferranti, L.; Monaco, C.; Antonioli, F.; Maschio, L.; Kershaw, S.; Verrubbi, V. The Contribution of Regional Uplift and Coseismic Slip to the Vertical Crustal Motion in the Messina Straits, Southern Italy: Evidence from Raised Late Holocene Shorelines. J. Geophys. Res. 2007, 112. [Google Scholar] [CrossRef] [Green Version]
  81. Miyauchi, T.; Dai Pra, G.; Sylos Labini, S. Geochronology of Pleistocene Marine Terraces and Regional Tectonics in the Tyrrhenian Coast of South Calabria, Italy. Quaternario 1994, 7, 17–34. [Google Scholar]
  82. Jacques, E.; Monaco, C.; Tapponnier, P.; Tortorici, L.; Winter, T. Faulting and Earthquake Triggering during the 1783 Calabria Seismic Sequence. Geophys. J. Int. 2001, 147, 499–516. [Google Scholar] [CrossRef] [Green Version]
  83. Ferranti, L.; Monaco, C.; Morelli, D.; Antonioli, F.; Maschio, L. Holocene Activity of the Scilla Fault, Southern Calabria: Insights from Coastal Morphological and Structural Investigations. Tectonophysics 2008, 453, 74–93. [Google Scholar] [CrossRef]
  84. Tarquini, S.; Vinci, S.; Favalli, M.; Doumaz, F.; Fornaciai, A.; Nannipieri, L. Release of a 10-m-Resolution DEM for the Italian Territory: Comparison with Global-Coverage DEMs and Anaglyph-Mode Exploration via the Web. Comput. Geosci. 2012, 38, 168–170. [Google Scholar] [CrossRef] [Green Version]
  85. Armijo, R.; Meyer, B.; King, G.C.P.; Rigo, A.; Papanastassiou, D. Quaternary Evolution of the Corinth Rift and Its Implications for the Late Cenozoic Evolution of the Aegean. Geophys. J. Int. 1996, 126, 11–53. [Google Scholar] [CrossRef] [Green Version]
  86. Pedoja, K.; Jara-Muñoz, J.; De Gelder, G.; Robertson, J.; Meschis, M.; Fernandez-Blanco, D.; Nexer, M.; Poprawski, Y.; Dugué, O.; Delcaillau, B.; et al. Neogene-Quaternary Slow Coastal Uplift of Western Europe through the Perspective of Sequences of Strandlines from the Cotentin Peninsula (Normandy, France). Geomorphology 2018, 303, 338–356. [Google Scholar] [CrossRef]
  87. Robertson, J.; Roberts, G.P.; Iezzi, F.; Meschis, M.; Gheorghiu, D.M.; Sahy, D.; Bristow, C.; Sgambato, C. Distributed Normal Faulting in the Tip Zone of the South Alkyonides Fault System, Gulf of Corinth, Constrained Using 36Cl Exposure Dating of Late-Quaternary Wave-Cut Platforms. J. Struct. Geol. 2020, 136, 104063. [Google Scholar] [CrossRef] [Green Version]
  88. De Santis, V.; Scardino, G.; Meschis, M.; Ortiz, J.E.; Sánchez-Palencia, Y.; Caldara, M. Refining the Middle-Late Pleistocene Chronology of Marine Terraces and Uplift History in a Sector of the Apulian Foreland (Southern Italy) by Applying a Synchronous Correlation Technique and Amino Acid Racemization to Patella Spp. and Thetystrombus Latus. Ital. J. Geosci. 2021, 140. [Google Scholar] [CrossRef]
  89. Papanikolaou, I.D.; Roberts, G.P. Geometry, Kinematics and Deformation Rates along the Active Normal Fault System in the Southern Apennines: Implications for Fault Growth. J. Struct. Geol. 2007, 29, 166–188. [Google Scholar] [CrossRef]
  90. Carobene, L.; Dai Pra, G. Middle and Upper Pleistocene Sea Level Highstands along the Tyrrhenian Coast of Basilicata (Southern Italy). Quaternario 1991, 4, 173–202. [Google Scholar]
  91. Cerrone, C.; Ascione, A.; Robustelli, G.; Tuccimei, P.; Soligo, M.; Balassone, G.; Mormone, A. Late Quaternary Uplift and Sea Level Fluctuations along the Tyrrhenian Margin of Basilicata - Northern Calabria (Southern Italy): New Constraints from Raised Paleoshorelines. Geomorphology 2021, 395, 107978. [Google Scholar] [CrossRef]
  92. Bianca, M.; Monaco, C.; Tortorici, L.; Cernobori, L. Quaternary Normal Faulting in Southeastern Sicily (Italy): A Seismic Source for the 1693 Large Earthquake. Geophys. J. Int. 1999, 139, 370–394. [Google Scholar] [CrossRef] [Green Version]
  93. Catalano, S.; De Guidi, G.; Monaco, C.; Tortorici, G.; Tortorici, L. Long-Term Behaviour of the Late Quaternary Normal Faults in the Straits of Messina Area (Calabrian Arc): Structural and Morphological Constraints. Quat. Int. 2003, 101–102, 81–91. [Google Scholar] [CrossRef]
  94. Bianca, M.; Catalano, S.; De Guidi, G.; Gueli, A.; Monaco, C.; Ristuccia, G.M.; Stella, G.; Tortorici, G.; Tortorici, L.; Troja, S.O. Luminescence Chronology of Pleistocene Marine Terraces of Capo Vaticano Peninsula (Calabria, Southern Italy). Quat. Int. 2011, 232, 114–121. [Google Scholar] [CrossRef]
  95. Giunta, G.; Gueli, A.M.; Monaco, C.; Orioli, S.; Ristuccia, G.M.; Stella, G.; Troja, S.O. Middle-Late Pleistocene Marine Terraces and Fault Activity in the Sant’Agata Di Militello Coastal Area (North-Eastern Sicily). J. Geodyn. 2012, 55, 32–40. [Google Scholar] [CrossRef]
  96. Gallen, S.F.; Wegmann, K.W.; Bohnenstiehl, D.R.; Pazzaglia, F.J.; Brandon, M.T.; Fassoulas, C. Active Simultaneous Uplift and Margin-Normal Extension in a Forearc High, Crete, Greece. Earth Planet. Sci. Lett. 2014, 398, 11–24. [Google Scholar] [CrossRef]
  97. Tortorici, G.; Bianca, M.; De Guidi, G.; Monaco, C.; Tortorici, L. Fault Activity and Marine Terracing in the Capo Vaticano Area (Southern Calabria) during the Middle-Late Quaternary. Quat. Int. 2003, 101–102, 269–278. [Google Scholar] [CrossRef]
  98. Houghton, S.L.; Roberts, G.P.; Papanikolaοu, I.D.; McArthur, J.M. New 234U- 230Th Coral Dates from the Western Gulf of Corinth: Implications for Extensional Tectonics. Geophys. Res. Lett. 2003, 30, 2013. [Google Scholar] [CrossRef] [Green Version]
  99. Meschis, M.; Roberts, G.P.; Robertson, J.; Mildon, Z.K.; Sahy, D.; Goswami, R.; Sgambato, C.; Faure Walker, J.; Michetti, A.M.; Iezzi, F. Out of Phase Uplift-Rate Changes During the Quaternary Reveal Normal Fault Interaction, Implied by Deformed Marine Palaeoshorelines, in Southern Italy. SSRN Electron. J. 2022. [Google Scholar] [CrossRef]
  100. Siddall, M.; Rohling, E.J.; Almogi-Labin, A.; Hemleben, C.; Meischner, D.; Schmelzer, I.; Smeed, D.A. Sea-Level Fluctuations during the Last Glacial Cycle. Nature 2003, 423, 853–858. [Google Scholar] [CrossRef]
  101. Rohling, E.J.; Foster, G.L.; Grant, K.M.; Marino, G.; Roberts, A.P.; Tamisiea, M.E.; Williams, F. Sea-Level and Deep-Sea-Temperature Variability over the Past 5.3 Million Years. Nature 2014, 508, 477–482. [Google Scholar] [CrossRef]
  102. Blewitt, G.; Hammond, W.; Kreemer, C. Harnessing the GPS Data Explosion for Interdisciplinary Science. Eos 2018, 99, 485. [Google Scholar] [CrossRef]
  103. Kreemer, C.; Blewitt, G.; Klein, E.C. A Geodetic Plate Motion and Global Strain Rate Model. Geochem. Geophys. Geosystems 2014, 15, 3849–3889. [Google Scholar] [CrossRef]
  104. Teza, G.; Pesci, A.; Galgaro, A. Grid_strain and Grid_strain3: Software Packages for Strain Field Computation in 2D and 3D Environments. Comput. Geosci. 2008, 34, 1142–1153. [Google Scholar] [CrossRef]
  105. Toda, S.; Stein, R.S.; Sevilgen, V.; Lin, J. Coulomb 3.3. Graphic-Rich Deformation & Stress-Change Software for Earthquake, Tectonic and Volcano Research and Teaching - User Guide. USGS Open-File Rep. 2011, 1060, 63. [Google Scholar]
  106. Mildon, Z.K.; Toda, S.; Faure Walker, J.P.; Roberts, G.P. Evaluating Models of Coulomb Stress Transfer: Is Variable Fault Geometry Important? Geophys. Res. Lett. 2016, 43, 12–407. [Google Scholar] [CrossRef]
  107. Meschis, M.; Roberts, G.P.; Mildon, Z.K.; Robertson, J.; Michetti, A.M.; Faure Walker, J.P. Slip on a Mapped Normal Fault for the 28th December 1908 Messina Earthquake (Mw 7.1) in Italy. Sci. Rep. 2019, 9, 6481. [Google Scholar] [CrossRef] [PubMed] [Green Version]
  108. Lin, J.; Stein, R.S. Stress Triggering in Thrust and Subduction Earthquakes and Stress Interaction between the Southern San Andreas and Nearby Thrust and Strike-Slip Faults. J. Geophys. Res. Solid Earth 2004, 109, 1–19. [Google Scholar] [CrossRef]
  109. Iezzi, F.; Mildon, Z.; Walker, J.F.; Roberts, G.; Goodall, H.; Wilkinson, M.; Robertson, J. Coseismic Throw Variation Across Along-Strike Bends on Active Normal Faults: Implications for Displacement Versus Length Scaling of Earthquake Ruptures. J. Geophys. Res. Solid Earth 2018, 1–25. [Google Scholar] [CrossRef] [Green Version]
  110. Faccenna, C.; Molin, P.; Orecchio, B.; Olivetti, V.; Bellier, O.; Funiciello, F.; Minelli, L.; Piromallo, C.; Billi, A. Topography of the Calabria Subduction Zone (Southern Italy): Clues for the Origin of Mt. Etna. Tectonics 2011, 30, 1–20. [Google Scholar] [CrossRef]
  111. Pedoja, K.; Husson, L.; Johnson, M.E.; Melnick, D.; Witt, C.; Pochat, S.; Nexer, M.; Delcaillau, B.; Pinegina, T.; Poprawski, Y.; et al. Coastal Staircase Sequences Reflecting Sea-Level Oscillations and Tectonic Uplift during the Quaternary and Neogene. Earth Sci. Rev. 2014, 132, 13–38. [Google Scholar] [CrossRef]
  112. Meschis, M.; Roberts, G.P.; Robertson, J.; Mildon, Z.K.; Sahy, D.; Goswami, R.; Sgambato, C.; Walker, J.F.; Michetti, A.M.; Iezzi, F. Out of Phase Quaternary Uplift-Rate Changes Reveal Normal Fault Interaction, Implied by Deformed Marine Palaeoshorelines. Geomorphology 2022, 416, 108432. [Google Scholar] [CrossRef]
  113. Antonioli, F.; Ferranti, L.; Lambeck, K.; Kershaw, S.; Verrubbi, V.; Dai Pra, G. Late Pleistocene to Holocene Record of Changing Uplift Rates in Southern Calabria and Northeastern Sicily (Southern Italy, Central Mediterranean Sea). Tectonophysics 2006, 422, 23–40. [Google Scholar] [CrossRef]
  114. Colella, A.; De Boer, P.L.; Nio, S.D. Sedimentology of a Marine Intermontane Pleistocene Gilbert-Type Fan-Delta Complex in the Crati Basin, Calabria, Southern Italy. Sedimentology 1987, 34, 721–736. [Google Scholar] [CrossRef]
  115. Roberts, G.P.; Michetti, A.M.; Cowie, P.; Morewood, N.C.; Papanikolaou, I. Fault Slip-Rate Variations during Crustal-Scale Strain Localisation, Central Italy. Geophys. Res. Lett. 2002, 29, 9-1-9-4. [Google Scholar] [CrossRef] [Green Version]
  116. Roberts, G.P.; Michetti, A.M. Spatial and Temporal Variations in Growth Rates along Active Normal Fault Systems: An Example from The Lazio–Abruzzo Apennines, Central Italy. J. Struct. Geol. 2004, 26, 339–376. [Google Scholar] [CrossRef]
  117. Galli, P.; Bosi, V. Catastrophic 1638 Earthquakes in Calabria (Southern Italy): New Insights from Paleoseismological Investigation. J. Geophys. Res. Solid Earth 2003, 108, ETG 1-1-ETG 1-20. [Google Scholar] [CrossRef] [Green Version]
  118. Ferranti, L.; Palano, M.; Cannavò, F.; Mazzella, M.E.; Oldow, J.S.; Gueguen, E.; Mattia, M.; Monaco, C. Rates of Geodetic Deformation across Active Faults in Southern Italy. Tectonophysics 2014, 621, 101–122. [Google Scholar] [CrossRef]
  119. Quye-sawyer, J.; Whittaker, A.C.; Roberts, G.; Rood, D. Fault Throw and Regional Uplift Histories From Drainage Analysis: Evolution of Southern Italy. Tectonics 2021, 40, e2020TC006076. [Google Scholar] [CrossRef]
  120. Galli, P.; Bosi, V. Paleoseismology along the Cittanova Fault: Implications for Seismotectonics and Earthquake Recurrence in Calabria (Southern Italy). J. Geophys. Res. 2002, 107, 2044. [Google Scholar] [CrossRef]
  121. Faure Walker, J.P.; Roberts, G.P.; Sammonds, P.R.; Cowie, P. Comparison of Earthquake Strains over 102 and 104 Year Timescales: Insights into Variability in the Seismic Cycle in the Central Apennines, Italy. J. Geophys. Res. 2010, 115. [Google Scholar] [CrossRef] [Green Version]
  122. Tansi, C.; Tallarico, A.; Iovine, G.; Folino Gallo, M.; Falcone, G. Interpretation of Radon Anomalies in Seismotectonic and Tectonic-Gravitational Settings: The South-Eastern Crati Graben (Northern Calabria, Italy). Tectonophysics 2005, 396, 181–193. [Google Scholar] [CrossRef]
  123. Spina, V.; Galli, P.; Tondi, E.; Critelli, S.; Cello, G. Kinematics and Structural Properties of an Active Fault Zone in the Sila Massif (Northern Calabria, Italy). Boll. Soc. Geol. Ital. 2007, 126, 427–438. [Google Scholar]
  124. Maesano, F.E.; Tiberti, M.M.; Basili, R. The Calabrian Arc: Three-Dimensional Modelling of the Subduction Interface. Sci. Rep. 2017, 7, 8887. [Google Scholar] [CrossRef] [Green Version]
  125. Carafa, M.M.C.; Kastelic, V.; Bird, P.; Maesano, F.E.; Valensise, G. A “Geodetic Gap” in the Calabrian Arc: Evidence for a Locked Subduction Megathrust? Geophys. Res. Lett. 2018, 45, 1794–1804. [Google Scholar] [CrossRef]
  126. Sgroi, T.; Polonia, A.; Barberi, G.; Billi, A.; Gasperini, L. New Seismological Data from the Calabrian Arc Reveal Arc-Orthogonal Extension across the Subduction Zone. Sci. Rep. 2021, 11, 473. [Google Scholar] [CrossRef] [PubMed]
  127. Gvirtzman, Z.; Nur, A. The Formation of Mount Etna as the Consequence of Slab Rollback. Nature 1999, 401, 782–785. [Google Scholar] [CrossRef]
  128. Mouslopoulou, V.; Oncken, O.; Hainzl, S.; Nicol, A. Uplift Rate Transients at Subduction Margins Due to Earthquake Clustering. Tectonics 2016, 35, 2370–2384. [Google Scholar] [CrossRef] [Green Version]
  129. Nicol, A.; Beavan, J. Shortening of an Overriding Plate and Its Implications for Slip on a Subduction Thrust, Central Hikurangi Margin, New Zealand. Tectonics 2003, 22. [Google Scholar] [CrossRef]
  130. Goes, S.; Giardini, D.; Jenny, S.; Hollenstein, C.; Kahle, H.-G.; Geiger, A. A Recent Tectonic Reorganization in the South-Central Mediterranean. Earth Planet. Sci. Lett. 2004, 226, 335–345. [Google Scholar] [CrossRef]
  131. Wortel, M.J.; Spakman, W. Subduction and Slab Detachment in the Mediterranean-Carpathian Region. Science 2000, 290, 1910–1917. [Google Scholar] [CrossRef]
  132. Serpelloni, E.; Cavaliere, A.; Martelli, L.; Pintori, F.; Anderlini, L.; Borghi, A.; Randazzo, D.; Bruni, S.; Devoti, R.; Perfetti, P.; et al. Surface Velocities and Strain-Rates in the Euro-Mediterranean Region From Massive GPS Data Processing. Front. Earth Sci. 2022, 10, 1–21. [Google Scholar] [CrossRef]
  133. Mildon, Z.K.; Roberts, G.; Walker, J.F.; Beck, J.; Papanikolaou, I.; Michetti, A.; Toda, S.; Iezzi, F.; Campbell, L.; McCaffrey, K. Earthquake Clustering Controlled by Shear Zone Interaction. Earth Sci. Phys. Sci. Math. Tecton. Struct. 2019. [Google Scholar] [CrossRef] [Green Version]
  134. Michetti, A.M.; Ferreli, L.; Serva, L.; Vittori, E. Geological Evidence for Strong Historical Earthquakes in an “Aseismic” Region: The Pollino Case (Southern Italy). J. Geodyn. 1997, 24, 67–86. [Google Scholar] [CrossRef]
  135. Catalano, S.; De Guidi, G. Late Quaternary Uplift of Northeastern Sicily: Relation with the Active Normal Faulting Deformation. J. Geodyn. 2003, 36, 445–467. [Google Scholar] [CrossRef]
  136. Cheloni, D.; D’Agostino, N.; D’Anastasio, E.; Avallone, A.; Mantenuto, S.; Giuliani, R.; Mattone, M.; Calcaterra, S.; Gambino, P.; Dominici, D.; et al. Coseismic and Initial Post-Seismic Slip of the 2009 Mw 6.3 L’Aquila Earthquake, Italy, from GPS Measurements. Geophys. J. Int. 2010, 181, 1539–1546. [Google Scholar] [CrossRef] [Green Version]
  137. Serpelloni, E.; Anderlini, L.; Belardinelli, M.E. Fault Geometry, Coseismic-Slip Distribution and Coulomb Stress Change Associated with the 2009 April 6, Mw 6.3, L’Aquila Earthquake from Inversion of GPS Displacements. Geophys. J. Int. 2012, 188, 473–489. [Google Scholar] [CrossRef] [Green Version]
  138. Lavecchia, G.; Castaldo, R.; de Nardis, R.; De Novellis, V.; Ferrarini, F.; Pepe, S.; Brozzetti, F.; Solaro, G.; Cirillo, D.; Bonano, M.; et al. Ground Deformation and Source Geometry of the 24 August 2016 Amatrice Earthquake (Central Italy) Investigated through Analytical and Numerical Modeling of DInSAR Measurements and Structural-Geological Data. Geophys. Res. Lett. 2016, 43, 12–389. [Google Scholar] [CrossRef]
  139. Papanikolaou, I.D.; Foumelis, M.; Parcharidis, I.; Lekkas, E.L.; Fountoulis, I.G. Deformation Pattern of the 6 and 7 April 2009, MW=6.3 and MW=5.6 Earthquakes in L’Aquila (Central Italy) Revealed by Ground and Space Based Observations. Nat. Hazards Earth Syst. Sci. 2010, 10, 73–87. [Google Scholar] [CrossRef]
  140. Stein, R.S.; Barrientos, S.E. Planar High-Angle Faulting in the Basin and Range: Geodetic Analysis of the 1983 Borah Peak, Idaho, Earthquake. J. Geophys. Res. 1985, 90, 11355. [Google Scholar] [CrossRef] [Green Version]
  141. Cowie, P.A.; Scholz, C.H.; Roberts, G.P.; Faure Walker, J.P.; Steer, P. Viscous Roots of Active Seismogenic Faults Revealed by Geologic Slip Rate Variations. Nat. Geosci. 2013, 3, 10–14. [Google Scholar] [CrossRef] [Green Version]
  142. Thatcher, W. Nonlinear Strain Buildup and the Earthquake Cycle on the San Andreas Fault. J. Geophys. Res. Solid Earth 1983, 88, 5893–5902. [Google Scholar] [CrossRef] [Green Version]
  143. Sibson, R.H. Fault Rocks and Fault Mechanisms. J. Geol. Soc. London. 1977, 133, 191–213. [Google Scholar] [CrossRef]
  144. Cambiotti, G.; Palano, M.; Orecchio, B.; Marotta, A.M.; Barzaghi, R.; Neri, G.; Sabadini, R. New Insights into Long-Term Aseismic Deformation and Regional Strain Rates from GNSS Data Inversion: The Case of the Pollino and Castrovillari Faults. Remote Sens. 2020, 12, 2921. [Google Scholar] [CrossRef]
Figure 1. Map of the investigated area. Sketched fault map of the northern Calabria is shown, across the strike of the E-dipping West Crati Fault and where uplifted marine terraces are mapped. Locations of age controls are shown from literature (Table 1). Green-coloured stars show that historical earthquakes occurred within the investigated area. Pink-coloured dots show the network of continuous GNSS stations. Inset A shows Quaternary active normal faults within the Calabrian–Peloritani Arc and the trace of the Ionian Subduction Zone (ISZ) [29,90].
Remotesensing 14 05303 g001
Figure 2. A map with locations of serial topographic profiles along the strike of the West Crati Fault is shown. Coloured dots identify inner edges and associated refined ages along a serial of topographic profiles intercepting raised marine terraces. Dashed squares show where a “zoom–in” has been carried out as Supplementary Material (SM) to better show traces of topographic profiles and locations of inner edges with refined ages on a 10 m high–resolution digital elevation model. Dashed orange trace shows the mapped palaeoshoreline identifying the Last Interglacial Maximum (LIG), MIS 5e [29].
Remotesensing 14 05303 g002
Figure 3. Evidence of raised marine terraces and their associated palaeoshorelines: in (a) three prominent sea-level highstands such as the 125 ka (MIS 5e), the 240 ka (MIS 7e), and the 340 ka (MIS 9e), which are mapped from Google Earth just south of Paola town, close to our Profile 11; in (b) a modified photo taken from Westaway (1993), showing a sequence of marine terraces from field close to Profile 1, close to Coreca town. Inset A shows a sketch of conceptual evolution when marine terraces form.
Remotesensing 14 05303 g003
Figure 4. Topographic profiles derived by using 10 m high-resolution DEMs (Tarquini et al., 2012) from fault tips area and the centre of the fault showing modelled palaeoshoreline elevations. Sea-level highstands, identifying and predicting palaeoshoreline elevations, are represented by coloured lines that are calculated by iterating values of uplift rate to find the best match with the mapped (numbered arrows) palaeoshorelines. All topographic profiles are shown in Figure 2 and Figures S5–S10. Inner edge elevations with refined ages are also shown in Table 4.
Remotesensing 14 05303 g004
Figure 5. Graph showing a linear regression analysis between iteratively calculated sea-level highstand elevations and our mapped palaeoshoreline elevations on DEMs. Note that the predicted elevations have been derived by defining a constant uplift rate through time and iterating this value to find the best match to the measured and mapped palaeoshorelines.
Remotesensing 14 05303 g005
Figure 6. Crustal uplift (a) and uplift rates (b) over the Quaternary. Topographic profiles from Figure 2 are labelled. Palaeoshoreline elevations change along the strike of the West Crati Fault, suggesting Late Quaternary faulting activity (a). Spatially changing rates of uplift measured along the strike of the West Crati Fault outcropping on its uplifting footwall are also mapped (b). Values of tilting angles in degrees are calculated for each mapped marine terrace and are presented in (c), showing that older palaeoshorelines have higher tilt angles; this suggests that they have experienced a longer history of differential uplift and that differential uplift was ongoing progressively during the Late Quaternary. Note that values of tilt angle for each investigated marine terrace have been calculated as a tan−1 of a gradient m of a straight line (equation y = mx), as proposed by previous studies [20,63,73].
Remotesensing 14 05303 g006
Figure 7. (a) Estimated velocities of GNSS stations in the studied area. The horizontal velocity vectors (for both EU and AF plate fixed reference frames and corresponding error ellipses at 95% confidence level) are shown. The vertical velocity components are shown as colours of the station markers. The KROT station name is magenta-coloured because it is excluded from the strain rate computation; (b) map of interpolated vertical velocity. In Figure S12, time series and modelled trend/periodic components are shown.
Remotesensing 14 05303 g007
Figure 8. (a) Principal strain-rate axes, computed in the grid nodes characterized by high geometric significance; (b) map of the field of change in area (i.e., the trace of the strain-rate tensor); (c) map of the field of engineering shear normalized to the change in area. The strain-rate field is also shown in Figure S13 (Supplementary Material), where the data related to mid significance nodes are also shown.
Remotesensing 14 05303 g008
Figure 9. A schematic structural map is shown where active faults are accommodating our geodetically derived crustal extension of 2.3 mm/yr across the strike of the E-dipping West Crati Fault and throughout northern Calabria. The green star indicates the location of the 1184 “Valle del Crati” earthquake (M 6.75) from the INGV historical catalogue [29]. Inset A shows a no-scaled cartoon where homogenous heave rates (HR) from computed extension rates are assigned among the active faults such as the West Crati Fault, East Crati Fault, and the Lakes Fault. Inset B shows a scheme of a normal fault with the three components where the deformation is measured and the fault dip angles: heave, throw, and displacement. Note that for a 45° fault dip, angle, throw, and heave will be equal.
Remotesensing 14 05303 g009
Figure 10. Modelled co-seismic displacement showing co-seismic uplift and subsidence if the entire fault length of the West Crati Fault (~40 km) would seismically rupture, producing a modelled earthquake of M 6.8. Inset A shows a 3D view of the modelled seismogenic source (the West Crati Fault) with the associated slip distribution in depth, with a maximum value of 3 m. Co-seismic uplift/subsidence contours produced by our preferred modelled fault in the half-elastic space are shown along the profile A-B, with a maximum co-seismic uplift and subsidence of 0.064 m and 0.810 m, respectively, Inset B. Furthermore, a crustal deformation profile (C-D) is produced comparing the co-seismic and long-term footwall uplift along the strike of the fault (Figure S11). Note that the estimated magnitude for the 1184 “Valle del Crati” earthquake is 6.75 and matches our modelled magnitude (M 6.8); moreover, the location of this historical seismic event lies where we estimate the maximum co-seismic subsidence [29].
Remotesensing 14 05303 g010
Table 3. Some data about GNSS stations in the studied area. More data are shown in Table S1 which can be downloaded as Supplementary Material.
GNSS StationTime SeriesUTM33N Coordinates
(m)
Velocity (EU Plate)
(mm/yr)
#NameNearby townL a
(y)
U bEastNorthUpVEσEVNσNVZσZ
1GRI1Grisolia6.4Y57308843992485530.720.113.800.140.20.4
2DIMTDiamante2.5N c570497439212079------
3DIA1Diamante1.8N c569428439643988------
4AQSAAcquaformosa9.6Y59290643973538820.620.054.430.080.090.20
5SLDVSan Lorenzo V.6.4Y60995543921393091.310.073.960.120.90.4
6CORCCorigliano C.3.0N c633640438685185------
7ROS4Rossano4.7Y6408934384649961.690.234.920.16−0.30.5
8CETRCetraro9.7Y58207743759186740.740.083.720.06−0.380.19
9LATTLattarico1.2N c5978974368776445------
10REGIRegina4.1N c5998044367691388----
11TVRNTaverna4.6Y60551643653241971.370.164.140.12−2.30.4
12ARC1Quattromiglia9.6Y60561343582212801.110.104.230.11−1.60.4
13RENDRende4.4N c6022854355735364------
14CAR8Carolei12.5Y60449043455526791.250.034.060.07−0.020.13
15LUZZLuzzi11.3Y61082843670634371.320.104.110.110.10.3
16BISIBisignano3.1N c6106364374498429------
17PIPAPietrapaola14.6Y65617743721744792.000.064.110.070.670.13
18CELICelico10.1Y629925436258612771.740.063.970.060.090.18
19CAMOCamigliatello8.0Y624871435550913131.590.083.920.09−0.80.4
20COSECosenza3.9N c6131164339900663------
21CRLMSan Giovanni F.5.3Y633435434876816101.120.163.900.170.50.4
22SAN3San Giovanni F.1.0N c64571543473221178------
23SGIFSan Giovanni F.3.0N c64675143473421087------
24CCRICaccuri5.3Y65330243433597102.290.164.030.160.20.4
25MEL2Melissa3.5N c6747634353026157------
26CIROCiro Marina2.9N c683641436067152------
27STSVSanta Severina5.3Y66548443349473772.750.133.760.160.50.5
28AMA1Amantea4.7Y5931034330645590.950.094.270.14−0.10.5
29SERSSersale16.2Y646184432212912151.950.053.700.050.550.11
30CUTRCutro8.8Y67190143222042692.660.101.840.161.41.0
31CROTCrotone0.7N c682886432656178------
32KROTCrotone9.0N d6838094327804626.570.093.900.12−2.00.2
a Time-series length. b Used time series (Yes, No). c Time series not used because it is too short (lower than 4.5 yr). d Time series not used because it is placed on an unstable slope.
Table 4. Mapped inner edges from DEM analysis with refined ages for marine terraces assigned via synchronous correlation.
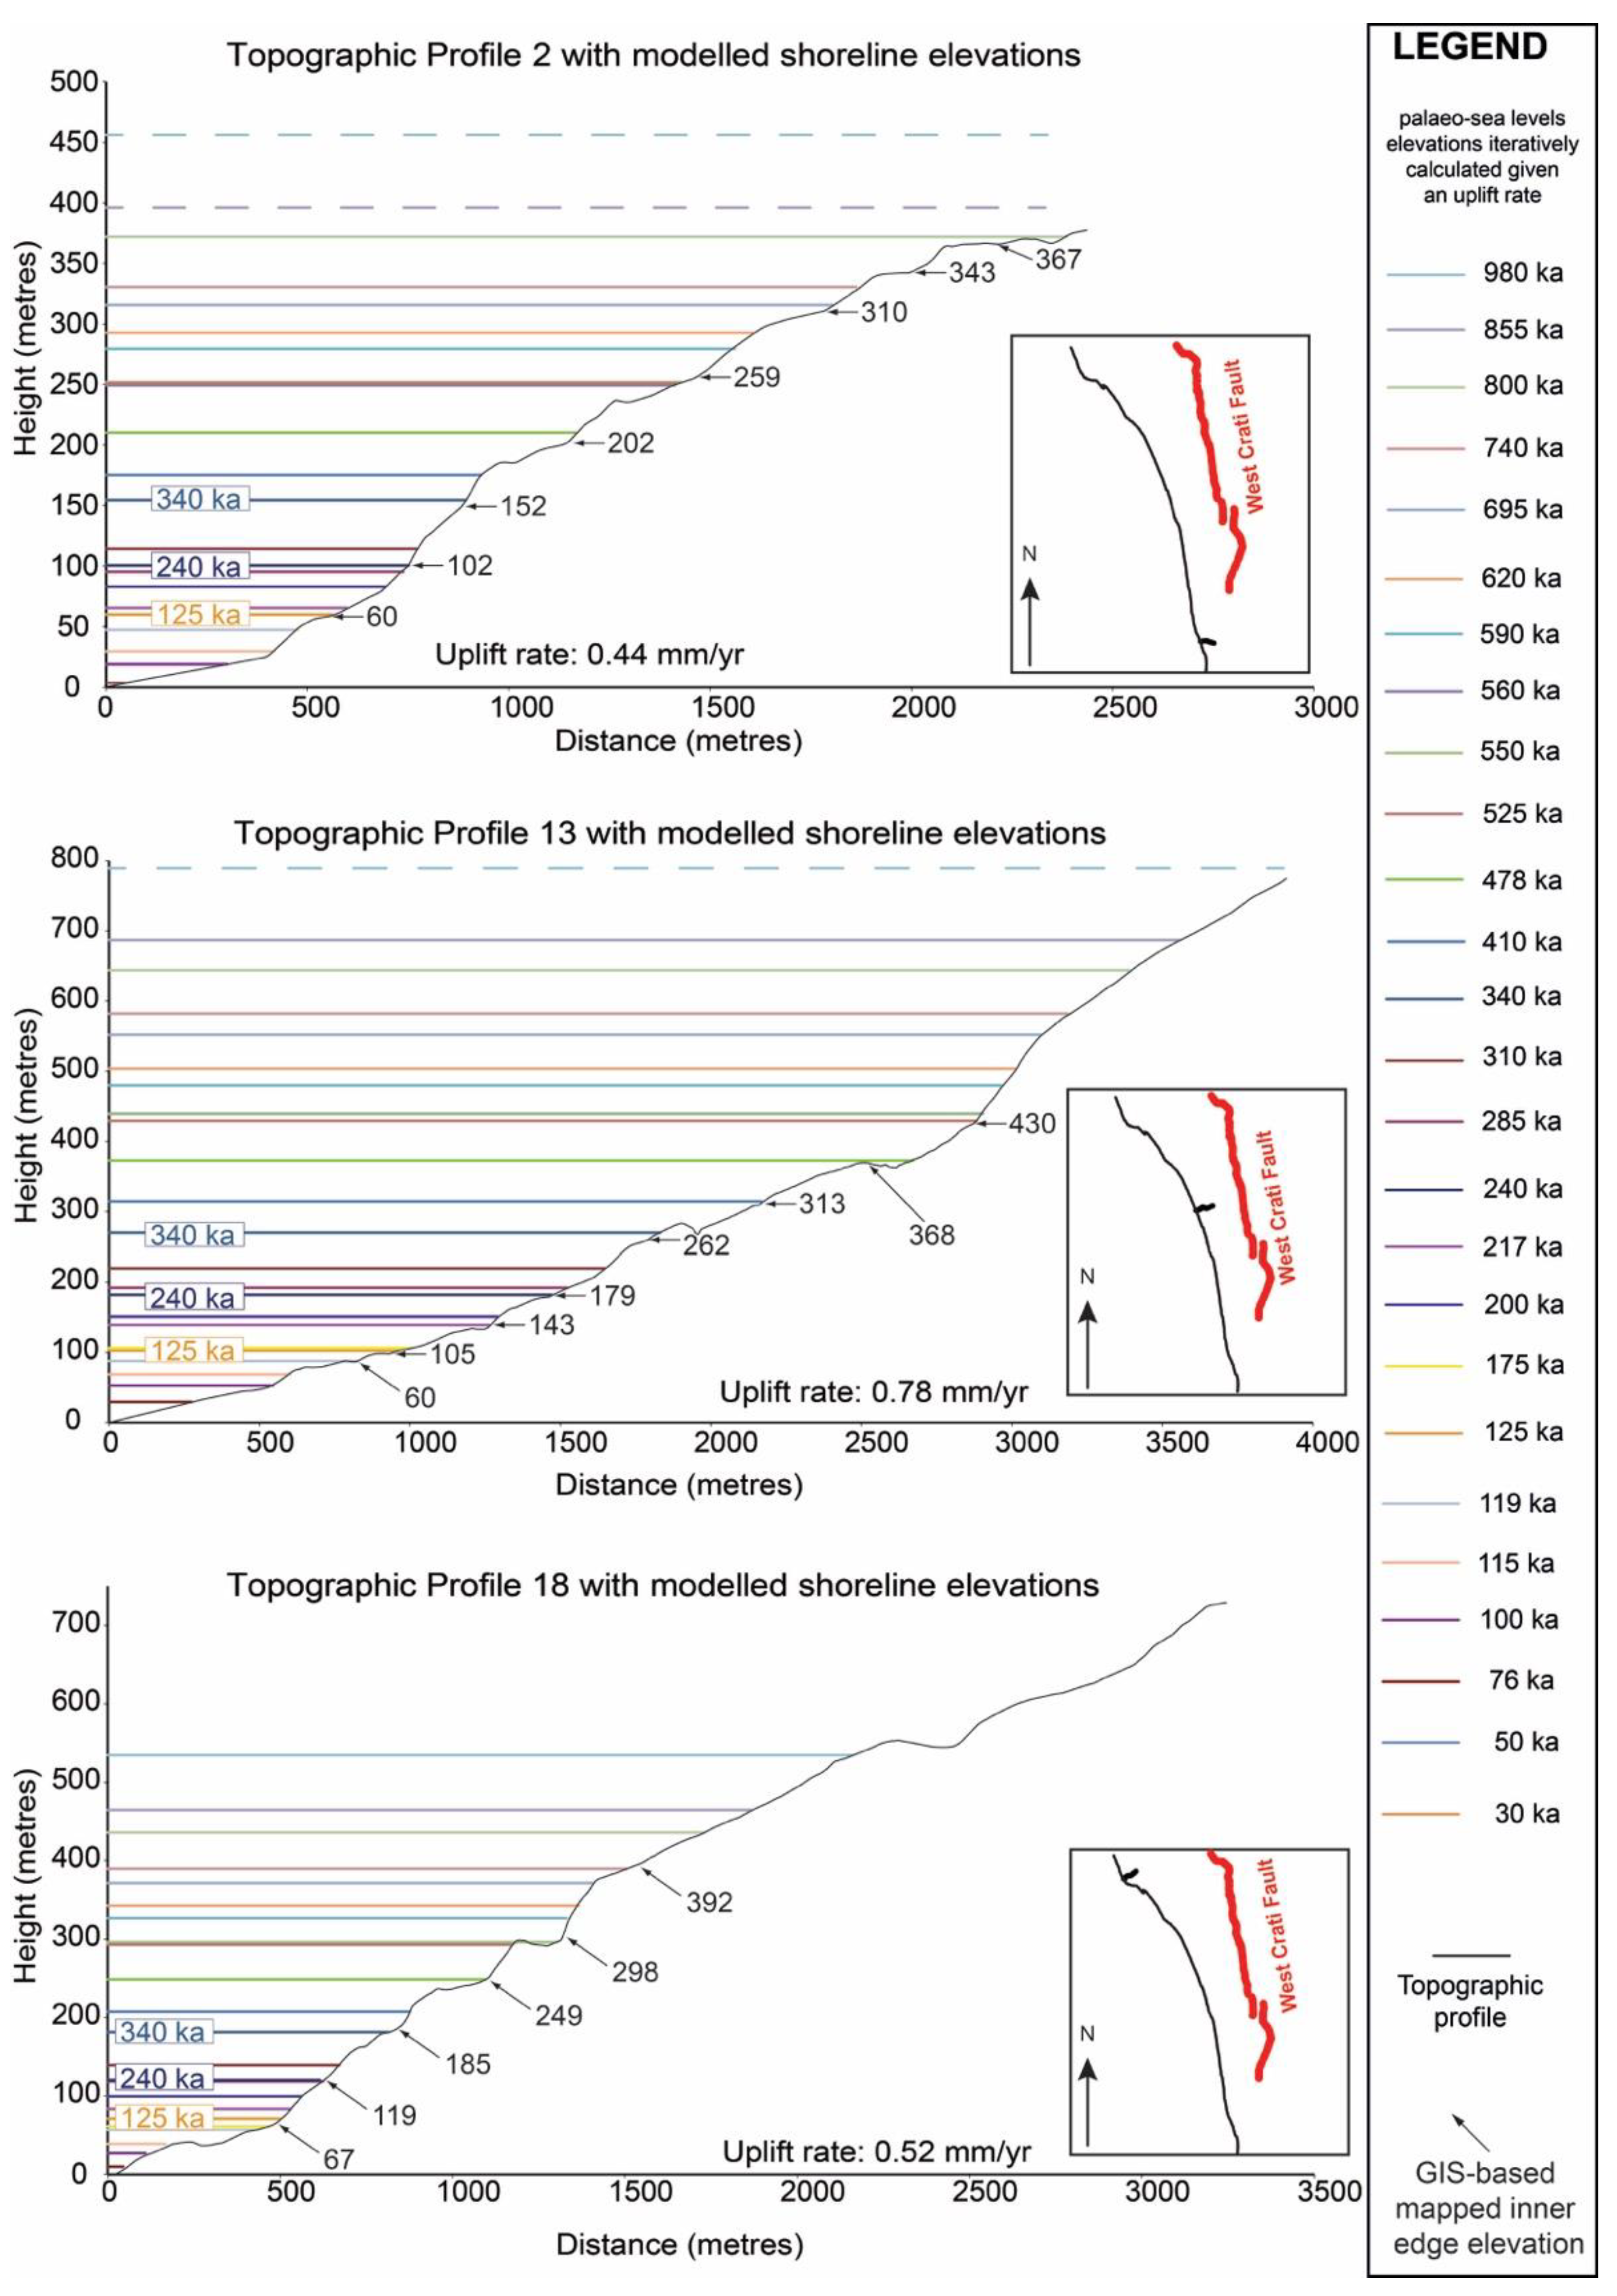
Profile Number
(Sea-Level
Highstand Referred to
Figure 2, Figure S1–10)
UTM 33N Coordinate
(Easting)
UTM 33N Coordinate
(Northing)
DEMs Elevations
(m)
Predicted Elevations
(m)
Our Proposed Age
(ka)
1 (3)594,5774,326,6725255125
1 (7)594,7354,326,8149591240
1 (11)594,8824,326,948158159410
1 (12)595,0854,327,075197191478
1 (13)595,1434,327,196225230525
1 (16)595,1824,327,281253256590
1 (19)595,2364,327,598300301740
2 (3)593,6154,329,9396060125
2 (7)593,8174,329,954102101240
2 (10)593,9454,329,965152155340
2 (12)594,1904,329,907202210478
2 (13)594,4474,329,735259251525
2 (18)594,7714,329,687310316695
2 (19)594,9814,329,601343331740
2 (20)595,1814,329,519367372800
3 (3)593,5164,331,1566761125
3 (5)593,5724,331,1657685200
3 (7)593,6394,331,176103103240
3 (10)593,7274,331,215154158340
3 (13)593,9824,331,238255256525
3 (16)594,0714,331,229288286590
3 (17)594,2654,331,201305299620
3 (20)594,6034,331,131383380800
3 (21)594,7004,331,137399405855
4 (3)593,2934,332,3646365125
4 (7)593,5394,332,240109110240
4 (10)594,1514,332,030165168340
4 (11)594,3004,332,070200192410
4 (12)594,4454,332,127227229478
4 (16)594,6864,332,204296303590
4 (19)594,9294,332,296360360740
5 (3)592,3024,333,9717171125
5 (7)592,3634,333,940118122240
5 (9)592,4394,333,898139142310
5 (10)592,7084,333,730182185340
5 (12)592,8634,333,758251253478
5 (13)592,9894,333,783297298525
5 (16)593,2504,333,869325333590
5 (17)593,4494,333,953352349620
5 (18)593,5724,334,011374378695
6 (3)592,3174,336,7067475125
6 (7)592,4524,336,784130129240
6 (9)592,4894,336,817152152310
6 (10)592,5844,336,878199195340
6 (12)592,7924,336,883276268478
6 (17)593,1974,336,855373367620
6 (21)593,6624,336,811496499855
6 (22)594,0814,336,843570574980
7 (3)592,2734,338,0998085125
7 (7)592,5334,337,959151149240
7 (9)592,6174,337,983173176310
7 (10)592,8294,338,233222223340
7 (11)592,9614,338,295250257410
7 (18)593,7624,338,410452455695
7 (22)594,5764,338,738676652980
8 (3a)592,0944,340,2467071119
8 (7)592,2864,340,264142149240
8 (9)592,419592,419172176310
8 (10)592,6304,340,312222223340
8 (13)593,0244,340,539350356525
8 (19)593,4514,340,643500479740
8 (21)593,6684,340,708560567855
8 (22)594,1334,340,657659652980
9 (3a)591,9474,345,7466976119
9 (3)592,1864,345,6888990125
9 (7)592,5214,345,721152158240
9 (9)592,6734,345,653198189310
9 (11)592,8594,345,548273274410
9 (12)592,9884,345,472326325478
9 (14)593,2234,345,444392384550
9 (17)593,2714,345,348441442620
9 (18)593,6734,345,181488483695
9 (20)594,2144,345,271554564800
10 (2)591,1864,349,9005455100
10 (3)591,4634,349,932107105125
10 (5)591,4964,350,360155155200
10 (7)591,8024,350,462193187240
10 (10)592,1914,350,125275277340
10 (11)592,4204,350,009327323410
10 (12)5929284,350,068380382478
10 (13)593,4484,350,063438440525
10 (16)593,9144,349,906495492590
10 (17)594,0754,349,832530516620
10 (21)594,8344,349,974715704855
11 (3)590,7484,353,620105108125
11 (5)591,1164,353,604164159200
11 (7)591,3074,353,447193192240
11 (10)591,5624,353,463282282340
11 (13)591,8884,353,856445451525
11 (18)592,2974,354,227575580695
11 (21)592,8014,354,534724721855
11 (22)593,1484,354,702829829980
12 (3)589,7804,357,753111114125
12 (7)590,1004,357,968204204240
12 (10)590,2634,358,080304301340
12 (12)590,8534,358,420425416478
12 (13)590,9544,358,466455477525
12 (17)591,1834,358,598554559620
12 (18)591,3524,358,517620615695
12 (20)591,7174,358,500718716800
12 (22)592,0904,358,504791764980
13 (3a)588,5724,360,1578288119
13 (3)588,7604,360,207105103125
13 (5)588,9934,360,370143151200
13 (7)589,1524,360,359179182240
13 (10)589,2934,360,576262270340
13 (11)589,5814,360,361313315410
13 (12)589,8784,360,252368373478
13 (13)590,2514,360,329430430525
14 (3a)587,7634,362,5348384119
14 (3)587,8594,362,55410099125
14 (7)588,1664,362,794165175240
14 (10)588,3354,363,026265260340
14 (12)589,2464,363,683365359478
14 (17)589,5384,363,728489485620
14 (18)589,8214,363,867535531695
14 (19)590,1654,364,055570560740
14 (20)590,3814,364,175630620800
14 (22)591,1494,364,526770760980
15 (3)586,3544,366,7278891125
15 (5)586,4254,366,856127133200
15 (7)586,5104,367,020166161240
15 (10)586,7964,367,527237240340
15 (11)586,9474,367,589284278410
15 (12)587,1774,367,781327330478
15 (13)587,5314,368,309385382525
15 (17)587,7354,368,448455448620
15 (20)587,9454,368,854565572800
15 (21)588,0704,368,963605610855
16 (3)584,7964,368,7699288125
16 (7)584,8844,368,840151153240
16 (10)585,1294,369,074238229340
16 (12)585,2764,369,194306315478
16 (13)585,5974,369,189375367525
16 (19)586,8444,370,578500493740
17 (3)582,0334,372,2068083125
17 (7)582,2244,372,186148144240
17 (11)582,4684,372,026255249410
17 (12)582,5914,371,740298296478
17 (13)583,3934,371,879340346525
17 (18)583,7274,371,973452441695
17 (22)584,3114,372,050623633980
18 (3)575,7294,378,5476770125
18 (7)575,8204,378,637119120240
18 (10)576,0104,378,722185182340
18 (12)576,2234,378,824249249478
18 (13)576,3174,378,805298293525
18 (19)576,6284,378,786392390740
Publisher’s Note: MDPI stays neutral with regard to jurisdictional claims in published maps and institutional affiliations.

