1. Introduction
Over the past years, the capability of the Interferometric Synthetic Aperture Radar (InSAR) technique for measuring surface displacements has been well-demonstrated [
1,
2,
3,
4]. After many years of application, mainly for the study of earthquakes and other strong motion phenomena (landslides, volcanic eruptions, etc.), a revolutionary technique at the time, exploiting multiple achieved SAR acquisitions was proposed by [
5], leading to millimeter-level accuracies and detailed displacement histories. This brought InSAR closer to GNSS measurements in terms of the extraction of displacement time series, whereas the limitations of measuring one-dimensional motion along the Line-of-Sight (LoS) of the satellite were compensated by the low-cost wide area coverage without additional requirements for ground installations.
As a geodetic imaging technique, InSAR has gone through several successful performance and validation activities, including the European Space Agency’s (ESA) Terrafirma project, a first-of-its-kind for Pan-European ground motion activity [
6]. Over the course of its evolution, numerous algorithms have been proposed to improve the extraction of InSAR-based displacement measurements via the multi-temporal analysis of large data stacks of SAR imagery while compensating for several error sources and improving geolocation accuracy [
7,
8]. Currently, InSAR measurements are being routinely used to assess geohazards, including the detection of earthquake-induced ground displacements [
9,
10], the mapping and monitoring of landslides [
11,
12], instabilities at active mining sites [
13,
14], land subsidence [
15,
16], volcano-monitoring purposes [
17,
18], archaeology [
19,
20], and infrastructures safety [
21,
22,
23]. Given its maturity, the need to further improve the acceptance and usage of EO-based InSAR techniques in operational disaster risk management schemes has been underlined [
24].
In May 2012, the European Space Agency (ESA) and the Group on Earth Observations (GEO) Secretariat convened the International Forum on Satellite EO for Geohazards, known also as the Santorini Conference [
25]. The event underlined the ever-increasing volume of satellite data and revealed the need for cloud-based processing solutions utilizing state-of-the-art technologies for data storage and processing to properly address the future requirements of the EO community.
The Copernicus Sentinel-1 (S-1) is indeed a very characteristic case of a large-volume data mission. Based upon a pre-defined and conflict-free acquisition plan, S-1 performs systematic data acquisition and routinely provides C-band SAR data on a global basis. The scientific community and EO practitioners were thus given the means to extend the use of spaceborne SAR data to various land applications. In the meanwhile, commercial ventures have been increasingly involved in providing SAR imagery for very high spatial and temporal resolution, addressing the operational needs of several domains.
With the multitude of SAR missions currently available, especially the Copernicus Sentinels, it is now possible to obtain InSAR results of nationwide [
26,
27] and continental coverage [
28]. The release of the European Ground Motion Service (EGMS) is a key demonstration of InSAR capabilities, providing consistent and reliable information regarding natural and anthropogenic ground motion across European national borders [
29]. The EGMS also serves as a starting point for further investigation on geohazards. However, although a country-wide solution represents a baseline for ground motion applications, the need to address specific user requirements with tailored processing and products, as well as dedicated monitoring schemes (i.e., regular or event-driven updates), is still necessary when aiming at an operational context.
Dedicated platform-based solutions currently offer access to EO data and algorithms for massive InSAR processing [
30], whereas others also provide thematic exploitation and e-collaboration capabilities [
31]. On such platforms, complex processing tools and algorithms, which are demanding in terms of the background knowledge required to generate results, are transformed into services designed to address the needs of the broader EO practitioners and decision-makers in a friendlier manner.
In the current work, we present the on-demand SNAPPING (Surface motioN mAPPING) service integrated into the Geohazards Exploitation Platform (GEP) for the interferometric processing of Sentinel-1 mission data. SNAPPING rests on the continuous adoption of open-source tools for Persistent Scatterers Interferometry (PSI) analysis as a hosted service on platform resources [
32]. The service, by utilizing platform capabilities, is meant to allow users to easily exploit EO data resources by combining fast data access, processing facilities, and flexibility for the user’s own data analysis. Our objective is to contribute to the optimal use of Copernicus data by simplifying the extraction of InSAR-based displacement measurements to allow for the focusing of efforts on the post-analysis and interpretation of EO observations for improving the understanding of geohazard phenomena.
Herein, we present the processing scheme adopted for SNAPPING, the designed implementation as a service on the GEP, and we discuss in detail the processing parameters and other valuable hits for a seamless user experience. Finally, the SNAPPING results are subjected to inter-verification to underline the robustness of the provided measurements, and several showcases from diverse environments are demonstrated.
2. The Geohazards Exploitation Platform
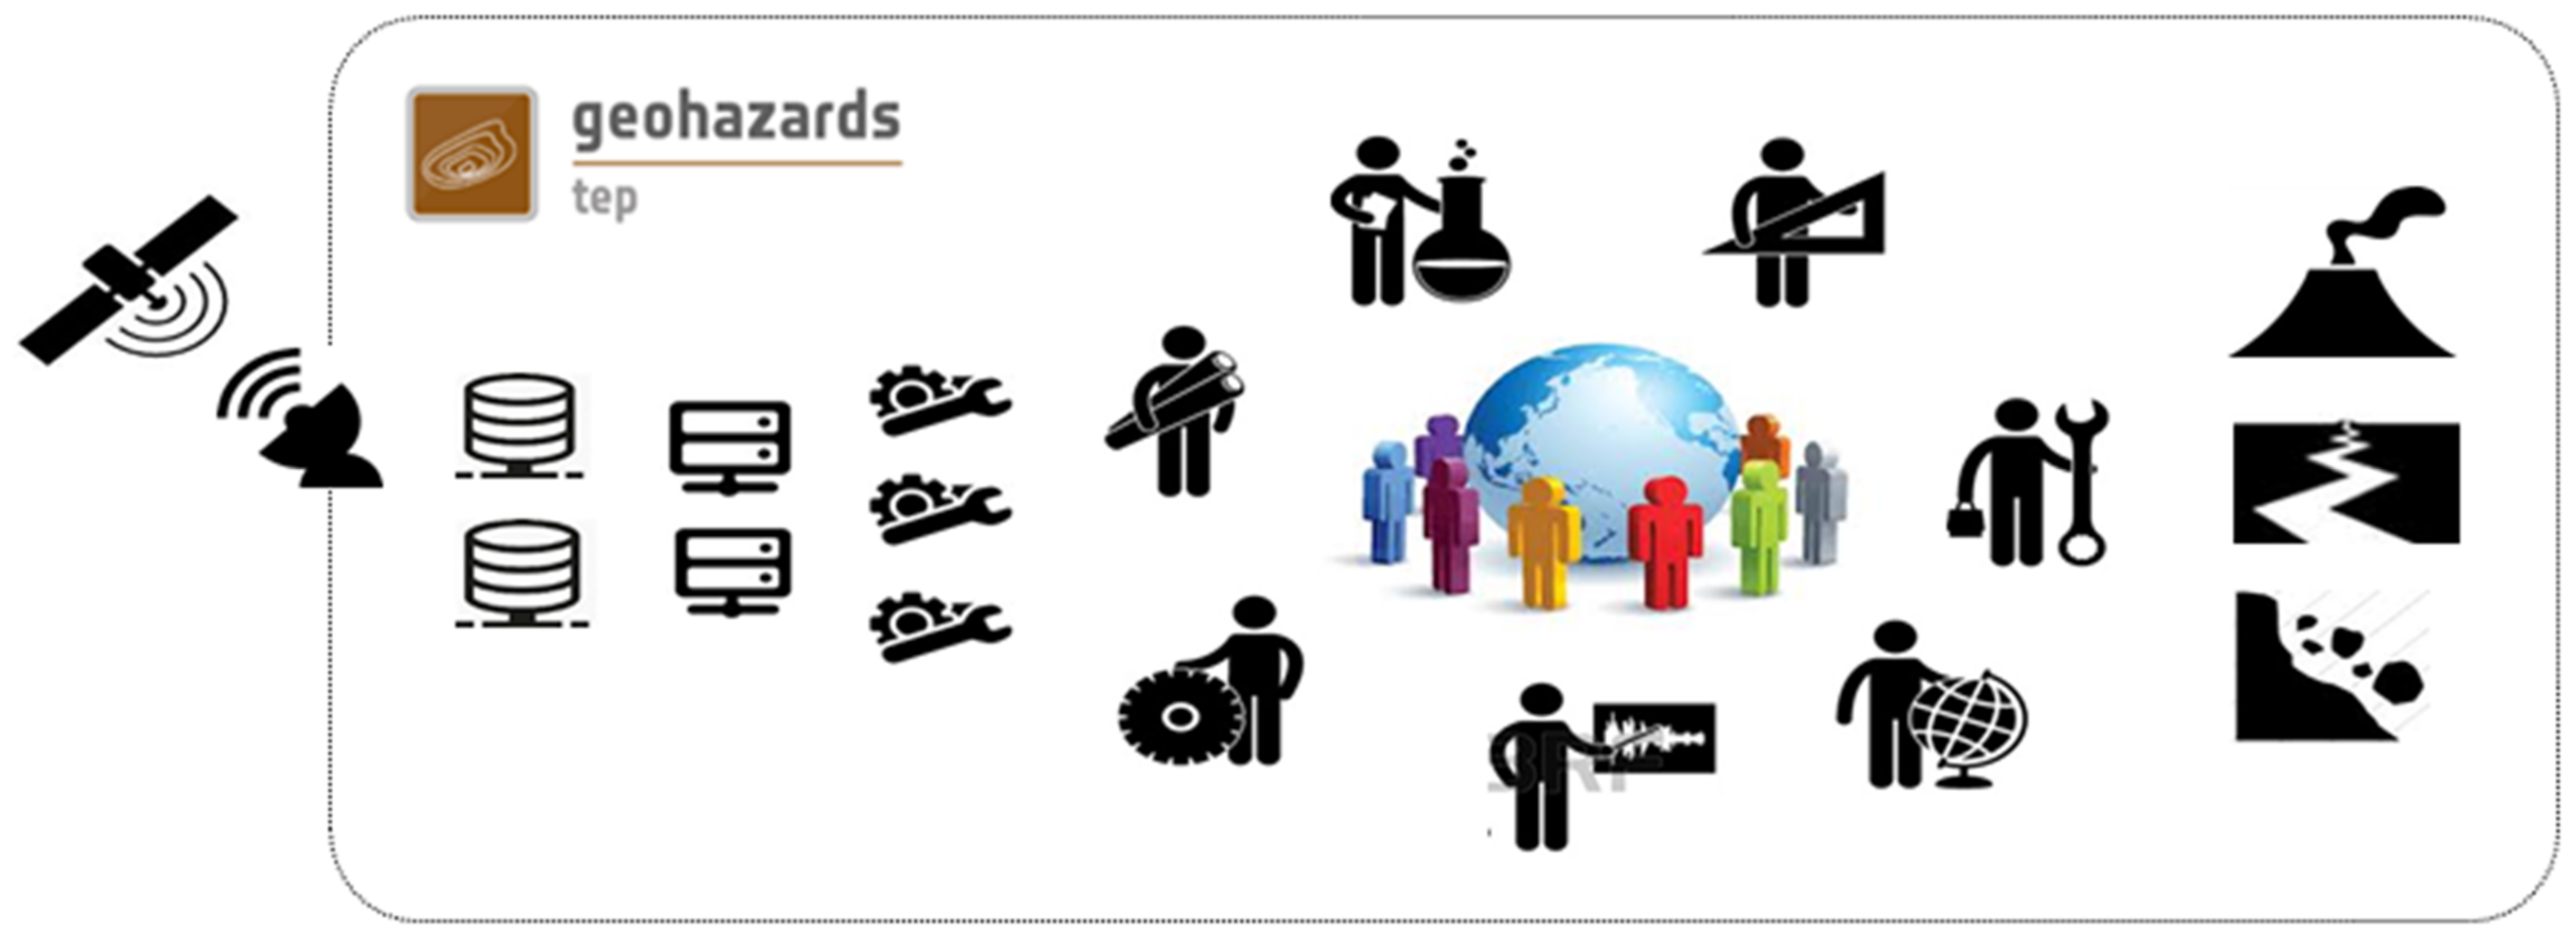
The GEP is a cloud-based environment providing access to satellite imagery from the Copernicus Sentinels and ESA historical SAR missions (70+ terabytes of ERS and ENVISAT data), and other national and commercial EO missions, as well as 25+ processing services that allow for the mapping of hazard-prone land surfaces and the monitoring of terrain motion (
Figure 1) [
31].
The GEP was created in 2015 as part of the Thematic Exploitation Platforms (TEP) initiative that was set up by the European Space Agency (ESA) aiming to support the further exploitation of satellite EO for geohazards applications [
33]. The GEP is an enhancement of the precursor Supersites Exploitation Platform (SSEP), originally initiated in the context of the Geohazard Supersites and Natural Laboratories initiative (GSNL). The GEP has been expanded to address the broader objectives of the geohazards community.
During pre-operations (2015–2020), user engagement for the integration and validation of services, as well as the gathering of feedback and requirements for ongoing developments, was realized through the GEP Early Adopters Programme (EAP). Throughout this phase, the processing and platform’s operation costs were almost entirely reliant on ESA TEP funding. By the end of the EAP in 2020, numerous users from different organizations around the world had been on-boarded, with an average consumption of about 20,000 CPU processing hours per month, carrying out research projects, publishing results, and providing feedback for enhancing the user experience on the platform.
Currently, the GEP has initiated a new phase of sustainability to pave the way toward a deeper level of community engagement and activity growth, and it anticipates more diversified funding schemes and revenue models. The hosted EO services on the GEP are open to the general public, provided either on a pay-per-use basis or via subscription. These services encompass an on-demand and systematic generation and delivery of value-added products, as well as the ability for expert users to integrate customized EO services. The service production cost is based on tailored components, including the cost of the cloud processing resources, the user support from service owners (including license fees when relevant), the cost for the platform operations, and the cost of EO data (for licensed or commercial data). Thus, the GEP targets the acceleration of the achievement of scientific goals and the sharing of the results, supporting EO practitioners to engage with the digital information market quicker and in an easier way. Towards this direction, support is provided by the Network of Resources (NoR) initiative [
34]. NoR can be used for sponsoring the initiation of users’ activities on the GEP, offering a more sustainable model for the service subscription and delivery, along with supporting research, product development, and pre-commercial demonstrators [
35].
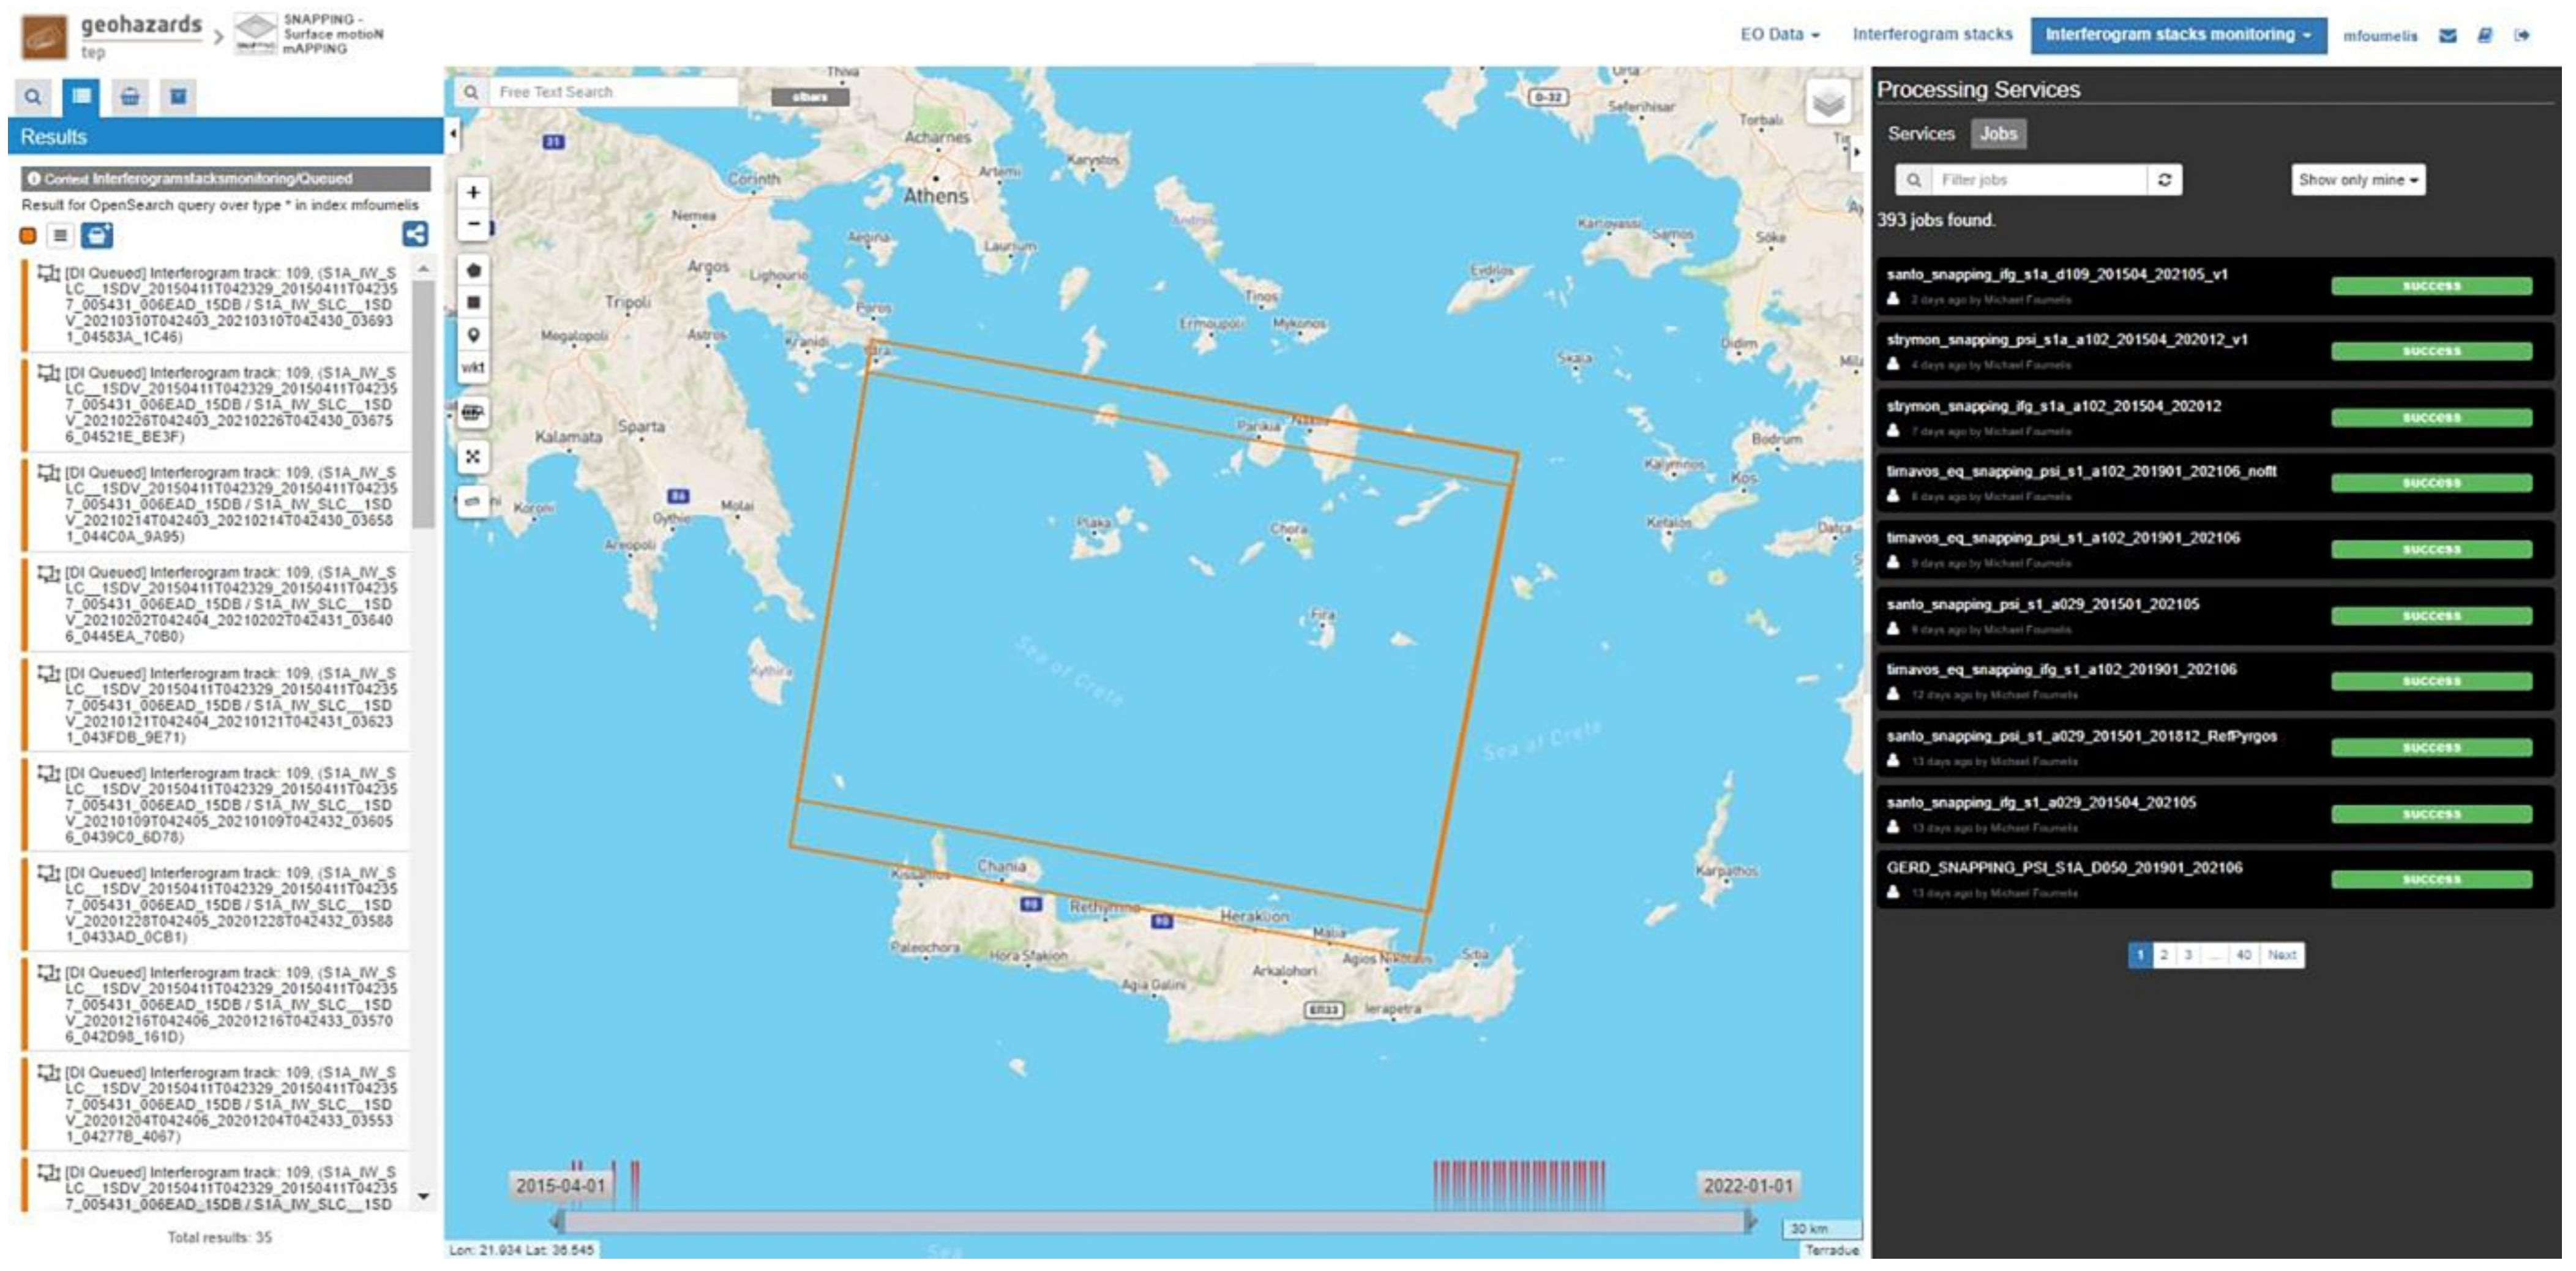
Indeed, the platform is continuously expanding to address the continuously evolving objectives of the geohazards community, by integrating a broad range of on-demand and systematic services hosted on cloud resources. To this context, it aims to support scientists and EO practitioners to better understand and assess geohazards and their impact by introducing innovative concepts for the exploitation, analysis, and sharing of EO products within an e-collaboration environment. The GEP geobrowser is the front-end interface to a sophisticated infrastructure where EO data and other auxiliary EO and non-EO resources are either fetched from multiple sources (several Copernicus DIAS and ICT providers) or locally stored, ensuring a seamless user experience when executing sophisticated algorithms (
Figure 2). It is worth noting that exploitation platforms offer, at some level, user access to the processing parameters for tailored measurement. This is contrary to other solutions where measurements are generated and disseminated as they are, via pre-defined chains and a set of fixed processing parameters. Among the existing advanced InSAR algorithms integrated into the GEP is the SNAPPING service presented therein.
3. The SNAPPING Processing Scheme
The first operational version (v1) of the SNAPPING service, based on the open-source ESA SNAP v6 [
36] and StaMPS v4.1b [
37,
38] software packages, was made available to GEP users in February 2021 [
39,
40]. Relying on those software packages for the core development of the services constitutes an important basis, since both are widely used by several researchers for providing successful results for various geohazards. This initial work mainly involved mainly the translation and parallelization of the
snap2stamps scripts, available since July 2018 on the GitHub and Zenodo repositories [
41,
42], into Python notebooks for their execution on the platform. Details of the preliminary SNAP-StaMPS integrated workflow can be found in [
32].
This first release included the automatic concatenation of S-1 acquisitions of the same date obtained consecutively along a common relative orbit (satellite track), while merging results, if necessary, from individual IW sub-swaths. Both the removal of topographic components and geolocation were based solely on the SRTM 3 arc-second heights [
43]. A common feature of all SNAPPING versions is the automatic ingestion of precise or restituted orbits, depending on their availabilities, and the selection of the reference scene, which is typically the oldest acquisition date in the user-defined S-1 stack.
A factor that occasionally introduced issues (i.e., job execution failures) in an earlier version was the hard-coded co-registration option, considering the entire S-1 IW swath for the geometric part, followed by the Enhanced Spectral Diversity (ESD) method [
44]. Although ESD correction is recommended to achieve the required coregistration accuracy, it is not therefore applicable over relatively small Areas-of-Interest (AOIs) (i.e., smaller than a single S-1 burst), since no burst overlap area exists. Another aspect affecting the coregistration outcome was the presence of significant large-scale motion within the scene (e.g., co-seismic motion), not necessarily located within the narrow extent of the AOI. In that case, mis-coregistration and the presence of phase shifts across IW burst margins might be introduced. This specific processing option was extensively amended in the following release of the service.
In fact, on June 2022, an upgraded version (v2) of SNAPPING was released, following a period during which some minor errors that had appeared from time to time were carefully evaluated, along with users’ suggestions to improve the service experience. It is important to note that major or blocking issues were immediately addressed during bug fixing. The SNAPPING v2 service consists of many new features and large architectural changes, the latter being mainly for improving the performance and the stability of the service, while further reducing processing times. To remain up-to-date with individual software packages utilized in SNAPPING, the entire chains were updated, referring to the SNAP v8 toolbox (released in October 2020).
To compensate for the before-mentioned limitations in the coregistration approach, different chains were introduced depending on the size of the selected AOI and the user-defined coregistration strategy. Thus, options were given to decide on whether the coregistration should be performed on the entire scene, irrespective of the defined processing extent, or should be based on the bursts covering the given AOI. Furthermore, when the AOI is located within a single S-1 burst and no wide area coregistration is selected, automatic processing is executed, as expected, without ESD correction. The adaptation of interferometric processing to small AOI by restricting coregistration to selected bursts, or even moving to complete single burst processing, substantially reduces the processing time. Nevertheless, the option to increase the coregistration area is still pertinent when extensive decorrelation occurs, or in the presence of large water bodies within the AOI.
An additional option is related to the availability of both the global SRTM 3 arc-seconds and the 1 arc-second heights. The utilization of a higher resolution Digital Elevation Model (DEM) such as the 30 m SRTM considerably improves the topographic phase removal and the geolocation of Persistent Scatterer (PS) targets. In addition, for the definition of the minimum accepted overlap between the input S-1 acquisitions and the user-defined AOI, a new parameter is introduced. This is recommended, since interferometric processing is performed on the common region of the entire S-1 data stack, and any partial coverage might result in a reduced extent of the final outputs. Such is the case when multi-temporal S-1 acquisitions are not perfectly aligned along-track and a missing part of the land occurs, especially along the edges of continental regions where a shifting between the IW and other acquisition modes takes place.
In response to users’ needs, a parameter was introduced to constrain either the generation of interferograms or time series analyses, based on user-defined seasonal spans, addressing, for instance, the snow presence over specific winter periods (more details are available in
Section 4.1). This also minimizes user efforts in selecting input imagery during job execution. In the same context, a challenge was made to minimize issues caused by the data themselves, namely the partial coverage of acquisitions (the edges of the IW mode) and/or archived multiple instances of S1 data (different SAR processors). Likewise, the systematic storage of several auxiliary input products, including global DEM datasets and orbit state vectors locally on the platform, reduces external dependencies and improves the resilience of the service.
The conceptual idea of SNAPPING is based on a twofold processing scheme; first, SNAPPING IFG for the generation and storage of an independent interferometric stack, followed by SNAPPING PSI for time series analysis, using as inputs the previously stored IFG stack. The above split procedure, although requiring the execution of subsequent processing jobs by the users, provides flexibility in storing the interferometric stack for future use, either by applying different PSI processing parameters or when regular updates of the solution are required (newly acquired S-1 scenes). This considerably reduces the consumption of resources and the processing time, especially when the actual monitoring of an area is intended. The conceptual model of SNAPPING processing is shown in
Figure 3.
In the same context, considerable efforts were made to enhance the services in terms of EO data manipulation (including storage and cataloging), as well as algorithm parallelization for distributed processing on cloud computing environments. This concerns both IFG and PSI services, the former for the execution of the interferometric analysis for each pair to different processing nodes, and the latter for segmenting the area into multiple patches, also to be run on separate nodes before their final merging and adjustment.
A major advent of the current SNAPPING v2 release is the availability of the PSI time series analysis service at both medium and full (sensor) resolutions: PSI Med and PSI Full, respectively.
While the initial service was offered only at medium resolution, merging the number of point targets located within a 100 m radius according to motion and noise levels criteria, the extension to full sensor resolution is rather reasonably advancement toward assisting with a wider range of applications. In the full version of the PSI service, no merging of PS is performed, maintaining all detected and accepted PS targets during processing. The availability of PSI at different resolutions allows for the initial inspection of wide areas using SNAPPING PSI Med, followed by a detailed investigation of specific regions of interest when applying the SNAPPING PSI Full service. That was found as an optimal configuration when the low-cost coverage of a wide area is necessary before focusing on a more thorough analysis of specific regions or infrastructures [
45].
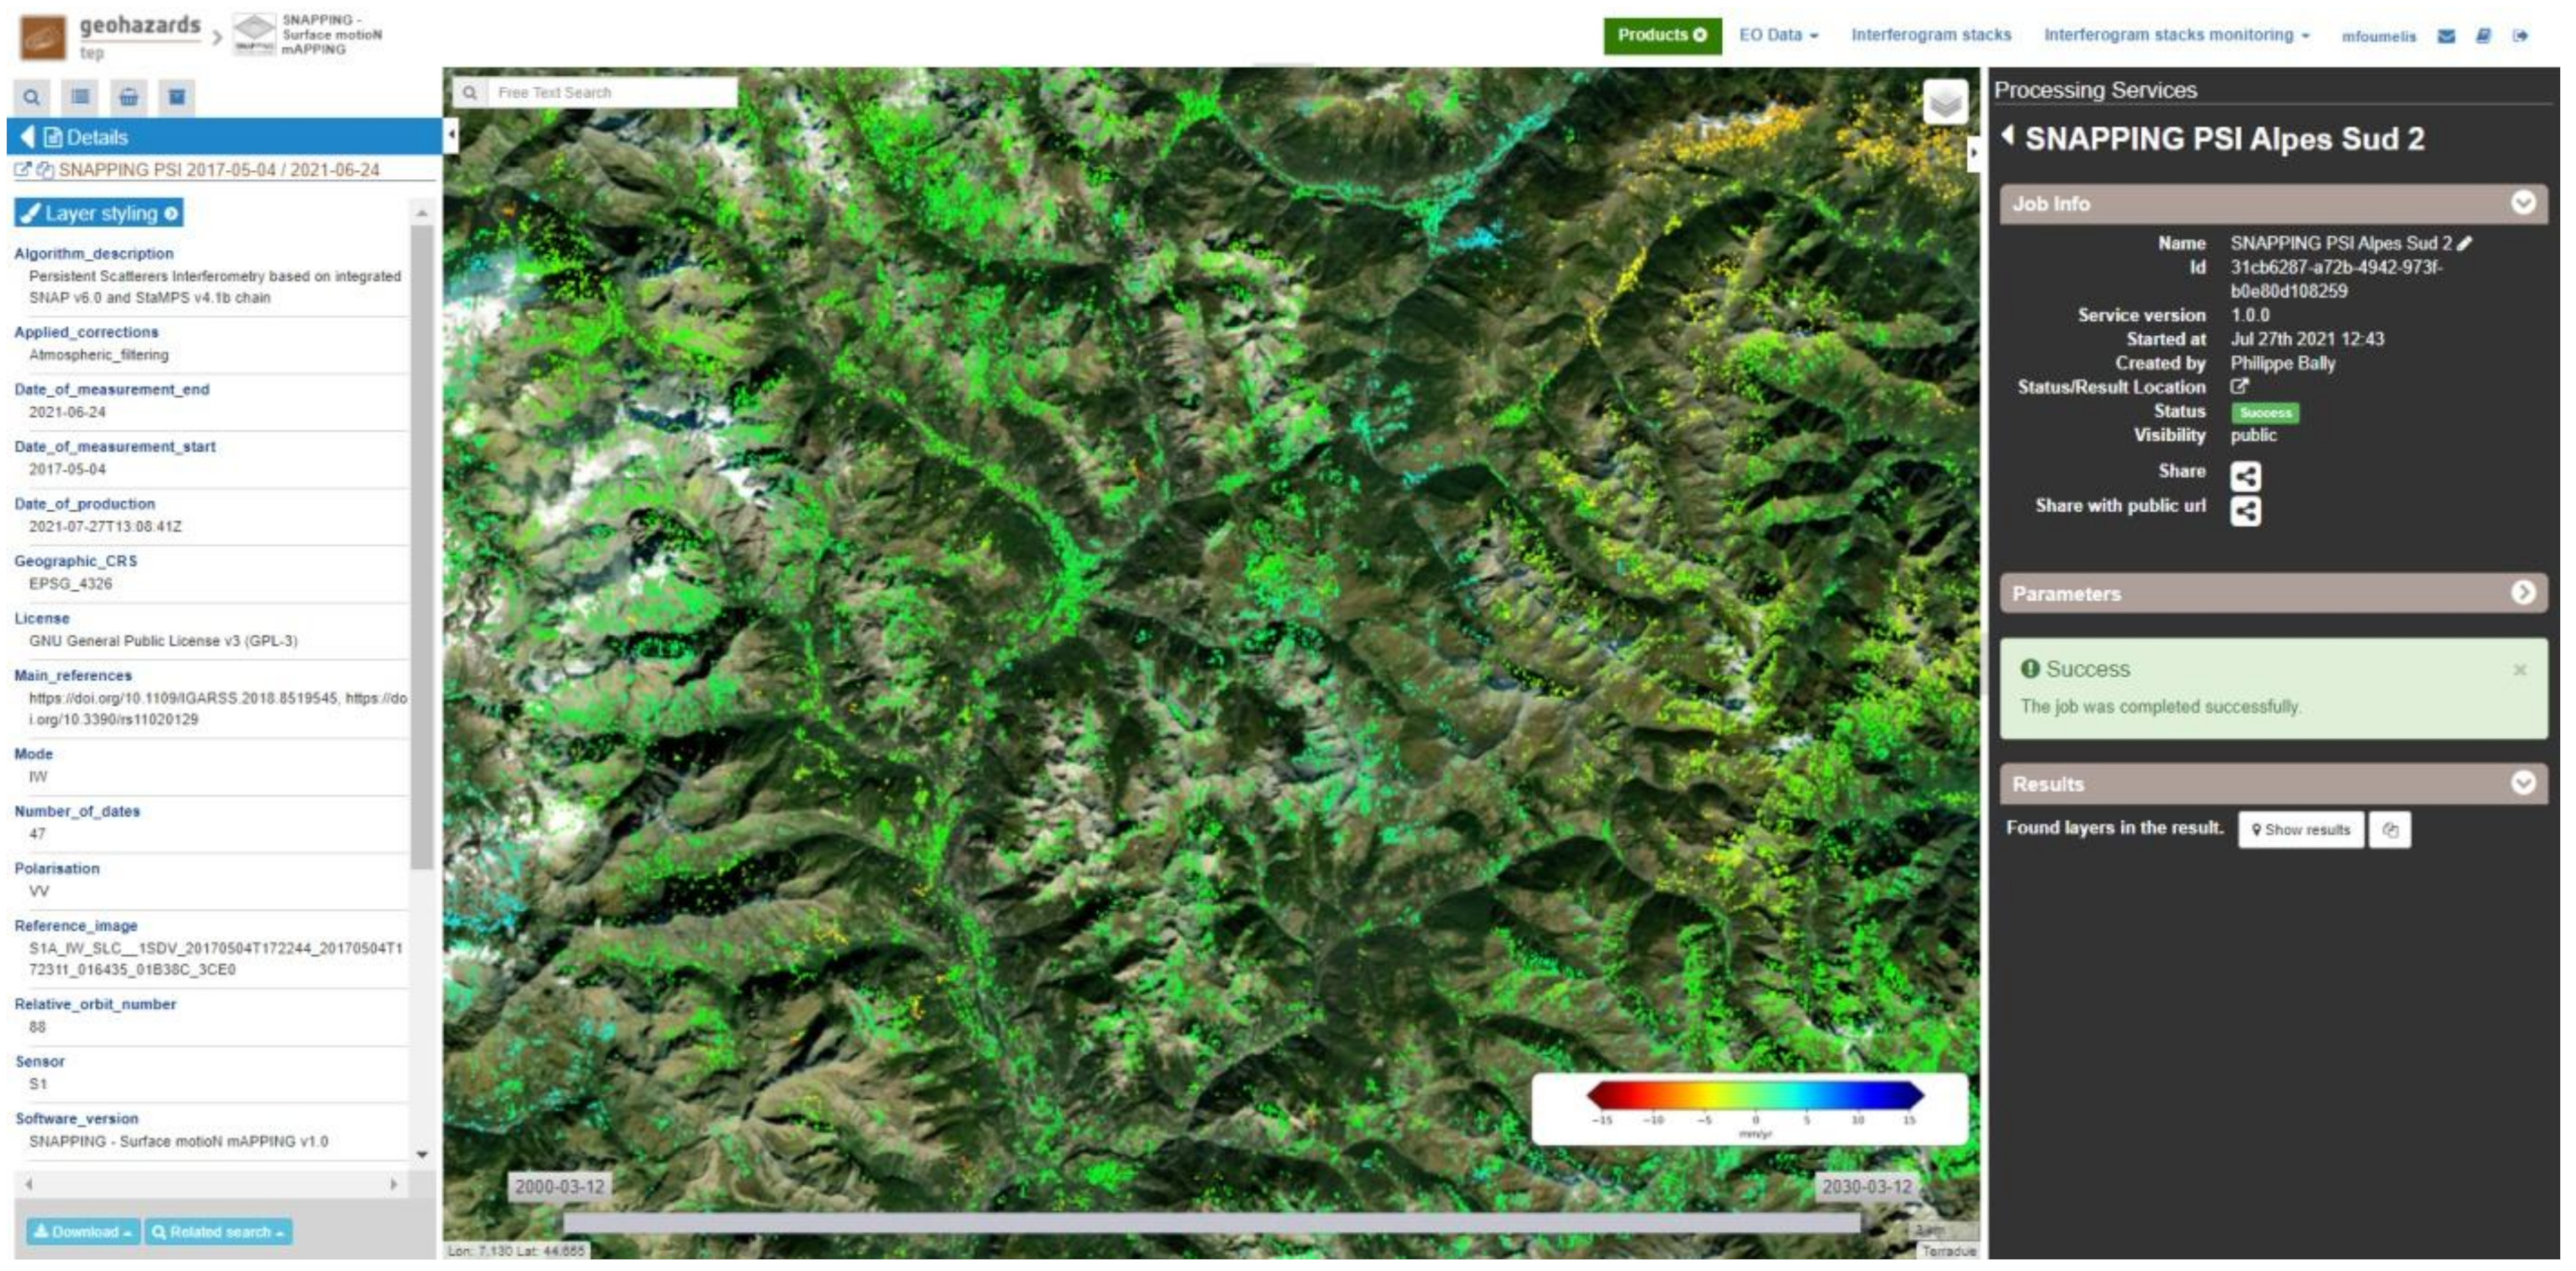
Once successfully produced, SNAPPING measurements are published on the GEP geobrowser, ready for downloading or sharing with other users (
Figure 4). It is important to note that optional sharing to specific users or the general public can be decided only by the user executing the job. If shared, the corresponding measurements become discoverable on the platform.
4. SNAPPING Online Service
In fact, the SNAPPING service workflow starts primarily with handling and ingesting the input data, consisting of a sequence of S-1 SLC images, the orbital information associated with each of the SAR acquisitions, and the DEM over the specific AOI. SNAPPING limits the interferometric processing to the VV polarization data, with it being the optimal choice for geohazard applications when using S-1. Even though there is no restriction on the number of dates to process in SNAPPING, scenes acquired before April 2015 are not actually considered, even if they are selected by the users. This is to avoid interferometric phase variations in the range resulting from different Elevation Antenna Pattern (EAP) compensations before and after this date. Thus, part of the service ensures the proper filtering of input EO data provided by the user in terms of acquisition mode, relative orbit, the presence of duplicates, spatial coverage, etc.
SNAPPING services generate average LoS motion rate maps and displacement time series at both reduced spatial (approx. 100 m) and full sensor resolutions. This makes the service suitable not only for various research application domains, but also when the rapid inspection of an area at medium resolution (SNAPPING PSI Med) is of interest. Within the operational frameworks supporting decision-making, this enables the identification of potentially affected regions at relatively lower costs, while leaving space for more detailed terrain motion analysis utilizing a solution at higher resolution (SNAPPING PSI Full).
For detailed step-by-step instructions on how to run the SNAPPING services, please refer to the SNAPPING Tutorial available online on the GEP [
46]. A dedicated section in the tutorial refers to the SNAPPING release notes for each version of the services.
4.1. SNAPPING Processing Parameters
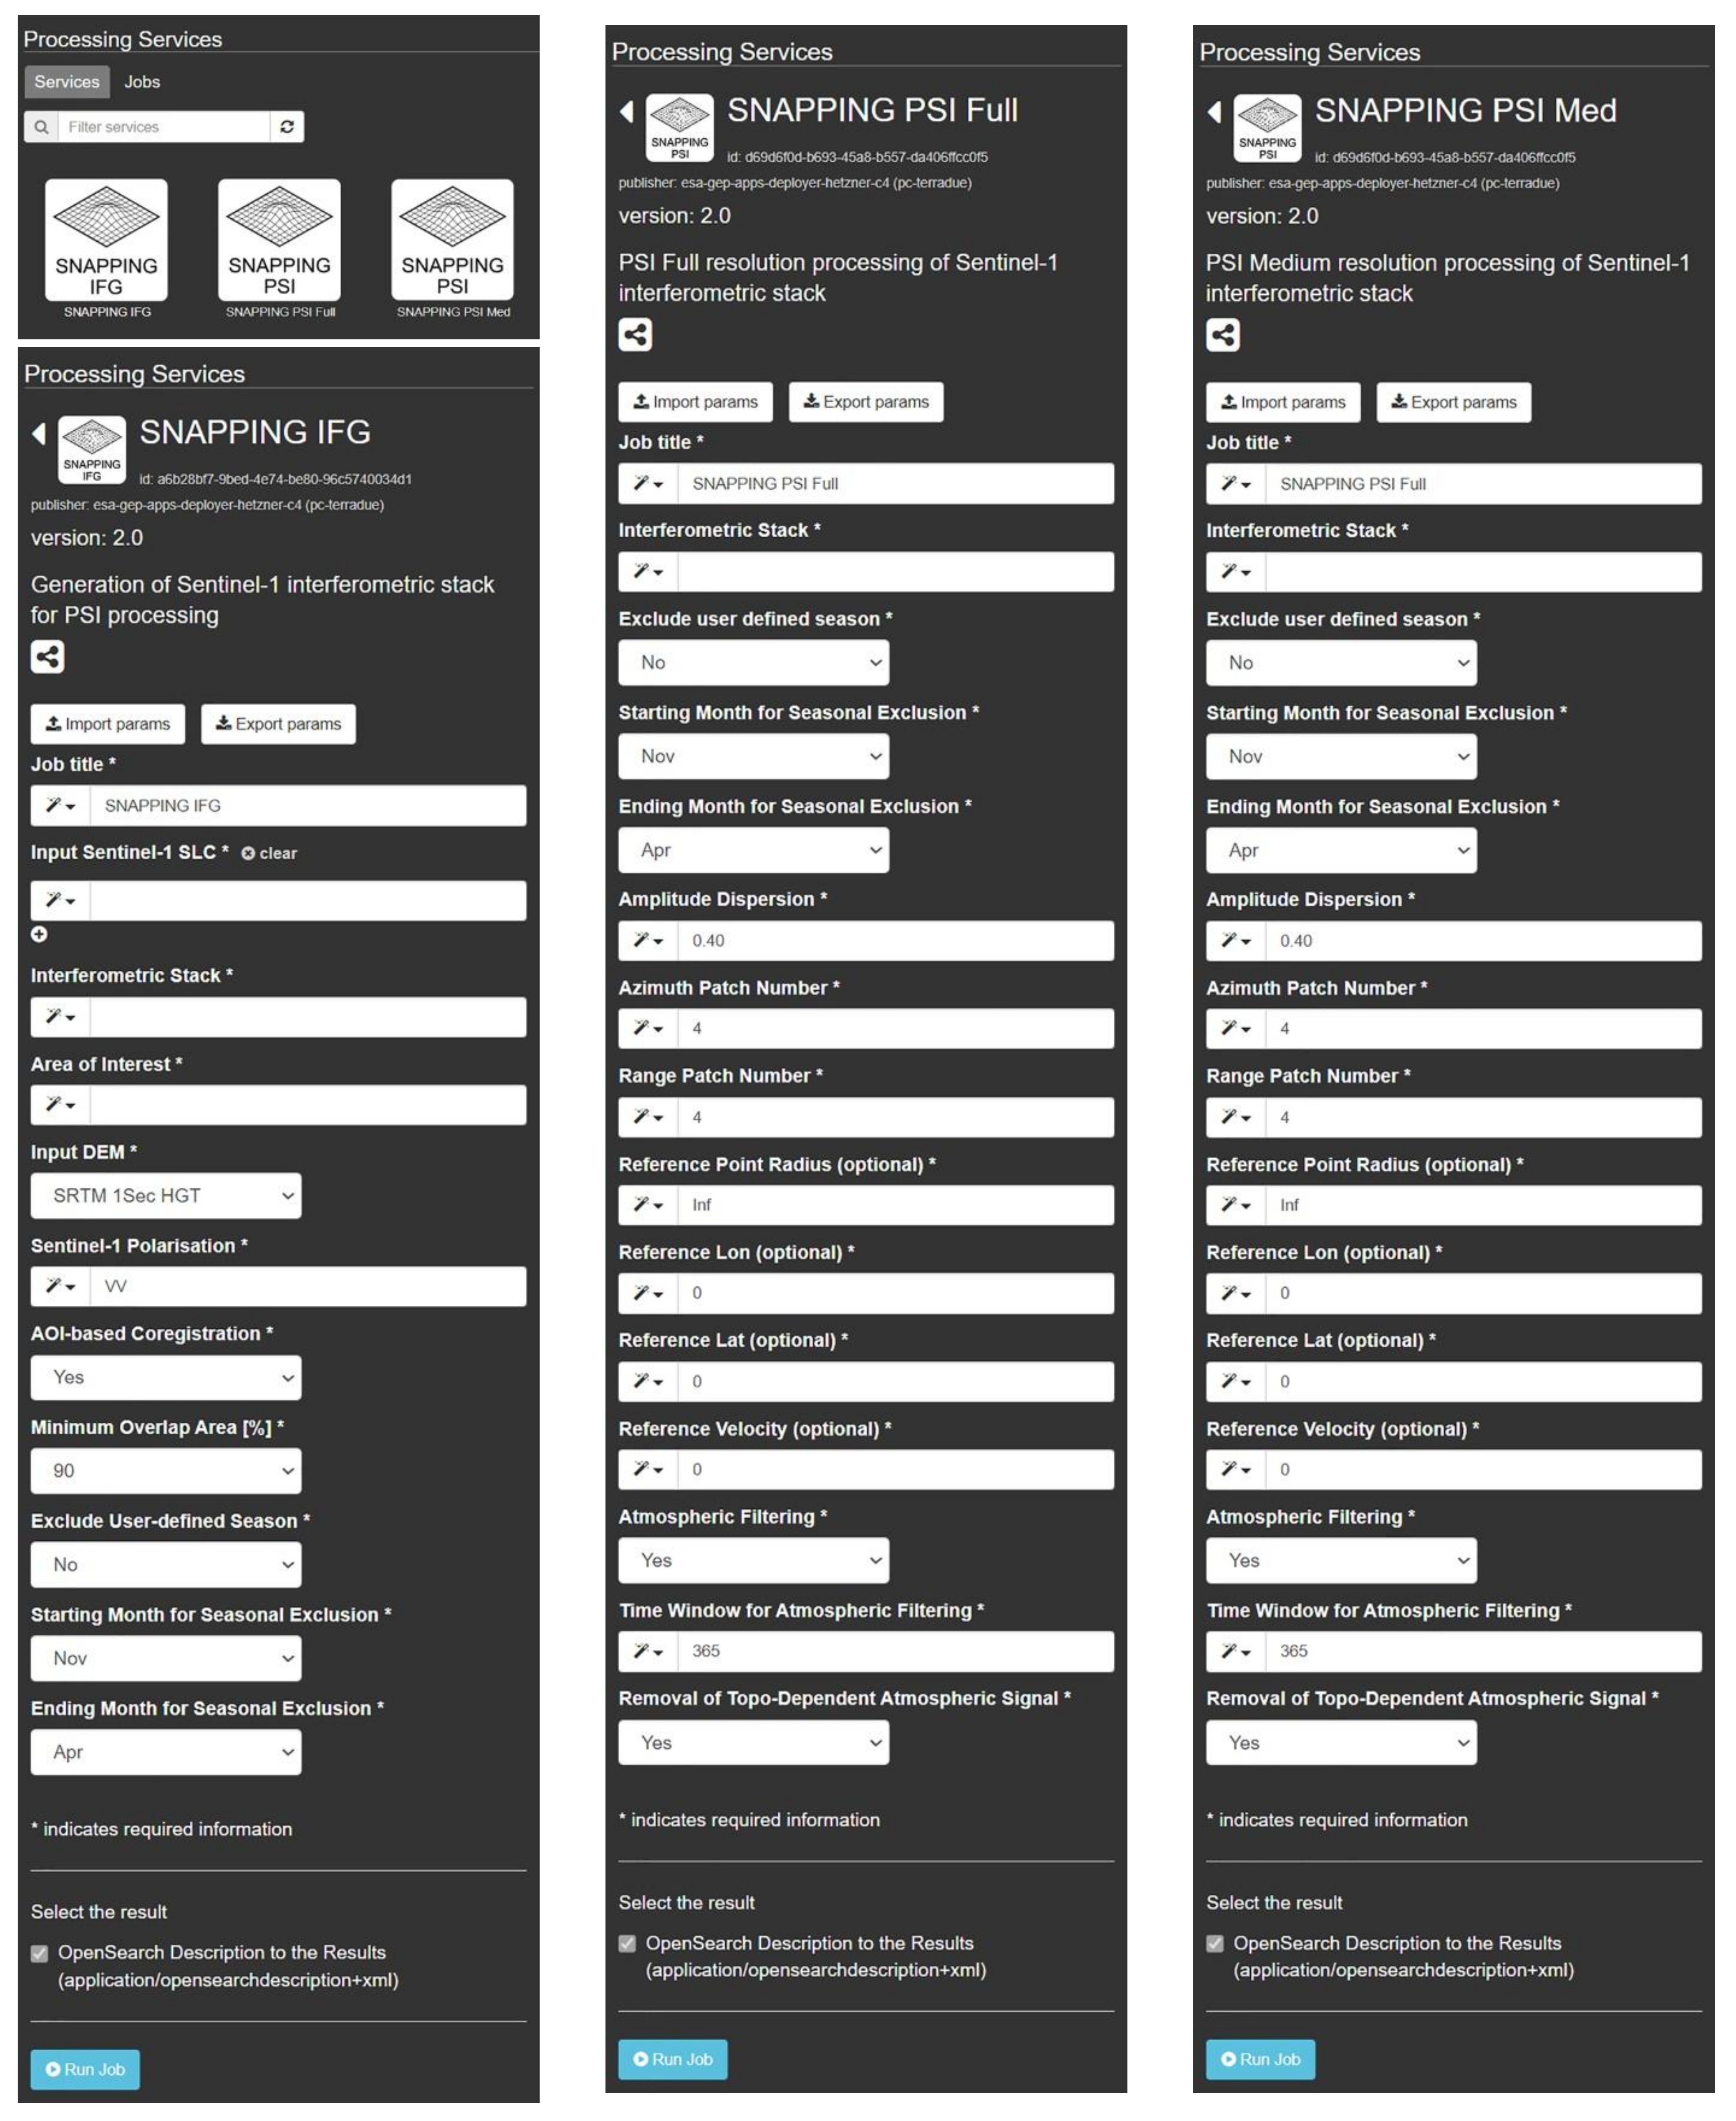
For the time being, the SNAPPING services are provided with a minimum set of user input parameters, in order to ensure the robustness of the results and to reduce processing failures. Although it is common that further tuning of the processing parameters is necessary for optimum results, this option is usually requested by advanced EO scientists. The design of SNAPPING services on the GEP is aimed to address a wide user community, reducing as much as possible the specialized knowledge required for the execution of jobs. Thus, GEP users are prompted to define only the necessary inputs, such as the satellite imagery for the processing, the bounding box coordinates of the AOI, and the name of the interferometric stack to be stored on the platform. The rest of the parameters can be kept to the proposed default values. These allow for some control of the interferometric processing steps, while addressing several corrections to be applied to the measurements. An overview of the processing parameters implemented in the SNAPPING services is shown in
Figure 5.
For GEP users who do not have special requirements on the production and delivery of the results; the AOI is constrained to a maximum of 60 × 60 sq. km; however, this could be expanded as appropriate, depending on users’ needs. In fact, a preliminary part of the code is dedicated to filtering out user input imagery based on their AOI coverage. Users may adjust the minimum AOI overlap parameter in the IFG service (the default being at 90%) to exclude the dates of partial coverage. Further constraints involve the seasonal exclusion of the input S-1 acquisitions by defining the starting and ending months, applicable to both the IFG and PSI services. This offers more flexibility during the preparation of the SNAPPING jobs and is applicable when a periodic effect on the measurements is expected, e.g., the presence of snow.
Once the input S-1 data are successfully ingested, the selection of the reference SAR acquisition for the coregistration of the entire SAR dataset (by default, this is the oldest scene), the handling of consecutive imagery acquired on the same date, as well as the marking of sub-swaths involved, and the actual S-1 bursts to be processed, are carried out before the actual execution of the IFG processing. At this point, as already mentioned, whether co-registration shall be performed on the entire scene, or based only on the burst intersecting the AOI, is defined using the AOI-based Coregistration parameter in the IFG service.
It is critical to underline the importance of maintaining a unique IFG stack name (Interferometric Stack parameter) for each submitted job, which should in turn be kept the same when executing the corresponding PSI service. When updating the existing interferometric stack, namely, re-running the IFG with newly acquired scenes while ensuring the presence of the reference acquisition (oldest date), practically, users can exploit the monitoring option of SNAPPING. The augmented interferometric stack is then inserted into the PSI service for providing updated measurements.
For the SNAPPING PSI service, there is no requirement for defining a priori the reference area for the interferometric analysis. Even though the relevant parameters are provided, including the Reference Point Radius, and lat and lon coordinates, the user might select to apply the default option (infinite radius and zero coordinates) in order to refer the PSI solution to the average motion of the entire area. Certainly, this is a convenient option when limited knowledge of the stability of the area is known. The optional Reference Velocity parameter also allows for inserting motion from other geodetic techniques to adjust the PSI measurements accordingly. It should be mentioned that the availability of PS targets over the user-defined reference area is checked, and the default option (no local reference) is applied when no sufficient points are found.
Once the PSI is launched, the amount of the initially detected PS candidates is controlled by the Amplitude Dispersion threshold (homonymous parameter), although the final number of PSs is defined after their quality assessment during PSI processing.
Finally, a couple of corrections regarding atmospheric effects are proposed for the improvement of the PSI measurements. Accordingly, the Atmospheric filtering parameter for the spatio-temporal smoothing of the displacement time series and the Removal of the Topo-Dependent Atmospheric Signal parameter (linear approach) can be activated depending on the preferred solution. The amount of temporal smoothing can also be controlled by setting properly the corresponding Time Window for Atmospheric Filtering parameter (the default being at 365 days). In the presence of abrupt motion (e.g., a moderate-size earthquake), it is recommended to deactivate this option, as the filtering of the time series might result in the erroneous representation of co-seismic motion. Likewise, topo-dependent atmospheric phase removal in flat areas or regions of relatively low relief has no actual effect. Care should be taken when applying those atmospheric corrections when the monitoring of seasonal motion is intended.
4.2. Progress Status of SNAPPING Jobs
Following the submission of SNAPPING jobs, the inspection of their progress status differs for IFG and PSI services. The status of IFG jobs refers to the triggering process, practically the preparation of the processing code, and not the launch of the actual IFG processing. After an IFG job is successful, interferometric pairs are put in queue and are step-by-step processed depending on the availability of the processing nodes. The completion of IFG pairs (interferogram generation) can be checked using the “Interferogram stacks monitoring” tab of the GEP geobrowser. Submitted interferometric pairs appear as Queued, On-going, Done or Failed, based on their status. Each pair initially appears as Queued, during processing as On-going and finally depending on the outcome as Done or Failed. Users should thus refrain from executing PSI (Med or Full) services before all interferometric pairs submitted under IFG are finally completed (no Queued or On-going pairs). Contrary to IFG, the inspection of the status of the submitted PSI jobs is straightforward through the progress bar of each job.
4.3. SNAPPING Outputs
The SNAPPING PSI results are provided as a text file in Comma Separated Values (CSV) format containing information about each point target, including a point identifier (code), latitude and longitude geographic coordinates (lat and lon; in decimal degrees), average LoS displacement rate (vel; in mm/yr), the standard deviation of displacement rate estimates (vs; in mm/yr), temporal coherence estimates (coh), DEM height (height; in meters), the incident angle of the LoS unit vector (inc_angle; in radians) and their corresponding LoS displacement time series for each acquisition date (formatted as DYYYYMMDD with YYYY: year, MM: month and DD: day; in mm).
Further to the CSV file containing the entire measurements, the PS displacement rates, and corresponding uncertainties are provided in standard vector format (i.e., ESRI shapefiles) for insertion and further analysis into common GIS environments. A corresponding metadata file lists several details on the sensor characteristics, the number of SAR acquisitions used, the version of the service, etc.
A simplified version of the SNAPPING CSV output, not containing the displacement time series, is also delivered in standard Geographic Information System (GIS) vector format. These vector data are considerably reduced in size, allowing for their easier manipulation and ingestion in common GIS packages. Furthermore, in an effort to utilize free GIS codes, attributes for the naming of SNAPPING PSI outputs are available for compatibility with the
PS Time Series Viewer toolbox available on the QGIS Python Plugins Repository [
47]. This ensures the effective and easy visualization of PSI displacement histories in the open-source QGIS environment.
For the visualization of the results on the GEP geobrowser, a reduced resolution raster file (in GeoTIFF format) and a corresponding color scale (in PNG format) are being generated, which are also downloadable by the users. An additional standalone visualization file (HTML format) for the inspection of measurements outside the platform is also provided (see
Section 4.4). Information on the various SNAPPING PSI outputs is listed in
Table 1.
It is important to note that intermediate outputs, i.e., differential interferograms generated by SNAPPING IFG, cannot be directly visualized on the GEP geobrowser. However, interferometric pairs can be accessed and downloaded separately for potential post-processing outside of the platform.
4.4. The SNAPPING Visualizer
Despite the fact that access to processing resources and the execution of sophisticated algorithms has been automated, the availability of tools for the rapid visualization of InSAR processing results is still crucial for many EO practitioners that are interested to exploit these data.
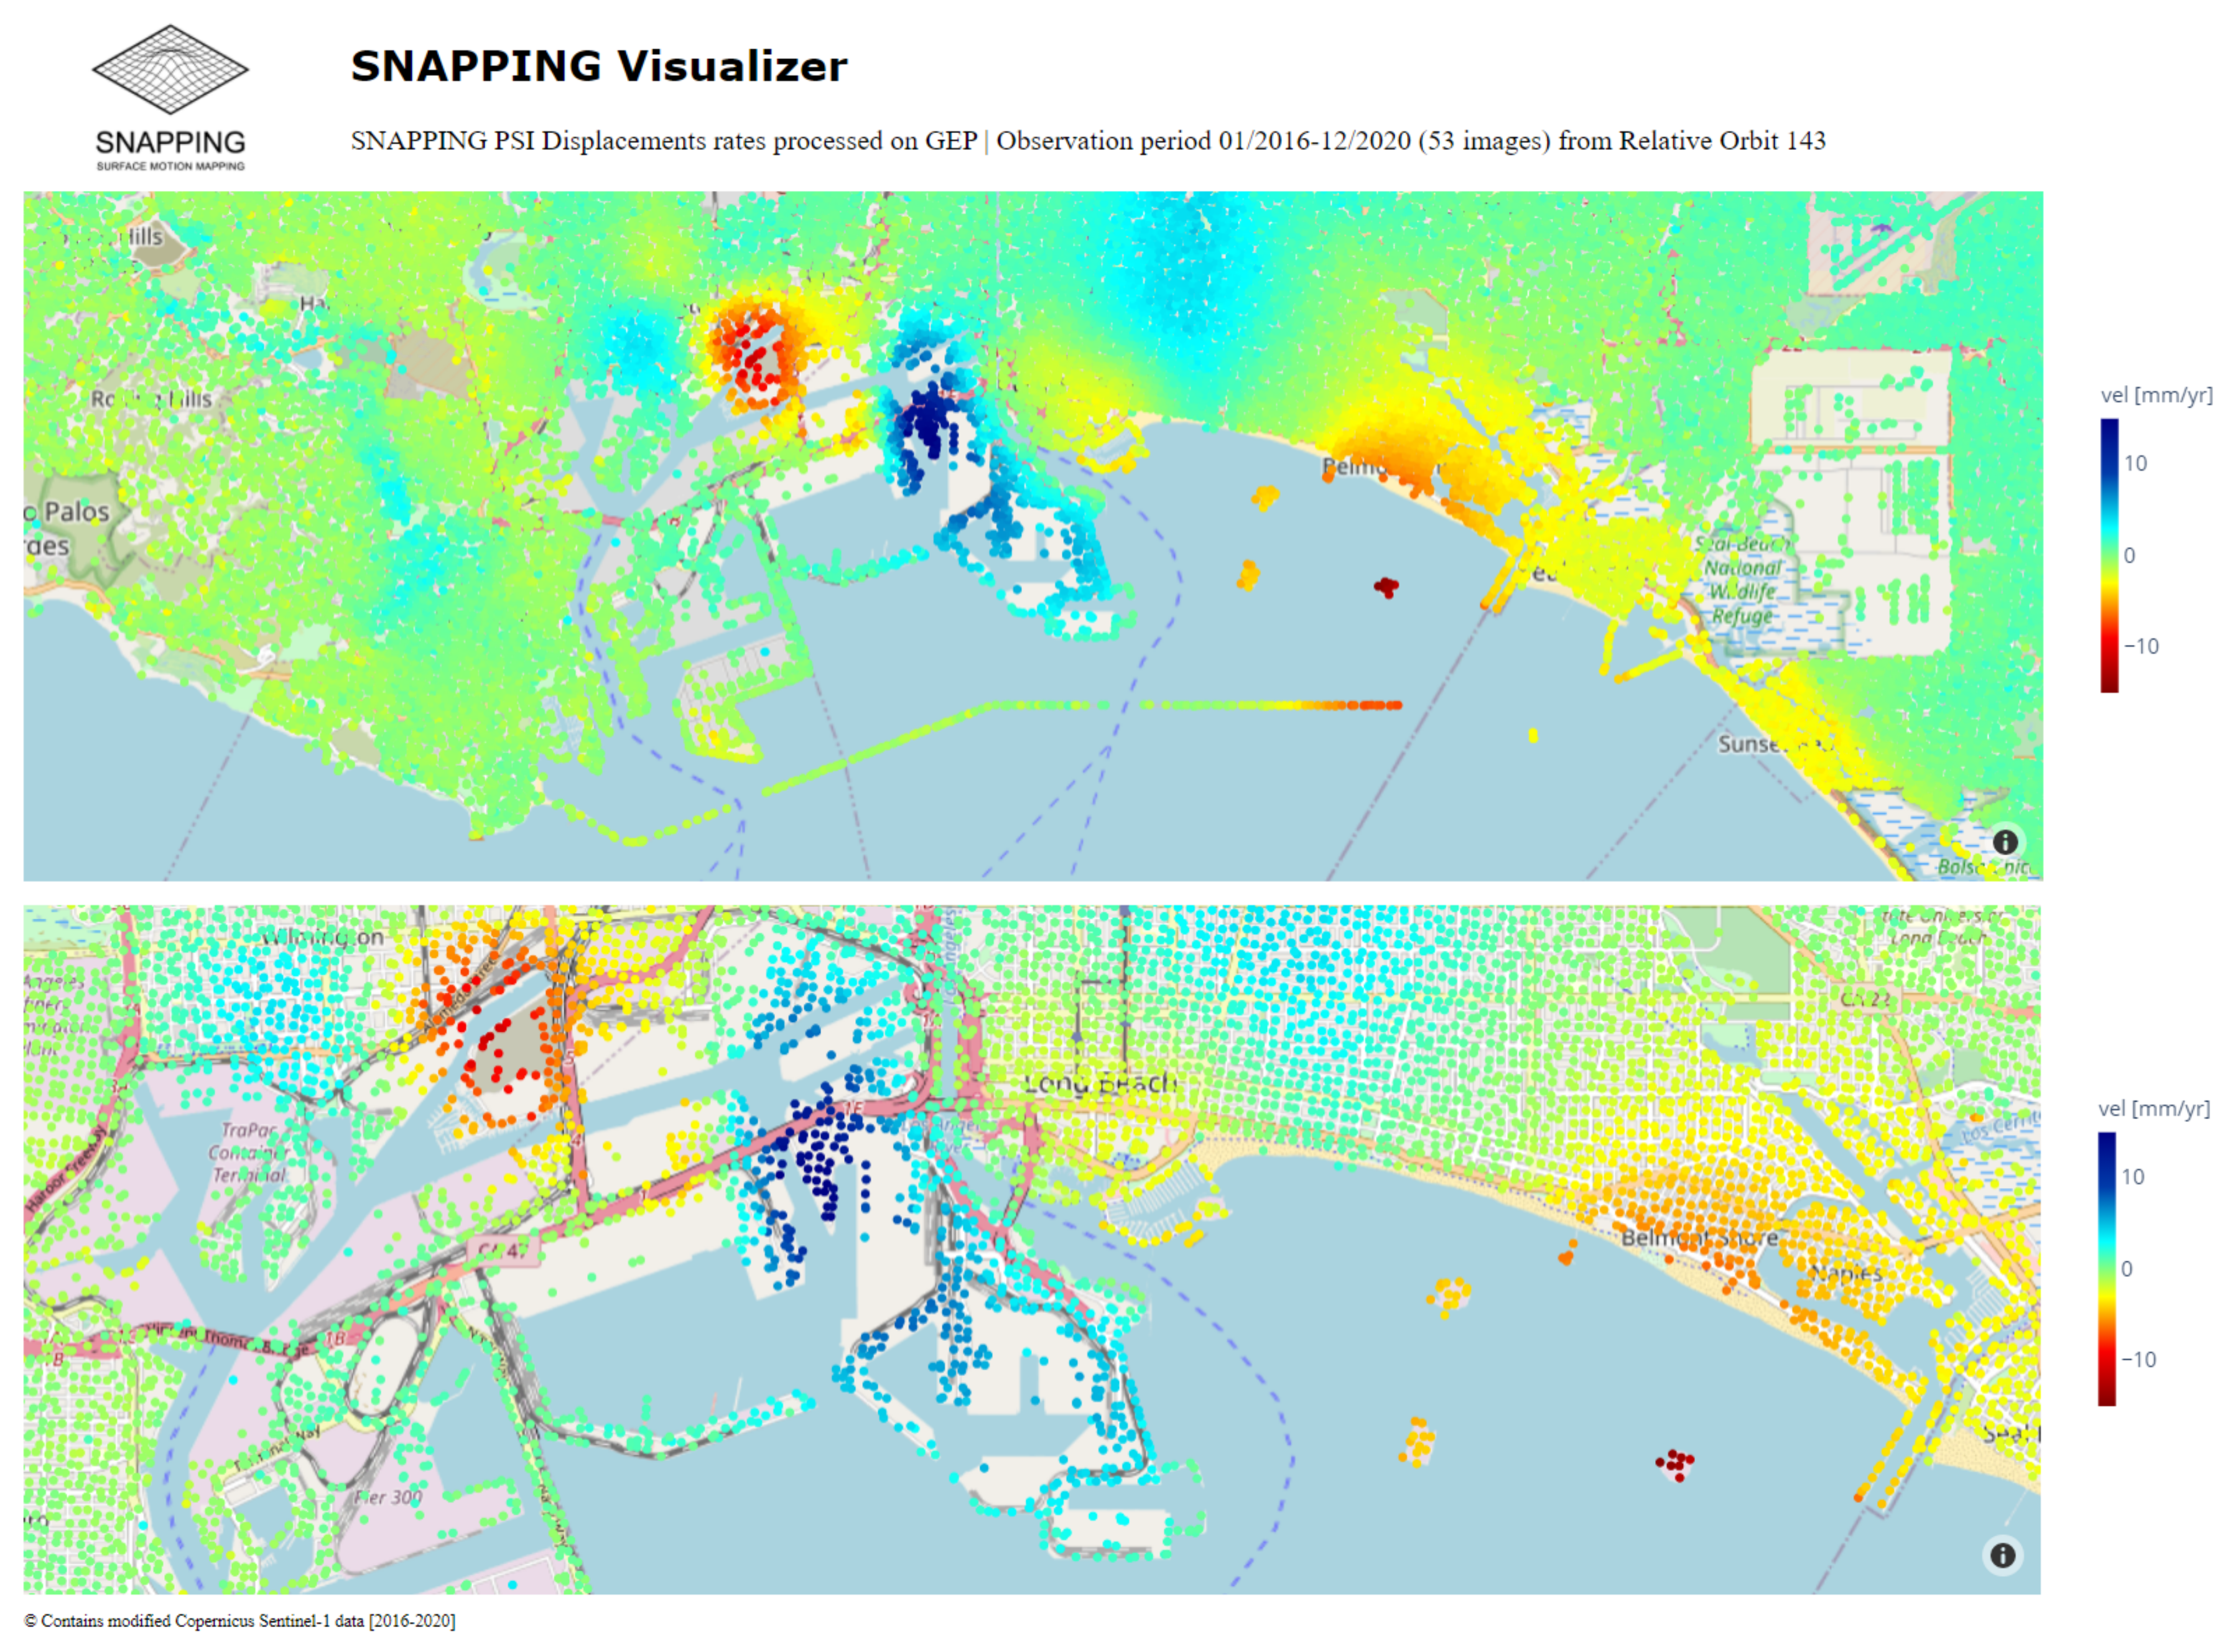
Following users’ recommendations, the SNAPPING Visualizer output is delivered under SNAPPING v2. It is a standalone HTML file accessible to end-users, even offline, without the need for ingestion into any geospatial database. Current developments support the visualization of average velocities and corresponding uncertainties in a straightforward way. An example of the SNAPPING Visualizer for the city of Los Angeles (United States of America) is shown in
Figure 6. As a default option, the background is represented by the OpenStreetMap
® free wiki world map [
48]. An option is provided for the navigation capability of the tool to color the label associated with the cursor according to the motion rate (velocity) of the selected point scatterer. The availability of the tool was announced earlier on the GEP blog [
49].
5. Distributed Computing, Storage, and Performance
The SNAPPING service is designed to exploit distributed computing infrastructures supporting both the multi-core and multi-node execution of processing jobs. The implementation of the GEP guarantees scalable performance supporting massive EO data processing.
For SNAPPING IFG, the initial triggering process covers the preparation of the code for each interferometric pair defined by the input S-1 data and the automatic execution of the chains on the available processing nodes. Depending on the number of available nodes, interferometric pairs are either directly processed or remain in the queue until resources are freed. A comparable procedure is realized for SNAPPING PSI, where in that case, the AOI is split into a number of patches (user-defined parameter), which in turn are pushed for processing into available nodes.
Typically, each user is allocated a comparable number of processing nodes, used jointly for running IFG and PSI services. Upon user request to the operator, and depending on the application at hand (e.g., early response to a disaster), the allocation of additional resources (processing nodes) is applicable to facilitate the timely completion of submitted jobs and the delivery of the measurements.
Concerning storage, a separation should be made among the final PSI outputs and intermediate products, i.e., the interferometric stack generated by the IFG service containing the differential interferograms. While the PSI outputs are stored permanently on the platform, the IFG interferometric stacks are kept on a dedicated cloud repository for interacting with the SNAPPING services when launched. The latter is maintained over a limited time period, which can last up to 6 months, unless requested differently by the user. The extendable period of IFG storage is applicable mainly for monitoring purposes, when systematic updates of the IFG stack with newly acquired data are required. Given the fact that intermediate interferometric stacks are dynamic (called and augmented), PSI processing is burdened with the transfer of those data to the processing nodes when PSI jobs are submitted for those stacks. Although this process causes some delays during PSI execution, it is still considered to be beneficial, providing more flexibility to the users. The advent of cloud-based object storage technologies, already integrated into the GEP, addresses such issues and significantly reduces the delays due to data transfer. Basic performance analysis for reporting on the expected processing times when using the SNAPPING service on the GEP has been performed and is reported herein (
Table S1 in Supplementary Materials).
6. Verification of Measurements
The validation of InSAR measurements has been the subject of various studies [
50,
51,
52,
53,
54,
55,
56,
57] and relevant initiatives [
6,
58,
59,
60]. Nevertheless, for the exploitation of InSAR measurements, their validation using in situ (e.g., leveling or ground-based radars) or satellite-based (e.g., GNSS) geodetic measurements are still requested. This is most evident when it comes to sensitive applications, e.g., infrastructure health monitoring.
Statistical estimates of uncertainty, either qualitative based on temporal coherence levels, or quantitative as the standard deviation of the calculated motion rates, are typically delivered by the different multi-temporal InSAR algorithms. However, those estimates are strongly affected by the number of observations and the temporal motion pattern (linear or non-linear).
On the basis of validation using GNSS data, accuracy levels of approx. 1–2 mm/year for the motion rate and 3–5 mm for the displacement time series have been demonstrated elsewhere [
54]. However, these values should be considered with care, given the availability of multitude of algorithms and approaches to compensate for the various error sources in multi-temporal InSAR measurements.
Herein, the goal of the verification work is to show the consistency of individual measurements based on different algorithms hosted on the GEP. For this purpose, the Parallel Small BAseline Subset (P-SBAS) service developed by CNR-IREA [
54,
61], already operational on the GEP since 2019, was selected. An intercomparison with the P-SBAS measurements, distributed over a regular 90 m grid, was performed, solely running SNAPPING PSI Med to assure consistent point densities. Nevertheless, when deemed necessary for demonstration purposes, the SNAPPING PSI at full resolution was run to showcase the effect of density in the interpretation and analysis of results over urban areas and other human infrastructures. Both SNAPPING and P-SBAS services were run using the default parameters proposed by each service, without any efforts to optimize the outputs densities; i.e., by adjusting the temporal coherence for P-SBAS (default 0.80) and/or the amplitude dispersion for SNAPPING PSI (default 0.40).
During the comparison, apart from the point densities, deviations in the motion rates and the matching of displacement time series were qualitatively and quantitatively examined. The investigations were made only between neighboring points (a distance of less than 100 m), in accordance with the spatial resolution of the services.
It is essential to keep in mind the algorithmic differences between the SNAPPING and the P-SBAS services to properly interpret the findings. The principal difference lies in the nature of the point-like measurements, with persistent scatterers being merged only where densities are high and when specific criteria are met for SNAPPING, contrary to P-SBAS representing persistent and distributed scatterers averaged together spatially. Moreover, SNAPPING measurements are referenced to the average motion within the AOI (default option), while P-SBAS uses a set of relatively stable points distributed throughout the AOI, a fact that may introduce inherited bias without any proper adjustment between the results.
In the following subsections, the inter-comparisons performed over various environments and ranges of motion are presented. Even though several examples are provided herein, other published studies underline the consistency between those advanced InSAR GEP services [
62].
6.1. Cap-Haïtien (Haiti)
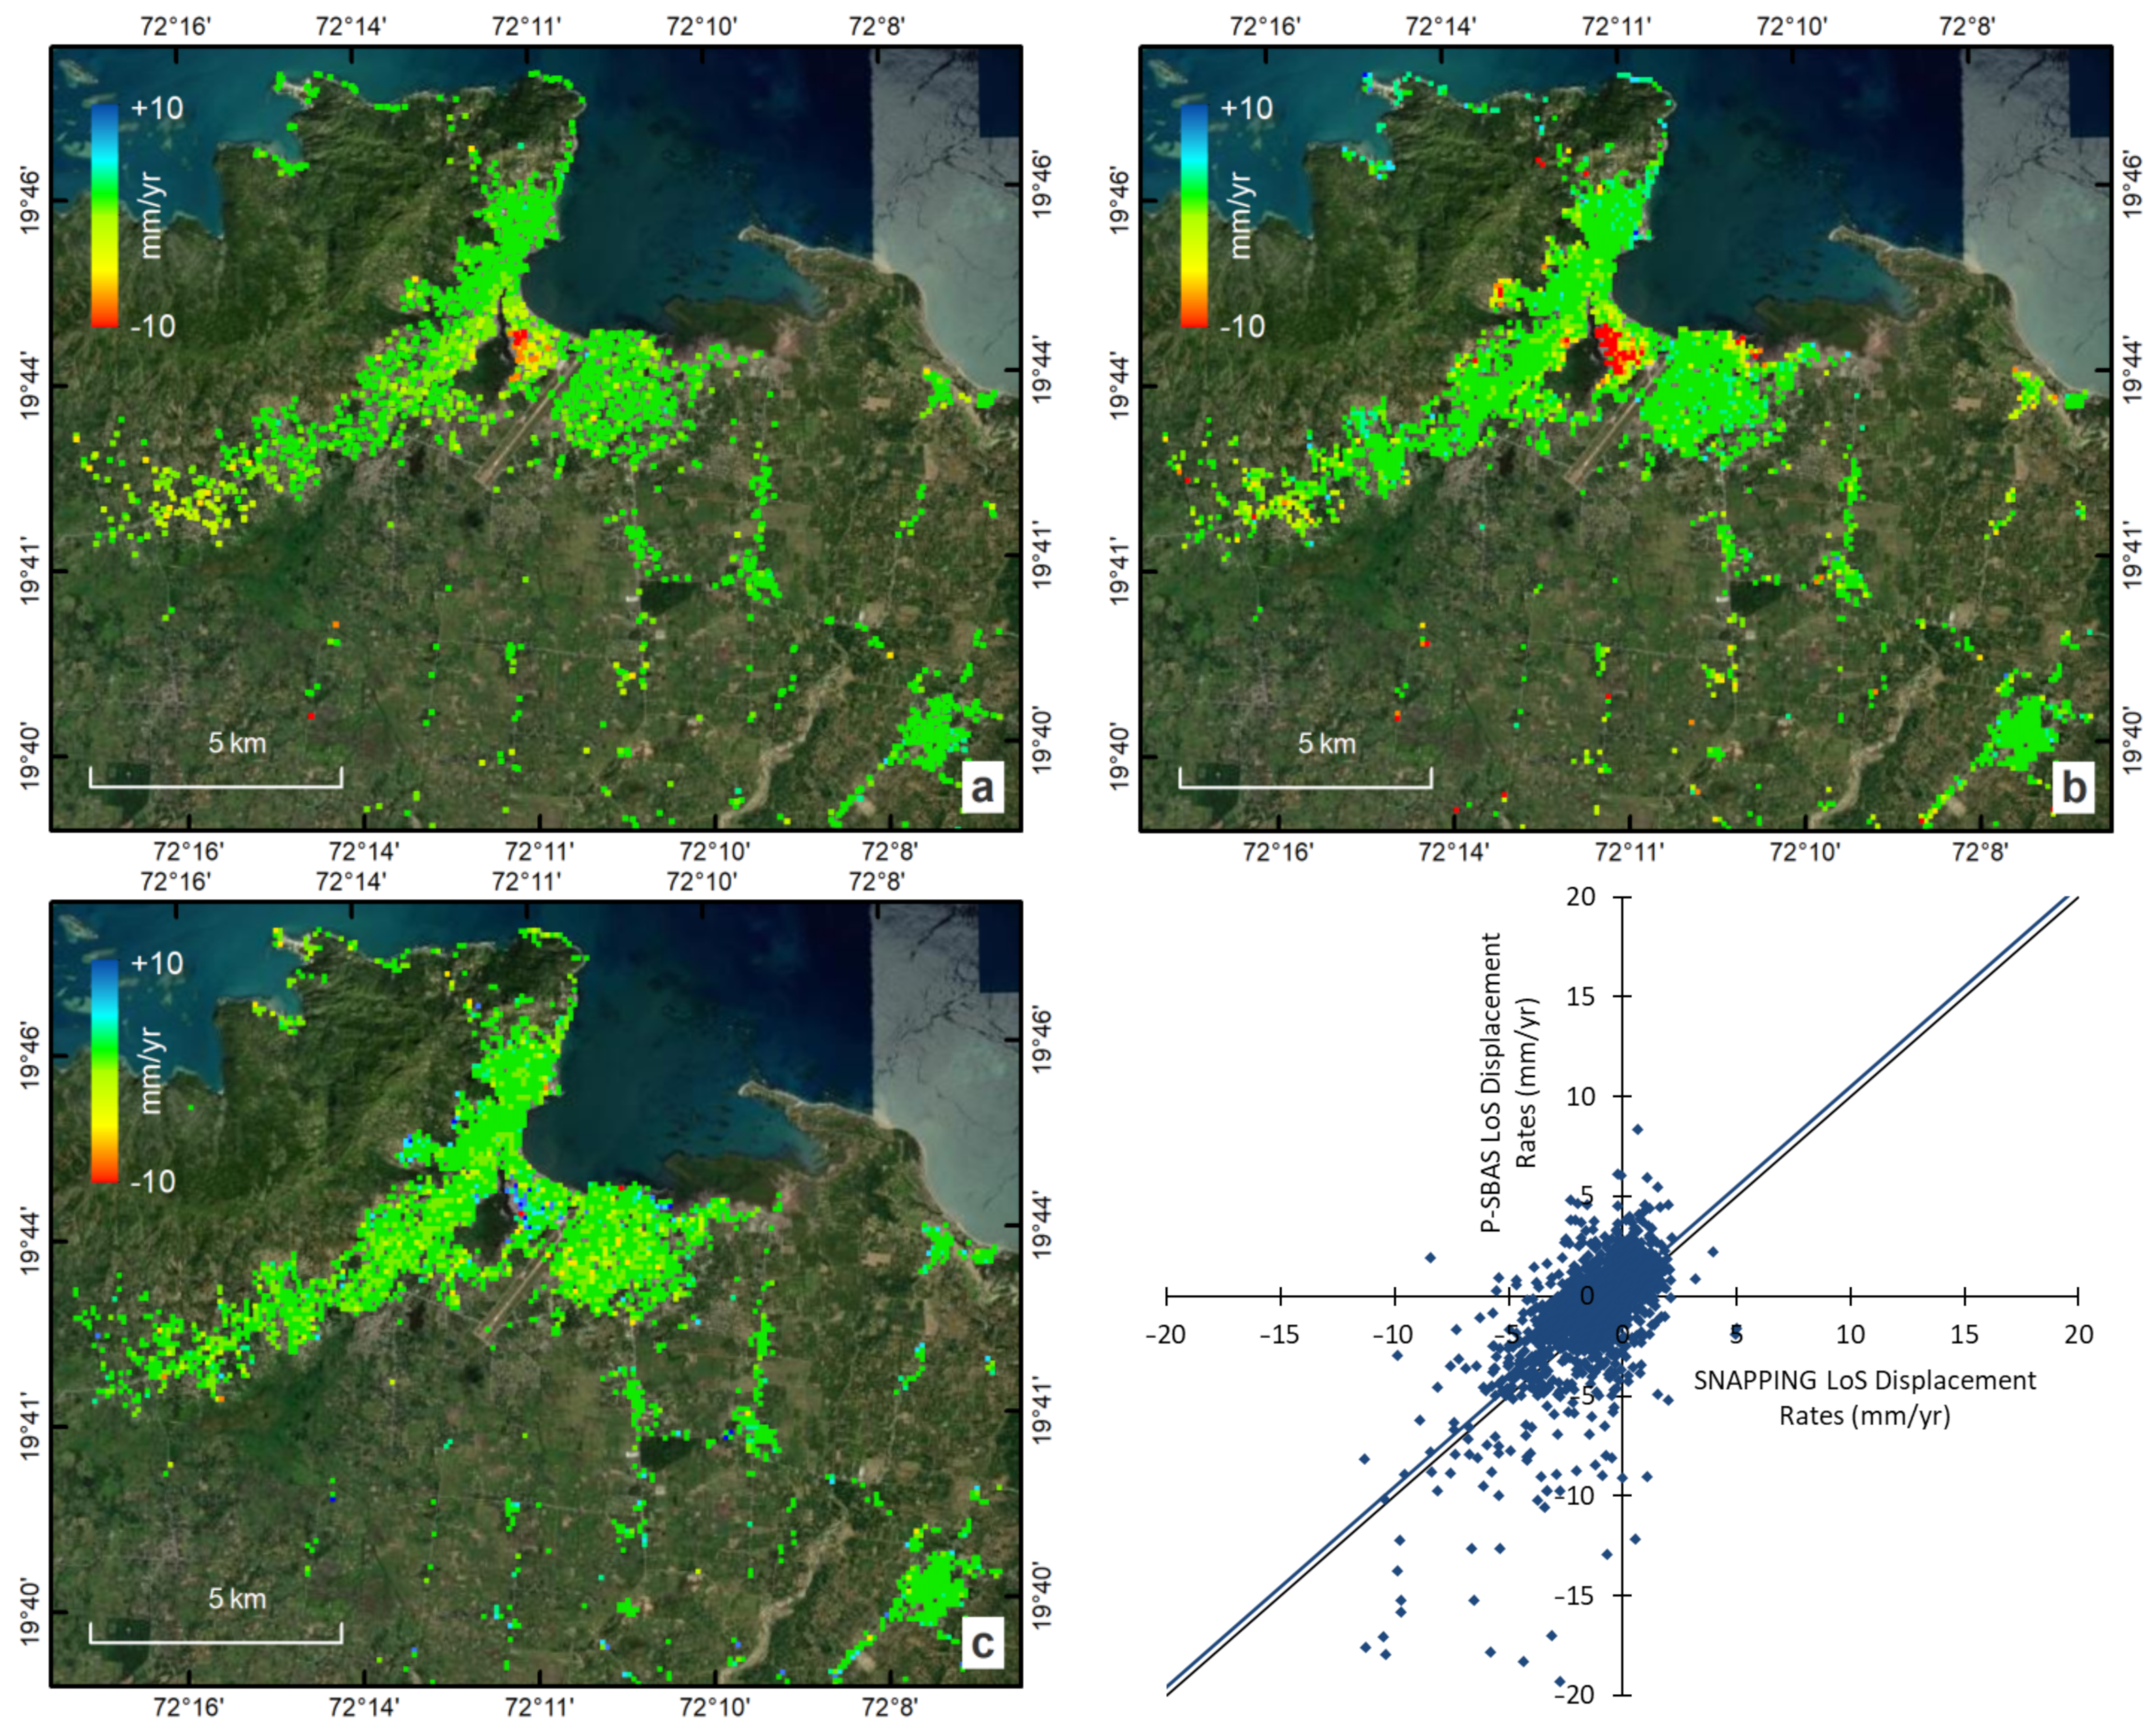
The interferometric processing of Cap-Haïtien, an area of approx. 295 sq. km, was based on 86 S-1 acquisition dates (ascending track 106) spreading over the period between 01/2017 and 12/2019. The P-SBAS processing of Cap-Haïtien was performed in the frame of the ESA EO4SD DRR project [
45] in support of the City Resilience Program (CRP) of the World Bank [
63]. The execution of the SNAPPING PSI Med service was based on exactly the same input dataset to allow for consistency during intercomparison.
Based on the vicinity of the SNAPPING PSI Med and P-SBAS results, within a radius of 100 m, no evident difference in the number of points between the individual solutions was found (
Figure 7 and
Figure S1). Measurements from the SNAPPING PSI Med reached 2700 points, whereas for P-SBAS, a total number of 3200 points was obtained, and a comparable density, given the dominance of agricultural lands in the area. Actually, both techniques provided consistent spatial coverage, with only 640 and 275 additional point measurements by SNAPPING and P-SBAS, respectively.
Regarding the motion rates, although fully compatible between the two services (average differences at 0.5 mm/yr), for a very limited number of points, mainly in the area of high rates, the P-SBAS results seem to provide higher velocities compared to SNAPPING. This, however, can be justified based on the different nature of the points between the PSI and SBAS techniques (
Figure S1).
Finally, the scatterplot of the deviations of calculated rates for common points among the two approaches (
Figure 7), shows that the majority of the points are constrained within the ±2 mm/yr limit, while few span the ±5 mm/yr range, indicative of the overall compatibility of the independent results.
6.2. Thessaloniki (Greece)
The city of Thessaloniki drew the attention of several research groups, due to the high displacement gradients identified within the urban fabric and the potential for damage to buildings and other human infrastructures [
64,
65,
66].
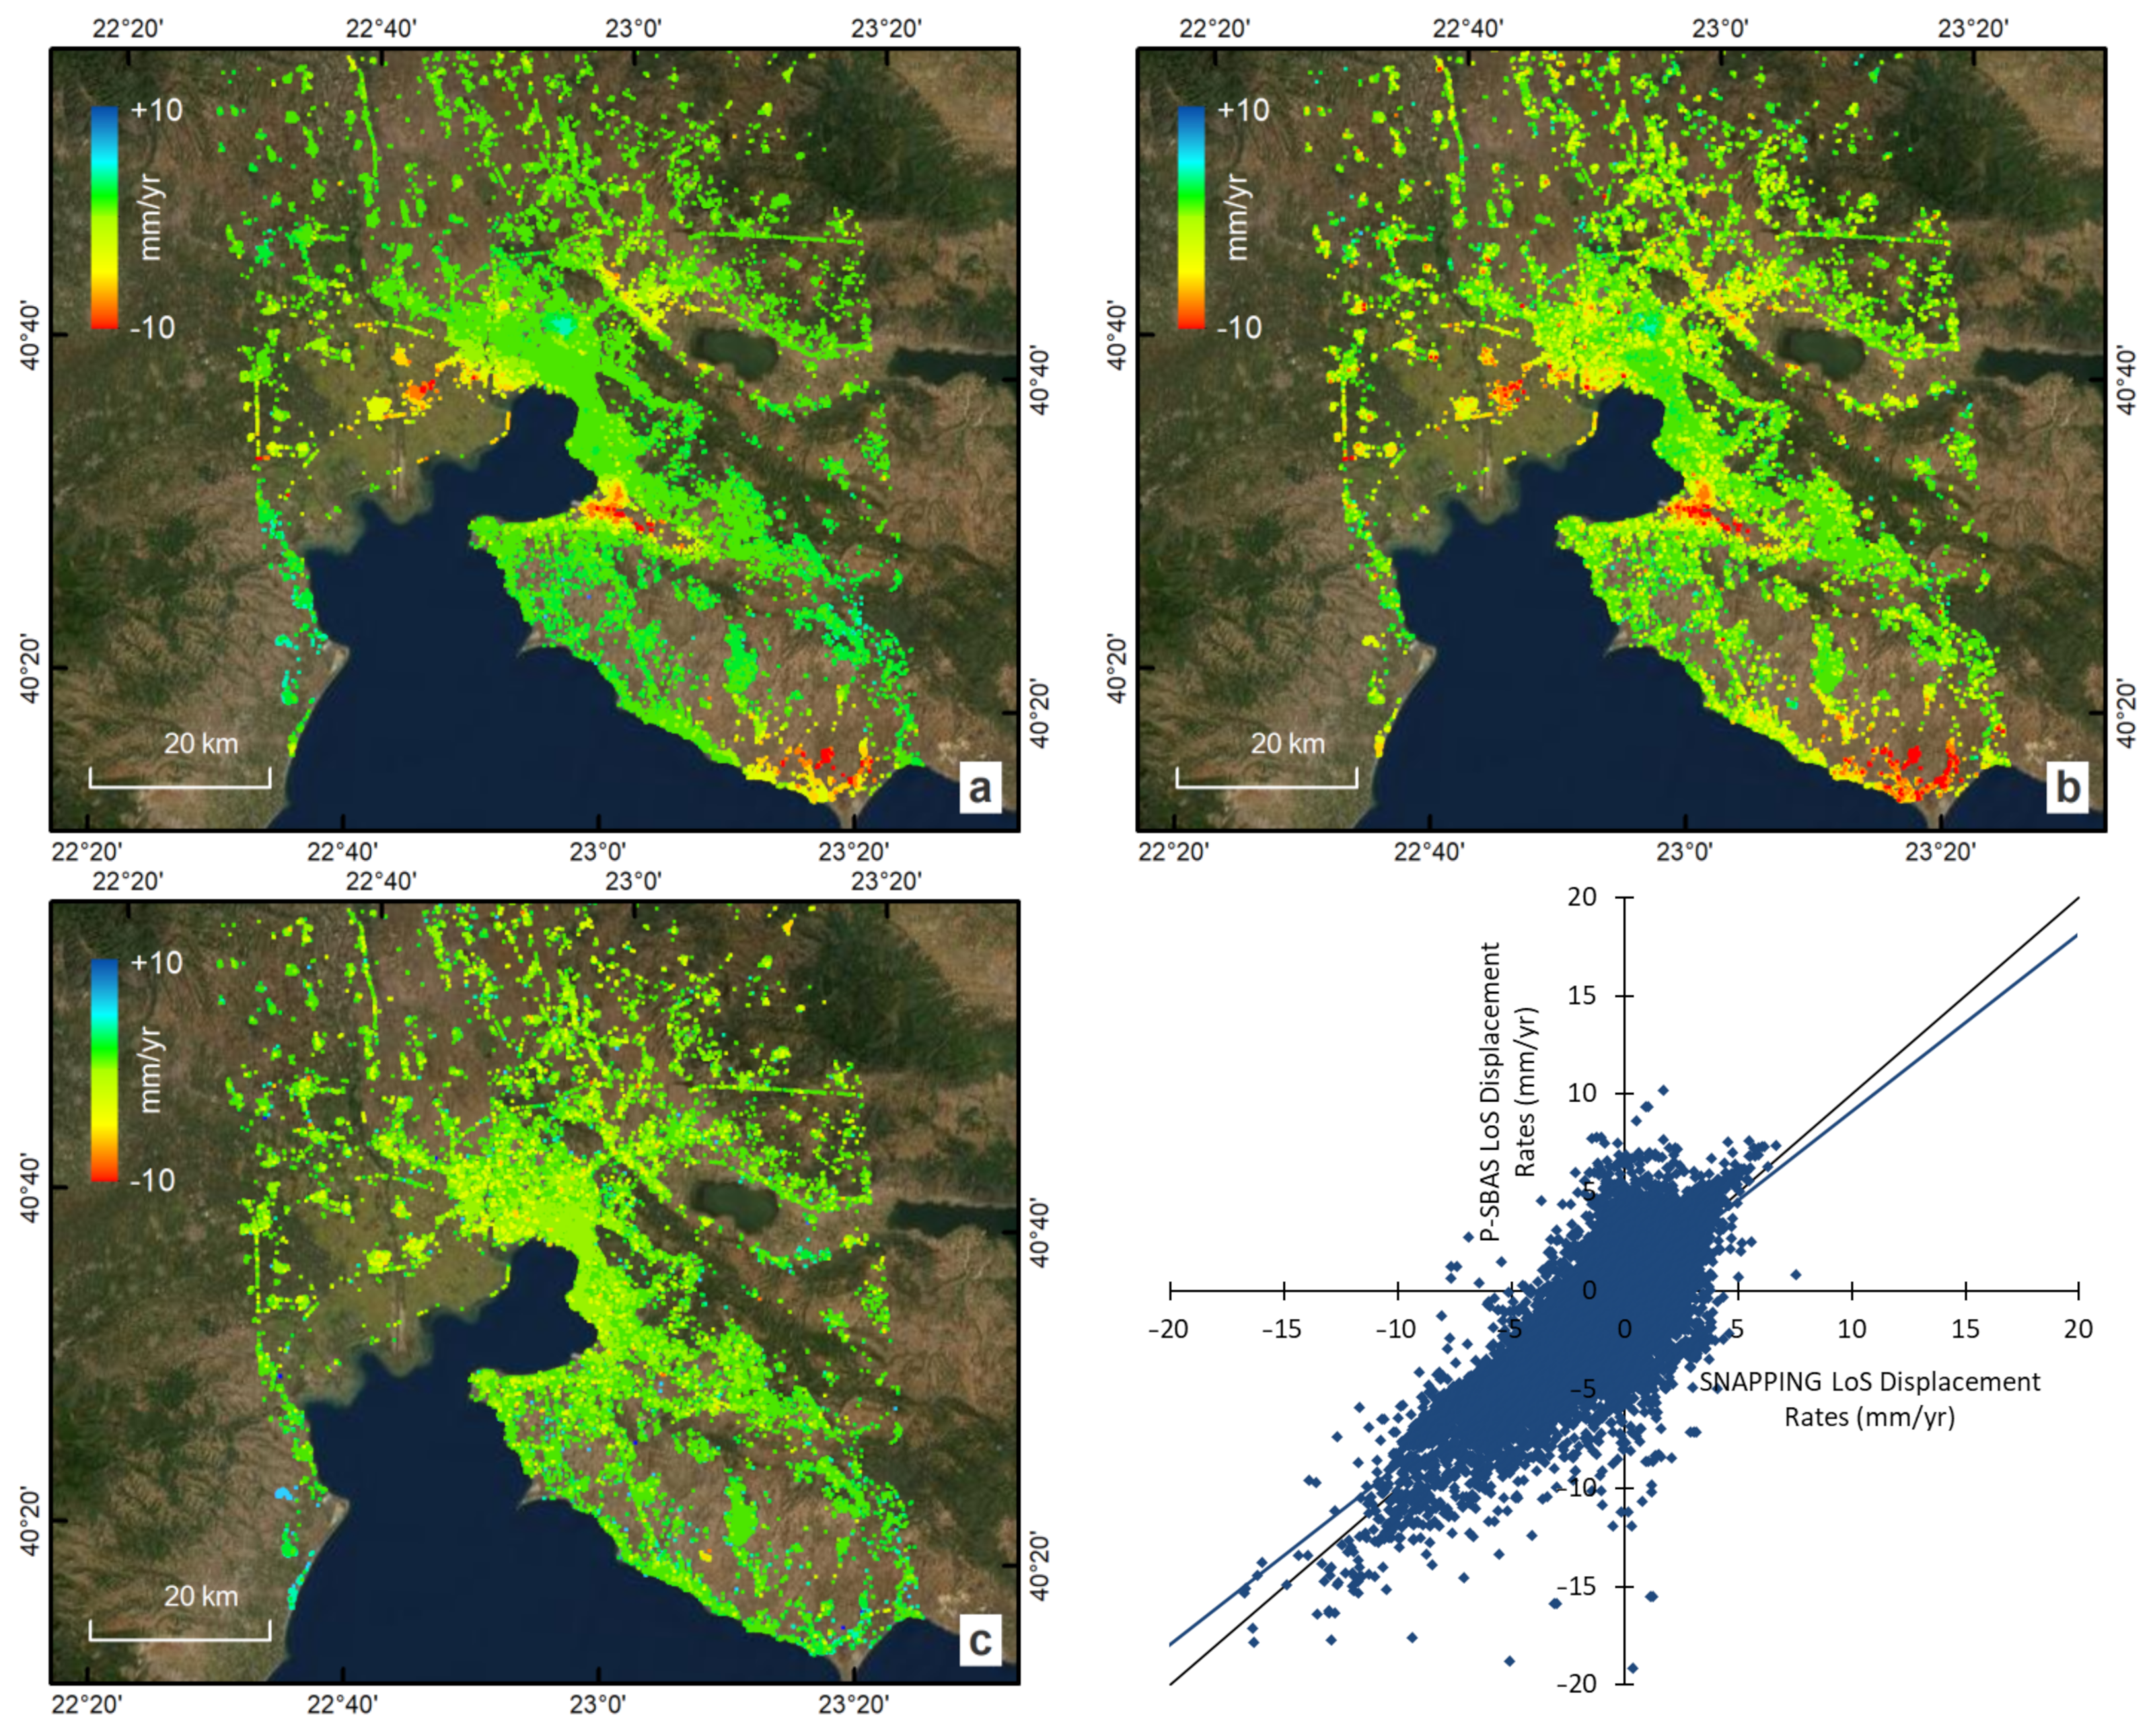
Both the SNAPPING PSI Med and P-SBAS services were run considering the exact same observation period, from April 2015 to December 2020 (~6 years), comprising the entire available Sentinel-1A archive data (138 acquisition dates) along the ascending track 102. A total number of ~42k point measurements were commonly identified by SNAPPING and P-SBAS, with neighboring measurements within a 100 m radius, as shown in
Figure 8. The detection of additional measurements by each service appears to have a direct relationship to specific land cover types (
Figure 9). As expected, the majority of additional PS targets are located over built-up areas, bare soils, or land with sparse vegetation (57%), with another 22% on croplands, contrary to P-SBAS, where more points are identified over land surfaces dominated by grasslands, scrublands, and trees (87%).
Examining the results further, it appears that additional P-SBAS point measurements have lower temporal coherence levels compared to those in the vicinity of the SNAPPING PS targets. Although relatively subtle differences (in the order of 0.1) are observed, they can still be ascribed to the presence of vegetation. A comparable increase in the motion rate uncertainties or coherence estimates is not found for the additional SNAPPING targets.
Comparing the LoS motion rates between the services, and only for neighboring points, the consistency of the solutions can be easily appreciated even visually (
Figure 8), while correspondingly, during the quantitative evaluation, the differences show fairly small dispersions. A slight overestimation of motion by SNAPPING or an underestimation by P-SBAS is nevertheless present when plotting rates against each other (
Figure 8). However, this is driven mainly by points of low motion gradients, whereas an overestimation by P-SBAS occurs for regions exhibiting higher subsidence rates. For very few points where the difference exceeds the measurements’ uncertainties and/or the nominal accuracy of the technique, it is better to assess the possibility of uncompensated error sources rather than considering them as being significant deviations.
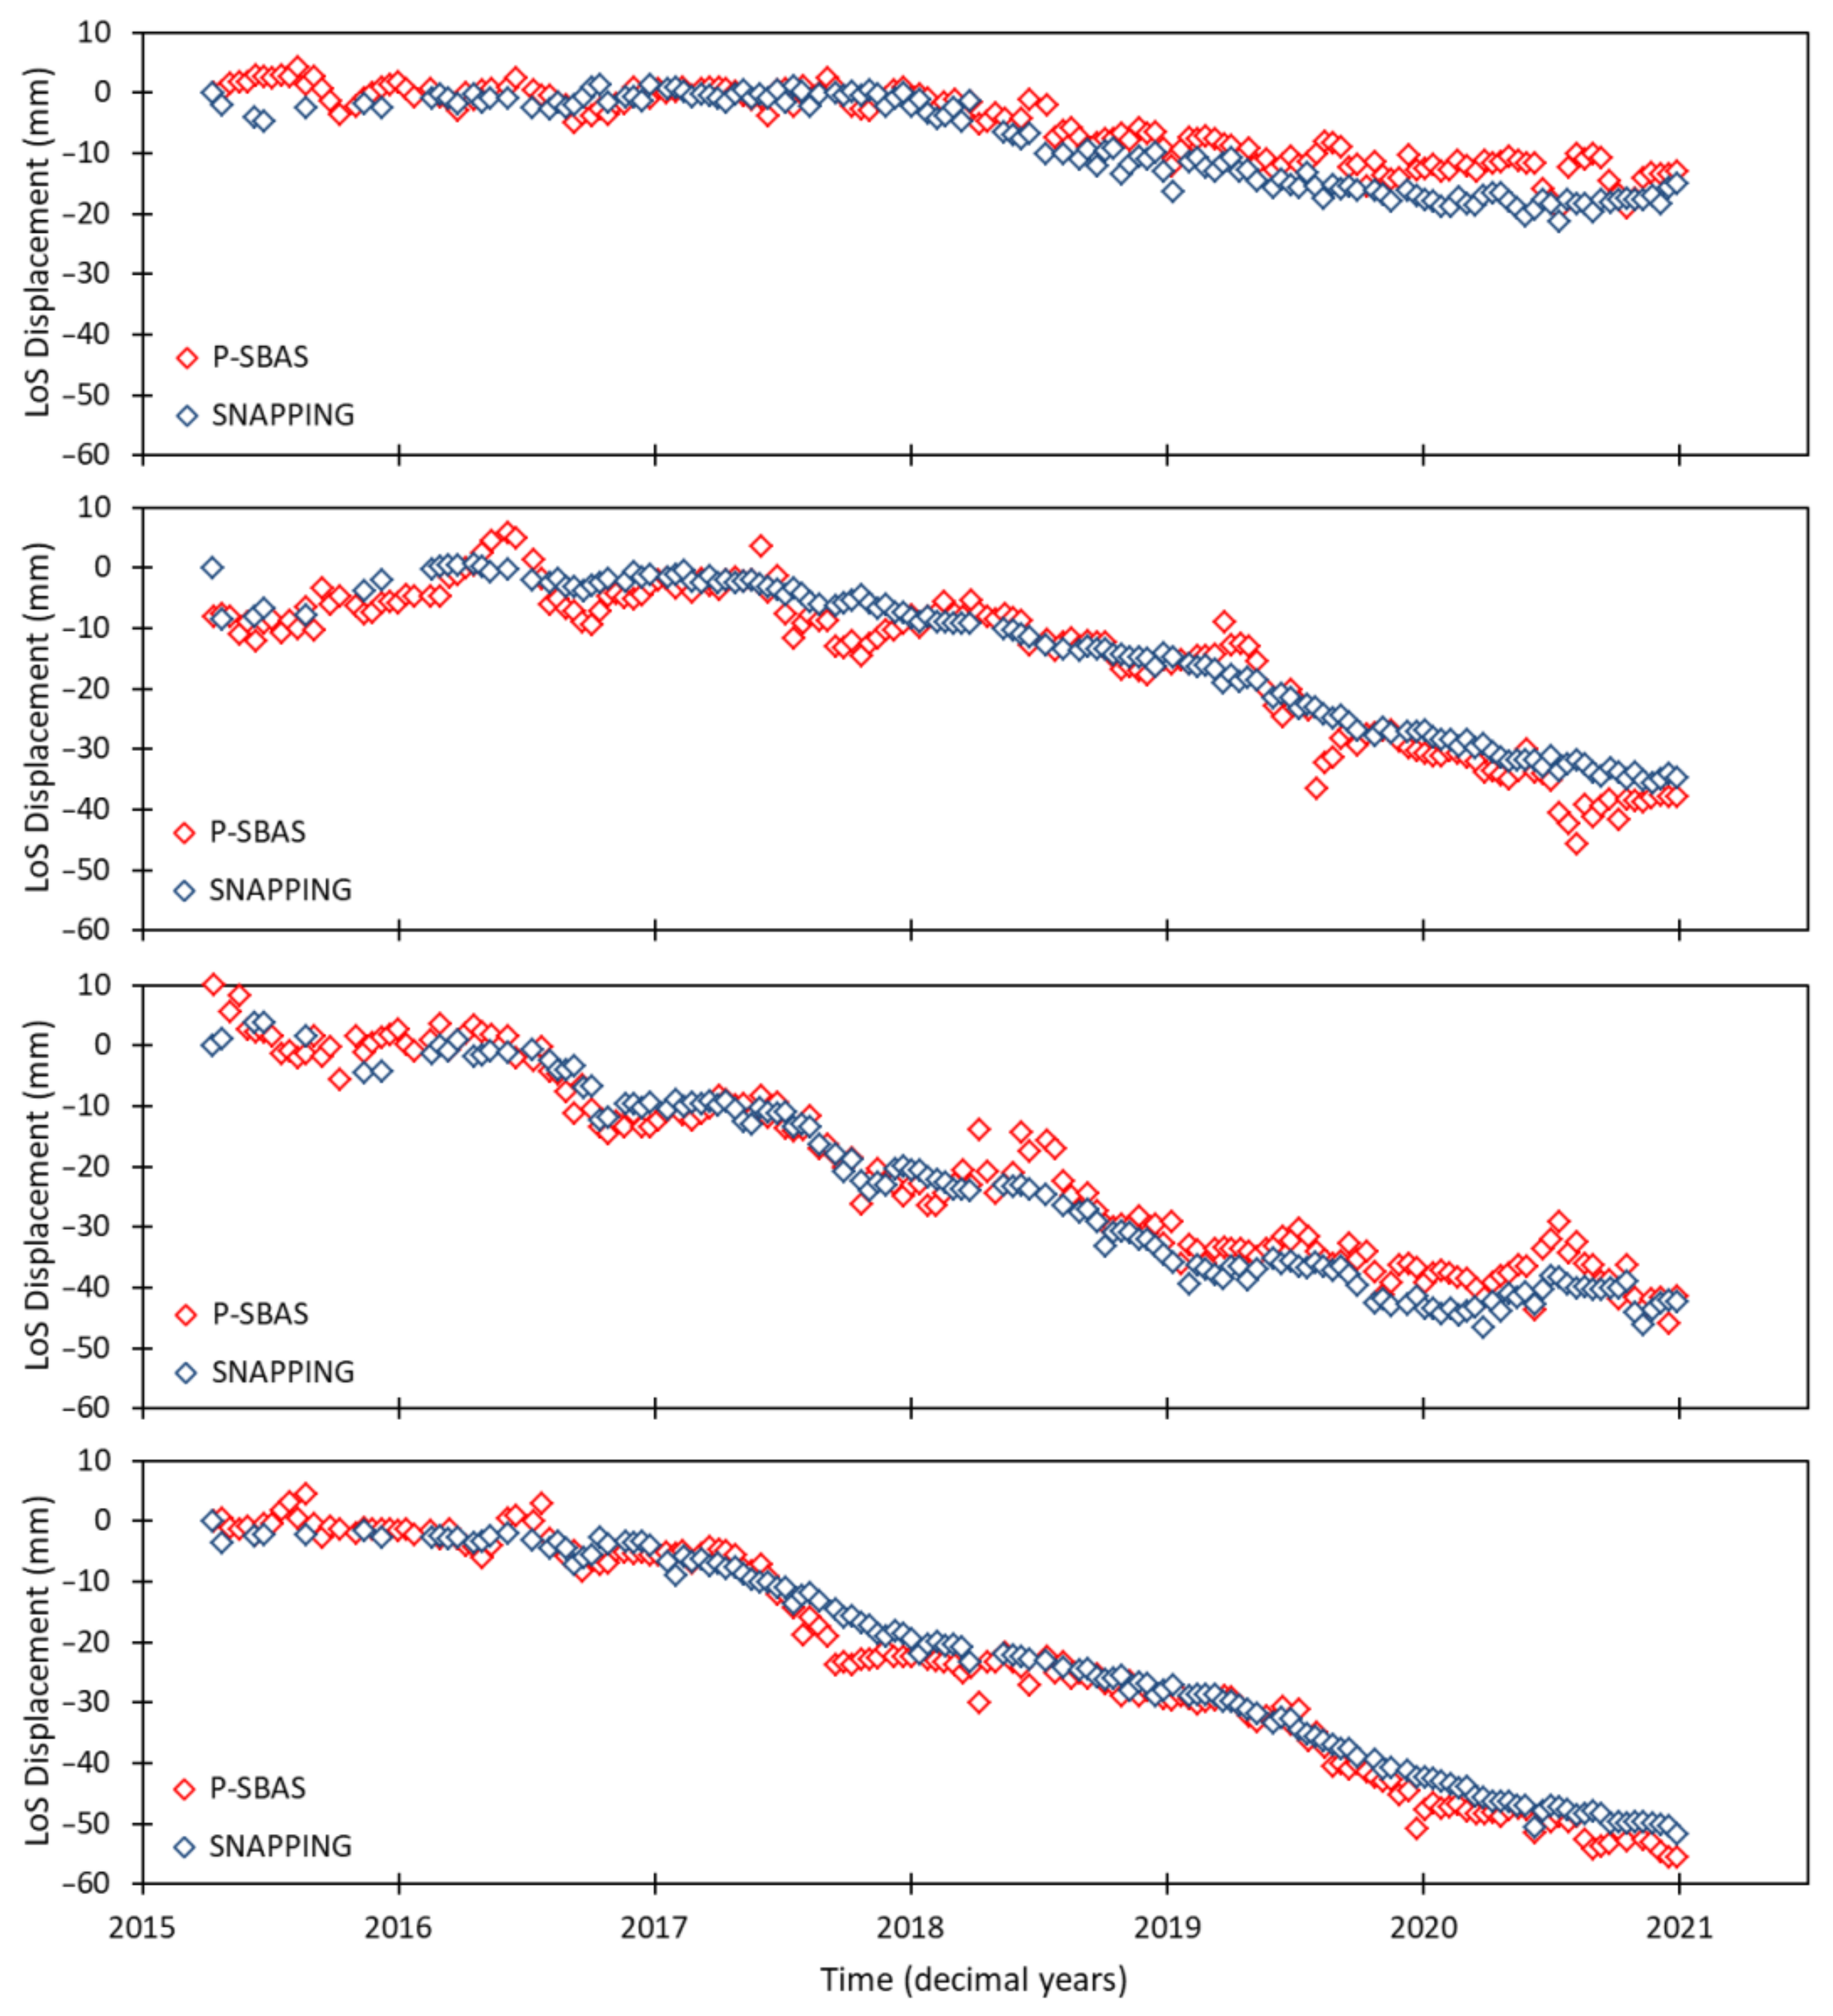
Further analysis involved the consistency of time series for different temporal motion patterns, including gradual trends, seasonal motion, and non-linear components (
Figure 10). The uniform evolution of displacements in time, as derived from both services and independently of the temporal filter applied, underlines the robustness of the interferometric solutions.
Complementary to the evaluation of services with comparable spatial resolutions, the demonstration of higher resolution InSAR services, such as SNAPPING PSI Full, is also of interest. Accordingly, based on the same interferometric stack used by the SNAPPING PSI Med service, the PSI Full results were generated. The production of those measurements is relatively more time-consuming (see
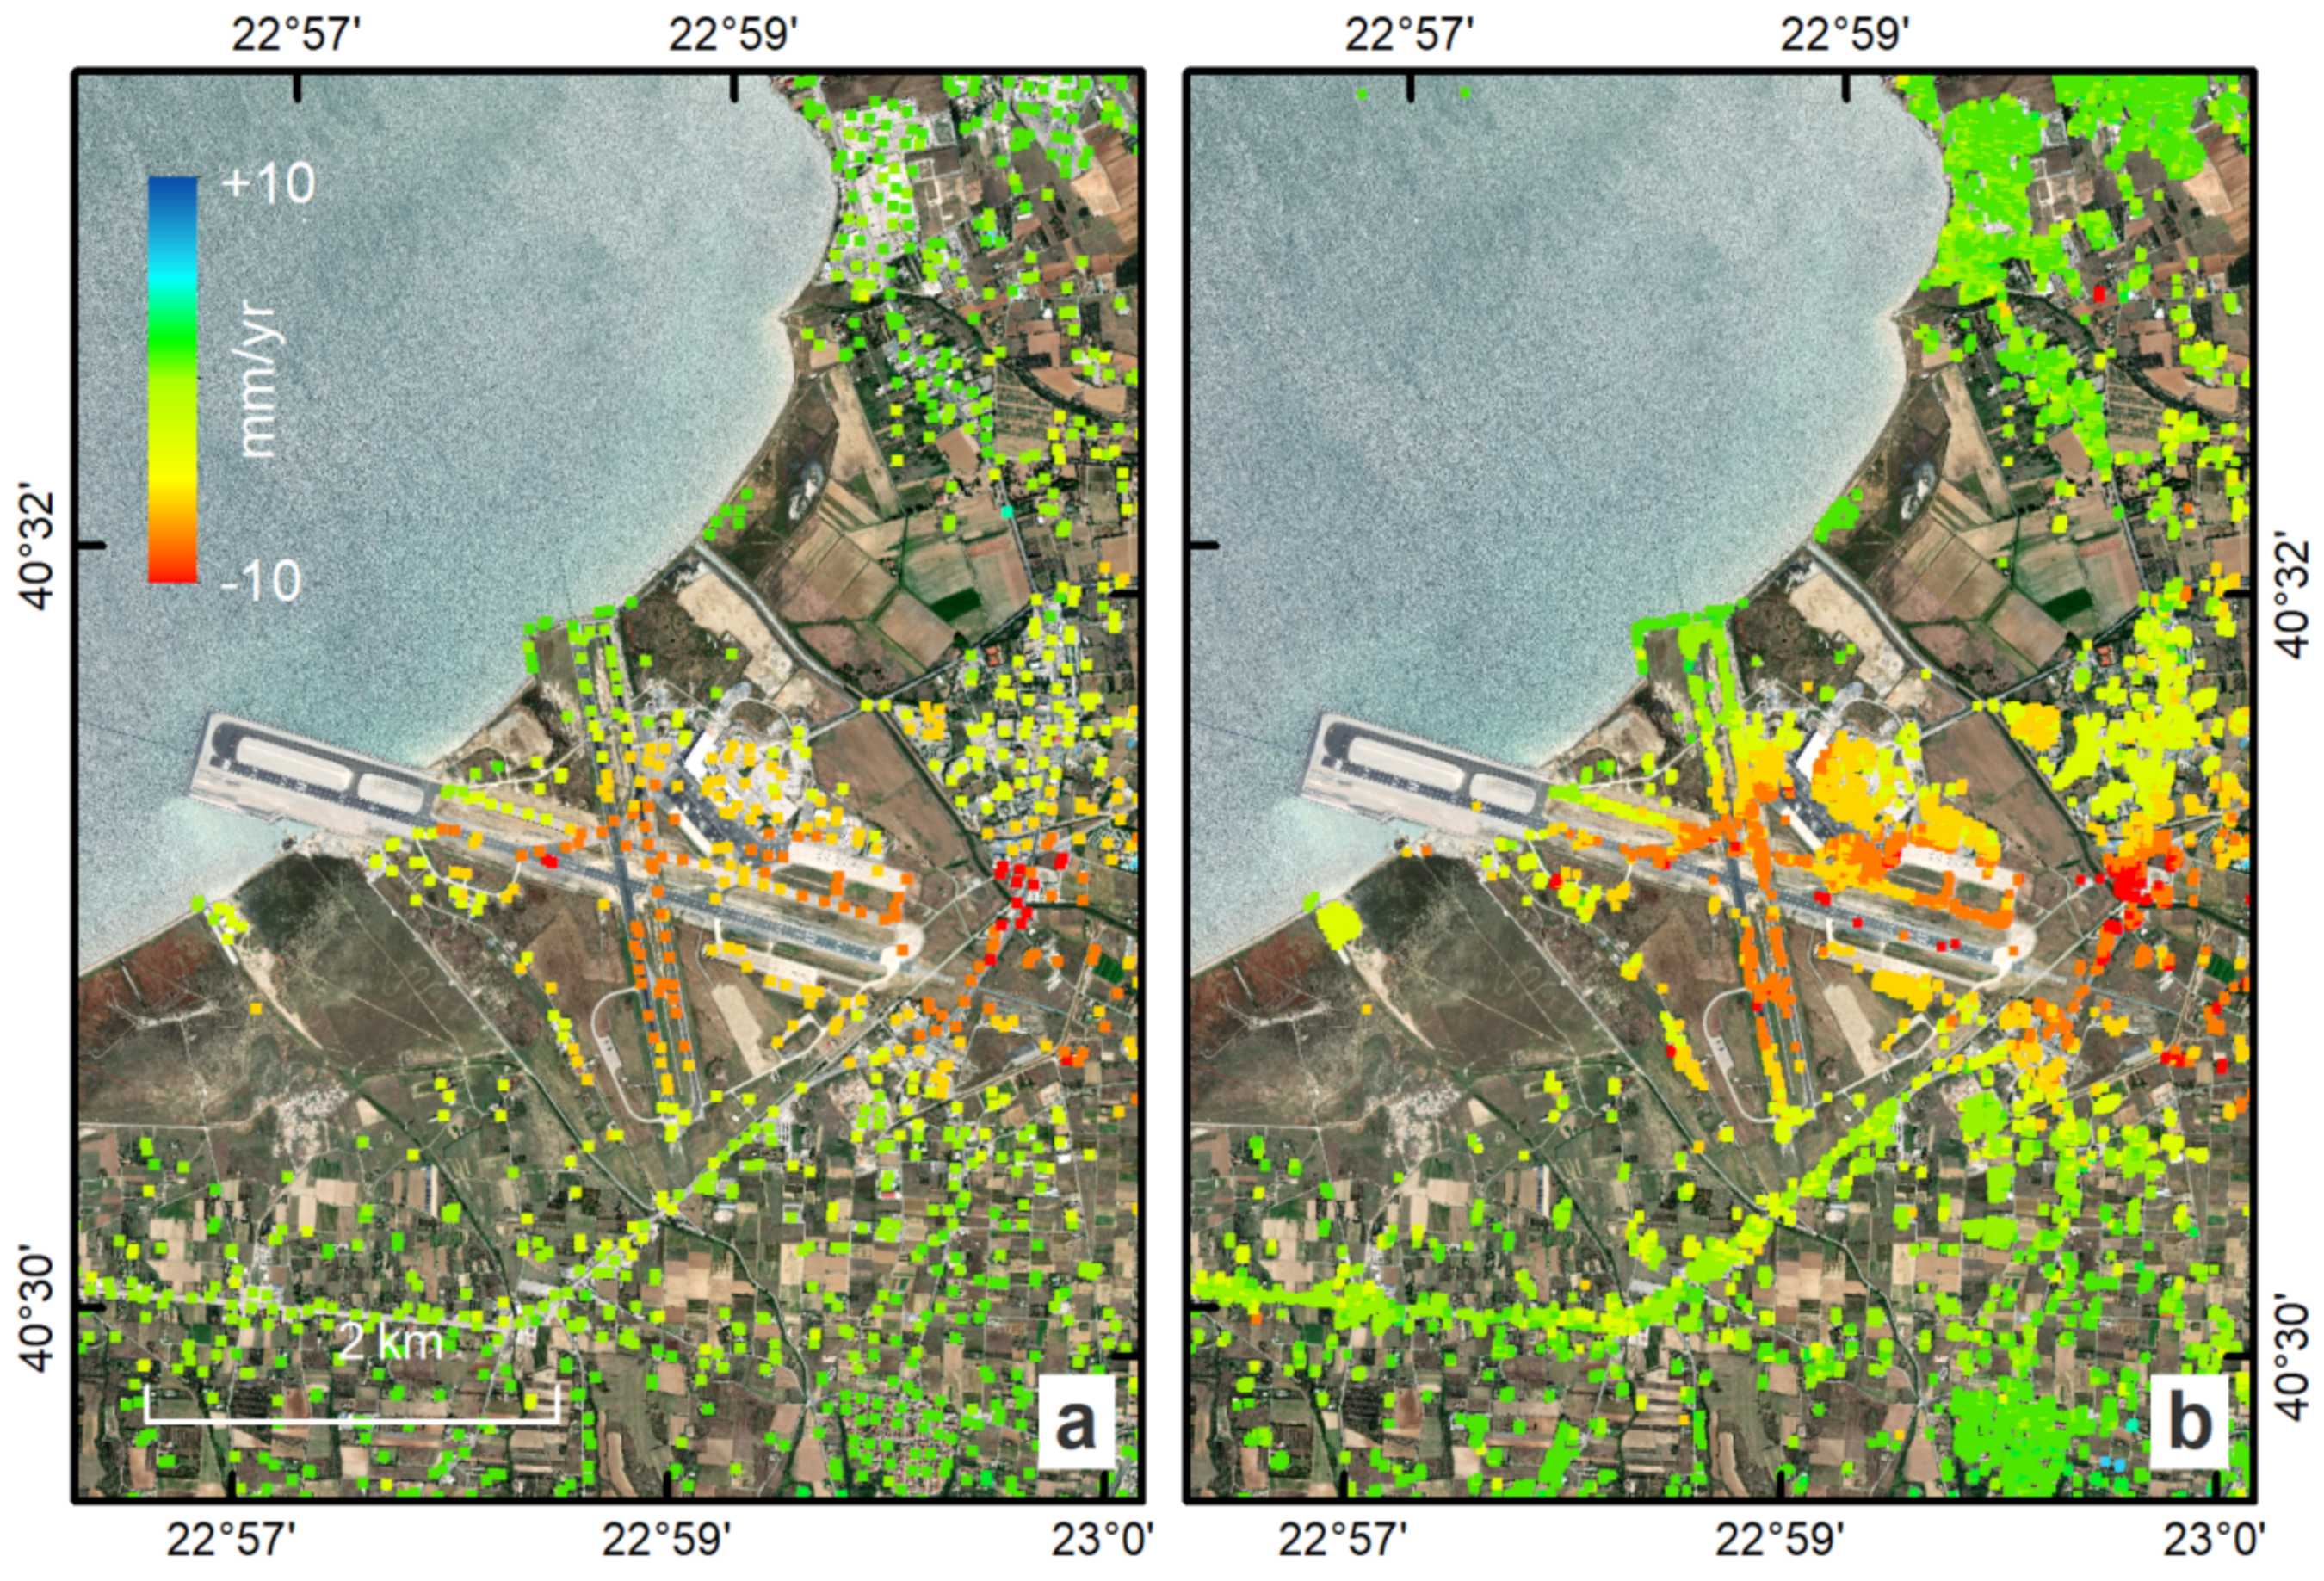
Table S1 in Supplementary Materials), given the highest number of PS targets involved. For instance, over the broader area of Thessaloniki airport, PSI Full led to a ~1500% increase in PSs (a total of 16,500 targets) compared to the corresponding PSI Med solution (1120 targets) (
Figure 11). Yet, this is practically a densification of the PSs already detected at medium resolution; hence, the measurements do not expand over regions that are not previously covered. Still, the capability to extract a higher number of points along human infrastructures or over low vegetated lands can be deemed as being critical for certain applications.
6.3. Surabaya (Indonesia)
For the broader area of Surabaya (~2600 sq. km), SNAPPING PSI Med and P-SBAS run on the GEP were performed in the context of the ADB project for “Support to Water and Food Security Planning and Investments in Indonesia through Earth Observations Services”, with 129 S-1 dates as inputs (descending track 3) covering a period of approx. 6 years (April 2015–December 2020).
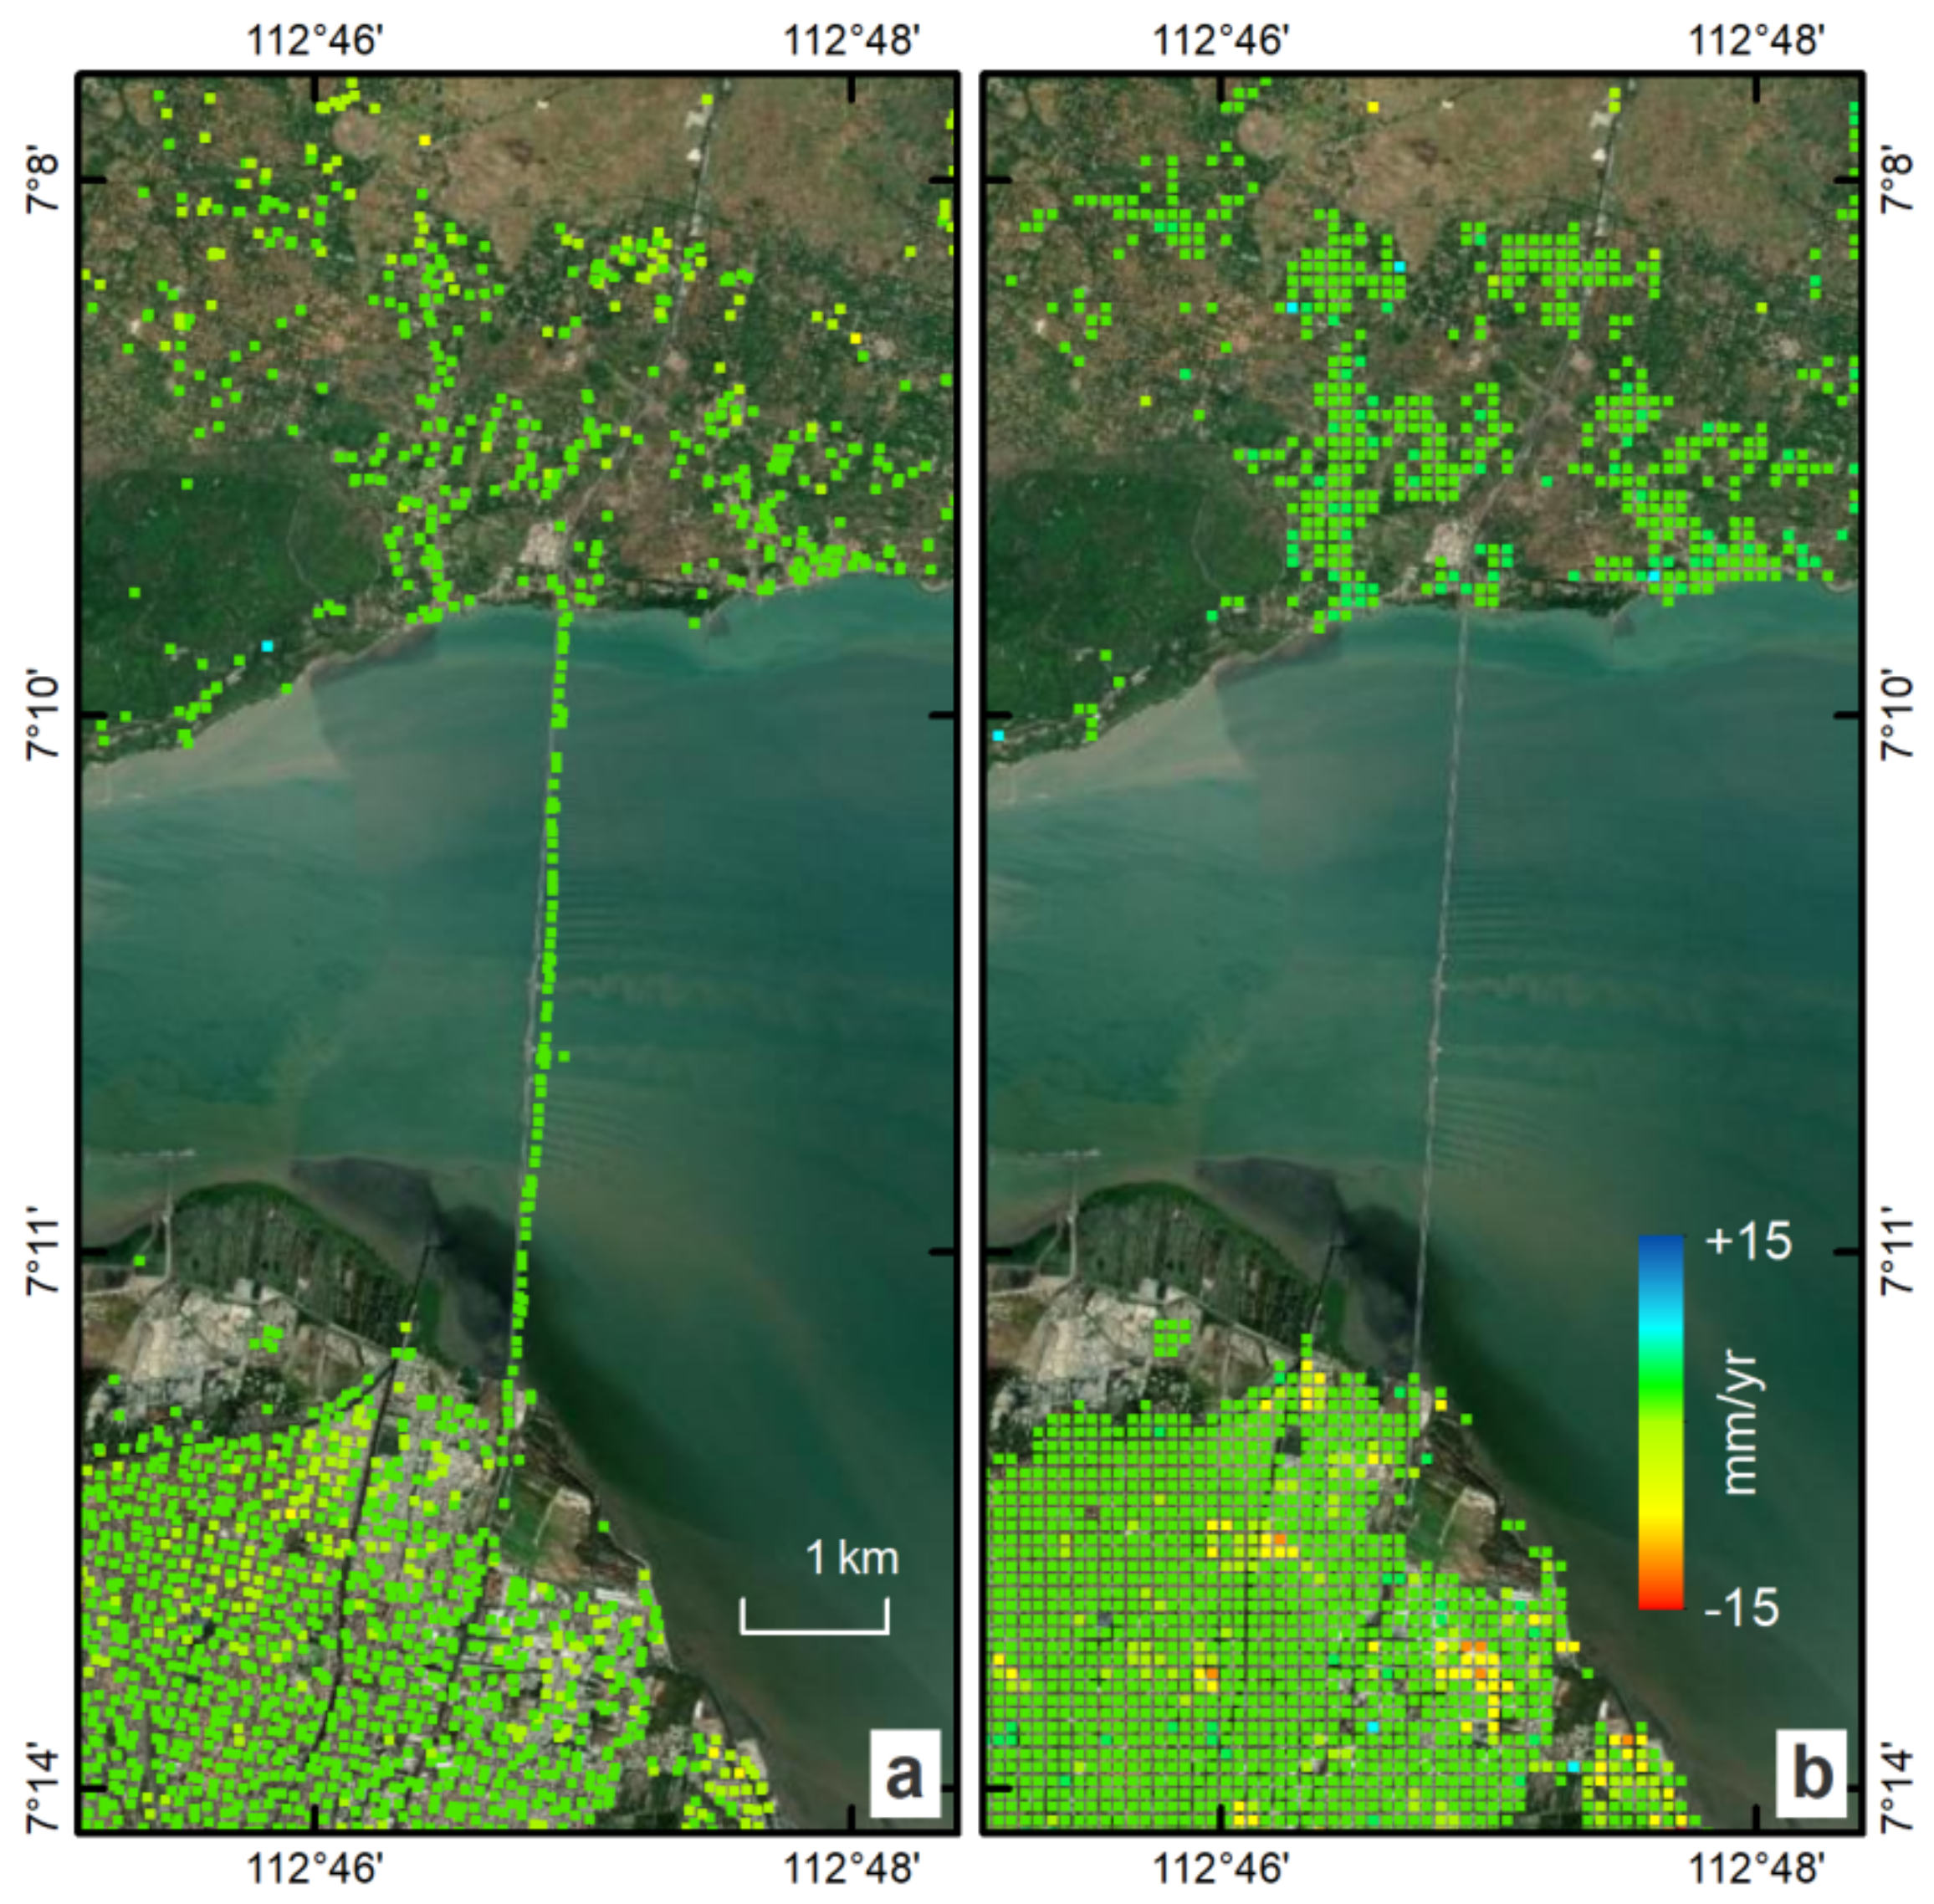
Spatially neighboring measurements for SNAPPING PSI Med and P-SBAS reached 57k points. As expected, the number of distributed scatterers is higher than the PS targets in the scene, especially since a large part of the area is dominated by agricultural lands (
Figure 12). Yet, it should be kept in mind that even for PSI Med, multiple PS targets can be located near to a single point of the P-SBAS grid. This is depicted in the additional points (farther than 100 m) obtained by each of the services, these being ~2100 for SNAPPING and ~6400 for P-SBAS. The small number of actual additional points compared to the total number of measurements underline the fact that both services are complementary, and detect, in practice, different types of scatterers in a scene. It is worth noting that when it comes to human infrastructures, the capability of the PSI technique is apparent, e.g., along the ‘Suramadu’ bridge connecting Surabaya and the island of ‘Madura’ to the NE (
Figure 13).
Regarding displacement patterns, both results appear almost identical, even for spatially limited deformation signals (
Figure 12). Even without any prior reference adjustment between the solutions, the average difference of motion rates (SNAPPING minus P-SBAS), is negligible at −0.8 mm/yr, these being actually within the error budget of the technique. However, the observed differences indicate higher P-SBAS subsidence values reaching 30–35 mm/yr, within the industrial zone SW of the Tanjung Perak port and along the eastern coastline of the city in the transition between the urban fabric and the mangrove ecosystem. Higher rates for SNAPPING, of up to 17 mm/yr, are sparsely located within the build-up area, while more concentrated patterns are found in the north-western suburbs of Surabaya (the Gresik Regency area).
Finally, additional point measurements by SNAPPING and P-SBAS show a motion of 3–4 mm/yr on average, exceeding a couple of tens of millimeters for some individual points. The above deviations are acceptable, considering the differences in spatial averaging between the services.
7. Demonstration Cases
The aim of this section is to demonstrate results obtained via the SNAPPING hosted service on the GEP, over regions of special interest and known InSAR signal (see
Table S2 in Supplementary Materials), in order to show the capability of EO-based platform solutions and to present the consistency with already published studies.
7.1. Santorini Volcano Recovery
The Santorini volcano in the southern Aegean Sea (Greece) belongs to caldera-forming systems undergoing long-term periods of quiescence, interrupted by short non-eruptive unrest. Its latest volcanic history was followed by the restless period of 2011–2012, with increased microseismic activity and significant ground uplift; however, it did not lead to an eruption [
68,
69]. Since the end of the 2011–2012 unrest, the volcano has presented no further activity, as confirmed by multi-sensor InSAR measurements for the post-unrest period 2012–2017 [
70].
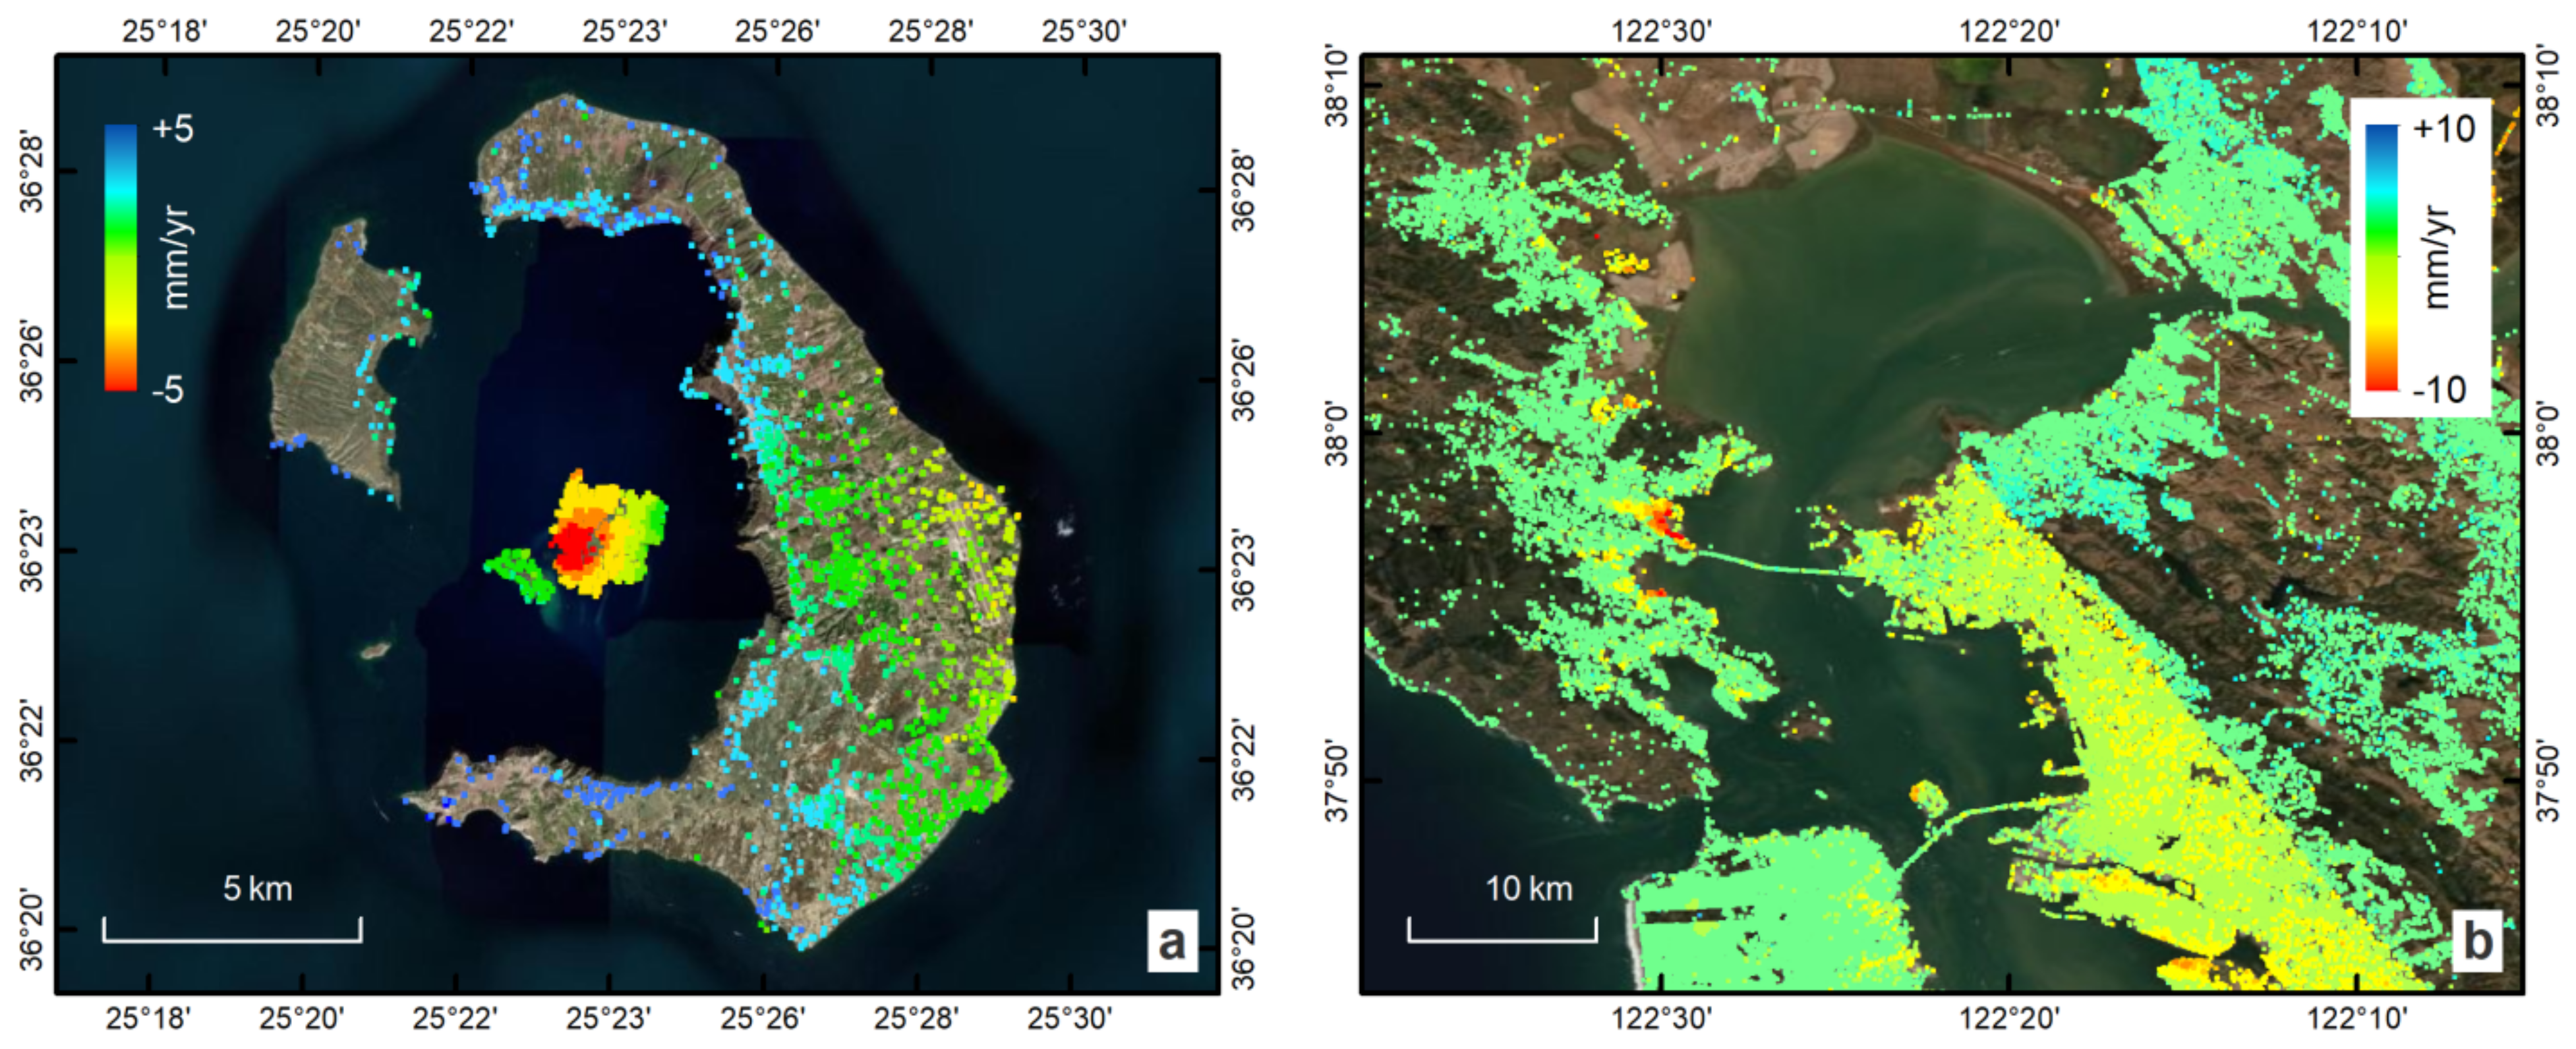
Herein, an interferometric analysis of S-1 data from April 2015 to May 2021 (~6 years), with a total of 319 dates acquired on ascending track 29, was made using the SNAPPING service at medium resolution (PSI Med) (
Figure 14a). Given that no local reference area is defined during processing (no selected zero point), measurements correspond to the average motion within the entire island.
At medium resolution, 2140 point targets were detected, distributed mainly over built-up areas and bare volcanic outcrops, areas with high temporal coherence. Overall, the findings are consistent with recently reported deformation patterns and motion rates for the post-unrest period [
70], yet they are still slightly higher than those prior to the unrest (−5–6 mm/yr for the period 1992–2010) [
71]. A downlift of −6.5 mm/yr in the area of Nea Kameni island, where volcanic deformation signals constantly occur, is clearly observed, suggesting that the volcano is close to reaching its previous dormant state.
Given the scientific importance of studying this volcanic complex, and the actual need for its monitoring, several in situ networks are operationally established under ISMOSAV (Institute for the Study and Monitoring of the Santorini Volcano), measuring, among others, the local seismicity, geochemical emissions, temperature variations, and GNSS-based displacements. Further to those, EO-based deformation monitoring through near real-time hosted InSAR processing is being integrated.
7.2. Inter-Seismic Motion along the San Andreas Fault
The San Andreas Fault (SAF) is one of the most seismically active tectonic zones in the world. It is a continental transform fault that extends roughly 1200 kilometers. Due to its proximity to urban settlements, and, hence, the resultingly high seismic risk, it has been intensively studied by several researchers [
72,
73]. Inter-seismic strain accumulation along several segments of the fault was investigated using an InSAR time series to evaluate short- and long-wavelength deformation, as well as transient deformation effects and post-seismic relaxation after major earthquakes [
74].
For the San Francisco Bay case, SNAPPING medium resolution processing involved 148 Sentinel-1 scenes from January 2016 to December 2020 (~5 years) acquired along the descending track 115 (
Figure 14b). A total number of ~49k point measurements were detected, showing an average motion rate of less than half of a millimeter per year (−0.4 mm/yr).
The results highlighted the overall stability of the region, including several bridges, with only local patterns of relatively higher subsidence rates ranging between −10 mm/yr and −16 mm/yr. However, the main finding was related to the difference in motion across the SAF (up to 2.5 mm/yr) that is passing through the urban shell of San Francisco city. Such measurements could contribute, together with other geodetic techniques, to the estimation of contemporary slip rates along the fault and the monitoring of potential changes over time.
7.3. Land Subsidence in Mexico Valley
Mexico City has been a point of reference for the mapping and monitoring of surface motion through space-borne geodetic techniques, given the very high subsidence rates exceeding several tenths of centimeters per year, according to various studies [
75,
76]. The impressive displacement signal that appears in the InSAR measurements has led to the exploitation of the area as a reference for verifying algorithms [
77,
78] or for validating newly developed SAR acquisition modes, including the S-1 Terrain Observation with Progressive Scans (TOPS) technique [
79,
80]. The utilization of GEP services, not only for the generation of surface motion measurements, but also to derive higher level products regarding building risk was also investigated [
16].
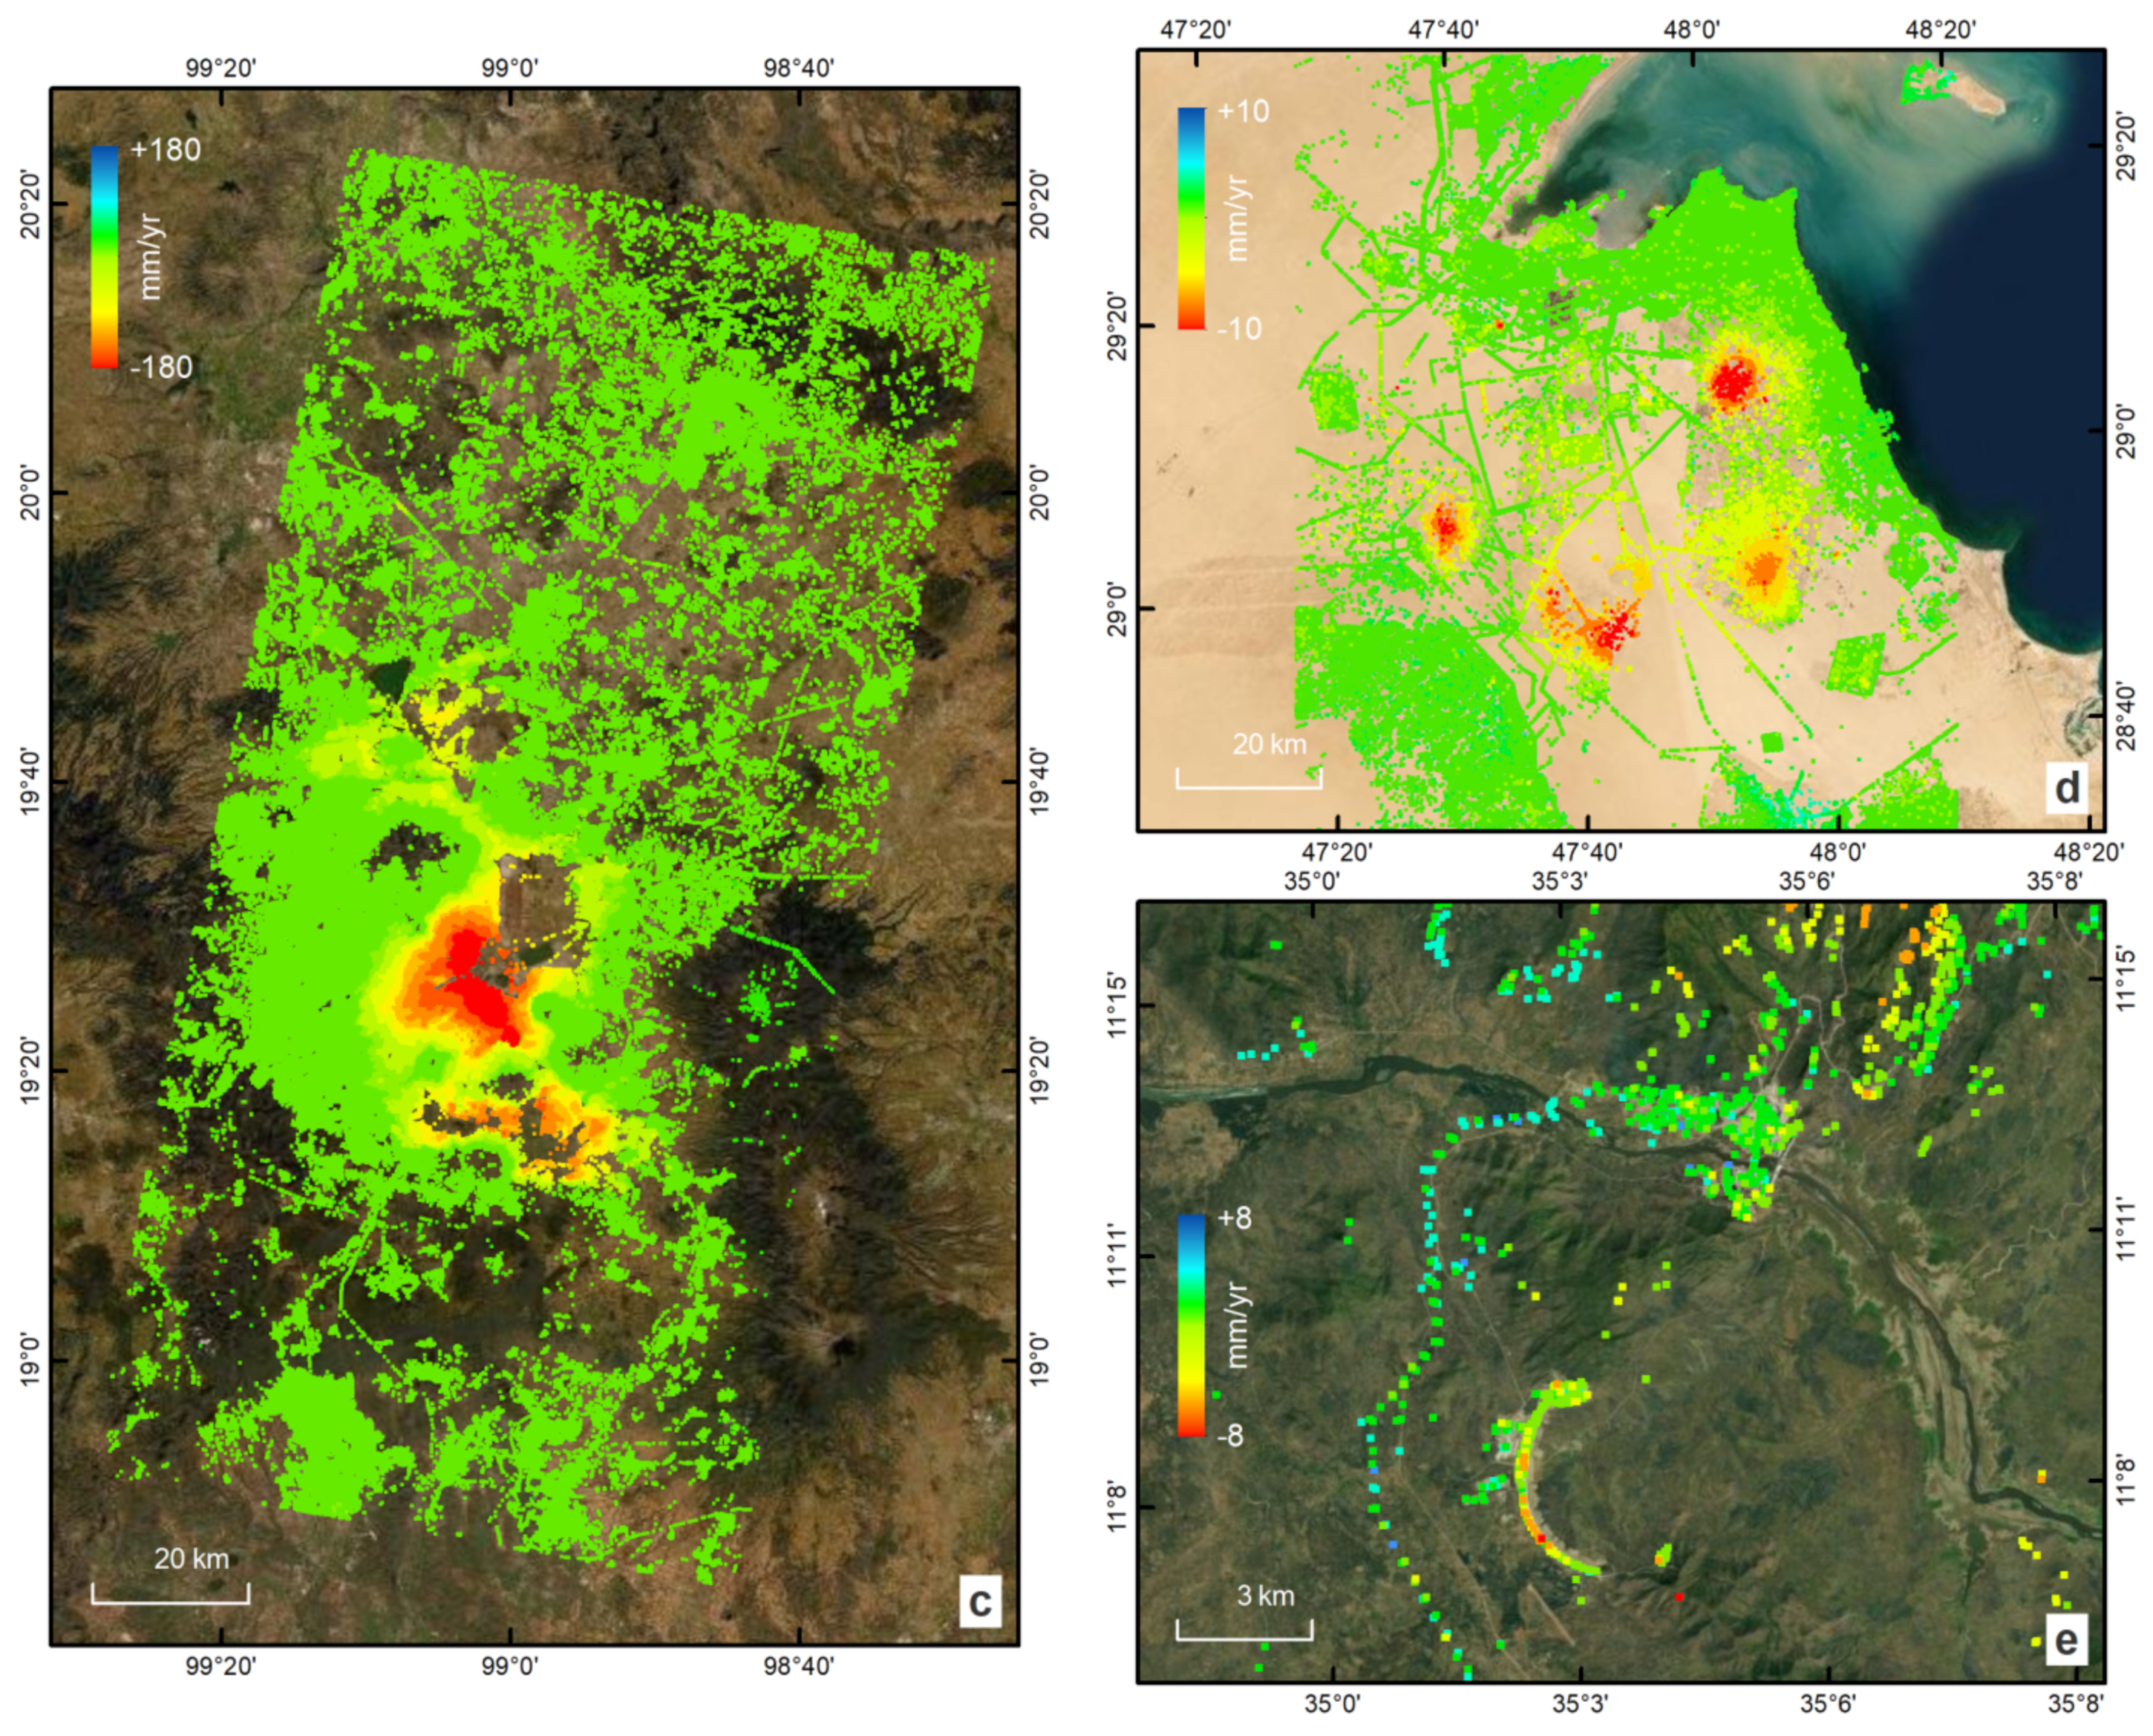
By processing 372 Sentinel-1A and -1B scenes (descending track 143) corresponding to 205 dates (April 2015–December 2020) the coverage of the entire Mexico Valley was aimed at showing the capability of the SNAPPING service for wide area mapping. An area of approx. 13,600 sq. km (80 × 170 km) was mapped within a week’s time obtaining a total number of ~245k PS targets at medium resolution (
Figure 14c). This translates to an average density of 18–20 points per sq. km for the entire area in medium resolution (up to 100–110 point/sq. km over dense urban areas), adequate for the inspection of even local displacement patterns.
As with previously published research works, a maximum subsidence rate of −180 mm/yr was detected within the broader area of ‘Mexico City International Airport’ and the ‘Laguna de Texcoco’ in the NE. The coverage of the entire valley pinpointed the presence of several deformation centers located in neighboring villages, e.g., −125 mm/yr and −58 mm/yr in Xico city (20 km SSE of Mexico) and the Zumpango region (35 km northeastern part of Mexico state), respectively. It is interesting that the displacement histories indicate a variability of trends, at least for some of the regions that have been affected by major displacement gradients within Mexico City. This above fact might imply a higher probability of potential problems in neighboring infrastructures when higher motion trends are recognized, although the effects of differential motions should be also carefully examined. More local patterns with lower motion rates are counted along the valley, exhibiting mainly linear displacement trends in time. A proper interpretation of the temporal evolution of surface motion in those areas could support the identification of the deformation causes, ensuring adequate mitigation actions.
7.4. Oil Fields in Kuwait
Kuwait has an outsized role in oil production, since its oil reserves make up 8–9% of the oil reserves in the world. Oil and gas production is managed through associated facilities from more than 12 developed oil fields spread over the state.
The oil and gas abstraction over several decades is followed by a reduction in fluid pressure and, in turn, by reservoir compaction, which is reflected as ground deformation in the surface. This phenomenon is prominent when the extraction in hydrocarbon reservoirs is not balanced by water injection. Regardless of the proven value of InSAR, limited scientific studies related to ground displacement monitoring in the area of Kuwait have been published [
81].
Herein, the SNAPPING medium resolution processing of 121 S-1 scenes acquired along a descending track 108 from April 2015 to February 2021 allowed for the detection of more than 120k point measurements over an approx. 12 thousand sq. km area (75% of land), with local motion rates exceeding −18 mm/yr (
Figure 14d). Well-distinguished patterns of terrain motion were found, related primarily to oil extraction activities, while the proper mapping of linear manmade structures (i.e., pipelines and road networks) was also achieved. It should be emphasized that despite the medium resolution of the applied SNAPPING service, and due to the special environmental conditions, the obtained density along those linear structures is sufficient for monitoring purposes. Decorrelated areas were primarily related to sand dunes and other landforms that were highly changeable over time.
7.5. The Grand Ethiopian Renaissance Dam
The Grand Ethiopian Renaissance Dam (GERD), formerly known as the Millennium Dam, is a gravity dam on the Blue Nile River in Ethiopia under construction since 2011. The design of the dam, whose construction started in 2011, is composed of two separate structures, the main 1780 m long concrete dam and the supporting 4900 m curved rock-fill saddle dam.
Depending on the hydrologic conditions, the filling of the whole reservoir is estimated to be completed in 4–7 years [
82,
83]. The first phase of reservoir filling began in July 2020, while the second was completed in July 2021 [
84]. The primary purpose of the dam is electricity production for Ethiopia’s neighboring countries, and February 2022 was marked as the date on which the dam would produce electricity for the first time.
Being one of the most important human infrastructures in the area, with relatively strong relief and a particularly high percentage of vegetation, the application of space-borne techniques for stability monitoring was considered an appropriate demonstration. The utilization of 49 S-1 products acquired over the period of January 2019–June 2021 (1.5 years), and the unsupervised execution of the SNAPPING PSI Med service on the GEP allowed for the identification of ~2.5k PS targets, distributed typically along man-made structures within an area of about 365 sq. km (
Figure 14e). Among the infrastructures, it is interesting that points were identified along power lines and specifically on the electricity pylons.
Average motion rates indicate overall stability, while in limited places higher velocities approaching −6 mm/yr and −8 mm/yr are presented. Examining the evolution of surface displacements in time does not indicate any notable variability. In practice, the calculated displacement rates must be examined in relation to the characteristics of each infrastructure in order to draw conclusions about their stability and the potential need for measures.
7.6. The La Palma Volcano Eruption
One of the longest recorded and most damaging volcanic eruptions on La Palma, Cumbre Vieja volcanic ridge, in the Canary Islands (Spain) began in September 2021, lasting 85 days, until finally stopping in December 2021 [
85]. The extensive lava flow caused the evacuation of more than 7000 people and destroyed almost 1000 hectares of plantations and farmlands; however, no direct human losses have been recorded.
For mapping, the volcano-induced deformation, the S-1 data acquired over the last one and a half years, including the eruption phase, was used (June 2019–December 2021), comprising 134 observation dates (descending track 169). For that case, SNAPPING PSI services at medium and full resolution were run, detecting 31,400 and 418,000 PS targets, respectively. Even though the consistency among the two independent runs is apparent, the full-resolution processing, given no spatial merging is applied, is able to detect more efficiently, local point clusters with higher motion rates (
Figure 15). Based on the EO findings, apart from local clusters attributed to eruptive vents, secondary slides, etc., the NW flank of the Cumbre Vieja ridge up to the coastline (the south-western part of the island) appears to have been affected by a relatively wide and continuous deformation pattern indicating a total uplift of a couple of tens of centimeters.
As a matter of fact, while the average velocity map allows for the immediate delineation of affected zones, it does not solely represent the surface displacements induced by volcanic activity. In particular, as a sufficient number of images need to be considered for InSAR time series analysis (SNAPPING, P-SBAS, etc.), the estimated rates refer to the entire observation period, and not to the time interval of the volcanic unrest. Thus, higher displacements are expected if only the volcanic unrest signal is examined at the post-processing level (see
Section 7.7).
7.7. The Samos 2020 M7.0 Earthquake
Samos Island (Greece) was struck on 30 October 2020 by an M7.0 earthquake, the strongest quake since 1955, causing extensive damages and casualties. On 30 October 2020, one of the strongest earthquakes since 1955, struck Samos Island (Greece), causing extensive damage and casualties. With a magnitude of M7.0 located approx. 12 km from the northern shorelines of the island and at a focal depth of between 10 and 15 km it caused deformation signals observable by both InSAR and GNSS over several surrounding islands and Turkey’s western coast [
86,
87]. The rapid response to the event was based on seismological, conventional Differential InSAR (DInSAR), and GNSS measurements [
88].
Although the PSI technique is not optimal for cases of strong abrupt motion, such as earthquake induced surface deformation, however for the Samos 2020 seismic event it was possible to successfully depict the induced co-seismic deformation, as well as the following post-seismic relaxation (
Figure 16). SNAPPING PSI Med processing involved a short observation period of six months from June 2020 to January 2021 (36 dates).
At post processing level the offset in the time series referring to the co-seismic motion (the difference between single dates) was extracted (
Figure 16a). The consistency with a single differential interferogram (24 October 2020–30 October 2020; ascending track 131) from other GEP services, specifically the P-SBAS service (in IFG mode), can be appreciated. Although this remains a unique case due to its relatively low co-seismic motion, it is an interesting demonstration case for the applicability of advanced EO geodetic imaging techniques (
Figure 16b).
8. Discussion and Conclusions
Recent developments of the SNAPPING family services (IFG, PSI Med, and PSI Full) hosted on the GEP have been presented, providing details on the processing schemes adopted, the service implementation, and the user parameters involved for S-1 advanced interferometric analysis. Built on software packages that have already demonstrated numerous successful investigations related to the geohazards’ applications, it is expected to achieve wide acceptance by the user community.
The inter-verification of the SNAPPING PSI measurements through several qualitative and quantitative comparisons with other operational GEP services, namely P-SBAS, was performed showcasing the performance of the service in both urban and natural terrain environments. For the great majority of nearby detected points, differences between the services lie within the measurement uncertainty of the technique. Likewise, the noteworthy consistency of time series as derived by the optical inspection of the results underlines the robustness of the solutions. Keeping in mind the different nature of measurements between the two approaches, especially over non-urban areas, not actually representing the same objects, could explain the higher observed deviation for part of the datasets. Thus, their complementarity when mapping surface motion should be taken into consideration.
It has been shown that SNAPPING is capable of detecting, apart from seasonal variability, more complex temporal motion patterns. Restrictions on the highest detectable motion are not specific for the services themselves, but concern limitations of the SAR wavelength (C-band for S-1), as well as the physical limits of the InSAR technique. Based on the performed runs herein, without further dedicated analysis, the highest motion rate observed by SNAPPING is in the order of −180 mm/yr in Mexico City. It is widely accepted though that by increasing the observation period—a minimum of three years is commonly considered—we ensure a more accurate solution, especially for regions exhibiting low motion rates.
Even though they are robust, SNAPPING PSI Med services such as the P-SBAS gridded solution cannot be used to accurately associate motion with specific infrastructures. The spatial averaging, applied not only to velocity estimates but also to point locations, is a limiting factor for this kind of investigation. For such cases, the SNAPPING PSI Full service is the indicative solution. Although algorithmically there is no substantial difference between the two medium and full resolution SNAPPING services, the design of the services is such to allow for the saving of time and processing resources.
The very structure of the services offers additional benefits to the user. Their implementation on the GEP is such that it allows the execution of both PSI Med and Full services by utilizing the same locally stored interferometric stack; the IFG service practically runs only once. This above fact allows for an initial rapid wide area overview through SNAPPING PSI Med, followed by more focused efforts based on the full resolution PSI analysis with the SNAPPING PSI Full service. A similar procedure was adopted for mapping the surface motion over a large number of cities worldwide [
45]. The expected underestimation of motion by SNAPPING PSI Med compared to PSI Full, being more pronounced for high motion gradients, can be attributed to the averaging of neighboring point scatterers.
A baseline performance assessment was also performed, mainly in terms of processing time, showing acceptable figures, yet further improvements are expected in future releases. Nevertheless, having such a chain integrated into a cloud processing environment enables EO practitioners to respond to the ever-increasing volume of satellite data and the high computational requirements. Taking advantage of the easy access to satellite data and the computing power of the platform facilitates the processing of wider areas, as well as the systematic update of surface motion measurements, addressing, e.g., monitoring requirements for disaster risk reduction.
Still, part of the performance of the services is related to the success rates of job execution on the platform. To this extent, the upgrade of different service components, meanwhile reducing as much as possible the dependencies on external repositories (orbits, DEMs, etc.), was aimed at improving those aspects, offering a more reliable service to users. Towards this direction, internal platform operations were re-configured accordingly to meet service requirements for an enhanced user experience. Upon user request, the SNAPPING service is also supported by pre-caching on the platform resources of S-1 SLC data collections to ensure the undisruptive use of imagery, avoiding issues due to the temporal unavailability of data from external dissemination sources.
In terms of responding to users’ suggestions, splitting large CSV files into multiple smaller parts or delivering results in higher compression formats is being examined, together with additional approaches for atmospheric signal compensation. Likewise, the SNAPPING Visualizer output shall be also enriched with the statistical properties of motion, the presentation of results on various backgrounds, and the option for the direct plotting of displacement time series for inspection purposes. The option for running the services in a fully unsupervised manner for monitoring purposes (i.e., regular updates on defined time intervals) is considered as a priority on the to-do list. Further planned developments include a motion decomposition service for combining ascending and descending geometries, time series breakdown, and automatic reporting tools. Lastly, foreseen platform evolutions include the dynamic scalability of the processing resources. Such a new processing framework will utilize the underlying cloud resources in a more efficient way to maximize parallel job submissions, considerably reducing completion times.
The observed consistency between the different advanced InSAR-hosted services, on the one hand, contributes to users’ acceptance of EO-based techniques and their operational capabilities and, on the other hand, underlines the robustness of unsupervised cloud-based solutions. The simplifications of accessing the EO data and tools resolve to a large extent past the prerequisites, demanding expert knowledge in executing sophisticated algorithms. This shall allow EO practitioners and domain experts to concentrate on the interpretation of the results and the building of tools for higher-level actionable products for serving and improving scientific contributions to decision-making schemes. The recent expansion of the GEP offering to include operational service packs, together with the on-boarding of GEP services on the Network of Resources (NoR) marketplace, paves the ground towards a new phase of community engagement activities, allowing interested users to directly request the utilization of services or to seek sponsorship for accessing them.
