Technical Note

ExtractEO, a Pipeline for Disaster Extent Mapping in the Context of Emergency Management

ICUBE-SERTIT, Université de Strasbourg, 67412 Illkirch Graffenstaden, France
*
Author to whom correspondence should be addressed.
Remote Sens. 2022, 14(20), 5253; https://doi.org/10.3390/rs14205253
Submission received: 28 June 2022 / Revised: 12 October 2022 / Accepted: 18 October 2022 / Published: 20 October 2022

Abstract

:
Rapid mapping of disasters using any kind of satellite imagery is a challenge. The faster the response, the better the service is for the end users who are managing the emergency activities. Indeed, production rapidity is crucial whatever the satellite data in input. However, the speed of delivery must not be at the expense of crisis information quality. The automated flood and fire extraction pipelines, presented in this technical note, make it possible to take full advantage of advanced algorithms in short timeframes, and leave enough time for an expert operator to validate the results and correct any unmanaged thematic errors. Although automated algorithms aren’t flawless, they greatly facilitate and accelerate the detection and mapping of crisis information, especially for floods and fires. ExtractEO is a pipeline developed by SERTIT and dedicated to disaster mapping. It brings together automatic data download and pre-processing, along with highly accurate flood and fire detection chains. Indeed, the thematic quality assessment revealed F1-score values of 0.91 and 0.88 for burnt area and flooded area detection, respectively, from various kinds of high- and very-high- resolution data (optical and SAR).

Graphical Abstract

1. Introduction

The provision of geospatial information covering an ongoing catastrophic event can be crucial for crisis managers to locate and measure the scale of a disaster, especially for widespread disasters. With climate change, both flood and fire mega-disasters are becoming far more common and intense, affecting vast areas. Often, due to weather patterns, many events can occur simultaneously. Simultaneously, satellite systems are greatly expanding their capabilities, leading to potentially very frequent, high- to very-high- resolution acquisitions. Hence, there is a major challenge to map many disasters and to map them frequently over vast areas. This means handling huge volumes of heterogeneous satellite data.
The processing and analysis of vast volumes of satellite imagery acquired just after or during a disaster requires methods and tool development to not only deal with the volume of event-associated data, but also to meet the increasing speed of delivery demands of crisis management actors. Indeed, reducing the time to map flooded or burned areas is a major issue for civil protection agencies and, consequently, for service providers with this parameter who often determine the added value of the information provided. The purpose of this technical note is to introduce ExtractEO (EEO), a pipeline sized to rapidly map widespread disasters on an industrial scale. Through pipelines like this, service providers can map mega-disasters over vast areas at high resolutions and speeds, providing unequalled service to emergency managers.
ICube-SERTIT’s Rapid Mapping Service (RMS) has specialized in the rapid delivery of crisis information derived from Earth Observation (EO) since the early 2000s [1,2,3,4,5,6]. SERTIT’s RMS works within many frameworks, which most notably include: the Copernicus Emergency Management Service-Rapid Mapping (CEMS-RM) (2015) for the European Commission’s Joint Research Centre [7], with e-GEOS as Prime; the International Charter Space and Major Disasters (2001) for and on behalf of the CNES for the needs of French Civil Security and a number of Francophone authorized users; insurance industry companies; and local/regional authorities. SERTIT is involved in both crisis activation management and geo-information production.
In order to ensure an operational 24/7 front room, it is necessary to manage the availability of personnel, as well as team training on tools, methods, and protocols. The RMS follows this through a Quality Management System to make sure the service satisfies evolving user/client needs and continuously improves. Depending on the Service Level Agreement, the RMS needs to deliver rough estimates within 2–3 h, and finalized higher detail products within 7–9 h, from image reception and quality acceptance.
Indeed, SERTIT works tirelessly to improve and streamline workflows, algorithms, and methods, with an eye to widening the product portfolio and an intense focus on meeting user requirements. At present, to speed up the service, SERTIT is introducing previously tried and tested automated methods that integrate Machine Learning and automated sampling into image processing and information extraction pipelines.
In this note, we will look at how these automated methods are being improved within the particularly demanding application domain of rapid mapping. SERTIT’s EEO pipeline provides flood and fire extraction methods in the optical and SAR domains that help to produce crisis information layers over vast areas in a matter of minutes on a standard computer.
EEO’s approach is similar to the operational ESA Charter Mapper [8] developed to better support rapid mapping in the framework of the International Charter. Indeed, both applications are able to ingest a huge number of sensors in a standardized processing environment, including thematic chains.
Both flood and fire automatic mapping are widely covered in the literature. For example, SAR-based flood detection is itself a huge topic. In the Copernicus Global Flood Monitoring service, the implemented algorithms based on Sentinel-1 data are referenced and well described [9,10,11]. Regarding burnt areas, the algorithm developed by CIMA for Sentinel-2 automatic processing is fully described in a dedicated article [12]. The level of description of the thematic algorithms integrated in EEO will be lower in this technical note, a note which also covers the description of the operational pipeline required to implement global, multi-sensor, and multi-resolution thematic chains.
In the last few years, SERTIT has developed and operationally implemented a Sentinel-2- and Landsat-8-based fire mapping pipeline that sources the imagery and extracts burnt areas. The system requests the optimal days from which to extract the burnt area layer. The layers are then rapidly verified by experienced operators before integrating crisis mapping databases and delivery to users. This pipeline was applied to vast areas in eastern Australia during the 2019–2020 fire season to test the system, and was well suited to mega-fire mapping.
EEO’s flood and water body mapping pipelines can cover vast areas by ingesting any type of optical or SAR data, and uses the Global Surface Water (GSW) [13] layer to automatically provide adapted samples before automatically providing floodwater layers to validate. Deep time series are also processed to provide lake water extent curves.
This paper will present the current architecture of EEO, the algorithms and performances of both thematic processing chains, and possible perspectives for improvement in the near future.

2. Materials and Methods

2.1. Data

In rapid mapping, it is always important to have access to various sensor types, resolutions, and satellites. Indeed, SAR sensors detect through clouds, while optical sensors benefit from of multi spectral bands to better classify the crisis information.
The wide range of available resolutions means the operator can select the best one for the assigned task, which include: Medium Resolution (MR) sensors, with a pixel size greater than 30 m, which are perfect for a rough, but quickly generated (2 h for the First Estimate Product in the CEMS-RM portfolio) crisis map; High Resolution (HR) sensors, with a pixel size between 30 and 4 m (such as Sentinel-1/2 and Landsat-8), which are very pertinent in delineating large to medium sized floods and fires; and Very High Resolution (VHR) sensors, with a pixel size below 4 m, which are more suitable for accurate event delineation and damage assessment mapping.
It is also very important to have several data sources for every resolution range, in order to maximize the chance of covering the monitored area, which are dependent on:
  • the availability of the satellites (they can be used for other purposes, such as military),
  • the overflight feasibility analysis (which depends on satellite orbit and agility),
  • the cloud cover over the scene at the acquisition time for optical data.
The delay until the next acquisition is also optimized and reduced by multiplying potential data sources, thus increasing the chance of passing over the monitored area.
The ESA Data Access Portfolio (DAP) [14] describes more than 25 sensors, and covers the main sensors used in SERTIT’s rapid-mapping service through CEMS (Copernicus missions or contributing missions) or the International Charter (members). The ESA DAP is quite complete with both SAR and optical sensor types, with resolutions from less than one meter to decametric sensors, which cover all the use cases encountered. The two following tables (Table 1 and Table 2) describe all the constellations handled by EEO.

2.2. Objectives

The main goal of the EEO software is to answer all rapid-mapping challenges to the best of its ability. First of all, the chains have to support all the data provided during RM activations, which means handling a wide variety of sensor types, resolutions and data, which are disseminated differently from one satellite product to another. Regarding Sentinel-1/2 data, the download is included in the pipeline, regardless of the size of the area or the time series.
There is a special focus on managing thematic products that can be automatized. This can differ from one sensor to another. For example, it is easy to delineate fire areas when SWIR bands are available (Sentinel-2), but becomes trickier when only a classic RGBNIR stack is provided (SPOT6/7). Some themes are also harder to map than others. For example, landslide mapping is very contextual, while flood mapping is more easily handled.
But the most important constraint of these chains is to deliver reliable insights to the experts in a short time. Indeed, the goal is that the operator spends as little time as possible in thematic extraction, saving time for the analysis phase. To achieve this, the chains have to be fully automated, from downloading data, to the thematic extraction into vector packages, in addition to dedicated, rapid-mapping delivery. They need to be as fast as possible, without losing their thematic reliability. Last but not least, they should be as user-friendly as possible, to ensure that the operators will use them without losing time.
In addition to answering the rapid-mapping challenges, having fully automatic end-to-end chains ensures a normalized and reproducible work environment shared by operators, and reduces the subjectivity of the thematic mapping.

2.3. ExtractEO Architecture

2.3.1. EOReader

The assumption was made that all the spectral bands from optical sensors could be mapped between each other, in addition to the natural mapping between SAR bands, as shown in Figure 1. This is why SERTIT decided to decouple the sensor handling from the extraction algorithms: they should be able to ingest semantic bands (i.e., RED or VV), without worrying about how to load the specific sensor band, or determine what unit it is. This brings a lot of benefits:
  • the algorithm (and its developer) can focus on its core tasks (such as extraction), without needing to account for the sensor characteristics (how to load a band, which band corresponds to which band number, etc.),
  • the addition of a new sensor is effortless and requires no algorithm modification,
  • maintenance is simplified and the code quality is significantly improved,
  • testing is simplified, as the sensor-related parts are tested in the EOReader library.
The python open source library EOReader [15] has been designed according to these previous principles, and to answer to CEMS-RM activation challenges, which are the multiplicity of sensors and CEMS products that need to be rapidly delivered. The EOReader handles both optical and SAR sensors, as well as loads and stacks spectral and radar bands, cloud bands, Digital Elevation Models (DEMs), and spectral indices in a sensor-agnostic manner. Of course, the EOReader follows software engineering best practices, such as code documentation, code reviews, python coding standards, and unit testing.
Figure 1. Optical band mapping in EOReader (version 0.15.0). Available in full resolution at [16].
Remotesensing 14 05253 g001

2.3.2. ExtractEO Generic Workflow

EEO is a software implementing fully automated, end-to-end satellite data processing chains. Its plugin-oriented design enables easy maintenance (module-by-module) and easy evolution (removing and adding modules shouldn’t affect others). Every module should implement core functions that are run in a predefined order by the EEO runner. EEO first splits the work into areas (AOI, Sentinel-2 tiles, etc.) which are themselves split into the individual constituent satellite products. This workflow is summarized in Figure 2. The design paves the way for parallelized and distributed computing. The chains are configured through a configuration file, enabling the operator to use predefined chains or create/customize chains, in order to fine-tune module configuration according to the monitored area. So even if the chains are fully automated, the operator can still bring expertise to bear that ensures better results, thanks to fine-tuning.
EEO is managed through Gitlab, and was released through Docker to ensure up-to-date software that works the same way on every computer.

2.3.3. ExtractEO SaaS

EEO has also been deployed as a Software as a Service (SaaS), in order to make it available through a web browser that simplifies the user experience and allows people outside of SERTIT to use it. The home web page is illustrated in the Figure 3.
The parameters and the number of sensors managed are reduced. Indeed, the SaaS focuses solely on Sentinel-1 and Sentinel-2 automatic download and processing. The SaaS component of EEO was built to be shared with rapid-mapping partners and, eventually, to be sold to customers through a service subscription. Three chains are available: SAR water, optical water, and fire, based on optical imagery. The user just has to fill in parameters, with an example shown below from the Sentinel-2 optical flood detection chain:
  • Area of Interest
  • Start date
  • End data
  • Extraction resolution
  • Minimum mapping unit
  • Visualization stack (true color, false color, SWIR)
  • Visualization resolution
The user can track the processing status, and can download the event delineation masks output directly from the website.
The SaaS is a cloud-native solution hosted by the University of Strasbourg’s Data Center, where distributed computing has been enabled using open source, state-of-the-art technologies like Docker, Celery, RabbitMQ and PostgreSQL to orchestrate distributed jobs.
Initially, the SaaS component of EEO was an internal service among the CEMS-RM consortium, in order to provide all partners with the ability to process huge volumes of EO data over widespread disasters. Now that the platform is operational, it has the potential to become an independent fee-paying service. The implementation of other EO sources is not foreseen for the moment, because EEO SaaS is designed to cover large areas with the download function included.

2.4. Fully Automated End-to-End Chains

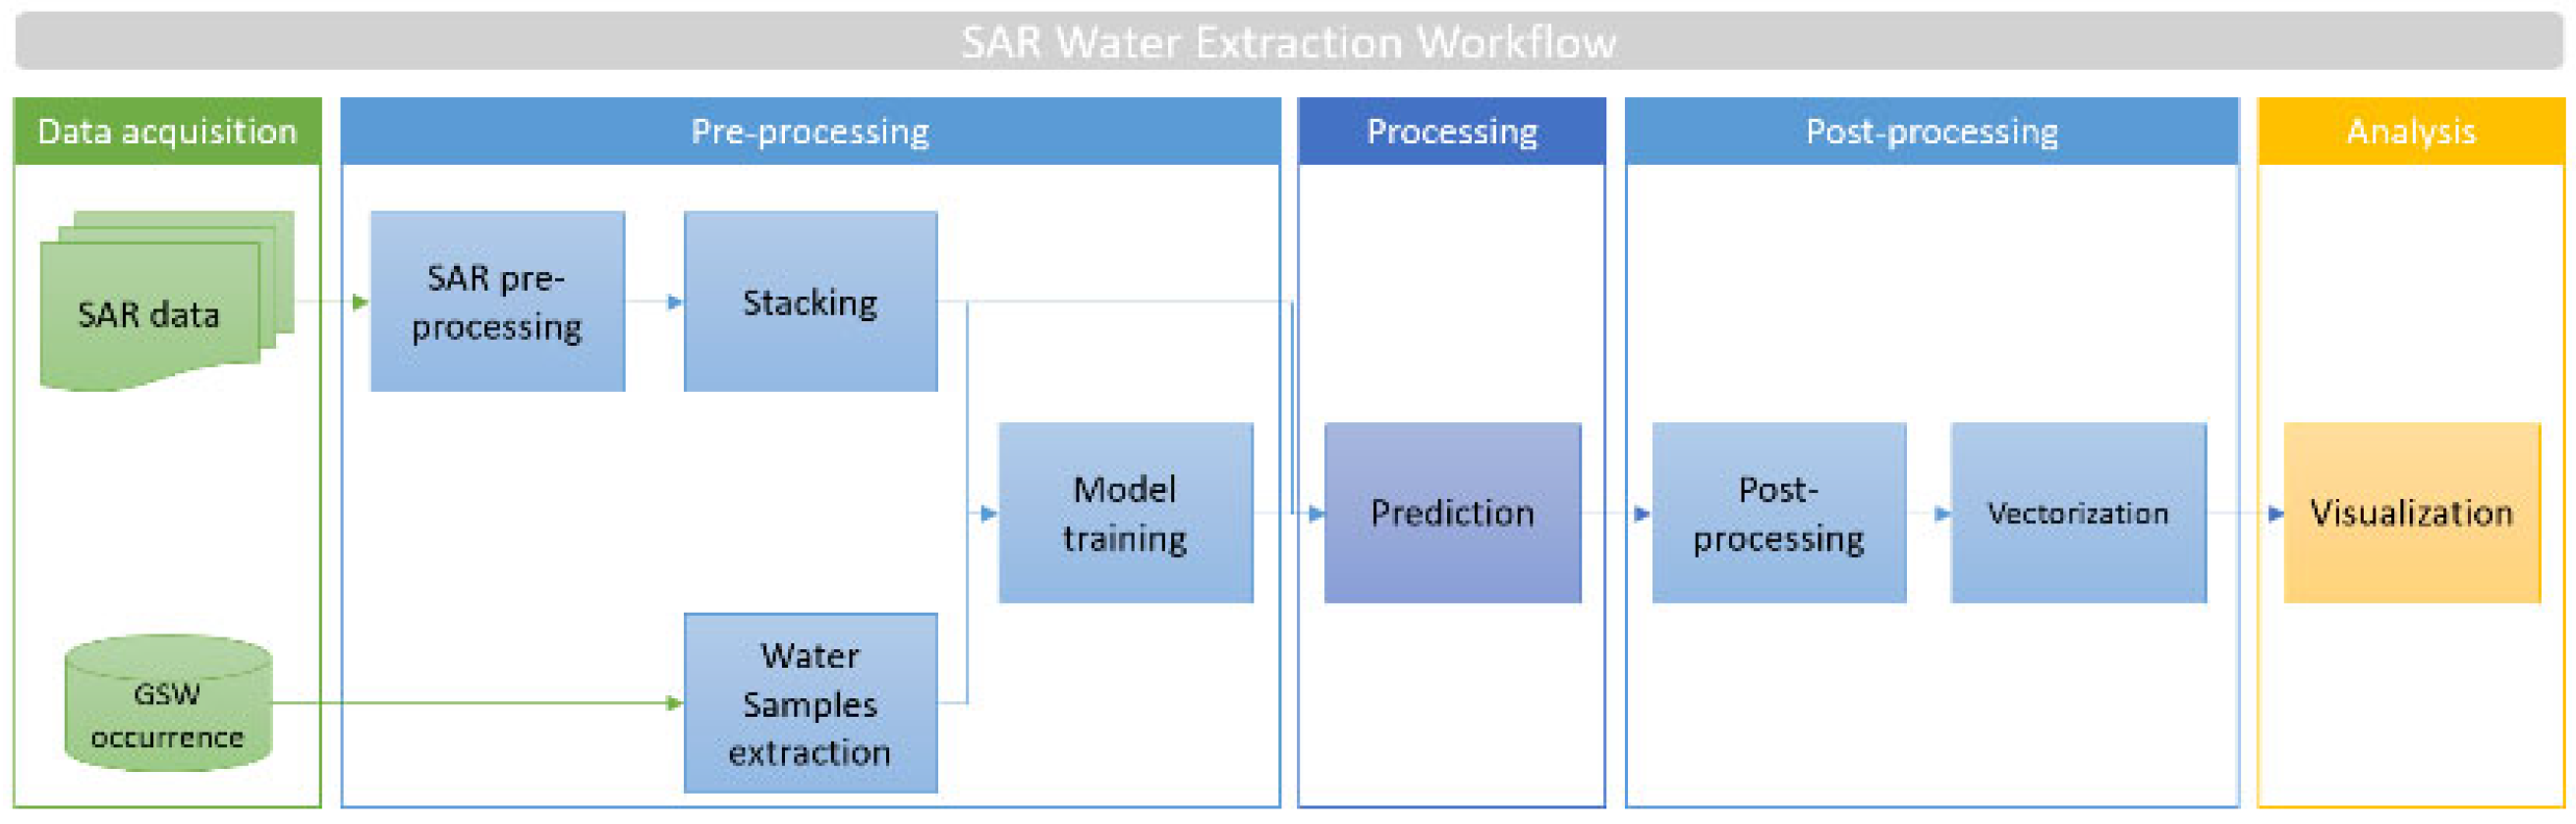
2.4.1. Flood and Water Body Mapping Pipeline

The water extraction chain processes optical or SAR data. The workflow is almost the same for both those EO input types. As input data, GSW is used to derive samples for the classification process.
The optical workflow illustrated in Figure 4 presents the different steps:
  • Data Acquisition
    • Optical data download through EEO (Sentinel-2/3, Landsat-5/7/8/9) or other sources;
    • GSW occurrence product download over the area covered by the optical data;
  • Pre-processing
    • Spectral index computation derived from the optical data: MNDWI, AWEInsh, AWEIsh, WI [18];
    • Stack relevant spectral indices and bands for training;
    • Cloud extraction from the optical data;
    • Water sample generation from the GSW, using an occurrence value (which is relatively low for flood mapping and high for water body mapping);
      Water samples are filtered using the cloud mask generated by EEO, and the indices are computed to remove outliers and filter the training samples to the hydrological reality of the image (water extent, resolution);
    • Training, using the Multi-Layer Perceptron classifier by default. After internal trials, this algorithm appears to be the most reliable classifier for water detection on big stacks. However, the training method can be chosen among other classifiers that are implemented, such as Random Forest or Support Vector Machine, for project needs;
  • Processing
    • Prediction of a trained model over a stacked image;
  • Post-processing
    • Slope and hillshade thresholds derived from HR DEMs are applied to refine the water extraction (post-processing);
    • Mosaicking of the results coming from several tiles with the same date and projection;
    • Minimum mapping unit (MMU) sieving to remove small features and fill holes;
    • Vectorization step in all classic formats, including GeoJSON, ESRI Shapefile, or Keyhole Markup Language (KML);
  • Visualization
    • A second stack may be included in the output folder with a separate stack of bands/indices, with a different resolution than the training/predicted stack, and used only for visualization purposes. This step is relevant when large areas are covered with the need to decrease the resolution in order to display and navigate quickly with the optical data as a background.
Most of the modules can be run with different parameters, but a generic configuration is set by default. As illustrated in Figure 5, the SAR workflow is very similar to the optical workflow. The default training stack includes either the raw amplitude, or the output of a despeckle process. The water sample filtering step is not included in the SAR workflow. The preferred machine learning method is Random Forest, as it has been proven to be more robust on thin stacks, and SAR offers less usable bands.

2.4.2. Burnt Area Mapping Pipeline

The approach is different from the water chain. This pipeline (Figure 6) is dedicated solely to optical images with SWIR bands, and has been initially developed through the ASAPTERRA project [19]. The fire mapping guidelines from the International Working Group on Satellite-Based Emergency Mapping (IWG-SEM), which are available online [20], are followed.
The fire extraction workflow illustrated by Figure 6 presents the different steps:
  • Data Acquisition—the burnt areas are derived from a change detection method by processing both post- and pre-event images;
  • Processing:
    • Two models based on the pre- and post-NBR (Normalized Burn Ratio) and BAI (Burned Area Index) indices are computed to derive a potentially burnt area mask.
    • Then, zonal statistic operations are applied and features are filtered to reduce false positives using NIR and SWIR post-event bands, and the NBR and BAI for Sentinel-2 [21] indices;
  • Post-processing
    • Mosaicking of the results coming from tiles with the same date and projection;
    • Minimum mapping unit (MMU) sieving to remove small features and fill holes;
    • Vectorization step in all classic formats, including GeoJSON, ESRI Shapefile, or Keyhole Markup Language (KML).
The operator only has to choose the pre-event data (and the processing resolution). The reference image selection is a crucial step in this methodology. The results are enhanced when images are fairly close chronologically, or have vegetation in a similar state (the same season).

3. Results

3.1. Event Delineation Masks

Both flood and fire detection chains should produce delineation masks that are almost ready to be published. A perfect chain that produces 100% reliable and complete delineation masks that would remove human validation is the final goal. However, the algorithms are not infallible, and validation by an expert is still mandatory. Moreover, a manual refinement is often necessary to remove wrongly detected features that would not be understood from the user point of view (e.g., ‘flooding’ located in a high relief area, far from hydrologic features). Indeed, the expected quality of delineation maps from the CEMS users is very high and goes beyond the computed thematic accuracies. A few wrongly classified pixels can discredit an entire rapid-mapping service or activation. The automatic vector in the output is manually refined by an operator expert in a GIS software by overlaying the extracted features, the post-event image used for the detection, the pre-event image, and a DEM (or derived slope). Missing flooded areas are added to the flood mask, and land areas wrongly classified as water are removed.
The thematic quality of the automatic outputs of both flood/fire chains was assessed through a relative thematic accuracy approach comparing them to the final delineation layers published in CEMS-RM. Indeed, the changes in surface comparing the automatic outputs to the final published vectors was the key performance indicator (KPI) to assess the quality of the algorithms implemented in ExtractEO. The associated processing time was also very important to leave enough time for manual refinement in the production workflow. Beyond the traditional F1 Score measure, the Critical Success Index (CSI) was also computed. Both combined precision and recall, but the CSI was more severe. A CSI above 0.7 is considered as a good basis on which to significantly limit the refinement job [22].
The results of the quality assessment of the event delineation masks (flood, fire) produced by EEO are presented in Table 3. Among the 13 products validated, only two presented a CSI value below 0.7, but were very close (0.65 and 0.69). Only one had an F1 score below 0.8 (0.79 for the Pléiades processing). Processing VHR images was more challenging, but the scores were not directly correlated to the resolution. The performances of the SAR imagery flood processing chain were satisfactory, as false detection due to topography, permanent low backscatter, or urban areas was limited. The global mean scores were 0.82, 0.90, 0.91 and 0.88 for the CSI, F1 score, precision, and recall, respectively. The classifications’ overall accuracies were well balanced with similar precision and recall mean values. The CSI and F1 score mean values were very good and demonstrated that the EEO considerably limited the operator refinement process, which can be long and prone to error through stress and night-time tiredness. Looking deeper into the performance scores, the burnt area algorithm out-performed the flood algorithm, with CSI/F1 score mean values of 0.84/0.91 compared to 0.79/0.88. The robustness, rapidity, and quality of the results characterize the huge added value of the EEO in rapid-mapping production, being fit-to-purpose with respect to demanding CEMS-RM product specifications [23]. Beyond being time-saving (which was difficult to measure, because it depended on the size of the event, the type and resolution of the input data, the thematic complexity, and other factors), the results were harmonized by using the same methodology for whoever was running EEO. Thematic continuity was thus ensured, for example, in two areas of interest processed by different operators.

3.2. Megadisaster Mapping

EEO enables regional-scale flood and wildfire mapping using high resolution data. Indeed, widespread delineation mapping is fit-to-purpose for mega-fires and mega-floods, which are characterized by their intensity and size. The use of medium resolution sensors would be relevant to cover such large areas, but the challenge here was to map the whole event with high resolution data. A mega-disaster product has similar quality specifications to those covering smaller-scale events. This approach required high computing power to process big volumes of data, notably, Sentinel 1&2 images, which were very suitable data for large-scale mapping, by offering free and open, high-resolution data covering large areas, with a high revisit frequency. This last aspect was very important to not only cover the event, but also to monitor the extent over time, especially for mega-fires, which can be very dynamic, due to ever-changing meteorology, fire-event meteorology, duration, and uncontrollability. Three mega events were processed through EEO to test its scalability.
Australia’s 2019–2020 ‘Black Summer’ mega-fire burnt more than 20 million hectares. A prototype of a mega-disaster map produced over this event is presented in the Figure 7. Processing details of this mega-fire mapping and of two massive flood events are reported in Table 4. Regarding the Australian event, the AOI size was 315,000 km² and was covered by two Sentinel-2 swaths. EEO ran on 51 Sentinel-2 tiles that intersected one strip. All the following processing steps were completed in 1 h and 9 min:
  • Download of the 51 × 2 S2 tiles (pre and post-event);
  • Burnt area detection at 20 m resolution;
  • Cloud detection at 20 m resolution;
  • Minimum Mapping Unit application (1 ha);
  • Image stack and mosaicking for visualization and validation;
  • Vectorization of the burnt areas and clouds.

3.3. Water Surface Time-Series

Climate change has had a huge impact on water resources, and may increase the number and the intensity of flood events. Essential Climate Variables (ECV) are defined by the Global Climate Observing System to characterize and monitor the Earth’s climate [24]. Lake Water Extent (LWE) is one of the ECVs that was monitored through EEO. Indeed, lakes are sentinels of climate change [25].
Lake Fitri, located in the semi-arid zone of Chad within the Sahelian band, is a flat-bottomed lake with high intra- and inter-annual variability, related to the fluctuations of the West African monsoon, which are expressed in Lake Fitri by fluctuations of great amplitude in the surface area of open water and in the depth of the lake, on all time scales (from one season to several millennia). In recent decades, since the lows of the 1970s–1990s droughts, open water and swamp areas have doubled and stabilized since the early 2000s [26,27].
The EEO pipeline downloaded 299 Sentinel-2 images acquired from 2017 to 2021 covering Lake Fitri. The lake surface was calculated on each exploitable date (i.e., no clouds over the lake) from all lake masks. Then, the results fed the LWE curve illustrated in Figure 8. The variations of the lake’s surface were impressive, with a minimum surface of 194 km² and a maximum surface of 1249 km² over the observed period. Moreover, the dynamics of the water surfaces were similar for the years 2017, 2018, and 2019. In 2020, the huge rise in the LWE was significant, as the 2020 maximum extent corresponded to double the maximum LWE observed during the three previous years.
Occurrence products were also derived from the lake masks, including annual occurrence (illustrated in Figure 9 for 2020) and overall occurrence over the 4-year observation period. These maps were very useful in helping to understand the lake’s inter- and intra-annual dynamics, with the results offering very rich information for the study and management of this lake. A regular monitoring of Lake Fitri’s LWE variation, in addition to rainfall, would provide excellent indicators of climate trends in this poorly studied region, as well as stresses on the resources in the context of population growth and stability/security. This was a success for EEO in terms of automatically deriving high quality water and cloud masks over a time series (from Sentinel-2 and Sentinel-1), computing areas to build a LWE monitoring curve and, compiling occurrence products. Details and maps are available through a dedicated ArcGIS Story Map [28].

4. Discussion and Research for the Future

At present, ExtractEO is mature enough to be a key rapid-mapping production tool, especially in the context of climate change, food security and disasters that are becoming more frequent, intense, and widespread. The processing time, the thematic quality, the robustness, and the multi-sensor approach are major assets of EEO, enabling SERTIT to respond to the growing rapid-mapping production requests from CEMS, the International Disaster Charter, or any other domain, including food security. Fires and floods are the most common events, and EEO is valuable in dealing with these. In fact, the thematic quality assessment performed through comparing EEO automatic results with published CEMS vectors gave very good results, with mean F1 score values of 0.91 and 0.88 for burnt areas and flooded area detection, respectively. Algorithm reliability and IT infrastructure facilitate ramping up to cover very large areas, in the case of mega-events or long time series that emphasize dramatic changes to water resources. The automatic results were not perfect, but considerably limited any manual refinement. The architecture of EEO enables the addition of any thematic chain. Clouds and landslide mapping are also managed. The perspectives can be encapsulated in three main points. First of all, there is the need to keep increasing the integration of new satellite constellations as they appear and are used in CEMS. Then, there is the need to improve computational speed by going deeper into clustering and parallelization. Tools like Dask, Apache Airflow, Apache Spark are currently being considered. Finally, there are several deep learning methods in the testing phase, awaiting the approval for production work, such as urban flood extraction, or landslide and fire mapping with fewer spectral bands.

Author Contributions

Conceptualization, R.B., M.C., J.M.; Methodology, J.M. and M.C.; software, R.B.; validation, J.M.; writing—original draft preparation, S.C.; writing—review and editing, J.M. and R.B. All authors have read and agreed to the published version of the manuscript.

Funding

This work has been funded by SERTIT and in part linked to SERTIT’s Copernicus EMS Rapid-mapping mega-disaster product development.

Data Availability Statement

CEMS RM layers can be downloaded directly though the CEMS portal (https://emergency.copernicus.eu/ (accessed on 1 October 2022)). EEO’s results presented in this note are available upon request from the first author for six months after the publication of this note.

Acknowledgments

The fire detection algorithm has been improved by Vitoria Barbosa Ferreira, in the framework of her summer internship in 2021.

Conflicts of Interest

The authors declare no conflict of interest.

References

  1. Allenbach, B.; Andreoli, R.; Battiston, S.; Bestault, C.; Clandillon, S.; Fellah, K.; Henry, J.-B.; Meyer, C.; Scius, H.; Tholey, N.; et al. Rapid EO disaster mapping service: Added value, feedback and perspectives after 4 years of charter actions. In Proceedings of the IGARSS ’05, 2005 IEEE International Geoscience and Remote Sensing Symposium, Seoul, Korea, 25–29 July 2005; pp. 4373–4378. [Google Scholar] [CrossRef]
  2. Maxant, J.; Proy, C.; Fontannaz, D.; Clandillon, S.; Allenbach, B.; Yésou, H.; Battiston, S.; Uribe, C.; De Fraipont, P. Contribution of Pleiades-HR imagery for disaster damage mapping: Initial feedback over Asia, Africa, Europe or the Caribbean. In Proceedings of the 33th EARSeL Symposium, Matera, Italy, 3–6 June 2013. [Google Scholar]
  3. Huber, C.; Battiston, S.; Yésou, H.; Tinel, C.; Laurens, A.; Studer, M. Synergy of VHR pleiades data and SWIR spectral bands for flood detection and impact assessment in urban areas: Case of Krymsk, Russian Federation, in July 2012. In Proceedings of the IEEE International Geoscience and Remote Sensing Symposium-IGARSS, Melbourne, Australia, 21–26 July 2013; pp. 4538–4541. [Google Scholar] [CrossRef]
  4. Herve, Y.; Francesco, S.; Nadine, T.; Antonios, M.; Stephen, C.; Claire, H.; Mathias, S.; de Paul, F. Adressing emergency flood mapping and monitoring of inland water bodies with Sentinel 1-2. Expectative and perspectives. Paper conference. In Proceedings of the Living Planet Symposium 2013, Edinburgh, UK, 9–13 September 2013; Volume ESA SP-722. [Google Scholar]
  5. Giraud, H.; Allenbach, B.; Tholey, N.; Battiston, S.; Đệ, P.; Proy, C.; Fontannaz, D. More than fifteen years of experience in natural disaster mapping in the context of emergency management support. In Proceedings of the IGARSS 2014-2014 IEEE International Geoscience and Remote Sensing Symposium, Quebec City, QC, Canada, 13–18 July 2014; pp. 2709–2711. [Google Scholar] [CrossRef]
  6. Nadine, T.; Stephen, C.; Lucia, L.; Jérôme, M.; Stéphanie, B.; Hervé, Y. Exploitation of Sentinel-1 Data for Flood Mapping and Monitoring within the Framework of the Copernicus Emergency Core and Downstream Services. In Proceedings of the IGARSS 2019-2019 IEEE International Geoscience and Remote Sensing Symposium, Yokohama, Japan, 28 July–2 August 2019; pp. 5393–5396. [Google Scholar] [CrossRef]
  7. De Groeve, T. Chapter 16—Knowledge-Based Crisis and Emergency Management. In Science for Policy Handbook; Elsevier: Amsterdam, The Netherlands, 2020; pp. 182–194. [Google Scholar]
  8. About the ESA Charter Mapper. 2020. Available online: https://docs.charter.uat.esaportal.eu/about/ (accessed on 16 September 2022).
  9. Generation of the Global Flood Monitoring Product Output Layers. Available online: https://extwiki.eodc.eu/GFM/PDD/GFMoutputLayers (accessed on 16 September 2022).
  10. Twele, A.; Cao, W.; Plank, S.; Martinis, S. Sentinel-1-based flood mapping: A fully automated processing chain. Int. J. Remote Sens. 2016, 37, 2990–3004. [Google Scholar] [CrossRef]
  11. Bauer-Marschallinger, B.; Cao, S.; Tupas, M.; Roth, F.; Navacchi, C.; Melzer, T.; Freeman, V.; Wagner, W. Satellite-Based Flood Mapping through Bayesian Inference from a Sentinel-1 SAR Datacube. Remote Sens. 2022, 14, 3673. [Google Scholar] [CrossRef]
  12. Pulvirenti, L.; Squicciarino, G.; Fiori, E.; Fiorucci, P.; Ferraris, L.; Negro, D.; Gollini, A.; Severino, M.; Puca, S. An Automatic Processing Chain for Near Real-Time Mapping of Burned Forest Areas Using Sentinel-2 Data. Remote Sens. 2020, 12, 674. [Google Scholar] [CrossRef] [Green Version]
  13. Pekel, J.-F.; Cottam, A.; Gorelick, N.; Belward, A.S. High-resolution mapping of global surface water and its long-term changes. Nature 2016, 540, 418–422. [Google Scholar] [CrossRef] [PubMed]
  14. ESA Data Access Portfolio. Available online: https://spacedata.copernicus.eu/documents/20126/0/DAP+Release+phase2+V2_8.pdf/82297817-2b96-d3de-c397-776292336434 (accessed on 19 May 2022).
  15. EOReader. Available online: https://github.com/sertit/eoreader (accessed on 19 May 2022).
  16. EOReader Spectral Band Mapping. Available online: https://eoreader.readthedocs.io/en/latest/optical.html (accessed on 14 June 2022).
  17. ExtractEO SaaS. Available online: https://extracteo.sertit.unistra.fr/ (accessed on 19 May 2022).
  18. EOReader Indices. Available online: https://eoreader.readthedocs.io/en/latest/api/eoreader.bands.indices.html (accessed on 14 June 2022).
  19. Martinis, S.; Clandillon, S.; Plank, S.; Twele, A.; Huber, C.; Caspard, M.; Maxant, J.; Cao, W.; Haouet, S.; Fuchs, E.M. ASAPTERRA—Advancing SAR and Optical Methods for Rapid Mapping. Project Report. 2017. Available online: https://elib.dlr.de/110776/1/ASAPTERRA_FinalReport_2017.pdf (accessed on 8 June 2022).
  20. IWG-SEM Fire Mapping Guidelines. Available online: https://wiki.iwg-sem.org/index.php/Fire_mapping_guidelines (accessed on 18 May 2022).
  21. Huang, H.; Roy, D.P.; Boschetti, L.; Zhang, H.K.; Yan, L.; Kumar, S.S.; Gomez-Dans, J.; Li, J. Separability analysis of Sentinel-2A multi-spectral instrument (MSI) data for burned area discrimination. Remote Sens. 2016, 8, 873. [Google Scholar] [CrossRef] [Green Version]
  22. Target Threshold Critical Success Index of 70–80% for Copernicus Global Flood Monitoring Product. Available online: https://extwiki.eodc.eu/GFM/PUM/UserRequirements. (accessed on 14 June 2022).
  23. CEMS-RM Product Specifications. Available online: https://emergency.copernicus.eu/mapping/ems/rapid-mapping-portfolio (accessed on 5 September 2022).
  24. Crétaux, J.-F.; Merchant, C.J.; Duguay, C.; Simis, S.; Calmettes, B.; Bergé-Nguyen, M.; Wu, Y.; Zhang, D.; Carrea, L.; Liu, X.; et al. ESA Lakes Climate Change Initiative (Lakes_Cci): Lake Products; Version 1.0; Centre for Environmental Data Analysis: Oxford, UK, 2020. [Google Scholar] [CrossRef]
  25. Adrian, R.; O’Reilly, C.M.; Zagarese, H.; Baines, S.B.; Hessen, D.O.; Keller, W.; Livingstone, D.M.; Sommaruga, R.; Straile, D.; Van Donk, E.; et al. Lakes as sentinels of climate change. Limnol. Oceanogr. 2009, 54, 2283–2297. [Google Scholar] [CrossRef] [PubMed] [Green Version]
  26. Yalikun, T.; Raimond, C.; Nagorngar, A.K.; Zakinet, D.; Schuster, M.; Sylvestre, F. Chapitre 5. Variabilité des crues et des paysages du lac Fitri depuis les grandes sécheresses des années 1970–1980. In Le Tchad des Lacs; IRD Editions: Marseille, France, 2019. [Google Scholar]
  27. Raimond, C.; Yalikun, T.; Cretaux, J.F.; Bergé-Nguyen, M.; Schuster, M.; Sylvestre, F. Anticipating the Evolution of the Fitri Lake System: Temporalities of an Overflowing Flood and Its Socio-Ecological Consequences. In Proceedings of the EGU General Assembly 2021, Online, 19–30 April 2021. EGU21-14459. [Google Scholar] [CrossRef]
  28. ArcGIS Story Map on the Fitri Lake Water Extent. Available online: https://storymaps.arcgis.com/stories/4cb5291dbc8f4a75b7254546b11058ee (accessed on 18 May 2022).
Figure 2. EEO generic workflow.
Remotesensing 14 05253 g002
Figure 3. ExtractEO SaaS main page [17].
Remotesensing 14 05253 g003
Figure 4. Optical water extraction workflow.
Remotesensing 14 05253 g004
Figure 5. SAR water extraction workflow.
Remotesensing 14 05253 g005
Figure 6. Fire Extraction workflow.
Remotesensing 14 05253 g006
Figure 7. Prototype of mega-disaster map covering Australia’s 2019–2020 mega-fire.
Remotesensing 14 05253 g007
Figure 8. Lake Fitri LWE curve derived from Sentinel-2 data acquired between 2017 and 2021.
Remotesensing 14 05253 g008
Figure 9. Annual water occurrence (2020) expressed as a percentage of total annual observations (from 1% in light blue to 100% in dark blue).
Remotesensing 14 05253 g009
Table 1. Optical constellations handled in EEO as of June 2022.
ConstellationInstrumentProduct Type/Processing Level
L1C
Sentinel-2MSIL2A
Theia
Sentinel-3OLCIEFR
SLSTRRBT
Landsat 1–5MSSL1
Landsat 4–5TM
Landsat 7ETM
Landsat 8–9OLI + TIRS
PlanetScopePS2, PS2-SD, PSB-SDL1B, L3B
Collect Ortho
SkySatSkySat Camera
Pleiades-NeoPleiades-Neo ImagerSEN, PRJ, ORT
Pleiades
SPOT-6/7
HiRI
NAOMI
Vision-1Vision-1 optical sensorPRJ, ORTP
WorldView-1
WorldView-2
WorldView-3
WorldView-4
QuickBird-2
GeoEye-1
WV60
WV110
WV110
SpaceView-110
BGIS-2000
GIS
Standard, Ortho
Table 2. SAR constellations handled in EEO as of June 2022.
ConstellationProduct Type
COSMO-Skymed 1st GEN
COSMO-Skymed 2nd GEN
SCS, DGM, GEC, GTC
ICEYESLC, GRD
RADARSAT-2SLC, SGF,
SGX, SCN, SCW,
SCF, SCS, SSG, SPG
RADARSAT-Constellation MissionSLC, GRD,
GRC, GCC, GCD
Sentinel-1SLC, GRD
SAOCOMSLC, ID, GEC, GTC
TerraSAR-X,
TanDEM-X,
PAZ SAR
SSC, MGD, GEC, EEC
Table 3. EEO performances (automatic extraction compared with CEMS products).
CEMS-RM ProductEO Data
(GSD, Area)
Processing
Time *
CSI F1 ScorePrecisionRecall
EMSR567: Floods in Queensland, Australia in 2022
AOI 14NOWRA
COSMO-Skymed
(3 m, 1634 km²)
20 min0.950.970.960.98
EMSR564: Tropical Cyclone Batsirai in Madagascar in 2022
AOI 01TSIRIBIHINA
RadarSat-2 SLC
(5 m, 15,207 km²)
31 min0.790.880.930.84
EMSR564: Tropical Cyclone Batsirai in Madagascar in 2022
AOI 05NOSYVARIKA
WorldView-2
(0.5 m, 36 km²)
1 min0.720.840.870.81
EMSR561: Floods in Malawi in 2022
AOI 03NSANJE
COSMO-Skymed
(5 m, 1334 km²)
7 min0.950.980.980.97
EMSR559: Flood in Madagascar in 2022
AOI 03ANTANANARIVO
Pléiades
(0.5 m, 665 km²)
19 min0.650.790.910.69
EMSR545: Wildfire in Andalusia, Spain, in 2021
AOI 01JUBRIQUE
Sentinel-2
(10 m, 15,393 km²)
4 min0.920.960.930.99
EMSR542: Forest fire in Lavrio, Eastern Attica, Greece, in 2021
AOI 01LAVRIO
Sentinel-2
(10 m, 951 km²)
3 min0.910.950.930.98
EMSR541: Fire in Var, France, in 2021
AOI 01GONFARON
Sentinel-2
(10 m, 23,003 km²)
6 min0.850.920.870.98
EMSR535: Wildfires in Albania, in 2021
AOI 02MUNELLES
Sentinel-2
(10 m, 12,034 km²)
3 min0.730.840.890.79
EMSR526: Fire in Rhodes island, North Aegean District, Greece, in 2021
AOI 01PSINTHOS
Sentinel-2
(10 m, 10,553 km²)
3 min0.820.900.940.87
EMSR523: Fire in Sardegna region, Italy, in 2021
AOI 07MACOMER
Sentinel-2
(10 m, 11,659 km²)
3 min0.820.900.940.86
EMSR492: Flood in Landes, France, in 2021
AOI 01MONT-DE-MARSAN
Sentinel-1
(10 m, 42,534 km²)
20 min0.810.890.890.90
EMSR479: Flood in Tabasco, Mexico, in 2021
AOI 02VILLAHERMOSA
Sentinel-2
(10 m, 29,021 km²)
21 min0.690.820.800.84
* Automatic chain run from data pre-processing to results (fire/water/cloud vectors) on a standard workstation (processor: i9-9900K, RAM: 64 GB). The processing time does not include the manual refinement process.
Table 4. Processing details of EEO mega-disaster mapping.
EventAOI Size (km²)EO Data Processing Time *Outputs
Mega-fire
Australia
2019 (EMSR408)
315,000Sentinel-2
51 × 2 tiles
78 Gb
1h00Burnt areas (20 m)
Cloudy areas (20 m)
Post-event image mosaic (100 m)
Mega-flood
Thailand/Cambodia
2019
115,000Sentinel-2
25 tiles
15 Gb
1h04Water surfaces (20 m)
Cloudy areas (20 m)
Post-event image mosaic (100 m)
Mega-flood
Sweden
2020 (EMSR427)
150,000Sentinel-1
4 images
4 Gb
0h47Water surfaces (20 m)
Post-event image (100 m)
* Automatic chain run-time from data download to results (fire/water/cloud vectors & image mosaic(s)) on a standard workstation (processor: i9-9900K, RAM: 64 GB).
Publisher’s Note: MDPI stays neutral with regard to jurisdictional claims in published maps and institutional affiliations.

