Article

Comparing Sentinel-2 and Landsat 8 for Burn Severity Mapping in Western North America

1
S.J & Jessie E. Quinney College of Natural Resources, Utah State University, Logan, UT 84322, USA
2
USDA Forest Service Aldo Leopold Wilderness Research Institute, Rocky Mountain Research Station, US Forest Service, Missoula, MT 59801, USA
3
School of Environmental and Forest Sciences, University of Washington, Seattle, WA 98195, USA
4
Department of Environmental Science and Policy, University of California, Davis, CA 95616, USA
*
Author to whom correspondence should be addressed.
Remote Sens. 2022, 14(20), 5249; https://doi.org/10.3390/rs14205249
Submission received: 19 September 2022 / Revised: 15 October 2022 / Accepted: 17 October 2022 / Published: 20 October 2022
(This article belongs to the Collection Sentinel-2: Science and Applications)

Abstract

:
Accurate assessment of burn severity is a critical need for an improved understanding of fire behavior and ecology and effective post-fire management. Although NASA Landsat satellites have a long history of use for remotely sensed mapping of burn severity, the recently launched (2015 and 2017) European Space Agency Sentinel-2 satellite constellation offers increased temporal and spatial resolution with global coverage, combined with free data access. Evaluations of burn severity derived from Landsat and Sentinel generally show comparable results, but these studies only assessed a small number of fires with limited field data. We used 912 ground calibration plots from 26 fires that burned between 2016 and 2019 in western North America to compare Sentinel- and Landsat-derived burn severity estimates with the field-based composite burn index. We mapped burn severity using two methods; the well-established paired scene approach, in which a single pre- and post-fire scene are selected for each fire, and also a mean image compositing approach that automatically integrates multiple scenes using the cloud-based remote sensing platform Google Earth Engine. We found that Sentinel generally performed as well or better than Landsat for four spectral indices of burn severity, particularly when using atmospherically corrected Sentinel imagery. Additionally, we tested the effects of mapping burn severity at Sentinel’s finer spatial resolution (10 m) on estimates of the spatial complexity of stand-replacing fire, resulting in a 5% average reduction per-fire in area mapped as high-severity patch interiors (24,273 ha total) compared to mapping at the resolution of Landsat (30 m). These findings suggest Sentinel may improve ecological discrimination of fine-scale fire effects, but also warrant caution when comparing estimates of burn severity spatial patterns derived at different resolutions. Overall, these results indicate that burn severity mapping will benefit substantially from the integration of Sentinel imagery through increased imagery availability, and that Sentinel’s higher spatial resolution improves opportunities for examining finer-scale fire effects across ecosystems.

1. Introduction

Mapping the landscape effects of wildfires advanced rapidly over recent decades as technological improvements in remote sensing and computing power synergized with unparalleled data access to enable research and monitoring efforts. Remotely sensed data are used to investigate diverse areas of inquiry, such as fire risk [1], burned area and severity mapping [2,3,4], detection of active fires [5,6], post-fire erosion risk [7], and vegetation recovery [8,9]. Burn severity, or the degree of fire-induced change due to consumption of organic matter [10], is commonly used by managers and researchers to assess the ecological impacts of fire at fine scales and across broad extents [11]. Remotely sensed metrics of burn severity are commonly derived from multispectral satellite imaging platforms [12], with widespread use of Landsat imagery [13,14,15] due to its global coverage, multi-decadal continuity, and open data policy beginning in 2008 [16].
Spectral burn severity indices, such as the differenced normalized burn ratio (dNBR) [11], measure differences in spectral reflectance from pre- and post-fire imagery to detect surface changes, including decreased vegetation cover and moisture, and increased exposure of ash, char, and bare soil [17,18]. Validations of the dNBR and related indices with a commonly used field-based measure of burn severity, the composite burn index (CBI) [11], generally show good correlation within various regions of North America [19,20,21], as well as to independent field measures of burn severity [22], though the strength of the relationship differs between regions and land cover types [15]. Still, the general utility of Landsat-derived burn severity mapping led to its widespread implementation, including the development of national burn severity atlases, such as the Monitoring Trends in Burn Severity (MTBS) program in the United States [23,24] and the Canadian Landsat Burn Severity (CanLaBS) product [14].
Recently, the addition of the Sentinel-2 constellation (hereafter referred to as Sentinel) to the network of Earth observation satellites brings new opportunities to improve burn severity mapping [25]. Consisting of two platforms sharing the same Multi-Spectral Instrument (MSI) sensor, Sentinel is designed to be complementary to the Landsat mission, but has several notable differences that make it appealing for burn severity mapping. When compared to the Landsat 8 Operational Land Imager (hereafter referred to as Landsat), differences include (1) a higher spatial resolution of the bands used for dNBR and related indices (10 m NIR and 20 m SWIR compared to 30 m for Landsat), (2) an increased temporal resolution (combined constellation revisit time average of 3 to 5 days compared to 16 days for Landsat), and (3) a greater spectral resolution (13 spectral bands compared to 9 bands for Landsat). In particular, the higher return interval of Sentinel offers more scene selection options, improving the ability to match phenology between pre- and post-fire images, which is often a challenge in areas with frequent cloud cover or rapid vegetation regrowth following fire [26,27]. Additionally, Sentinel’s higher spatial resolution offers the potential to improve ecological interpretation of heterogeneous burn severity effects that occur at spatial scales finer than Landsat pixels [28,29,30]. These effects include high sub-pixel variability in tree mortality between similar values of remotely sensed burn severity [31], as well as the presence of small unburned areas, termed fire refugia, which are effectively hidden due to the effects of spectral averaging across the scale of a Landsat pixel (i.e., 900 m2) [32,33,34]. Due to the importance that distance to the nearest seed source can have on post-fire forest recovery [2,35,36], detection of small refugia containing surviving seed-bearing trees could alter predictions about recovery following wildfire.
While the MTBS program already announced a plan to begin integrating Sentinel imagery upon availability of a harmonized Landsat and Sentinel dataset [24], to date, no formal analysis of Sentinel’s performance for burn severity mapping has been conducted in the United States or Canada. Regional studies in other parts of the world generally show the suitability of Sentinel for burn severity mapping, including Australia [37,38], Bolivia [39], Greece [25], India [40], Italy [41,42], Mexico [43], Portugal [44], Spain [45,46,47,48], and Siberia [49]. However, the methods used to map and assess burn severity estimates are highly variable, with a limited number of studies directly comparing Landsat and Sentinel using field-validated data. Thus, there is still a need for a broad assessment of Sentinel’s burn severity mapping ability across multiple fires with consistent, field-based measures of burn severity.
Our main objective was to assess the relative accuracy of Sentinel and Landsat for burn severity mapping in western North America using a dataset spanning the largest number of fires and field validation plots of any study to date. Using multiple mapping approaches and burn severity indices, we compared the performance of Landsat and Sentinel by modeling the relationships between remotely sensed estimates of burn severity to a field-based measure, the CBI. As a secondary objective, we also explored the implications of mapping burn severity at a higher spatial resolution with Sentinel, first by comparing the proportion of each fire mapped at a given severity class, and second by estimating the proportion of high-severity patch interiors within each fire.
Using a dataset of 912 CBI plots collected from 26 wildfires across western North America, we compared the performance of burn severity estimates derived from Sentinel and Landsat imagery using several common spectral indices. We created burn severity maps for each fire using two methods: (1) a conventional paired scene approach in which a single scene from before and after a fire are differenced, and (2) a recently developed approach termed “compositing”, in which per-pixel values are computed across a stacked time-series of imagery [50]. In the compositing approach, all clear pixels (i.e., free of clouds and cloud shadows) acquired during a date range of interest are stacked, after which a summary statistic (e.g., mean and median) is computed for each pixel, creating composite images from before and after the fire, which are then differenced. The composite approach is being increasingly used recently [51,52,53], as it eliminates the need for careful a priori scene selection, while retaining similar or better performance to the paired scene approach [50].

2. Materials and Methods

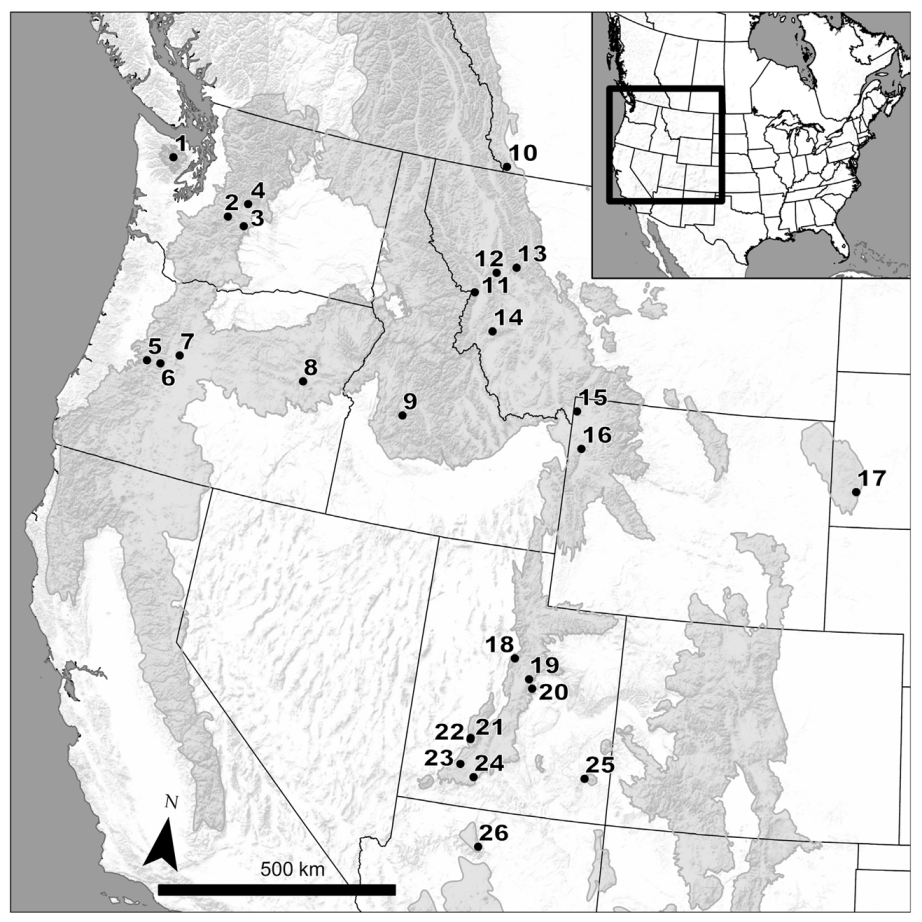
2.1. Study Region and Field Data

The study area comprised fire footprints in montane conifer and mixed-conifer forests of western North America (Figure 1). We included 26 fires that burned between 2016 and 2019, in the US states of Washington, Oregon, Idaho, Montana, Wyoming, South Dakota, Utah, and Arizona, as well as one fire from the Canadian province Alberta. The fires burned across a variety of forest communities, with fire sizes ranging from 91 to 76,572 ha across elevations from 328 m to 3371 m (Table 1).
In order to assess the relative accuracy of burn severity estimates based on imagery derived from Landsat and Sentinel, we gathered composite burn index (CBI) data, a commonly used field-based estimate of burn severity, from several sources (Table 1). CBI data collection follows a standardized procedure for visually assessing burn severity within 30 m diameter plots across five strata (i.e., substrates, herbs and low shrubs, tall shrubs, subcanopy, and upper canopy) [11]. Fire effects specific to each stratum are scored on a continuous scale of zero (unchanged) to three (most severe burn severity), and all strata are then averaged together to obtain an aggregated burn severity estimate for the plot.
The first of two satellites in the Sentinel-2 constellation, Sentinel-2A, were launched on 23 June 2015. Therefore, only CBI data from fires that burned during 2016 and later are available for use in this study to ensure availability of Sentinel pre-fire imagery, which is typically obtained from the year before the fire. We assembled a dataset of 1007 CBI plots from 26 wildfires (Table 1). Because the interpretation and measurement of burn severity differs between forest and non-forest environments [1,57,58], we chose to compare the accuracy of Landsat and Sentinel using only forested CBI plots. To remove non-forested plots, we used the 2015 NASA Global Forest Cover Change (GFCC) 30 m dataset [59] to filter out plots located within pixels with less than 5% canopy cover greater than 5 m in height prior to burning. The GFCC estimates tree cover using regression tree modeling of Landsat surface reflectance and temperature data using 250 m tree cover estimates derived from Moderate Resolution Imaging and Spectroradiometer (MODIS) imagery as training data. This filtering resulted in a final dataset of 912 CBI plots.

2.2. Burn Severity Indices

We evaluated imagery obtained from Landsat and Sentinel for burn severity mapping of each fire using four spectral indices derived from pre- and post-fire imagery. Three indices are based on the normalized burn ratio (NBR) [11,60] and include (a) the differenced normalized burn ratio (dNBR) [11] (b) the relativized burn ratio (RBR) [61], and (c) the relative delta normalized burn ratio (RdNBR) [62]:
N B R = N I R S W I R 2 N I R + S W I R 2  
d N B R = N B R p r e f i r e N B R p o s t f i r e × 1000  
R B R = d N B R N B R p r e f i r e + 1.001
R d N B R =   d N B R | N B R p r e f i r e | 0.5 ,     | N B R p r e f i r e |   0.001   d N B R 0.001 0.5 ,     | N B R p r e f i r e | < 0.001  
where NIR (Equation (1)) is the near infrared band (Landsat: B5; Sentinel: B8) and SWIR2 is the shortwave infrared band 2 (Landsat: B7; Sentinel: B12) (Table 2). In Equation (4), the NBRprefire qualifier is necessary so that the equation does not fail when NBRprefire equals zero.
Due to the resolution differences between the bands of Sentinel (Table 2), we also tested a metric based on the normalized difference vegetation index (NDVI) [63], which is often used to assess vegetation change in forests [64,65,66]. Unlike NBR, which combines the Sentinel 10 m NIR band with the 20 m SWIR2 band, NDVI uses the 10 m red band instead of the SWIR2 band, allowing for true 10 m resolution. We tested both the differenced normalized difference vegetation index (dNDVI) [55] and a relativized version (RdNDVI) similar to the one used in [65], but with NDVIprefire in the denominator squared in the same formulation as RdNBR:
N D V I = N I R r e d N I R + r e d  
d N D V I = N D V I p r e f i r e N D V I p o s t f i r e × 1000  
R d N D V I =   d N D V I | N D V I p r e f i r e | 0.5 ,   | N D V I p r e f i r e |   0.001   d N D V I 0.001 0.5 ,     | N D V I p r e f i r e | < 0.001
where NIR (Equation (5)) is the near infrared band (Landsat: B5; Sentinel: B8) and red is the red band (Landsat and Sentinel: B4). Because dNDVI showed weaker correlation to field measures of burn severity than RdNDVI (i.e., lower R2), we excluded it from further analysis (Figure S1A).
We calculated all indices using the native resolution of each sensor’s band. For Sentinel, this means all indices derived from NBR (i.e., dNBR, RBR, and RdNBR) were mapped at a pseudo-resolution of 10 m using a combination of the 10 m NIR band and the 20 m SWIR2 band resampled to 10 m, while RdNDVI was mapped at true 10 m resolution. Indices derived from Landsat were mapped at the native 30 m resolution. All indices were calculated in the cloud-based remote sensing platform Google Earth Engine (GEE) [67] for both the paired scene (Section 2.3) and composite approach (Section 2.4).

2.3. Calculating Burn Severity: Paired Scene Approach

We mapped burn severity for all 26 fires (Table 1) using the well-established paired scene approach, in which a single pre- and post-fire image is manually selected [11,23]. For all fires that were mapped by the Monitoring Trends in Burn Severity (MTBS) program (n = 23), we selected the pre- and post-fire Landsat 8 imagery from the acquisition dates reported by MTBS. With the three remaining fires that were not mapped by MTBS (Table 1, Kenow, Mammoth, and Chippean), we selected pre- and post-fire imagery that minimized cloud and snow cover within the fire perimeter, while also attempting to match the imagery acquisition dates between years to be as similar as possible to minimize seasonality differences that can affect phenology and sun angle (see Table S1 for scene dates used in the paired scene analysis). Because MTBS map products are distributed with only two of the burn severity indices (i.e., dNBR and RdNBR), we performed the calculation of all burn severity indices using the corresponding pre- and post-fire image for each fire from the Landsat 8 Surface Reflectance Tier 1 dataset in GEE.
For the Sentinel imagery used in the paired scene burn severity mapping approach, we attempted to select the scene closest in acquisition timing to the corresponding Landsat scene used for each fire. This generally resulted in Sentinel and Landsat pre- and post-fire scenes acquired within approximately two weeks of each other, however, the presence of cloud or snow contamination covering the fire footprint required the use of some Sentinel scenes that were acquired further apart. Finding temporally matched imagery was more challenging for earlier dates prior to the launch of the Sentinel-2B satellite in March of 2017, thus requiring the use of eight pre-fire scenes that were acquired during a different year than their Landsat counterparts (Table S1).
To assess the effect of atmospheric correction applied to Sentinel imagery, we used both Level-1C Top of Atmosphere Reflectance (TOA) and Level-2A Bottom of Atmosphere Reflectance (BOA) data products. Acquiring the latter required post-processing the Level-1C imagery using the Sen2Cor atmospheric correction algorithm [68], as the European Space Agency did not begin global distribution of Level-2A imagery until late in 2018. We used the R package sen2r v1.5.0 to download all Sentinel-2 Level-1C imagery and post-process it to Level-2A [69]. We then uploaded the Sentinel TOA and BOA scenes to GEE, where we calculated burn severity maps using both sets of imagery separately for each fire following the paired scene approach described above.

2.4. Calculating Burn Severity: Composite Approach

In addition to the paired scene approach for burn severity mapping, we also used an image compositing approach in the cloud-based remote sensing platform Google Earth Engine (GEE) [67]. Image compositing uses an imagery stack from a user-specified date range before and after the fire to compute a per-pixel mean value from the imagery time series [50,53]. We additionally tested two modifications to the compositing approach, including: (1) computing the per-pixel median, rather than mean, and (2) calculating a severity offset to account for phenological or moisture differences between pre- and post-fire years [11], which was calculated as the difference between the pre- and post-fire mean burn severity of unburned pixels 180 m outside of the fire perimeter. The offset value for each fire was then subtracted from the burn severity raster of each fire following the methods of [50]. However, we found no significant difference in correlation with CBI field data using the median instead of the mean (Figure S1B), while using the offset resulted in decreased correlation with CBI values compared to no offset (Figure S1C). Thus, we chose to exclude the offset and median composite from further analyses.
One complication of comparing Landsat and Sentinel using the composite imagery approach arises from differential access to atmospherically corrected imagery collected by each sensor. We used the Landsat 8 Surface Reflectance Tier 1 dataset and the Sentinel-2 Level-1C TOA dataset, which combines imagery collected by both Sentinel-2A and -2B. Although the European Space Agency (ESA) now produces an atmospherically corrected BOA product, Level-2A, this dataset was not processed globally until approximately the fall of 2018, inhibiting its use in this study for the compositing approach to burn severity mapping. We instead tested the Level-2A product using the paired scene approach (see Section 2.3), as the reduced number of scenes requiring atmospheric correction compared to the composite approach made this feasible to accomplish, given computation limitations. In order to filter out pixels with cloud, snow, shadow, or water, we used the quality assessment band of Landsat 8 to mask contaminated pixels from each image before computing each pixel’s composite value. Although the Sentinel-2 Level-2A product’s quality assessment band contains flags for all the contaminants listed above, the Level-1C product’s quality assessment band only allowed for masking of cloud and cirrus covered pixels.
We tested two different “image season” date ranges for the pre- and post-fire imagery compositing (Table 3). The “extended composite” method uses a static date range starting on 1 June and ending on 30 September for both the year before and the year after fire. This choice of date range reflects the timeframe when scenes were selected for the paired scene assessment of these fires by MTBS (see Table S1 for scene dates used in the paired scene analysis), and is the range used by Parks et al. [50] for fires occurring in the same regions. The pre-fire composite image also includes imagery occurring during the year of fire between 1 June and the start date of the fire, which was done to ensure the availability of Sentinel scenes for 2016 fires.
In contrast to the extended composite imagery season, the “hybrid composite” combines post-fire imagery from both the year of fire (i.e., an immediate assessment) with imagery from the year after the fire (i.e., an extended assessment) [11]. The goal of the hybrid composite approach is to minimize the influence of rapid herbaceous and shrub cover green-up following fire; this approach is shown to increase correlation of burn severity estimates with plot validation data in the boreal forests of North America [70]. Specifically, the MODIS Aqua and Terra Thermal Anomalies and Fire Daily Global datasets are used to estimate the date when there are no longer any high-confidence active “fire” pixels within the fire perimeter. All Landsat or Sentinel imagery occurring after the end of fire date and before 15 November of the fire year are included in the post-fire imagery season. If the end of fire date is not able to be determined by MODIS, then the start of the imagery season defaults to 15 September (this only occurred for the two smallest fires, Chippean and Mammoth). In the following year, the MODIS Aqua and Terra Snow Cover Daily Global datasets are used to estimate the earliest date of majority snowmelt (i.e., snow cover of 5% or less for each pixel within the fire perimeter), and imagery from this date to 1 July is added to the image stack used to compute the post-fire image composite. If a majority snowmelt date is not able to be determined by MODIS, then the start of the imagery season defaults to 30 April (this did not occur for any fires analyzed).

2.5. Evaluating Remotely Sensed Indices of Burn Severity

We compared all burn severity indices to CBI field data of burn severity for the 26 fires. For each CBI plot, we extracted burn severity values from the computed severity imagery using the area-weighted values of pixels within a 15 m radius of each plot center (the size of a CBI plot). We evaluated the correlation between each remotely sensed measure of burn severity and field-measured CBI using Nonlinear Least Squares (NLS) regression of the form:
y = a + b × exp C B I × c
where y is the remotely sensed severity index being evaluated, CBI is the field-based measure of burn severity, and a, b, and c are the coefficients being estimated.
NLS models were fit to all burn severity indices, except for two models, which failed to converge and a linear model was instead fit to the data [19]. We quantified the strength of the relationship between each burn severity index and CBI by calculating the coefficient of determination for each NLS or linear model (i.e., the R2 of the linear regression between the predicted and observed values of CBI), as well as the normalized Root Mean Squared Error (RMSE). Each NLS or linear model was fit to the full dataset of 912 CBI plots across all 26 fires, as the number of CBI plots was highly variable between fires (Table 1), limiting the ability to compare burn severity indices on a per-fire basis. Models and model statistics were computed in the statistical environment R version 4.1.2 [71].

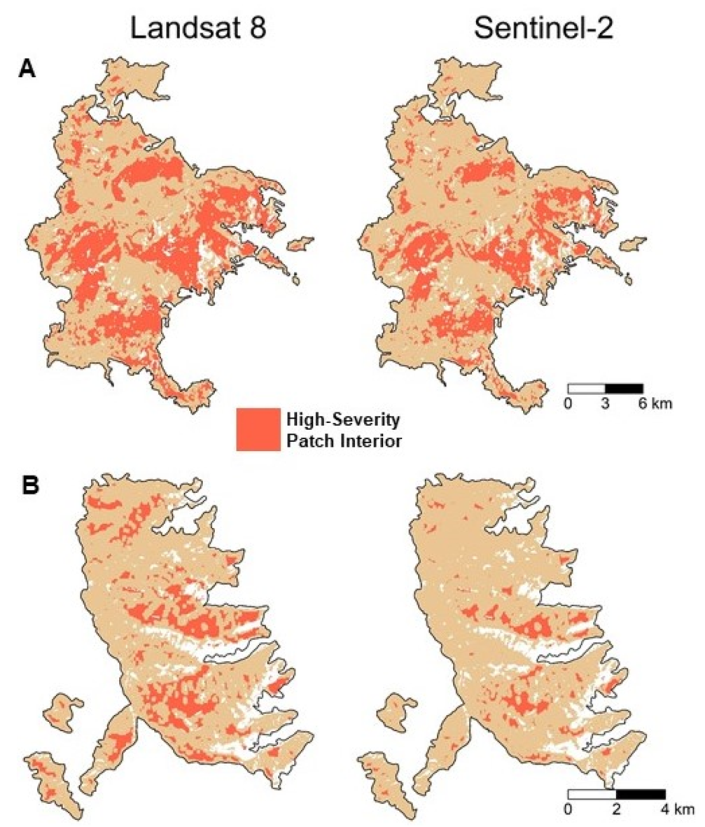
2.6. Assessing the Effects of Imagery Resolution on Estimates of Categorical Burn Severity Classes and High-Severity Patch Interiors within Fires

We explored the difference between Landsat- and Sentinel-derived burn severity maps classified into categorical fire severity groupings of low, moderate, and high severity for the forested pixels within each fire. To isolate the effects of imagery resolution, we additionally compared Sentinel burn severity maps at 10 m spatial resolution to the same maps at 30 m resolution using mean resampling. We used RdNBR calculated with the extended composite method (Table 3), as it showed relatively high correlation with field-based CBI plots for both Landsat and Sentinel (Table 4). Threshold values of RdNBR for each severity category were estimated based on the NLS models of CBI data fit to the Landsat and Sentinel burn severity maps, with commonly used severity breakpoints in the CBI scale as follows: 0 to 1.25 for low severity, 1.26 to 2.25 for moderate severity, and 2.26 to 3 for high severity [62]. We estimated the burn severity class predictive accuracy derived from Sentinel and Landsat imagery with a Kappa statistic calculated from a confusion matrix using the R package caret [72].
In addition to the percentage of each fire burned by severity class, we estimated the percentage of forested area within each fire that was more than 90 m from the likely surviving forest edge (low or moderate severity pixels), hereafter referred to as ‘high-severity patch interior’. These regions within fires have received increasing attention due to concerns for natural conifer regeneration being limited by the distance to the nearest seed source [2,35,73]. Though seed dispersal distance is highly variable by species and environmental context, approximately 100 m from a seed source is a common threshold beyond which conifer seedling regeneration density is sparse following disturbance [74,75,76]. We chose a 90 m distance threshold because it was a common multiple of both Landsat and Sentinel pixel sizes (i.e., 30 m and 10 m, respectively).
Because not all regions mapped as low or moderate severity within a fire perimeter are potential conifer seed sources (i.e., forested), we applied a ‘forest mask’ to exclude pixels unlikely to be forested pre-fire before calculating high-severity patch interiors and severity class percentages for all fires. Our forest mask was similar to that used in [77], which used a combination of pre-fire canopy cover and NDVI [1]. Although the [77] forest mask used LANDFIRE data to estimate percent canopy cover [78], we instead used the 2015 NASA GFCC [59], so as to include coverage for the Kenow fire, which occurred in Canada. Though LANDFIRE predicts canopy cover with additional biophysical variables and field validation data than the GFCC, it is only available in the United States. Pre-fire NDVI was calculated as the mean composite from Landsat imagery collected between 1 June and 30 September the year before fire. The final forest mask used a combination of mean composite pre-fire NDVI of greater than or equal to 0.4 and tree canopy cover greater than or equal to 5%. Visual examination of the mask overlaid with high-resolution aerial imagery showed this combination of thresholds provided the most consistent masking of non-forest across the 26 fires analyzed, minimizing land cover with high NDVI, such as meadows and grassland, while retaining forested pixels with sparse canopies. Estimates of high-severity patch interior for each fire were then made by calculating the Euclidian distance of each forested high-severity pixel to the nearest low- or moderate-severity forested pixel using the distance function in GEE. Pixels greater than or equal to 90 m in the resulting distance map were classified as high-severity patch interior. Finally, differences in proportion of low, moderate, high, and high-severity patch interior between fires mapped with Landsat and Sentinel imagery were assessed using a Wilcoxon signed-rank test in R version 4.1.2 [71].

3. Results

3.1. Landsat and Sentinel Burn Severity Correspondence with Field Data

Across the burn severity indices and mapping approaches tested, Landsat and Sentinel performed similarly as measured by their correlation with CBI field data (i.e., higher R2 or lower RMSE error). However, when comparing between specific mapping approaches (e.g., imagery season used for the compositing approach and atmospheric correction in the paired scene approach), some consistent differences were observed.
Using the paired scene approach, Bottom of Atmosphere (BOA) Sentinel imagery with Sen2Cor atmospheric and terrain corrections consistently performed better than the uncorrected Top of Atmosphere (TOA) imagery. BOA imagery improved R2 by an average of 0.078, with a particularly large increase of 0.212 for RdNBR (Table 5). Compared to Landsat imagery, the BOA Sentinel imagery also performed better across all indices with an average increase in R2 of 0.059.
Using the extended composite imagery method, Sentinel performed marginally better than Landsat with all three NBR-derived indices (dNBR, RBR, RdNBR, mean R2 = 0.590 and 0.606, Landsat and Sentinel, respectively), with the Sentinel-derived RdNBR showing the overall highest coefficient of determination with field-measured burn severity of all methods tested (R2 = 0.643, Table 4). Conversely, when using the hybrid composite imagery method, Landsat-derived NBR indices performed better than Sentinel, with an average difference of 0.057 R2 across the three indices. For Landsat, the hybrid compositing method performed better than the extended compositing with the three NBR indices, increasing R2 by an average of 0.023. For Sentinel, the opposite trend occurred, with hybrid compositing reducing R2 by an average of 0.05 compared to extended compositing. The only non-NBR-derived index tested, RdNDVI, performed consistently worse than the average of its NBR counterparts, lowering R2 for both Landsat compositing methods (0.036 and 0.081, extended and hybrid compositing, respectively), as well as for Sentinel (0.180 and 0.041, extended and hybrid compositing, respectively). RdNDVI derived from the Sentinel extended composite method performed notably worse than all other indices with an R2 of 0.426.
Finally, comparing the paired scene and image compositing methods, Landsat NBR-derived indices from both compositing methods slightly outperformed their paired scene counterparts, increasing R2 by an average of 0.014 and 0.037 (extended and hybrid compositing methods, respectively, Table 4 and Table 5). In contrast, the paired scene approach using the Sentinel atmospherically corrected BOA imagery improved R2 for the NBR indices by 0.01 compared to the extended composite method, and by 0.06 compared to the hybrid composite method. However, when comparing the compositing approaches, which used uncorrected TOA imagery in the paired scene approach also using TOA imagery, both compositing methods improved average NBR indices by 0.088 and 0.038 (extended and hybrid composites, respectively), largely due to the low R2 of the paired scene RdNBR of 0.421. Notably, the R2 of RdNDVI from paired scene Sentinel BOA imagery was improved compared to compositing by 0.171 and 0.082 (extended and hybrid composites, respectively), although the opposite was true for Landsat, where the R2 of the paired scene RdNDVI was reduced by 0.073 and 0.081 (extended and hybrid composites, respectively).

3.2. High-Severity Patch Interior and Severity Class Estimates between Fires

Using the NLS models fit to the composite burn index (CBI) and satellite-derived burn severity indices, we calculated burn severity thresholds for RdNBR derived from the extended compositing approach for low (Landsat: ≤334; Sentinel: ≤314), moderate (Landsat: 335–664; Sentinel: 315–633), and high severities (Landsat ≥665; Sentinel ≥634). A confusion matrix was used to assess the predictive accuracy of the severity categorization compared to the field-based measurement, resulting in an overall accuracy of 66% and a Kappa of 0.485 for Landsat, and an accuracy of 69% and Kappa of 0.518 for Sentinel. In order to estimate high-severity patch interior, we further simplified the severity classes into high and not high (i.e., low and moderate) severity classes. This classification had an accuracy of 81% and a Kappa of 0.607 for Landsat, and an accuracy of 82% and Kappa of 0.631 for Sentinel.
Differences between per-fire proportions of the three severity classes made by Landsat and Sentinel were non-significant (p > 0.05, Figure 2A). In contrast, the difference in the proportion of a fire mapped as high-severity patch interior (high-severity pixels 90 m or further from the nearest non-high-severity forest pixel) was significantly higher for Landsat as compared to the same fire mapped with Sentinel (mean 5.0%, p < 0.001, Figure 2A). This difference resulted in Landsat estimating 24,273 additional hectares (6.6% of forested area) of high-severity patch interior compared to Sentinel across all fires analyzed (Figure 2B and Figure 3).
Comparing the same Sentinel categorical severity maps for a fire at 10 m resolution to a reduced resolution version at 30 m resulted in small but consistent shifts in the percent of a fire mapped at a given severity class. The higher resolution maps decreased the amount of moderate severity by an average of 1.0% across fires, increasing the amount predicted as low- and high-severity (all differences significant, p < 0.001, Figure 2C). This effect is illustrated in Figure 2D, which shows the frequency histogram of the continuous RdNBR values for the 2016 Hayes Two fire when mapped at 10 and 30 m spatial resolutions. Compared to the 30 m distribution, the 10 m imagery has fewer pixels in the moderate-severity range, and instead has more pixels in the high- and low-severity range. Across all 26 fires, the mean reduction in area mapped at moderate-severity corresponds to 2443 ha (0.7% of forested area). Finally, high-severity patch interior estimates were significantly higher for the 30 m Sentinel severity maps than those mapped at 10 m (mean 4.2%, p < 0.001, Figure 2C).

4. Discussion

In the most comprehensive assessment of burn severity mapping using Sentinel-derived imagery to date, we found that Sentinel generally performed as well or better than Landsat for mapping burn severity in western North American forests, lending further evidence to the complementary nature of both earth-observing missions in this context [25,47]. However, nuances in the performance between products emerged when comparing different mapping methods, such as the date range used to select imagery for compositing (Table 4), as well as the effect of post-processing Sentinel imagery for atmospheric and terrain correction (Table 5). Emerging products, such as the Harmonized Landsat Sentinel-2 [79], seek to alleviate some of these issues by fully integrating imagery from both sources through a consistent post-processing chain. Although integrated datasets will be invaluable for long-term time series analyses and image selection options, they forfeit one of the major advantages of the Sentinel-2 MSI sensors over the Landsat mission; namely, higher spatial resolution. Our results show that mapping burn severity at higher resolution helps resolve some heterogeneity in fire effects masked at coarser scales e.g., [31,32,34], reducing the number of pixels classified as ‘moderate’ severity (Figure 2C). Though the proportional differences in severity classes are small when mapping at Sentinel’s higher resolution, these can have much larger impacts on metrics seeking to quantify the spatial configuration of severity patches. This highlights opportunities to assess the ecological interpretations of mapping burn severity at higher resolution at broad scales, but also warrants caution when comparing results to previous work at the commonly used 30 m resolution.
Though we generally found similar regression model fits between field data and burn severity indices derived from Landsat and Sentinel compared to other studies in western North America [19,53,62], some studies reported even stronger correlations [61,70,80]. Discrepancies in model fit are likely due in part to the degree of pooling data from fires occurring in different ecoregions and vegetation types. Picotte et al. [15] assessed how the scale of the regression model affected burn severity estimate accuracy by comparing a model spanning the continental United States to models subset by increasingly narrow land cover classifications, finding that the more specific models generally improved model fit, particularly in the western US. Thus, it is likely we would observe stronger R2 values in our assessment if the models were further broken down regionally. Furthermore, it is important to note that classifying burn severity should ideally be conducted with ecologically meaningful thresholds calibrated to the vegetation community being analyzed [81]. Though we used a single threshold to classify stand-replacing fire across the fires we studied, this was done to simplify analysis and focus on the effect of imagery resolution. Cross-regional studies of burn severity patterns would ideally use regionally defined thresholds where they show improved fit [15], or use non-parametric methods, such as machine learning, to predict burn severity by integrating multiple spatially varying predictors e.g., [37,51,55].

4.1. Image Compositing Approaches

Applying the relatively new image compositing method to burn severity mapping showed similar, and in some cases stronger, correlations with CBI data compared to the traditional paired scene approach for both Landsat and Sentinel, corroborating the results of recent studies [50,53]. The extended composite approach, which used a static pre- and post-fire date range for imagery selection, performed well for both Sentinel and Landsat, with the exception of Sentinel’s RdNDVI (Table 4). Our study included fires from a diverse set of forested ecosystems within western North America (Table 1), and it is likely that further improvements to the extended composite method could be obtained by customizing the date ranges by region to account for differences in phenology and weather patterns. For instance, Parks et al. [50] used an earlier date range of April through June for fires in the states of Arizona, New Mexico, and Utah, due to monsoonal precipitation patterns common in the region, while using a date range of June through September for all other fires. In the present study, we used a single date range (June through September) for the extended composite, as the delineation between fires affected by monsoonal precipitation was less clear for the fires in our analysis.
One alternative to choosing a static temporal window for compositing is to make the date range dynamic. The other compositing method we tested, the hybrid composite, was developed specifically to customize the image selection process dynamically for the boreal region of North America, where rapid herbaceous green-up in the year following fire frequently depresses estimates of burn severity [70]. In the first test of this method for fires in temperate forests, we obtained contrasting results for Landsat and Sentinel, with modest improvements for all indices from Landsat imagery, while the R2 of all indices derived from Sentinel imagery (except RdNDVI) decreased compared to the extended composite version. While it is challenging to pinpoint the reason for this difference, one potential explanation is that the higher temporal resolution of Sentinel (3–5 days return time compared to 16 for Landsat) results in more cloud-free pixels obtained during the late fall and early spring included for the post-fire composite image. Particularly for areas that burned at lower to moderate severity and contain some proportion of deciduous vegetation, the NBR values could be depressed for these late and early season pixels, resulting in a lower post-fire mean composite pixel NBR unrelated to the effects of fire. If this is the case, then the addition of Landsat 9 imagery could pose the same issue for the hybrid compositing approach applied to the Landsat catalog in the future due to the increase in temporal resolution. Regardless, the fact that performance increased in the current analysis for Landsat compared to the extended composite shows promise for this dynamic approach to the temporal selection of imagery in regions outside of the Boreal, and performance could continue to be improved with the additional tweaking of date ranges.

4.2. The Paired Scene Approach

In addition to being a well-established and widely used method for burn severity mapping, testing the paired scene approach allowed us to evaluate the impact of atmospheric and terrain corrections to Sentinel imagery. Atmospheric correction is demonstrated to increase NDVI with both Landsat and Sentinel due to an increase in reflectivity in the near-infrared spectrum and decrease in the visible range of the electromagnetic spectrum [82], and also affects shortwave infrared light reflectance [83], which is used in NBR indices. Additionally, use of atmospherically corrected imagery is particularly important when comparing burn severity across fires in different regions or years, as we carried out in this study, due to differences in atmospheric conditions [84].
The Sen2Cor post-processing algorithm [68], which applies atmospheric and terrain corrections to Sentinel TOA imagery to create BOA scenes, improved burn severity correlations with CBI data for all indices, with a particularly large boost for RdNBR (Table 5). This was notable since the uncorrected Sentinel TOA imagery still performed similarly, or even slightly better, than the corrected Landsat imagery. Given that image compositing with Sentinel TOA imagery improved performance for all NBR-derived indices compared to the paired scene approach, it is likely that applying the image compositing approach to the Sentinel BOA catalog will result in further improvements. This is possible for fires occurring in 2020 or later, which we were unfortunately unable to test in the current analysis because our most recent field data were collected from 2019 fires.
Even though we attempted to minimize differences between the acquisition dates of the scene pairs acquired by Landsat and Sentinel, for some fires, the chosen pre-fire Sentinel image was more than a month, and in some cases more than a year, apart from the Landsat counterpart (Table S1). This was unavoidable and potentially impacted the resulting burn severity estimates, but in all cases we made sure to match the post-fire scene’s season as closely as possible to the acquisition time of the pre-fire Sentinel image, as seasonal differences between paired scenes are shown to have a large effect on burn severity estimates [85].

4.3. The Effect of Imagery Resolution

While acknowledging Sentinel’s higher spatial resolution as an asset, research comparing Landsat and Sentinel for burn severity mapping is yet to examine the impact it will have on landscape assessments of fire severity patterns. Fire has heterogeneous effects at scales finer than 30 m [28,86], particularly in non-stand replacing fires, resulting in high sub-pixel variability in tree mortality [31,87] and frequency of smaller-sized unburned patches [32,34]. Efforts to map burn severity with sub-30 m resolution imagery show an improved ability to capture fine-scale fire patterns of burn severity, e.g., [88,89], though they had to rely on proprietary data sources, limiting the ability to scale-up analyses. Mapping NBR-derived indices at pseudo-10 m resolution with Sentinel by resampling the 20 m SWIR band provided a 9-fold increase in resolution over the 30 m Landsat pixel, while still being a freely available dataset with global coverage. True 10 m resolution can also be obtained with Sentinel NDVI-derived indices, such as the RdNDVI we tested. Though RdNDVI performed worse than NBR-derived indices with the compositing approach (Table 4), it performed similarly in the paired scene approach (Table 5), suggesting that with some tweaking of the compositing date range, it could also be a useful index for assessing fine-scale fire effects.
Fires mapped at a 10 m resolution had a consistent reduction in moderate severity compared to pixels resampled to 30 m (Figure 2C). While this effect was small overall, averaging a 1% reduction in moderate severity across the 26 fires, this corresponds to a total area of 2443 ha. The effect of this partitioning of ‘moderate’ severity into low and high can be seen by looking at the continuous distribution of burn severity values from a 10 m and 30 m resolution burn severity map of the Hayes Two fire (Figure 2D). While this result is not surprising, given that the resampling process to reduce the 10 m Sentinel imagery to 30 m averages the underlying pixel values, it still provides a baseline for the magnitude of difference that could be expected when mapping burn severity at higher resolution in similar forest types. ‘Moderate’ severity is the result of a mixture of high and low severity effects within close proximity. This often occurs at the edge of high-severity patches [20], suggesting that mapping burn severity at higher resolution could help delineate unburned areas within a fire, providing more accurate estimates of area burned.
Compared to the relatively small differences in severity class proportions, the effect that imagery resolution can have on metrics of the spatial arrangement of high-severity fire are starker, which is an important consideration as these factors gain increasing attention [90,91,92,93]. High-severity patch interior was estimated by Landsat to be 6.6% higher than Sentinel across forested areas within fires in our analysis (Figure 2A), corresponding to a 24,273 ha difference. This is primarily driven by the difference in resolution, rather than differences between sensors, as evidenced by a similar difference between Sentinel estimates of high-severity patch interior when mapped at 10 and 30 m resolution (Figure 2C). While many landscape metrics that quantify patch spatial characteristics are known to be sensitive to resolution [94], this result highlights two important points. First, that researchers of burn severity patch dynamics need to be careful when comparing across resolutions, and ideally test the scaling relationship explicitly, and second, that burn severity maps using coarser-scale sensors may be overestimating the amount of area vulnerable to seed dispersal limitations in some fires, though it is beyond the scope of this analysis to determine whether the higher resolution imagery is actually picking up meaningful ecological differences. Yet, recent work indicated that surviving trees (i.e., fire refugia) are frequently located in Landsat pixels categorized as moderate- or even high-severity [34]. Testing the ability of Sentinel to identify these small-scale refugia would be a valuable next step towards assessing whether mapping burn severity at a higher resolution would provide a tangible benefit to the ecological interpretation of fire effects.

5. Conclusions

The Sentinel-2 constellation of Earth-observing satellites provides similar or even improved estimates of burn severity compared to Landsat 8, further validating its use for mapping fire effects across a diversity of forested ecosystems. Atmospherically correcting Sentinel imagery to Bottom of Atmosphere noticeably improved correlations with field measures of burn severity using the paired scene approach. The image-compositing approach, which required the use of uncorrected Top of Atmosphere Sentinel imagery due to data access limitations, still performed well relative to corrected Landsat imagery, suggesting that use of the composite approach with corrected Sentinel imagery may improve accuracy even further. Developing products that consistently process imagery from both missions to ensure compatibility for time series analyses, such as the Harmonized Landsat and Sentinel-2 [79], will ultimately streamline the process of integrating both data sources. This will have major benefits for burn severity mapping globally, increasing both the number of cloud-free scenes to choose from for the paired scene approach and the number of cloud-free pixels available to integrate for the image compositing method. Yet we caution against ignoring the increased spatial resolution that Sentinel provides. Mapping burn severity at true 10 m resolution with an NDVI-derived index, or pseudo-10 m with NBR, helps resolve some of the fine-scale heterogeneity of fire effects. There are opportunities to test Sentinel’s ability to delineate unburned areas within a fire footprint, potentially improving estimates of burned area. Detection of fire refugia occurring at the sub-30 m pixel scale could aid in interpreting the ecological resilience of post-fire landscapes [34,95], as well as reduce uncertainty in the amount of tree mortality for a given burn severity estimate [31,87].

Supplementary Materials

The following supporting information can be downloaded at: https://www.mdpi.com/article/10.3390/rs14205249/s1, Figure S1: NLS model fits (R2) for Landsat 8 and Sentinel-2 derived burn severity indices to field-based composite burn index scores using the image compositing approach. N = 40 models for Landsat and for Sentinel (5 indices × 2 compositing statistics × 2 calculation or not of an offset × 2 composite imagery seasons). The 5 indices compared are (1) differenced normalized vegetation index (dNDVI); (2) relativized difference normalized vegetation index (RdNDVI); (3) differenced normalized burn ratio (dNBR); (4) relativized burn ratio (RBR); and (5) relativized differenced normalized burn ratio (RdNBR) (A). The compositing statistics are the method used to calculate the pixel value from the pre- and post-fire imagery stacks in Google Earth Engine (B). The offset calculates the mean index value from a 180 m band outside the fire perimeter for the pre- and post-fire image composites and uses the difference between the two as a correction value for all pixels inside the burn perimeter (C).; Table S1: Paired scene approach scene acquisition dates.

Author Contributions

Conceptualization, A.A.H., S.A.P. and L.L.Y.; data curation, B.J.H., S.A.P., J.A.L. and L.L.Y.; formal analysis, A.A.H.; funding acquisition, A.A.H., B.J.H., J.A.L. and L.L.Y.; investigation, A.A.H. and S.A.P.; methodology, A.A.H., S.A.P. and L.L.Y.; software, A.A.H.; supervision, L.L.Y.; visualization, A.A.H.; writing–original draft, A.A.H.; writing–review and editing, A.A.H., S.A.P., B.J.H., S.J.S., J.A.L. and L.L.Y. All authors have read and agreed to the published version of the manuscript.

Funding

This work was supported by the Utah State University Quinney College of Natural Resources Quinney Fellowship; the USU Office of Research; the USU Climate Adaptation Science Traineeship Program (NSF Grant No. 1633756); the BYU Charles Redd Center for Western Studies; and the USDA Forest Service, Rocky Mountain Research Station, Aldo Leopold Wilderness Research Institute. This research was supported by the Utah Agricultural Experiment Station, Utah State University, and approved as journal paper number 9616. The findings and conclusions in this publication are those of the authors and should not be construed to represent any official USDA or US Government determination or policy.

Institutional Review Board Statement

Not applicable.

Informed Consent Statement

Not applicable.

Data Availability Statement

Sentinel-2 single-date L1C images can be freely downloaded from the United States Geological Survey (USGS) Earth Explorer data portal (EE, https://earthexplorer.usgs.gov/, accessed on 14 November 2021). Composite indices using Sentinel-2 processing level 1C: (GEE dataset ID: ee.ImageCollection (“COPERNICUS/S2”)) and Landsat 8 Surface Reflectance Tier 1: (GEE dataset ID: ee.ImageCollection(“LANDSAT/LC08/C01/T1_SR”)) imagery can be freely accessed from Google Earth Engine. MODIS Terra and Aqua Thermal Anomalies & Fire Daily Global: (GEE dataset ID: ee.ImageCollection(“MODIS/006/MOD14A1”) and ee.ImageCollection(“MODIS/006/MYD14A1”), respectively) are also freely accessible in Google Earth Engine. MODIS Terra and Aqua Snow Cover Daily Global: (GEE dataset ID: ee.ImageCollection(“MODIS/006/MOD10A1”) and ee.ImageCollection(“MODIS/006/MYD10A1”), respectively) are also freely accessible in Google Earth Engine. Fire perimeter data is available from the USGS Monitoring Trends in Burn Severity (MTBS) program (https://www.mtbs.gov/direct-download, accessed on 13 July 2020).

Acknowledgments

We thank Mark Kreider, Elyse Doty, and Megan Nasto for their contributions to CBI data collection. We also thank Lisa Holsinger for coding advice and support.

Conflicts of Interest

The authors declare no conflict of interest.

References

  1. Dillon, G.K.; Panunto, M.H.; Davis, B.; Birch, D.S.; Jolly, W.M. Development of a Severe Fire Potential Map for the Contiguous United States; U.S. Department of Agriculture, Forest Service, Rocky Mountain Research Station: Fort Collins, CO, USA, 2020; p. 107.
  2. Cansler, C.A.; McKenzie, D. Climate, Fire Size, and Biophysical Setting Control Fire Severity and Spatial Pattern in the Northern Cascade Range, USA. Ecol. Appl. 2014, 24, 1037–1056. [Google Scholar] [CrossRef]
  3. Lutz, J.A.; Key, C.H.; Kolden, C.A.; Kane, J.T.; van Wagtendonk, J.W. Fire Frequency, Area Burned, and Severity: A Quantitative Approach to Defining a Normal Fire Year. Fire Ecol. 2011, 7, 51–65. [Google Scholar] [CrossRef]
  4. Lutz, J.A.; van Wagtendonk, J.W.; Thode, A.E.; Miller, J.D.; Franklin, J.F. Climate, Lightning Ignitions, and Fire Severity in Yosemite National Park, California, USA. Int. J. Wildland Fire 2009, 18, 765. [Google Scholar] [CrossRef]
  5. Giglio, L.; Descloitres, J.; Justice, C.O.; Kaufman, Y.J. An Enhanced Contextual Fire Detection Algorithm for MODIS. Remote Sens. Environ. 2003, 87, 273–282. [Google Scholar] [CrossRef]
  6. Schroeder, W.; Oliva, P.; Giglio, L.; Csiszar, I.A. The New VIIRS 375m Active Fire Detection Data Product: Algorithm Description and Initial Assessment. Remote Sens. Environ. 2014, 143, 85–96. [Google Scholar] [CrossRef]
  7. Robichaud, P.R.; Lewis, S.A.; Brown, R.E.; Ashmun, L.E. Emergency Post-Fire Rehabilitation Treatment Effects on Burned Area Ecology and Long-Term Restoration. Fire Ecol. 2009, 5, 115–128. [Google Scholar] [CrossRef]
  8. Bright, B.C.; Hudak, A.T.; Kennedy, R.E.; Braaten, J.D.; Henareh Khalyani, A. Examining Post-Fire Vegetation Recovery with Landsat Time Series Analysis in Three Western North American Forest Types. Fire Ecol. 2019, 15, 8. [Google Scholar] [CrossRef] [Green Version]
  9. Lacouture, D.L.; Broadbent, E.N.; Crandall, R.M. Detecting Vegetation Recovery after Fire in a Fire-Frequented Habitat Using Normalized Difference Vegetation Index (NDVI). Forests 2020, 11, 749. [Google Scholar] [CrossRef]
  10. Keeley, J.E. Fire Intensity, Fire Severity and Burn Severity: A Brief Review and Suggested Usage. Int. J. Wildland Fire 2009, 18, 116. [Google Scholar] [CrossRef]
  11. Key, C.H.; Benson, N.C. Landscape Assessment (LA); USDA Forest Service, Rocky Mountain Research Station: Ogden, UT, USA, 2006.
  12. Lentile, L.B.; Holden, Z.A.; Smith, A.M.S.; Falkowski, M.J.; Hudak, A.T.; Morgan, P.; Lewis, S.A.; Gessler, P.E.; Benson, N.C. Remote Sensing Techniques to Assess Active Fire Characteristics and Post-Fire Effects. Int. J. Wildland Fire 2006, 15, 319. [Google Scholar] [CrossRef]
  13. French, N.H.F.; Kasischke, E.S.; Hall, R.J.; Murphy, K.A.; Verbyla, D.L.; Hoy, E.E.; Allen, J.L. Using Landsat Data to Assess Fire and Burn Severity in the North American Boreal Forest Region: An Overview and Summary of Results. Int. J. Wildland Fire 2008, 17, 443. [Google Scholar] [CrossRef]
  14. Guindon, L.; Gauthier, S.; Manka, F.; Parisien, M.-A.; Whitman, E.; Bernier, P.; Beaudoin, A.; Villemaire, P.; Skakun, R. Trends in Wildfire Burn Severity across Canada, 1985 to 2015. Can. J. For. Res. 2021, 51, 1230–1244. [Google Scholar] [CrossRef]
  15. Picotte, J.J.; Cansler, C.A.; Kolden, C.A.; Lutz, J.A.; Key, C.; Benson, N.C.; Robertson, K.M. Determination of Burn Severity Models Ranging from Regional to National Scales for the Conterminous United States. Remote Sens. Environ. 2021, 263, 112569. [Google Scholar] [CrossRef]
  16. Woodcock, C.E.; Allen, R.; Anderson, M.; Belward, A.; Bindschadler, R.; Cohen, W.; Gao, F.; Goward, S.N.; Helder, D.; Helmer, E.; et al. Free Access to Landsat Imagery. Science 2008, 320, 1011. [Google Scholar] [CrossRef] [PubMed]
  17. van Wagtendonk, J.W.; Root, R.R.; Key, C.H. Comparison of AVIRIS and Landsat ETM+ Detection Capabilities for Burn Severity. Remote Sens. Environ. 2004, 92, 397–408. [Google Scholar] [CrossRef]
  18. White, J.D.; Ryan, K.C.; Key, C.C.; Running, S.W. Remote Sensing of Forest Fire Severity and Vegetation Recovery. Int. J. Wildland Fire 1996, 6, 125–136. [Google Scholar] [CrossRef] [Green Version]
  19. Cansler, C.A.; McKenzie, D. How Robust Are Burn Severity Indices When Applied in a New Region? Evaluation of Alternate Field-Based and Remote-Sensing Methods. Remote Sens. 2012, 4, 456–483. [Google Scholar] [CrossRef] [Green Version]
  20. Miller, J.D.; Knapp, E.E.; Key, C.H.; Skinner, C.N.; Isbell, C.J.; Creasy, R.M.; Sherlock, J.W. Calibration and Validation of the Relative Differenced Normalized Burn Ratio (RdNBR) to Three Measures of Fire Severity in the Sierra Nevada and Klamath Mountains, California, USA. Remote Sens. Environ. 2009, 113, 645–656. [Google Scholar] [CrossRef]
  21. Soverel, N.O.; Perrakis, D.D.B.; Coops, N.C. Estimating Burn Severity from Landsat DNBR and RdNBR Indices across Western Canada. Remote Sens. Environ. 2010, 114, 1896–1909. [Google Scholar] [CrossRef]
  22. Saberi, S.J.; Agne, M.C.; Harvey, B.J. Do You CBI What I See? The Relationship between the Composite Burn Index and Quantitative Field Measures of Burn Severity Varies across Gradients of Forest Structure. Int. J. Wildland Fire 2022, 31, 112–123. [Google Scholar] [CrossRef]
  23. Eidenshink, J.; Schwind, B.; Brewer, K.; Zhu, Z.-L.; Quayle, B.; Howard, S. A Project for Monitoring Trends in Burn Severity. Fire Ecol. 2007, 3, 3–21. [Google Scholar] [CrossRef]
  24. Picotte, J.J.; Bhattarai, K.; Howard, D.; Lecker, J.; Epting, J.; Quayle, B.; Benson, N.; Nelson, K. Changes to the Monitoring Trends in Burn Severity Program Mapping Production Procedures and Data Products. Fire Ecol. 2020, 16, 16. [Google Scholar] [CrossRef]
  25. Mallinis, G.; Mitsopoulos, I.; Chrysafi, I. Evaluating and Comparing Sentinel 2A and Landsat-8 Operational Land Imager (OLI) Spectral Indices for Estimating Fire Severity in a Mediterranean Pine Ecosystem of Greece. GIScience Remote Sens. 2018, 55, 1–18. [Google Scholar] [CrossRef]
  26. Picotte, J.J.; Robertson, K.M. Validation of Remote Sensing of Burn Severity in South-Eastern US Ecosystems. Int. J. Wildland Fire 2011, 20, 453. [Google Scholar] [CrossRef]
  27. Vanderhoof, M.K.; Hawbaker, T.J.; Teske, C.; Ku, A.; Noble, J.; Picotte, J. Mapping Wetland Burned Area from Sentinel-2 across the Southeastern United States and Its Contributions Relative to Landsat-8 (2016–2019). Fire 2021, 4, 52. [Google Scholar] [CrossRef]
  28. Key, C.H. Ecological and Sampling Constraints on Defining Landscape Fire Severity. Fire Ecol. 2006, 2, 34–59. [Google Scholar] [CrossRef]
  29. Kolden, C.A.; Abatzoglou, J.T.; Lutz, J.A.; Cansler, C.A.; Kane, J.T.; Wagtendonk, J.W.V.; Key, C.H. Climate Contributors to Forest Mosaics: Ecological Persistence Following Wildfire. Northwest Sci. 2015, 89, 219–238. [Google Scholar] [CrossRef] [Green Version]
  30. Miller, C.; Urban, D.L. Interactions between Forest Heterogeneity and Surface Fire Regimes in the Southern Sierra Nevada. Can. J. For. Res. 1999, 29, 202–212. [Google Scholar] [CrossRef]
  31. Furniss, T.J.; Kane, V.R.; Larson, A.J.; Lutz, J.A. Detecting Tree Mortality with Landsat-Derived Spectral Indices: Improving Ecological Accuracy by Examining Uncertainty. Remote Sens. Environ. 2020, 237, 111497. [Google Scholar] [CrossRef]
  32. Blomdahl, E.M.; Kolden, C.A.; Meddens, A.J.H.; Lutz, J.A. The Importance of Small Fire Refugia in the Central Sierra Nevada, California, USA. For. Ecol. Manag. 2019, 432, 1041–1052. [Google Scholar] [CrossRef]
  33. Kolden, C.A.; Lutz, J.A.; Key, C.H.; Kane, J.T.; van Wagtendonk, J.W. Mapped versus Actual Burned Area within Wildfire Perimeters: Characterizing the Unburned. For. Ecol. Manag. 2012, 286, 38–47. [Google Scholar] [CrossRef]
  34. Walker, R.; Coop, J.; Downing, W.; Krawchuk, M.; Malone, S.; Meigs, G. How Much Forest Persists through Fire? High-Resolution Mapping of Tree Cover to Characterize the Abundance and Spatial Pattern of Fire Refugia across Mosaics of Burn Severity. Forests 2019, 10, 782. [Google Scholar] [CrossRef] [Green Version]
  35. Chambers, M.E.; Fornwalt, P.J.; Malone, S.L.; Battaglia, M.A. Patterns of Conifer Regeneration Following High Severity Wildfire in Ponderosa Pine—Dominated Forests of the Colorado Front Range. For. Ecol. Manag. 2016, 378, 57–67. [Google Scholar] [CrossRef]
  36. Harvey, B.J.; Donato, D.C.; Turner, M.G. High and Dry: Post-Fire Tree Seedling Establishment in Subalpine Forests Decreases with Post-Fire Drought and Large Stand-Replacing Burn Patches. Glob. Ecol. Biogeogr. 2016, 25, 655–669. [Google Scholar] [CrossRef] [Green Version]
  37. Gibson, R.; Danaher, T.; Hehir, W.; Collins, L. A Remote Sensing Approach to Mapping Fire Severity in South-Eastern Australia Using Sentinel 2 and Random Forest. Remote Sens. Environ. 2020, 240, 111702. [Google Scholar] [CrossRef]
  38. White, L.A.; Gibson, R.K. Comparing Fire Extent and Severity Mapping between Sentinel 2 and Landsat 8 Satellite Sensors. Remote Sens. 2022, 14, 1661. [Google Scholar] [CrossRef]
  39. Maillard, O.; Flores-Valencia, M.; Michme, G.; Coronado, R.; Bachfischer, M.; Azurduy, H.; Vides-Almonacid, R.; Flores, R.; Angulo, S.; Mielich, N. Phenology Patterns and Postfire Vegetation Regeneration in the Chiquitania Region of Bolivia Using Sentinel-2. Fire 2022, 5, 70. [Google Scholar] [CrossRef]
  40. Konkathi, P.; Shetty, A. Inter Comparison of Post-Fire Burn Severity Indices of Landsat-8 and Sentinel-2 Imagery Using Google Earth Engine. Earth Sci. Inform. 2021, 14, 645–653. [Google Scholar] [CrossRef]
  41. Lasaponara, R.; Tucci, B.; Ghermandi, L. On the Use of Satellite Sentinel 2 Data for Automatic Mapping of Burnt Areas and Burn Severity. Sustainability 2018, 10, 3889. [Google Scholar] [CrossRef] [Green Version]
  42. Morresi, D.; Marzano, R.; Lingua, E.; Motta, R.; Garbarino, M. Mapping Burn Severity in the Western Italian Alps through Phenologically Coherent Reflectance Composites Derived from Sentinel-2 Imagery. Remote Sens. Environ. 2022, 269, 112800. [Google Scholar] [CrossRef]
  43. Silva-Cardoza, A.I.; Vega-Nieva, D.J.; Briseño-Reyes, J.; Briones-Herrera, C.I.; López-Serrano, P.M.; Corral-Rivas, J.J.; Parks, S.A.; Holsinger, L.M. Evaluating a New Relative Phenological Correction and the Effect of Sentinel-Based Earth Engine Compositing Approaches to Map Fire Severity and Burned Area. Remote Sens. 2022, 14, 3122. [Google Scholar] [CrossRef]
  44. Navarro, G.; Caballero, I.; Silva, G.; Parra, P.-C.; Vázquez, Á.; Caldeira, R. Evaluation of Forest Fire on Madeira Island Using Sentinel-2A MSI Imagery. Int. J. Appl. Earth Obs. Geoinf. 2017, 58, 97–106. [Google Scholar] [CrossRef] [Green Version]
  45. Amos, C.; Petropoulos, G.P.; Ferentinos, K.P. Determining the Use of Sentinel-2A MSI for Wildfire Burning & Severity Detection. Int. J. Remote Sens. 2019, 40, 905–930. [Google Scholar] [CrossRef]
  46. Colson, D.; Petropoulos, G.P.; Ferentinos, K.P. Exploring the Potential of Sentinels-1 & 2 of the Copernicus Mission in Support of Rapid and Cost-Effective Wildfire Assessment. Int. J. Appl. Earth Obs. Geoinf. 2018, 73, 262–276. [Google Scholar] [CrossRef]
  47. García-Llamas, P.; Suárez-Seoane, S.; Fernández-Guisuraga, J.M.; Fernández-García, V.; Fernández-Manso, A.; Quintano, C.; Taboada, A.; Marcos, E.; Calvo, L. Evaluation and Comparison of Landsat 8, Sentinel-2 and Deimos-1 Remote Sensing Indices for Assessing Burn Severity in Mediterranean Fire-Prone Ecosystems. Int. J. Appl. Earth Obs. Geoinf. 2019, 80, 137–144. [Google Scholar] [CrossRef]
  48. Quintano, C.; Fernández-Manso, A.; Fernández-Manso, O. Combination of Landsat and Sentinel-2 MSI Data for Initial Assessing of Burn Severity. Int. J. Appl. Earth Obs. Geoinf. 2018, 64, 221–225. [Google Scholar] [CrossRef]
  49. Delcourt, C.J.F.; Combee, A.; Izbicki, B.; Mack, M.C.; Maximov, T.; Petrov, R.; Rogers, B.M.; Scholten, R.C.; Shestakova, T.A.; van Wees, D.; et al. Evaluating the Differenced Normalized Burn Ratio for Assessing Fire Severity Using Sentinel-2 Imagery in Northeast Siberian Larch Forests. Remote Sens. 2021, 13, 2311. [Google Scholar] [CrossRef]
  50. Parks, S.; Holsinger, L.; Voss, M.; Loehman, R.; Robinson, N. Mean Composite Fire Severity Metrics Computed with Google Earth Engine Offer Improved Accuracy and Expanded Mapping Potential. Remote Sens. 2018, 10, 879. [Google Scholar] [CrossRef] [Green Version]
  51. Parks, P.; Holsinger, L.; Koontz, M.; Collins, L.; Whitman, E.; Parisien, M.-A.; Loehman, R.; Barnes, J.; Bourdon, J.-F.; Boucher, J.; et al. Giving Ecological Meaning to Satellite-Derived Fire Severity Metrics across North American Forests. Remote Sens. 2019, 11, 1735. [Google Scholar] [CrossRef] [Green Version]
  52. Soulard, C.E.; Albano, C.M.; Villarreal, M.L.; Walker, J.J. Continuous 1985–2012 Landsat Monitoring to Assess Fire Effects on Meadows in Yosemite National Park, California. Remote Sens. 2016, 8, 371. [Google Scholar] [CrossRef]
  53. Whitman, E.; Parisien, M.-A.; Holsinger, L.M.; Park, J.; Parks, S.A. A Method for Creating a Burn Severity Atlas: An Example from Alberta, Canada. Int. J. Wildland Fire 2020, 29, 995. [Google Scholar] [CrossRef]
  54. Omernik, J.M. Ecoregions of the Conterminous United States. Ann. Assoc. Am. Geogr. 1987, 77, 118–125. [Google Scholar] [CrossRef]
  55. Ellenwood, J.R.; Krist, F.J., Jr.; Romero, S.A. National Individual Tree Species Atlas; USDA Forest Service: Washington, DC, USA, 2015.
  56. Picotte, J.J.; Arkle, R.; Bastian, H.; Benson, N.; Cansler, A.; Caprio, T.; Dillon, G.; Key, C.; Klein, R.N.; Kopper, K.; et al. Composite Burn Index (CBI) Data for the Conterminous US, Collected between 1996 and 2018; [Data Set]; U.S. Geological Survey: Reston, WV, USA, 2019. [CrossRef]
  57. Meddens, A.J.H.; Kolden, C.A.; Lutz, J.A. Detecting Unburned Areas within Wildfire Perimeters Using Landsat and Ancillary Data across the Northwestern United States. Remote Sens. Environ. 2016, 186, 275–285. [Google Scholar] [CrossRef]
  58. Morgan, P.; Keane, R.E.; Dillon, G.K.; Jain, T.B.; Hudak, A.T.; Karau, E.C.; Sikkink, P.G.; Holden, Z.A.; Strand, E.K. Challenges of Assessing Fire and Burn Severity Using Field Measures, Remote Sensing and Modelling. Int. J. Wildland Fire 2014, 23, 1045. [Google Scholar] [CrossRef] [Green Version]
  59. Sexton, J.O.; Song, X.-P.; Feng, M.; Noojipady, P.; Anand, A.; Huang, C.; Kim, D.-H.; Collins, K.M.; Channan, S.; DiMiceli, C.; et al. Global, 30-m Resolution Continuous Fields of Tree Cover: Landsat-Based Rescaling of MODIS Vegetation Continuous Fields with Lidar-Based Estimates of Error. Int. J. Digit. Earth 2013, 6, 427–448. [Google Scholar] [CrossRef] [Green Version]
  60. García, M.J.L.; Caselles, V. Mapping Burns and Natural Reforestation Using Thematic Mapper Data. Geocarto Int. 1991, 6, 31–37. [Google Scholar] [CrossRef]
  61. Parks, S.; Dillon, G.; Miller, C. A New Metric for Quantifying Burn Severity: The Relativized Burn Ratio. Remote Sens. 2014, 6, 1827–1844. [Google Scholar] [CrossRef] [Green Version]
  62. Miller, J.D.; Thode, A.E. Quantifying Burn Severity in a Heterogeneous Landscape with a Relative Version of the Delta Normalized Burn Ratio (DNBR). Remote Sens. Environ. 2007, 109, 66–80. [Google Scholar] [CrossRef]
  63. Tucker, C.J. Red and Photographic Infrared Linear Combinations for Monitoring Vegetation. Remote Sens. Environ. 1979, 8, 127–150. [Google Scholar] [CrossRef]
  64. Cohen, W.B.; Spies, T.A.; Alig, R.J.; Oetter, D.R.; Maiersperger, T.K.; Fiorella, M. Characterizing 23 Years (1972–95) of Stand Replacement Disturbance in Western Oregon Forests with Landsat Imagery. Ecosystems 2002, 5, 122–137. [Google Scholar] [CrossRef]
  65. Collins, B.M.; Miller, J.D.; Thode, A.E.; Kelly, M.; van Wagtendonk, J.W.; Stephens, S.L. Interactions among Wildland Fires in a Long-Established Sierra Nevada Natural Fire Area. Ecosystems 2009, 12, 114–128. [Google Scholar] [CrossRef]
  66. Wilson, E.H.; Sader, S.A. Detection of Forest Harvest Type Using Multiple Dates of Landsat TM Imagery. Remote Sens. Environ. 2002, 80, 385–396. [Google Scholar] [CrossRef]
  67. Gorelick, N.; Hancher, M.; Dixon, M.; Ilyushchenko, S.; Thau, D.; Moore, R. Google Earth Engine: Planetary-Scale Geospatial Analysis for Everyone. Remote Sens. Environ. 2017, 202, 18–27. [Google Scholar] [CrossRef]
  68. Main-Knorn, M.; Pflug, B.; Louis, J.; Debaecker, V.; Müller-Wilm, U.; Gascon, F. Sen2Cor for Sentinel-2. In Proceedings of the Image and Signal Processing for Remote Sensing XXIII, International Society for Optics and Photonics, Warsaw, Poland, 11–13 September 2017; Volume 10427, p. 1042704. [Google Scholar] [CrossRef] [Green Version]
  69. Ranghetti, L.; Boschetti, M.; Nutini, F.; Busetto, L. “Sen2r”: An R Toolbox for Automatically Downloading and Preprocessing Sentinel-2 Satellite Data. Comput. Geosci. 2020, 139, 104473. [Google Scholar] [CrossRef]
  70. Holsinger, L.M.; Parks, S.A.; Saperstein, L.B.; Loehman, R.A.; Whitman, E.; Barnes, J.; Parisien, M.-A. Improved Fire Severity Mapping in the North American Boreal Forest Using a Hybrid Composite Method. Remote Sens. Ecol. Conserv. 2022, 8, 222–235. [Google Scholar] [CrossRef]
  71. R Core Team. R: A Language and Environment for Statistical Computing; R Foundation for Statistical Computing: Vienna, Austria, 2021; Available online: https://www.R-project.org/ (accessed on 14 November 2021).
  72. Kuhn, M. Caret: Classification and Regression Training; R Package Version 6.0-90; 2021. Available online: https://CRAN.R-project.org/package=caret (accessed on 14 November 2021).
  73. Collins, B.M.; Roller, G.B. Early Forest Dynamics in Stand-Replacing Fire Patches in the Northern Sierra Nevada, California, USA. Landsc. Ecol. 2013, 28, 1801–1813. [Google Scholar] [CrossRef]
  74. Clark, J.S.; Silman, M.; Kern, R.; Macklin, E.; HilleRisLambers, J. Seed Dispersal Near and Far: Patterns Across Temperate and Tropical Forests. Ecology 1999, 80, 1475–1494. [Google Scholar] [CrossRef]
  75. Haire, S.L.; McGarigal, K. Effects of Landscape Patterns of Fire Severity on Regenerating Ponderosa Pine Forests (Pinus Ponderosa) in New Mexico and Arizona, USA. Landsc. Ecol. 2010, 25, 1055–1069. [Google Scholar] [CrossRef]
  76. Kemp, K.B.; Higuera, P.E.; Morgan, P. Fire Legacies Impact Conifer Regeneration across Environmental Gradients in the U.S. Northern Rockies. Landsc. Ecol. 2016, 31, 619–636. [Google Scholar] [CrossRef]
  77. Parks, S.A.; Abatzoglou, J.T. Warmer and Drier Fire Seasons Contribute to Increases in Area Burned at High Severity in Western US Forests from 1985 to 2017. Geophys. Res. Lett. 2020, 47, e2020GL089858. [Google Scholar] [CrossRef]
  78. Rollins, M.G. LANDFIRE: A Nationally Consistent Vegetation, Wildland Fire, and Fuel Assessment. Int. J. Wildland Fire 2009, 18, 235. [Google Scholar] [CrossRef] [Green Version]
  79. Claverie, M.; Ju, J.; Masek, J.G.; Dungan, J.L.; Vermote, E.F.; Roger, J.-C.; Skakun, S.V.; Justice, C. The Harmonized Landsat and Sentinel-2 Surface Reflectance Data Set. Remote Sens. Environ. 2018, 219, 145–161. [Google Scholar] [CrossRef]
  80. Dillon, G.K.; Holden, Z.A.; Morgan, P.; Crimmins, M.A.; Heyerdahl, E.K.; Luce, C.H. Both Topography and Climate Affected Forest and Woodland Burn Severity in Two Regions of the Western US, 1984 to 2006. Ecosphere 2011, 2, 1–33. [Google Scholar] [CrossRef]
  81. Kolden, C.A.; Smith, A.M.S.; Abatzoglou, J.T. Limitations and Utilization of Monitoring Trends in Burn Severity Products for Assessing Wildfire Severity in the USA. Int. J. Wildland Fire 2015, 24, 1023–1028. [Google Scholar] [CrossRef]
  82. Moravec, D.; Komárek, J.; López-Cuervo Medina, S.; Molina, I. Effect of Atmospheric Corrections on NDVI: Intercomparability of Landsat 8, Sentinel-2, and UAV Sensors. Remote Sens. 2021, 13, 3550. [Google Scholar] [CrossRef]
  83. Roy, D.P.; Qin, Y.; Kovalskyy, V.; Vermote, E.F.; Ju, J.; Egorov, A.; Hansen, M.C.; Kommareddy, I.; Yan, L. Conterminous United States Demonstration and Characterization of MODIS-Based Landsat ETM+ Atmospheric Correction. Remote Sens. Environ. 2014, 140, 433–449. [Google Scholar] [CrossRef] [Green Version]
  84. Fang, L.; Yang, J. Atmospheric Effects on the Performance and Threshold Extrapolation of Multi-Temporal Landsat Derived DNBR for Burn Severity Assessment. Int. J. Appl. Earth Obs. Geoinf. 2014, 33, 10–20. [Google Scholar] [CrossRef]
  85. Chen, D.; Loboda, T.V.; Hall, J.V. A Systematic Evaluation of Influence of Image Selection Process on Remote Sensing-Based Burn Severity Indices in North American Boreal Forest and Tundra Ecosystems. ISPRS J. Photogramm. Remote Sens. 2020, 159, 63–77. [Google Scholar] [CrossRef]
  86. Jeronimo, S.M.A.; Kane, V.R.; Churchill, D.J.; Lutz, J.A.; North, M.P.; Asner, G.P.; Franklin, J.F. Forest Structure and Pattern Vary by Climate and Landform across Active-Fire Landscapes in the Montane Sierra Nevada. For. Ecol. Manag. 2019, 437, 70–86. [Google Scholar] [CrossRef]
  87. Harvey, B.J.; Andrus, R.A.; Anderson, S.C. Incorporating Biophysical Gradients and Uncertainty into Burn Severity Maps in a Temperate Fire-Prone Forested Region. Ecosphere 2019, 10, e02600. [Google Scholar] [CrossRef] [Green Version]
  88. Holden, Z.A.; Morgan, P.; Smith, A.M.S.; Vierling, L. Beyond Landsat: A Comparison of Four Satellite Sensors for Detecting Burn Severity in Ponderosa Pine Forests of the Gila Wilderness, NM, USA. Int. J. Wildland Fire 2010, 19, 449–458. [Google Scholar] [CrossRef] [Green Version]
  89. Meng, R.; Wu, J.; Schwager, K.L.; Zhao, F.; Dennison, P.E.; Cook, B.D.; Brewster, K.; Green, T.M.; Serbin, S.P. Using High Spatial Resolution Satellite Imagery to Map Forest Burn Severity across Spatial Scales in a Pine Barrens Ecosystem. Remote Sens. Environ. 2017, 191, 95–109. [Google Scholar] [CrossRef] [Green Version]
  90. Stevens, J.T.; Collins, B.M.; Miller, J.D.; North, M.P.; Stephens, S.L. Changing Spatial Patterns of Stand-Replacing Fire in California Conifer Forests. For. Ecol. Manag. 2017, 406, 28–36. [Google Scholar] [CrossRef]
  91. Harvey, B.J.; Donato, D.C.; Turner, M.G. Drivers and Trends in Landscape Patterns of Stand-Replacing Fire in Forests of the US Northern Rocky Mountains (1984–2010). Landsc. Ecol. 2016, 31, 2367–2383. [Google Scholar] [CrossRef]
  92. Singleton, M.P.; Thode, A.E.; Sánchez Meador, A.J.; Iniguez, J.M.; Stevens, J.T. Management Strategy Influences Landscape Patterns of High-Severity Burn Patches in the Southwestern United States. Landsc. Ecol. 2021, 36, 3429–3449. [Google Scholar] [CrossRef]
  93. Collins, B.M.; Stevens, J.T.; Miller, J.D.; Stephens, S.L.; Brown, P.M.; North, M.P. Alternative Characterization of Forest Fire Regimes: Incorporating Spatial Patterns. Landsc. Ecol. 2017, 32, 1543–1552. [Google Scholar] [CrossRef]
  94. Wu, J.; Shen, W.; Sun, W.; Tueller, P.T. Empirical Patterns of the Effects of Changing Scale on Landscape Metrics. Landsc. Ecol. 2002, 17, 761–782. [Google Scholar] [CrossRef]
  95. Meddens, A.J.H.; Kolden, C.A.; Lutz, J.A.; Smith, A.M.S.; Cansler, C.A.; Abatzoglou, J.T.; Meigs, G.W.; Downing, W.M.; Krawchuk, M.A. Fire Refugia: What Are They, and Why Do They Matter for Global Change? BioScience 2018, 68, 944–954. [Google Scholar] [CrossRef]
Figure 1. Location of the 26 fires in the western portion of North America (inset map). Montane-forested ecoregions are displayed in light gray (EPA Level II Ecoregions Northwestern Forested Mountains and Temperate Sierras [54]). Numbers correspond to individual fire IDs (see Table 1).
Remotesensing 14 05249 g001
Figure 2. Differences in the proportion of forest-classified pixels among the mapped fires for three severity classes (low, moderate, and high) and as high-severity patch interior (high-severity pixels >90 m from the nearest low or moderate severity pixel). Severity classes were derived from RdNBR calculated using the extended composite approach (see Section 2.4), and the difference in percent estimated for each class is shown between Landsat and Sentinel (A), and Sentinel at 10 m resolution and resampled to 30 m resolution (C). Each dot represents one of the 26 fires (the two smallest fires were excluded for the high-severity patch interior), and the bars show the mean ±1 standard deviation. The relationship between percent high severity and percent high-severity patch interior for each fire is shown as mapped by Landsat (red circle) and Sentinel (blue triangle) (B). Frequency plots of the continuous RdNBR values for the Hayes Two fire are overlaid as mapped by Sentinel at 10 m resolution (blue) and 30 m resolution (red), with the vertical dashed lines depicting the categorical breaks between low/moderate severity and moderate/high severity (D).
Remotesensing 14 05249 g002
Figure 3. Maps of high-severity patch interior for the 2017 Meyers fire in southwestern Montana (A), and the 2018 Trail Mountain fire in central Utah (B) derived from Landsat (left column) and Sentinel (right column) imagery. High-severity patch interior (red) was mapped from all high-severity pixels 90 m or further from the nearest low- or moderate-severity forest-classified pixel. Tan areas represent all other forest-classified pixels; white areas were classified as non-forest. For the Meyers fire, Landsat predicts 10.7% more high-severity patch interior than Sentinel (2801 additional hectares). For the Trail Mountain fire, Landsat predicts 11.0% more high-severity patch interior than Sentinel (710 additional hectares). Maps using Landsat imagery are at their native 30 m resolution, while Sentinel maps use 10 m resolution. Severity was derived from RdNBR measured using the extended compositing approach in GEE, with severity thresholds estimated from NLS models of the satellite-derived burn severity fit to field-based CBI measurements.
Remotesensing 14 05249 g003
Table 1. Fires analyzed in this study. Overstory species within each fire were estimated from the basal area product of the USDA National Individual Tree Species Atlas [55], which is available within the US. For the Kenow fire, which was located immediately north of the US-Canadian border, we delineated a false perimeter just south of the border in similar terrain in order to extract estimates of overstory species prevalence to maintain dataset consistency. Tree species abbreviations: Abies amabilis (ABAM) Pacific silver fir; Abies concolor (ABCO) white fir; Abies grandis (ABGR) grand fir; Abies lasiocarpa (ABLA) subalpine fir; Juniperus osteosperma (JUOS) Utah juniper; Larix occidentalis (LAOC) western larch; Picea engelmannii (PIEN) Engelmann spruce; Pinus albicaulis (PIAL) whitebark pine; Pinus contorta (PICO) lodgepole pine; Pinus edulis (PIED) two-needle piñon pine; Pinus flexilis (PIFL) limber pine; Pinus ponderosa (PIPO) ponderosa pine; Populus tremuloides (POTR) quaking aspen; Pseudotsuga menziesii (PSME) Douglas-fir; Thuja plicata (THPL) western redcedar; Tsuga heterophylla (TSHE) western hemlock; and Tsuga mertensiana (TSME) mountain hemlock.
Map IDFireYearFire Size (ha)Elevation
(m)
CBI PlotsData Source *Overstory Species
(in Order of Prevalence)
1Hayes Two20161081988–1903313ABAM, ABLA, TSHE, PSME, TSME
2Norse Peak201720,590830–2099351ABAM, PSME, TSME, TSHE, PIEN
3Rock Creek2016552983–1359111PSME, ABGR, PIPO
4Jolly Mountain201715,399693–1929121PSME, ABGR, TSHE, PIPO, THPL
5Jones20174144328–1147271PSME, TSHE, THPL
6Rebel20173653570–163381PSME, TSHE, THPL, ABGR
7Milli 0843 CS201797221092–2200651PIPO, TSME, ABAM, PICO, ABGR
8Rail201617,6931325–2370231PICO, ABGR, PSME, PIPO, LAOC, ABCO
9Pioneer201676,5721002–2649121PSME, PICO, ABLA, PIPO, PIEN
10Kenow201720,0581263–24091475ABLA, PIEN, PSME
11Lolo Peak201725,1521010–2779211PSME, ABLA, PICO, LAOC, PIEN, PIPO
12Liberty201711,1911339–233091ABLA, PICO, PSME, PIEN, LAOC
13Rice Ridge201769,2021266–2652271PSME, ABLA, PIEN, PICO, LAOC, PIAL
14Meyers201727,7381664–2921231PICO, ABLA, PIEN, PIAL, PSME
15Maple201620,8352003–2666361, 3PICO, PSME, ABLA, PIEN
16Berry201683942061–2797271PICO, ABLA, PIEN
17Legion Lake201722,1621022–1719322PIPO
18Bald Mountain201884961694–3229174PSME, POTR, ABLA, ABCO
19Mammoth20192702757–3129256PIEN, ABLA, PSME, POTR
20Trail Mountain201874162121–3233384PSME, POTR, ABLA, PIEN
21Skull Flat20196742272–3031316ABCO, PSME, ABLA, POTR
22Skull Flat 2201910222313–3030306ABLA, POTR, ABCO, PSME
23Brianhead201730,0422169–3371724ABLA, POTR, PIEN, PIPO
24Little Bear201910782395–2828476PIPO, ABCO, PIFL, PSME
25Chippean2019912323–2405336PIPO, PSME, PIED, JUOS
26Fuller201661801314–2761732PIPO, ABCO, PIED, JUOS, POTR
* Composite burn index (CBI) data sources: (1) Brian Harvey and Saba Saberi, University of Washington [22]; (2) Joshua Picotte, USGS [56]; (3) US National Park Service; (4) Larissa Yocom, Utah State University; (5) Parks Canada; (6) James Lutz, Utah State University, Utah Forest Institute.
Table 2. Comparison of Sentinel-2 MultiSpectral Instrument (MSI) and Landsat 8 Operational Land Imager (OLI) radiometric and spatial resolutions of spectral bands.
Band NameSentinel-2 MSILandsat 8 OLI
Index
Number
Wavelength (nm)Spatial Resolution (m)Index
Number
Wavelength (nm)Spatial Resolution (m)
Coastal aerosolB1432–45360B1433–45330
BlueB2459–52510B2450–51530
GreenB3541–57810B3525–60030
RedB4649–68110B4630–68030
Red edge 1B5696–71220
Red edge 2B6732–74820
NIR (narrow 1)B7770–79320
NIRB8780–88610B5845–88530
NIR (narrow 2)B8A853–87520
Water vaporB9933–95560
SWIR CirrusB101358–139260B91360–138030
SWIR 1B111563–165920B61560–166030
SWIR 2B122093–229020B72100–230030
Panchromatic B8500–68015
Table 3. Image season date ranges for pre- and post-fire imagery used in composite imagery methods for calculating burn severity. YBF indicates “Year Before Fire”, YOF indicates “Year of Fire”, and YAF indicates “Year After Fire”.
MethodPre-Fire Imagery SeasonPost-Fire Imagery Season
StartEndStartEnd
Extended1 June YBF30 September YBF1 June YAF30 September YAF
1 June YOFFire Start Day
Hybrid20 May YBF31 August YBFDay after fire ends YOF15 November YOF
Day after snow cover ends YAF1 July YAF
Table 4. Composite imagery method model fit (R2) and normalized root-mean-square error (RMSE) for non-linear least squares regression between composite burn index (CBI) plots and remotely sensed burn severity estimates using either Landsat or Sentinel imagery. Results are presented for the four spectral indices tested and computed using pre- and post-fire imagery composited using either the extended or hybrid imagery seasons (see Table 3). Models were fit to the combined dataset of 912 CBI plots from all 26 fires.
Composite Imagery MethodSpectral IndexLandsat 8
Surface Reflectance (Tier 1)
Sentinel-2
Top of Atmosphere
(Level 1C)
R2RMSER2RMSE
Extended imagery seasonsdNBR0.5520.5380.5610.526
RBR0.6060.4800.6130.474
RdNBR0.6130.4630.6430.447
RdNDVI0.5540.5190.4260.765
Hybrid imagery seasonsdNBR0.5700.5020.5170.542
RBR0.6270.4430.5730.489
RdNBR0.6410.4230.5790.487
RdNDVI0.5620.4410.5150.396
Table 5. Paired scene method model fit (R2) and normalized root-mean-square error (RMSE) for non-linear least squares regression between composite burn index (CBI) plots and remotely sensed burn severity estimates using either Landsat or Sentinel imagery. Results from Sentinel imagery are presented both for atmospheric and terrain corrected Bottom of Atmosphere (BOA) and uncorrected Top of Atmosphere (TOA) scenes. Models were fit to the combined dataset of 912 CBI plots from all 26 fires.
Spectral IndexLandsat 8Sentinel-2
Surface Reflectance
(Tier 1)
Bottom of Atmosphere
(Level 2A)
Top of Atmosphere
(Level 1C)
R2RMSER2RMSER2RMSE
dNBR0.5370.5170.5780.5050.5330.538
RBR0.5840.4710.6370.4440.6010.465
RdNBR0.6070.4470.6330.4430.4210.661
RdNDVI0.4810.5440.5970.4920.5780.492
Publisher’s Note: MDPI stays neutral with regard to jurisdictional claims in published maps and institutional affiliations.

