
Detecting Maritime Infrared Targets in Harsh Environment by Improved Visual Attention Model Preselector and Anti-Jitter Spatiotemporal Filter Discriminator

Abstract
1. Introduction
- (1)
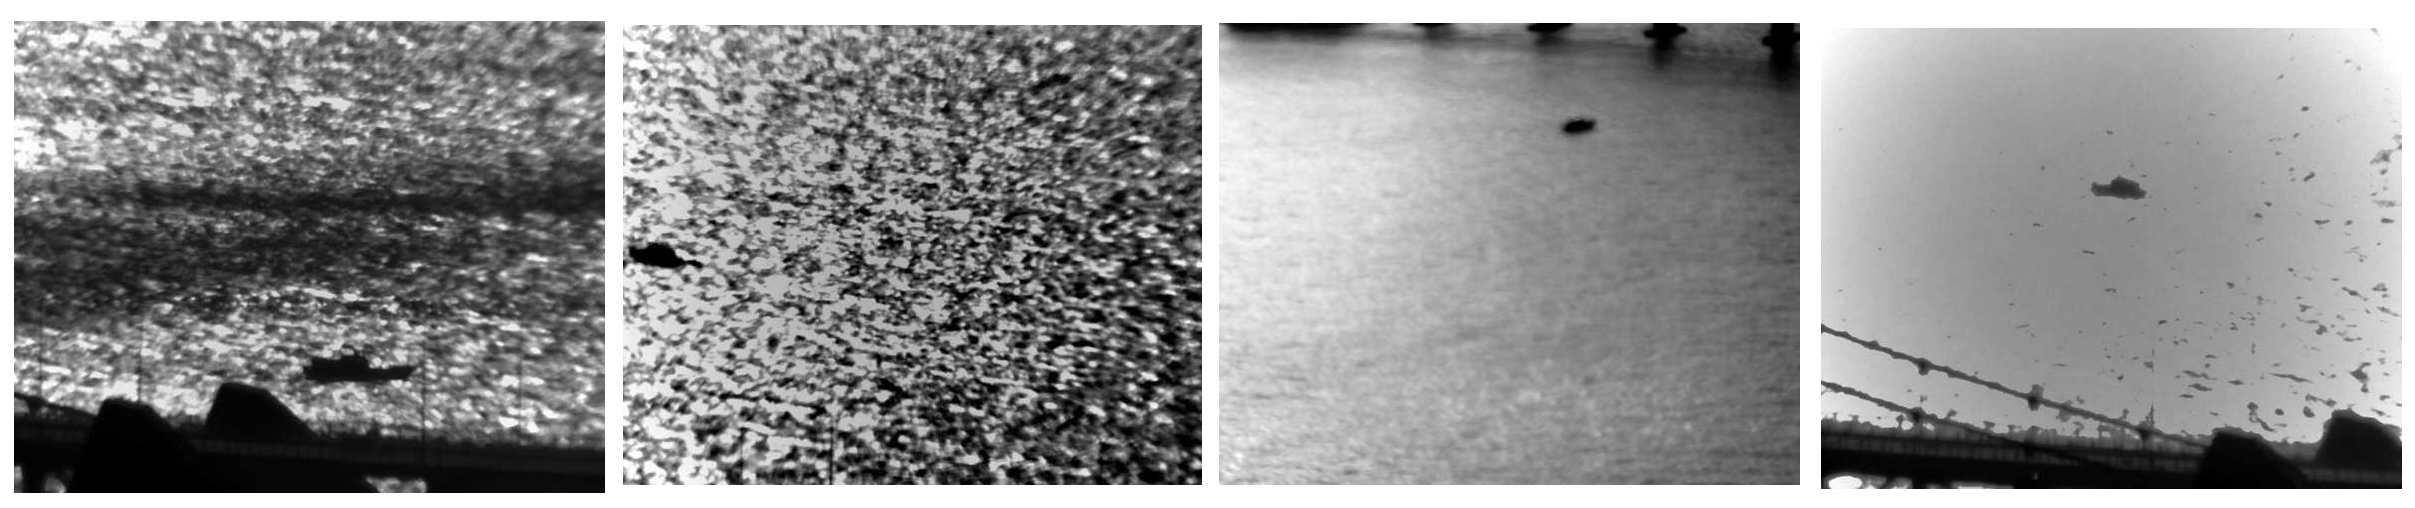
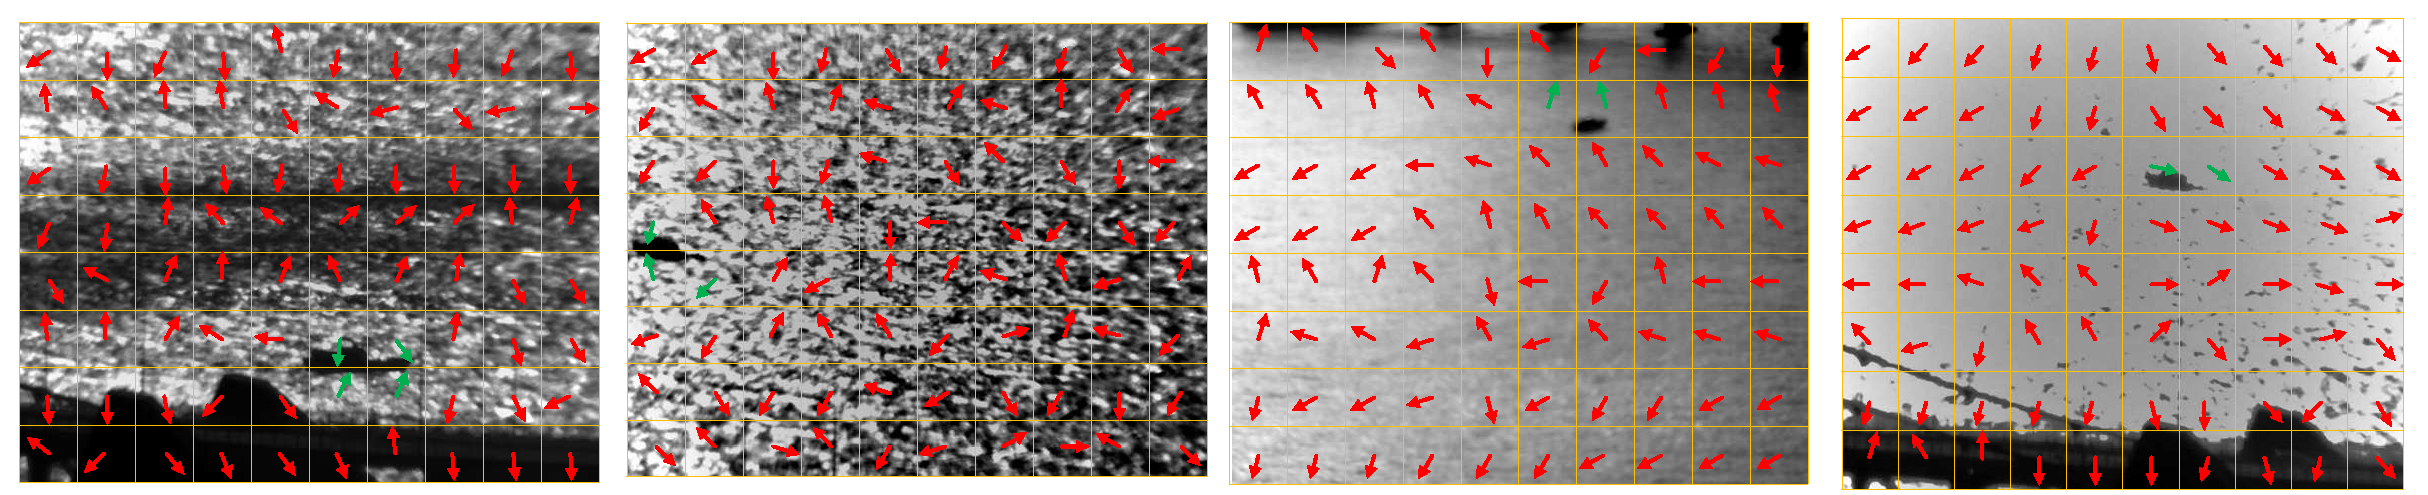
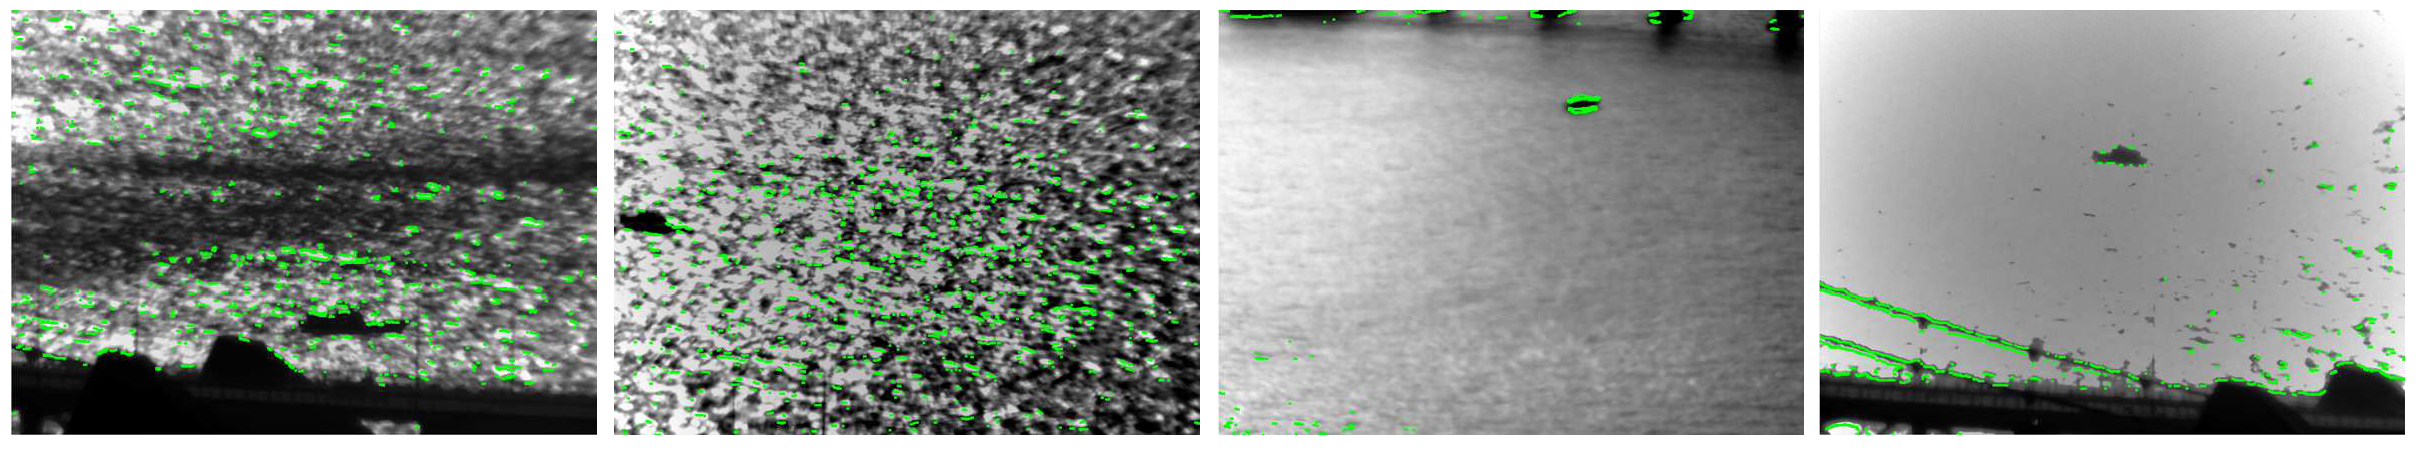
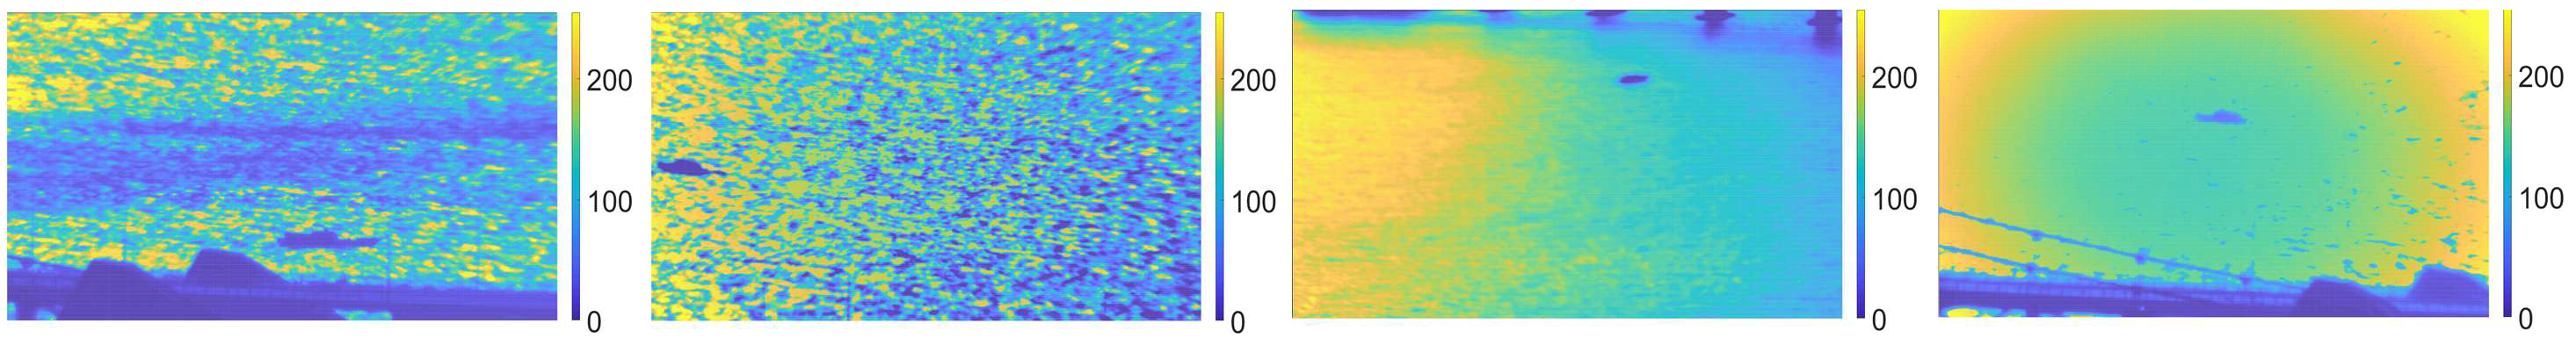
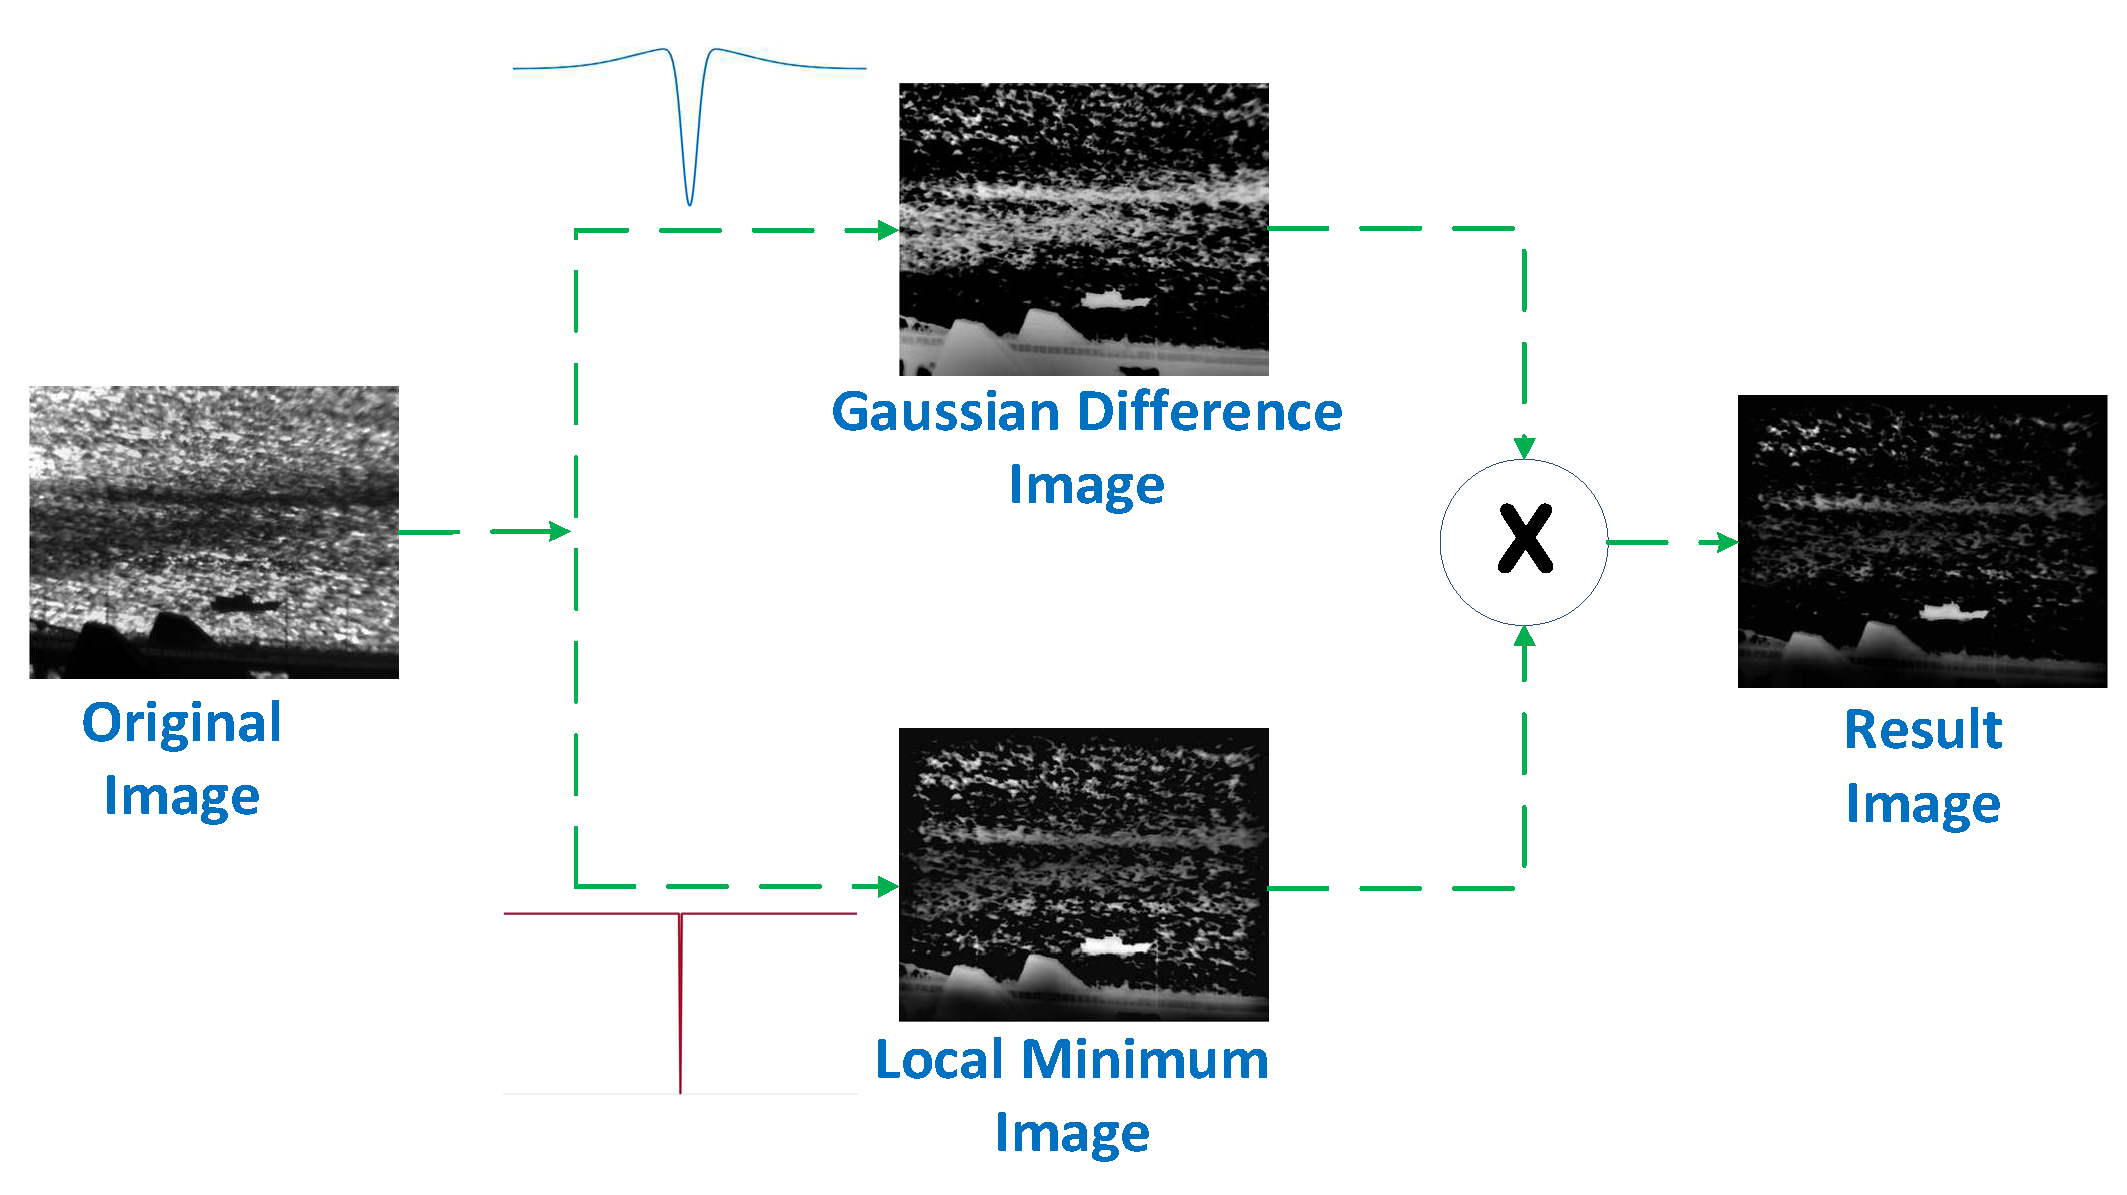
- The orientation feature, contrast feature, infrared thermal feature and frequency domain feature of the target are analyzed, a preprocessing method combining the Gauss difference filter and local minimum filter is constructed to improve the target saliency in the backlight scenario.
- (2)
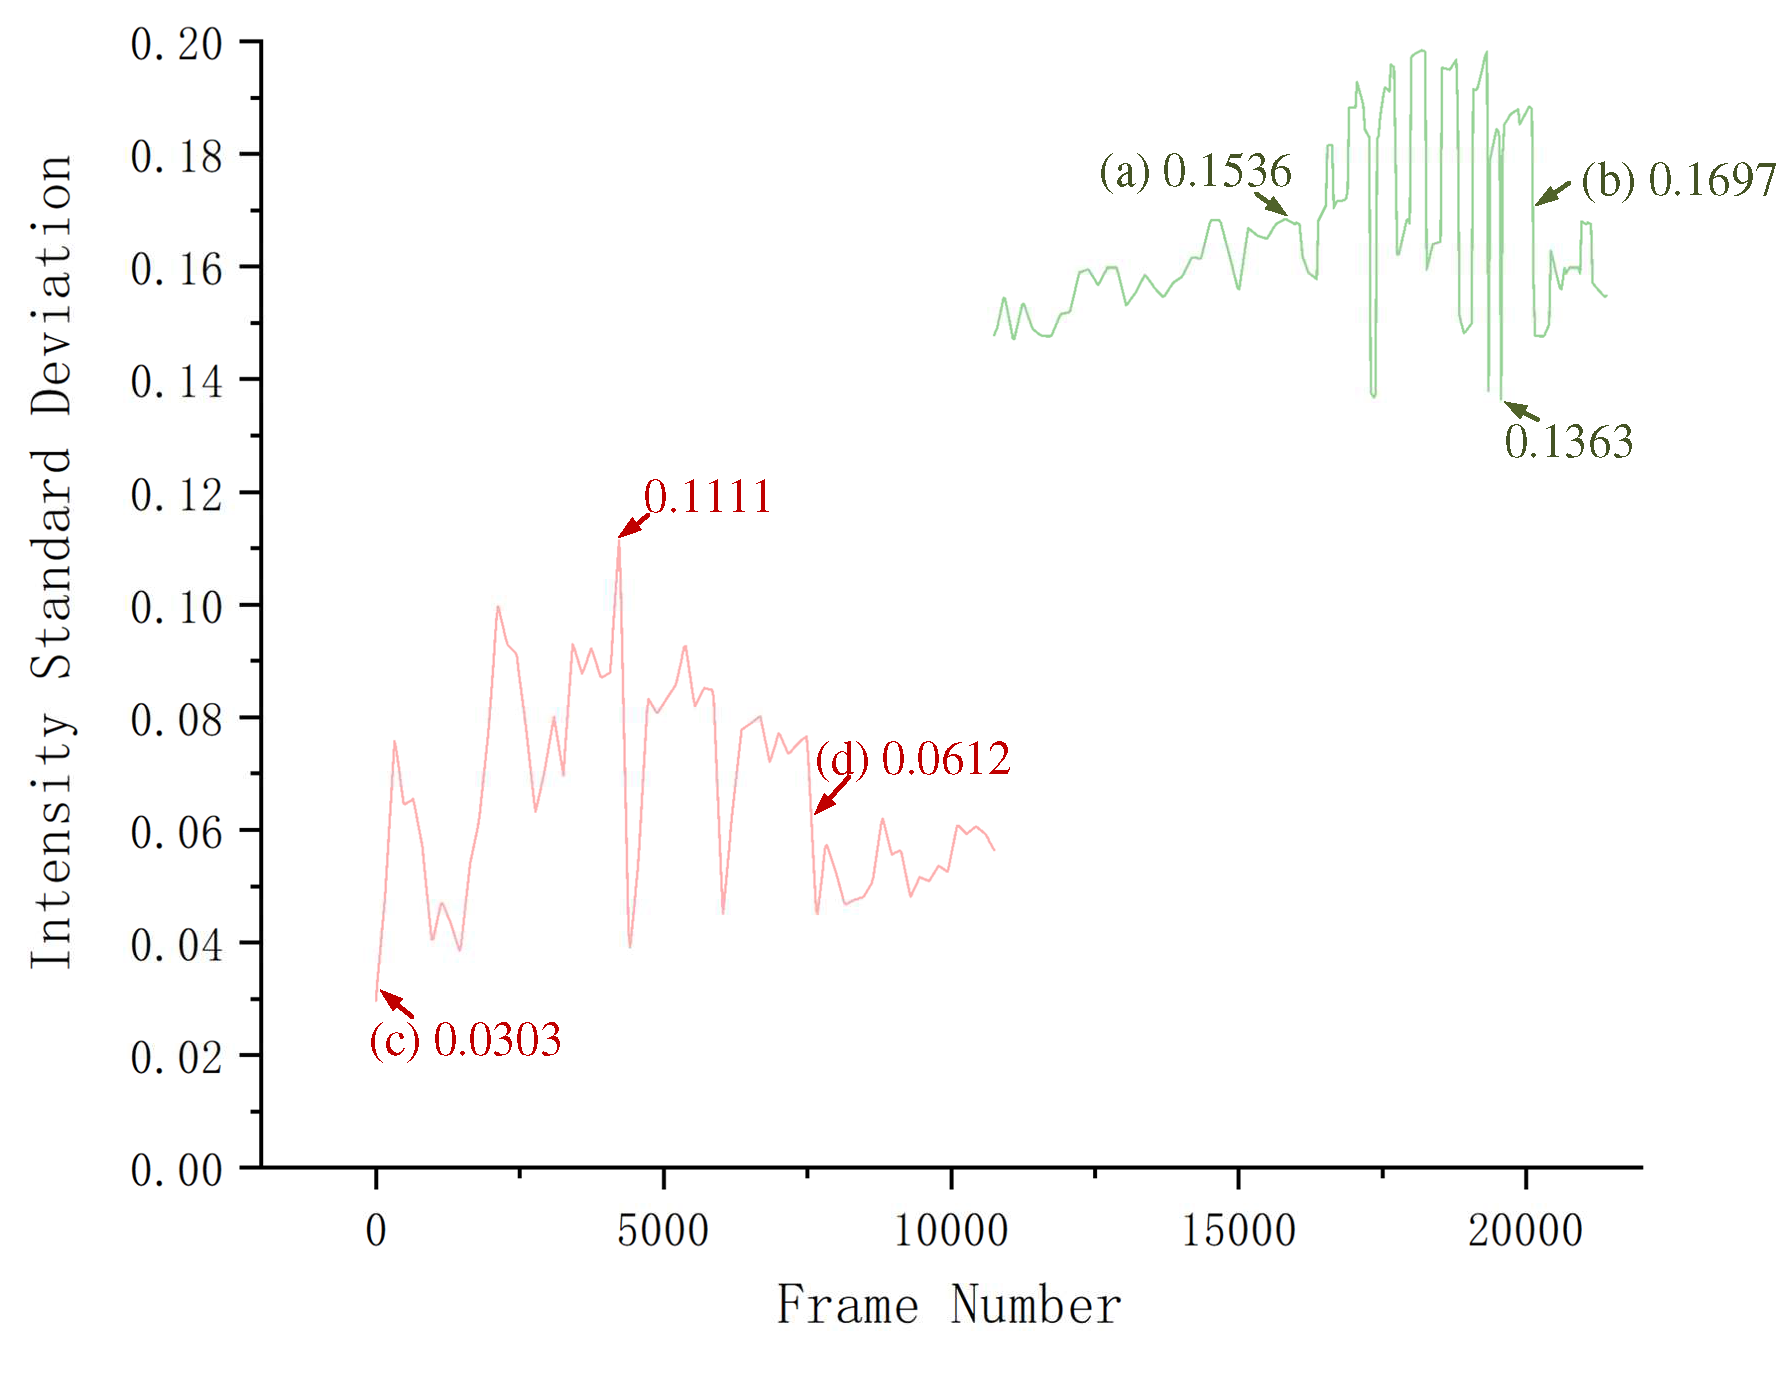
- An intensity standard deviation method is designed to distinguish the background non-uniformity; the purpose is to select a suitable “center-surround difference” operator to suppress the interference of highlight points according to the background smoothness. It also reduces the time consumption of a traditional VAM.
- (3)
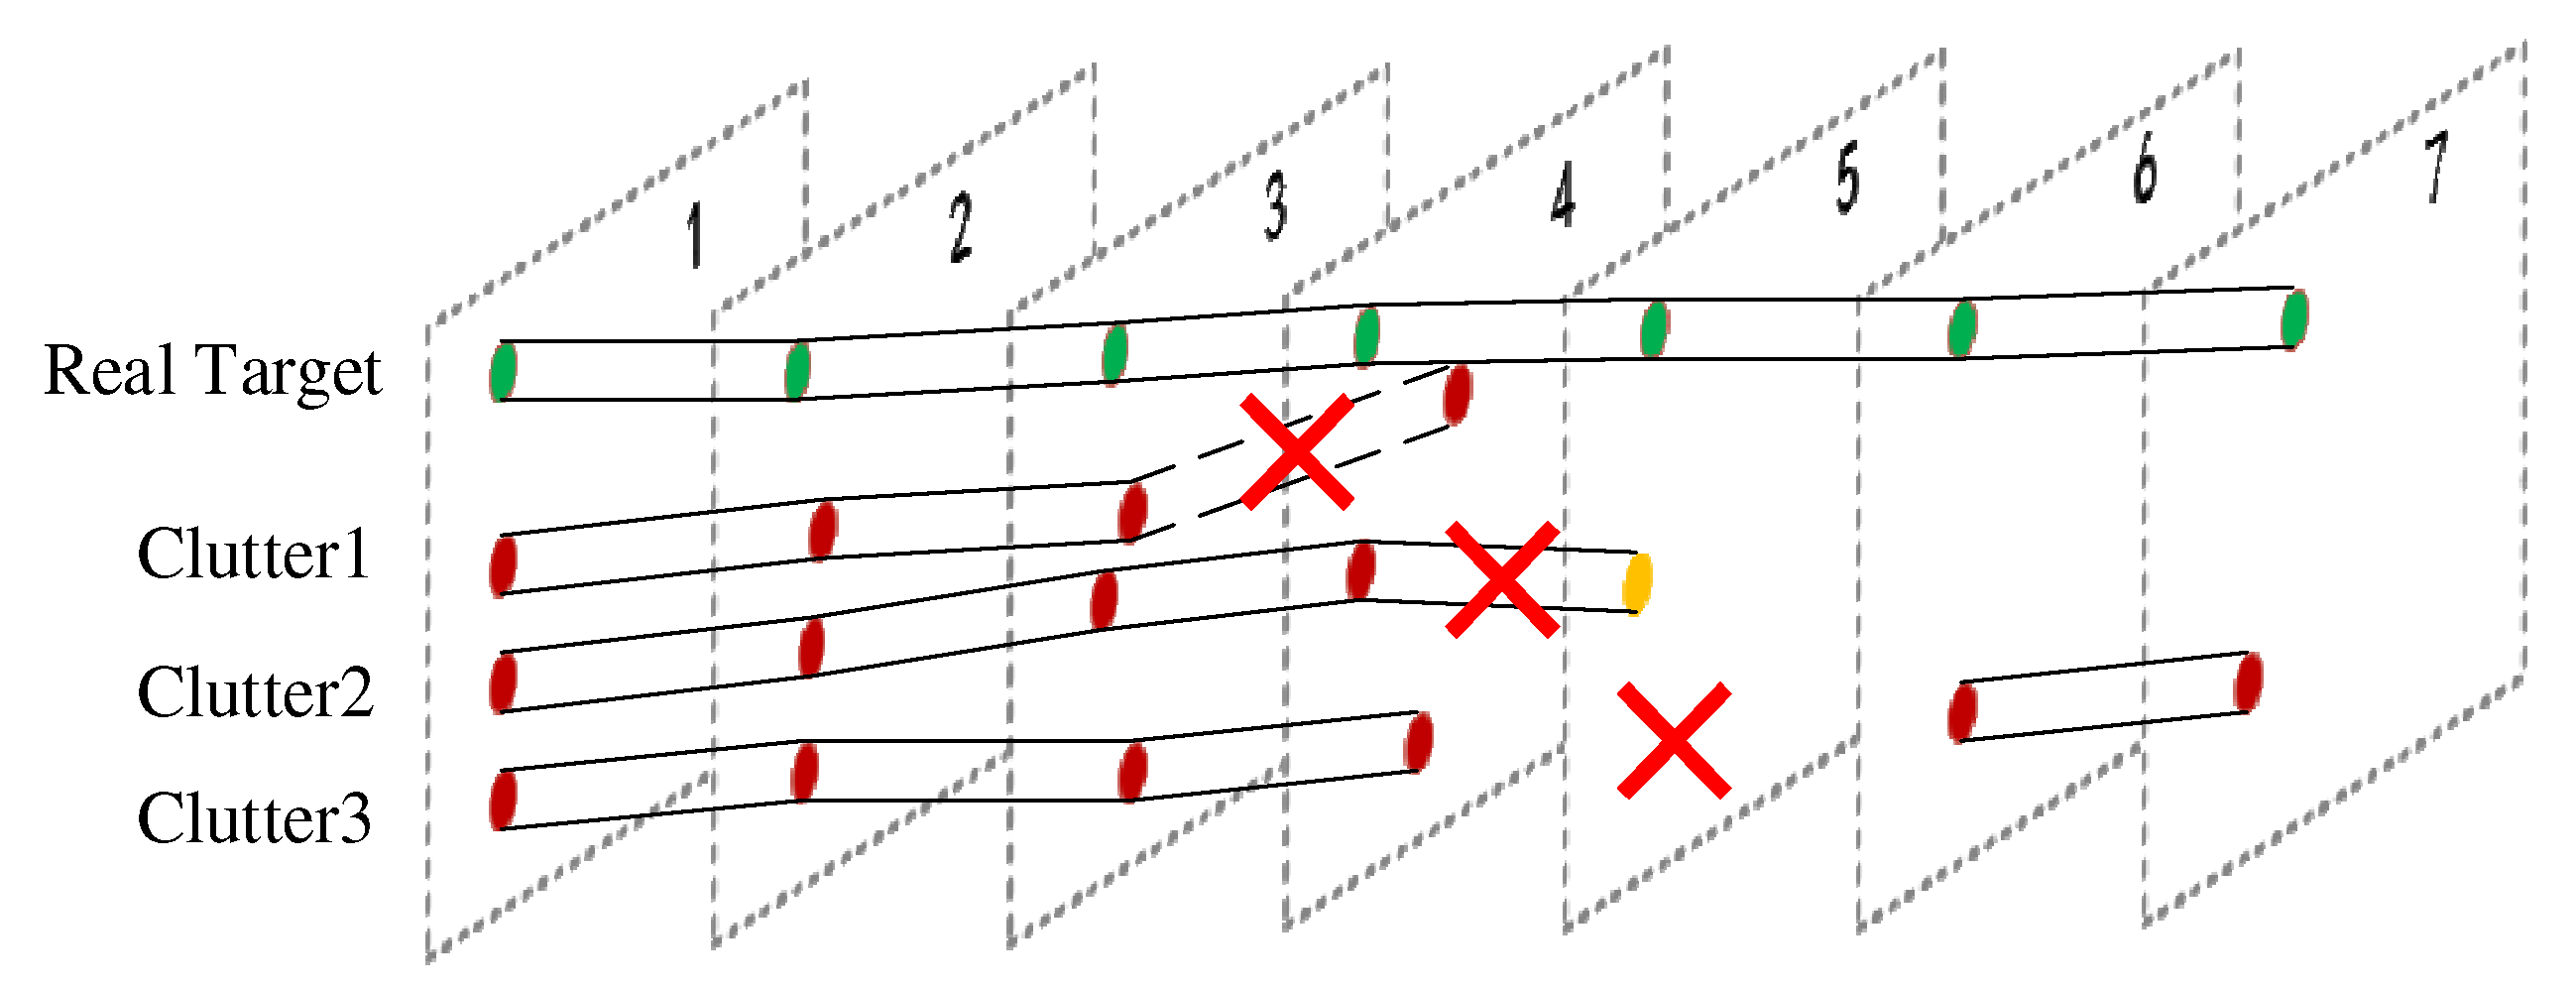
- According to the space–time characteristics of the maritime target, three hypotheses are proposed to realize the multi-frame space–time filtering of the image, to further eliminate the strong background and sea clutter interference.
- (4)
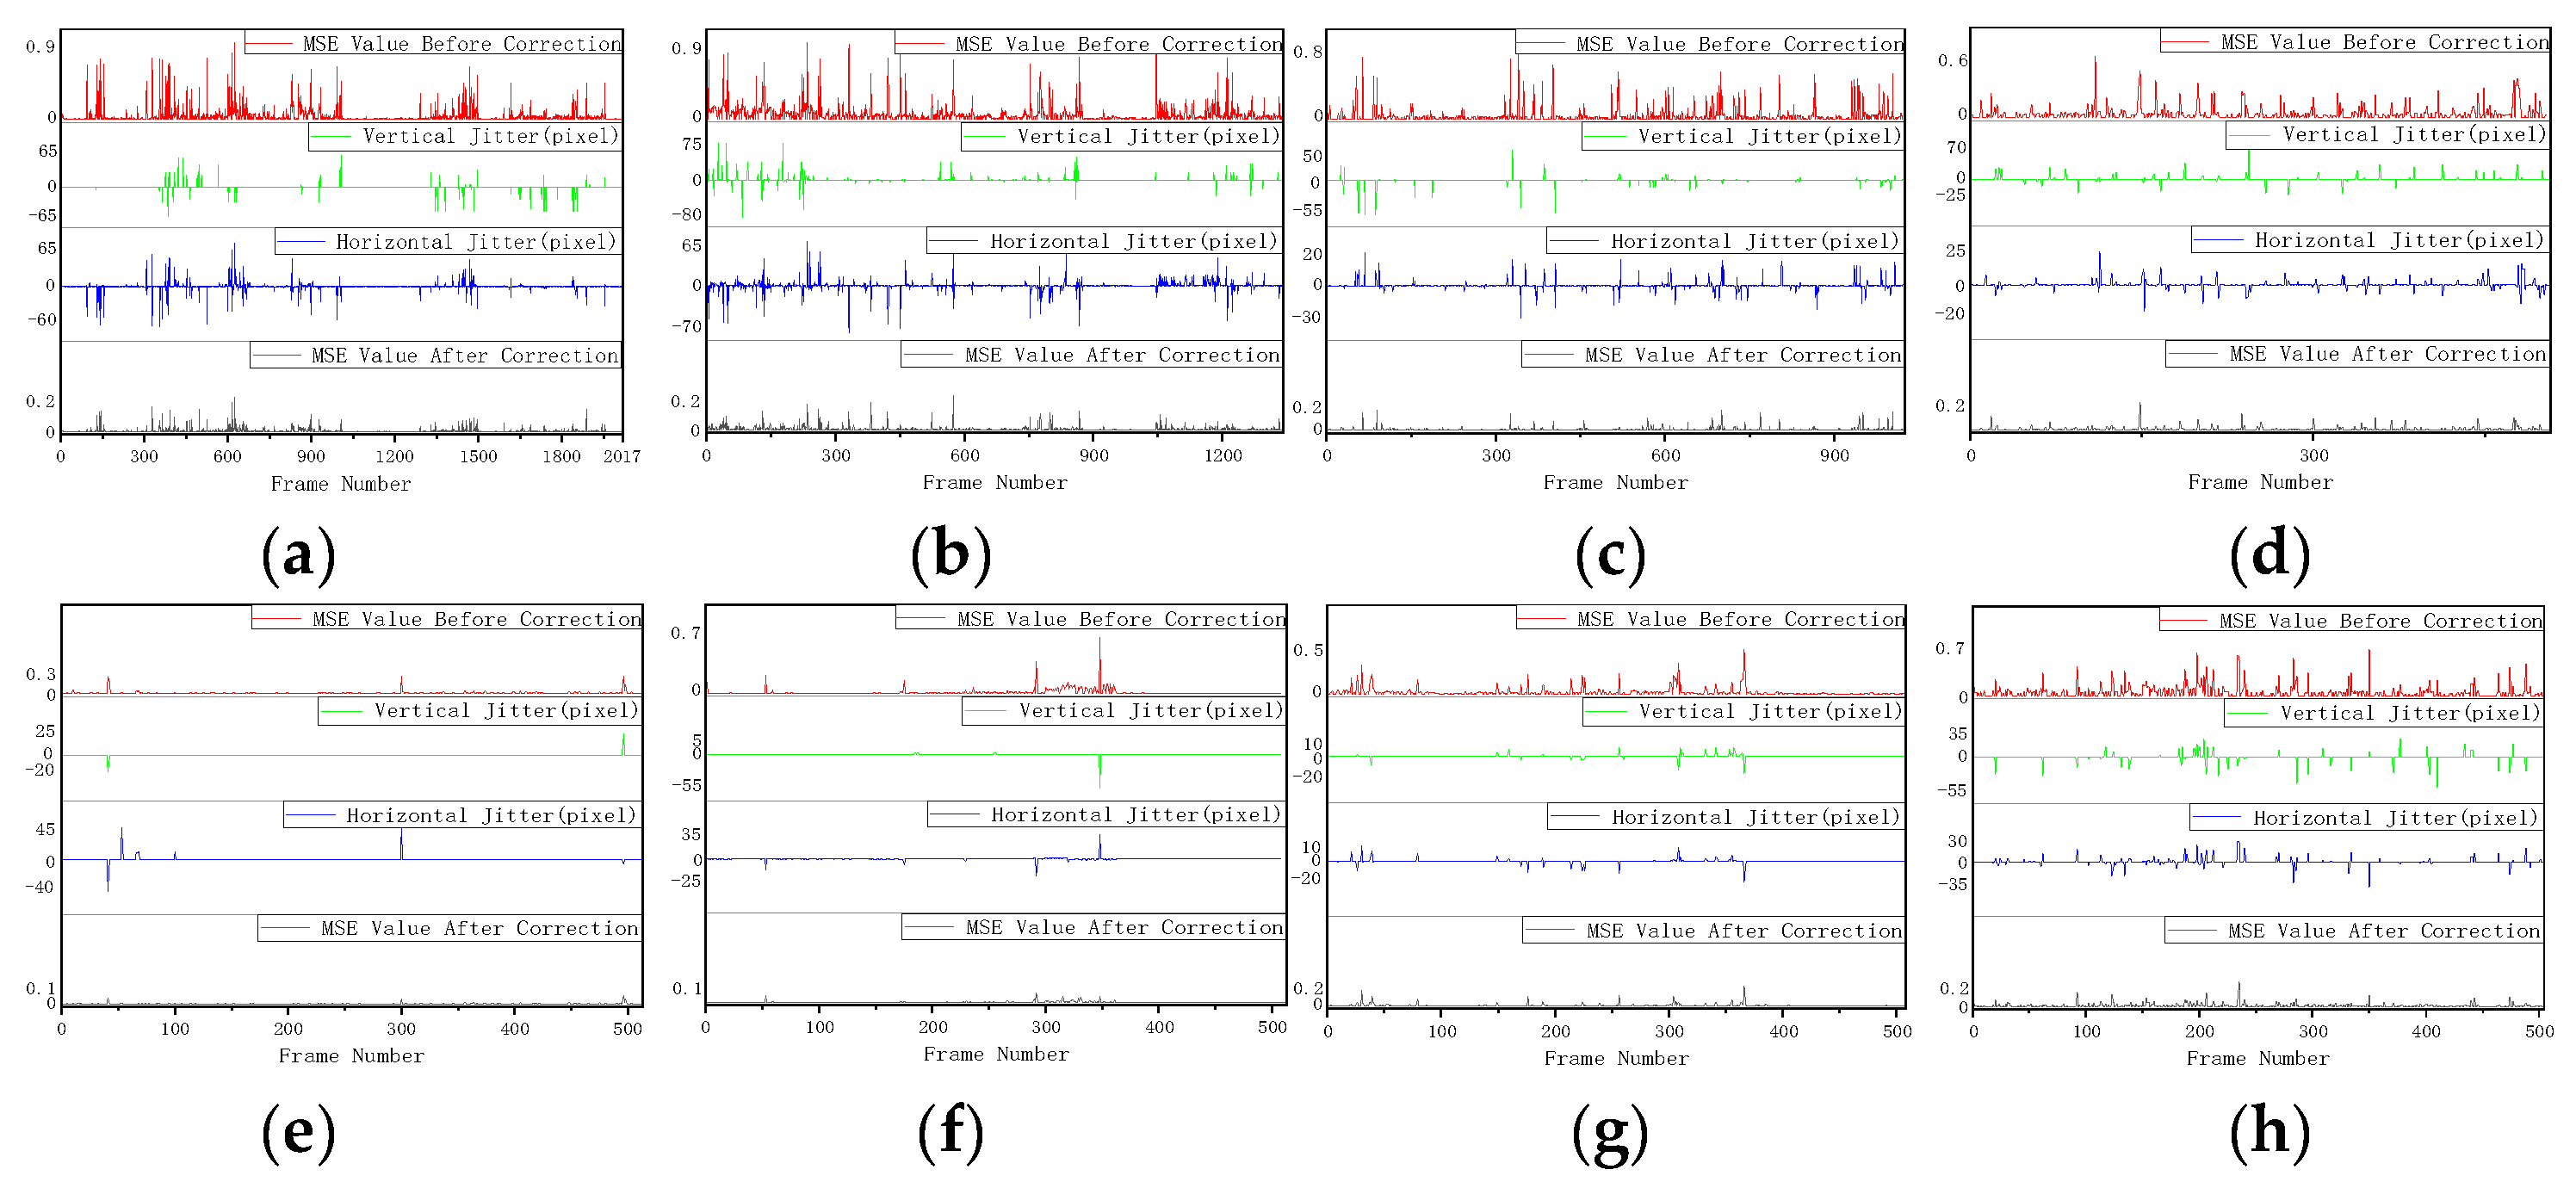
- Considering that the imaging system will produce an inter-frame jitter in the process of practical application, this paper proposes a method of inter-frame jitter position correction to “align” the image sequence, so as to improve the real target detection rate.
2. Materials and Methods
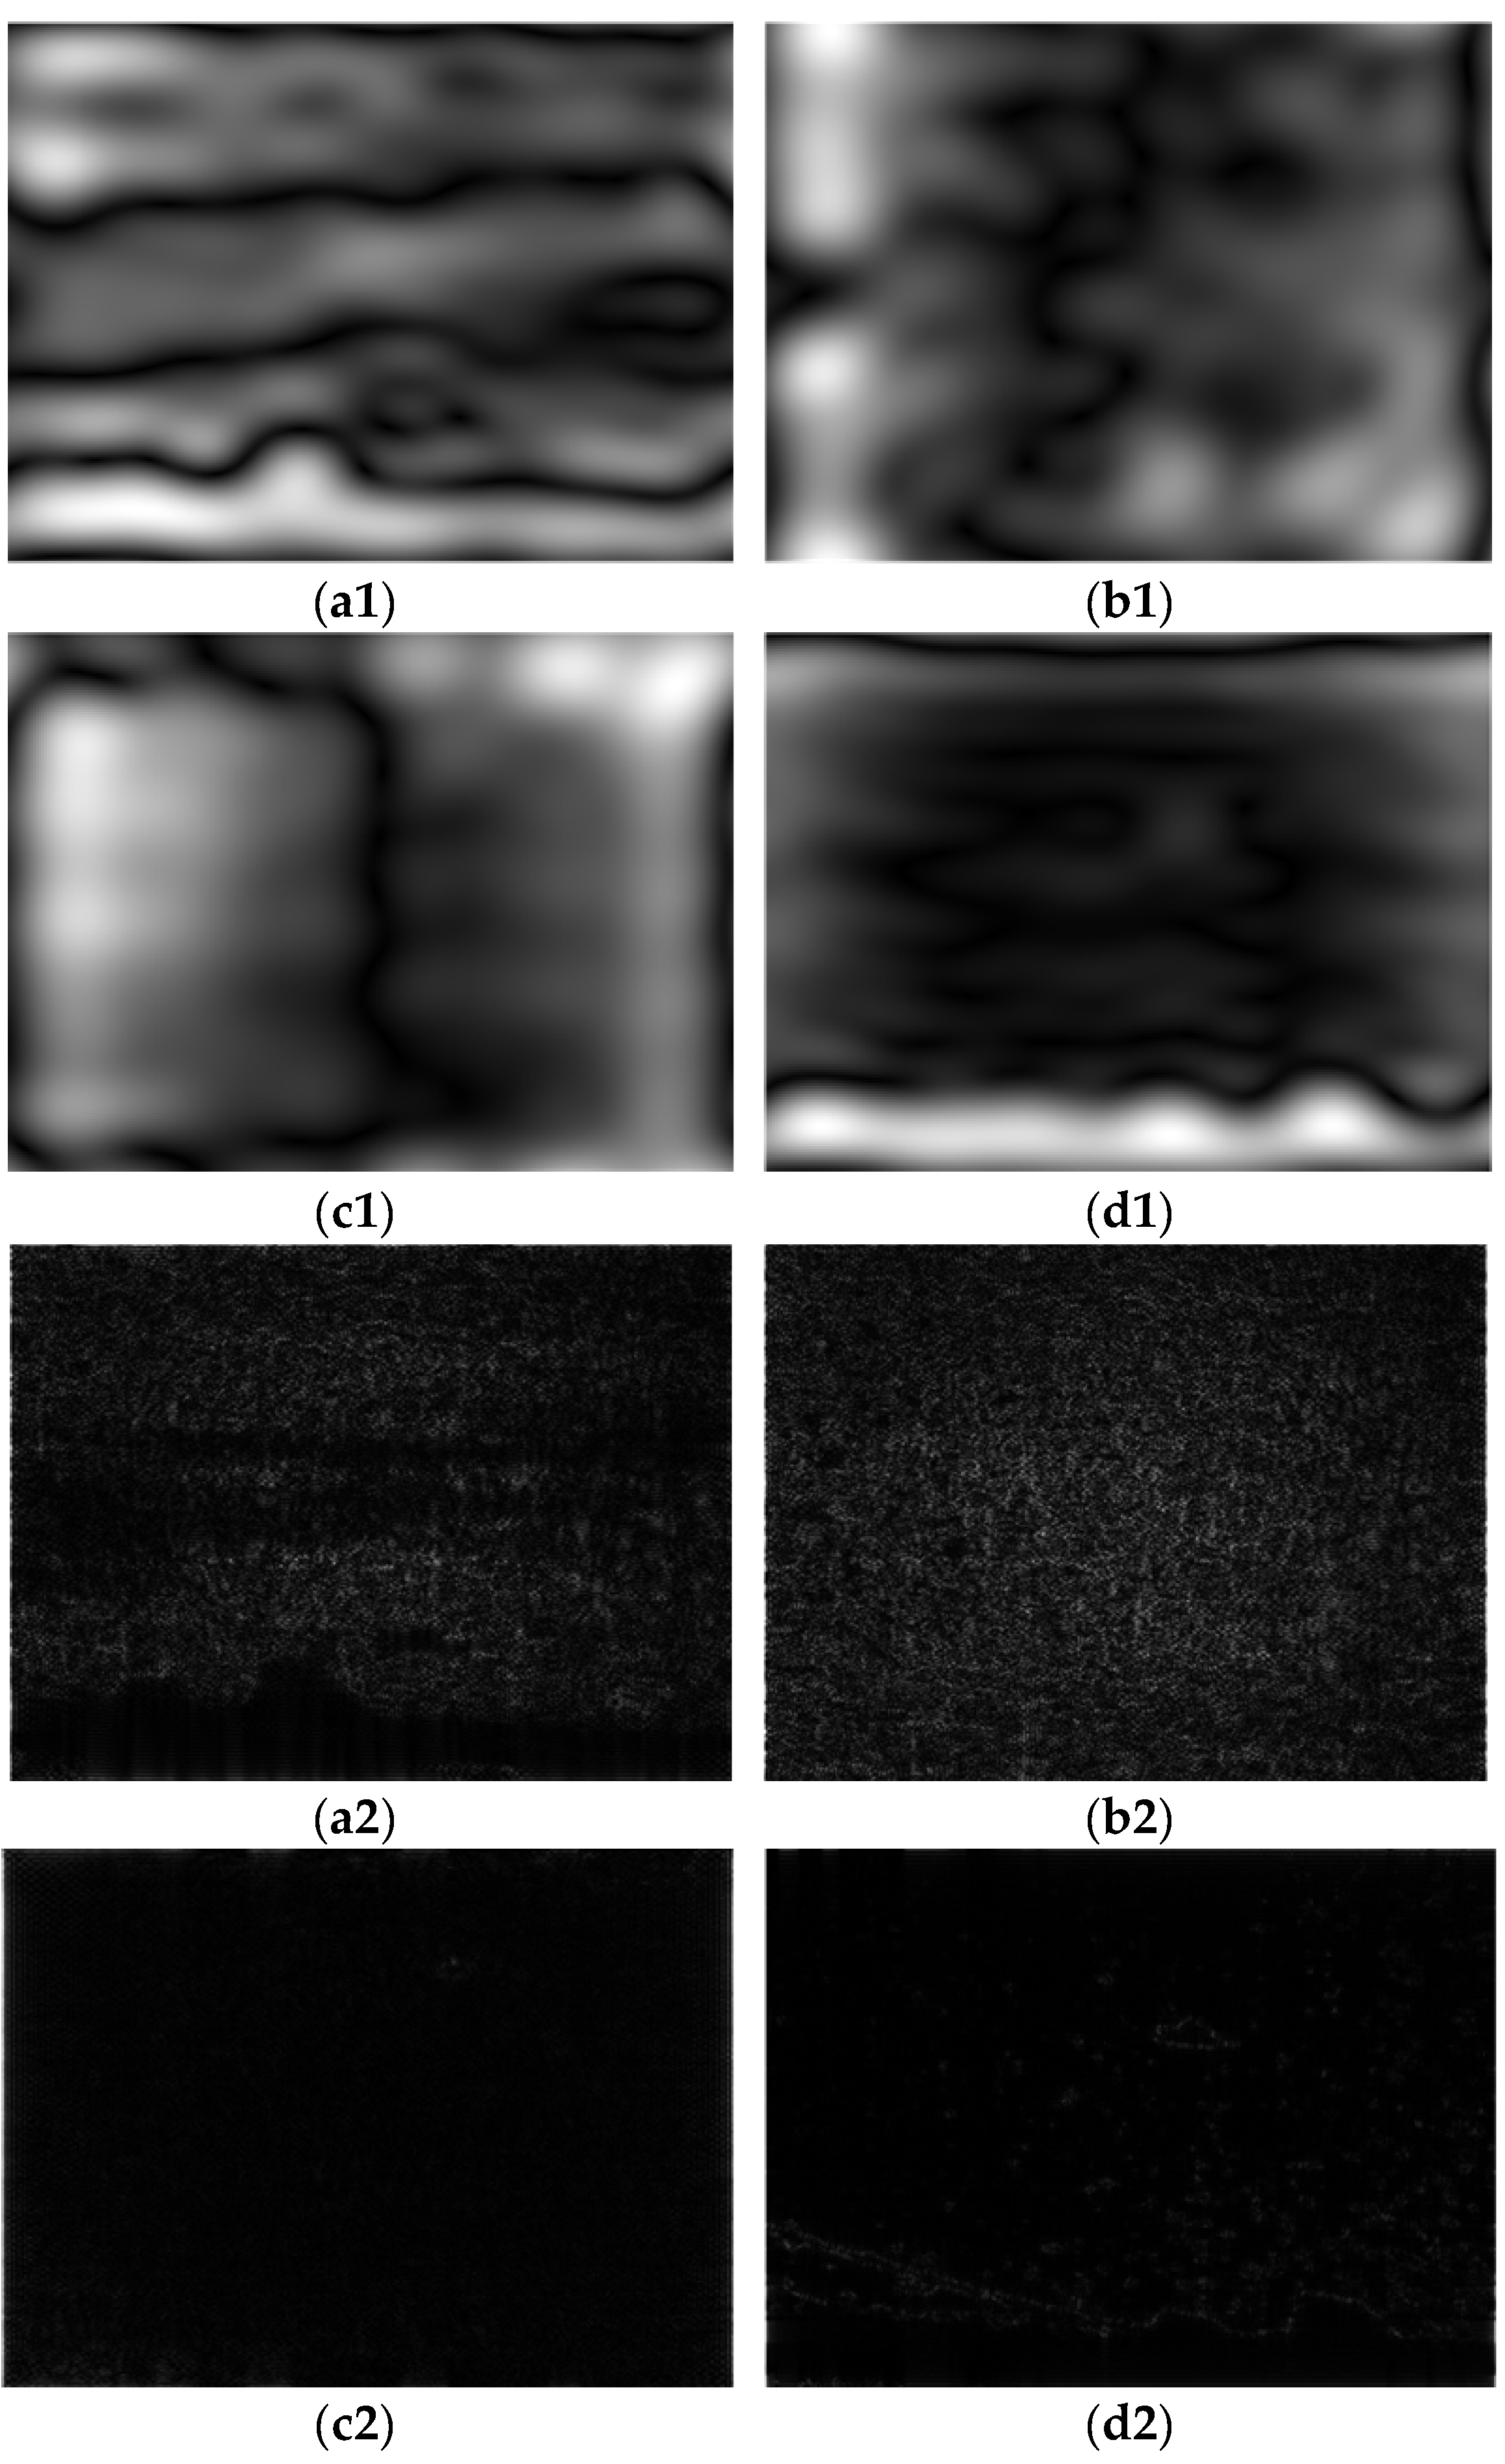
2.1. Image Feature Analysis
2.2. A preprocessing Method to Improve Target Intensity
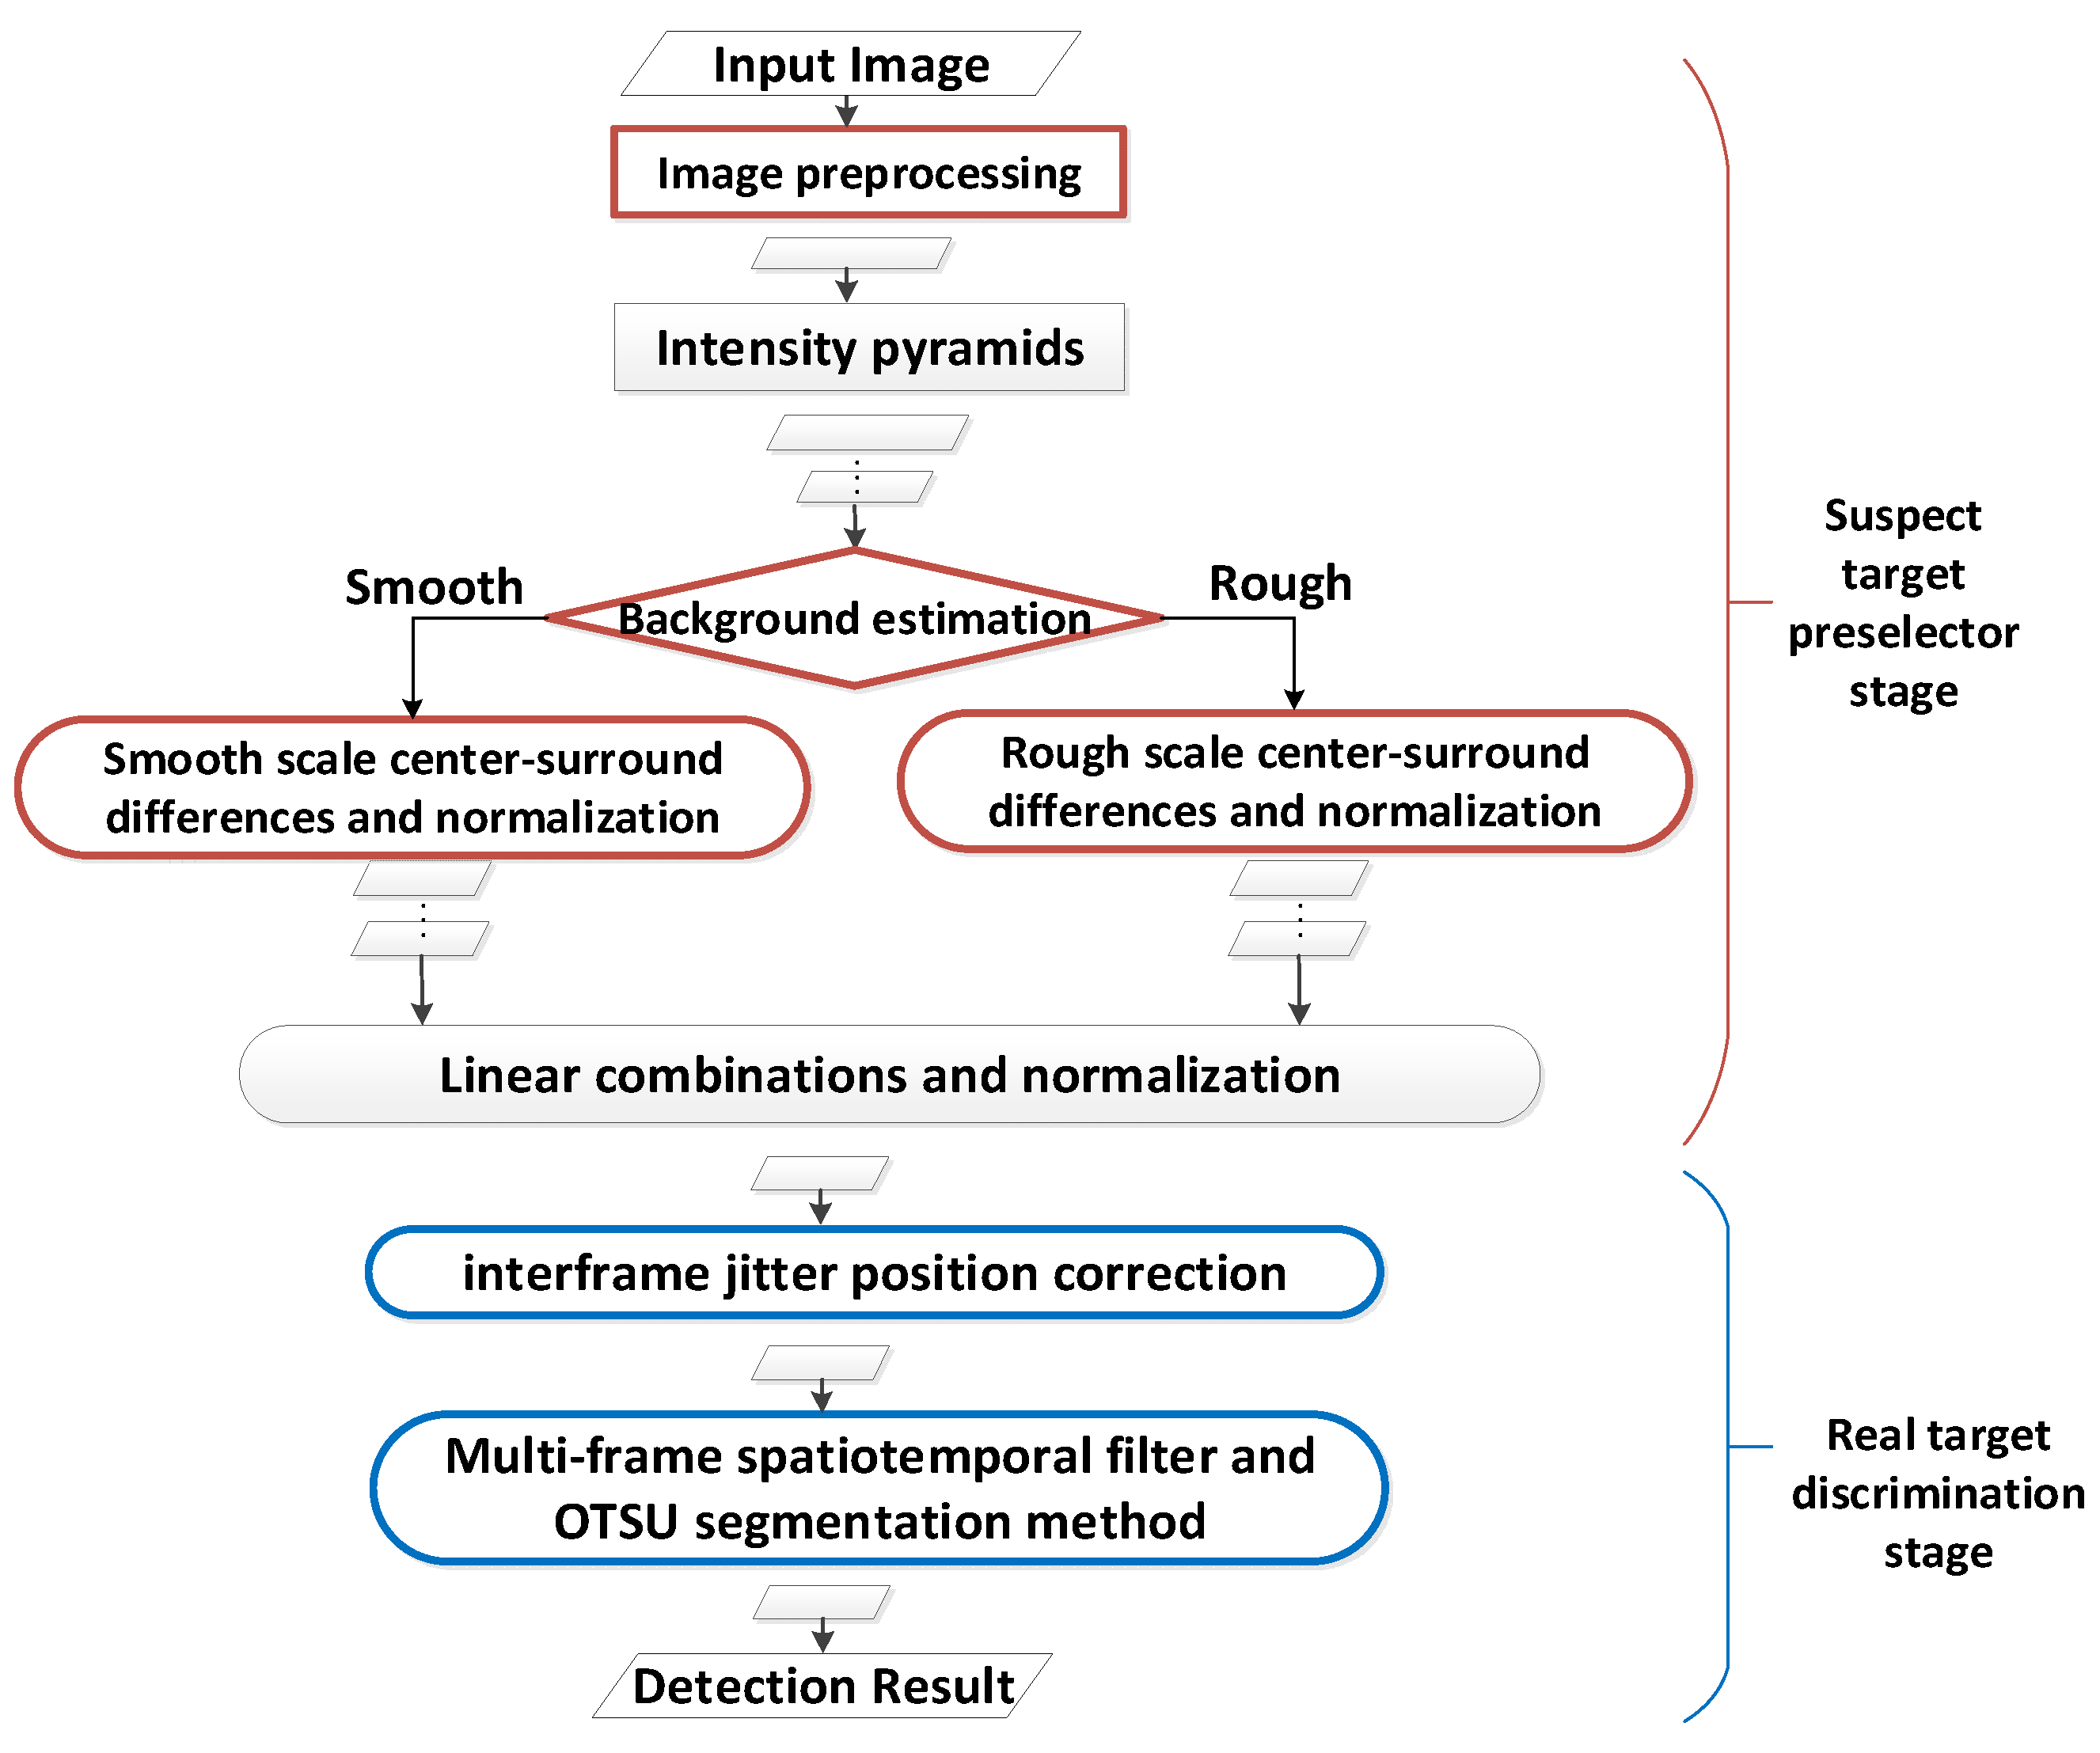
2.3. Suspected Target Pre-Screening Stage
2.4. Real Target Judgment Stage
- (1)
- The target shift between adjacent frames will not be too large;
- (2)
- The intensity of the target in the saliency map of adjacent frames does not differ greatly;
- (3)
- The target will appear continuously within a certain time frame.
3. Results and Discussion
3.1. Real Target Judgment Stage
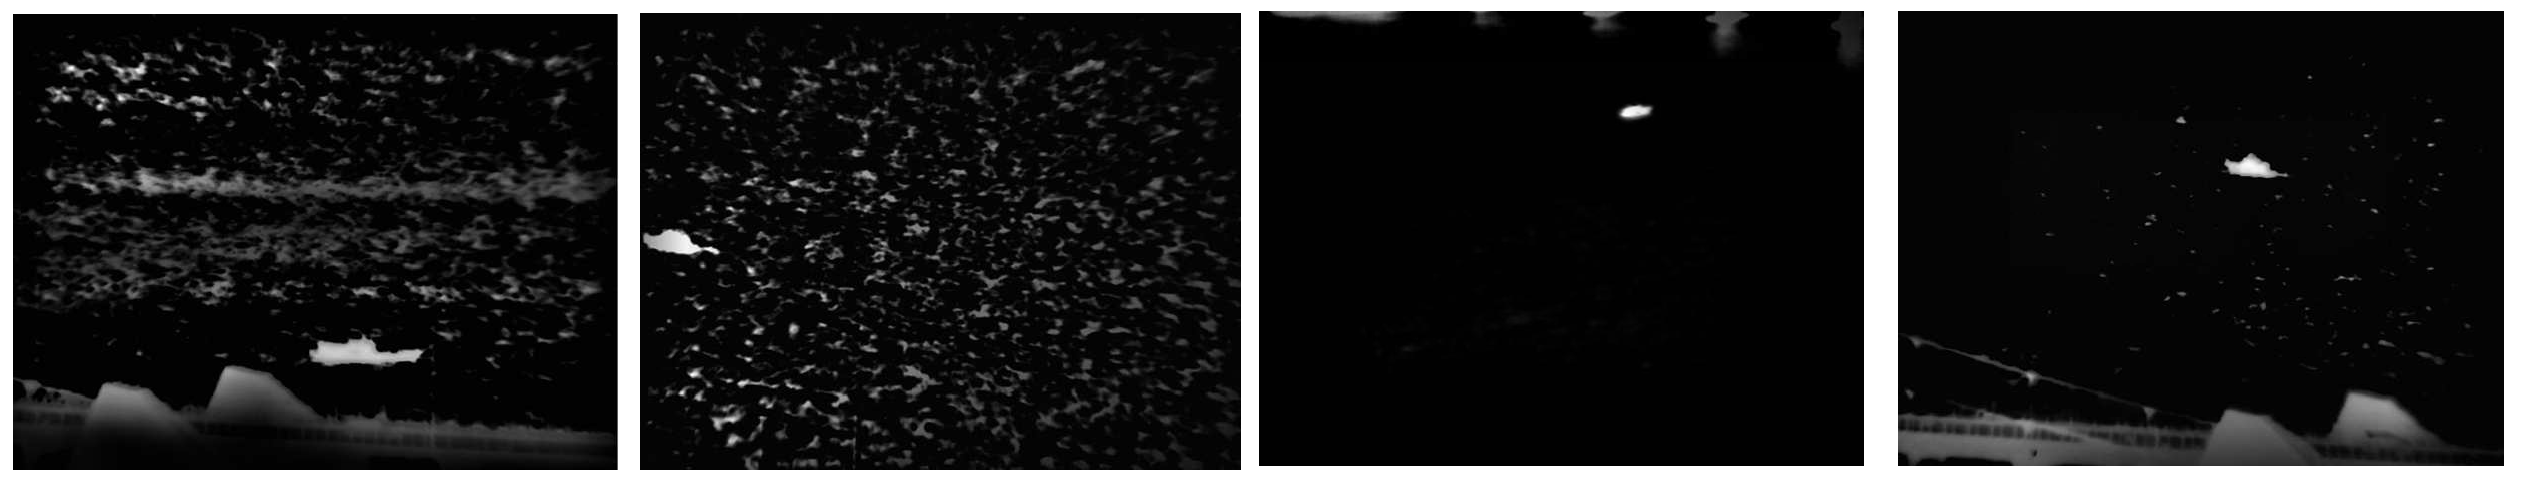
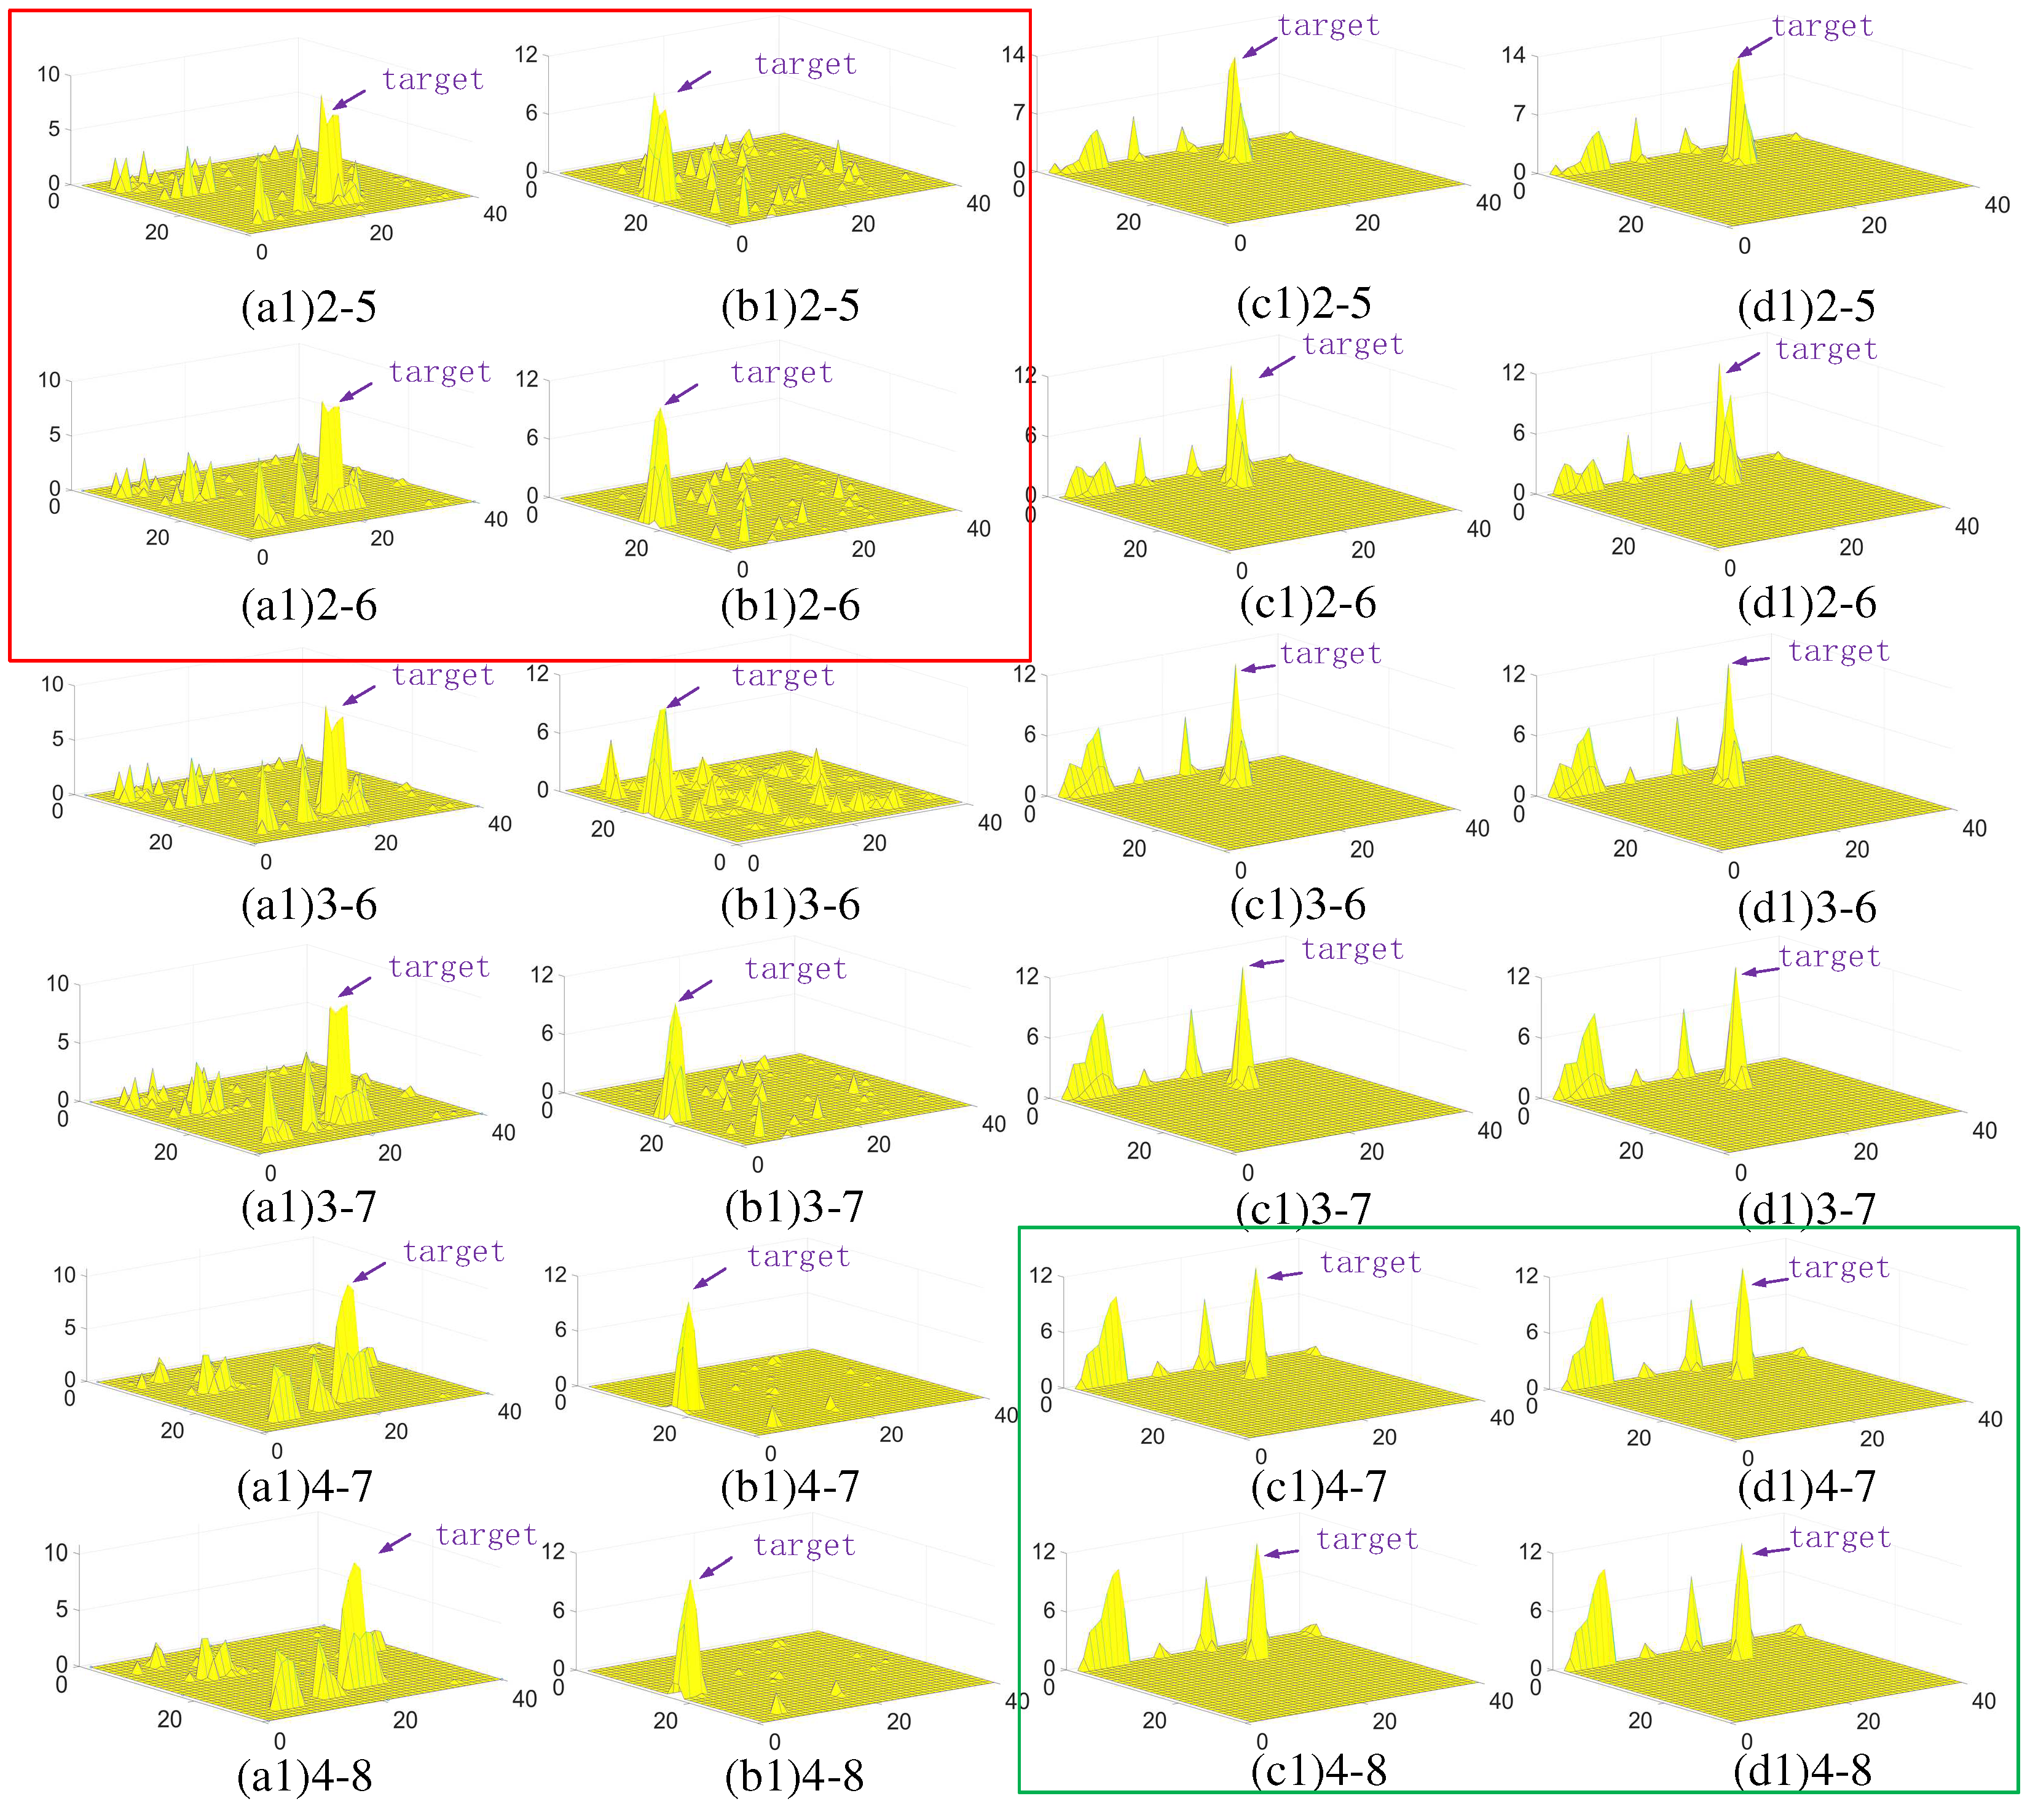
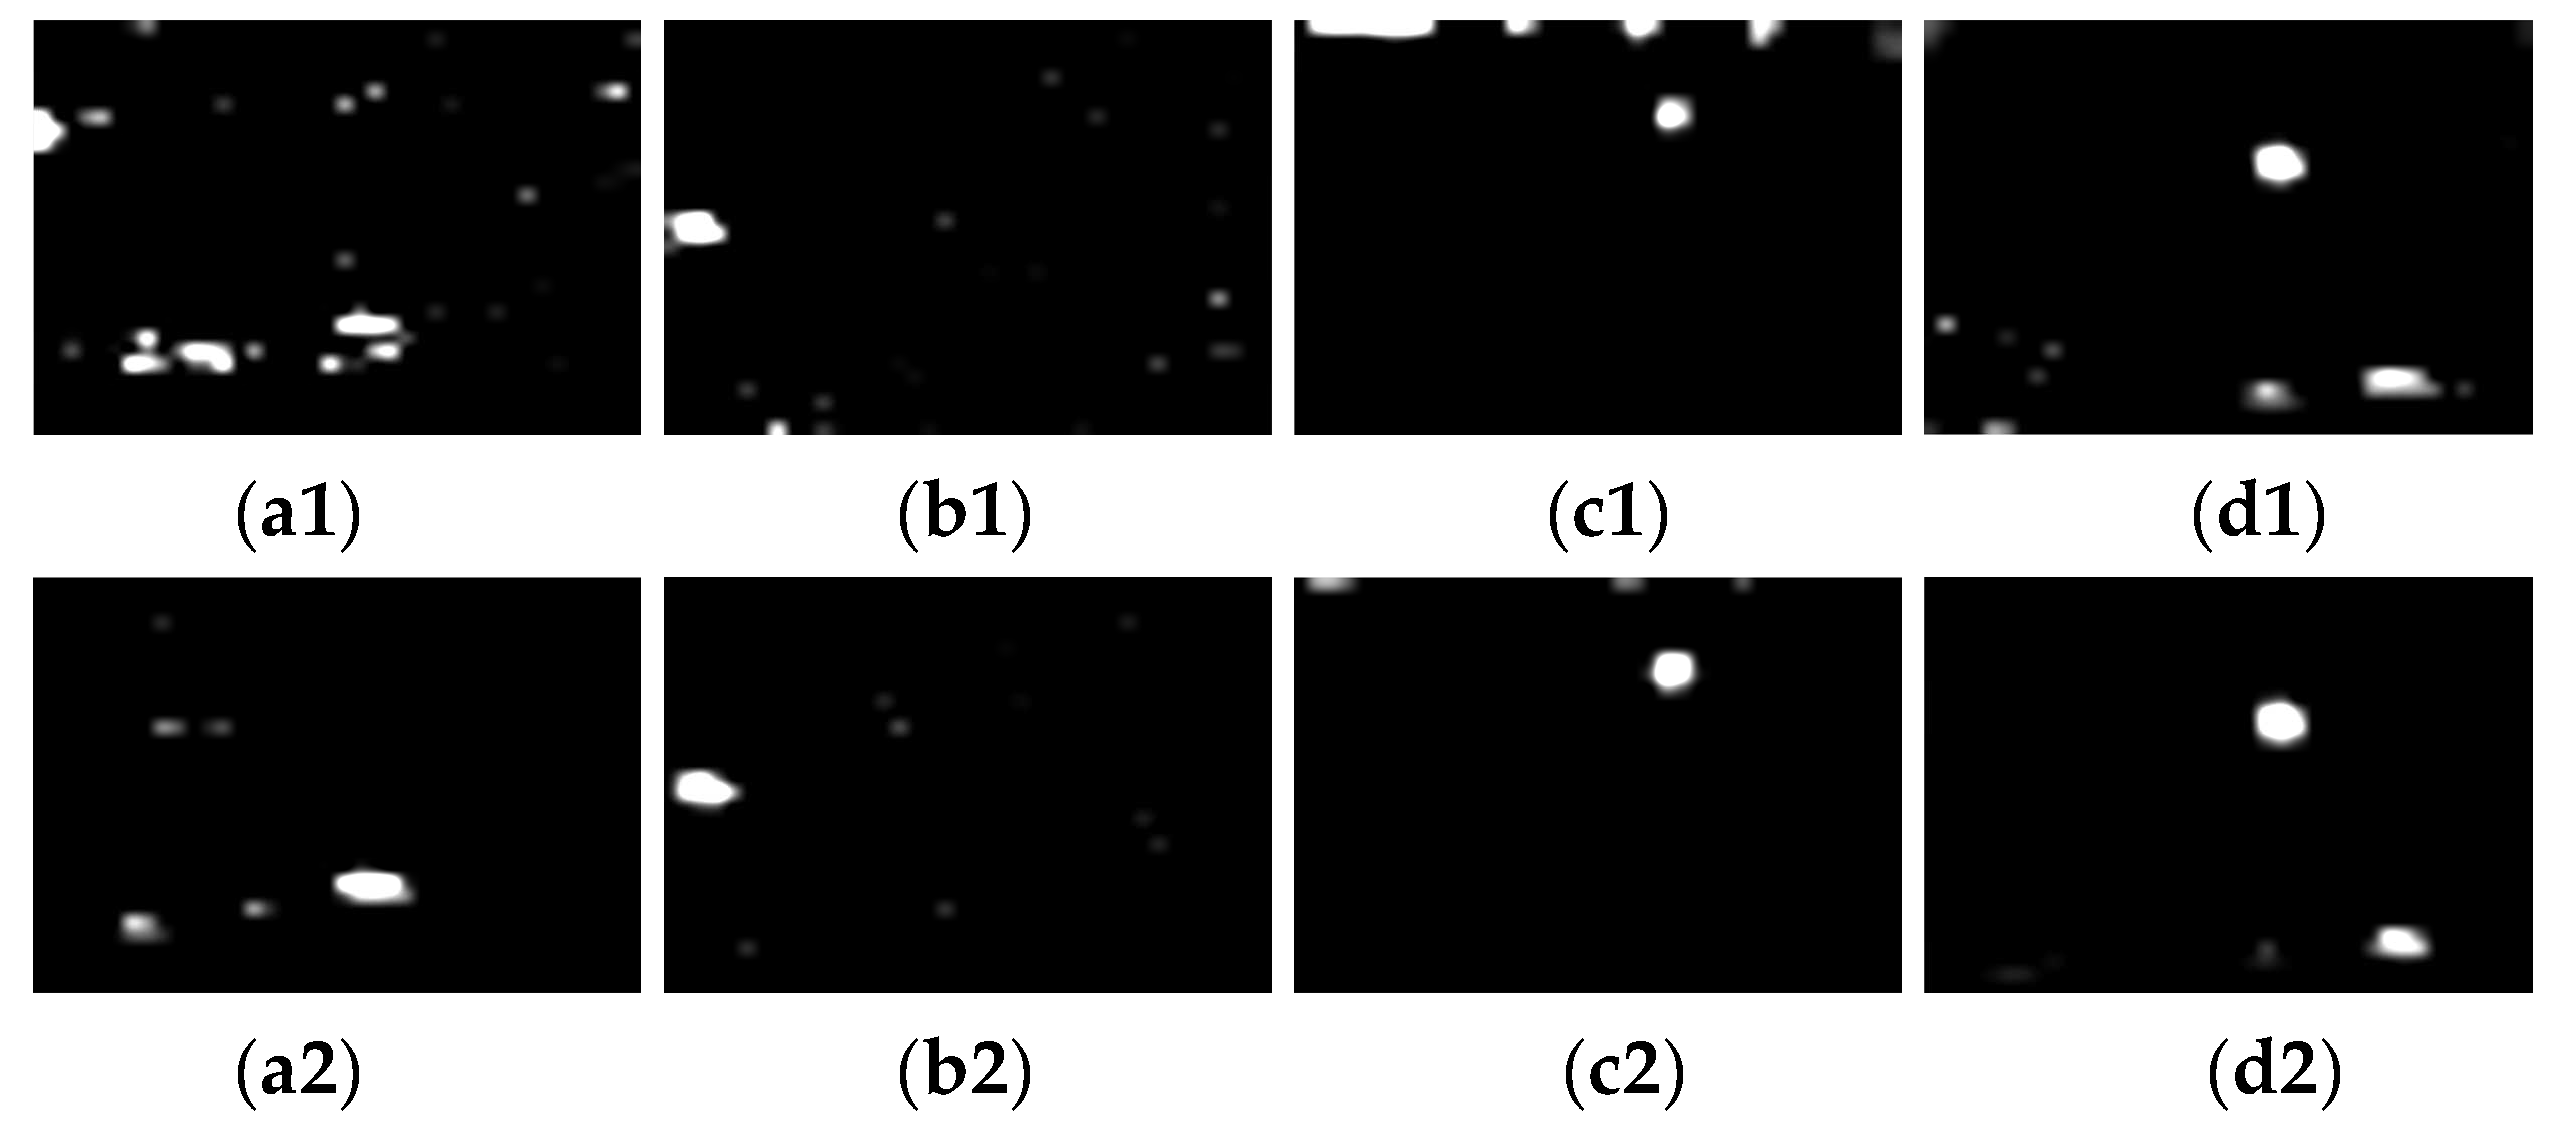
3.2. Verify Intermediate Results
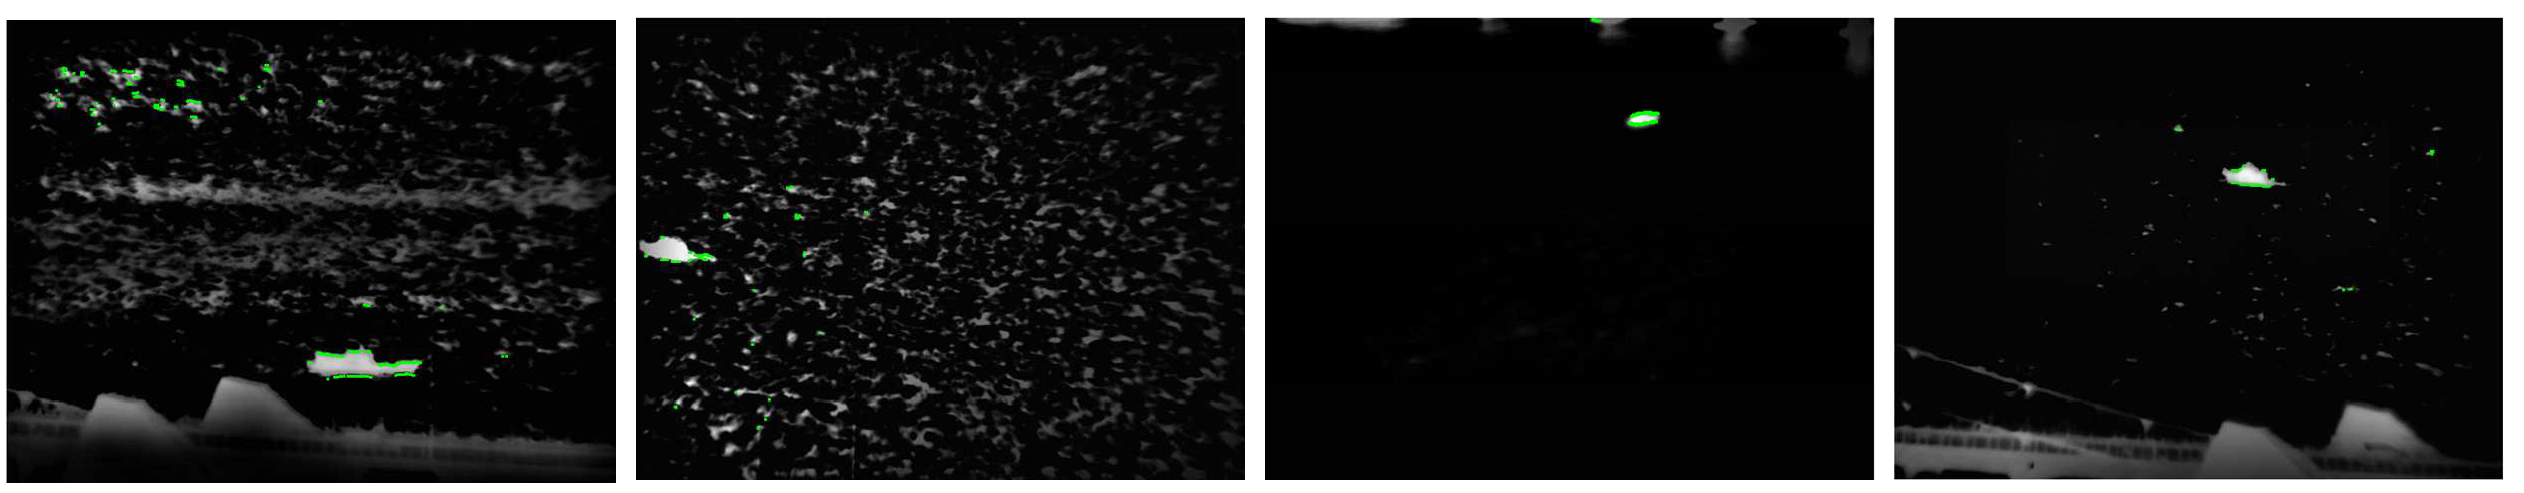
3.3. Comparison of Experimental Results
3.4. Limitations
4. Conclusions
Author Contributions
Funding
Conflicts of Interest
References
- Li, Y.; Zhang, Y. Robust infrared small target detection using local steering kernel reconstruction. Pattern Recognit. 2018, 77, 113–125. [Google Scholar] [CrossRef]
- Nie, J.; Qu, S.; Wei, Y.; Zhang, L.; Deng, L. An infrared small target detection method based on multiscale local homogeneity measure. Infrared Phys. Technol. 2018, 90, 186–194. [Google Scholar] [CrossRef]
- Deng, H.; Sun, X.; Zhou, X. A Multiscale Fuzzy Metric for Detecting Small Infrared Targets Against Chaotic Cloudy/Sea-Sky Backgrounds. IEEE Trans. Cybern. 2019, 49, 1694–1707. [Google Scholar] [CrossRef] [PubMed]
- Zhang, S.; Huang, F.; Liu, B.; Yu, H.; Chen, Y. Infrared dim target detection method based on the fuzzy accurate updating symmetric adaptive resonance theory. J. Vis. Commun. Image Represent. 2019, 60, 180–191. [Google Scholar] [CrossRef]
- Li, D. Lifting Scheme-Based Sparse Density Feature Extraction for Remote Sensing Target Detection. Remote Sens. 2021, 13, 1862. [Google Scholar] [CrossRef]
- He, Y.; He, H.; Xu, Y. Marine Multi-Target Detection Based on Improved Wavelet Transform. In Proceedings of 2019 3rd International Conference on Electronic Information Technology and Computer Engineering (EITCE), Xiamen, China, 18–20 October 2019. [Google Scholar]
- Hou, X.; Zhang, L. Saliency Detection: A Spectral Residual Approach. In Proceedings of 2007 IEEE Conference on Computer Vision and Pattern Recognition, Minneapolis, MN, USA, 17–22 June 2007. [Google Scholar]
- Li, Z.; Hou, Q.; Fu, H.; Dai, Z.; Yang, L.; Jin, G.; Li, R. Infrared small moving target detection algorithm based on joint spatio-temporal sparse recovery. Infrared Phys. Technol. 2015, 69, 44–52. [Google Scholar] [CrossRef]
- Brahim, K.; Kalboussi, R.; Abdellaoui, M.; Douik, A. Spatio-temporal saliency detection using objectness measure. Signal Image Video Process. 2019, 13, 1055–1062. [Google Scholar] [CrossRef]
- Li, B.; Zhi, Y.X.; Zhang, J.; Wang, X.; Fan, X. Dim-Small Target Detection Based on Adaptive Pipeline Filtering. Math. Probl. Eng. 2020, 2020, 8234349. [Google Scholar] [CrossRef]
- Wang, B.; Dong, L.; Zhao, M.; Xu, W. A small dim infrared maritime target detection algorithm based on local peak detection and pipeline-filtering. In Proceedings of International Conference on Graphic Image Processing, Singapore, 9 December 2015. [Google Scholar]
- Zhu, H.; Liu, S.; Deng, L.; Li, Y.; Xiao, F. Infrared Small Target Detection via Low-Rank Tensor Completion with Top-Hat Regularization. IEEE Trans. Geosci. Remote Sens. 2020, 58, 1004–1016. [Google Scholar] [CrossRef]
- Cao, Z.; Kong, X. Infrared dim target detection via mode-k1k2 extension tensor tubal rank under complex ocean environment. ISPRS J. Photogramm. Remote Sens. 2021, 181, 167–190. [Google Scholar] [CrossRef]
- Gao, C.Q.; Deng, Y.M. Infrared patch-image model for small target detection in a single image. IEEE Trans. Image Process. 2013, 22, 4996–5009. [Google Scholar] [CrossRef]
- Guo, J.; Wu, Y.Q.; Dai, Y.M. Small target detection based on reweighted infrared patch-image model. IET Image Process. 2018, 12, 70–79. [Google Scholar] [CrossRef]
- Zhang, L.; Peng, L.; Zhang, T.; Cao, S.; Peng, Z. Infrared Small Target Detection via Non-Convex Rank Approximation Minimization Joint l2,1 Norm. Remote Sens. 2018, 10, 1821. [Google Scholar] [CrossRef]
- Li, M.Y.; He, Y.J.; Zhang, J. Small Infrared Target Detection Based on Low-Rank Representation. Int. Conf. Image Graph. 2015, 9219, 393–401. [Google Scholar]
- Lu, Y.; Huang, S.; Zhao, W. Sparse representation based infrared small target detection via anonline-learned double sparse background dictionary. Infrared Phys. Technol. 2019, 99, 14–27. [Google Scholar] [CrossRef]
- Zhang, T.F.; Peng, Z.M. Infrared small target detection via self-regularized weighted sparse model—Science Direct. Neurocomputing 2021, 420, 124–148. [Google Scholar] [CrossRef]
- Dai, Y.M.; Wu, Y.Q. Reweighted Infrared Patch-Tensor Model with Both Nonlocal and LocalPriors for Single-Frame Small Target Detection. IEEE J. Sel. Top. Appl. Obs. Remote Sens. 2017, 10, 3752–3767. [Google Scholar] [CrossRef]
- Zhang, P.; Zhang, L.; Wang, X. Edge and Corner Awareness-Based Spatial-Temporal Tensor Model for Infrared Small-Target Detection. IEEE Trans. Geosci. Remote Sens. 2021, 59, 10708–10724. [Google Scholar] [CrossRef]
- Kong, X.; Yang, C.; Cao, S. Infrared Small Target Detection via Nonconvex Tensor Fibered Rank Approximation. IEEE Trans. Geosci. Remote Sens. 2021, 60, 5000321. [Google Scholar] [CrossRef]
- Tao, C.; Mi, L.; Li, Y.; Qi, J.; Xiao, Y.; Zhang, J. Scene Context-Driven Vehicle Detection in High-Resolution Aerial Images. IEEE Trans. Geosci. Remote Sens. 2019, 57, 7339–7351. [Google Scholar] [CrossRef]
- Ryu, J.; Kim, S. Heterogeneous Gray-Temperature Fusion-Based Deep Learning Architecture for Far Infrared Small Target Detection. J. Sens. 2019, 2019, 4658068. [Google Scholar] [CrossRef]
- Gao, Z.; Dai, J.; Xie, C. Dim and Small Target Detection Based on Feature Mapping Neural Networks. J. Vis. Commun. Image Represent. 2019, 62, 206–216. [Google Scholar] [CrossRef]
- Zhao, B.; Wang, C.; Fu, Q. A Novel Pattern for Infrared Small Target Detection with Generative Adversarial Network. IEEE Trans. Geosci. Remote Sens. 2021, 59, 4481–4492. [Google Scholar] [CrossRef]
- Dai, Y.; Wu, Y.; Zhou, F. Attentional Local Contrast Networks for Infrared Small Target Detection. IEEE Trans. Geosci. Remote Sens. 2021, 59, 9813–9824. [Google Scholar] [CrossRef]
- Wang, Z.; Du, L.; Zhang, P.; Li, L.; Wang, F.; Xu, S.; Su, H. Visual Attention-Based Target Detection and Discrimination for High-Resolution SAR Images in Complex Scenes. IEEE Trans. Geosci. Remote Sens. 2018, 56, 1855–1872. [Google Scholar] [CrossRef]
- Zhao, Y.; Song, Y.; Li, X.; Sulaman, M.; Guo, Z.; Yang, X.; Wang, F.; Hao, Q. IR saliency detection via a GCF-SB visual attention framework. J. Vis. Commun. Image Represent. 2020, 66, 102706. [Google Scholar] [CrossRef]
- Du, L.; Li, L.; Wei, D.; Mao, J. Saliency-Guided Single Shot Multibox Detector for Target Detection in SAR Images. IEEE Trans. Geosci. Remote Sens. 2020, 58, 3366–3376. [Google Scholar] [CrossRef]
- Bruno, A.; Gugliuzza, F.; Pirrone, R.; Ardizzone, E. A Multi-Scale Colour and Keypoint Density-Based Approach for Visual Saliency Detection. IEEE Access 2020, 8, 121330–121343. [Google Scholar] [CrossRef]
- Gao, F.; Liu, A.; Liu, K.; Yang, E.; Hussain, A. A novel visual attention method for target detection from SAR images. Chin. J. Aeronaut. 2019, 32, 1946–1958. [Google Scholar] [CrossRef]
- Okade, M.; Patel, G.; Biswas, P.K. Robust Learning-Based Camera Motion Characterization Scheme with Applications to Video Stabilization. IEEE Trans. Circuits Syst. Video Technol. 2016, 26, 453–466. [Google Scholar] [CrossRef]
- Garcia-Morales, J.; Femenias, G.; Riera-Palou, F. Analysis and Optimization of FFR-Aided OFDMA-Based Heterogeneous Cellular Networks. IEEE Access 2016, 4, 5111–5127. [Google Scholar] [CrossRef]
- Ling, Q.; Zhao, M. Stabilization of Traffic Videos Based on Both Foreground and Background Feature Trajectories. IEEE Trans. Circuits Syst. Video Technol. 2019, 29, 2215–2228. [Google Scholar] [CrossRef]
- Moradi, S.; Moallem, P.M.; Sabahi, F. Fast and robust small infrared target detection using absolute directional mean difference algorithm. Signal Process. 2020, 177, 107727. [Google Scholar] [CrossRef]
- Zhang, L.; Peng, Z. Infrared small target detection based on partial sum of the tensor nuclear norm. Remote Sens. 2019, 11, 382. [Google Scholar] [CrossRef]
- Qin, Y.; Bruzzone, L.; Gao, C.; Li, B. Infrared small target detection based on facet kernel and random walker. IEEE Trans. Geosci. RemoteSens. 2019, 57, 7104–7118. [Google Scholar] [CrossRef]
- Han, J.; Moradi, S.; Faramarzi, I.; Zhao, Q. A local contrast method for infrared small-target detection utilizing a tri-layer window. IEEE Geosci. Remote Sens. Lett. 2020, 17, 1822–1826. [Google Scholar] [CrossRef]


| Image Sequence | Number of Test Sets | Experimental Environment and Image Description | |||
|---|---|---|---|---|---|
| Wind Speed (m/s) | Wave Height (m) | Infrared Camera | Background Interference | ||
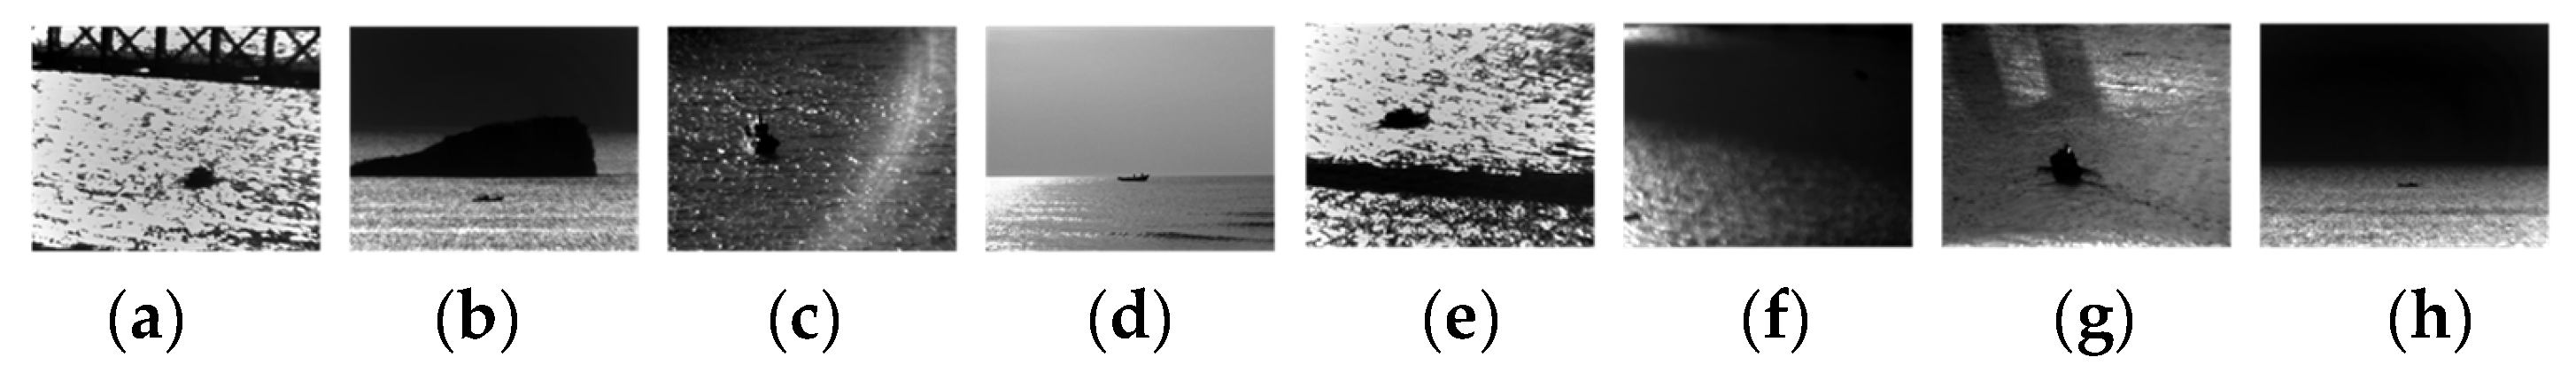
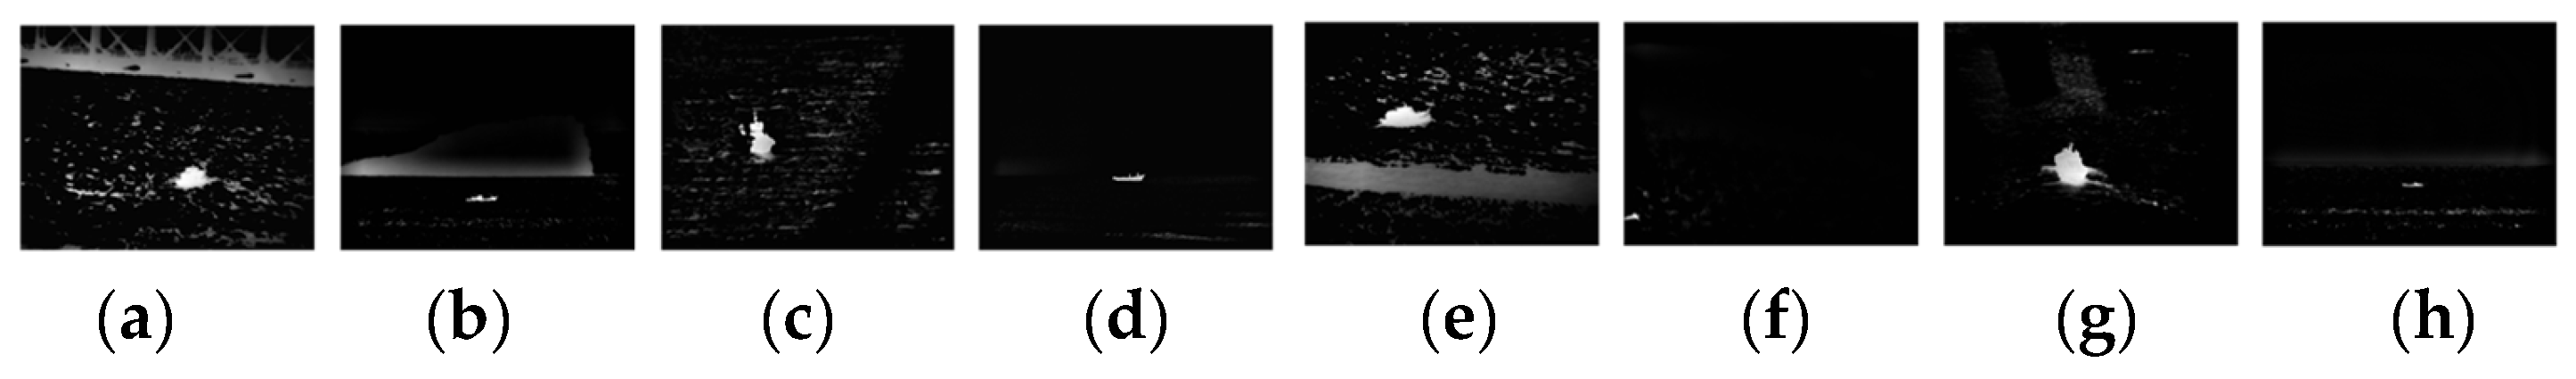
| (a) | 1025 | 8.6–9.8 | 1.8–2.0 | Long wave un-refrigeration | Bridge Bright and dark spots |
| (b) | 1342 | 5.0–5.4 | 0.3–0.5 | Medium wave refrigeration | Sea-sky line IslandsSea waves |
| (c) | 2085 | 6.0–7.4 | 0.7–0.9 | Long wave un-refrigeration | Lens flare Highlight ocean noise |
| (d) | 4463 | 2.7–3.0 | 0.1–0.3 | Medium wave refrigeration | smooth streaks |
| (e) | 507 | 8.6–9.8 | 1.8–2.0 | Long wave un-refrigeration | Connected dark lines |
| (f) | 768 | 5.0–5.4 | 0.3–0.5 | Medium wave refrigeration | Shadow bright and dark spots |
| (g) | 821 | 2.0–3.4 | 0.1–0.3 | Long wave un-refrigeration | Bridge reflection |
| (h) | 2017 | 5.0–5.4 | 0.3–0.5 | Medium wave refrigeration | Sea-sky line Sea waves |
| Data | (a) | (b) | (c) | (d) | (e) | (f) | (g) | (h) |
|---|---|---|---|---|---|---|---|---|
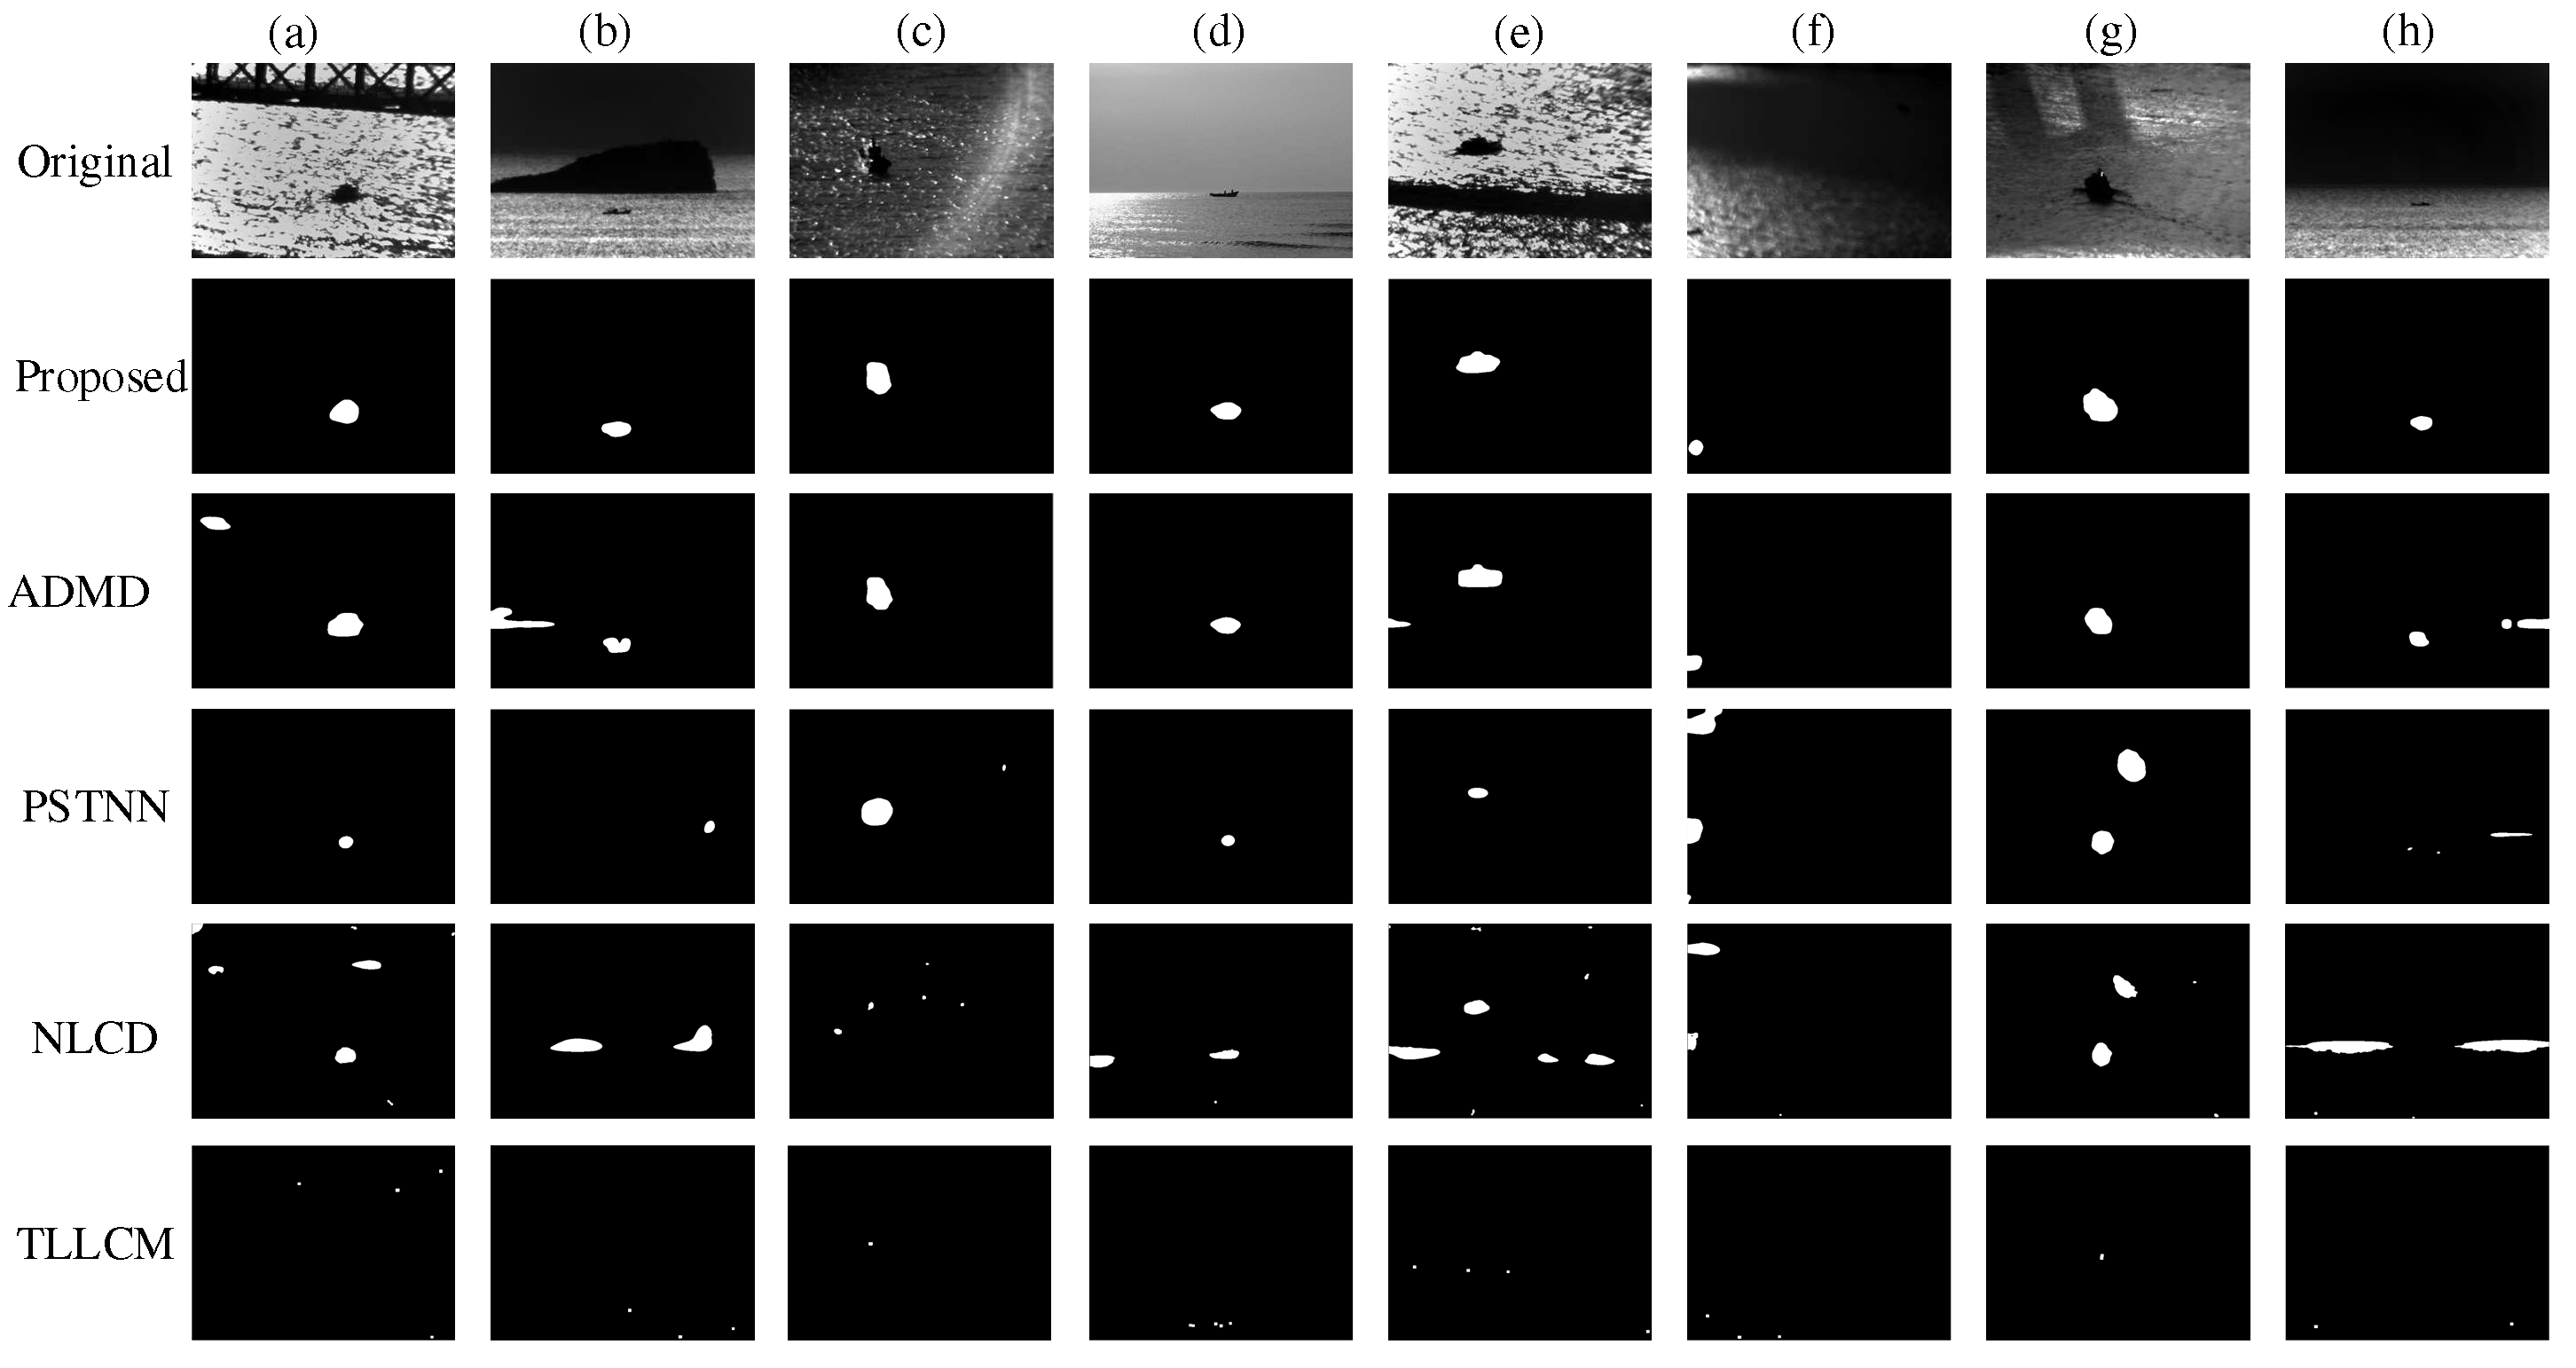
| SCRG | 24.6 | 25.4 | 23.5 | 36.0 | 26.7 | 52.7 | 21.6 | 50.1 |
| Method | Proposed | ADMD | PSTNN |
|---|---|---|---|
| Complexity Time/s | O(𝑝2𝑁) 0.082 | O(𝑝2𝑁3𝐾) 0.185 | O(n1n2n3log(n1n2) + n1n22[(n3 + 1)/2]) 0.158 |
| Method | NLCD | TLLCM | |
| Complexity Time/s | O(ξ𝑝6𝑁) 0.281 | O(LR2logR2MN) 4.661 |
Publisher’s Note: MDPI stays neutral with regard to jurisdictional claims in published maps and institutional affiliations. |
© 2022 by the authors. Licensee MDPI, Basel, Switzerland. This article is an open access article distributed under the terms and conditions of the Creative Commons Attribution (CC BY) license (https://creativecommons.org/licenses/by/4.0/).
Share and Cite
Ma, D.; Dong, L.; Xu, W. Detecting Maritime Infrared Targets in Harsh Environment by Improved Visual Attention Model Preselector and Anti-Jitter Spatiotemporal Filter Discriminator. Remote Sens. 2022, 14, 5213. https://doi.org/10.3390/rs14205213
Ma D, Dong L, Xu W. Detecting Maritime Infrared Targets in Harsh Environment by Improved Visual Attention Model Preselector and Anti-Jitter Spatiotemporal Filter Discriminator. Remote Sensing. 2022; 14(20):5213. https://doi.org/10.3390/rs14205213
Chicago/Turabian StyleMa, Dongdong, Lili Dong, and Wenhai Xu. 2022. "Detecting Maritime Infrared Targets in Harsh Environment by Improved Visual Attention Model Preselector and Anti-Jitter Spatiotemporal Filter Discriminator" Remote Sensing 14, no. 20: 5213. https://doi.org/10.3390/rs14205213
APA StyleMa, D., Dong, L., & Xu, W. (2022). Detecting Maritime Infrared Targets in Harsh Environment by Improved Visual Attention Model Preselector and Anti-Jitter Spatiotemporal Filter Discriminator. Remote Sensing, 14(20), 5213. https://doi.org/10.3390/rs14205213