Abstract
Sandy islands suffer multiple external disturbances and thus experience drastic temporal ecological changes, and the two parts, that is, the states of essential components (Part 1) and the resilience under multiple disturbances (Part 2), are both indispensable to the sandy island ecosystem health. In this study, a model for the sandy island ecosystem health was established by integrating the two parts. In Part 1, the states were measured following the framework of vegetation, soil, and landscape, and a total of 12 factors in the three components were adopted. In Part 2, three typical disturbances, namely, geomorphological change, soil salinization, and human influence, were identified, and the resilience across different time intervals was measured by clarifying the intrinsic correlations between the components and disturbances. A sandy island ecosystem health index (SIEHI) was proposed based on the two parts, and Chongming Island was selected as the study area to demonstrate the model. The results indicated that the SIEHI continuously increased from 1988 to 2017, denoting the good effects of “Eco-Island construction” on Chongming Island. In different components and factors, the vegetation and soil components contributed more than the landscape component to the sandy island ecosystem health, and vegetation quality and soil carbon/nitrogen were the factors that made the most contributions. In different disturbances, the human influence played a major role in driving the spatiotemporal variations of the sandy island ecosystem health. Farming and building construction contributed the most and accounted for 37.12% and 35.59% of the total human influence, respectively, while traffic development exerted the highest influence per area. Then, influence coefficients of different human activities on the sandy island were determined, and measures for different functional zones were proposed for balancing the protection and development and achieving the sandy island ecosystem-based management.
1. Introduction
The sandy island is one of the three main types of islands according to the material constitution (the other two are rocky and coral reef islands), and by definition, this type of island is mainly constituted by sand and mud. It is always located in the estuarine areas and formed and changed by the sediment input via the river and deposition in the estuary. Sandy islands are in a low number compared with the total number of islands in China (more than 10,000) yet occupy a considerable proportion of the island areas and become an integral part of the coastal areas for human inhabitation, economic development, and ecological conservation [1]. Saltmarshes and mangroves are always developed on sandy islands and exhibit enormous ecological functions, including biodiversity maintenance, habitat provision, pollutant purification, erosion prevention, and carbon sequestration [2,3,4,5,6,7]. Meanwhile, flat terrain, fertile land, and superior geographic location render the sandy island a hotspot for human activities. Humans live and conduct economic activities by utilizing various resources of sandy islands. In China, urban and rural constructions, coastal reclamation, farming, pond aquaculture, and tourism activities are frequent and spread over most of the sandy islands; these activities greatly contribute to the regional economic and social developments of sandy islands [8,9,10,11]. In the context of intensive land–sea interaction and frequent human activities, the sandy island ecosystem suffers multiple external disturbances and thus experiences distinct temporal changes. The large amount of sediment input and deposition continuously enlarged the outline of the island in the long term, and reclamation activities and embankment establishment accelerated the process in the last decades [12,13,14]. Furthermore, coastal erosions also occur in certain areas and lead to the shrinkage of the island [5]. The enlargement and shrinkage result in the changing geomorphological environment of the sandy island. The continuous supplement of salts from the sea makes the soil salinization a common ecological problem on sandy islands and other coastal lowlands [15,16,17]. The soil salinization severely damages the soil quality, vegetation condition, and crop yield and thus threatens the ecosystem health [18,19,20]. Meanwhile, human activities have been increasingly intensive and substantially influenced the sandy island ecosystem in recent decades [5,12]. They exert negative influences by occupying natural habitats, increasing landscape fragmentation, interfering with the biological community, and emitting pollutants while generate positive influences through ecological conservation and management [5,11,21,22]. Under the multiple natural and anthropogenic disturbances, the essential components of sandy island ecosystem show complex spatiotemporal responses, and the sandy island ecosystem health exhibits drastic temporal variations [2,23,24]. It is of great significance to assess the sandy island ecosystem health influenced by multiple disturbances for revealing the spatiotemporal characteristics of essential components, identifying the driving factors of the spatiotemporal variations, and providing practical suggestions for the sandy island ecosystem-based management.
Up to now, ecosystem health assessments have been conducted in different types of ecosystems, including forests [25], meadows [26], wetlands [4,27], rivers [28], oceans [29,30], urban and rural areas [31,32], agroecosystems [33], and social-ecological systems [34], and at different spatial scales, including local [34], regional [35,36], national [37], and global [38] scales. Island ecosystem health has also been assessed in some cases, most of which are aiming at rocky or coral reef islands [10,39,40,41]. Coastal wetlands are always the integral part of sandy islands, and the ecosystem health of coastal wetlands has been extensively studied. The existing studies can be roughly classified into two categories, namely, single-factor study and holistic assessment. The first category refers to the studies that focus on a specific component of the ecosystem such as vegetation condition [42,43], macrobenthic communities [44], soil bacterial communities [45], and landscape pattern [46], as well as the response of the ecosystem to a certain external disturbance, including sea level rise [47], saltwater intrusion [48], sea reclamation [49], onshore industries [50], and aquaculture [51]. The second category aims to assess the ecosystem health of coastal wetlands from a holistic perspective by using an index system that contains various types of indexes, and the index systems are always established following general frameworks such as pressure–state–response [52], structure–function–resilience [27], external hazard–internal vulnerability [53], and external factors–internal factors–ecological state [4]. Remote sensing serves as the main data source for the holistic assessments. All these studies have achieved good results and contributed to the ecosystem maintenance in different areas. They provide theoretical basis and technical methods, which, however, fail to comprehensively assess the sandy island ecosystem health and its spatiotemporal pattern due to the following three points. First, the essential components and the main external disturbances are not comprehensively considered, and the field measured data are always absent in some holistic assessments. Second, the changes in ecosystem health under the external disturbances during a period receive insufficient attention, and the intrinsic correlations between ecosystem health and external disturbances during different development periods remain unclear. Third, the spatial visualization of assessment results, particularly those within the study area, need to be further explored. Therefore, the targeted assessment of the sandy island ecosystem health has an urgent need to be studied.
After decades of research, the ecological health is recognized to comprise two parts of connotations: (1) the integrative state that reflects the essential components in the ecosystem and (2) the ecosystem resilience responding to the multiple external disturbances [34,54,55,56,57,58,59,60,61,62]. The two parts exist at specific spatial and temporal scales. The state is essentially a static attribute at a time point and its temporal change is composed of several static states at different time points [4,27,37]. By contrast, the resilience is a dynamic attribute in a time interval and indicates the resistance, adaptation, and recovery under external disturbances [63,64,65]. Furthermore, the two parts are closely related to each other. The resilience is the resilience of the state under the influences of external disturbances, and the state is the final outcome through the processes of resilience to disturbances. Currently, most of the empirical studies measured the ecosystem health by considering only the state, yet the resilience across time intervals received relatively low attention [4,10,37,41,65,66]. This can be attributed to the following two reasons: (1) The needed data for measuring the resilience are difficult to be obtained, and the method for assessing the resilience to different disturbances is complicated because the resilience involves processes of temporal changes and responses of states to disturbances across the time intervals. (2) In areas where the temporal changes of the ecosystem are not drastic, the assessment of the first part is adequate to represent the ecosystem health because of the close relation between the state and resilience. Thus, to balance the assessment effect and cost, it is feasible to only measure the state of ecosystem health in these areas, and the exhibition of the states in different time points can reveal the temporal changes. The rocky island is one of these areas. However, the state alone cannot largely represent the ecosystem health of the sandy island. It is necessary to measure both of the two parts for comprehensively assessing the sandy island ecosystem health, that is, Part 1 (the states of essential components) and Part 2 (the resilience under multiple disturbances).
In this study, a model for assessing sandy island ecosystem health was established by considering the two parts. In Part 1, the essential components were selected following a framework of vegetation, soil, and landscape, which was proposed by the authors in previous studies of the ecosystem health assessment on rocky islands [10,41], and the spatiotemporal characteristics of the states of the essential components were measured. In Part 2, three typical disturbances on sandy islands, namely, geomorphological change, soil salinization, and human influence, were identified, and the spatiotemporal variations of the resilience under the multiple disturbances were measured by clarifying the intrinsic correlations between the components and disturbances. A sandy island ecosystem health index (SIEHI) was proposed based on the indexes for Part 1 (SIEHI-1) and Part 2 (SIEHI-2). Chongming Island, the world’s largest estuarine sandy island, was selected as the study area to demonstrate the model. Remote sensing data during the last decades from Landsat series satellites served as the major data source. Four time points, namely, 1988, 1995, 2007, and 2017, and three time intervals, namely, 1988–1995, 1995–2007, and 2007–2017, were adopted to represent the temporal variations (Figure 1). To accurately assess the sandy island ecosystem health, this study must solve the following scientific questions: (1) How is the sandy island ecosystem health model established based on the states of essential components and the resilience under multiple disturbances? (2) How is the resilience measured through clarifying the intrinsic correlations between the components and disturbances across different time points? (3) What are the driving factors of spatiotemporal variations of the sandy island ecosystem health? (4) How are the novel suggestions for the sandy island ecosystem-based management proposed based on the assessment results?
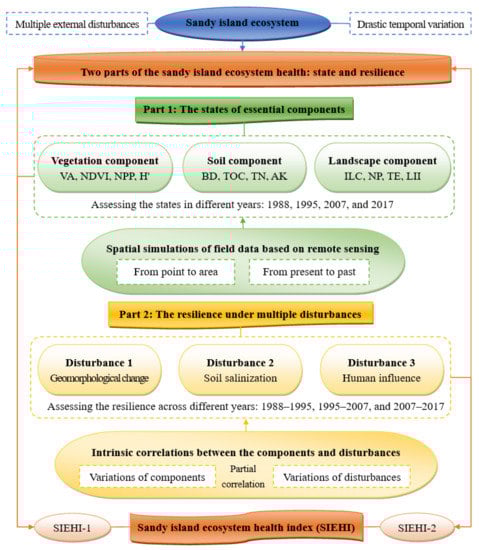
Figure 1.
Framework for assessing the sandy island ecosystem health: VA: vegetation abundance (dimensionless); NDVI: normalized difference vegetation index (dimensionless); NPP: net primary productivity (g C m−2 a−1); H’: Shannon–Wiener index (dimensionless); BD: bulk density (g/cm3); TOC: total organic carbon (g/kg); TN: total nitrogen (g/kg); AK: available potassium (mg/kg); ILC: important landscape coverage (dimensionless); NP: number of patches (dimensionless); TE: total edges (m); LII: landscape isolation index (dimensionless).
2. Materials and Methods
2.1. Study Area and Data Source
2.1.1. Study Area
Chongming Island is in the estuary of the Yangtze River, adjacent to the East China Sea, and close to Shanghai City (Figure 2). It is the third largest island in China and the largest estuarine sandy island in the world, and exhibits typical features of estuarine sandy islands, that is, changeable geomorphology, abundant ecological functions, intensive land–sea interaction, and increasing human activities [5,23,67]. Chongming Island is the location of important ecological function areas, including Dongtan Wetland, Beihu Wetland, Xisha Wetland, and Dongping Forest Park (Figure 2), of which Dongtan Wetland was designated as a national nature reserve in 2005. Extensive studies on Chongming Island’s ecosystem have been conducted. Current studies covered different aspects, including geomorphology evolution [13,68], biological resources [7,69], soil quality [70,71,72], landscape character [5,73], as well as ideas, policies, and measures for constructing an ecoisland [12,74,75]. Furthermore, evaluations on the island ecosystem were also implemented using different methods [24,76]. However, the spatiotemporal characteristics of ecosystem health that integrate the states of essential components and the resilience under multiple disturbances are still unclear. The spatial characteristics refer to the spatial heterogeneity of ecosystem health within the island based on the assessment unit, which is the minimum unit to conduct the assessment; the temporal characteristics indicate the temporal changes of ecosystem health across different years during the last decades.
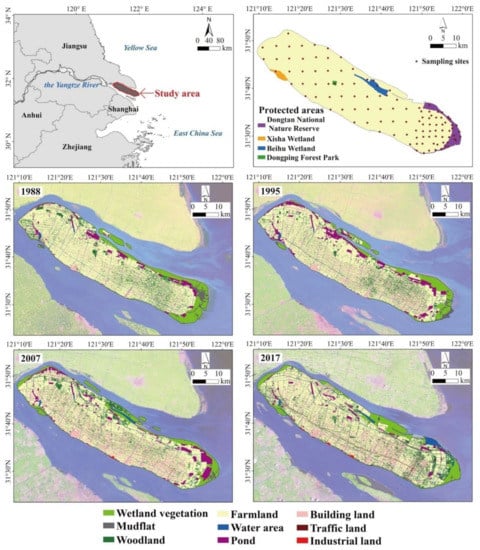
Figure 2.
Location, sampling sites, island outlines, and land cover types of the study area: the sampling sites, island outlines, and land cover types were quoted from previous relevant studies by the authors [5,71]. The protected areas were sourced from the People’s Government of Chongming District in Shanghai [77].
The island has a subtropical, oceanic, monsoon climate with an average annual temperature and rainfall of 15.2 °C and 1025 mm, respectively [5]. Most of the island belongs to Chongming District in Shanghai City. In 2021, the gross domestic product (GDP) of the district summed up to CNY 40.97 billion (USD 5.76 billion), and the GDP per capita was CNY 60,889 (USD 8555); at the end of 2021, the total population summed up to approximately 672,900 [78]. A small part of the island in the northwest belongs to Nantong City in Jiangsu Province because of the historical issue. The spatial scope of this study is the entire Chongming Island, and the temporal scope is the last 30 years. Specifically, the entire Chongming Island in the 1988, 1995, 2007, and 2017 were selected as the objects, and the spatiotemporal changes over the island and across the years were studied.
2.1.2. Data Source
The assessment of the sandy island ecosystem health needs the area data that cover the entire island and range from 1988 to 2017. The needed data for the assessment were sourced by remote sensing and field investigation, of which remote sensing served as the major data source.
The remote sensing data from Landsat 5 in 1988, 1995, and 2007 and that from Landsat 8 in 2017 were collected on the premises of the consistency in season, the cleanliness of images with no or little clouds, and the time interval of approximately 10 years. The spatial resolution of the multispectral bands is 30 × 30 m. The spectral reflectance of each band in different years was extracted through radiometric calibration and atmospheric correction, and reflectance-based ecological indices were then calculated. Furthermore, island outlines and land cover types in different years were obtained through visual interpretation and supervised classification methods, and the land covers were divided into wetland vegetation, mudflat, woodland, farmland, water area, pond, building land, traffic land, and industrial land (Figure 2). The classification accuracies were assessed using error matrices, and high accuracies were validated in a previous study of the authors [5]. The land cover data serve as the basic data for calculating the factors in vegetation and landscape components.
The field investigation was conducted in May 2018. A total of 110 sampling sites were set based on the even distribution in the land surface, the representativeness of plant communities, and the accessibility to the sites. The plant community in each site was surveyed, and plant species data, including abundance, height, and coverage of each species in tree, shrub, and herb layers, were recorded. The surface (0–20 cm) soil was sampled in each site, and soil physicochemical properties, including bulk density (BD), total organic carbon (TOC), total nitrogen (TN), available phosphorus (AP), and available potassium (AK), were measured in the laboratory.
2.2. Part 1 of the Sandy Island Ecosystem Health: The State
2.2.1. Three Components and 12 Factors
The Part 1 of the sandy island ecosystem health is the states of essential components of the ecosystem. Vegetation, soil, and landscape are the three essential components and refer to the overall characteristics, vitality, and base of the island ecosystem, respectively [41,79,80,81]. The three essential components involve different aspects of the island ecosystem from macro- to micro perspectives and from upper to bottom layers. In terms of the perspectives, the vegetation and soil indicate the specific ecological functions from the micro perspective, including biodiversity maintenance, habitat provision, carbon sequestration, and water conservation [79,81,82,83]; the landscape refers to the compositional structure and spatial configuration of land surface elements from a macro perspective [5,84,85]. In terms of the spatial layers, landscape, vegetation, and soil are situated at the upper, intermediate, and bottom layers over the island surface, and can comprehensively represent the essential components and overall conditions of the island ecosystem. Some other natural factors such as geological background, climate condition, water resource, and animals were not considered. Geological background and climate condition are always spatially homogeneous over an island, and they are the background conditions rather than the indicators of the ecosystem health. Naturally developed surface runoffs are rare on islands because of the small catchment areas. The existing water areas are mostly artificial and have been considered in the landscape component; thus, the water resource was not selected as an independent component. For biological resources, only vegetation was selected, and other biological resources such as animals and microorganisms were not included in the framework. The vegetation is the main producer of the ecosystem; it refers to various ecological functions and largely represents the habitat quality of islands. Moreover, the investigation of vegetation is relatively simple with low uncertainty, and some parameters can be easily monitored through remote sensing in the long term. By contrast, difficulty and cost for investigating and monitoring animals and microorganisms are high, with distinct uncertainty. Thus, they were not considered to ensure the applicability of the framework. In previous studies, the three components have been successfully used in the assessments of island ecosystem health on rocky islands [10,41]. In this study, the framework of these three components was adopted to validate its effectiveness in the sandy island. In the factor selection for each component, the factors should be typical for specific aspects of the component and different factors should be mutually independent, and a total of 12 factors were selected under the framework (Figure 1).
The vegetation component was assessed in two aspects, namely, quantity and quality. Vegetation abundance (VA) refers to the quantity of the vegetation in the assessment unit, and normalized difference vegetation index (NDVI), net primary productivity (NPP), and Shannon–Wiener index (H’) denote the quality. The NDVI directly represents the vegetation growth condition and neglects the difference among different vegetation types, while NPP considers the growth condition and the difference in light use efficiencies among vegetation types [86,87]. The H’ refers to the species composition and diversity and indicates the stability of the island ecosystem [82,88]. The VA was calculated using the following equation:
where VAi is the area of vegetation type i, and i = 1, 2, and 3 refer to wetland vegetation, woodland, and cropland, respectively; wi is the weighted value of vegetation type i and indicates the existence time of vegetation type i over the year; TA is the total area of the assessment unit. Wetland and woodland are covered by vegetation throughout the year, and thus w1 and w2 are given as 1; by contrast, cropland is uncovered after harvest, and thus w3 is given as 0.5. NDVI was obtained through band calculation of the spectral reflectance using the following equation:
where Rex is the spectral reflectance of band x. The serial number (x) of bands in the equation is for Landsat 8 data and should be (x − 1) for Landsat 5 data. NPP was estimated using a Carnegie–Ames–Stanford approach [89]. H’ was calculated based on shrub and herb species because the tree species are mostly artificial and in a low number, and the method has been reported in [69]. Of the four factors, H’ was sourced by the field investigation and the remaining three factors were sourced by remote sensing.
The soil component was measured based on the physicochemical properties. Four soil factors, that is, BD, TOC, TN, and AK, were selected. The BD is an important physical factor that reflects the structural support function [90]. The TOC indicates the soil carbon storage; TN and AK refer to different nutrients; and all the three factors involve biogeochemical cycles [41,91]. All of the four factors are sourced by field investigation.
The landscape component consists of composition and configuration. The former refers to the land cover types and their areas in an assessment unit, while the latter focuses on the spatial distributions and inter-relations of different landscape patches in the assessment unit [5]. Four factors, namely, important landscape coverage (ILC), number of patches (NP), total edges (TE), and landscape isolation index (LII), were used. The ILC denotes the landscape composition, and the remaining three factors indicate the landscape configuration [5]. They are frequently used factors for representing the landscape patterns on different islands [5,10,92]. The ILC was calculated using the equation in [10]. The wetland vegetation was selected as the very important landscape because of its enormous ecological values; mudflat, woodland, and water area also provide specific ecological functions, yet to a lesser degree; thus, they were considered importance landscapes. The NP, TE, and LII were calculated using the methods reported in [5]. All of the four factors are obtained based on the land cover data sourced by remote sensing.
The assessment unit was set as 100 m × 100 m to balance the demands of spatial heterogeneity exhibition, landscape factor calculations, and appropriate data amount [11]. The assessment units in the four years were generated using the Fishnet tool in ArcGIS 10.0 (ESRI, Redlands, CA, USA).
2.2.2. Spatial Simulations of Field Data
In this study, the factors that are sourced by filed investigation include H’, BD, TOC, TN, and AK. They are point data at a time point. The historical data from field investigation are always discontinuous and unavailable. Thus, these factors should be converted from point data at a time point to multitemporal area data to meet the assessment requirement. The method of spatial simulation can help realize the conversion. It is always conducted by establishing the relationships between field and remote sensing data and then simulating the spatial distributions of the field data based on the relationships [71,93,94]. In previous studies, the spatial simulations that convert the point data to area data at the same time point have been widely conducted [71,95,96,97], and the spatial simulations that aim to convert the data “from present to past” were also explored [72]. The previous studies achieved good results and provided necessary methods for the conversion in the present study. The reliable and continuous data provided by Landsat series satellites lay the foundation for the cross-time simulation. The spectral reflectance and reflectance-based ecological indexes at a time point can correspond to those at another time point after radiometric calibration and atmospheric correction, and thus the simulations can be conducted from point to area and from present to past based on the remote sensing data. The detailed processes are as follows:
First, a total of 15 predictors were selected following a predictor system that covers different aspects of the land surface characteristics [71]. The predictor system consists of two aspects, namely, spectral values and ecological indexes. The spectral values refer to the original spectral reflectance of each band. According to the spectral range of each band in Landsat 8 and Landsat 5 data, Rex (for Re2–Re6) in Landsat 8 data corresponds to Re(x−1) in Landsat 5 data, while Re7 in Landsat 8 data corresponds to Re7 in Landsat 5 data. The ecological indexes are indexes that possess specific ecological significance and are calculated based on the spectral reflectance. Various types of ecological indexes exist and represent different aspects of the ecological conditions [71]. Vegetation, salinity, humidity, and aridity indexes indicate the vegetation growth condition, soil salinity, moisture degree, and dry degree, respectively [98,99,100]. Vegetation indexes consist of difference vegetation index (DVI), NDVI, and soil-adjusted vegetation index (SAVI); salinity indexes include salinity index 1 (SI1), salinity index 2 (SI2), and salinity index 3 (SI3); humidity index indicates land surface wetness (LSW); and aridity indexes are composed of index-based built-up index (IBI) and bare soil index (BSI). NDVI was calculated using Equation (2), and the remaining indexes were calculated using the following equations:
where Rex indicates the spectral reflectance of Band x and Band (x − 1) in Landsat 8 and Landsat 5 data, respectively, for DVI, SAVI, SI1, SI2, SI3, IBI, and BSI; L is given as 0.5; LSWLt8 and LSWLt5 are the LSWs using Landsat 8 and Landsat 5 data, respectively; Cx are coefficients of Rex for the calculation of LSW and are sourced from [101] and [102] for LSMLt8 and LSMLt5, respectively.
The predictors in all the assessment units in different years were obtained through ArcGIS 10.0. The correlations of the field data with the 15 predictors were analyzed using IBM SPSS 18 (IBM, Armonk, NY, USA), and certain significant correlations were observed (Table 1). All the simulated factors, that is, H’, BD, TOC, TN, and TK, possessed significant correlations with different predictors, indicating the feasibility of their spatial simulations. In addition, another two factors, namely, Pielou index in the vegetation component and AP in the soil component, were also initially selected as the potential factors of the sandy island ecosystem health. However, no significant correlations of the two factors with the predictors existed, and thus the two factors were eliminated from the factors. The soil salinity (Sa), which would be used for indicating one of the disturbances in the next step, was originally point data sourced by filed investigation. It was also included in the simulated objects and its significant correlations with the predictors were found.

Table 1.
Correlations of the simulated point factors with the predictors.
Second, 20% of the 110 sampling sites were randomly selected as the validating samples, and the other 80% were considered training samples. Before conducting the simulations, the outliers for each simulated factor were identified and removed. The partial least square regression (PLSR), which is a commonly used and highly repeatable approach [71,103,104], was used to implement the simulations using Minitab 17. The training and validating samples were entered, the maximum component number was given as 10, and a leave-one-out cross validation method was adopted. The results indicated the acceptable simulation accuracies for all the simulated factors.
Third, the predictor values of all the assessment units in different years were entered, and the area data of the simulated factors were obtained, i.e., the simulations from point to area and from present to past were accomplished.
The spatial distributions of the 12 factors in the three components are shown in Figure 3.
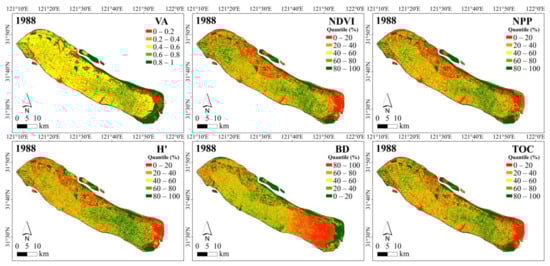
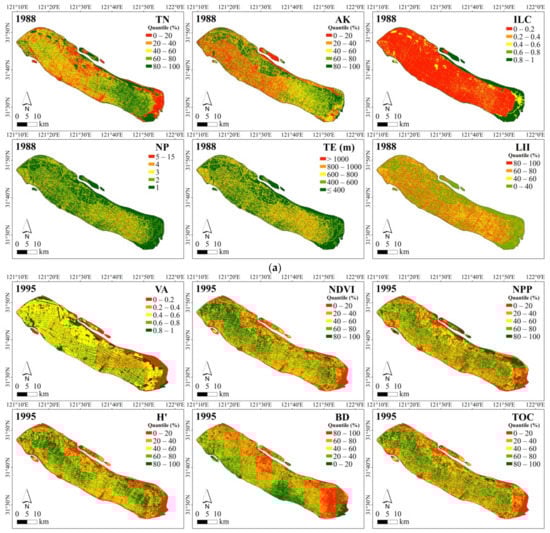
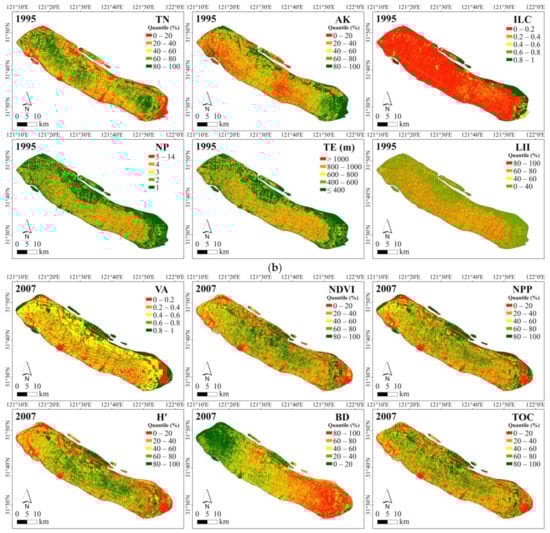
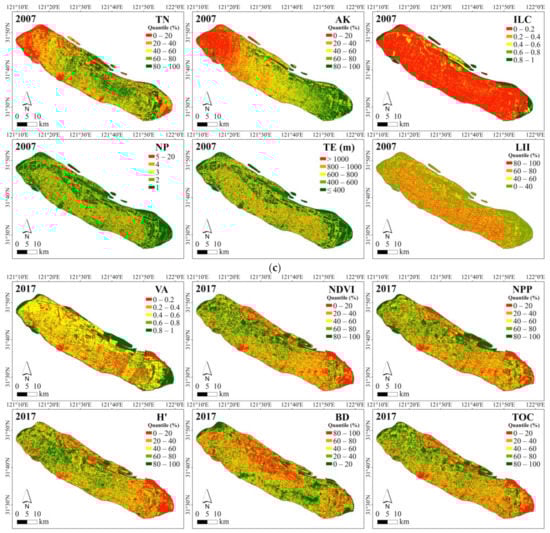
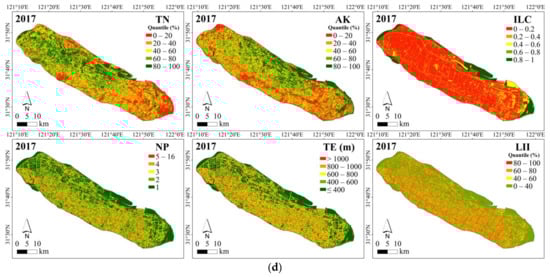
Figure 3.
(a) Spatial distributions of the 12 factors in 1988. (b) Spatial distributions of the 12 factors in 1995. (c) Spatial distributions of the 12 factors in 2007. (d) Spatial distributions of the 12 factors in 2017. Abbreviations for the factors are the same as for Figure 1.
2.2.3. Calculation of SIEHI-1
For measuring the states of different components and calculating the SIEHI-1, all the factor values should be standardized for the comparability of different factors in different years. For each of the factors, the 95th and 5th percentiles of all the factor values in the four years were considered the upper and lower limits, respectively, to avoid the extreme value effects. Of the 12 factors, BD, NP, TE, and LII are “less is better” factors, and the remaining 8 factors are “more is better” factors. The standardization was then conducted using the equation in [5].
The states of the three components were measured using the following equation:
where C is the state of one component; Fi is the standardized value of factor i contained in the component; and wi is the weighed value of factor i. Then, the SIEHI-1 was calculated using the following equation:
where Ci and wi are the state and weighed value of component i, respectively. An equal weighted method was adopted to represent the equal importance of the factors and components [5,10]. The fs is the function to standardize the value of SIEHI-1 using the 99th and 1st percentiles of all the index values in the four years as the upper and lower limits, respectively, for clearly exhibiting the spatiotemporal heterogeneity of the sandy island ecosystem health.
2.3. Part 2 of the Sandy Island Ecosystem Health: The Resilience
The framework for assessing the resilience is presented in Figure 4. The method was first proposed in the present study to assess the resilience of sandy ecosystem health by integrating the results of previous studies. In the method, three main external disturbances of the sandy island ecosystem were identified, the intrinsic correlation of the variation of each component with that of each disturbance was clarified, and the resilience was then measured based on the variations of component and disturbance, as well as their intrinsic correlations.
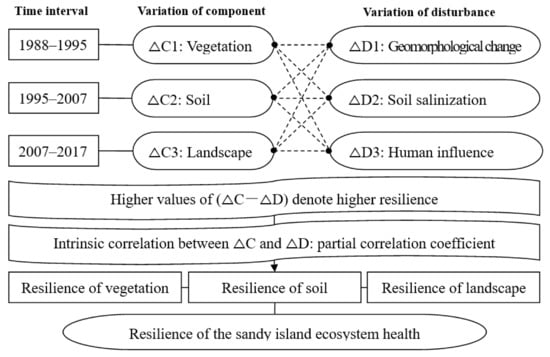
Figure 4.
Framework for assessing the resilience of the sandy island ecosystem health: ΔC and ΔD indicate the variations of a component and disturbance, respectively, across a time interval.
2.3.1. Three Disturbances
The sandy island ecosystem is deeply influenced by the intensive interactions of river, land, and sea because the formation and change of the sandy island are closely related to the water and sediment discharge via the river, the hydrodynamic condition in the estuary, and the continuous force from the seawater [13,71,105]. Furthermore, intensive human activities exert increasing influences on the sandy island ecosystem [5,14,69,106]. Therefore, multiple natural and anthropogenic disturbances jointly drive the change of sandy island ecosystem health. The main disturbances were identified in the following three types.
(1) Geomorphological change
The geomorphological change mainly refers to the variations of area and shape of the island. It is the most conspicuous sign of island evolution and affects the basic parameter of an island, i.e., the island area, which determines the carrying capacity for biota and human activities [92,107]. It is also a fundamental parameter of coastal wetlands [52]. In terms of a sandy island, the increase in the island area indicates the increase in land resources and spaces for performing more functions and thus enhances the ecosystem health, and vice versa. The disturbance of geomorphological change across a time interval was measured using the following equation:
where D1 is the disturbance of geomorphological change; ΔD1a–b is the variation of this disturbance across years a and b, and a–b indicates 1988–1995, 1995–2007, and 2007–2017 in this study; and Ab and Aa are island areas in an assessment unit in years b and a, respectively. A higher ΔD1a–b indicates that the island area is increasing, the disturbance is decreasing, and the influence of this disturbance is getting more positive across years a and b.
(2) Soil salinization
As a common ecological problem in coastal lowlands, the soil salinization is controlled by different factors. Specifically, seawater intrusion provides the salt source, and high evaporation rate, frequent droughts, irregular precipitations, and sea level changes accelerate the process [108,109,110,111]. Meanwhile, human activities have played an important role in influencing the soil salinization. They aggravate it by saline water irrigation and groundwater use and mitigate it by ecological measures and reasonable tillage practice [15,16,112]. The soil salinization was judged by the salinity content, and the disturbance of soil salinization across a time interval was measured using the following equation:
where D2 is the disturbance of soil salinization; SSb and SSa are standardized salinity contents in an assessment unit in years b and a, respectively. The standardization method for the salinity is the same as for the aforementioned negative factors, and a higher ΔD2a–b indicates that the degree of soil salinization is decreasing, the disturbance is decreasing, and the influence of this disturbance is getting more positive across years a and b.
(3) Human influence
In recent decades, human influence has been the main driving factor of the ecological evolution on many islands [5,69,113,114]. Human activities not only participate in processes of the aforementioned disturbances, but also generate considerable influences on the sandy island ecosystem in different aspects. The classification and quantification of the human influence are complex and difficult [115,116]. A composite index, namely, human net influence index (HNII), was proposed by the authors [11] to identify the integrative influence of different types of human activities on the sandy island ecosystem. The HNII was calculated based on remote sensing by measuring the negative and positive influences of human activities on five aspects of the sandy island ecosystem, including island geomorphology, landscape pattern, plant community, physical quality, and chemical environment. The HNII has been applied in Chongming Island and proven to be effective in representing the human integrative influence on the sandy island ecosystem, and a higher HNII indicates a more positive influence. The disturbance of human influence across a time interval was measured using the following equation:
where D3 is the disturbance of human influence; HNIIb and HNIIa are HNIIs in an assessment unit in years b and a, respectively. A higher ΔD3a–b indicates that the disturbance is decreasing, and the human influence is getting more positive across years a and b.
The spatial distributions of variations of the three disturbances across different years are presented in Figure 5.
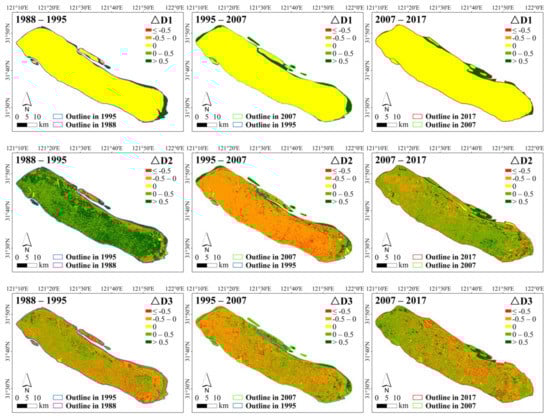
Figure 5.
Spatial distributions of variations of the disturbances across different years: D1: disturbance 1, i.e., geomorphological change; D2: disturbance 2, i.e., soil salinization; D3: disturbance 3, i.e., human influence. ΔD indicates the variation of one disturbance across a time interval.
2.3.2. Resilience of Different Components under the Multiple Disturbances
The intrinsic correlation between components and disturbances at a single time point has been studied on Dongtou Archipelago [10]. In that study, the partial correlation analysis was employed to identify the factual influence of the disturbance on the component and quantify the influence degree based on the correlation coefficient; the results revealed the intrinsic correlations between components and disturbances [10]. However, the practice in the previous study was in a static state, i.e., at a single time point. The intrinsic correlations between the variations of components and disturbances of the sandy island ecosystem across different time points remain to be clarified in the present study for assessing the resilience. The resilience refers to the responses of different components to the three disturbances across a time interval. The variations of components (ΔC) and disturbances (ΔD) occur across the same time interval, that is, 1988–1995, 1995–2007, and 2007–2017. A positive ΔC indicates an increase in the state value of a component across the time interval, and the higher ΔC, the higher the increase in the state value. A positive ΔD denotes a decrease in the degree of disturbance across the time interval, and the higher ΔD, the higher the decrease in the degree of disturbance. Meanwhile, ΔC corresponds to ΔD in each assessment unit. Thus, the components and disturbances are comparable after quantification and standardization, the intrinsic correlations between components and disturbances can be measured, and the resilience can be then obtained based on the intrinsic correlations. Two circumstances indicate the high resilience across a time interval: (1) when the ΔD is positive, the increase in the states of components is higher than the decrease in the degree of disturbances; (2) when the ΔD is negative, the decrease in the state of components is lower than the increase in the degree of disturbances. To be brief, higher values of (ΔC − ΔD) denote higher resilience.
Furthermore, the intrinsic correlations between components and disturbances are complicated, that is, different components respond variously to the disturbance. Moreover, correlations may also differ among different disturbances. Thus, the partial correlation of each of the ΔCs with each of the ΔDs was analyzed through IBM SPSS 18 to explore the factual response of each component to each of the disturbances after eliminating the joint effects of the two other disturbances across different time intervals (Table 2).
Table 2.
Partial correlation coefficients of variations of components with those of disturbances.
The positive partial correlations were considered the factual responses, and the negative ones were ruled out. Then, the resilience of each component under the multiple disturbances across different time intervals was calculated using the following equations:
where RC1, RC2, and RC3 are the resilience of vegetation, soil, and landscape components, respectively, across a time interval; ΔC1, ΔC2, and ΔC3 are the variations of vegetation, soil, and landscape components, respectively, across a time interval; ΔDi is the variation of disturbance i across a time interval; and PCCi is the partial correlation coefficient of ΔC with ΔDi across a time interval, and only positive correlations are considered. PCC indicates the factual influence degree of a disturbance on a component, and (ΔC − ΔD) denotes the change of the component under the disturbance. Then, the resilience of all the three components (RC) is calculated using the following equation:
where RCi is the resilience of component i across a time interval.
2.3.3. Calculation of SIEHI-2
The SIEHI-2 should be measured for each year (1988, 1995, 2007, and 2017) to ensure the consistency with SIEHI-1 and to conduct the calculation of the following SIEHI. The resilience in one year is the average of the resilience in the time interval before the year and that after the year. Thus, the SIEHI-2 was calculated using the following equation:
where RCbefore and RCafter are the RCs in the time interval before one year and that after the year, respectively. Specifically, SIEHI-2 in 1995 is calculated using the average value of RCs across 1988–1995 and 1995–2007; SIEHI-2 in 2007 is calculated using the average value of RCs across 1995–2007 and 2007–2017. For SIEHI-2 in 1988 and 2017, only RCafter and RCbefore existed, respectively. Thus, RC across 1988–1995 and that across 2007–2017 were directly used as SIEHI-2 in 1988 and 2017, respectively. The fs is the function to standardize the value of SIEHI-2 using the same method as for SIEHI-1.
2.4. Sandy Island Ecosystem Health Index (SIEHI)
2.4.1. Calculation of SIEHI
The SIEHI is composed of two parts, that is, SIEHI-1 and SIEHI-2. The two parts are closely inter-related and interacted, because the resilience is obtained based on the states of different components and their responses to the multiple disturbances. Furthermore, each of the two parts is essential to the sandy island ecosystem health, and the deterioration of each of the two parts will result in the distinct decrease in SIEHI. At the extreme, if each of SIEHI-1 and SIEHI-2 = 0, then SIEHI = 0. Thus, the SIEHI was calculated using the following equation:
2.4.2. Analyses of SIEHI-1, SIEHI-2, and SIEHI in Chongming Island
The maps of SIEHI-1, SIEHI-2, and SIEHI were generated through ArcGIS 10.0. Based on the results of the assessment units, the temporal changes of SIEHI-1, SIEHI-2, and SIEHI in the entire study area, in different land cover types, and for different protected areas from 1988 to 2017, were analyzed. Each of SIEHI-1, SIEHI-2, and SIEHI was divided into five levels, that is, Levels 1–5, when the index values are 0–0.2, 0.2–0.4, 0.4–0.6, 0.6–0.8, and 0.8–1, respectively, and area proportions of different levels were determined from 1988 to 2017. To verify the gradient effect of the distance to the shoreline (DTS) on the sandy island ecosystem health, changes of SIEHI-1, SIEHI-2, and SIEHI along the DTS gradient were analyzed.
3. Results
3.1. Assessment Results of Part 1
3.1.1. States of the Three Components in the Four Years
The spatiotemporal characteristics of the three components in the four years are presented in Figure 6. The state of vegetation component was better in the alongshore wetland vegetation than in the inner island, and in woodland and cropland than in built-up areas, water areas, and ponds. From 1988 to 2017, the state was becoming better over the entire island, which was largely manifested in the improvement of vegetation conditions in cropland and woodland in the inner island. In the alongshore areas, the state of the newly formed wetland vegetation was getting better, whereas that of the newly reclaimed ponds was getting worse. In terms of the soil component, most areas of the island were in the intermediate or bad state in 1988, and only a small part in the alongshore areas exhibited a good state. In 1995, the areas in an intermediate state increased compared with those in 1988. In 2007, the areas in a good state slightly increased compared with those in 1995. The soil component was generally in a good state in 2017, and the state over the island was distinctly better than that in the three other years. From 1988 to 2017, the state was generally becoming better. For the landscape component, the state was very good in the alongshore areas. By contrast, the areas in the inner island, particularly those along the roads or waterways and in the urbanized areas, were in a bad state. The state was generally becoming worse from 1988 to 2017.
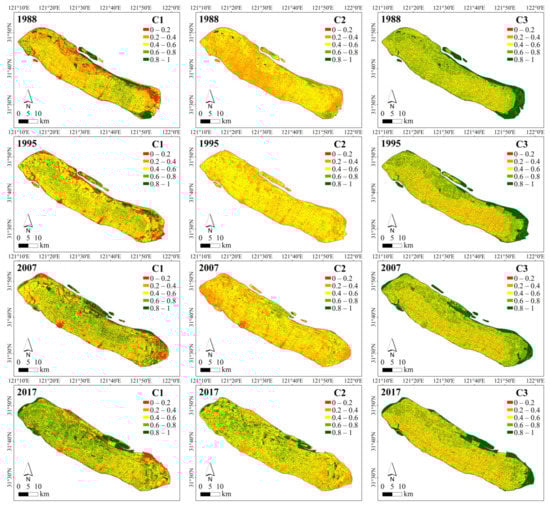
Figure 6.
Spatiotemporal characteristics of the three components in the four years: C1: vegetation component; C2: soil component; C3: landscape component.
3.1.2. Maps of SIEHI-1 in the Four Years
The maps of SIEHI-1 in the four years are presented in Figure 7. In 1988, the SIEHI-1 was high in the alongshore vegetation areas and generally low over the inner areas of the island. In 1995, the SIEHI-1 slightly decreased in the alongshore areas and the expanded built-up areas, while it increased in cropland and woodland compared with that in 1988. In 2007, the SIEHI-1 generally increased compared with that in 1995. Specifically, the SIEHI-1 in the northern and western alongshore areas distinctly increased, and that in the surrounding areas of built-up areas in the inner island slightly increased. In 2017, the SIEHI-1 increased over the island, except for in the eastern alongshore areas.
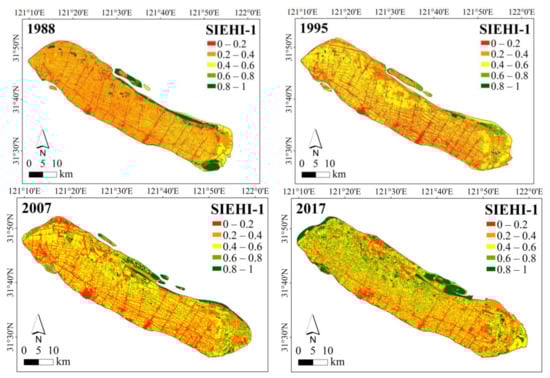
Figure 7.
Maps of SIEHI-1 in the four years: SIEHI-1: Part 1 of the sandy island ecosystem health index.
3.2. Assessment Results of Part 2
3.2.1. Resilience under Multiple Disturbances across Different Years
The spatiotemporal characteristics of the resilience of components under multiple disturbances are shown in Figure 8. The resilience of vegetation component was generally low across 1988–1995, and only a small part in the east of the island exhibited high resilience. The resilience was much higher across 1995–2007 than that across 1988–1995, and high resilience was observed over nearly the entire island. Across 2007–2017, this resilience showed clear spatial heterogeneity, that is, the assessment units with different values of the resilience were mixed. Furthermore, the western part of the island showed higher resilience than the eastern part. Overall, the three time intervals were in the following descending order of the resilience of vegetation component: 1995–2007, 2007–2017, and 1988–1995. In terms of the soil component, the resilience was low in the eastern alongshore areas and the northwestern part in the inner island across 1988–1995. Across 1995–2007, the western, northern, and eastern alongshore areas exhibited low resilience, yet the resilience in inner areas of the island was generally higher than that across 1988–1995. Across 2007–2017, the resilience in the alongshore areas was still low, while the inner island generally showed higher resilience compared with that across 1995–2007. Overall, the resilience in the alongshore areas remained low, yet that in the inner island increased along the three time intervals. The resilience of landscape component stayed low in the alongshore areas across the three time intervals. Meanwhile, the resilience in the inner island was distinctly higher across 1995–2007 than that across 1988–1995 and 2007–2017. For the resilience of all the three components, it combined the spatiotemporal characteristics of vegetation, soil, and landscape components. Specifically, the alongshore areas exhibited low resilience across the three time intervals, which was in accordance with the characteristics of the resilience of soil and landscape components; the resilience in the inner areas of the island was generally low and high across 1998–1995 and across 1995–2007, respectively, and showed clear spatial heterogeneity across 2007–2017, which was in accordance with the characteristics of the resilience of vegetation component.
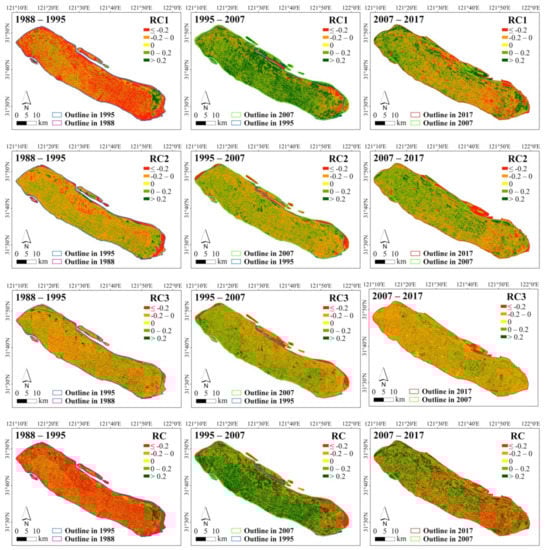
Figure 8.
Spatiotemporal characteristics of the resilience of components under multiple disturbances across different years: RC1: resilience of vegetation component; RC2: resilience of soil component; RC3: resilience of landscape component; RC: resilience of all the three components.
3.2.2. Maps of SIEHI-2 in the Four Years
The maps of SIEHI-2 in the four years are shown in Figure 9. The spatial characteristics of SIEHI-2 in 1988 and 2017 were similar to those of RCs across 1998–1995 and 2007–2017, respectively. The SIEHI-2 in 1995 combined the spatial characteristics of RCs across 1998–1995 and 1995–2007; and the SIEHI-2 in 2007 combined those across 1995–2007 and 2007–2017. In brief, the SIEHI-2 in the alongshore areas was not high in the four years. By contrast, the SIEHI-2 in the inner island was generally low, intermediate, and high in 1988, 1995, and 2007, respectively, and showed distinct heterogeneity in 2017.
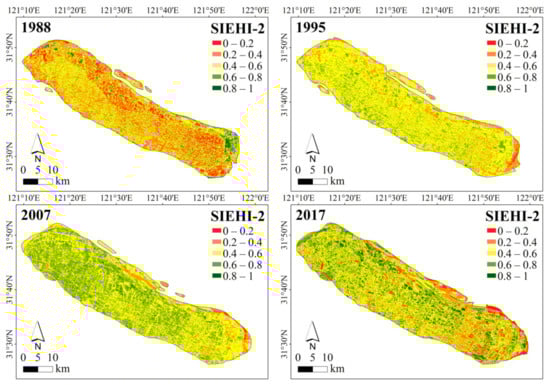
Figure 9.
Maps of SIEHI-2 in the four years: SIEHI-2: Part 2 of the sandy island ecosystem health index.
3.3. Assessment Results of the Sandy Island Ecosystem Health
3.3.1. Maps of SIEHI in the Four Years
The maps of SIEHI in the four years are presented in Figure 10. In 1998, the alongshore areas showed intermediate or high values of SIEHI. In the inner island, some small patches in the north of the island showed very high values of SIEHI, parts of croplands and woodlands exhibited intermediate values of SIEHI, and the remaining parts, particularly the built-up areas, had low or very low values of SIEHI. In 1995, the SIEHI in the alongshore areas decreased compared with that in 1988. By contrast, the areas with intermediate values of SIEHI in the inner island distinctly increased. In 2007, most areas in the inner island exhibited intermediate values of SIEHI, the northern alongshore areas showed high values of SIEHI, and the eastern alongshore areas and the built-up areas in the inner island had low values of SIEHI. In 2017, high values of SIEHI were observed in the western alongshore areas and in patches scattered in the inner island, whereas low values of SIEHI were in the eastern alongshore areas and the built-up areas in the inner island.
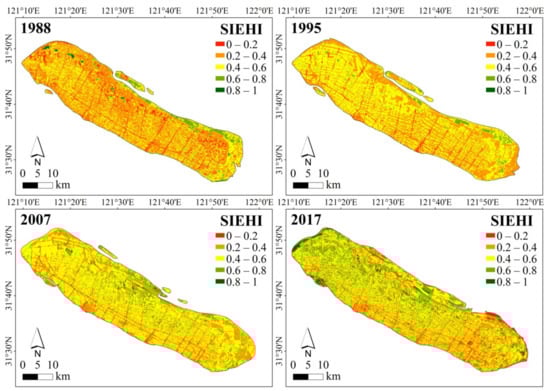
Figure 10.
Maps of SIEHI in the four years: SIEHI: sandy island ecosystem health index.
3.3.2. Spatiotemporal Characteristics of the Sandy Island Ecosystem Health
The overall temporal changes of the sandy island ecosystem health from 1988 to 2017 are shown in Figure 11. The SIEHI-1 slightly decreased from 1988 to 1995 and then distinctly increased from 1995 to 2017. The SIEHI-2 initially increased from 1998 to 2007 and then decreased from 2007 to 2017. The SIEHI continuously increased from 1988 to 2017.
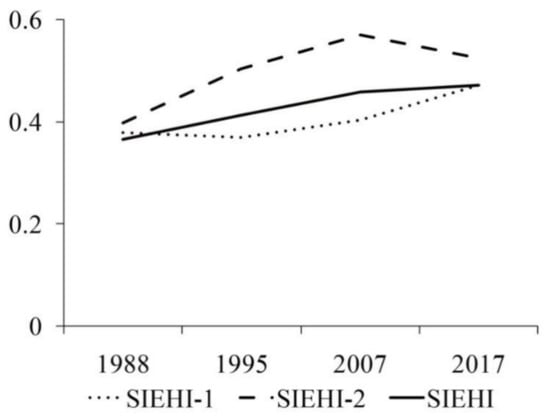
Figure 11.
Overall changes of the sandy island ecosystem health from 1988 to 2017: SIEHI: sandy island ecosystem health index; SIEHI-1: Part 1 of the SIEHI; SIEHI-2: Part 2 of the SIEHI.
The SIEHI-1, SIEHI-2, and SIEHI in different land cover types and for different protected areas are presented in Table 3. In different land cover types, SIEHI-1 was high in wetland vegetation, intermediate in cropland and woodland, and low in the remaining land cover types. From 1988 to 2017, SIEHI-1 in wetland vegetation, mudflat, and traffic land initially decreased and then increased; that in woodland showed fluctuating characteristics; that in cropland, water areas, building land, and industrial land continuously increased; and that in ponds did not present distinct changes. For the SIEHI-2 from 1988 to 2017, it remained low in wetland vegetation, showed decreasing characteristics in mudflat, and initially distinctly increased and then slightly decreased in the remaining land cover types. The SIEHI showed the similar characteristics to the SIEHI-1 for different land cover types. In terms of the protected areas, SIEHI-1 was higher in core and ordinary protected areas than in nonprotected areas in all the four years. In 1988, SIEHI-1 was much higher in core protected areas than in ordinary protected areas. In 1995, 2007, and 2017, ordinary protected areas achieved the highest SIEHI-1. The SIEHI-2 generally showed decreasing and increasing characteristics in core and ordinary protected areas, respectively, from 1988 to 2017. It first increased from 1988 to 2007 and then slightly decreased from 2007 to 2017 in nonprotected areas. The SIEHI was highest in core protected areas in 1988, in ordinary protected areas in 1995 and 2007, and in nonprotected areas in 2017.
Table 3.
Results of SIEHI-1, SIEHI-2, and SIEHI in different land cover types and protected areas.
The proportions of different levels of the sandy island ecosystem health are presented in Table 4. For the SIEHI-1, Level 2 occupied the biggest proportion in 1988, Levels 2 and 3 were the biggest in 1995 and 2007, and Levels 2–4 covered the most areas in 2017. For the SIEHI-2, Levels 2 and 3 were the biggest in 1988, Level 3 occupied the most in 1995, and Levels 3 and 4 were the biggest in 2007 and 2017. In terms of the SIEHI, Levels 1 and 5 occupied small proportions in the four years. Areas in Levels 2 and 4 continuously decreased and increased, respectively, and those in Level 3 initially increased and then decreased from 1988 to 2017.
Table 4.
Proportions of different levels of the sandy island ecosystem health (%).
The changes of the sandy island ecosystem health along the DTS gradient are shown in Figure 12. In 1988, SIEHI-1, SIEHI-2, and SIEHI all showed decreasing characteristics along the gradient, and the characteristics for SIEHI-1 and SIEHI were more distinct than those for SIEHI-2. The lines were gentle when DTS > 3 km. Along the gradient in 1995, the SIEHI-1 decreased when DTS < 3 km and then gently fluctuated, the SIEHI-2 increased when DTS < 5 km and then gently fluctuated, and the SIEHI showed gently fluctuating characteristics. In 2007, SIEHI-1 and SIEHI decreased when DTS < 3 km and then gently fluctuated, and the SIEHI-2 slightly increased along the gradient. In 2017, the SIEHI-1 distinctly decreased when DTS < 3 km and then slightly increased, the SIEHI-2 continuously increased and the increasing characteristics were more distinct than those in 2007, and the SIEHI initially increased when DTS < 1 km, then decreased when 1 km < DTS < 4 km, and finally increased when DTS > 4 km.
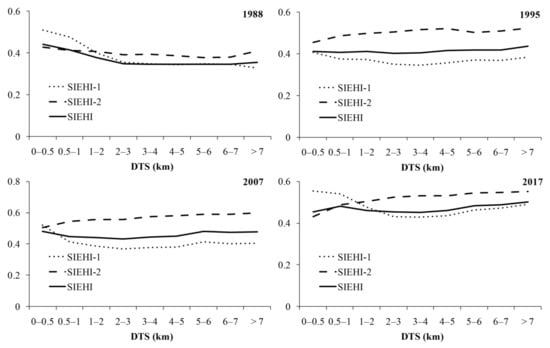
Figure 12.
Changes of the sandy island ecosystem health along the gradient of distance to shoreline (DTS): SIEHI: sandy island ecosystem health index; SIEHI-1: Part 1 of the SIEHI; SIEHI-2: Part 2 of the SIEHI.
4. Discussion
4.1. Key Issues in Assessing the Sandy Island Ecosystem health
4.1.1. Two Parts of the Sandy Island Ecosystem Health
Two parts of the sandy island ecosystem health were identified, analyzed, and assessed in this study.
Part 1 was assessed based on the recognized framework of the three components, namely, vegetation, soil, and landscape. In previous studies, this framework has been successfully applied in Dongtou Archipelago in southern China and Miaodao Archipelago in northern China, which are constituted mainly by rocky islands [10,41]. This study demonstrated the effectiveness of the framework in assessing the states of essential components in the sandy island ecosystem. Rocky and sandy islands are two major types of islands and occupied most of the world’s islands and nearly all the islands in middle and high latitudes [5,92,117]. Previous and present studies proved the good applicability of the framework in these two types of islands, and its applicability in coral reef islands remains to be studied in future work.
Part 2 was assessed by identifying the multiple disturbances, tracking the rapid temporal variations, and clarifying the intrinsic correlations between the components and disturbances. Various natural and anthropogenic disturbances, including sea level rise [47], saltwater intrusion [48], sea reclamation [49], onshore industries [50], and aquaculture [51], existed and set a special and complex context of the coastal ecosystem. In the present study, three main disturbances were identified by considering the above potential disturbances that generate distinct influences. All of the three disturbances were measured using quantifiable indicators, parts of which were sourced from previous reliable results [11]. The temporal variations were analyzed on the premise of the comparability of the components and disturbances, and the three time intervals were exhibited based on the existing data in the 4 years during the last 30 years. The intrinsic correlations could be considered causal links between the disturbances (causes) and components (effects) after the aforementioned identification of multiple disturbances. A partial correlation analysis was used to clarify the intrinsic correlations. This analysis could reveal the practical effects generated by one type of disturbance by eliminating the joint effects from the two other disturbances [10]. In this study, nearly all of the partial correlation coefficients were positive, indicating the distinct causal links between the disturbances and components. The partial correlation coefficients greatly varied in different disturbances and components, thereby revealing the different influences from different disturbances on different components of the sandy island ecosystem. Based on the aforementioned work, the resilience was measured by connecting the components with the disturbances using their comparable values and intrinsic correlations in different time intervals. Then, the resilience in different years was obtained by resampling the results across the three time intervals to those in the four years.
The two parts can be measured and integrated to comprehensively represent sandy island ecosystem health. Part 1 contributed to the wide application of the framework of vegetation, soil, and landscape in different types of islands. Part 2 provided a new method for measuring the resilience of the sandy island ecosystem responding to multiple disturbances across different time points, and the applicability of the method also remains to be validated on different islands in future studies. The method proposed in the present study corresponds to the three points existing in the previous studies, which were mentioned in the Introduction section. Specifically, the method comprehensively considers the essential components of the island ecosystem and the main external disturbances by integrating the field and remote sensing data, clarifies the intrinsic correlations between the variations of components and disturbances across different time points, and realizes the spatial visualization of the state and resilience in the assessment results, thereby effectively solving the three points and mapping the spatiotemporal pattern of sandy island ecosystem health during the last decades.
4.1.2. Adequate Utilization of Remote Sensing Data in the Assessment
The other key issue for realizing the assessment was the adequate utilization of remote sensing data. Remote sensing as a rapidly developing and highly applicable technique has been widely applied in ecosystem health research for the abundant spatiotemporal information and accessible data source [4,27,52]. In the present study, the spatiotemporal information of remote sensing data was adequately utilized in two aspects.
First, the remote sensing data were directly used for the extractions of island outlines and land cover types, as well as the calculations of ecological indexes. The island outlines set the extent of the study area in different years and were used to analyze the geomorphological change. The land cover types served as the basic data for calculating VA in the vegetation component and all the factors (ILC, NP, TE, and LII) in the landscape component. Two of the ecological indexes, namely, NDVI and NPP, were factors in the vegetation component. Moreover, HNII as the indicator of human interference was calculated by combining the land cover and ecological indexes [11]. Therefore, seven factors in the components, including VA, NDVI, NPP, ILC, NP, TE, and LII, and two disturbances were all obtained directly using the remote sensing data. Their results were area data that covered the entire study area across different years during the last decades, thereby meeting the requirement of assessment of the sandy island ecosystem health.
Second, the remote sensing data functioned as the predictors to conduct the spatial simulations of field data from point to area and from present to past. Some factors in the components and disturbances, including H’, BD, TOC, TN, AK, and Sa, were sourced by field work. Unlike the above factors that were directly sourced by remote sensing and covered the entire island in different years, these field data were point data only at a time point. In previous studies, the spatial simulations of the field data from point to area and from present to past have been implemented, and good effects have been achieved, thereby proving the feasibility to conduct such simulations [72,97,118]. In this study, we conducted the spatial simulations based on the multitemporal remote sensing data (Landsat series satellites), various predictors that adequately utilized the ecological information of the remote sensing data (spectral reflectance and reflectance-based ecological indexes), and reliable algorithm that had high maneuverability and repeatability (PLSR). To avoid the potential errors generated by the temporal variations of the remote sensing data, controlling measures such as radiometric calibration and atmospheric correction were conducted, and the changing bands and indexes such as thermal infrared bands and brightness temperatures were not selected as the predictors. The simulation results showed acceptable accuracies for different simulated factors. Thus, the factors that ranged from 1988 to 2017 and covered the entire study areas were obtained, thereby meeting the requirement of the assessment. However, two points remain to be promoted, that is, the collection of measured data to validate the simulation results in different years and the improvement of the simulation accuracy using more sophisticated procedures.
Therefore, remote sensing provided the major data source of the present study, and the utilization of remote sensing data in the two aspects adequately tapped their ecological significance and effectively supported the assessments of the two parts of the sandy island ecosystem health.
4.2. Driving Factors of Spatiotemporal Variations of the Sandy Island Ecosystem Health
4.2.1. Contributions of Components and Factors to the Spatiotemporal Variations
To identify the main driving factors of spatiotemporal variations of the ecosystem health of Chongming Island, the contributions of components and factors to the spatiotemporal variations were measured using correlation analyses. The correlation coefficients of the sandy island ecosystem health with different components and factors in the four years were presented in Table 5. All of the correlations were significant because of the enormous analyzed samples, yet the correlation coefficients varied considerably. Among SIEHI, SIEHI-1, and SIEHI-2, the correlation coefficient between SIEHI and SIEHI-1 was constantly higher than that between SIEHI and SIEHI-2 in all the four years; the difference was small in 1988 and 2017 and large in 1995 and 2007, which indicated that the spatial characteristics of SIEHI were influenced by both of SIEHI-1 and SIEHI-2 in 1988 and 2017, while mainly controlled by SIEHI-1 in 1995 and 2007. The correlation coefficient between SIEHI-1 and SIEHI-2 was in a very low level in the four years, exhibiting their weak spatial correlation. It indicated that the two parts of the sandy island ecosystem health were relatively independent to each other in the temporal scope of the study, and each of them was indispensable. That is, the high value of only one of the two parts did not necessarily denote good sandy island ecosystem health. In terms of the three components and 12 factors, SIEHI and SIEHI-1 showed certain high correlation coefficients with them, whereas SIEHI-2 exhibited weak correlations, which was in accordance with the aforementioned correlation between SIEHI-1 and SIEHI-2. Generally, correlation coefficients for vegetation and soil components were higher than those for the landscape component in the four years, of which the vegetation component achieved the highest one, and those for landscape component were particularly lower in 2007 and 2017. The vegetation and soil components, which mainly refer to the microscale state, contributed much more to the spatial variance of sandy island ecosystem health than the landscape component, which mainly represents the macroscale state [5,119]. This result was not in accordance with the previous studies on the rocky islands, which showed that the soil and landscape components were the major components on Dongtou Archipelago and Miaodao Archipelago, respectively [10,41]. Though the three components are all essential to the island ecosystem, their importance degrees may change across different islands. In the vegetation component, NDVI and NPP showed high correlation coefficients in all the four years, indicating the large contribution of vegetation growth condition to the sandy island ecosystem health, which was in accordance with the previous studies on the rocky islands [10,41]. The correlation coefficient for VA was high in 1988, 1995, and 2007 and distinctly low in 2017. By contrast, that for H’ continuously increased from 1988 with a low value to 2017, when a high one was achieved. It indicated that the plant diversity has played an increasingly important role, and the vegetation quality rather than the quantity greatly contributed to sandy island ecosystem health in recent years. For the four factors in the soil component, TOC and TN exhibited high and increasing correlation coefficients from 1988 to 2017, whereas correlation coefficients for the remaining two factors were low. TOC and TN, which refer to the two basic elements in the soil [90], made large contributions to the sandy island ecosystem. In the landscape component, the correlation coefficient for ILC was high only in 1988 and low in 1995, 2007, and 2017. The remaining three factors showed intermediate correlation coefficients in all the four years, which indicated that landscape fragmentation was not the decisive factor influencing the sandy island ecosystem health and explained the relatively lower contribution of landscape component than the two other components.
Table 5.
Correlation coefficients of the sandy island ecosystem health with different components and factors in the four years.
4.2.2. Contributions of Disturbances and Resilience to the Spatiotemporal Variations
The influences of different disturbances on the states of components have been shown in Table 2. The partial correlation coefficient between ΔC and ΔD denoted the independent influence of the variation of one disturbance on that of one component. The ΔD1 showed positive correlations with ΔC1 and ΔC3 and a negative correlation with ΔC2 in all the three time intervals. The increase in the island area brought about the improvement in states of vegetation and landscape components because the newly formed areas were always covered by wetland vegetation, which showed good growth condition and high landscape connectivity. Meanwhile, the soil in these newly formed areas was severely influenced by seawater and thus had a low state. Distinct positive correlation was observed between ΔD2 and ΔC1, indicating that the decrease in the degree of soil salinization remarkably helped improve the state of the vegetation component, particularly in the inner areas of the island covered by crops and forests. This result was in accordance with a previous study on coastal forested wetlands [43]. Furthermore, ΔD2 was positively and negatively correlated with ΔC2 and ΔC3, respectively, though in a limited degree, showing the influences of soil salinization on the soil and landscape components. As shown in Figure 5, areas with positive ΔD2 covered most of the island across 1988–1995 and 2007–2017, while those with negative ΔD2 occupied the most across 1995–2007. The degree of soil salinization showed a fluctuating temporal change under the natural and anthropogenic factors and was generally getting better after the long-term and island-wide tillage practice [71]. High partial correlation coefficients of ΔD3 with ΔC1, ΔC2, and ΔC3 revealed the distinct human influences on the three components. The results denoted the high sensitivity of all the three components to human influences. That is, positive human influences contributed to increasing the states of the three components, while negative human influences resulted in the decreases in the states.
The correlation coefficients among the resilience of different components are presented in Table 6. Across the three time intervals, RC2, RC1, and RC3 were in the descending order of the correlation coefficients with RC, indicating their different contributions to the spatiotemporal variations of RC. Among RC1, RC2, and RC3, only the correlation between RC2 and RC3 was distinct, revealing the intrinsic link between the resilience of soil and landscape components. In addition, RC2 also showed a certain positive correlation with RC1. The soil served as the base of the ecosystem, and high resilience of the soil component may improve the resilience of the two other components [10,120].
Table 6.
Correlation coefficients among the resilience of different components.
4.2.3. Driving Factors of the Spatiotemporal Variations
Based on the aforementioned analyses, the spatiotemporal variations of sandy island ecosystem health were controlled by the two parts, namely, the state and resilience. In different components, the vegetation and soil components contributed more than the landscape component to the sandy island ecosystem health. In the specific factors, vegetation quality and soil carbon/nitrogen were the ones that showed the most contributions.
Of the three disturbances, the human influence on the three components was generally higher than the two other disturbances, indicating the major role of human activities in driving the spatiotemporal variations of the sandy island ecosystem health. This result was in accordance with the previous studies on rocky islands [41,113,114] and coastal wetlands [4,52]. The states of the three components were quickly getting better when the human influence was getting more positive, and vice versa. However, the influences generated by human activities were not overwhelmingly dominant. The geomorphological change and soil salinization also exerted practical influences on different components to certain degrees. The vegetation component received an increasing influence from geomorphological change yet a decreasing influence from soil salinization from 1988 to 2017, and the increase in the island area and the decrease in the degree of soil salinization brought about the improvement of the vegetation component. In addition, the increase in the island area resulted in the deterioration and improvement of the soil and landscape components, respectively. These results confirmed that the spatiotemporal variations of the sandy island ecosystem health were controlled by multiple natural and anthropogenic disturbances, and human influence played a major role during the last decades.
4.3. Novel Suggestions Based on The Sandy Island Ecosystem Health
4.3.1. Influence Coefficients of Different Human Activities on the Sandy Island Ecosystem
The human activity has been proven to be the major factor influencing sandy island ecosystem health. Accurately measuring the influences of different human activities on the island ecosystem is the premise to balance the island protection and development and achieve island ecosystem-based management. The influence coefficients of different human activities can provide a universal standard for measuring the anthropogenic influences through a simple process. Specifically, the single influence from one type of human activity and the comprehensive influences from multiple types of human activities can be easily quantified based on the areas and the influence coefficients of different human activities. In most of the previous studies, the influence coefficients were empirically assigned to ensure the simplicity, yet the accuracy was uncertain [92,115,121]. To meet the demands of high simplicity and accuracy, a previous study on the ecosystem health of rocky islands has provided the influence coefficients of typical human activities on the rocky island [41]. In this study, the influence coefficients for the sandy island could also be obtained based on the results. Seven typical types of human activities were extracted based on the land cover types, that is, plantation, farming, waterway construction, pond aquaculture, building construction, traffic development, and factory construction. The wetland vegetation and mudflat, which received little or low anthropogenic influence, were considered natural areas of the sandy island, and the area-weighted SIEHI of wetland vegetation and mudflat was used as the baseline to measure the changes of SIEHI under different types of human activities. The relative SIEHI of one type of human activity was obtained using the ratio of the SIEHI of the human activity to the aforementioned area-weighted SIEHI. Then, the influence coefficients of different human activities were calculated using the following equation [41]:
where IC is the influence coefficient of one type of human activity; rSIEHI is the relative SIEHI of one type of human activity; T is the threshold. Two schemes exist for the threshold selection. Scheme 1: A threshold of 0.7 was used based on the island carrying capacity [122], and the influence coefficients are comparable to those for the rocky islands. Scheme 2: The lowest relative SIEHI of different types of human activities (i.e., 0.4384 for the traffic development) was used as the threshold, and the influence coefficients are applicable for only the sandy island and can better represent the differences among different human activities. The calculated influence coefficients of different types of human activities on the sandy island ecosystem are shown in Table 7. In terms of Scheme 2, traffic development, waterway construction, and factory construction were the three types that exerted the highest influences per area. In consideration of the area of each type, farming and building construction were the two types that showed the highest influences, and accounted for 37.12% and 35.59%, respectively, of the anthropogenic influence.
Table 7.
Influence coefficients of different types of human activities on the sandy island ecosystem.
4.3.2. Measures for the Sandy Island Ecosystem-Based Management
Chongming Island is the hotspot of ecosystem studies, and various measures for conserving the island ecosystem have been proposed by scholars and administrators. As a time-honored site for human inhabitation and agricultural activities and an indispensible part of Shanghai City, the largest city in China, the economic development is one of the main goals of the island [77]. Meanwhile, the ecological functions of the island received increasing attention in recent decades and were unprecedented valued in the context of the China’s theory of “Lucid Water and Lush Mountains are Invaluable Assets” [123]. The development and protection are both essential to the island and should be well-balanced to pursue the sandy island ecosystem-based management. Different functional zones can be divided based on the results of the state and resilience of the sandy island ecosystem health for balancing the development and protection through conducting different measures in different zones. According to the five levels for SIEHI-1 and SIEHI-2 (Table 4), three functional zones, namely, Zone A, Zone B, and Zone C, were assigned for different purposes in 2017. Along the zones from Zone A to Zone C, the protection and development functions were decreasing and increasing, respectively. The division scheme for different zones is as follows: Zone A: areas in Levels 4 or 5 of SIEHI-1 and in Levels 1, 2, or 3 of SIEHI-2, as well as areas in Level 3 of SIEHI-1 and in Levels 1 or 2 of SIEHI-2; Zone C: areas in Levels 1 or 2 of SIEHI-1 and in Levels 3, 4, or 5 of SIEHI-2, as well as areas in Level 3 of SIEHI-1 and in Levels 4 or 5 of SIEHI-2; Zone B: the remaining areas. The scheme was proposed by referencing the previous study [10]. Thus, the three functional zones in 2017 were obtained and are shown in Figure 13. The area proportions of Zones A, B, and C were 24.01%, 36.88%, and 39.10%, respectively. Zone A was mainly along the shoreline with continuous distribution and also in areas with good state and bad resilience in the inner island with scattered distribution, and it covered most of the protected areas of the island. Zone C was in different types of development areas, including urban constructions, pond aquaculture, waterways, and parts of croplands. Zone B was in the intermediate areas between Zones A and C. The areas and spatial distributions of different zones ensured the core functions of protection (Zone A) and development (Zone C), as well as the multiple functions (Zone B) on the basis of factual conditions.
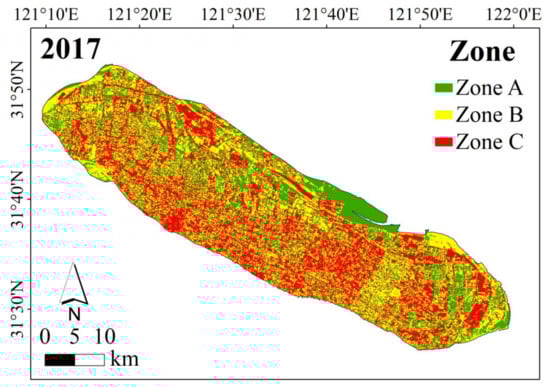
Figure 13.
Different functional zones based on the SIEHI-1 and SIEHI-2: Zone A is mainly for protection function; Zone B is for the harmonious coexistence of protection and development; and Zone C is mainly for development function.
Different measures should be formulated for different zones. In Zone A, strict protection measures should be implemented. In this zone, the SIEHI-1 was generally high, while the SIEHI-2 was generally low. For the three components, the damaged vegetation and soil should be ecologically restored; the current vegetation should be protected from human occupation and biological invasion; and the landscape connectivity should be improved by removing the obstacles and constructing the ecological corridors. In terms of the three disturbances, most of the areas in Zone A were in the alongshore areas and were susceptible to geomorphological change and soil salinization. In areas in which coastal erosions often occurred, revetment measures with the ecological revetment as the primary means should be conducted. Specific measures to control the soil salinization are not needed in these areas because the wetland vegetation species have certain salt-tolerance. The human influences also need attention, and human activities that are not for protection purposes should be prohibited. In Zone B, the harmonious coexistence of protection and development is pursued. This zone was mainly composed of cropland, woodland, and parts of wetland vegetation and built-up areas. Within this zone, areas with different levels of SIEHI-1 or SIEHI-2 could be observed. The areas with high SIEHI-1 had high SIEHI-2, and vice versa. Soil salinization and human influence were two major disturbances to this zone. The former may severely threaten the vegetation growth in cropland and woodland. Different measures for controlling the soil salinization, including physical, chemical, and biological modifications, should be conducted to mitigate or even eliminate the negative influence from soil salinization [112,124]. For the human influence, the spatial patterns of human activities should be optimized based on the SIEHI-1 and SIEHI-2. In areas with high SIEHI-1 and SIEHI-2 (e.g., parts of wetland vegetation), moderate human activities can be conducted in forms of ecological tourism. In areas with intermediate SIEHI-1 and SIEHI-2 (e.g., cropland and woodland), high-quality agricultural activities should be conducted through rational tillage practice. In areas with low SIEHI-1 and SIEHI-2 (e.g., parts of built-up areas), the constructions that have low density and intensity are encouraged and ecological restoration measures should be simultaneously carried out to improve SIEHI-1 and SIEHI-2. In Zone C where the SIEHI-1 was generally low while the SIEHI-2 was generally high, measures for reasonable and efficient development should be conducted for maximizing the economic and social benefits and minimizing the negative effects on the sandy island ecosystem. The urban construction should be organized and compact with high intensities for reserving space for future generations [125,126]. Meanwhile, the greenway network should be continuously constructed to improve the ecological connectivity of built-up areas, which aims to mitigate the influences from landscape fragmentation on the island biodiversity [11]. From the perspective of a larger scale, the pressure from the surrounding and relevant areas, such as the decline in water and sediment discharge along the Yangtze River [13], the high threat degree of wastewater pollutants in the Yangtze River Delta [50], and the tourist visits from the urban agglomeration [127], should also be noticed and the corresponding measures should be made in the way of regional linkage and cooperation.
5. Conclusions
This study assessed the sandy island ecosystem health by integrating the two parts, that is, the states of essential components and the resilience under multiple disturbances. The states were measured following the framework of vegetation, soil, and landscape, and a total of 12 factors in the three components were adopted. The results demonstrated the effectiveness of the framework in the sandy island ecosystem, which corresponded to the first scientific question proposed at the end of the Introduction section. Three typical disturbances on the sandy island, namely, geomorphological change, soil salinization, and human influence, were identified, and the resilience was measured by clarifying the intrinsic correlations between the variations of components and disturbances across different time intervals, thereby solving the second scientific question of the study. Then, the contributions of components, factors, and disturbances to the spatiotemporal variations of sandy island ecosystem health were analyzed, and the main driving factors were identified, which corresponded to the third scientific question. Based on the assessment results, influence coefficients of different human activities were determined for providing a universal standard and a simple method for measuring the anthropogenic influences on the sandy island ecosystem, and different measures for the sandy island ecosystem-based management were proposed for different functional zones. The novel suggestions answered the fourth scientific question.
The results in Chongming Island indicated that the SIEHI-1 in the alongshore areas was generally high in the four years, and that in the inner island was low in 1988 yet showed increasing characteristics from 1988 to 2017. By contrast, the SIEHI-2 was generally low in the alongshore areas in the four years, while that in the inner island was low, intermediate, and high in 1988, 1995, and 2007, respectively, and showed distinct heterogeneity in 2017. The SIEHI combined the spatiotemporal characteristics of SIEHI-1 and SIEHI-2. In the entire study area from 1988 to 2017, the SIEHI-1 initially slightly decreased and then distinctly increased, the SIEHI-2 first distinctly increased and then slightly decreased, and the SIEHI continuously increased. In different land cover types, the SIEHI and SIEHI-1 were high in wetland vegetation, intermediate in cropland and woodland, and low in the remaining land cover types in the four years. The SIEHI-2 remained low in wetland vegetation, showed decreasing characteristics in mudflat, and initially distinctly increased and then slightly decreased in the remaining land cover types from 1988 to 2017. Along the DTS gradient, the SIEHI showed decreasing and gently fluctuating characteristics in 1988 and 1995, respectively; it first decreased and then gently fluctuated in 2007; and it initially increased, then decreased, and finally increased in 2017. In different components and factors, the vegetation and soil components contributed more than the landscape component to the sandy island ecosystem health, and vegetation quality and soil carbon/nitrogen were the factors that showed the most contributions; in different disturbances, the human influence played a major role in driving the spatiotemporal variations of the sandy island ecosystem health, and the geomorphological change and soil salinization also exerted practical influences on different components to certain degrees.
Author Contributions
Conceptualization, Y.C. and D.L.; methodology, Y.C.; software, Y.C.; validation, Y.C. and D.L.; formal analysis, Y.C.; investigation, Y.C.; writing—original draft preparation, Y.C.; writing—review and editing, Y.C. and D.L.; visualization, Y.C.; supervision, D.L. All authors have read and agreed to the published version of the manuscript.
Funding
This research was funded by the National Natural Science Foundation of China (No. 42071116) and the Basic Scientific Fund for National Public Research Institutes of China (No. 2021S02).
Data Availability Statement
The data presented in this study are available upon reasonable request.
Acknowledgments
We thank NASA and USGS for the open source Landsat data. We also appreciate the anonymous reviewers for the valuable comments.
Conflicts of Interest
The authors declare no conflict of interest.
References
- Ministry of Natural Resources of China, 2018. Bulletin of Island Statistical Survey in 2017. Available online: http://gi.mnr.gov.cn/201807/t20180727_2156215.html (accessed on 12 December 2021).
- Cohen, M.C.L.; Lara, R.J.; Smith, C.B.; Angélica, R.S.; Dias, B.S.; Pequeno, T. Wetland dynamics of Marajó Island, northern Brazil, during the last 1000 years. Catena 2008, 76, 70–77. [Google Scholar] [CrossRef]
- França, M.C.; Francisquini, M.I.; Cohen, M.C.L.; Pessenda, L.C.R.; Rossetti, D.F.; Guimarães, J.T.F.; Smith, C.B. The last mangroves of Marajó Island—Eastern Amazon: Impact of climate and/or relative sea-level changes. Rev. Palaeobot. Palynol. 2012, 187, 50–65. [Google Scholar] [CrossRef]
- Chi, Y.; Zheng, W.; Shi, H.; Sun, J.; Fu, Z. Spatial heterogeneity of estuarine wetland ecosystem health influenced by complex natural and anthropogenic factors. Sci. Total Environ. 2018, 634, 1445–1462. [Google Scholar] [CrossRef] [PubMed]
- Chi, Y.; Zhang, Z.; Gao, J.; Xie, Z.; Zhao, M.; Wang, E. Evaluating landscape ecological sensitivity of an estuarine island based on landscape pattern across temporal and spatial scales. Ecol. Indic. 2019, 101, 221–237. [Google Scholar] [CrossRef]
- Cai, W.; Song, X.; Zhang, P.; Xin, Z.; Zhou, Y.; Wang, Y.; Wei, W. Carbon emissions and driving forces of an island economy: A case study of Chongming Island, China. J. Clean. Prod. 2020, 254, 120028. [Google Scholar] [CrossRef]
- Li, B.; Yuan, X.; Chen, M.; Bo, S.; Xia, L.; Guo, Y.; Zhao, S.; Ma, Z.; Wang, T. How to strive for balance of coastal wind energy development with waterbird conservation in the important coastal wetlands, a case study in the Chongming Islands of East China. J. Clean. Prod. 2020, 263, 121547. [Google Scholar] [CrossRef]
- Hu, Z.; Li, H.; Bao, Y.; Ge, B. Biodiversity comparison of macrobenthic communities at tidal flat of Lingkun Island. Acta Ecol. Sin. 2008, 28, 1498–1507. [Google Scholar]
- Fu, J.; Huang, H.; Yang, X. Comparison of land use classification methods used in analysis of the Tangshan Bay three islands using remote sensing images based on ENVI. Mar. Sci. 2014, 38, 20–26. [Google Scholar]
- Chi, Y.; Zhang, Z.; Wang, J.; Xie, Z.; Gao, J. Island protected area zoning based on ecological importance and tenacity. Ecol. Indic. 2020, 112, 106139. [Google Scholar] [CrossRef]
- Chi, Y.; Liu, D.; Wang, J.; Wang, E. Human negative, positive, and net influences on an estuarine area with intensive human activity based on land covers and ecological indices: An empirical study in Chongming Island, China. Land Use Policy 2020, 99, 104846. [Google Scholar] [CrossRef]
- Huang, B.; Ouyang, Z.; Zheng, H.; Zhang, H.; Wang, X. Construction of an ecoisland: A case study of Chongming Island, China. Ocean Coast Manag. 2008, 51, 575–588. [Google Scholar] [CrossRef]
- Li, X.; Zhou, Y.; Zhang, L.; Kuang, R. Shoreline change of Chongming Dongtan and response to river sediment load: A remote sensing assessment. J. Hydrol. 2014, 511, 432–442. [Google Scholar] [CrossRef]
- Chen, L.; Ren, C.; Zhang, B.; Li, L.; Wang, Z.; Song, K. Spatiotemporal dynamics of coastal wetlands and reclamation in the Yangtze Estuary during past 50 years (1960s–2015). Chin. Geogr. Sci. 2018, 3, 1–14. [Google Scholar] [CrossRef]
- Fan, X.; Pedroli, B.; Liu, G.; Liu, Q.; Liu, H.; Shu, L. Soil salinity development in the Yellow River Delta in relation to groundwater dynamics. Land Degrad. Dev. 2012, 23, 175–189. [Google Scholar] [CrossRef]
- Yu, J.; Li, Y.; Han, G.; Zhou, D.; Fu, Y.; Guan, B.; Wang, G.; Ning, K.; Wu, H.; Wang, J. The spatial distribution characteristics of soil salinity in coastal zone of the Yellow River Delta. Environ. Earth Sci. 2014, 72, 589–599. [Google Scholar] [CrossRef]
- Walter, J.; Lück, E.; Bauriegel, A.; Facklam, M.; Zeitz, J. Seasonal dynamics of soil salinity in peatlands: A geophysical approach. Geoderma 2018, 310, 1–11. [Google Scholar] [CrossRef]
- Aragüés, R.; Medina, E.T.; Zribi, W.; Clavería, I.; Álvaro-Fuentes, J.; Faci, J. Soil salinization as a threat to the sustainability of deficit irrigation under present and expected climate change scenarios. Irrig. Sci. 2014, 33, 67–79. [Google Scholar] [CrossRef]
- Scudiero, E.; Skaggs, T.H.; Corwin, D.L. Simplifying field-scale assessment ofspatiotemporal changes of soil salinity. Sci. Total Environ. 2017, 587–588, 273–281. [Google Scholar] [CrossRef]
- Thiam, S.; Villamor, G.B.; Kyei-Baffour, N.; Matty, F. Soil salinity assessment and coping strategies in the coastal agricultural landscape in Djilor district, Senegal. Land Use Policy 2019, 88, 104191. [Google Scholar] [CrossRef]
- Shen, G.; Ibrahim, A.N.; Wang, Z.; Ma, C.; Gong, J. Spatial–temporal land-use/land-cover dynamics and their impacts on surface temperature in Chongming Island of Shanghai, China. Int. J. Remote Sens. 2015, 36, 4037–4053. [Google Scholar] [CrossRef]
- Li, Z.; Zhou, C.; Yang, X.; Chen, X.; Meng, F.; Lu, C.; Pan, T.; Qi, W. Urban landscape extraction and analysis in the mega-city of China’s coastal regions using high-resolution satellite imagery: A case of Shanghai, China. Int. J. Appl. Earth. Obs. 2018, 72, 140–150. [Google Scholar] [CrossRef]
- Zhao, B.; Kreuter, U.; Li, B.; Ma, Z.; Chen, J.; Nakagoshi, N. An ecosystem service value assessment of land-use change on Chongming Island China. Land Use Policy 2004, 21, 139–148. [Google Scholar] [CrossRef]
- Liu, Z.; Fan, B.; Huang, Y.; Yu, P.; Zhao, Y. Assessing the ecological health of the Chongming Dongtan Nature Reserve, China, using different benthic biotic indices. Mar. Pollut. Bull. 2019, 146, 76–84. [Google Scholar] [CrossRef]
- Styers, D.M.; Chappelka, A.H.; Marzen, L.J.; Somers, G.L. Developing a land-cover classification to select indicators of forest ecosystem health in a rapidly urbanizing landscape. Landscape Urban Plan. 2010, 94, 158–165. [Google Scholar] [CrossRef]
- Wu, N.; Liu, A.; Wang, Y.; Li, L.; Chao, L.; Liu, G. An assessment framework for grassland ecosystem health with consideration of natural succession: A case study in Bayinxile, China. Sustainability 2019, 11, 1096. [Google Scholar] [CrossRef]
- Ekumah, B.; Armah, F.A.; Afrifa, E.K.A.; Aheto, D.W.; Odoi, J.O.; Afitiri, A.R. Geospatial assessment of ecosystem health of coastal urban wetlands in Ghana. Ocean Coast. Manag. 2020, 193, 105226. [Google Scholar] [CrossRef]
- Zhang, Y.; Leung, J.Y.S.; Zhang, Y.; Cai, Y.; Zhang, Z.; Li, K. Agricultural activities compromise ecosystem health and functioning of rivers: Insights from multivariate and multimetric analyses of macroinvertebrate assemblages. Environ. Pollut. 2021, 275, 116655. [Google Scholar] [CrossRef]
- Halpern, B.S.; Longo, C.; Hardy, D.; McLeod, K.L.; Samhouri, J.F.; Katona, S.K.; Kleisner, K.; Lester, S.E.; Leary, J.O.; Ranelletti, M.; et al. An index to assess the health and benefits of the global ocean. Nature 2012, 488, 615–620. [Google Scholar] [CrossRef]
- Wu, Z.; Chen, R.; Meadows, M.E.; Liu, X. Application of the Ocean Health Index to assess ecosystem health for the coastal areas of Shanghai, China. Ecol. Indic. 2021, 126, 107650. [Google Scholar] [CrossRef]
- Su, M.; Xie, H.; Yue, W.; Zhang, L.; Yang, Z.; Chen, S. Urban ecosystem health evaluation for typical Chinese cities along the Belt and Road. Ecol. Indic. 2019, 101, 572–582. [Google Scholar] [CrossRef]
- Das, M.; Das, A.; Pereira, P.; Mandal, A. Exploring the spatio-temporal dynamics of ecosystem health: A study on a rapidly urbanizing metropolitan area of Lower Gangetic Plain, India. Ecol. Indic. 2021, 125, 107584. [Google Scholar] [CrossRef]
- Peterson, E.E.; Cunningham, S.A.; Thomas, M.; Collings, S.; Bonnett, G.D.; Harch, B. An assessment framework for measuring agroecosystem health. Ecol. Indic. 2017, 79, 265–275. [Google Scholar] [CrossRef]
- Mantyka-Pringle, C.S.; Jardine, T.D.; Bradford, L.; Bharadwaj, L.; Kythreotis, A.P.; Fresque-Baxter, J.; Kelly, E.; Somers, G.; Doig, L.E.; Jones, P.D.; et al. Bridging science and traditional knowledge to assess cumulative impacts of stressors on ecosystem health. Environ. Int. 2017, 102, 125–137. [Google Scholar] [CrossRef] [PubMed]
- Li, W.; Xie, S.; Wang, Y.; Huang, J.; Cheng, X. Effects of urban expansion on ecosystem health in Southwest China from a multi-perspective analysis. J. Clean. Prod. 2021, 294, 126341. [Google Scholar] [CrossRef]
- Pan, Z.; He, J.; Liu, D.; Wang, J.; Guo, X. Ecosystem health assessment based on ecological integrity and ecosystem services demand in the Middle Reaches of the Yangtze River Economic Belt, China. Sci. Total Environ. 2021, 774, 144837. [Google Scholar] [CrossRef]
- Liu, W.; Guo, Z.; Jiang, B.; Lu, F.; Wang, H.; Wang, D.; Zhang, M.; Cui, L. Improving wetland ecosystem health in China. Ecol. Indic. 2020, 113, 106184. [Google Scholar] [CrossRef]
- Zhao, C.; Pan, T.; Dou, T.; Liu, J.; Liu, C.; Ge, Y.; Zhang, Y.; Yu, X.; Mitrovic, S.; Lim, R. Making global river ecosystem health assessments objective, quantitative and comparable. Sci. Total Environ. 2019, 667, 500–510. [Google Scholar] [CrossRef]
- Smith, T.B.; Nemeth, R.S.; Blondeau, J.; Calnan, J.M.; Kadison, E.; Herzlieb, S. Assessing coral reef health across onshore to offshore stress gradients in the US Virgin Islands. Mar. Pollut. Bull. 2008, 56, 1983–1991. [Google Scholar] [CrossRef]
- Wu, L.; You, W.; Ji, Z.; Xiao, S.; He, D. Ecosystem health assessment of Dongshan Island based on its ability to provide ecological services that regulate heavy rainfall. Ecol. Indic. 2018, 84, 393–403. [Google Scholar]
- Chi, Y.; Liu, D.; Xing, W.; Wang, J. Island ecosystem health in the context of human activities with different types and intensities. J. Clean. Prod. 2021, 281, 125334. [Google Scholar] [CrossRef]
- Dybiec, J.M.; Albert, D.A.; Danz, N.P.; Wilcox, D.A.; Uzarski, D.G. Development of a preliminary vegetation-based indicator of ecosystem health for coastal wetlands of the Laurentian Great Lakes. Ecol. Indic. 2020, 119, 106768. [Google Scholar] [CrossRef]
- Conroy, B.M.; Hamylton, S.M.; Kumbier, K.; Kelleway, J.J. Assessing the structure of coastal forested wetland using field and remote sensing data. Estuar. Coast. Shelf Sci. 2022, 271, 107861. [Google Scholar] [CrossRef]
- Huang, Y.; Li, Y.; Chen, Q.; Huang, Y.; Tian, J.; Cai, M.; Huang, Y.; Jiao, Y.; Yang, Y.; Du, X.; et al. Effects of reclamation methods and habitats on macrobenthic communities and ecological health in estuarine coastal wetlands. Mar. Pollut. Bull. 2021, 168, 112420. [Google Scholar] [CrossRef] [PubMed]
- Zhang, K.; Shi, Y.; Lu, H.; He, M.; Huang, W.; Siemann, E. Soil bacterial communities and co-occurrence changes associated with multi-nutrient cycling under rice-wheat rotation reclamation in coastal wetland. Ecol. Indic. 2022, 144, 109485. [Google Scholar] [CrossRef]
- Wu, M.; Li, C.; Du, J.; He, P.; Zhong, S.; Wu, P.; Lu, H.; Fang, S. Quantifying the dynamics and driving forces of the coastal wetland landscape of the Yangtze River Estuary since the 1960s. Reg. Stud. Mar. Sci. 2019, 32, 100854. [Google Scholar] [CrossRef]
- Estrela-Segrelles, C.; Gómez-Martinez, G.; Pérez-Martín, M.Á. Risk assessment of climate change impacts on Mediterranean coastal wetlands. Application in Júcar River Basin District (Spain). Sci. Total Environ. 2021, 790, 148032. [Google Scholar] [CrossRef]
- Visschers, L.L.B.; Santos, C.D.; Franco, A.M.A. Accelerated migration of mangroves indicate large-scale saltwater intrusion in Amazon coastal wetlands. Sci. Total Environ. 2022, 836, 155679. [Google Scholar] [CrossRef]
- Agboola, J.I.; Ndimele, P.E.; Odunuga, S.; Akanni, A.; Kosemani, B.; Ahove, M.A. Ecological health status of the Lagos wetland ecosystems: Implications for coastal risk reduction. Estuar. Coast. Shelf Sci. 2016, 183, 73–81. [Google Scholar] [CrossRef]
- Zhao, X.; Zhang, Q.; He, G.; Zhang, L.; Lu, Y. Delineating pollution threat intensity from onshore industries to coastal wetlands in the Bohai Rim, the Yangtze River Delta, and the Pearl River Delta, China. J. Clean. Prod. 2021, 320, 128880. [Google Scholar] [CrossRef]
- Monsalve, E.R.; Quiroga, E. Farmed shrimp aquaculture in coastal wetlands of Latin America—A review of environmental issues. Mar. Pollut. Bull. 2022, 183, 113956. [Google Scholar] [CrossRef]
- Sahana, M.; Saini, M.; Areendran, G.; Imdad, K.; Sarma, K.; Sajjad, H. Assessing Wetland ecosystem health in Sundarban Biosphere Reserve using pressure-state-response model and geospatial techniques. Remote Sens. Appl. Soc. Environ. 2022, 26, 100754. [Google Scholar] [CrossRef]
- Duan, H.; Yu, X.; Zhang, L.; Xia, S.; Liu, Y.; Mao, D.; Zhang, G. An evaluating system for wetland ecological risk: Case study in coastal mainland China. Sci. Total Environ. 2022, 828, 154535. [Google Scholar] [CrossRef] [PubMed]
- Rapport, D.J. What constitutes ecosystem health? Perspect. Biol. Med. 1989, 33, 120–132. [Google Scholar] [CrossRef]
- Rapport, D.J.; Costanza, R.; McMichael, A.J. Assessing ecosystem health. Trends Ecol. Evol. 1998, 13, 397–402. [Google Scholar] [CrossRef]
- Costanza, R.; Norton, B.G.; Haskell, B.J. Ecosystem Health: New Goals for Environmental Management; Island Press: Washington, DC, USA, 1992. [Google Scholar]
- Whitford, W.G.; Rapport, D.J.; de Soyza, A.G. Using resistance and resilience measurements for ‘fitness’ tests in ecosystem health. J. Environ. Manag. 1999, 57, 21–29. [Google Scholar] [CrossRef]
- Lackey, R.T. Values, policy, and ecosystem health. BioScience 2001, 51, 437–443. [Google Scholar] [CrossRef]
- Gewin, V. The state of the planet. Nature 2002, 417, 112–113. [Google Scholar] [CrossRef]
- Wiegand, J.; Raffaelli, D.; Smart, J.C.R.; White, P.C.L. Assessment of temporal trends in ecosystem health using a holistic indicator. J. Environ. Manag. 2010, 91, 1446–1455. [Google Scholar] [CrossRef]
- He, J.; Pan, Z.; Liu, D.; Guo, X. Exploring the regional differences of ecosystem health and its driving factors in China. Sci. Total Environ. 2019, 10, 553–564. [Google Scholar] [CrossRef]
- Xiao, R.; Yu, X.; Shi, R.; Zhang, Z.; Yu, W.; Li, Y.; Chen, G.; Gao, J. Ecosystem health monitoring in the Shanghai-Hangzhou Bay Metropolitan Area: A hidden Markov modeling approach. Environ. Int. 2019, 133, 105170. [Google Scholar] [CrossRef]
- Sasaki, T.; Furukawa, T.; Iwasaki, Y.; Seto, M.; Mori, A.S. Perspectives for ecosystem management based on ecosystem resilience and ecological thresholds against multiple and stochastic disturbances. Ecol. Indic. 2015, 57, 395–408. [Google Scholar] [CrossRef]
- Nathwani, J.; Lu, X.; Wu, C.; Fu, G.; Qin, X. Quantifying security and resilience of Chinese coastal urban ecosystems. Sci. Total Environ. 2019, 672, 51–60. [Google Scholar] [CrossRef] [PubMed]
- Meng, Y.; Liu, X.; Ding, C.; Xu, B.; Zhou, G.; Zhu, L. Analysis of ecological resilience to evaluate the inherent maintenance capacity of a forest ecosystem using a dense Landsat time series. Ecol. Inform. 2020, 57, 101064. [Google Scholar] [CrossRef]
- Jian, P.; Liu, Y.; Li, T.; Wu, J. Regional ecosystem health response to rural land use change: A case study in Lijiang City, China. Ecol. Indic. 2017, 72, 399–410. [Google Scholar]
- Zhan, J.; Zhang, F.; Chu, X.; Liu, W.; Zhang, Y. Ecosystem services assessment based on emergy accounting in Chongming Island, Eastern China. Ecol. Indic. 2019, 105, 464–473. [Google Scholar] [CrossRef]
- Qiao, G.; Mi, H.; Wang, W.; Tong, X.; Li, Z.; Li, T.; Liu, S.; Hong, Y. 55-year (1960–2015) spatiotemporal shoreline change analysis using historical DISP and Landsat time series data in Shanghai. Int. J. Appl. Earth Obs. 2018, 68, 238–251. [Google Scholar] [CrossRef]
- Chi, Y.; Wang, E.; Wang, J. Identifying the anthropogenic influence on the spatial distribution of plant diversity in an estuarine island through multiple gradients. Glob. Ecol. Conserv. 2020, 21, e00833. [Google Scholar] [CrossRef]
- Zhang, S.; Wang, L.; Hu, J.; Zhang, W.; Fu, X.; Le, Y.; Jin, F. Organic carbon accumulation capability of two typical tidal wetland soils in Chongming Dongtan, China. J. Environ. Sci. 2011, 23, 87–94. [Google Scholar] [CrossRef]
- Chi, Y.; Zhao, M.; Sun, J.; Xie, Z.; Wang, E. Mapping soil total nitrogen in an estuarine area with high landscape fragmentation using a multiple-scale approach. Geoderma 2019, 339, 70–84. [Google Scholar] [CrossRef]
- Chi, Y.; Sun, J.; Liu, D.; Xie, Z. Reconstructions of four-dimensional spatiotemporal characteristics of soil organic carbon stock in coastal wetlands during the last decades. Catena 2022, 218, 106553. [Google Scholar] [CrossRef]
- Ding, D.; Jiang, Y.; Wu, Y.; Shi, T. Landscape character assessment of water-land ecotone in an island area for landscape environment promotion. J. Clean. Prod. 2020, 259, 120934. [Google Scholar] [CrossRef]
- Ma, X.; de Jong, M.; den Hartog, H. Assessing the implementation of the Chongming Eco Island policy: What a broad planning evaluation framework tells more than technocratic indicator systems. J. Clean. Prod. 2018, 172, 872–886. [Google Scholar] [CrossRef]
- Fang, J.; Liu, M.; Liu, W.; Pathak, S.; Li, S.; Tang, X.; Zhou, L.; Sun, F. Piloting a capital-based approach for characterizing and evaluating drivers of island sustainability- An application in Chongming Island. J. Clean. Prod. 2020, 261, 121123. [Google Scholar] [CrossRef]
- Yuan, L.; Ge, Z.; Fan, X.; Zhang, L. Ecosystem-based coastal zone management: A comprehensive assessment of coastal ecosystems in the Yangtze Estuary coastal zone. Ocean Coast. Manag. 2014, 95, 63–71. [Google Scholar] [CrossRef]
- The People’s Government of Chongming District in Shanghai, 2018. Master Plan and General Land-Use Plan of Chongming District, Shanghai, 2017–2035. Available online: https://www.shcm.gov.cn/zjcm/ztgh/mobile/index.html (accessed on 2 February 2022).
- Bureau of Statistics of Chongming District in Shanghai, 2022. Statistics Bulletin of the National Economic and Social Development of Chongming District in Shanghai. 2021. Available online: https://www.shcm.gov.cn/govxxgk/qtjj/2022-04-19/4065d02c-28fd-4344-b864-8d26c7e13f97.html (accessed on 8 August 2022).
- Borges, P.A.V.; Cardoso, P.; Kreft, H.; Whittaker, R.J.; Fattorini, S.; Emerson, B.C.; Gil, A.; Gillespie, R.G.; Matthews, T.J.; Santos, A.M.C.; et al. Global Island Monitoring Scheme (GIMS): A proposal for the long-term coordinated survey and monitoring of native island forest biota. Biodivers. Conserv. 2018, 27, 2567–2586. [Google Scholar] [CrossRef]
- Gil, A.; Fonseca, C.; Benedicto-Royuela, J. Land cover trade-offs in small oceanic islands: A temporal analysis of Pico Island, Azores. Land Degrad. Dev. 2018, 29, 349–360. [Google Scholar] [CrossRef]
- Wilson, B.R.; Wilson, S.C.; Sindel, B.; Williams, L.K.; Hawking, K.L.; Shaw, J.; Tighe, M.; Hua, Q.; Kristiansen, P. Soil properties on sub-Antarctic Macquarie Island: Fundamental indicators of ecosystem function and potential change. Catena 2019, 177, 167–179. [Google Scholar] [CrossRef]
- Chi, Y.; Sun, J.; Fu, Z.; Xie, Z. Spatial pattern of plant diversity in a group of uninhabited islands from the perspectives of island and site scales. Sci. Total Environ. 2019, 664, 334–346. [Google Scholar] [CrossRef]
- Craven, D.; Knight, T.M.; Barton, K.E.; Bialic-Murphy, L.; Chase, J.M. Dissecting macroecological and macroevolutionary patterns of forest biodiversity across the Hawaiian archipelago. Proc. Natl. Acad. Sci. USA 2019, 116, 16436–16441. [Google Scholar] [CrossRef]
- Thies, C.; Tscharntke, T. Landscape structure and biological control in agroecosystems. Science 1999, 285, 893–895. [Google Scholar] [CrossRef]
- Xie, Z.; Li, X.; Zhang, Y.; Chen, S. Accelerated expansion of built-up area after bridge connection with mainland: A case study of Zhujiajian Island. Ocean Coast Manag. 2018, 152, 62–69. [Google Scholar] [CrossRef]
- Xu, H.; Zhang, T. Assessment of consistency in forest-dominated vegetation observations between aster and Landsat ETM+ images in subtropical coastal areas of Southeastern China. Agric. For. Meteorol. 2013, 168, 1–9. [Google Scholar] [CrossRef]
- Sun, J.; Chi, Y.; Fu, Z.; Li, T.; Dong, K. Spatiotemporal variation of plant diversity under a unique estuarine wetland gradient system. Chin. Geogr. Sci. 2020, 30, 217–232. [Google Scholar] [CrossRef]
- Tilman, D.; Reich, P.B.; Knops, J.M.H. Biodiversity and ecosystem stability in a decade–long grassland experiment. Nature 2006, 441, 629–632. [Google Scholar] [CrossRef] [PubMed]
- Potter, C.S.; Randerson, J.T.; Field, C.B.; Matson, P.A.; Vitousek, P.M.; Mooney, H.A.; Klooster, S.A. Terrestrial ecosystem production: A process model based on global satellite and surface data. Glob. Biogeochem. Cycles 1993, 7, 811–841. [Google Scholar] [CrossRef]
- Yang, R.; Guo, W. Exotic Spartina alterniflora enhances the soil functions of a coastal ecosystem. Soil Sci. Soc. Am. J. 2018, 82, 901–909. [Google Scholar] [CrossRef]
- Galloway, J.N.; Townsend, A.R.; Erisman, J.W.; Bekunda, M.; Cai, Z.; Freney, J.R.; Martinelli, L.A.; Seitzinger, S.P.; Sutton, M.A. Transformation of the nitrogen cycle: Recent trends, questions, and potential solutions. Science 2008, 320, 889–892. [Google Scholar] [CrossRef]
- Chi, Y.; Shi, H.; Zheng, W.; Wang, E. Archipelagic landscape patterns and their ecological effects in multiple scales. Ocean Coast. Manag. 2018, 152, 120–134. [Google Scholar] [CrossRef]
- Mulder, V.L.; de Bruin, S.; Schaepman, M.E.; Mayr, T.R. The use of remote sensing in soil and terrain mapping—A review. Geoderma 2011, 162, 1–19. [Google Scholar] [CrossRef]
- Rasel, S.M.M.; Groen, T.A.; Hussin, Y.A.; Diti, I.J. Proxies for soil organic carbon derived from remote sensing. Int. J. Appl. Earth Obs. Geoinf. 2017, 59, 157–166. [Google Scholar] [CrossRef]
- Rossel, R.V.; Behrens, T. Using data mining to model and interpret soil diffuse reflectance spectra. Geoderma 2010, 158, 46–54. [Google Scholar] [CrossRef]
- Wang, S.; Adhikari, K.; Wang, Q.; Jin, X.; Li, H. Role of environmental variables in the spatial distribution of soil carbon (C), nitrogen (N), and C:N ratio from the northeastern coastal agroecosystems in China. Ecol. Indic. 2018, 84, 263–272. [Google Scholar] [CrossRef]
- Paul, S.S.; Coops, N.C.; Johnson, M.S.; Krzic, M.; Chandna, A.; Smukler, S.M. Mapping soil organic carbon and clay using remote sensing to predict soil workability for enhanced climate change adaptation. Geoderma 2020, 363, 114177. [Google Scholar] [CrossRef]
- Douaoui, A.E.K.; Nicolas, H.; Walter, C. Detecting salinity hazards within asemiarid context by means of combining soil and remote-sensing data. Geoderma 2006, 134, 217–230. [Google Scholar] [CrossRef]
- Sertel, E.; Gorji, T.; Tanik, A. Monitoring soil salinity via remote sensing technologyunder data scarce conditions: A case study from Turkey. Ecol. Indic. 2017, 74, 384–391. [Google Scholar]
- Hu, X.; Xu, H. A new remote sensing index for assessing the spatial heterogeneityin urban ecological quality: A case from Fuzhou City, China. Ecol. Indic. 2018, 89, 11–21. [Google Scholar] [CrossRef]
- Baig, M.H.A.; Zhang, L.; Tong, S.; Tong, Q. Derivation of a tasselled cap transformation based on Landsat 8 at-satellite reflectance. Remote Sens. Lett. 2014, 5, 423–431. [Google Scholar] [CrossRef]
- Huang, C.; Wylie, B.; Yang, L.; Homer, C.; Zylstra, G. Derivation of a tasselled cap transformation based on Landsat 7 at-satellite reflectance. Int. J. Remote Sens. 2002, 23, 1741–1748. [Google Scholar] [CrossRef]
- Aldabaa, A.A.A.; Weindorf, D.C.; Chakraborty, S.; Sharma, A.; Li, B. Combination of proximal and remote sensing methods for rapid soil salinity quantification. Geoderma 2015, 239–240, 34–46. [Google Scholar] [CrossRef]
- Vermeulen, D.; Niekerk, A.V. Machine learning performance for predicting soil salinity using different combinations of geomorphometric covariates. Geoderma 2017, 299, 1–12. [Google Scholar] [CrossRef]
- Chen, Q.; Zhu, J.; Lyu, H.; Pan, S.; Chen, S. Impacts of topography change on saltwater intrusion over the past decade in the Changjiang Estuary. Estuar. Coast. Shelf. Sci. 2019, 231, 106469. [Google Scholar] [CrossRef]
- Yang, C.; Wang, Y.; Jing, Y.; Li, J. The impact of land use on riparian soil dissolved organic matter and on streamwater quality on Chongming Island China. Reg. Environ. Change 2016, 16, 2399–2408. [Google Scholar] [CrossRef]
- Helmus, M.R.; Mahler, D.L.; Losos, J.B. Island biogeography of the Anthropocene. Nature 2014, 513, 543–546. [Google Scholar] [CrossRef] [PubMed]
- Zalidis, G. Management of river water for irrigation to mitigate soil salinization on a coastal wetland. J. Environ. Manag. 1998, 54, 161–167. [Google Scholar] [CrossRef]
- Zarroca, M.; Bach, J.; Linares, R.; Pellicer, X.M. Electrical methods (VES and ERT) for identifying, mapping and monitoring different saline domains in a coastal plain region (Alt Empordà, Northern Spain). J. Hydrol. 2011, 409, 407–422. [Google Scholar] [CrossRef]
- Wöppelmann, G.; Marcos, M. Coastal Sea level rise in southern Europe and the nonclimate contribution of vertical land motion. J. Geophys. Res. Oceans 2012, 117, 1–14. [Google Scholar] [CrossRef]
- Zovko, M.; Romić, D.; Colombo, C.; Di Iorio, E.; Romić, M.; Buttafuoco, G.; Castrignanò, A. A geostatistical Vis-NIR spectroscopy index to assess the incipient soil salinization in the Neretva River valley, Croatia. Geoderma 2018, 332, 60–72. [Google Scholar] [CrossRef]
- Chi, Y.; Sun, J.; Liu, W.; Wang, J.; Zhao, M. Mapping coastal wetland soil salinity in different seasons using an improved comprehensive land surface factor system. Ecol. Indic. 2019, 107, 105517. [Google Scholar] [CrossRef]
- Li, X.; Zhang, J.; Cao, J.; Ma, Y. Ecological risk assessment of exploitation and utilization in Chuanshan archipelago, Guangdong Province, China. Acta Ecol. Sin. 2015, 35, 2265–2276. [Google Scholar]
- Xie, Z.; Li, X.; Jiang, D.; Lin, S.; Yang, B.; Chen, S. Threshold of island anthropogenic disturbance based on ecological vulnerability assessment—A case study of Zhujiajian Island. Ocean Coast Manag. 2019, 167, 127–136. [Google Scholar] [CrossRef]
- Xu, Y.; Sun, X.; Tang, Q. Human activity intensity of land surface: Concept, method and application in China. J. Geogr. Sci. 2016, 26, 13491361. [Google Scholar] [CrossRef]
- Rillig, M.C.; Ryo, M.; Lehmann, A. Classifying human influences on terrestrial ecosystems. Global Change Biol. 2021, 27, 2273–2278. [Google Scholar] [CrossRef] [PubMed]
- Weigelt, P.; Jetz, W.; Kreft, H. Bioclimatic and physical characterization of the world’s islands. Proc. Natl. Acad. Sci. USA 2013, 110, 15307–15312. [Google Scholar] [CrossRef] [PubMed]
- Morgan, C.L.S.; Waiser, T.H.; Brown, D.J.; Hallmark, C.T. Simulated in situ characterization of soil organic and inorganic carbon with visible near-infrared diffuse reflectance spectroscopy. Geoderma 2009, 151, 249–256. [Google Scholar] [CrossRef]
- Chen, L.; Sun, R.; Liu, H. Eco-environmental effects of urban landscape pattern changes: Progresses, problems, and perspectives. Acta Ecol. Sin. 2013, 33, 1042–1050. [Google Scholar] [CrossRef]
- Ouyang, Z.; Wang, R.; Zhao, J. Ecosystem services and their economic valuation. Chin. J. Appl. Ecol. 1999, 10, 635–640. [Google Scholar]
- Brown, M.T.; Vivas, M.B. Landscape development intensity index. Environ. Monit. Assess. 2005, 101, 289–309. [Google Scholar] [CrossRef]
- Fan, J.; Zhou, K.; Wang, Y. Basic points and progress in technical methods of early-warning of the national resource and environmental carrying capacity (V 2016). Prog. Geogr. 2017, 36, 266–276. [Google Scholar]
- Shi, C.; Yao, S. Analysis on the theory of “Lucid Water and Lush Mountains are Invaluable Assets” based on ecological Marxism. For. Econ. 2018, 3, 7–10. [Google Scholar]
- Li, Y.; Dongye, G.; Li, X. Countermeasure on sustainable utilization of saline soil in Yellow River Delta. J. Soil Water Conserv. 2003, 7, 55–58. [Google Scholar]
- Chen, H.; Jia, B.; Lau, S.S.Y. Sustainable urban form for Chinese compact cities: Challenges of a rapid urbanized economy. Habitat Int. 2008, 32, 28–40. [Google Scholar] [CrossRef]
- Zhao, J.; Song, Y.; Tang, L.; Shi, L.; Shao, G. China’s cities need to grow in a more compact way. Environ. Sci. Technol. 2011, 45, 8607–8608. [Google Scholar] [CrossRef] [PubMed]
- Guo, Q.; Liu, M. Discussion of Planning and Operating of Chongming Qianwei Village’s Nongjiale tourism site. Phys. Procedia 2012, 24, 1649–1654. [Google Scholar] [CrossRef]
Publisher’s Note: MDPI stays neutral with regard to jurisdictional claims in published maps and institutional affiliations. |
© 2022 by the authors. Licensee MDPI, Basel, Switzerland. This article is an open access article distributed under the terms and conditions of the Creative Commons Attribution (CC BY) license (https://creativecommons.org/licenses/by/4.0/).