Article

Estimation of Aboveground Biomass of Potatoes Based on Characteristic Variables Extracted from UAV Hyperspectral Imagery

1
Key Laboratory of Quantitative Remote Sensing in Agriculture, Ministry of Agriculture and Rural Affairs, Information Technology Research Center, Beijing Academy of Agriculture and Forestry Sciences, Beijing 100097, China
2
Key Laboratory of Smart Agriculture System, Ministry of Education, China Agricultural University, Beijing 100083, China
3
Key Laboratory of Agricultural Information Acquisition Technology, Ministry of Agriculture and Rural Affairs, China Agricultural University, Beijing 100083, China
4
College of Agriculture, Nanjing Agricultural University, Nanjing 210095, China
5
College of Information and Management Science, Henan Agricultural University, Zhengzhou 450002, China
6
College of Geomatics, Shandong University of Science and Technology, Qingdao 266590, China
7
Institute of Crop Sciences, Chinese Academy of Agricultural Sciences/Key Laboratory of Crop Physiology and Ecology, Ministry of Agriculture, Beijing 100081, China
8
School of Computer and Information Technology, Beijing Jiaotong University, Beijing 100091, China
*
Author to whom correspondence should be addressed.
These authors contributed equally to this work.
Remote Sens. 2022, 14(20), 5121; https://doi.org/10.3390/rs14205121
Submission received: 6 September 2022 / Revised: 27 September 2022 / Accepted: 12 October 2022 / Published: 13 October 2022
(This article belongs to the Special Issue Recent Progress in UAV-AI Remote Sensing)

Abstract

:
Aboveground biomass (AGB) is an important indicator for crop-growth monitoring and yield prediction, and accurate monitoring of AGB is beneficial to agricultural fertilization management and optimization of planting patterns. Imaging spectrometer sensors mounted on unmanned aerial vehicle (UAV) remote-sensing platforms have become an important technical method for monitoring AGB because the method is convenient, rapidly collects data and provides image data with high spatial and spectral resolution. To confirm the feasibility of UAV hyperspectral remote-sensing technology to estimate AGB, this study acquired hyperspectral images and measured AGB data over the potato bud, tuber formation, tuber growth, and starch-storage periods. The canopy spectrum obtained in each growth period was smoothed by using the Savitzky–Golay filtering method, and the spectral-reflection feature parameters, spectral-location feature parameters, and vegetation indexes were extracted. First, a Pearson correlation analysis was performed between the three types of characteristic spectral parameters and AGB, and the spectral parameters that reached a significant level of 0.01 in each growth period were selected. Next, the spectral parameters reaching a significance of 0.01 were optimized and screened by moving window partial least squares (MWPLS), Monte Carlo uninformative variable elimination (MC-UVE), and random frog (RF) methods, and the final model parameters were determined according to the thresholds of the root mean square error of cross-validation (RMSEcv), the reliability index, and the selected probability. Finally, the three optimal characteristic spectral parameters and their combinations were used to estimate the potato AGB in each growth period by combining the partial least squares regression (PLSR) and Gaussian process regression (GPR) methods. The results show that, (i) ranked from high to low, vegetation indexes, spectral-location feature parameters, and spectral-reflection feature parameters in each growth period are correlated with the AGB, and these correlations all first improve and then degrade in going from the budding period to the starch-storage period. (ii) The AGB estimation model based on the characteristic variables screened by the three methods in each growth period is most accurate with RF, less so with MC-UVE, and least accurate with MWPLS. (iii) Estimating the AGB with the same variables combined with the PLSR method in each growth period is more accurate than the corresponding GPR method, but the estimations produced by the two methods both show a trend of first improving and then worsening from the budding period to the starch-accumulation period. The accuracy of the estimation models constructed by PLSR and GPR from high to low is based on comprehensive variables, vegetation indexes, spectral-location feature parameters and spectral-reflection feature parameters. (iv) When combined with the RF-PLSR method to estimate AGB in each growth period, the best R2 values are 0.65, 0.68, 0.72, and 0.67, the corresponding RMSE values are 167.76, 162.98, 160.77, and 169.24 kg/hm2, and the corresponding NRMSE values are 19.76%, 16.01%, 15.04%, and 16.84%. The results of this study show that a variety of characteristic spectral parameters may be extracted from UAV hyperspectral images, that the RF method may be used for optimizing and screening, and that PLSR regression provides accurate estimates of the potato AGB. The proposed approach thus provides a rapid, accurate, and nondestructive way to monitor the growth status of potatoes.

1. Introduction

Aboveground biomass (AGB) is an important agronomic parameter that characterizes the life activities of crops. It is closely related to the nutritional status and growth status of crops and is commonly used to monitor crop seedlings and evaluate farmland productivity [1,2,3]. Field management and yield prediction therefore rely on the rapid, non-destructive, and accurate determination of the temporal and spatial dynamics of AGB [4,5,6]. Traditionally, AGB is measured by a destructive sampling method that requires manual crop harvesting, weighing, and recording. This method is not only time-consuming, laborious, and destructive but is also limited to small areas due to the limited number of sampling points and monitoring range. It therefore does not suit the needs of quantitative monitoring of a large-scale crop AGB [7,8,9,10].
Because ground objects can reflect and absorb electromagnetic radiation, the spectral information of different crop canopies can be obtained by remote-sensing technology in a long-distance, high-throughput, and nondestructive manner. The application of mathematical analyses to interpret the spectral characteristics from multiple perspectives allows for nondestructive quantitative monitoring of crop physiological and biochemical indicators [11,12,13]. Currently, the main categories of sensor platforms for earth observation based on remote-sensing technology are ground, spaceborne, and airborne. Using ground sensors to obtain canopy spectral data in the field can sometimes damage crops. At the same time, it is challenging to monitor physical and chemical parameters in large areas for a long time due to physical constraints [14,15,16]. Although spaceborne remote-sensing technology can be used for nondestructive monitoring, it is expensive, imposes long transit periods, and yields images of coarse spatial resolution, which limits its application in precision agriculture [17,18,19]. Compared with other remote-sensing technologies, remote sensing from unmanned aerial vehicles (UAVs) has become an essential means to monitor crop growth due to its advantages of solid controllability, simple operation, economic suitability, and the ability to obtain high-resolution crop canopy orthophoto images under clouds [20,21,22].
At present, UAV platforms are typically equipped with digital, multispectral, and hyperspectral sensors to obtain spectral information on crop canopies and thereby monitor crop growth [23]. UAV hyperspectral remote sensing offers continuous narrow-band spectral information on the crop canopy, which allows the hidden details of the crop canopy spectrum to be mined [24,25]. Seeking the characteristic spectrum establishes the AGB monitoring model, which can effectively evaluate crop growth and predict yield [26]. In addition, UAV hyperspectral remote sensing also provides orthophotos of fields, which facilitates the mapping and display of AGB spatial variations [27]. Therefore, UAV hyperspectral remote-sensing technology with simultaneous acquisition of image and spectral information is vital for the accurate monitoring of crop AGB and to support real-time field management strategies [28,29].
Currently, the methods to estimate AGB from spectral information obtained by hyperspectral sensors fall into three main categories: (i) those based on spectral-reflectance features, (ii) those based on spectral-location features, and (iii) those based on vegetation indexes. The original canopy spectrum characterizes the ability of the crop canopy to radiate energy, which is related to variations in AGB content, so it can be directly used to estimate AGB. For example, Wang et al. [30], Jia et al. [31], and Kong et al. [32] used the successive projection algorithm to screen the characteristic wavelengths of the original crop canopy spectrum and combined different regression methods to estimate the AGB of winter wheat. Spectral-location features reflect the absorption and reflection of biochemical components in crops, and these feature locations contain rich crop-growth information that can be extracted to monitor crop AGB. For example, Tao et al. [33], Fu et al. [34], and Gnyp et al. [35] analyzed the position of the red edge and found that the red-edge parameters correlate strongly with wheat AGB, which means that the position of spectral features can be used to estimate AGB. The vegetation index enhances vegetation information and is usually composed of two or more spectral bands in a specific mathematical way to reduce or eliminate the effect of background noise on the crop canopy spectral information. For example, Jin et al. [36] found that the enhanced vegetation index and the three-band water index can be used to estimate maize AGB. Hansen et al. [37] showed that band combinations of the normalized vegetation index within the central wavelength band 680–750 nm correlate strongly with maize AGB and that an accurate estimation could be achieved by using the partial least squares regression (PLSR) method. Finally, Liu et al. [38] used the chlorophyll content index to estimate rice AGB.
Although these studies show how to effectively monitor AGB using different spectral features, most of them use only one type of spectral variable as an input parameter for their model. No studies have compared the performance of different forms of spectral parameters for estimating AGB. We do not yet know which spectral information is beneficial for potato AGB estimation and what is the accuracy of the model constructed. As a result, they fail to comprehensively evaluate how multiple types of spectral variables affect AGB estimation results, which may prevent hyperspectral information from being fully utilized, thus restricting the accuracy of estimation models. In addition, due to the high information redundancy between adjacent bands of hyperspectral data, most studies estimate AGB by directly inputting spectral characteristic variables into the model without optimizing the model’s input data, which reduces the predictive power and robustness of the model. Although research has shown that the use of UAV hyperspectral data can lead to reasonable estimates of the AGB of winter wheat, corn, rice, and other crops, the morphological structure of potato plants differs significantly from those crops, and the crop nutrient absorption, transportation, and transfer also differ considerably. Therefore, to determine which spectral information is most beneficial for potato AGB estimation and to validate whether methods used for AGB estimation in other crops are applicable to potato crops, we evaluated the performance of various spectral variables to estimate AGB in potato multiple growth stages. Briefly, the main objective of this study was to determine the best spectral information and estimation method for estimating potato AGB.
In order to obtain the best spectral information for estimating potato AGB, this study used moving window partial least squares (MWPLS), Monte Carlo uninformative-variable elimination (MC-UVE), and random leapfrog (RF) to optimize spectral-reflection features, spectral-location features, vegetation indexes, and their combinations. Finally, model parameters with low redundancy were selected to establish AGB estimation models combined with PLSR and Gaussian process regression (GPR). We selected the optimal estimation model and regression technique. The resulting model provides rapid and nondestructive monitoring of potato-crop growth.

2. Materials and Methods

2.1. Experimental Design

The potato cultivation experiment took place at the Xiao Tangshan National Precision Agriculture Research Center (40°10′N, 116°26′E), Changping District, Beijing, China. In the field, we planted two precocious potato varieties (Zhongshu 5, (Z5) and Zhongshu 3, (Z3)) with different planting densities (P plots), nitrogen treatments (N plots), and potassium fertilizer treatments (K plots). The experimental area contained 48 plots and each plot covered 32.5 m2. Please see Ref. [39] for the specific experimental design. To accurately correct UAV hyperspectral images, the three-dimensional information of eleven ground control points was obtained by using the differential global positioning system. The specific plan of this study is shown in Figure 1.

2.2. Ground-Data Collection and Processing

AGB data were collected during four potato-growth periods including the budding period (13 May 2019), the tuber-formation period (28 May 2019), the tuber growth period (10 June 2019), and the starch-accumulation period (20 June 2019). To obtain the ground-truth AGB data, three plants representative of the overall growth level were randomly selected from each plot. After random field sampling, we quickly took it back to the laboratory. We used an oven to dry the samples to a constant mass before weighing. For each growth period, the plant density and dry mass of the stems and leaves of each plant sample as measured by a high-precision balance were used to calculate the potato AGB of each plot (in kg/hm2). The specific steps of collection are available in the literature [39].

2.3. UAV Hyperspectral Data Acquisition and Processing

A six-rotor electric UAV (SZ DJI Technology Co., Ltd., Shenzhen, Guangdong, China) was used as the ultralow-altitude remote-sensing platform. The UAV was equipped with a GPS module to record the attitude and spatial position during image shooting and two 1800 mAH batteries (25 V, which can maintain autonomous flight for 25 min on the specified route). The UAV had a maximum takeoff mass of 6 kg and a flight speed of about 8 m/s. The UAV platform carried a UHD 185 firefly imaging spectrometer, referred to as “UHD 185” for short. The flying height of the UAV is 20 m, and the obtained image resolution is 1.3 cm. Before each operation of the UAV, black and white panel data were collected on the ground using UHD185 for radiometric calibration.
UAV hyperspectral image processing includes two main parts:
(i)
Image mosaic and terrain correction. First, with the help of the Agisoft Photoscan software, which is based on a motion structure algorithm, image mosaic and terrain correction were carried out in combination with the position of ground control points (the correction error of each growth period is less than 2 cm). Second, hyperspectral and grayscale images were fused by using the Cubert Cube-Pilot software to form new hyperspectral digital orthophotos [40].
(ii)
Extraction of canopy spectral reflectance. According to the ratio method, the digital number value of the hyperspectral image is converted into the surface reflectance based on the black and white panel data collected on the ground. To eliminate the boundary effect, ArcGIS 10.2 software was used to draw the maximum region of interest (a total of 48 plots) for each plot. Based on ENVI 5.3 software, the average spectral reflectance of all pixels in each region of interest was calculated, and the average spectrum obtained served as the spectral reflectance of the potato canopy for each experimental plot [41].

2.4. Selection of Model Parameters

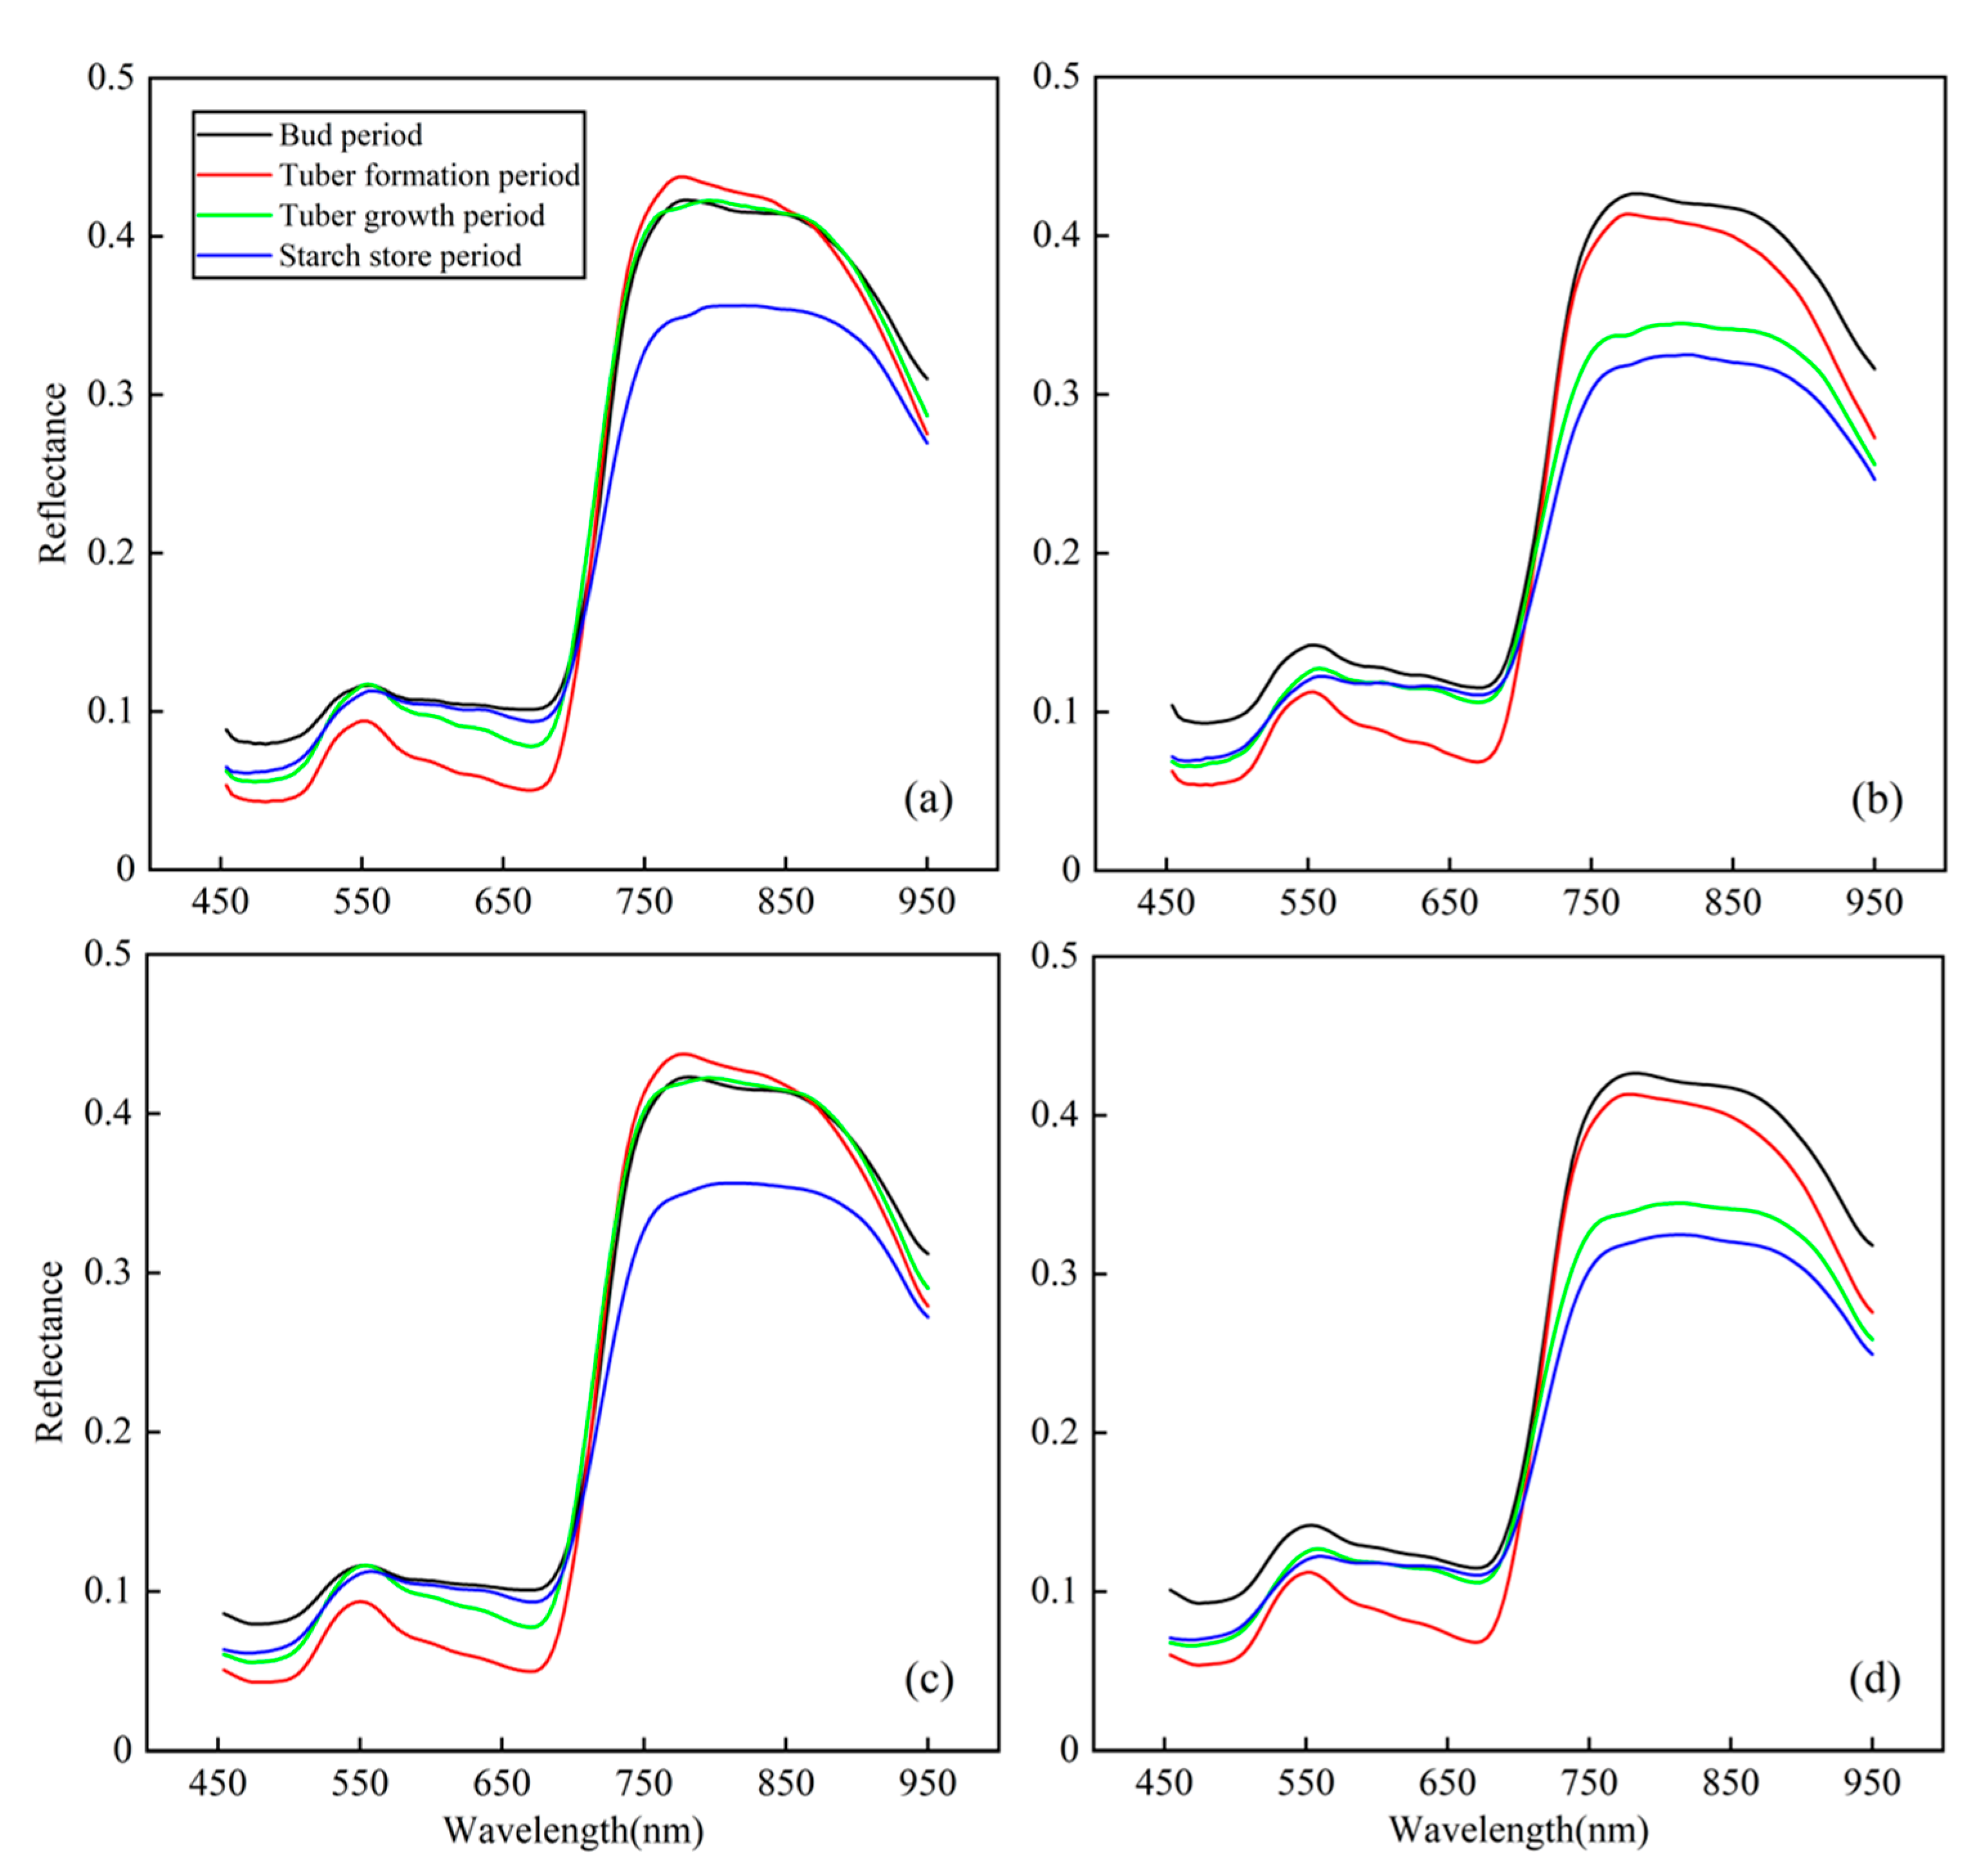
Due to the sensitivity of the imaging spectrometer itself and to the interference of the external environment, the acquired crop canopy spectrum is easily affected by noise in the process of image acquisition. To improve the signal-to-noise ratio of the spectral data and further improve the accuracy of AGB estimates, the spectral data must be smoothed. The Savitzky–Golay (SG) filtering method was proposed by Savitzky and Golay in 1964 and is a low-pass filtering method that smooths time-series data by applying a local polynomial regression model. Its biggest advantage is to remove noise while maintaining the shape and width of the signal [42]. The SG filter used in this study has a width of 5, a smoothing order of 0, and a smoothing degree of 2. Figure 2 shows the canopy spectral-reflectance features of potatoes (Z5 and Z3) before and after SG filtering at each growth stage. Comparative analysis showed that the canopy spectral curve retained the original shape and became smoother after SG filtering. Before constructing the AGB estimation model for each growth period, the spectral-reflectance features, spectral-position features, and vegetation indexes were extracted from the canopy spectral data after SG filtering.

2.4.1. Extraction of Spectral-Reflection Features

The characteristic spectral-reflectance parameters extracted in this study include mainly canopy original reflectance spectra (CRS) and first-order differential spectra (FDS). CRS is the most direct expression of the response of the internal cell structure of the plant leaf to the incident optical spectrum. The depth analysis of the changes in spectral reflection and absorption characteristics in the visible and near-infrared bands provides the basis for the establishment of the AGB estimation model. FDS represents the change of reflectance, that is, the slope of wavelength, which can remove the influence of partial linear background noise on the spectral information of crop canopy, refine the differences between spectra, and enhance the spectral sensitivity. The UHD 185 sensor covers numerous bands, which is suitable for first-order differential processing. The FDS formula is
FDS λ ( i ) = R λ ( i 1 ) R λ ( i + 1 ) 8
where FDS λ ( i ) is the first-order differential spectral reflectance at a central wavelength i between waveband i 1 and i + 1 . R λ ( i 1 ) and R λ ( i + 1 ) are the reflectances in the waveband i 1 and i + 1 , respectively.

2.4.2. Extraction of Spectral-Position Features

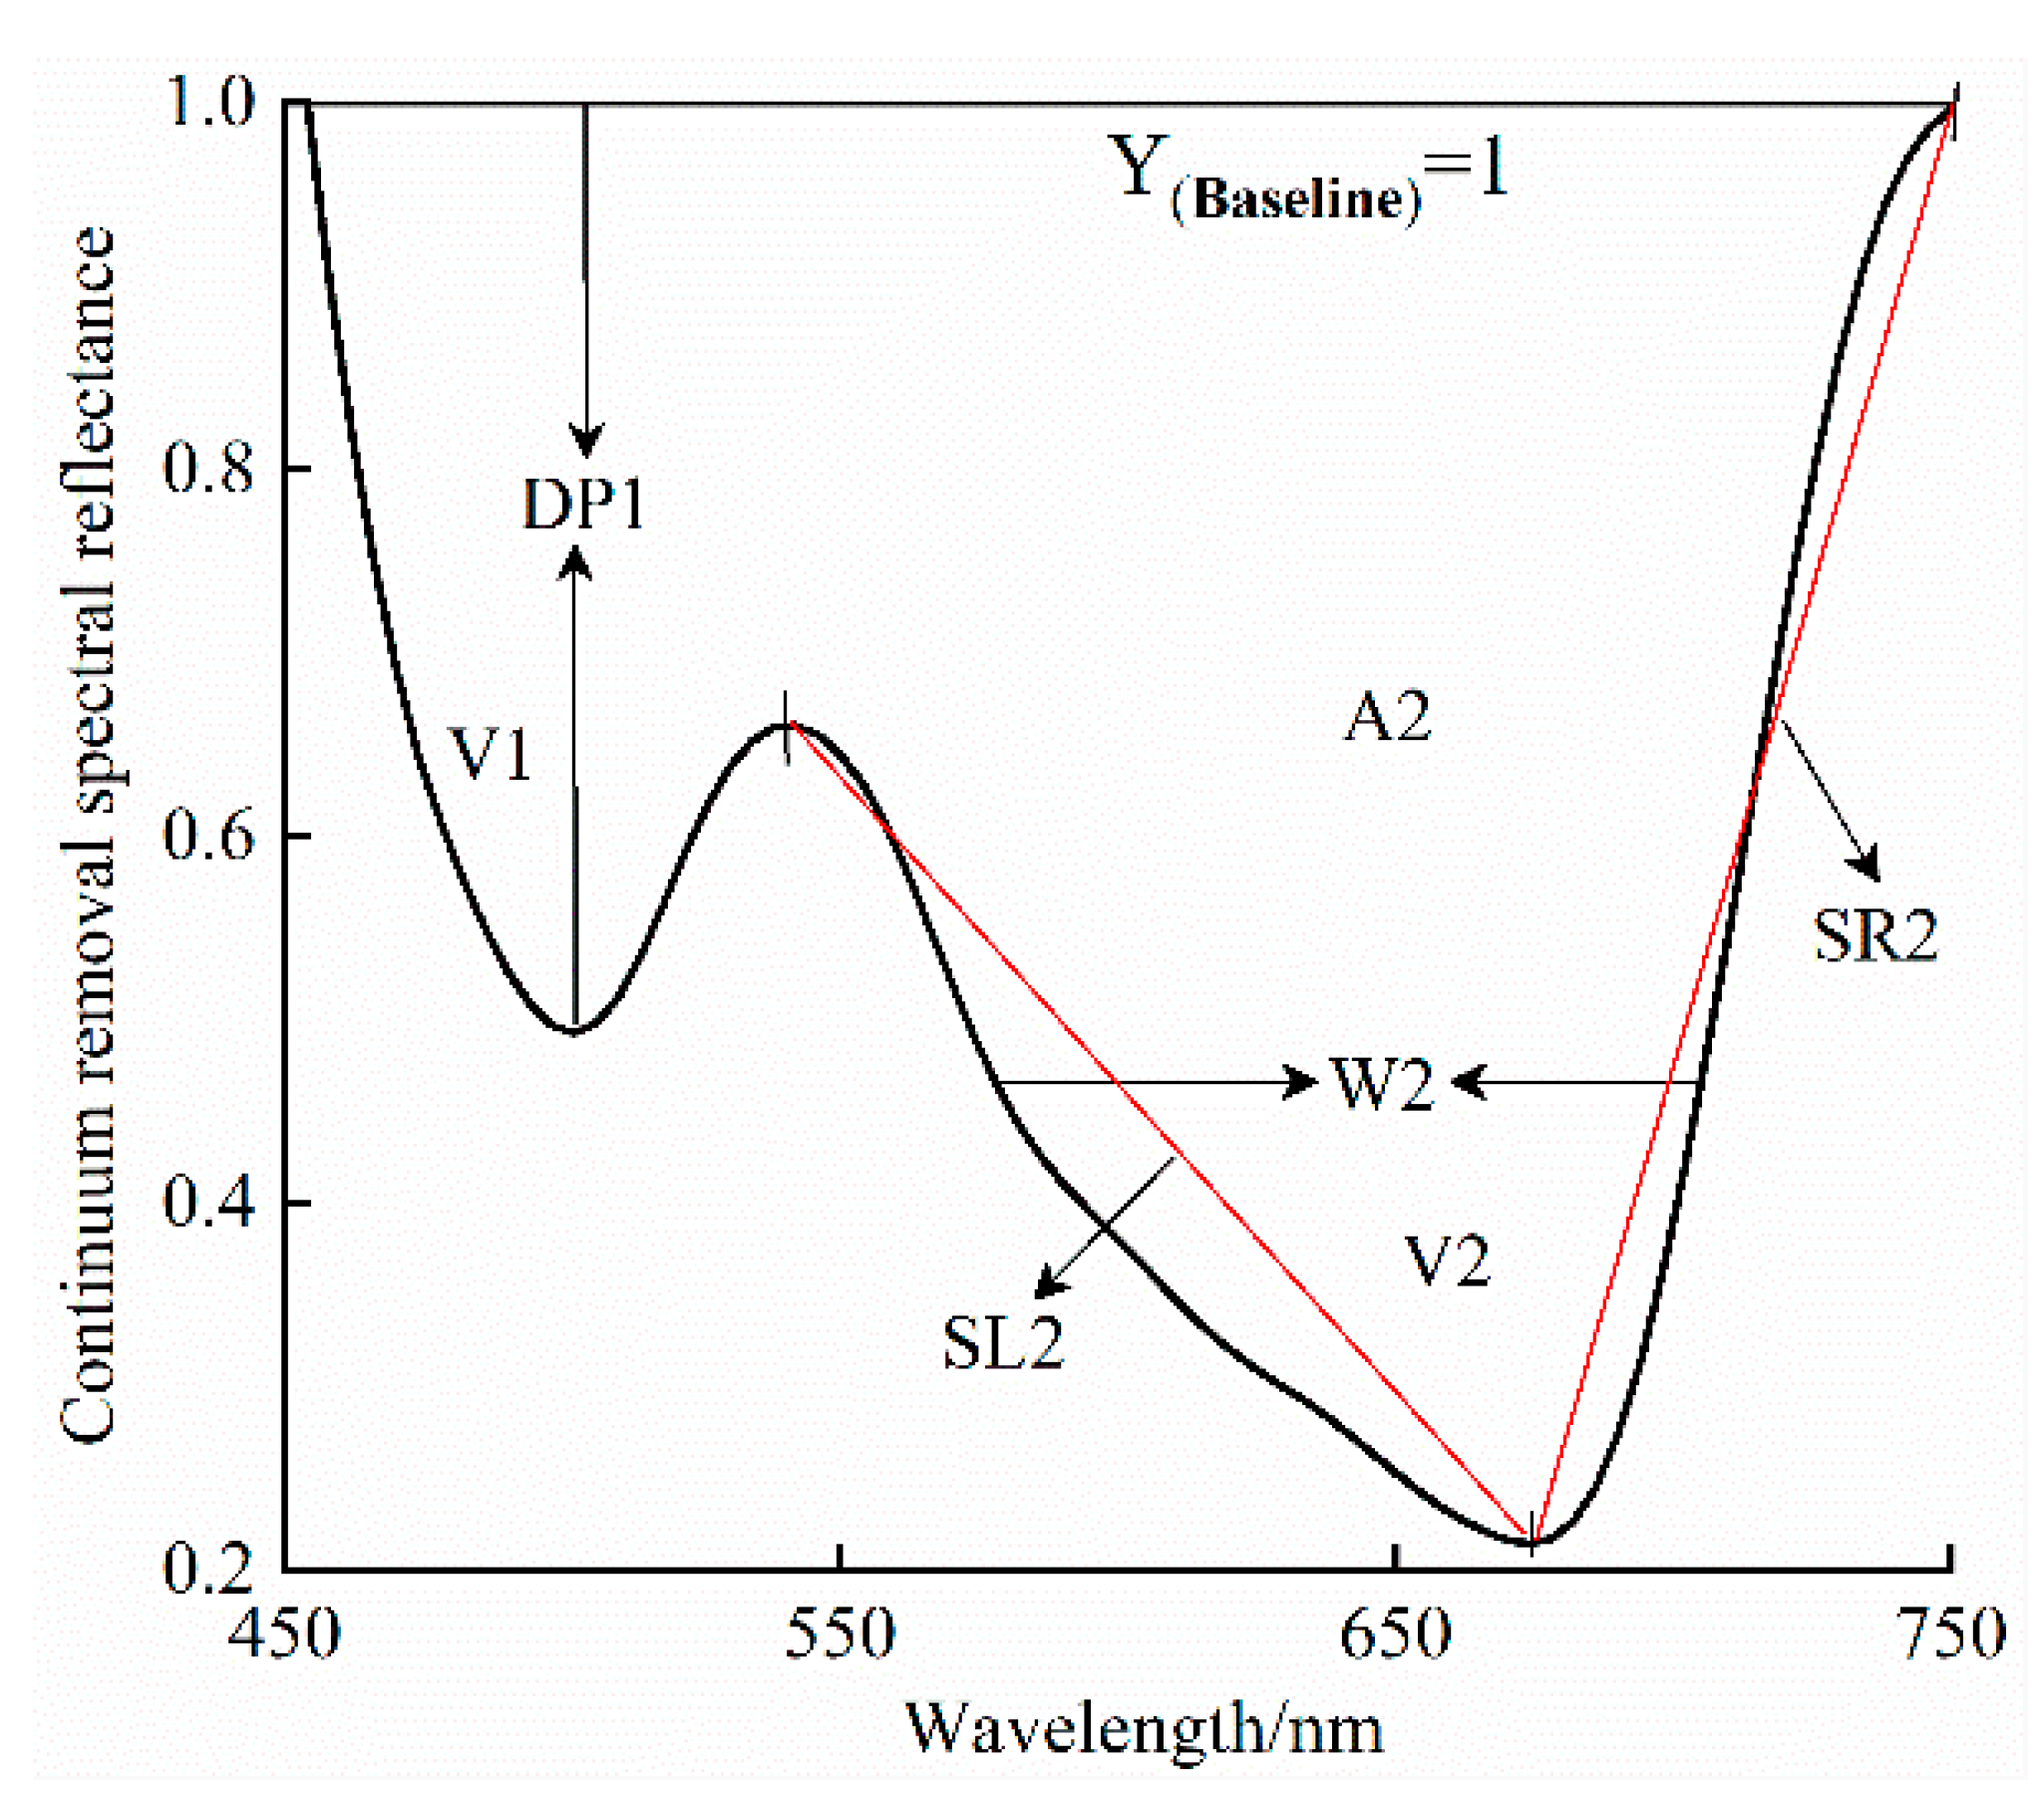
De-enveloping line processing, also known as the continuous removal method, is a processing method that normalizes the canopy spectral data to unity so that the spectral data have the same background, retain most of the information, and effectively highlight the difference between the spectral information and the variation in AGB, which produces accurate AGB estimates [43,44,45]. The potato canopy spectral data range obtained by the UHD185 sensor ranges from 454 to 950 nm, but as of 750 nm, the shape of the absorption valley of the potato canopy de-envelope spectrum is slightly smaller, and the difference between the spectra does not suffice to express the AGB variations. Therefore, in this study, only the absorption valley between 454 and 750 nm is studied in-depth. As shown in Figure 3, after the spectral data for this study are processed by applying the continuous removal method, the characteristic parameters of the two absorption valleys (V1 and V2) are extracted and mainly include the absorption valley depth (DP1 and DP2), the absorption valley area (A1 and A2), the absorption valley width (W1 and W2), the absorption valley left slope (SL1 and SL2), and the absorption valley right slope (SR1 and SR2). See Table 1 for details.
At 502–554, 490–530, 562–638, 682–758, 650–690, and 510–558 nm, the absorption of chlorophyll varies with the scattering degree of leaves and canopy in different directions, defining the green edge, blue edge, yellow edge, red edge, red valley, and green peak positions, respectively. These bands contain a large amount of sensitive crop canopy spectral information. The features extracted by the first-order differential spectrum are collectively referred to as “four sides, one valley, and one peak” parameters and reflect the growth status of potatoes in different periods. Therefore, the variations in potato AGB in different growth periods can be explored by studying the typical spectral position of characteristic parameters. This study extracts three types of parameters from the “four sides, one valley, and one peak” group: amplitude, position, and area [46].

2.4.3. Selection of Vegetation Indexes

Previous studies confirm that the vegetation index is closely related to physiological and biochemical parameters of crops, so it is often used to monitor crop growth. Therefore, we selected 20 commonly used vegetation indexes to estimate potato AGB. The specific names and mathematical expressions are listed in Table 2.

2.5. Analysis Method

This study selects three spectral feature screening methods: MWPLS, MC-UVE, and RF. MWPLS is based on interval partial least squares. The moving window technology is used to scan all wavebands, move one wavelength point backward each time with a specific window width, establish a partial least squares model, and repeat the operations many times. The root mean square error of cross-validation (RMSEcv) is used as the evaluation standard for wavelength screening intervals. This method avoids information redundancy [47]. MC-UVE is a widely used and effective band-selection method in the field of chemometrics. By randomly selecting the spectral variable matrix as noise, adding it to the original matrix, and then establishing the partial least squares model by the cross-validation method to eliminate one by one, the regression coefficient matrix is obtained, and the stability or reliability of the quotient of the mean and standard deviation of the regression coefficient is analyzed. Finally, the threshold is determined based on the importance of the noise variables, and the variables with importance below this threshold are deleted to obtain the optimal model variables [48]. The RF algorithm is a heuristic swarm evolution algorithm that computes efficiently and offers excellent global search capability, similar to the reversible jump Markov chain Monte Carlo algorithm, which calculates the selected probability of each variable by simulating a Markov chain obeying the steady-state distribution in the model space to evaluate the importance of the variable [49].
PLSR and GPR are used to build a model to estimate AGB. PLSR is a combination of multiple linear regression and principal component analysis. It provides a many-to-many regression model by fully considering the multicollinearity between independent variables. Especially when the number of independent variables is large and there is a certain autocorrelation, and the number of dependent variables is small, the model constructed by PLSR is more accurate than the traditional regression analysis and allows predictions to be made from a small number of factors [50]. Gaussian process regression is a nonparametric probabilistic statistical model that learns the relationship between independent variables (e.g., spectral features) and dependent variables (e.g., AGB) based on the Bayesian theorem and uses mean and covariance functions to train samples according to the maximum likelihood estimation method. Compared with conventional machine learning, parameter optimization is simpler and more suitable for training small-sample data. At the same time, the prediction and its related confidence interval are provided, which allows the reliability of the prediction results to be evaluated [51]. The characteristic variable selection and model construction for this study were carried out using MATLAB 2020b software.

2.6. Accuracy Evaluation

To estimate the AGB, this study selects the repeat 2 and repeat 3 data (32 groups total) as the calibration set, and the repeat 1 data (16 groups total) as the validation set to check the reliability and stability of the model. The coefficient of determination (R2), root mean square error (RMSE), and normalized root mean square error (NRMSE) are used to evaluate the model accuracy.

3. Results and Analysis

3.1. Estimation of AGB Using Spectral-Reflectance Features

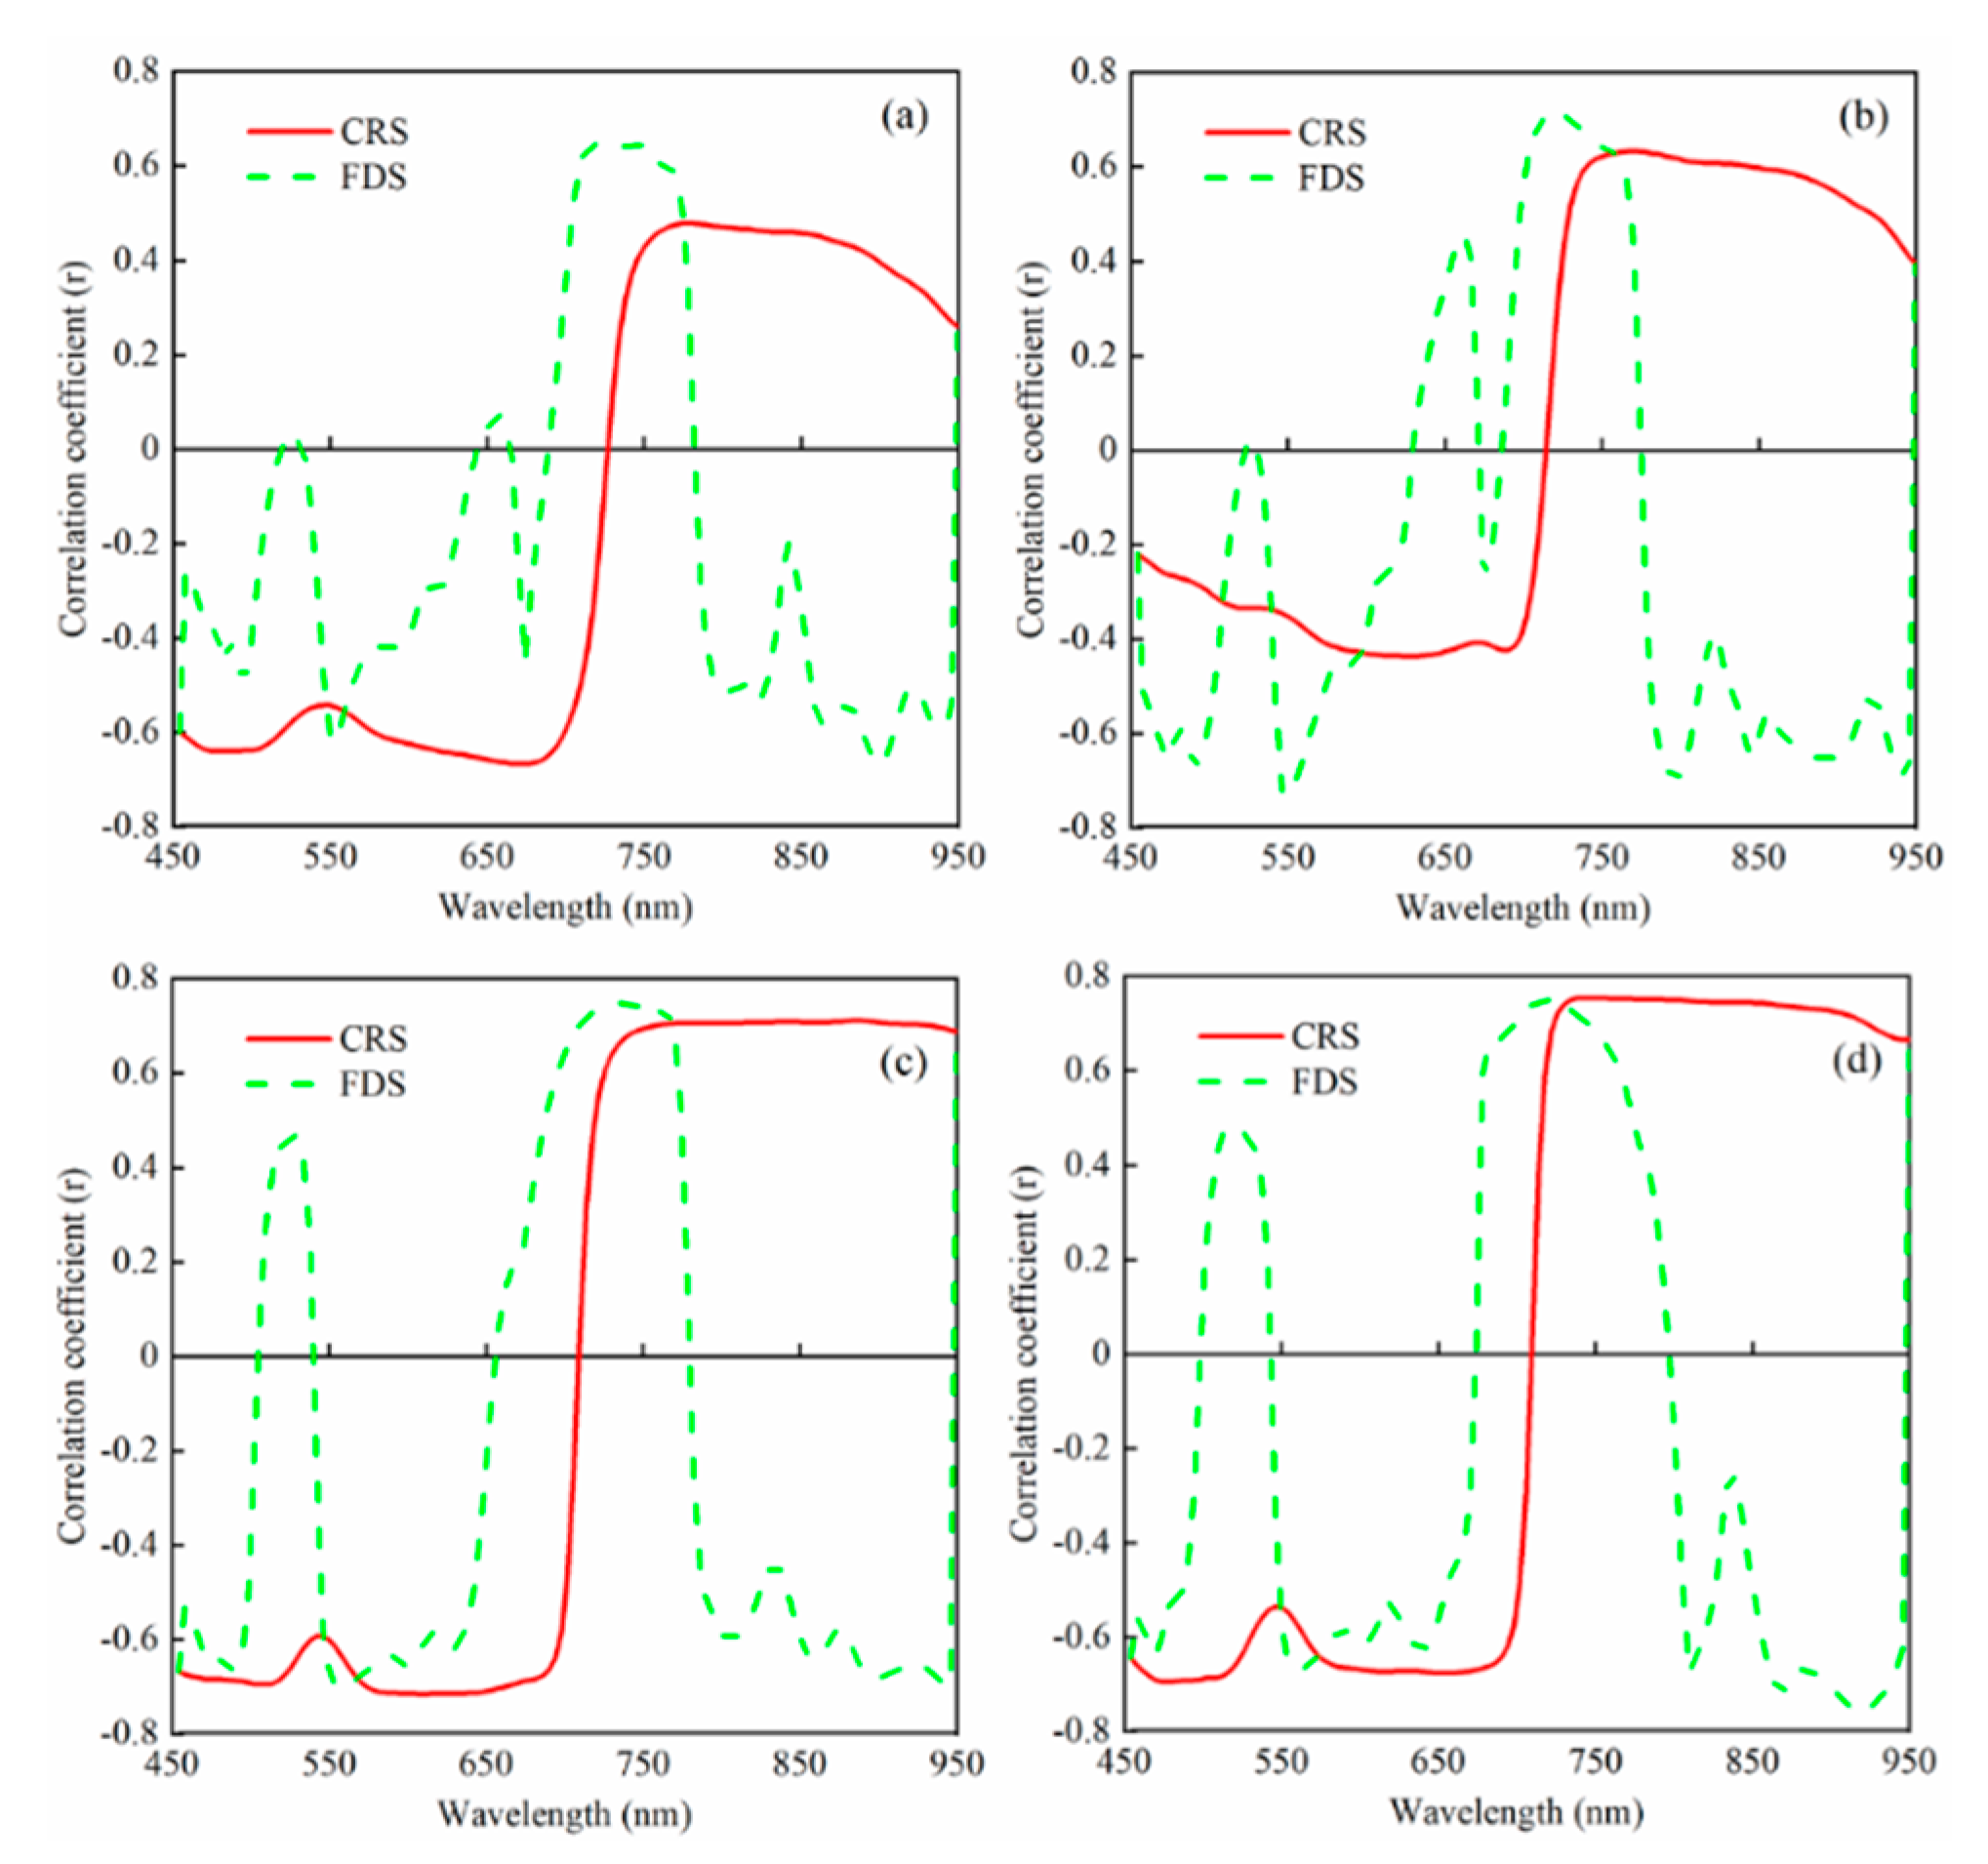
Figure 4 shows the correlation coefficient changes of CRS and FDS with AGB at different potato-growth periods. Figure 4a–d shows that the correlation coefficients for CRS, FDS, and AGB in each growth period differ significantly. Overall, the correlation of the two reflection spectra increases from the budding period to the tuber growth period but decreases slightly in the starch-accumulation period. There are also significant differences in the wavelength range where CRS, FDS, and AGB reach a very significant correlation level. At the budding period, CRS correlates significantly with AGB at 454–714 and 742–914 nm, whereas the wavelength range where FDS correlates significantly with AGB is scattered and mainly spread over five ranges: 470–498, 546–602, 702–774, 790–834, and 854–946 nm. During the tuber-formation period, the number of wavelengths in the bands 554–698 and 726–950 nm with a significant correlation between CRS and AGB increases, and the correlation coefficient also increases somewhat. Similarly, the number of wavelength bands (454–506, 542–598, 654–666, 698–950 nm) with significant correlation between FDS and AGB increases, and the correlation coefficient increases. During the tuber-growth period, the correlation between CRS, FDS, and AGB is the highest over all the growth periods, and the wavelength ranges with extremely significant correlations are 454–702, 718–950 nm, and 454–498, 514–534, 546–646, 682–774, and 786–950 nm, respectively. During the starch-accumulation period, the correlation between CRS, FDS and AGB is slightly less than in the previous period. The wavelength ranges that produced an extremely significant correlation were 454–702, 714–950 nm and 454–490, 510–534, 550–666, 678–786, 806–830, and 846–950, respectively.
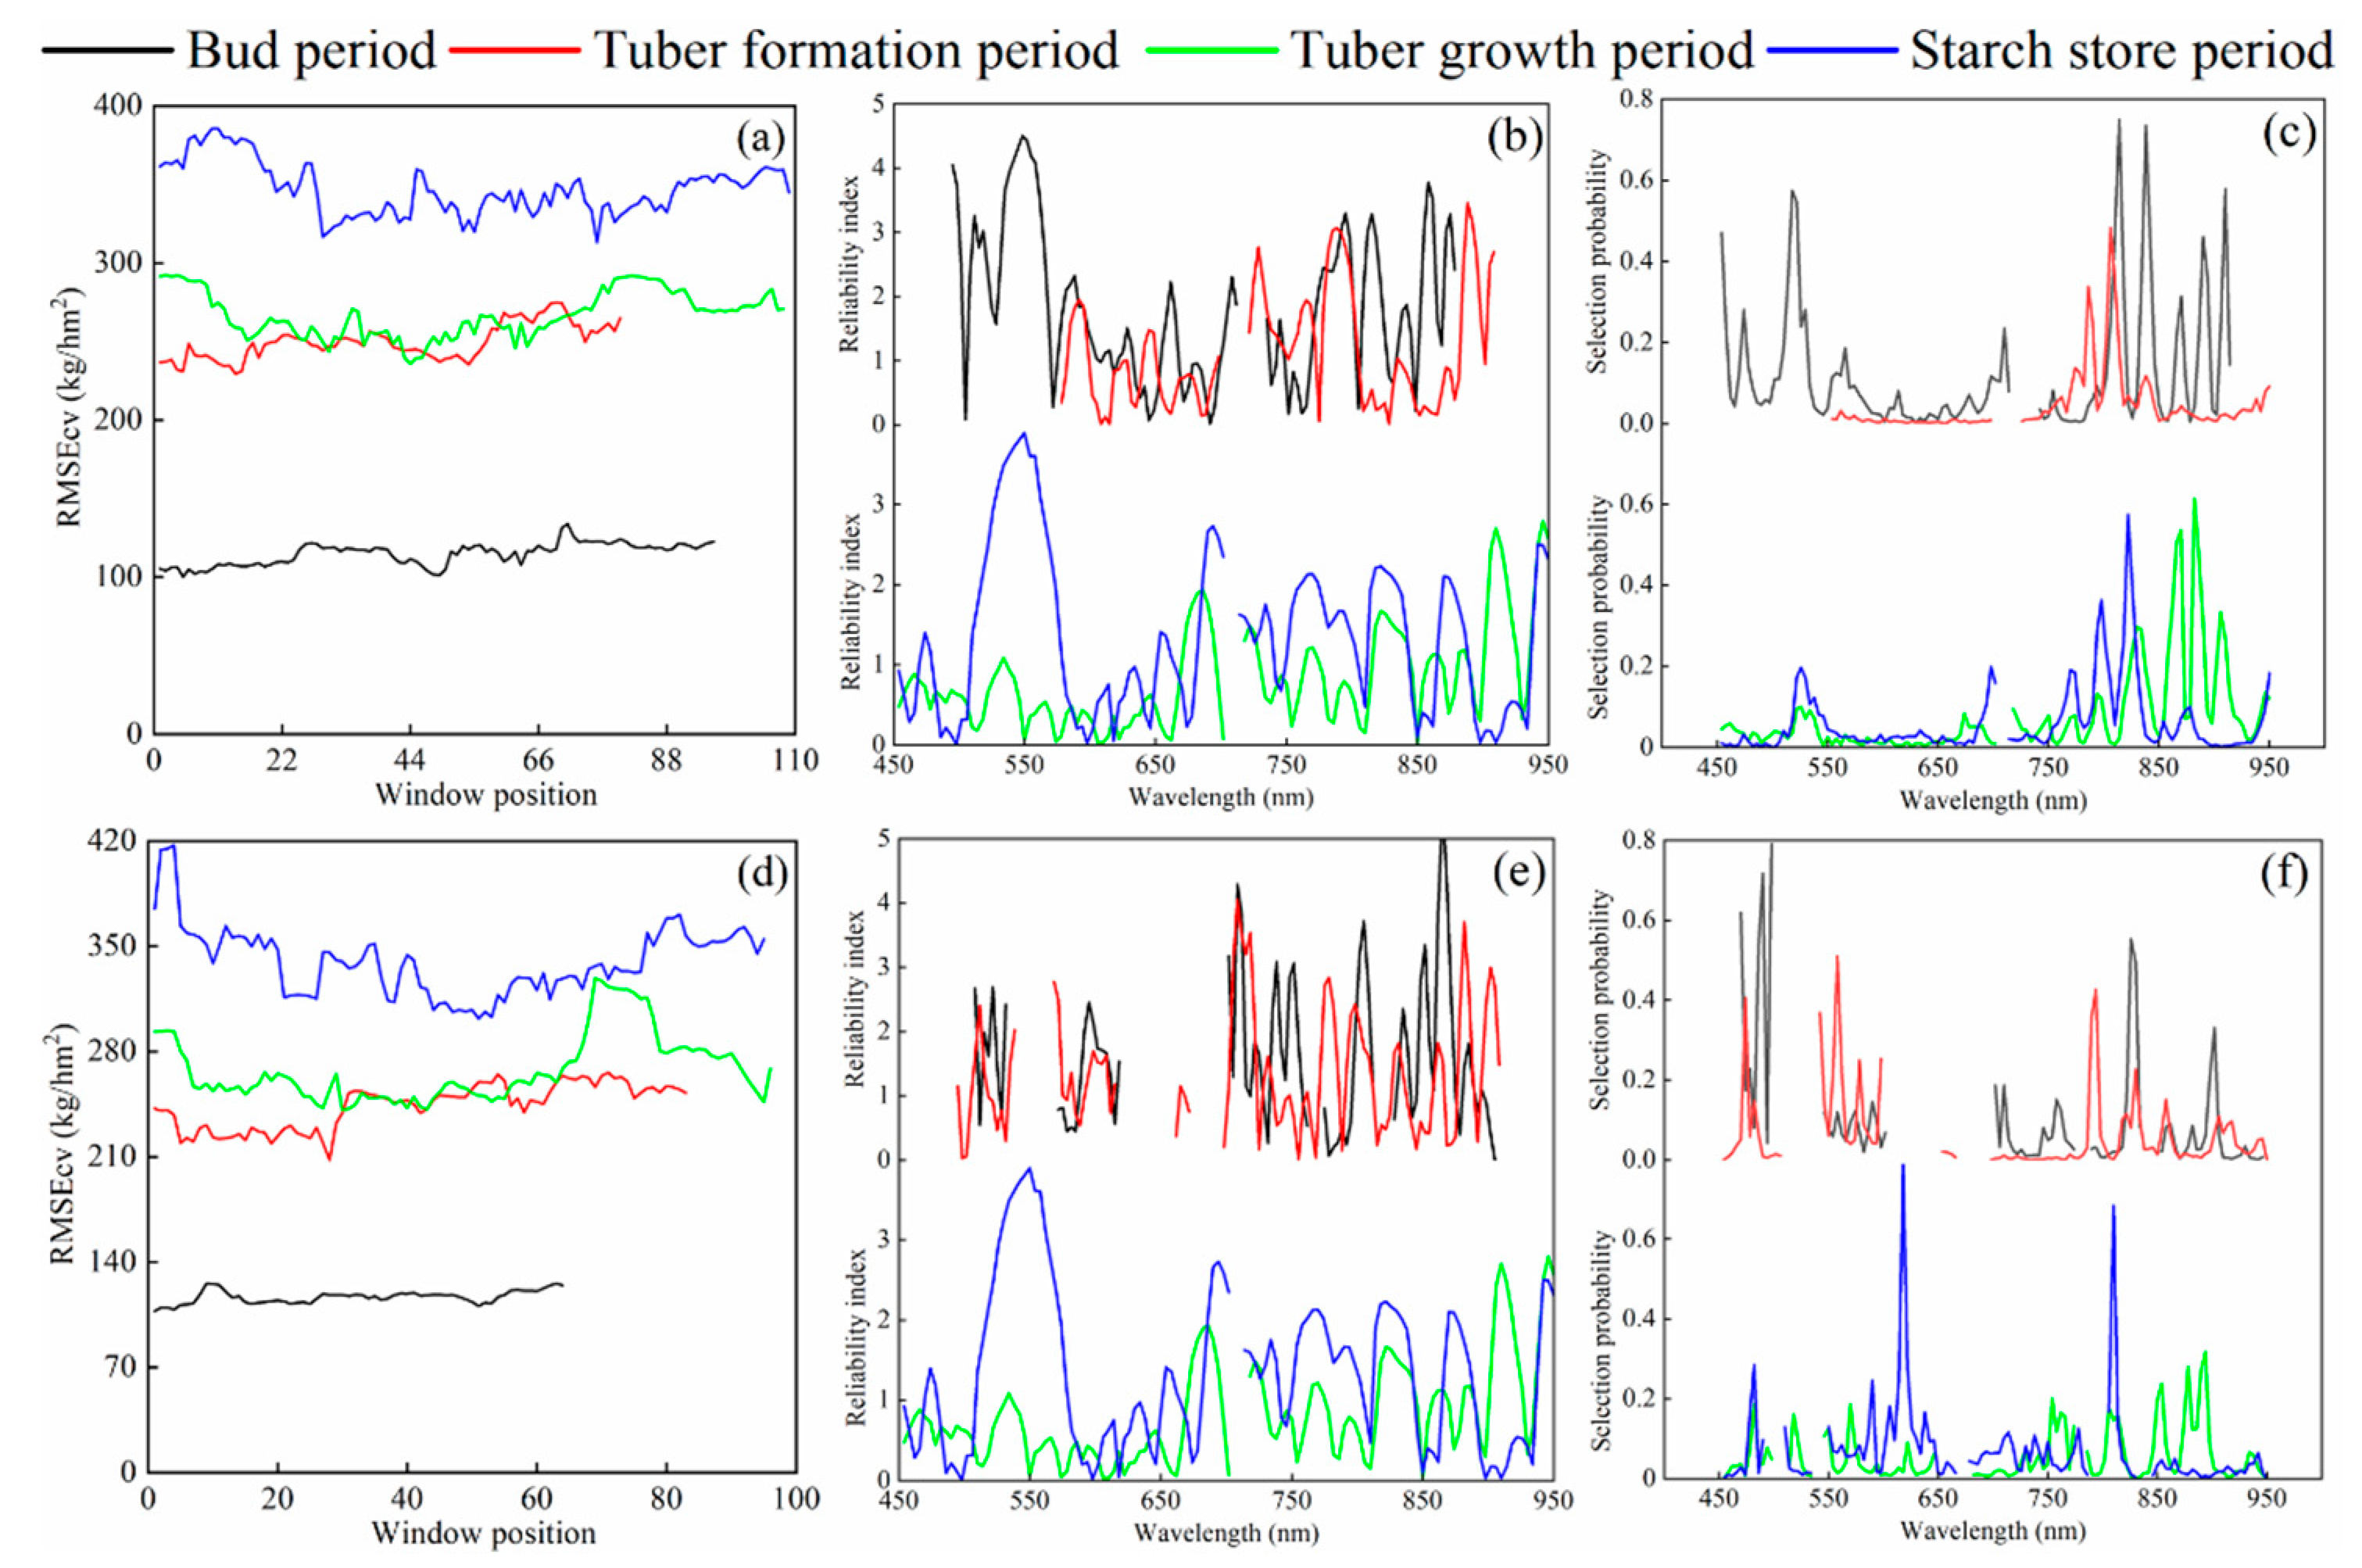
MWPLS, MC-UVE, and RF methods were used to screen the spectral-reflectance features of CRS and FDS that reached a very significant correlation in each potato-growth period. Figure 5 shows the variations in RMSEcv, reliability index, and selected probability obtained by using different wavelength-screening methods in each growth period. If the RMSEcv of the partial least squares model established in the selected wavelength interval is lower or the reliability index and the selected probability of a single wavelength are higher, it is more likely to become the parameter of the AGB estimation model. The combined results of many tests indicate that the threshold for extracting spectral features by using three sensitive wavelength screening methods at each potato-growth period was finally determined. The budding period based on CRS and FDS is 105 kg/hm2, 3.0, 0.2 and 113 kg/hm2, 2.0, 0.1, respectively. The tuber-formation period based on CRS and FDS is 240 kg/hm2, 1.8, 0.1 and 225 kg/hm2, 2.0, 0.1, respectively. The tuber-growth period based on CRS and FDS is 250 kg/hm2, 1.0, 0.1 and 250 kg/hm2, 1.8, 0.1, respectively. Finally, the starch-accumulation period based on CRS and FDS gives 320 kg/hm2, 1.0, 0.1.
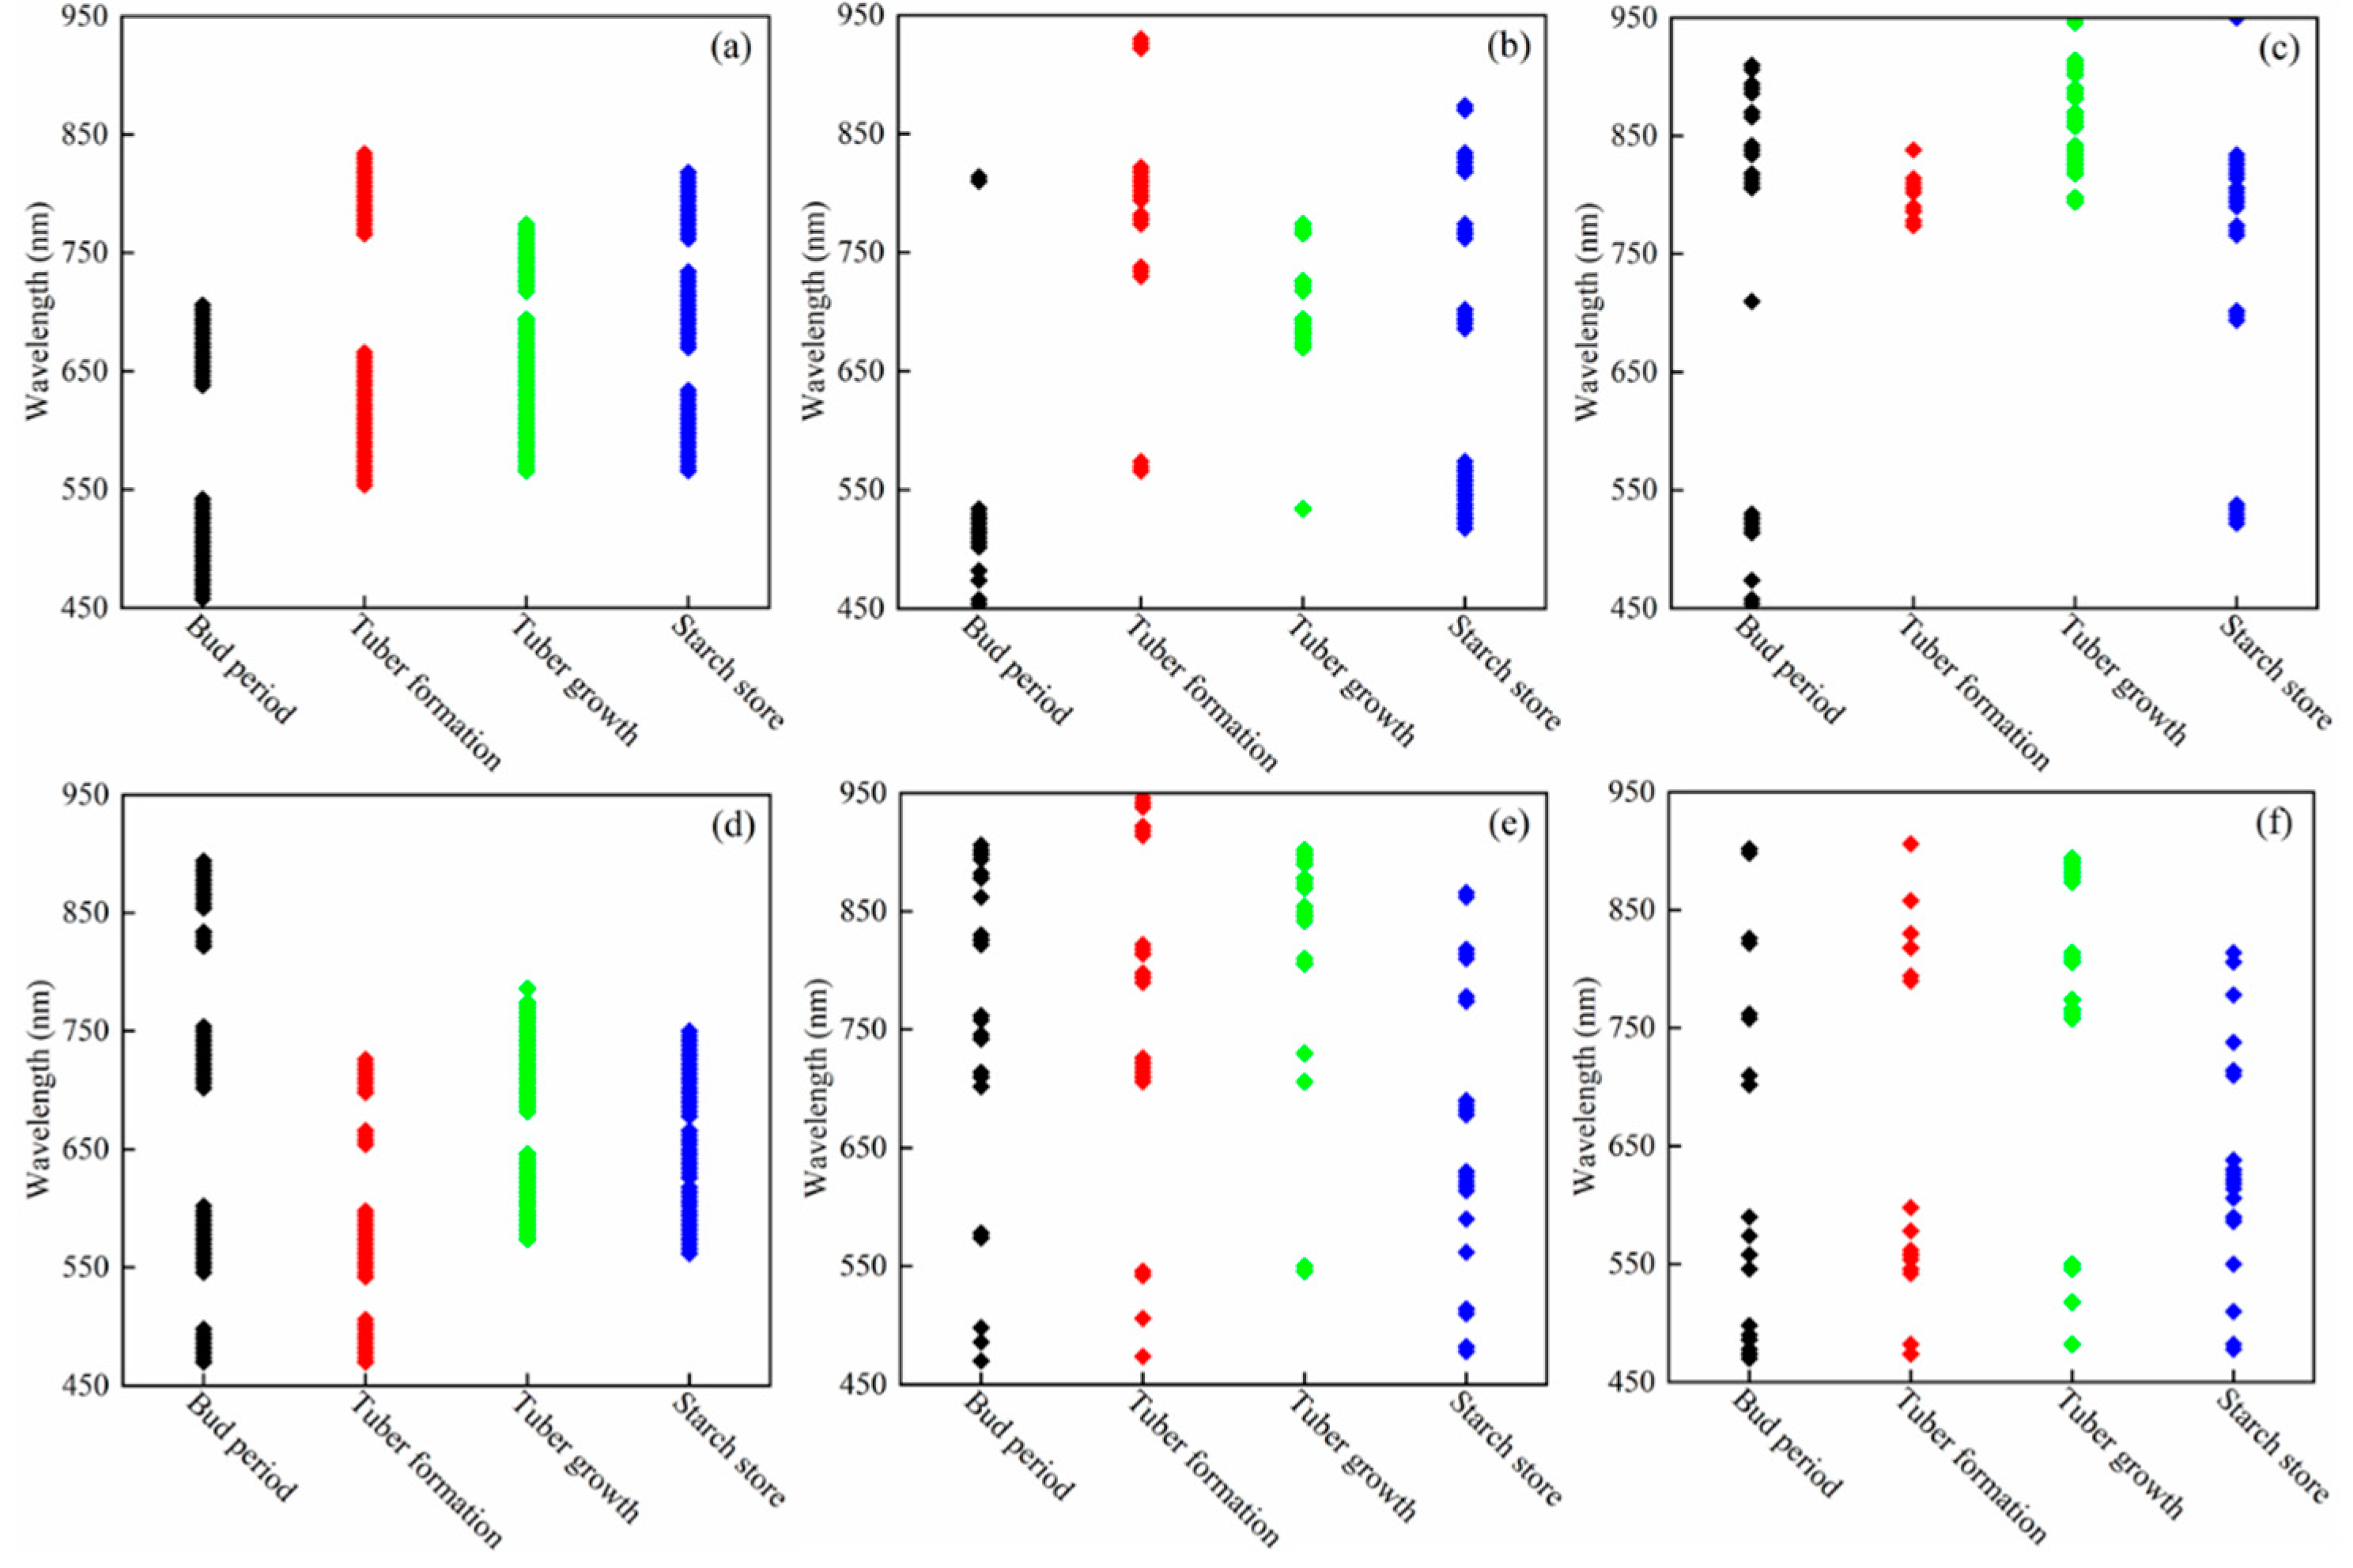
According to the threshold results set in Figure 4, the characteristic wavelengths extracted by MWPLS, MC-UVE, and RF methods based on CRS and FDS at each potato-growth period are shown in Figure 6. From the results of the distribution map, the specific number of characteristic wavelengths obtained by different methods based on the two spectral variables in each growth period is different, but the overall position is roughly the same, mainly located in “four sides, one valley and one peak”, which confirms the importance of the special spectral position to the estimation of potato AGB.
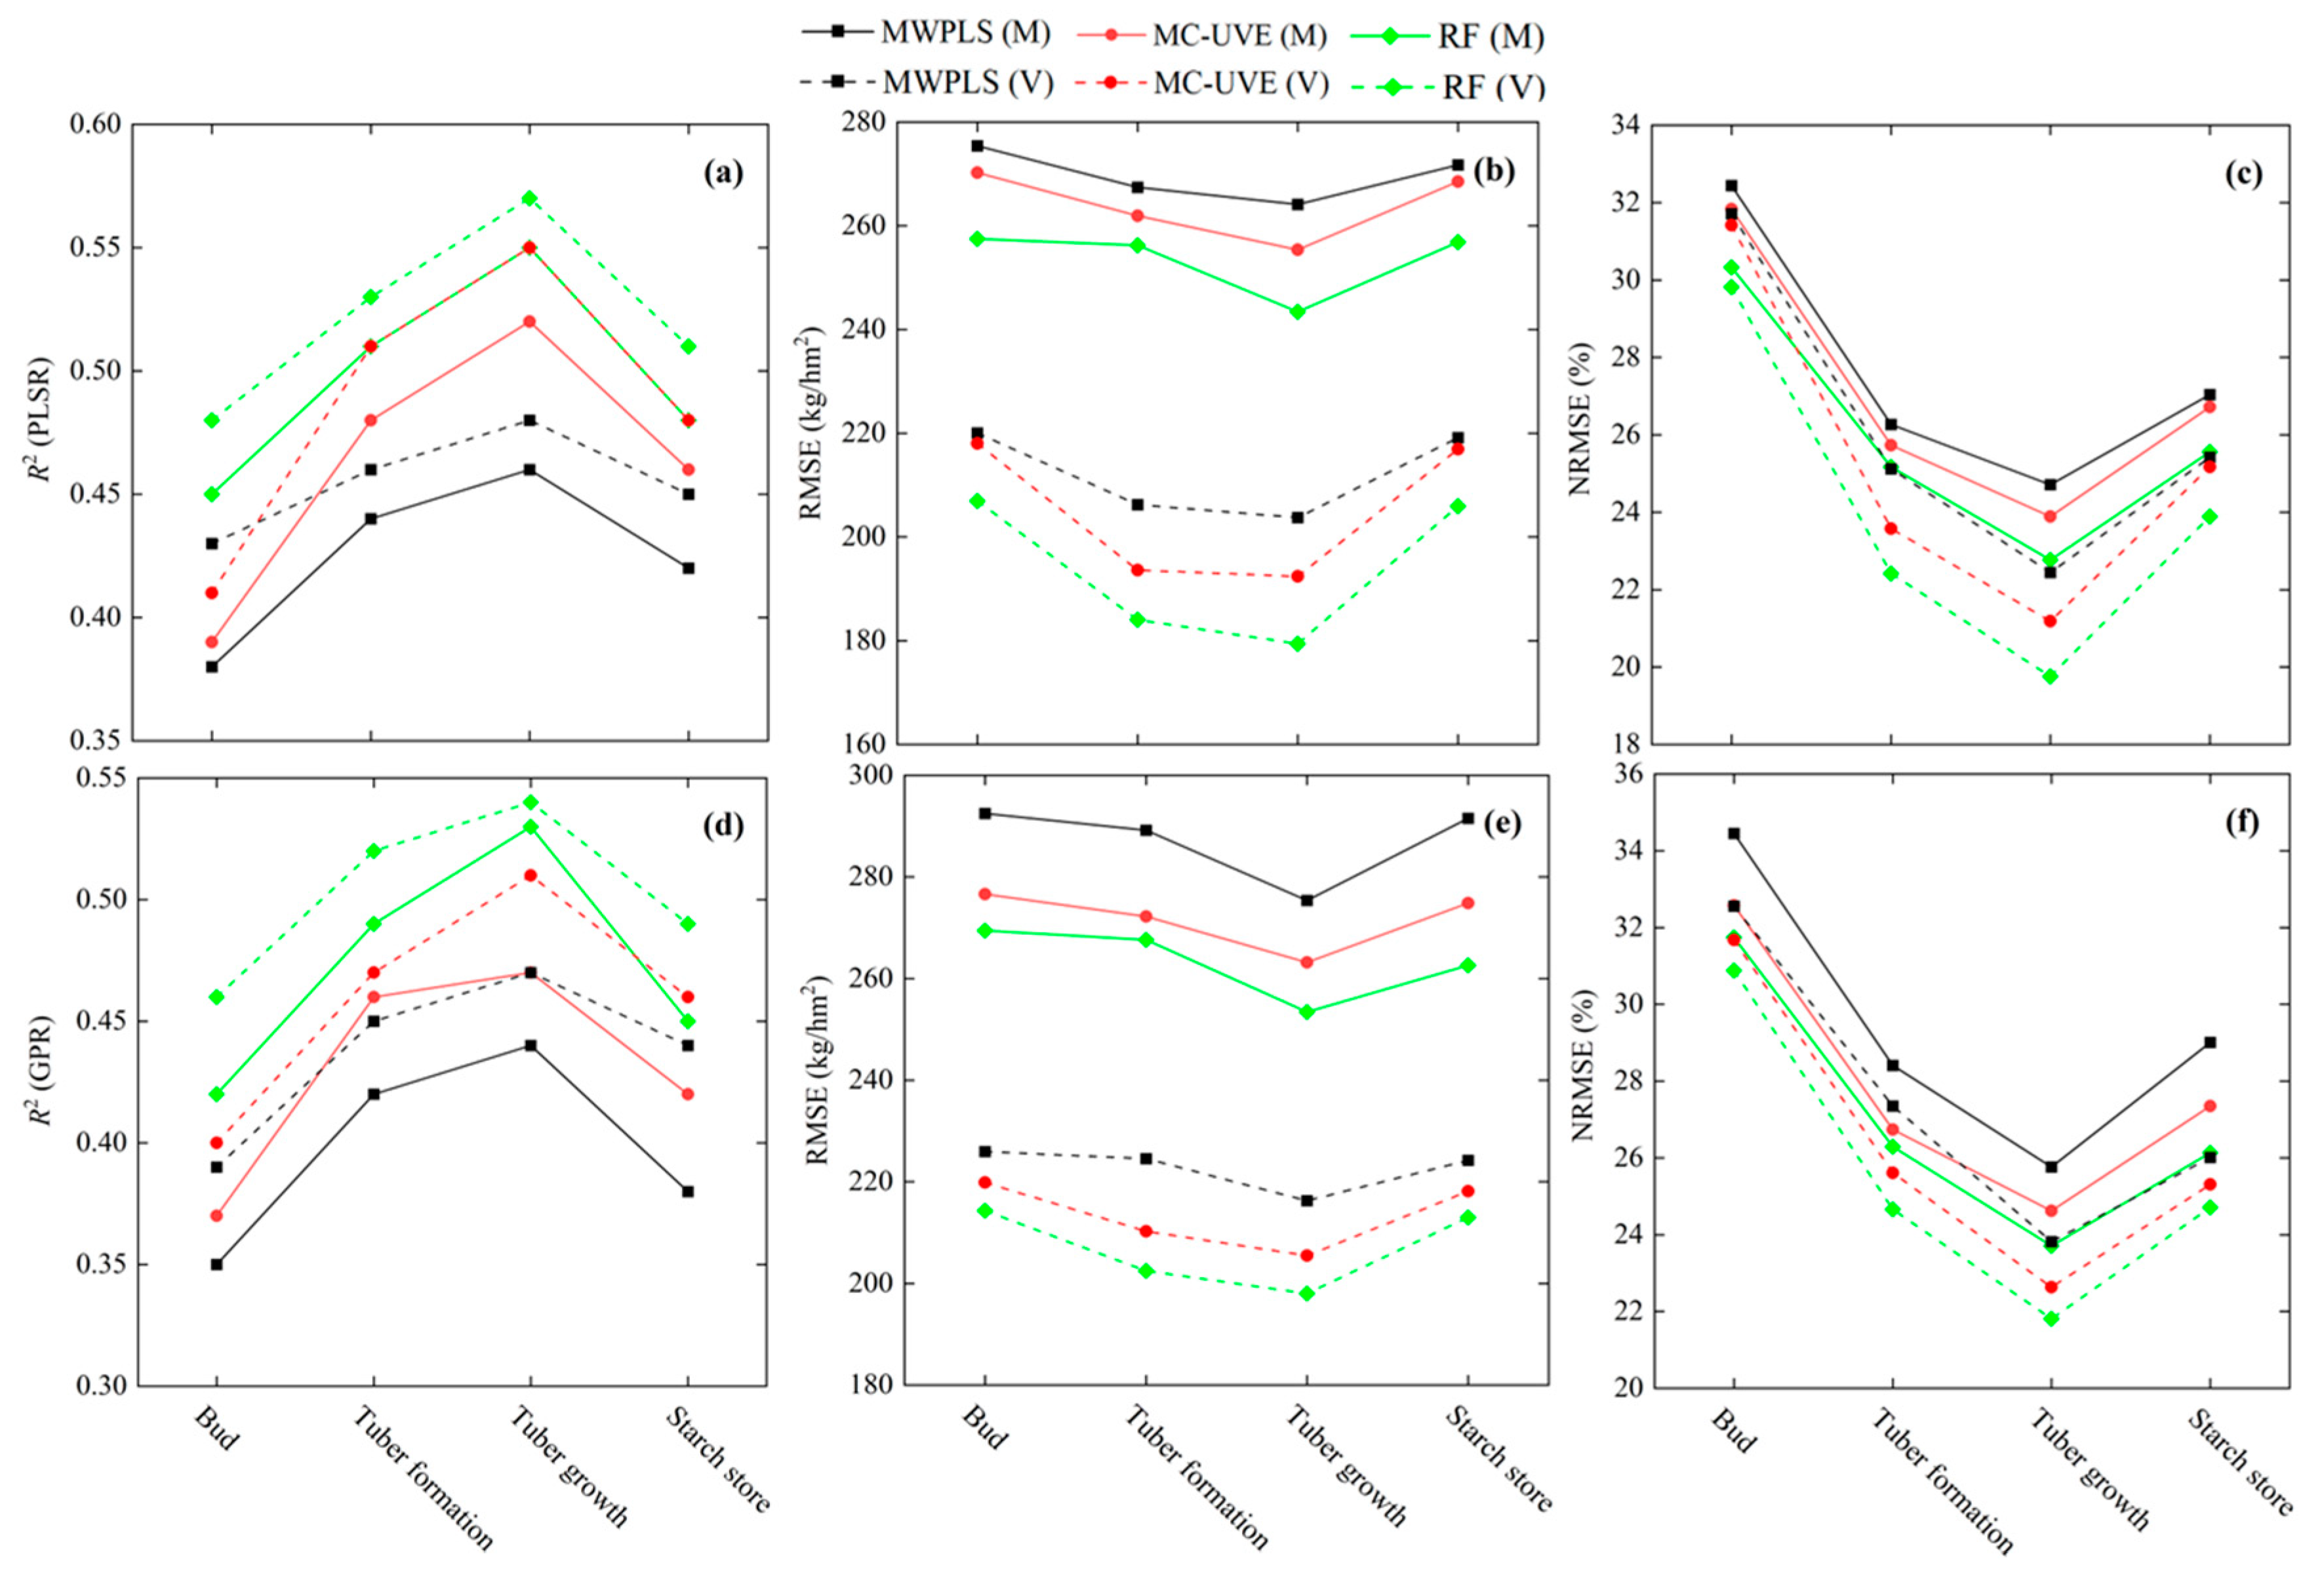
To evaluate the performance of estimating AGB based on spectral-reflectance characteristics, PLSR and GPR were used to build AGB estimation models for potatoes at each growth period based on the characteristic spectra of CRS and FDS (Figure 6), and R2, RMSE, and NRMSE were used to evaluate the fitting and stability of the models. The estimations obtained for each growth period are evaluated in Figure 7 and Figure 8. The results show that AGB estimates based on the two types of canopy spectral information of crops are not good, but, under the same conditions, the effect of estimating AGB directly using CRS features (Figure 7) is significantly weaker than when using FDS features (Figure 8). Based on a comprehensive analysis of the quality indicators (R2, RMSE, and NRMSE) in Figure 7 and Figure 8, the same modeling method was used to estimate AGB with the characteristic wavelengths selected by MWPLS, MC-UVE, and RF over the whole growth period, and they all showed that the AGB estimates gradually improved from the budding period to the tuber-growth period, and then deteriorated. The model variables selected by RF produce the best results, followed by MC-UVE, and the variables selected by MWPLS produce the worst results. Comparing the AGB estimation ability of PLSR and GPR shows that the former produces a greater R2 and lower RMSE and NRMSE for four growth periods, indicating that PLSR significantly improves the accuracy of potato AGB estimates.
The AGB estimation model was established by RF-PLSR in each growth period, with the highest fitting accuracy and the strongest model stability. From the budding period to the tuber-formation period, based on CRS and FDS modeling, R2 varies over the range 0.45–0.55 and 0.49–0.57, RMSE varies over the range 257.50–243.41 and 252.06–231.75 kg/hm2, and NRMSE varies over the range 30.33–22.77% and 29.69–21.68%, respectively. These results are consistent with the validation results, which show that R2 gradually increases, whereas RMSE and NRMSE gradually decrease. From the tuber-formation period to the starch-accumulation period, based on CRS and FDS modeling, R2 varies over the range 0.55–0.48 and 0.57–0.50, RMSE varies over the range 243.41–256.87 kg/hm2 and 231.75–243.11 kg/hm2, and NRMSE varies over the range 22.77–25.56% and 21.68–24.19%, respectively. It is verified that R2 gradually decreases, whereas RMSE and NRMSE gradually increase.

3.2. Estimation of AGB Using Spectral-Position Features

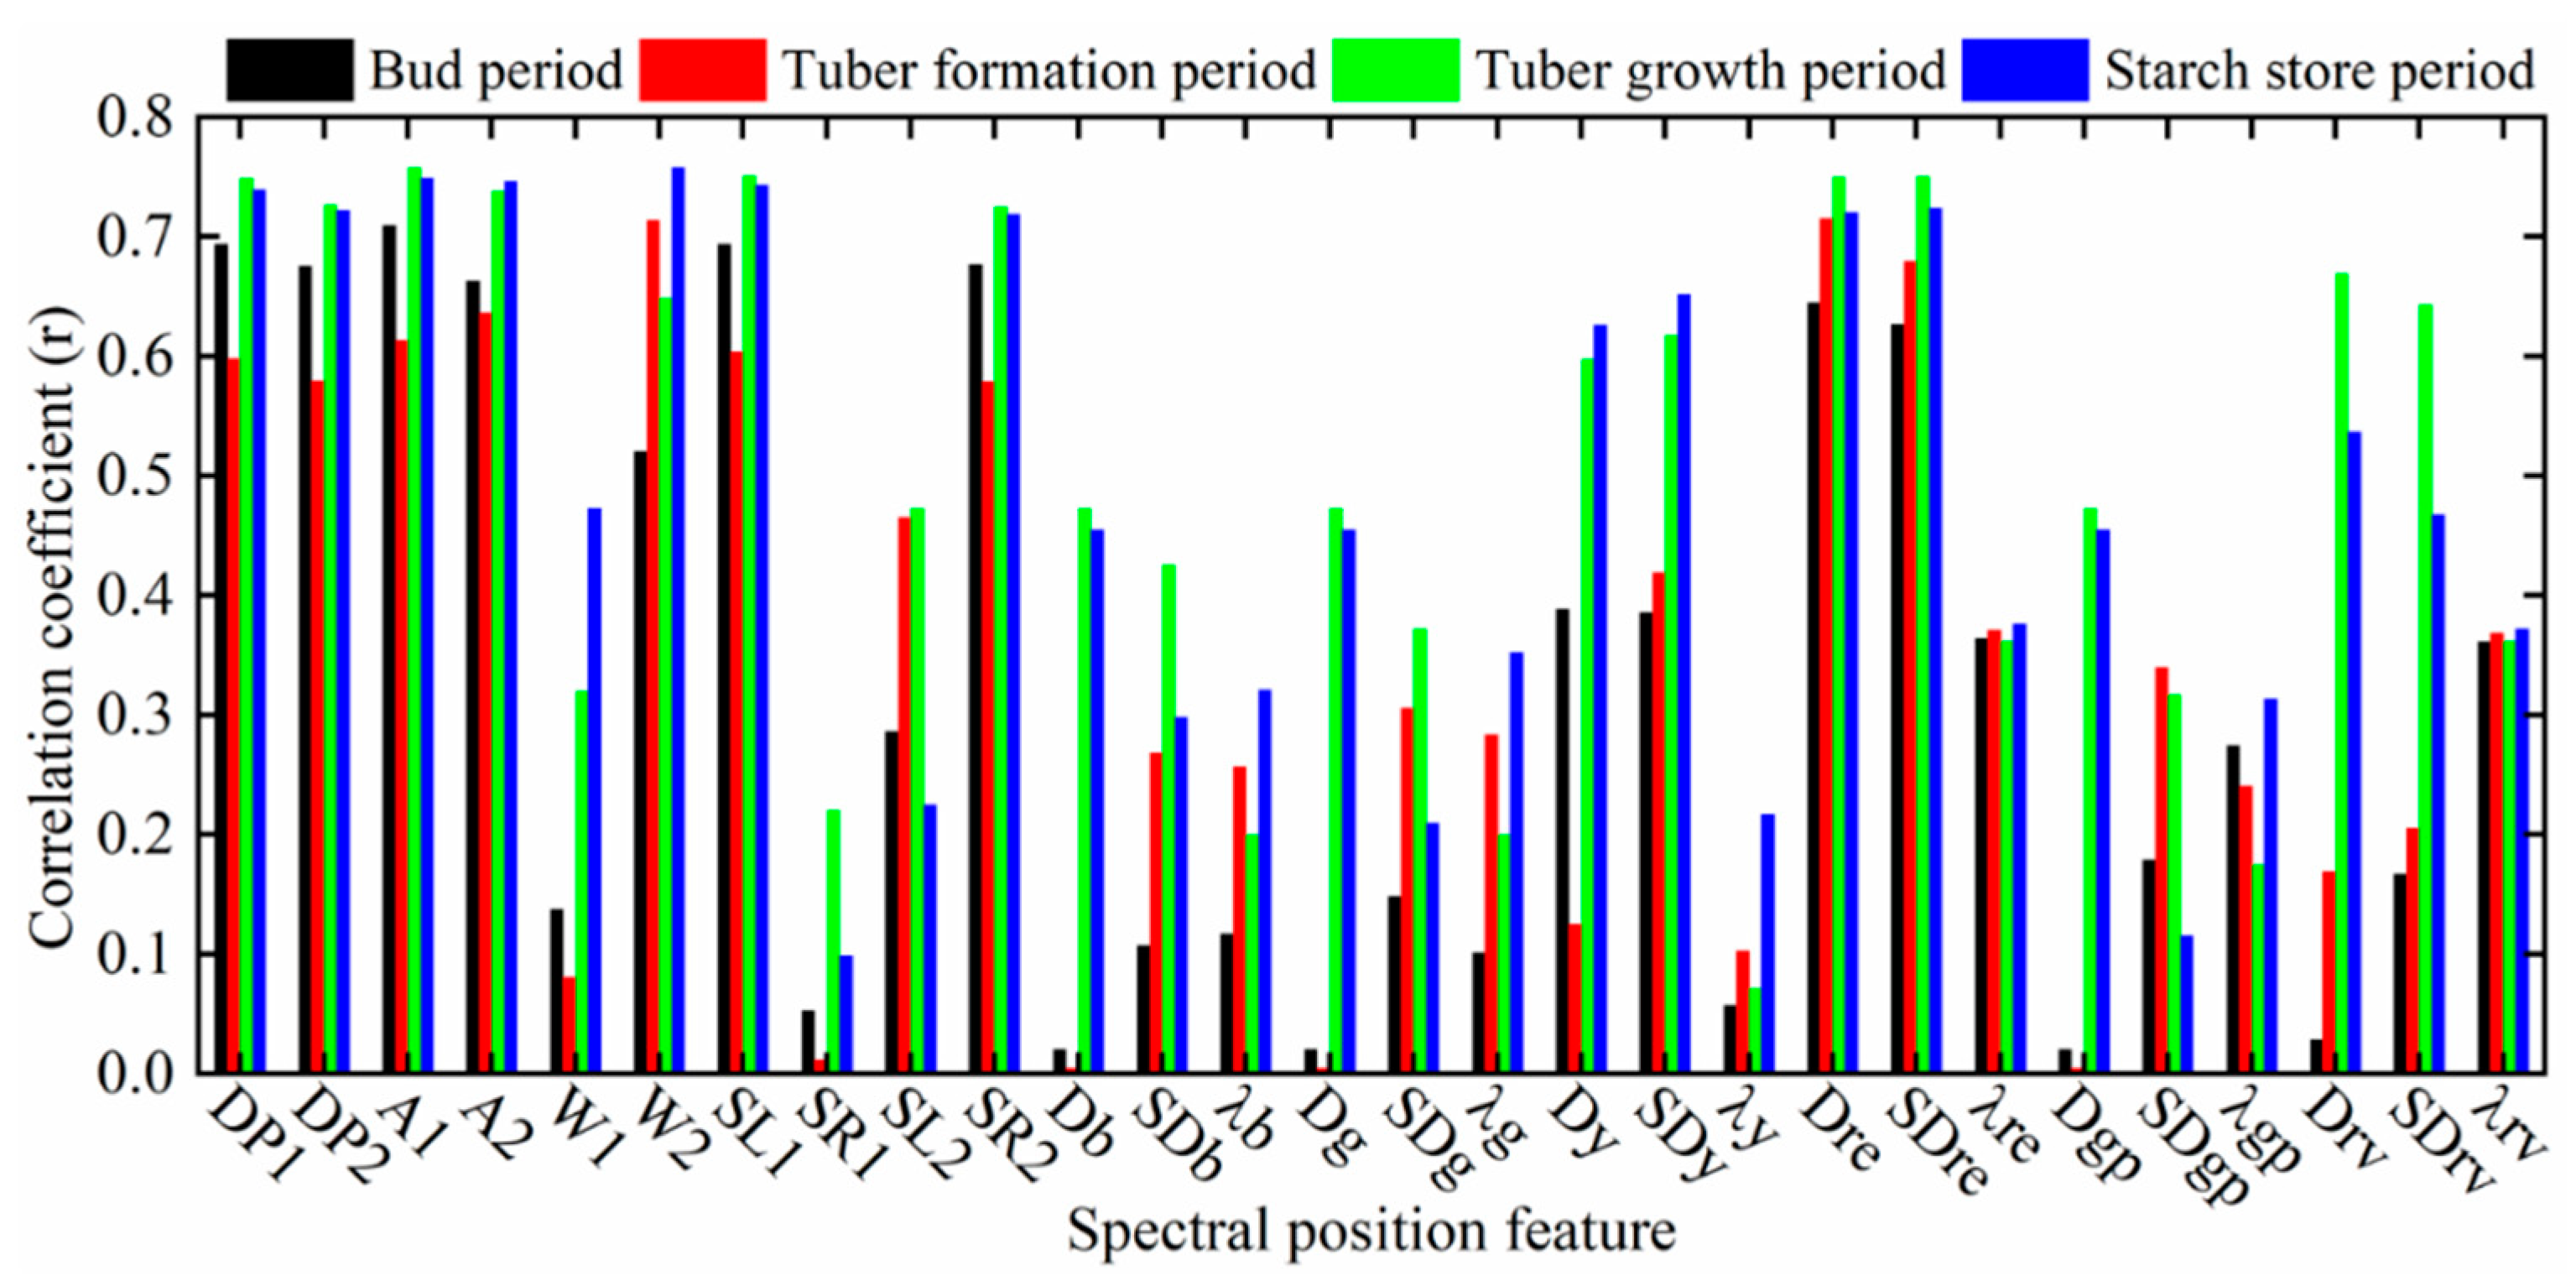
The twenty-eight spectral position characteristic parameters extracted at each growth period were correlated with the measured potato AGB, and the results are shown in Figure 9. A correlation analysis reveals that the responses of the various parameters differ significantly from that of the AGB, and the correlation between the de-envelope absorption valley parameters and AGB over the whole growth period is stronger than that of the “four sides, one valley, and one peak”. Comparing the correlation of different parameters in each growth period shows that twelve parameters (DP1, DP2, A1, A2, W2, SL1, SR2, SDy, Dre, SDre, λre, and λrv) are significantly correlated with AGB over the four growth periods, and the correlation remains excellent. Compared with the correlations between the remaining parameters and AGB in each growth period, the number of positional parameters that correlate significantly with AGB differs greatly. Only the parameters Dy and SL2 correlate significantly with AGB at the budding period and tuber-formation period, respectively. The number of parameters (W1, Db, Dg, Dy, Dgp, Drv, and SDrv) that correlate significantly with AGB in the tuber-growth stage increases, as does the correlation, whereas the number of parameters significantly correlated with AGB in the starch-accumulation stage also increased (SL2, Db, Dg, SDg, Dy, Dgp, Drv, SDrv), but the correlation started to decrease. A comprehensive analysis of the correlation of location parameters over the whole growth period shows that the correlation from the budding period to the starch-accumulation period generally increases first and then decreases.
The MWPLS, MC-UVE, and RF methods were also used to optimize and screen the location parameters that correlate significantly in each potato-growth period. According to the three selected indexes (RMSEcv, RI, and SP) in Figure 5 and based on the analysis of the test results, the thresholds for selecting model parameters for each growth period under each method are finally determined to be 120, 260, 275, and 360 kg/hm2 (based on MWPLS), 1.0, 2.0, 1.0, and 1.5 (based on MC-UVE), 0.1, 0.2, 0.2, and 0.4 (based on RF). According to the selected threshold results, the model parameters used to estimate AGB in each potato-growth period were selected (Table 3). The model parameters listed in Table 3 show that the number and category of location parameters selected for each growth period vary greatly. Overall, the importance of the absorption valley parameters for AGB estimation is greater than that of the “four sides, one valley, and one peak”.
Using the PLSR and GPR methods based on the model parameters listed in Table 3 as independent variables, we obtain the relationship between the spectral location characteristic parameters and AGB in the four potato-growth periods. The indicators (R2, RMSE, and NRMSE) used to evaluate the model accuracy in each growth stage are shown in Figure 10. Based on the evaluation index of the AGB estimation model, the estimation obtained by using the model parameters selected by different methods as variables is consistent with the spectral reflection characteristics, which shows that the variables selected by the RF method produce the best estimates, followed by MC-UVE, whereas the worst estimates are produced by the MWPLS method. Compared with the GPR regression technique, the model constructed by PLSR using the same variables in each growth period produces a larger R2 and smaller RMSE and NRMSE, indicating that the PLSR method improves the accuracy of the AGB estimation model, which is consistent with the results given in Figure 7 and Figure 8.
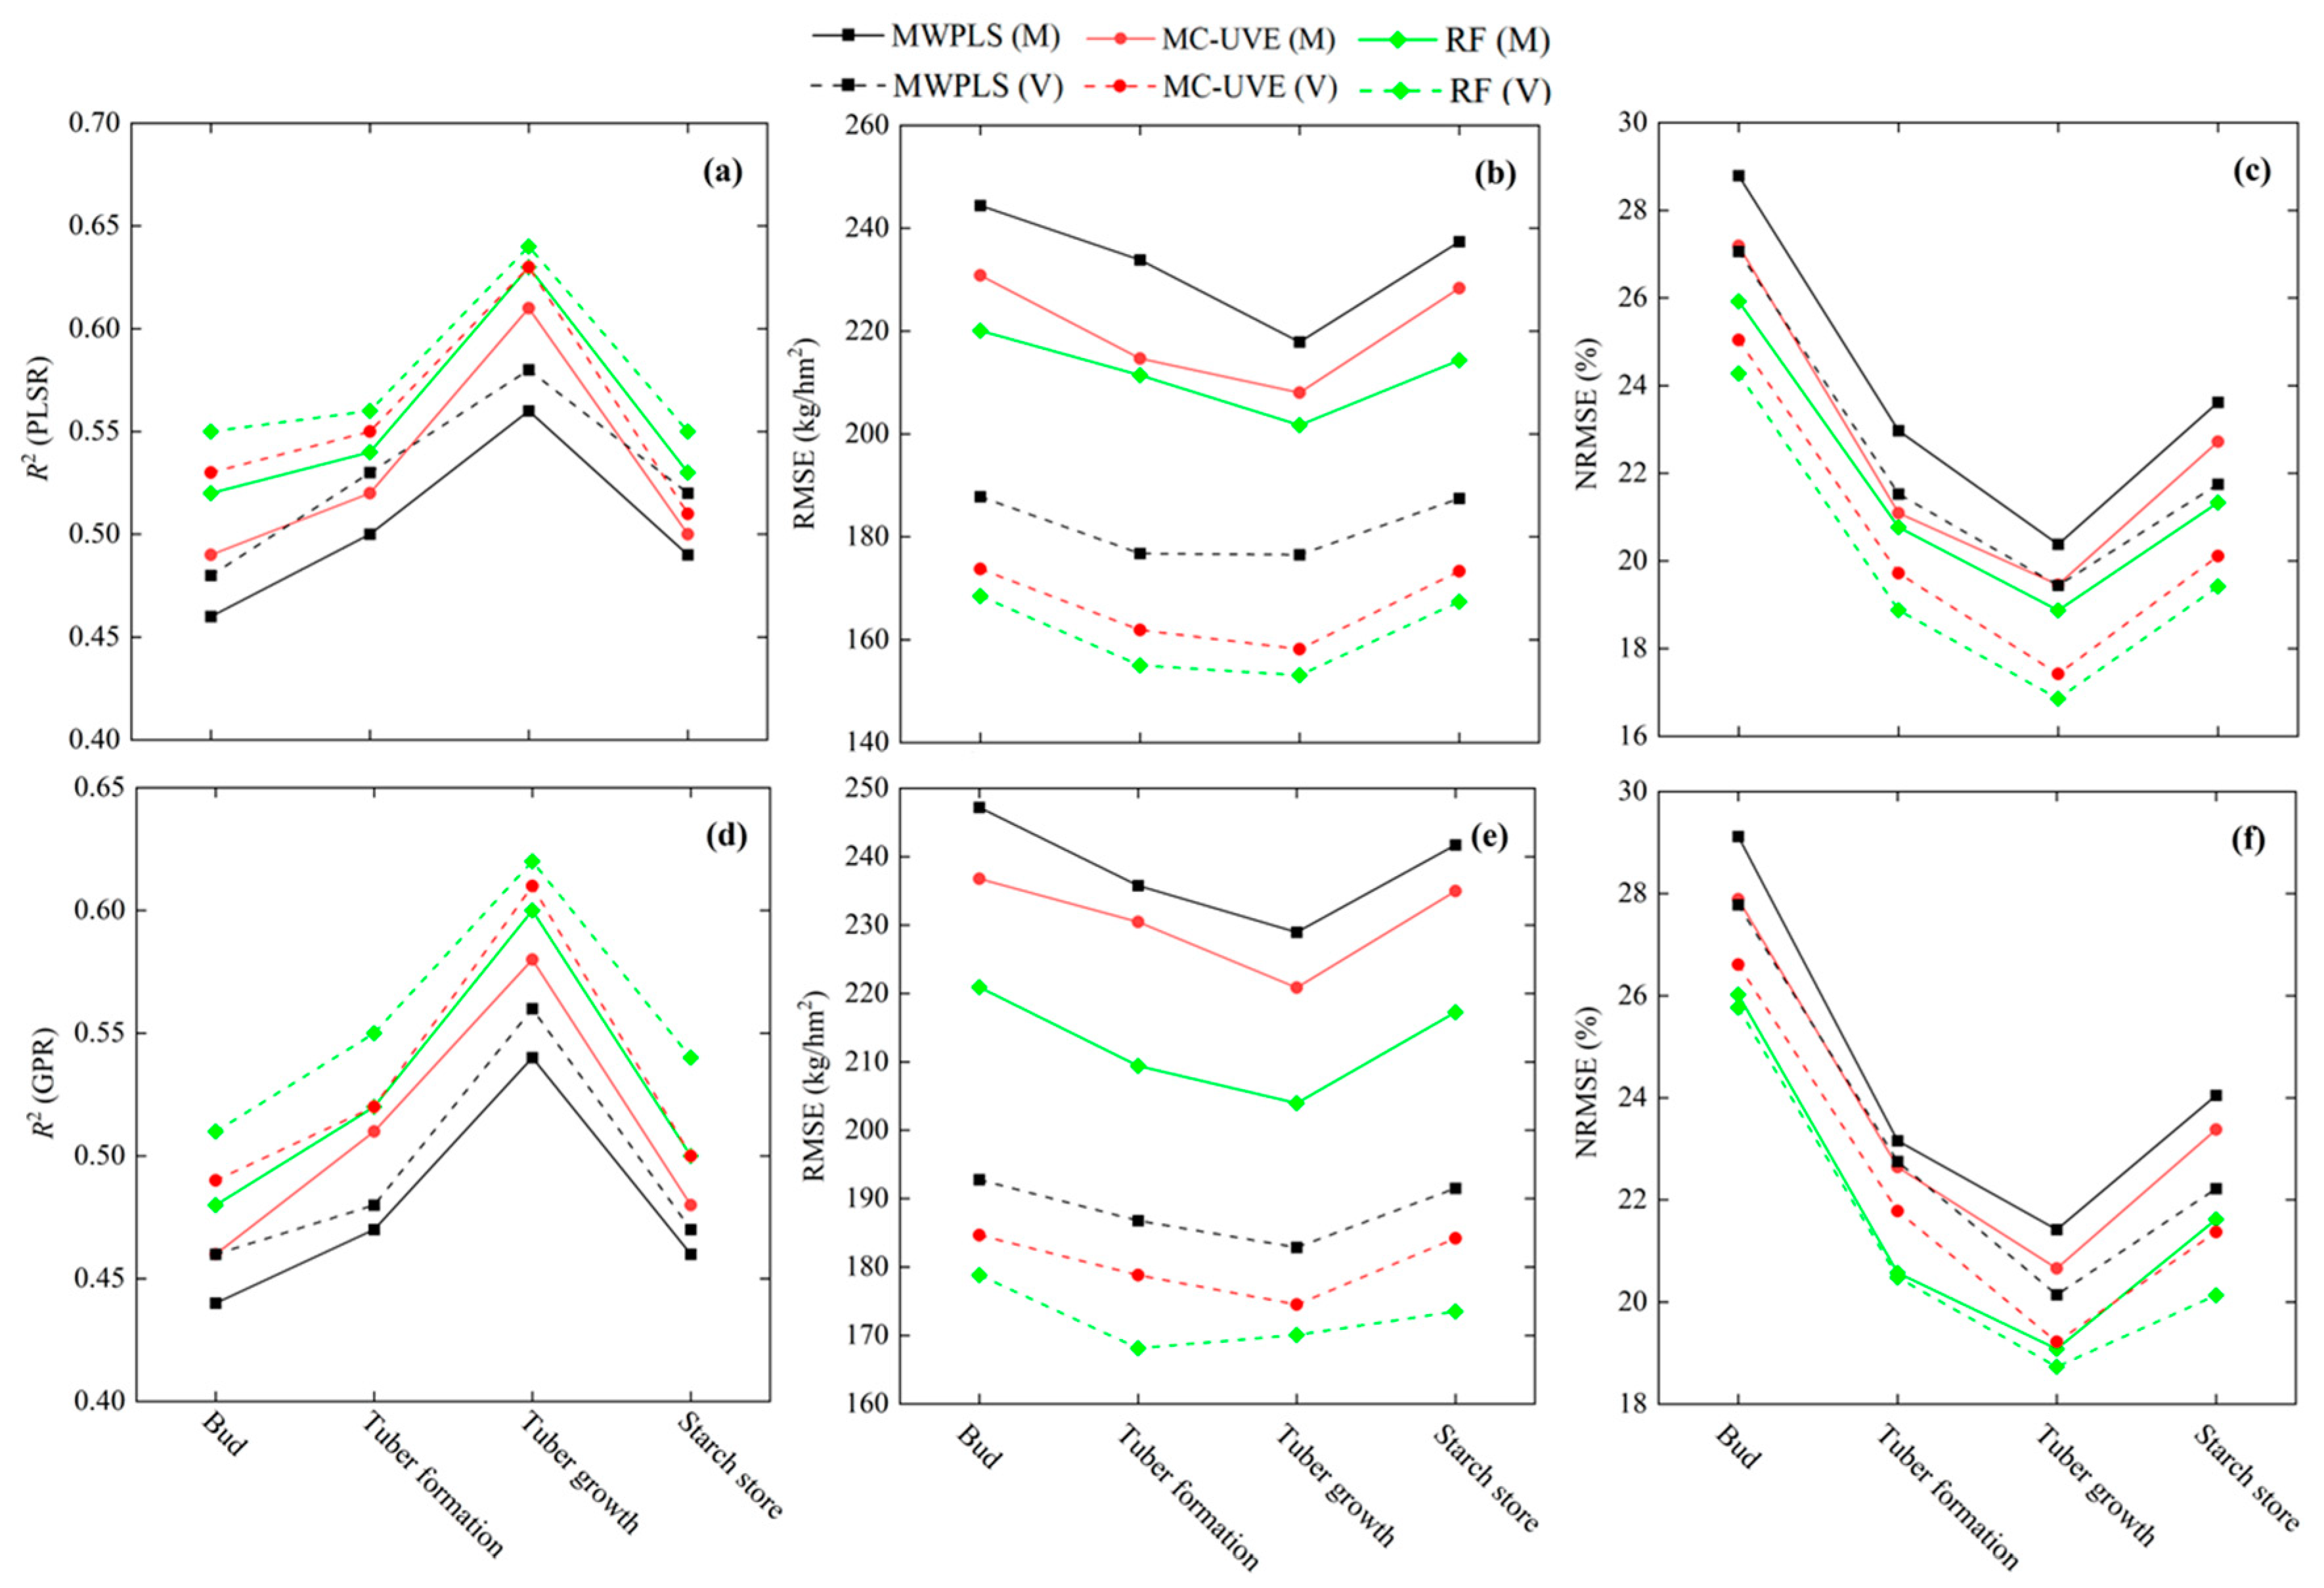
Comparing the results in Figure 7 and Figure 8 with those in Figure 10 shows that the AGB estimate based on the spectral-location features is more accurate than the AGB estimate based on the corresponding spectral reflectance features. Similarly, the estimation quality first improves and then decreases from the budding period to the starch-accumulation period. In each growth period, the estimation model obtained by the RF-PLSR method is also more accurate and more reliable. From the budding period to the tuber-growth period, R2 increases from 0.52 to 0.63, and RMSE and NRMSE decrease from 220.06 to 201.72 kg/hm2 and from 25.92% to 18.87%, respectively. Validation R2 also increases gradually and RMSE and NRMSE decrease gradually so that the estimate gets better and better. From the tuber-growth period to the starch-accumulation period, R2 varies over the range 0.63–0.53, RMSE varies over the range 201.72–214.36 kg/hm2, and NRMSE varies over the range 18.87–21.33%. The validation results are like the modeling results, and the estimation gradually deteriorates.

3.3. Estimation of AGB Using Vegetation Indexes

The twenty selected vegetation indexes and the measured potato AGB in each growth period were used for a Pearson correlation analysis. The specific correlation size is shown in Figure 11, where the selected vegetation index and the measured AGB in each growth period correlate very strongly. Comparing the results in Figure 4, Figure 9 and Figure 11 shows that the correlations between the three types of model parameters and AGB differ significantly. In general, the vegetation index produces the best results, followed by the spectral-location feature parameter, and the spectral-reflectance feature parameter produces the worst results. Similarly, the variation of the correlation between vegetation indexes and AGB in the four growth periods is consistent with the characteristics of spectral position and spectral reflectance, which gradually improve from the budding period to the tuber-growth period and then decrease.
The vegetation indexes that do not correlate significantly in the four growth periods are MCARI and TCARI for the budding period, TCARI for the tuber-formation period, MSR and CRI for the tuber-growth period, and CRI for the starch-accumulation period. This indicates that the correlation between vegetation index and AGB depends on the growth period.
To reduce information redundancy, the MWPLS, MC-UVE, and RF methods were also used to optimize and screen the vegetation indexes that reached extremely significant correlation levels in each potato-growth period. Using the quantitative indicators RMSEcv, RI, and SP as criteria, the thresholds for selecting model parameters for each growth period under each method are determined. Based on MWPLS, they are 125, 260, 275, and 360 kg/hm2, respectively. Based on MC-UVE, they are 1.0, 1.0, 1.0, and 1.5, respectively. Based on RF, they are 0.3, 0.2, 0.3, and 0.4, respectively. According to the threshold results, the vegetation index used to estimate AGB in each potato-growth period was selected (Table 4). From the results in Table 4, the vegetation indexes obtained in each growth period also differ, with NDVI, SIPI, NDRE, and WDRVI most likely to be selected by the three methods, indicating that these vegetation indexes are important for estimating potato AGB.
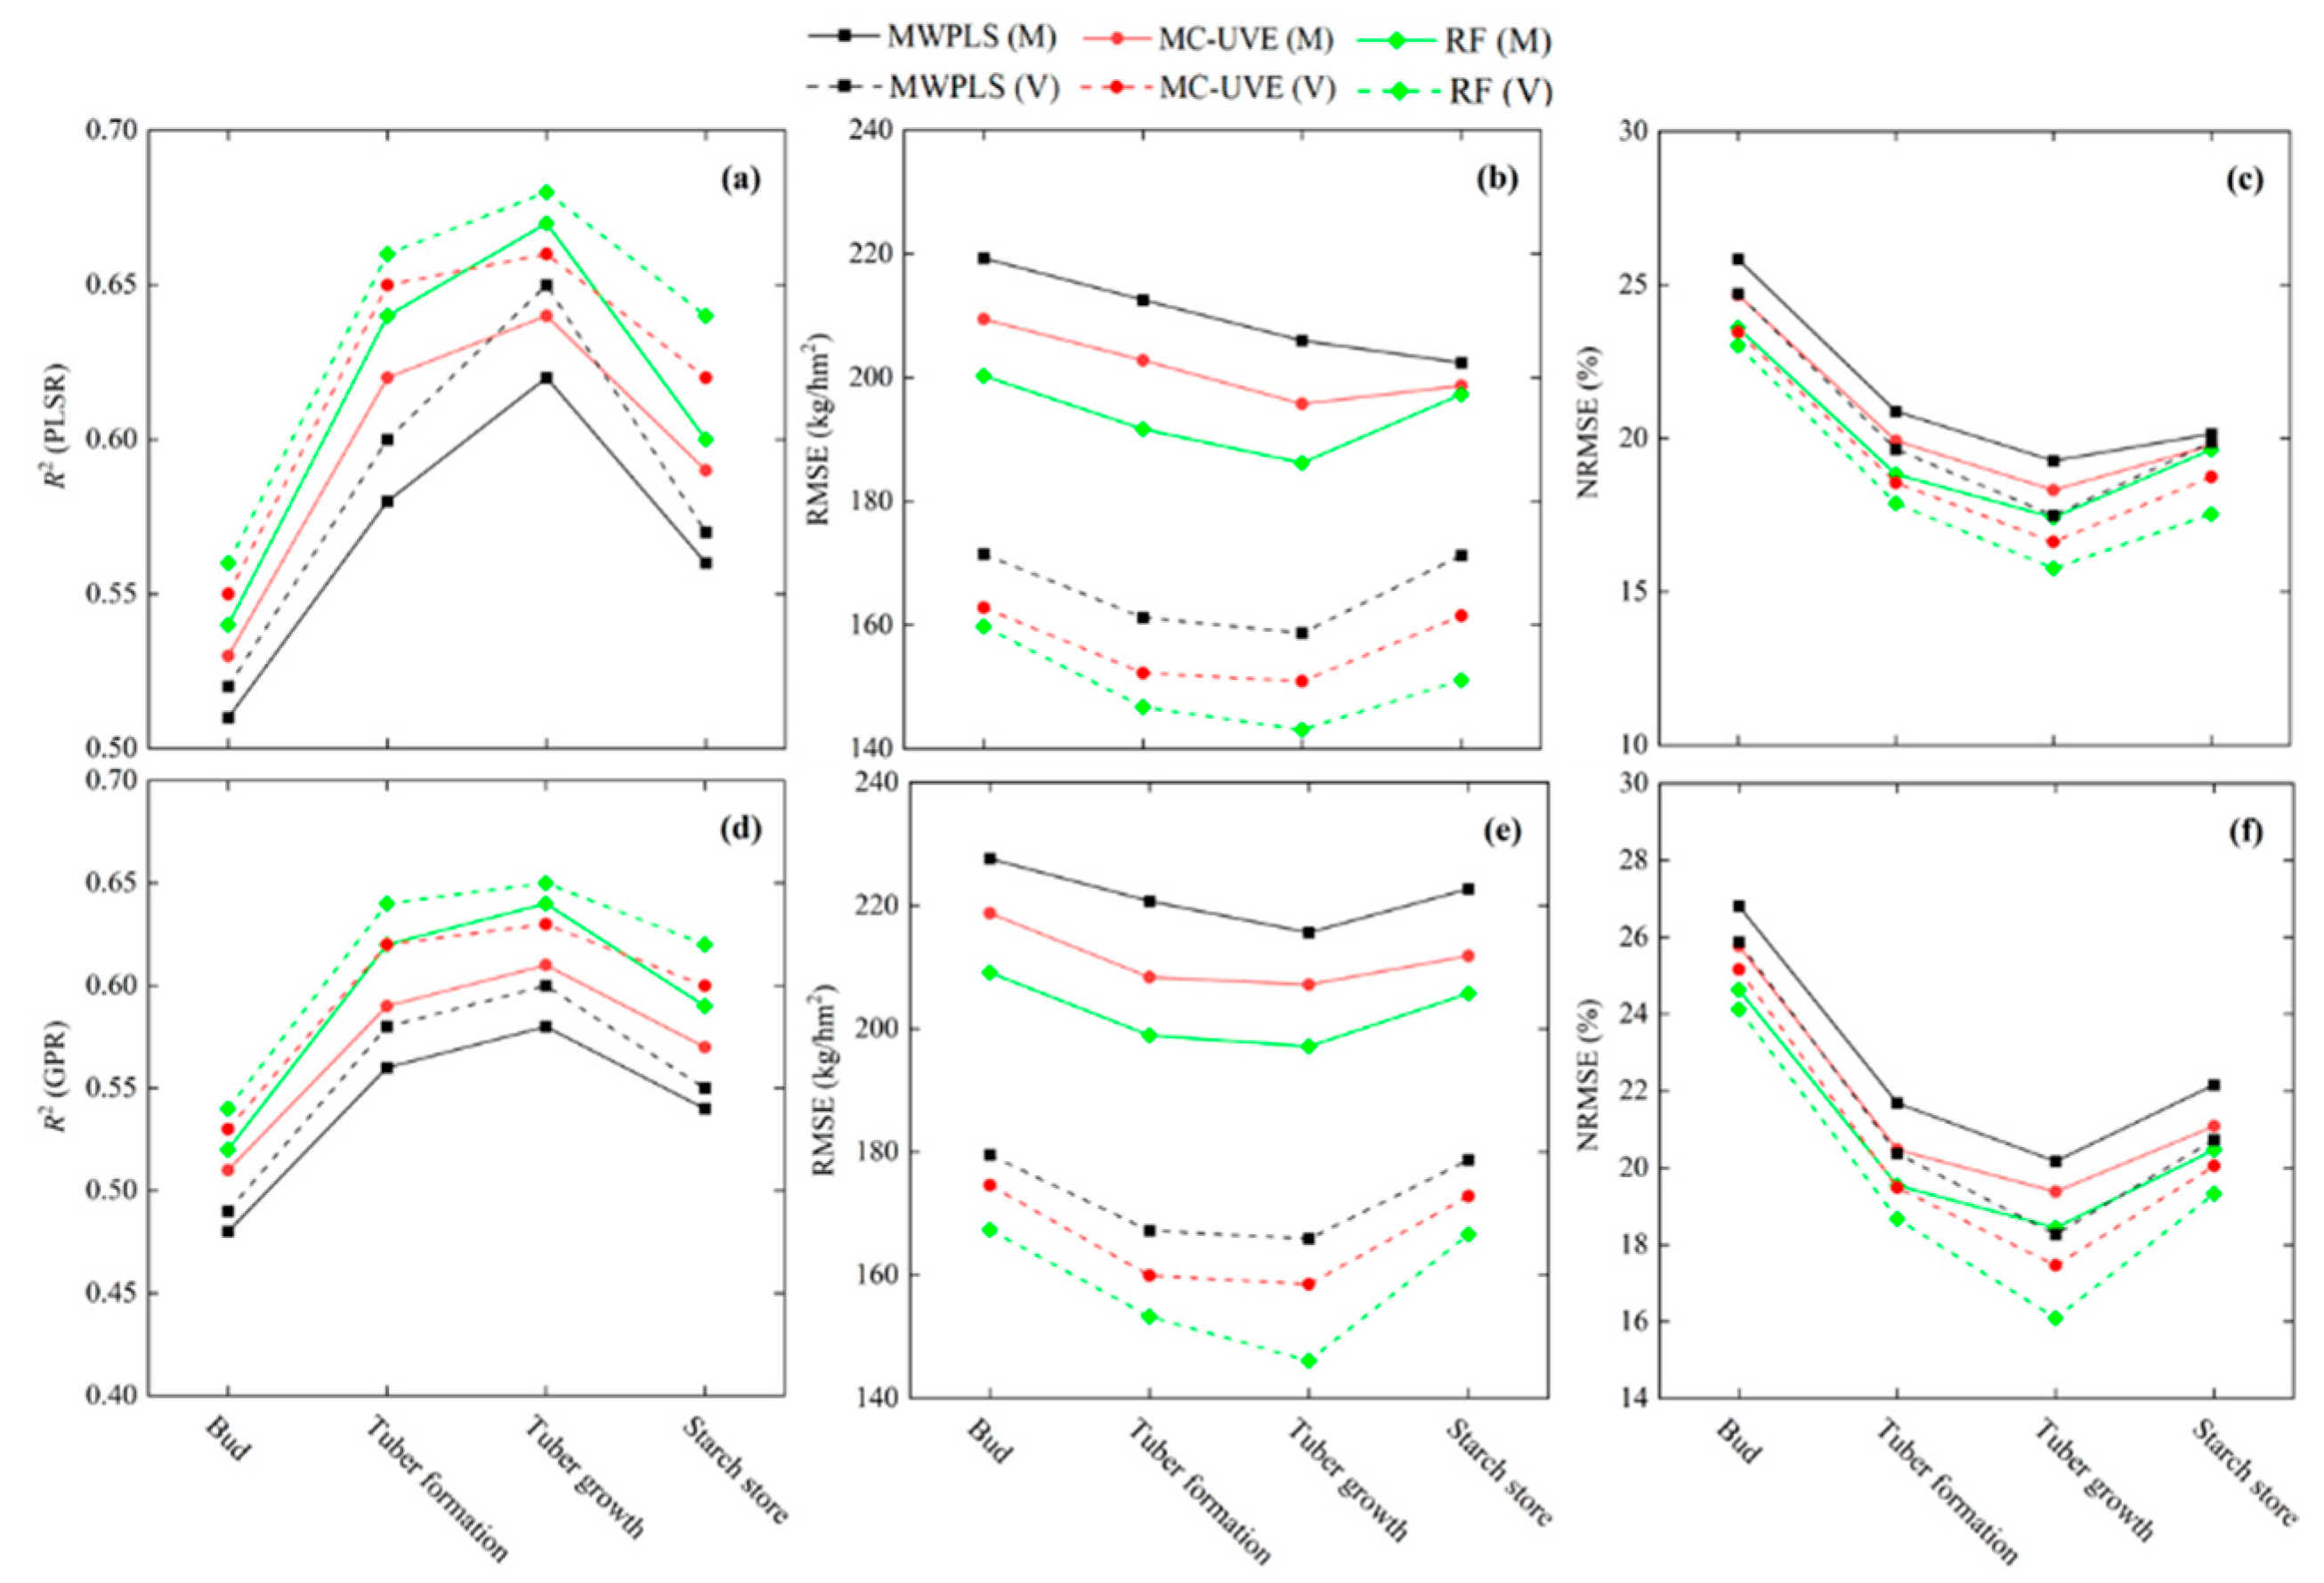
Based on the screening results in Table 4, the potato AGB estimate for each growth period is constructed by combining the PLSR and GPR methods, respectively. The modeling and validation indicators (R2, RMSE, and NRSE) of each model are listed in Figure 12. From the perspective of the size of the model evaluation indicators, under the same method, the vegetation index selected by RF in each growth period has the best effect for estimating AGB, followed by MC-UVE, whereas the vegetation index selected by MWPLS produces the worst modeling and verification results. These results are consistent with those listed in Figure 7, Figure 8 and Figure 10. For a given variable, R2 of the AGB estimation model constructed by PLSR for each growth period is greater than the R2 of the AGB estimation model constructed by the GPR method, and the RMSE and NRMSE are smaller, indicating that the PLSR method is more conducive to AGB estimation, which is also consistent with the results in Figure 7, Figure 8 and Figure 10.
Comparing the results listed in Figure 7, Figure 8, Figure 10 and Figure 12 shows that, under the same conditions, the estimates of AGB based on vegetation indexes are more accurate, followed by spectral position features, whereas estimating AGB based on spectral-reflection features is the least accurate. However, the accuracy of the AGB estimates based on three categories goes from high to low from the budding period to the starch-accumulation period. In each growth period, the AGB estimation model established by the RF-PLSR method is also more accurate and more stable. From the budding period to the tuber-formation period, the modeling R2 increases from 0.54 to 0.67, the RMSE decreases from 200.27 to 186.21 kg/hm2, and the NRMSE decreases from 23.59% to 17.42%. The verification results are consistent with the modeling results: R2 continues to increase, RMSE and NRMSE gradually decrease, and the estimation improves. From the tuber-formation period to the starch-accumulation period, R2 decreases from 0.67 to 0.60, and the RMSE and NRMSE increase from 186.21 to 197.28 kg/hm2 and from 17.42% to 19.63%, respectively. The verification R2 also gradually decreases, and the RMSE and NRMSE gradually increase, so the estimation deteriorates.

3.4. Estimation of AGB Using Composite Variables

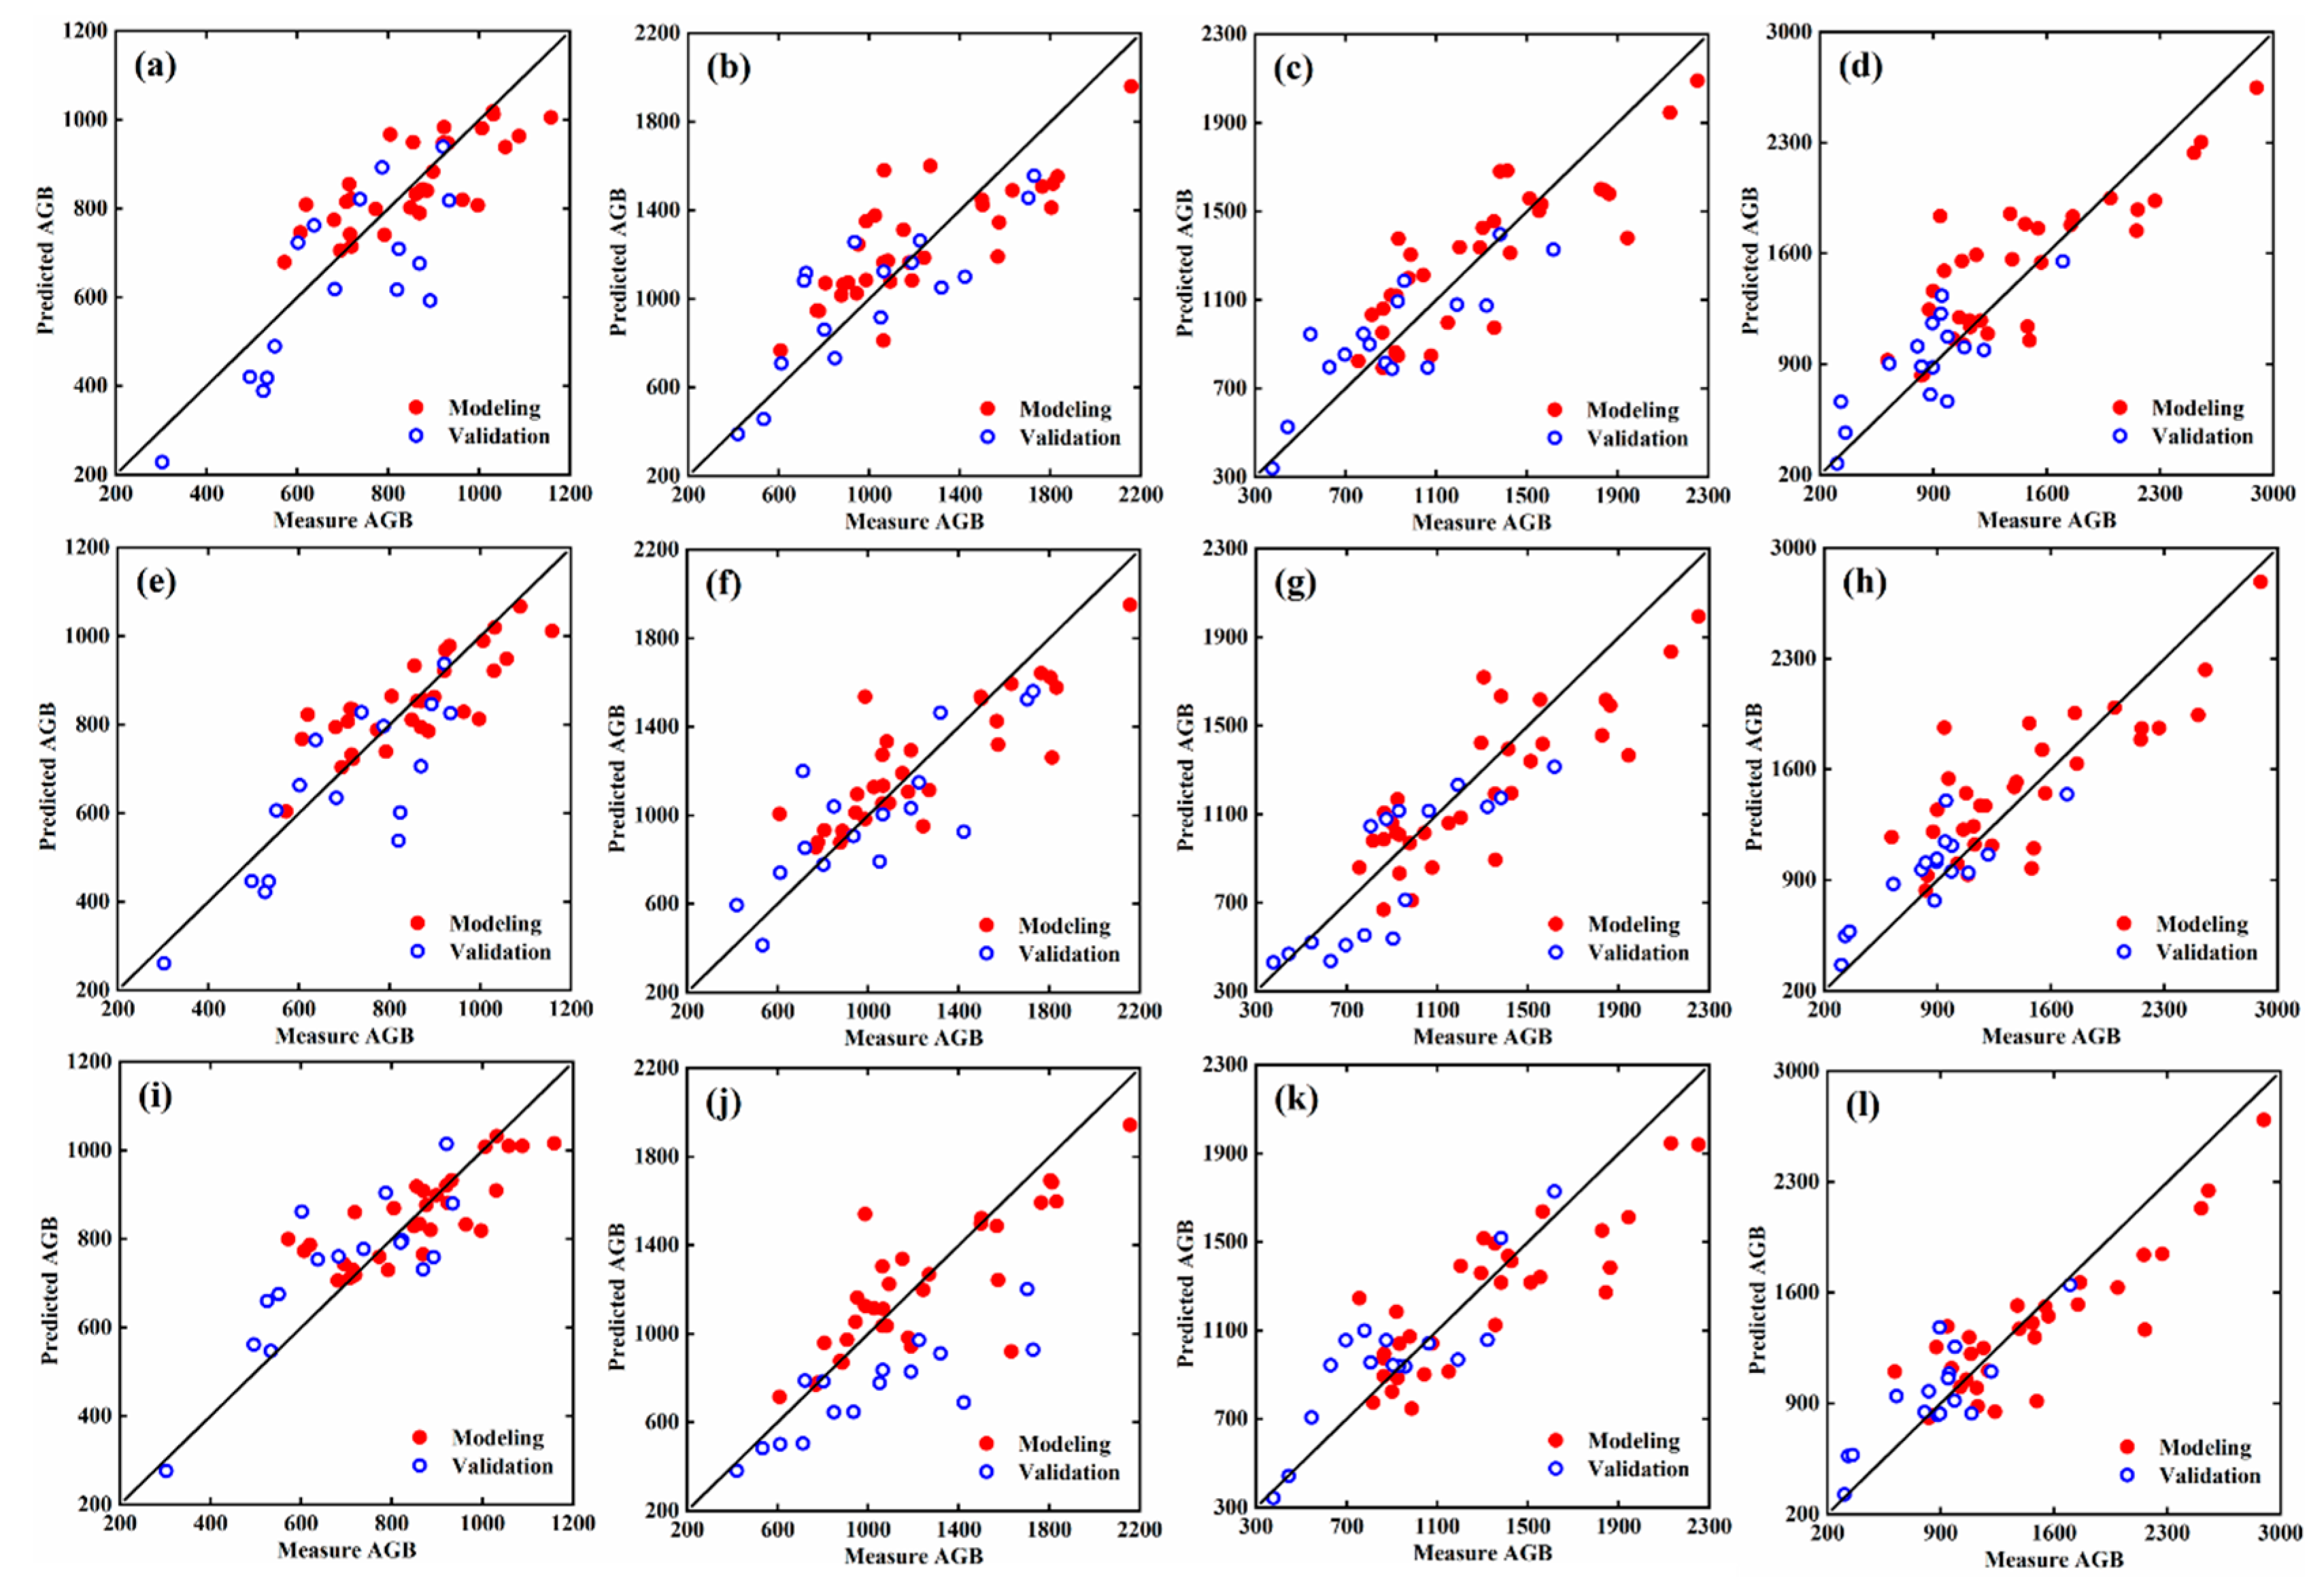
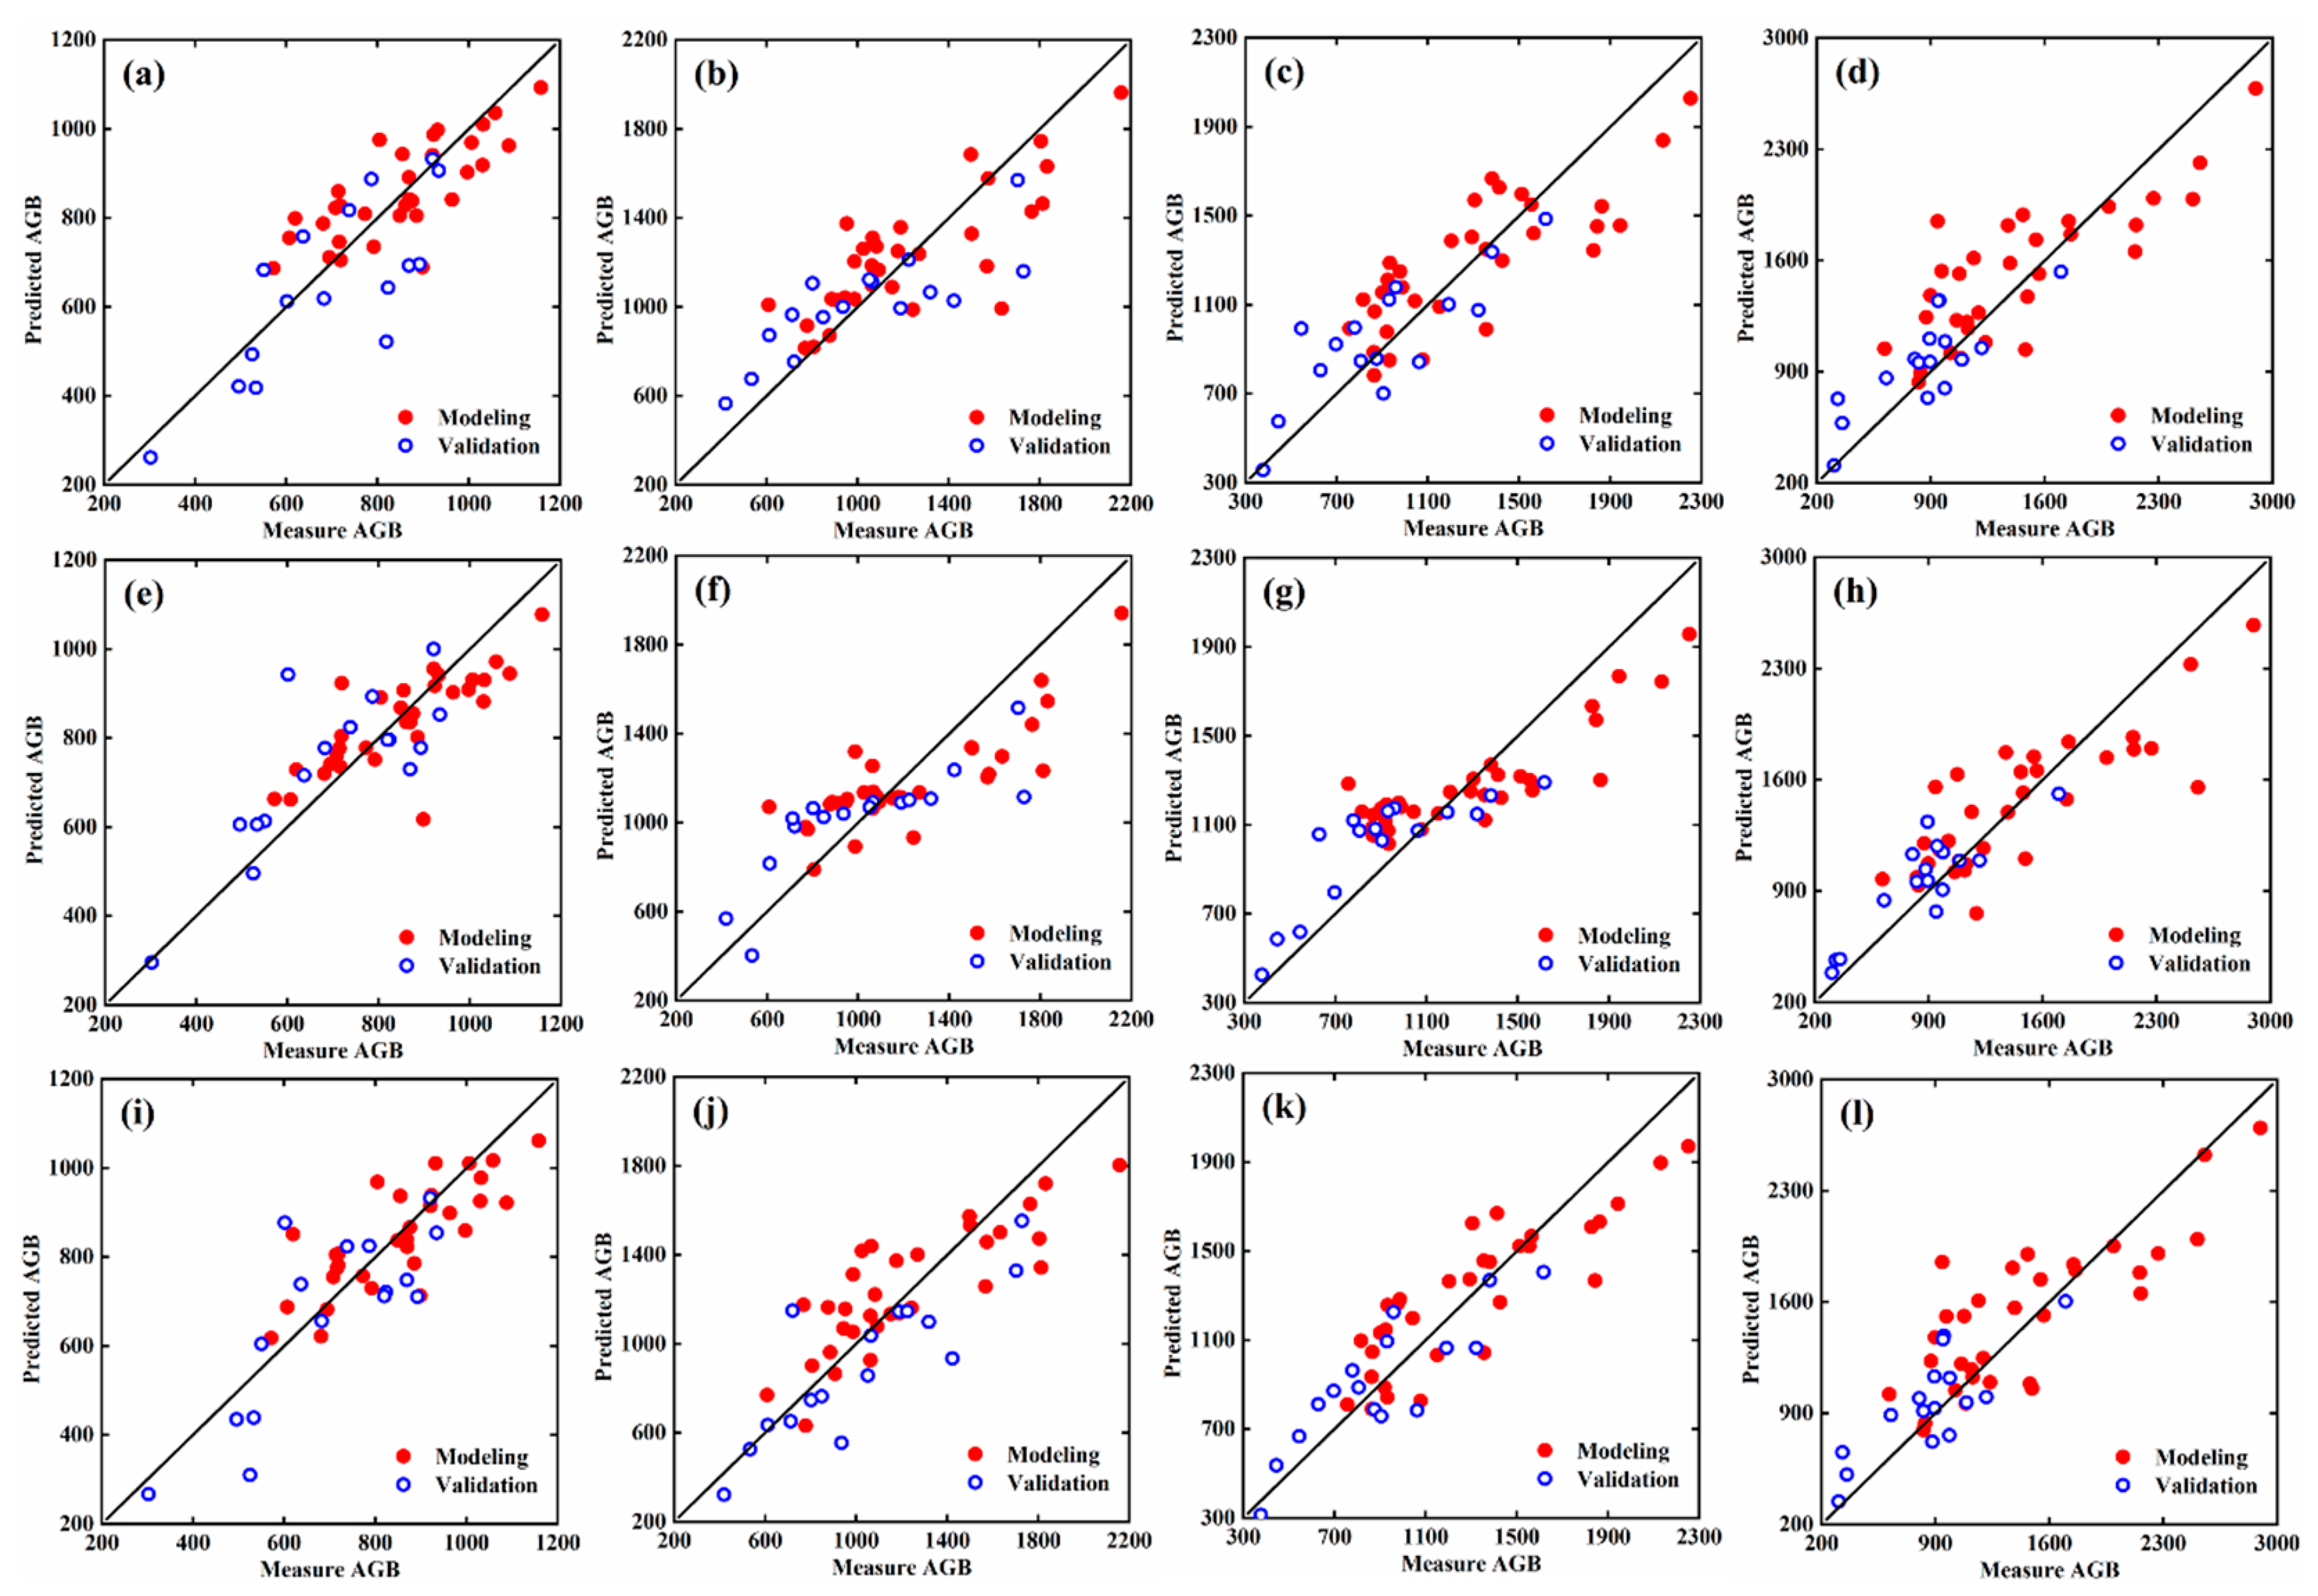
The model variables (Table 3 and Table 4 and Figure 6) extracted by the MWPLS, MC-UVE, and RF screening methods based on three types of spectral features were formed into a new data set, and the PLSR and GPR methods were used to estimate the potato AGB in each growth period. The R2, RMSE, and NRMSE of the regression results appear in Figure 13, and the fitted scatterplots are shown in Figure 14 and Figure 15. These results show that, under the same conditions, the comprehensive variables serve as model input parameters in each growth period, R2 is maximal for modeling and verification, and the RMSE and NRMSE are minimal, so the estimation is the best (Figure 7, Figure 8, Figure 10, Figure 12 and Figure 13). Comparing the influence of the three variable-screening methods on AGB estimation through a comparative analysis of the evaluation indicators shows that the variables selected by the RF method are the best in each growth period, followed by MC-UVE, and those selected by MWPLS are the worst, which is consistent with the results listed in Figure 7, Figure 8, Figure 10 and Figure 12. For the same variables, the AGB estimation model constructed by the PLSR method in each growth period fits slightly more accurately (Figure 14 and Figure 15) and is more stable than the GPR method (Figure 13). The estimations from the budding period to starch-accumulation period first improve and then decrease in accuracy, which is consistent with the estimation of AGB based on three types of spectral characteristics. In each growth period, the RF-PLSR method produces the best AGB estimates, and the model is the most stable. R2 continues to increase (0.65–0.72) from the budding period to the tuber-growth period, and the corresponding RMSE (167.76–160.77 kg/hm2) and NRMSE (19.76–15.04%) continue to decrease, so the estimates gradually improve. The verification results (Figure 13 and Figure 14) are similar to the modeling results. R2 (0.68–0.74) increases, RMSE (136.57–125.48 kg/hm2) and NRMSE (19.68–13.82%) decrease, and the model gradually improves. From the tuber-growth period to the starch-accumulation period, R2 decreases from 0.72 to 0.67, RMSE increases from 160.77 kg/hm2 to 169.24 kg/hm2, NRMSE increases from 15.04% to 16.84%, so the estimation deteriorates. We verified that the trends of R2 (0.74–0.70), RMSE (125.48–135.16 kg/hm2), and NRMSE (13.82–15.68%) are consistent with the modeling set, where R2 decreases, RMSE and NRMSE increase, and the estimation deteriorates.

4. Discussion

4.1. Correlation between Three Types of Spectral Features and AGB

The analysis of the correlation between spectral variables and physicochemical parameters (such as AGB and LAI) is the premise of building the estimation model. Therefore, this study first applies a Pearson correlation analysis between (i) spectral-reflectance features, spectral-location features, and vegetation indexes and (ii) AGB in each potato-growth period. The results show that differences exist in the correlation between various types of parameters and AGB (Figure 4, Figure 9 and Figure 11), and the number of parameters reaching the extremely significant correlation level is also different, which shows that AGB can be estimated by using different types of spectral variables in each growth period, which is necessary for growth monitoring [34,37]. Overall, the correlation between the three types of spectral variables and AGB first increases and then decreases upon progressing from the budding period to the starch-accumulation period, which may be related to the potato-growth cycle. In the early stage, it is manifested by vegetative and reproductive growth, which is reflected in the elongation of stem nodes and the expansion of leaves. In the tuber-growth period, the fresh weight of stems and leaves reaches a maximum. At this time, the vegetation coverage reaches a maximum, and the acquisition of canopy spectral information is not contaminated by the ground soil. The extracted spectral characteristic parameters fully reflect the AGB. At the later stage of growth, due to the continuous expansion of underground tubers, nutrients accumulated in the early stage of aboveground stems and leaves need to be transferred underground. At the same time, due to the rainy weather, aboveground leaves wither and rapidly fall off, and the growth of potato crops becomes worse, so that the reflected energy of soil pixels contributes greatly to the spectrum of the potato canopy, making it difficult for spectral characteristic parameters to characterize the true AGB situation, thereby reducing the correlation between the two [39].
From the correlation of Figure 4, it is found that the correlation between FDS and AGB in each growth period is greater than that of CRS, which is consistent with the research results of Wang et al. [31], Fan et al. [41], and Chen et al. [52], and also shows that the correlation between FDS and AGB is higher, mainly because the interference of a part of the soil background can be eliminated through spectral differential transformation, the signal-to-noise ratio of canopy spectral information is improved, and the correlation with AGB is enhanced [32]. The correlation of Figure 9 shows that the correlation between the absorption valley parameter and AGB is greater than that of “four sides, one valley and one peak,” which is consistent with the research results of Fu et al. [34] and Han et al. [45]. This result is mainly attributed to the spectrum reflected from the potato canopy being unified into the same background through de-envelope line processing, which highlights the absorption and reflection characteristics of the crop canopy from the visible to the near-infrared and increases the difference in canopy spectrum in each plot, making it closely related to AGB. An analysis of the correlation results in Figure 11 shows that most vegetation indexes correlate very significantly with AGB, with TVI, RDVI, SAVI, and NDI having a higher correlation with AGB in each growth period than the other vegetation indexes, mainly because these four vegetation indexes are related to the radiation absorbed by crops, and solar radiation provides input energy for crop photosynthesis. Therefore, the photosynthetic radiation intercepted by crops is closely related to the production of crop dry weight (AGB), which increases the correlation between the four vegetation indexes and AGB [52].
Comparing the correlation analysis results of Figure 4, Figure 9 and Figure 11 shows that the vegetation index and AGB are most strongly correlated, followed by the spectral-location feature, and the spectral-reflectance feature is the most poorly correlated, which is consistent with the research results of Tao et al. [33] and Gong et al. [53]. This is because most of the vegetation indexes selected in this study combine the red and near-infrared bands, and previous studies show that the red–near-infrared band vegetation indexes are most effective for estimating AGB, so these vegetation indexes are more closely related to AGB [54,55]. Due to the unique absorption valley and reflection peak of vegetation, the characteristic parameters of spectral positions are closely related to the growth of potato crops. Therefore, these positions contain significant spectral information, which can also reflect the AGB [44]. When the spectral information is collected, the jitter of the sensor and interference due to the external reflected signal may cause the potato-canopy spectrum to deviate from the actual spectrum, in which case the analysis of correlations with AGB is insufficient to reflect the real situation of the AGB, which may reduce the correlation between (i) FDS and CRS and (ii) AGB [52].

4.2. Estimation of AGB Effect Based on Three Spectral Features

Ultralow-altitude UAV remote-sensing platforms have become the most frequently used technical tool for quantitative monitoring of AGB in precision agriculture due to their high mobility, affordable price, and simple operation [12,28,56]. At present, the sensors on the UAV remote sensing platform are mainly digital cameras, multispectral, hyperspectral, and lidar. Although the price of digital cameras and multispectral sensors is relatively low, they accept only a small number of bands, which limits the spectral information of the crop canopy that can be obtained, making it difficult to interpret the subtle differences between optical spectra. Data obtained by lidar are of high precision but too expensive, which limits its promotion and application for monitoring AGB of crops [40]. Hyperspectral sensors have a significant application potential for making rapid, nondestructive, and accurate estimates of crop AGB because of their high spectral resolution and their ability to obtain images and spectra simultaneously [57]. The estimation of AGB based on UAV hyperspectral image data takes three main forms: spectral-reflectance features [30], spectral-location features [34], and vegetation indexes [36]. Numerous research results only use one type of spectral variable as model-input parameters but fail to fully consider the continuity and diversity of canopy spectral information obtained by hyperspectral sensors, which may prevent the full use of hyperspectral data, thereby restricting the accuracy of the estimation model [50]. Therefore, in this study, the spectral-reflectance feature, spectral-position feature, vegetation index, and their combinations are used as model-input parameters and combined with different modeling methods. This approach allows the potato AGB to be estimated at each growth period (Figure 7, Figure 8, Figure 10, Figure 12 and Figure 13).
From the evaluation indicators of the estimation model in Figure 7, Figure 8, Figure 10, Figure 12 and Figure 13, the estimations based on the four variables in each growth period differ significantly, but the common point is that the estimations based on the four variables gradually improve from the budding period to the tuber-growth period before deteriorating. This trend is the same as that of the correlation between the model variables and AGB. When estimating potato AGB based on a single type of spectral parameters, the R2 of the model constructed with vegetation indexes as the variable are larger, and the RMSE and NRMSE are smaller (Figure 12), indicative of an improved estimate. The next-best estimates are based on spectral-location characteristic parameters (Figure 10), and the worst estimates are based on spectral-reflection characteristic parameters (Figure 7 and Figure 8), which is related to the correlation between the three spectral parameters and AGB (Figure 4, Figure 9 and Figure 11). When estimating AGB based on spectral-reflection characteristics, the estimation based on FDS is significantly more accurate than that based on CRS, which is consistent with the results of Acquach et al. [57]. This result is mainly because processing hyperspectral data through first-order differentiation refines the spectral information and deeply mines the information hidden in the spectrum, in addition to expanding the selection space of the characteristic wavelength [19]. When estimating AGB based on spectral position features, R2 of the estimation model in each growth period increases significantly, and the RMSE and NRMSE decrease, which is consistent with the research results of Sun et al. [58]. However, the accuracy of the estimation model constructed in this study for each growth period is slightly low, which is mainly because the estimated physical and chemical parameters differ. The goal of this study is estimating potato AGB, while the goal of Sun et al. was the total nitrogen content of cotton leaves. The second reason is that different types of sensors are used. In this study, the UAV was equipped with a UHD 185 sensor that was used to obtain the spectral data of the field canopy, whereas Sun et al. obtained their spectrum by using an ASD spectrometer in an artificial backpack. The range of field angle and the interference of the environment are easy to control when collecting the data, and the final measurement result is the weighted mean of the many collected spectra. When estimating AGB based on a vegetation index, the estimation model for each growth period is more accurate than the model based on spectral reflection characteristics and spectral position characteristics, which is consistent with the results of Yang et al. [46] and Kang et al. [50], mainly because the vegetation index combines two or more narrow bands in a certain mathematical way, eliminating or reducing the impact of the background and enhancing the vegetation information [11,12]. At the same time, it is the most effective factor for estimating AGB [52]. In this study, taking full account of the diversity of spectral data, three spectral features are combined into a new data set, and the same method is used to estimate the potato AGB for each growth period (Figure 13). Given the same conditions, the R2 constructed for each growth period is maximal, the RMSE and NRMSE are minimal, and the estimation is the most accurate, which confirms that the accuracy of AGB estimates can be improved by using multiple types of variables from hyperspectral images, thereby compensating for a lack of single-variable estimation accuracy.

4.3. Estimation of AGB Based on Different Variable-Screening Methods

Significant progress has been made in estimating the AGB of winter wheat [33], cotton [58], corn [59], rice [60], soybean [61], and other crops based on UAV hyperspectral image data. However, few reports are available for estimating potato AGB over multiple growth periods. At the same time, most of these studies seek an appropriate vegetation index as the model-input parameter but do not explore how the introduction of new variables affects AGB estimates. Due to the wide spectral range and high spectral resolution of hyperspectral data, rich crop canopy spectral information is obtained. If only vegetation indexes are used to estimate AGB, more sensitive spectral variables may be missed, thereby limiting the accuracy of the estimation model [50]. At the same time, most studies choose the model parameters according to the correlation between the spectral variables and AGB, which leads to the subjective determination of the number of parameters input into the model, thereby preventing an optimal estimation model. Therefore, to better estimate the potato AGB for each growth period, we select three characteristic spectral parameters as the model-input parameters, and the MWPLS, MC-UVE, and RF methods are used to optimize and screen the model parameters of each growth period. Finally, taking the value of RMSECV, RI, and SP as the standard, we determine the optimized model variables for each growth period and estimate the potato AGB (Figure 7, Figure 8, Figure 10, Figure 11, Figure 13, Figure 14 and Figure 15).
Based on different spectral characteristics in each growth period, MWPLS, MC-UVE, and RF methods are used to screen variables, and the final models constructed differ significantly in accuracy. However, under the same conditions, the variables obtained by the RF method prove to be the best to estimate AGB, followed by the MC-UVE method, whereas the variables obtained by the MWPLS method are the worst for estimating AGB. This is because the variables screened by the RF method have a wide span, weak autocorrelation between variables, and rich information, Therefore, the accuracy of the model is high, which is consistent with the results of Sun et al. [58]. The performance of the MWPLS method is the worst, mainly because the variables selected by this method are related to the size of the moving window, and the selected variables have strong autocorrelation, which reduces the accuracy of the estimation model, making it consistent with the results of Yang et al. [62]. According to the results in Figure 6 and Table 3 and Table 4, the number of variables screened by the RF method and based on the three spectral characteristics is less than the number produced by MWPLS and MC-UVE, but the model constructed in the former case remains the most accurate, indicating that this method may serve to eliminate the “while removing uncorrelated variables”, and it can significantly improve the predictive ability and robustness of the AGB estimation model [49]. When using the three variable-screening methods to optimize the spectral-reflectance features, it was found that the final model parameters were mainly located in the position of “four sides, one valley, and one peak” (Figure 6), indicating that these spectral positions contain more information related to potato AGB, which allows for better AGB estimates [32]. When using the same method to screen sensitive model parameters for spectral-location features, the probability of selecting absorption valley parameters to estimate AGB in each growth period is greater than that of the location parameters in “four sides, one valley, and one peak” (Table 3), mainly because the difference in potato-canopy absorption characteristics is more prominent and more potential information may be mined after the continuum-removing transformation, which enhances the differential characteristics of spectral curves of different AGB contents, thereby improving the correlation with AGB [46]. When the MWPLS, MC-UVE, and RF methods are used to screen the vegetation index, NDVI, SIPI, NDRE, and WDRVI have a high probability of being selected by the three methods (Table 4), indicating that these vegetation indexes play an important role in the estimation of potato AGB. This is consistent with the conclusions of Tao et al. [33] and Liu et al. [63], who report that these vegetation indexes are important parameters for estimating AGB.

4.4. Estimation of AGB Based on Different Modeling Methods

In this study, MWPLS, MC-UVE, and RF methods are used to optimize and screen the spectral-reflectance features, spectral-location features, and vegetation indexes of potatoes for each growth stage and then combine with PLSR and GPR methods to construct potato AGB estimation models and finally obtain the R2, RMSE, and NRMSE of each model (Figure 7, Figure 8, Figure 10 and Figure 12). The results show that, given the same variable, although the estimation models constructed by PLSR and GPR methods for each growth period differ significantly, they trend from good to bad upon going from the budding period to the starch-accumulation period, which is the same trend seen in the correlation between the model parameters and AGB (Figure 4, Figure 9 and Figure 11). Comparing and analyzing how the PLSR and GPR methods affect AGB estimates based on three spectral variables show that the modeling and verification results obtained by the two methods are similar. If R2 is large, the RMSE and NRMSE are smaller, indicating that the two methods used to build AGB estimation models are reliable and stable [50,64]. Based on three spectral variables, we find that the PLSR method is better than the GPR method for estimating the AGB, which indicates that the PLSR method can effectively improve the AGB estimation accuracy. This is because the PLSR method reduces the dimensions and decomposes the data according to the number of input samples. The estimation model is established after the optimal principal component, which effectively solves the problem of collinearity between variables [37]; the problem of collinearity between variables in the GPR model reduces the prediction accuracy and stability of the model [64].
Analyzing the accuracy indicators of each model (Figure 7, Figure 8, Figure 10 and Figure 12) shows that the model constructed by RF-PLSR method in each growth period is the most accurate. The best R2 based on spectral-reflection characteristics is 0.49, 0.53, 0.57, and 0.50, and the NRMSE is 29.69%, 23.88%, 21.68%, and 24.19%, which is lower than the accuracy obtained by Sun et al. [65] using this method to estimate the chlorophyll content in potato leaves. The main reasons for this discrepancy are that the physical and chemical parameters estimated by the two approaches differ, and the types of sensors used to collect spectral information differ. In this study, the data were obtained in the field by the UAV platform equipped with a UHD 185 imaging spectrometer, whereas Sun et al. studied data obtained by a Gaia hyperspectral imaging system on a closed laboratory platform. In addition, to monitor the AGB potato canopy plants, Sun et al. used only single leaves as targets to estimate crop parameters. The best R2 values obtained based on the spectral-location features are 0.52, 0.54, 0.63, and 0.53, and the NRMSE values are 25.92%, 20.77%, 18.87%, and 21.33%, which is more accurate than the results of Tao et al. [33] for estimating the AGB of winter wheat over multiple growth periods with red-edge parameters, mainly because this study extracts all the location parameters related to crop growth in the region “four sides, one valley, and one peak” (Table 1). At the same time, the continuum division method serves to analyze the band depth of the two absorption valleys (Figure 3), which increases the diversity of spectral parameters. The best R2 values for models based on vegetation indexes are 0.54, 0.64, 0.67, and 0.60 and the corresponding NRMSE values are 23.59%, 18.83%, 17.42%, and 19.63%, which is consistent with the accuracy of crop AGB estimated by Hansen et al. [20] and Liu et al. [63], mainly because the vegetation index selected in this study also includes important model parameters such as NDVI, SIPI, NDRE, and WDRVI.
In this study, by fully considering the diversity of hyperspectral data, three spectral characteristic variables are formed into a new data set to estimate the potato AGB for each growth period. The results show that the accuracy of the models established by PLSR and GPR methods increase significantly (Figure 13), and the model constructed by the PLSR method is more accurate and stable (Figure 13, Figure 14 and Figure 15). R2 values for the estimation models for each growth period are 0.65, 0.68, 0.72, and 0.67, and NRMSE values are 19.76%, 16.01%, 15.04%, and 16.84%, respectively, which is consistent with the results of Fan et al. [42], who used a variety of hyperspectral data variables to improve the nitrogen content of summer maize. Future studies should focus on considering the fusion of image features and spectral features for AGB estimation, and test the accuracy of models for each reproductive period at different locations and times.

5. Conclusions

The use of imaging hyperspectral sensors on the UAV platform has great potential for crop AGB monitoring because it allows convenient and fast data acquisition and high spectral and spatial resolution, all at a reasonable price. In view of the continuity and diversity of hyperspectral data, this study extracts spectral-reflectance feature parameters, spectral-location feature parameters, and vegetation indexes. Based on an analysis of the correlation between these parameters and AGB, and to reduce data redundancy and improve the stability of the model, the MWPLS, MC-UVE, and RF methods are used to optimize and screen the spectral parameters to ensure a significant correlation. Finally, these are combined with PLSR and GPR methods to estimate the potato AGB at the budding period, tuber-formation period, tuber-growth period, and starch-accumulation period.
The results show that the vegetation index has the strongest correlation during each growth period and AGB, followed by the spectral-position feature parameter, and then by the spectral-reflectance feature parameter. The change trend of correlation first increases and then deteriorates from the budding stage to starch-accumulation period. When estimating AGB based on different spectral characteristics in each growth period, the variables screened by the RF method are the best, followed by those screened by the MC-UVE method, whereas those screened by the MWPLS method are the worst. When estimating AGB based on a given variable for each growth period, the estimation model obtained by using the PLSR method is more accurate than that obtained by using the GPR method. However, the models constructed by the two methods and the correlations between the model parameters and AGB remain the same: both go from good to bad as the budding stage progresses to the starch-storage period. The model constructed from the comprehensive variables is the most accurate, followed by the model constructed from the vegetation indexes, the spectral-position feature parameters, and the spectral-reflection feature parameters. The RF-PLSR method is optimal for estimating AGB in each growth period based on comprehensive variables, with R2 = 0.65, 0.68, 0.72, and 0.67, and NRMSE = 19.76%, 16.01%, 15.04%, and 16.84%, respectively.

Author Contributions

H.F., Y.L., G.Y. and J.Y. designed the experiments. H.F., Z.F. and Y.F. collected the AGB and UAV hyperspectral images. Y.L. and H.F. analyzed the data and wrote the manuscript. X.J. and Z.L. made comments and revised the manuscript. All authors have read and agreed to the published version of the manuscript.

Funding

This study was supported by the Key Scientific and Technological Projects of Heilongjiang Province (2021ZXJ05A05), the National Natural Science Foundation of China (41601346), the Platform Construction Funded Program of Beijing Academy of Agriculture and Forestry Sciences (No. PT2022-24), and the Key Field Research and Development Program of Guangdong Province (2019B020216001).

Acknowledgments

We thank Bo Xu, Hong Chang, Weiguo Li, Yang Meng and Yu Zhao for field management and data collection. We thank the National Precision Agriculture Experiment Station for providing the test site and employees.

Conflicts of Interest

The authors declare no conflict of interest.

References

  1. Banerjee, B.P.; Spangenberg, G.; Kant, S. Fusion of spectral and structural information from aerial images for improved biomass estimation. Remote Sens. 2020, 12, 3164. [Google Scholar] [CrossRef]
  2. Banerjee, B.P.; Raval, S.; Cullen, P.J. UAV-hyperspectral imaging of spectrally complex environments. Int. J. Remote Sens. 2020, 41, 4136–4159. [Google Scholar] [CrossRef]
  3. Yang, Y.; Liu, B.M.; Ni, X.Y.; Tao, L.Z.; Yu, L.X.; Yang, Y.; Feng, M.X.; Zhong, W.J.; Wu, Y.J. Rice productivity and profitability with slow-release urea containing organic-inorganic matrix materials. Pedosphere 2021, 31, 511–520. [Google Scholar] [CrossRef]
  4. Morier, T.; Cambouris, A.N.; Chokmani, K. In-season nitrogen status assessment and yield estimation using hyperspectral vegetation indices in a potato crop. Agron. J. 2015, 107, 1295–1309. [Google Scholar] [CrossRef]
  5. Mahlein, A.K.; Rumpf, T.; Welke, P.; Dehne, H.W.; Plumer, L.; Steiner, U.; Oerke, E.C. Development of spectral indices for detecting and identifying plant diseases. Remote Sens. Environ. 2013, 128, 21–30. [Google Scholar] [CrossRef]
  6. Thenkabail, P.S.; Smith, R.B.; Pauw, E.D. Hyperspectral vegetation indices and their relationships with agricultural crop characteristics. Remote Sens. Environ. 2000, 71, 158–182. [Google Scholar] [CrossRef]
  7. Kumar, A.; Tewari, S.; Sing, H.; Kumar, P.; Kumar, N.; Bisht, S.; Devi, S. Biomass accumulation and carbon stock in different agroforestry systems prevalent in the Himalayan foothills, India. Curr. Sci. 2021, 120, 1083–1088. [Google Scholar] [CrossRef]
  8. Virlet, N.; Sabermanesh, K.; Sadeghi, P.; Hawkesford, M.J. Field Scanalyzer: An automated robotic field phenotyping platform for detailed crop monitoring. Funct. Plant Biol. 2016, 44, 143–153. [Google Scholar] [CrossRef] [Green Version]
  9. Zhang, H.Y.; Du, H.Y.; Zhang, C.K.; Zhang, L.P. An automated early-season method to map winter wheat using time-series Sentinel-2 data: A case study of Shandong, China. Comput. Electron. Agric. 2021, 182, 105962–105977. [Google Scholar] [CrossRef]
  10. Huang, J.X.; Sedano, F.; Huang, Y.B.; Ma, H.Y.; Li, X.L.; Liang, S.L.; Tian, L.Y. Assimilating a synthetic Kalman filter leaf area index series into the WOFOST model to improve regional winter wheat yield estimation. Agric. For. Meteorol. 2016, 216, 188–202. [Google Scholar] [CrossRef]
  11. Tao, H.L.; Feng, H.K.; Xu, L.J.; Miao, M.K.; Yang, G.J.; Yang, X.D. Estimation of the yield and plant height of winter wheat using UAV-based hyperspectral images. Sensors 2020, 20, 1231. [Google Scholar] [CrossRef] [PubMed] [Green Version]
  12. Yue, J.B.; Feng, H.K.; Yang, G.J.; Li, Z.H. A comparison of regression techniques for estimation of above-ground winter wheat biomass using near-surface spectroscopy. Remote Sens. 2018, 10, 66. [Google Scholar] [CrossRef] [Green Version]
  13. Zhang, C.; Kovacs, J.M. The application of small unmanned aerial systems for precision agriculture: A review. Precis. Agric. 2012, 13, 693–712. [Google Scholar] [CrossRef]
  14. Yu, N.; Li, L.; Schmitz, N.; Tian, L.F.; Greenberg, J.A.; Diers, B.W. Development of methods to improve soybean yield estimation and predict plant maturity with an unmanned aerial vehicle based platform. Remote Sens. Environ. 2016, 187, 91–101. [Google Scholar] [CrossRef]
  15. Lydia, S.; Iolanda, F.; Josep, P. Remote sensing of biomass and yield of winter wheat under different nitrogen supplies. Crop Sci. 2000, 40, 723–731. [Google Scholar] [CrossRef] [Green Version]
  16. David, A.J.; Hernan, D.B.; Jocelyn, C. Graph-based data fusion applied to: Change detection and biomass estimation in rice crops. Remote Sens. 2020, 12, 2683. [Google Scholar] [CrossRef]
  17. Kanemasu, E.T. Seasonal canopy reflectance patterns of wheat, sorghum, and soybean. Remote Sens. Environ. 1974, 3, 43–47. [Google Scholar] [CrossRef]
  18. Kooistra, L.; Clevers, J.W. Estimating potato leaf chlorophyll content using ratio vegetation indices. Remote Sens. Lett. 2016, 7, 611–620. [Google Scholar] [CrossRef] [Green Version]
  19. Daughtry, C.T.; Walthall, C.L.; Kim, M.S.; Colstoun, E.B.; Mcmurtrey, J.E. Estimating corn leaf chlorophyll concentration from leaf and canopy reflectance. Remote Sens. Environ. 2000, 74, 229–239. [Google Scholar] [CrossRef]
  20. Poley, L.G.; McDermid, G.J. A systematic review of the factors influencing the estimation of vegetation aboveground biomass using unmanned aerial systems. Remote Sens. 2020, 12, 1052. [Google Scholar] [CrossRef]
  21. Behmann, J.; Mahlein, A.K.; Rumpf, T.; Romer, C.; Plumer, L. A review of advanced machine learning methods for the detection of biotic stress in precision crop protection. Precis. Agric. 2015, 16, 239–260. [Google Scholar] [CrossRef]
  22. Andres, V.; Gitelson, A.A.; Nguy-Robertson, A.L.; Peng, Y. Comparison of different vegetation indices for the remote assessment of green leaf area index of crops. Remote Sens. Environ. 2011, 115, 3468–3478. [Google Scholar] [CrossRef]
  23. Melian, J.M.; Jimenez, A.; Diaz, M.; Morales, A.; Horstrand, P.; Guerra, R.; Lopez, S. Real-time hyperspectral data transmission for UAV-based acquisition platform. Remote Sens. 2021, 13, 850. [Google Scholar] [CrossRef]
  24. Guerra, R.; Lopez, S.; Sarmiento, R. A computationally efficient algorithm for fusing multispectral and hyperspectral images. IEEE Trans. Geosci. Remote Sens. 2016, 54, 5712–5728. [Google Scholar] [CrossRef]
  25. Guo, A.T.; Huang, W.J.; Dong, Y.Y.; Ye, H.C.; Ma, H.Q.; Liu, B. Wheat yellow rust detection using UAV-based hyperspectral technology. Remote Sens. 2021, 13, 123. [Google Scholar] [CrossRef]
  26. Li, C.C.; Ma, C.Y.; Cui, Y.Q.; Lu, G.Z. UAV hyperspectral remote sensing estimation of soybean yield based on physiological and ecological parameter and meteorological factor in China. J. Indian Soc. Remote Sens. 2021, 49, 873–886. [Google Scholar] [CrossRef]
  27. Liu, T.; Shi, T.Z.; Zhang, H.; Wu, C. Detection of rise damage by leaf folder (Cnaphalocrocis medinalis) using unmanned aerial vehicle based hyperspectral data. Sustainability 2020, 12, 9343. [Google Scholar] [CrossRef]
  28. Pugh, N.A.; Horne, D.W.; Murray, S.C.; Carvalho, G.; Malambo, L.; Jung, J.H. A Temporal estimates of crop growth in sorghum and maize breeding enabled by unmanned aerial systems. Plant Phenome J. 2017, 28, 170006–170016. [Google Scholar] [CrossRef]
  29. Astor, T.; Dayananda, S.; Nautiyal, S. Vegetable crop biomass estimation using hyperspectral and RGB 3D UAV data. Agronomy 2020, 10, 1600. [Google Scholar] [CrossRef]
  30. Wang, Y.; Li, F.L.; Wang, W.D.; Chen, X.K.; Chang, Q.R. Hyperspectral remote sensing of shoot biomass of winter wheat based on SPA and transformation spectra. J. Triticeae Crops 2020, 40, 1389–1398. [Google Scholar] [CrossRef]
  31. Jia, M.; Li, W.; Wang, K.; Zhou, C.; Cheng, T.; Tian, Y.; Zhu, Y.; Cao, W. A newly developed method to extract the optimal hyperspectral feature for monitoring leaf biomass in wheat. Comput. Electron. Agric. 2019, 165, 104942. [Google Scholar] [CrossRef]
  32. Kong, Q.M.; Su, Z.B.; Shen, W.Z.; Zhang, B.F.; Wang, J.B.; Ji, N. Research of straw biomass based on NIR by wavelength selection of IPLS-SPA. Spectrosc. Spectr. Anal. 2015, 35, 1233–1238. [Google Scholar] [CrossRef]
  33. Tao, H.L.; Feng, H.K.; Xu, X.J.; Miao, M.K.; Long, H.L.; Yue, J.B.; Li, Z.H. Estimation of crop growth parameters using UAV-based hyperspectral remote sensing data. Sensors 2020, 20, 1296. [Google Scholar] [CrossRef] [PubMed] [Green Version]
  34. Fu, Y.Y.; Wang, J.H.; Yang, G.J.; Song, X.Y.; Xu, X.G.; Feng, H.K. Band depth analysis and partial least square regression based winter wheat biomass estimation using hyperspectral measurements. Spectrosc. Spectr. Anal. 2013, 33, 1315–1319. [Google Scholar] [CrossRef]
  35. Gnyp, M.L.; Bareth, G.; Li, F.; Lenz-Wiedemann, V.S.; Koppe, W.G.; Miao, Y.X.; Hennig, S.D. Development and implementation of a multiscale biomass model using hyperspectral vegetation indices for winter wheat in the North China Plain. Int. J. Appl. Earth Obs. Geoinf. 2014, 33, 232–242. [Google Scholar] [CrossRef]
  36. Jin, X.L.; Li, Z.H.; Feng, H.K.; Ren, Z.B.; Li, S.K. Estimation of maize yield by assimilating biomass and canopy cover derived from hyperspectral data into the Aqua Crop model. Agric. Water Manag. 2019, 227, 105846–105856. [Google Scholar] [CrossRef]
  37. Hansen, P.M.; Schjoerring, J.K. Reflectance measurement of canopy biomass and nitrogen status in wheat crops using normalized difference vegetation indices and partial least squares regression. Remote Sens. Environ. 2003, 86, 542–553. [Google Scholar] [CrossRef]
  38. Liu, C.; Liu, Y.; Lu, Y.H.; Liao, Y.L.; Nie, J.; Yuan, X.L. Use of a leaf chlorophyll content index to improve the prediction of above-ground biomass and productivity. PeerJ 2019, 6, 6240–6255. [Google Scholar] [CrossRef] [Green Version]
  39. Liu, Y.; Feng, H.K.; Yue, J.B.; Li, Z.H.; Yang, G.J. Remote-sensing estimation of potato above-ground biomass based on spectral and spatial features extracted from high-definition digital camera images. Comput. Electron. Agric. 2022, 198, 107089–107099. [Google Scholar] [CrossRef]
  40. Li, T.S.; Zhu, Z.; Cui, J.; Chen, J.H.; Shi, X.Y.; Zhao, X. Monitoring of leaf nitrogen content of winter wheat using multi-angle hyperspectral data. Int. J. Remote Sens. 2021, 42, 4676–4696. [Google Scholar] [CrossRef]
  41. Arroyo-Mora, J.P.; Kalacska, M.; Loke, T.; Schlapfer, D.; Coops, N.C.; Lucanus, O. Assessing the impact of illumination on UAV pushbroom hyperspectral imagery collected under various cloud cover conditions. Remote Sens. Environ. 2021, 258, 112396–112410. [Google Scholar] [CrossRef]
  42. Fan, L.L.; Zhao, J.L.; Xu, X.G.; Liang, D.; Yang, G.J.; Feng, H.K.; Yang, H. Hyperspectral-based estimation of leaf nitrogen content in corn using optimal selection of multiple spectral variables. Sensors 2019, 19, 2898. [Google Scholar] [CrossRef] [PubMed] [Green Version]
  43. Marabel, M.; Alvarez-Taboada, F. Spectroscopic determination of aboveground biomass in grasslands using spectral transformations, support vector machine and partial least squares regression. Sensors 2014, 13, 10027. [Google Scholar] [CrossRef] [PubMed] [Green Version]
  44. Kokaly, R.F.; Clark, R.N. Spectroscopic determination of leaf biochemistry using band-depth analysis of absorption features and stepwise multiple linear regression. Remote Sens. Environ. 1999, 67, 267–287. [Google Scholar] [CrossRef]
  45. Han, X.; Wong, Y.S.; Song, M.H.; Tam, N.Y. Feasibility of using microalgal biomass cultured in domestic wastewater for the removal of chromium pollutants. Water Environ. Res. 2008, 80, 647–653. [Google Scholar] [CrossRef]
  46. Yang, H.B.; Li, F.; Wang, W.; Yu, K. Estimating above-ground biomass of potato using random forest and optimized hyperspectral indices. Remote Sens. 2021, 13, 2339. [Google Scholar] [CrossRef]
  47. Zhe, L.; Lee, Y.S.; Chen, J.H.; Qian, Y.W. Developing variable moving window PLS models: Using case of NOx emission prediction of coal-fired power plants. Fuel 2021, 296, 120441–120457. [Google Scholar] [CrossRef]
  48. Zhang, J.; Cui, X.Y.; Cai, W.S.; Shao, X.G. A variable importance criterion for variable selection in near-infrared spectral analysis. Sci. China Chem. 2019, 62, 271–279. [Google Scholar] [CrossRef]
  49. Fan, N.Y.; Liu, G.S.; Zhang, J.J.; Zhang, C.; Yuan, R.R.; Ban, J.J. Hyperspectral model optimization for protein of tan mutton based on Box-Behnken. Spectrosc. Spectr. Anal. 2021, 41, 918–923. [Google Scholar] [CrossRef]
  50. Kang, X.Y.; Zhang, A.W.; Pang, H.Y. Estimation of grassland above ground biomass from UAV-mounted hyperspectral image by optimized spectral reconstruction. Spectrosc. Spectr. Anal. 2021, 41, 250–256. [Google Scholar] [CrossRef]
  51. Verrelst, J.; Rivera, J.P.; Gitelson, A.; Delegido, J.; Moreno, J.; Camps-Valls, G. Spectral band selection for vegetation properties retrieval using Gaussian processes regression. Int. J. Appl. Earth Obs. Geoinf. 2016, 52, 554–567. [Google Scholar] [CrossRef]
  52. Chen, J.; Gu, S.; Shen, M.G.; Tang, Y.H.; Matsushita, B. Estimating above ground biomass of grassland having a high canopy cover: An exploratory analysis of in situ hyperspectral data. Int. J. Remote Sens. 2009, 30, 6497–6517. [Google Scholar] [CrossRef]
  53. Gong, Z.; Kawamura, K.; Ishikawa, N.; Inaba, M.; Alateng, D. Estimation of herbage biomass and nutritive status using band depth features with partial least squares regression in Inner Mongolia grassland, China. Grassl. Sci. 2016, 62, 45–54. [Google Scholar] [CrossRef]
  54. Cho, M.A.; Skidmore, A.; Corsi, F.; Sobhan, I. Estimation of green grass/herb biomass from airborne hyperspectral imagery using spectral indices and partial least squares regression. Int. J. Appl. Earth Obs. Geoinf. 2007, 9, 414–424. [Google Scholar] [CrossRef]
  55. Fu, Y.Y.; Yang, G.J.; Wang, J.; Feng, H.K.; Xu, B. Winter wheat biomass estimation based on spectral indices, band depth analysis and partial least squares regression using hyperspectral measurements. Comput. Electron. Agric. 2014, 100, 51–59. [Google Scholar] [CrossRef]
  56. Niu, Y.X.; Zhang, L.Y.; Zhang, H.H.; Han, W.T.; Peng, X.S. Estimating above-ground biomass of maize using features derived from UAV-based RGB imagery. Remote Sens. 2019, 11, 1261. [Google Scholar] [CrossRef] [Green Version]
  57. Acquach, G.E.; Via, B.K.; Fasina, O.; Eckhardt, L.G. Non-destructive prediction of the properties of forest biomass for chemical and bioenergy applications using near infrared spectroscopy. J. Near Infrared Spectrosc. 2015, 23, 93–102. [Google Scholar] [CrossRef]
  58. Sun, L.; Chen, X.; Wu, J.J.; Feng, X.W.; Bao, A.M.; Ma, Y.Q. Study on the biomass change derived from the hyperspectral data of cotton leaves in canopy under moisture stress. Chin. Sci. Bull. 2006, 51, 173–178. [Google Scholar] [CrossRef]
  59. Li, C.C.; Cui, Y.Q.; Ma, C.Y.; Niu, Q.L.; Li, J.B. Hyperspectral inversion of maize biomass coupled with plant height data. Crop Sci. 2021, 61, 2067–2079. [Google Scholar] [CrossRef]
  60. Kanke, Y.; Tubana, B.; Dalen, M.; Harrell, D. Evaluation of red and red-edge reflectance-based vegetation indices for rice biomass and grain yield prediction models in paddy fields. Precis. Agric. 2016, 17, 507–530. [Google Scholar] [CrossRef]
  61. Akhtar, K.; Wang, W.Y.; Khan, A.; Ren, G.X.; Afridi, M.Z.; Feng, Y.Z. Wheat straw mulching offset soil moisture deficient for improving physiological and growth performance of summer sown soybean. Agric. Water Manag. 2019, 211, 16–25. [Google Scholar] [CrossRef]
  62. Yang, B.H.; Chen, J.L.; Chen, L.H.; Cao, W.X.; Yao, X.; Zhu, Y. Estimation model of wheat canopy nitrogen content based on sensitive bands. Trans. Chin. Soc. Agric. Eng. 2015, 31, 176–182. [Google Scholar] [CrossRef]
  63. Liu, Y.; Feng, H.K.; Huang, J.; Yang, F.Q.; Wu, Z.C.; Sun, Q.; Yang, G.J. Estimation of potato above-ground biomass based on hyperspectral characteristic parameters of UAV and plant height. Spectrosc. Spectr. Anal. 2021, 41, 903–911. [Google Scholar] [CrossRef]
  64. Fu, Y.Y.; Yang, G.J.; Li, Z.H.; Song, X.Y.; Li, Z.H.; Xu, X.G.; Wang, P.; Zhao, C.J. Winter wheat nitrogen status estimation using UAV-based RGB imagery and Gaussian processes regression. Remote Sens. 2020, 12, 3778. [Google Scholar] [CrossRef]
  65. Sun, H.; Zheng, T.; Liu, N.; Li, M.Z.; Zhang, Q. Vertical distribution of chlorophyll in potato plants based on hyperspectral imaging. Trans. Chin. Soc. Agric. Eng. 2018, 34, 149–156. [Google Scholar] [CrossRef]
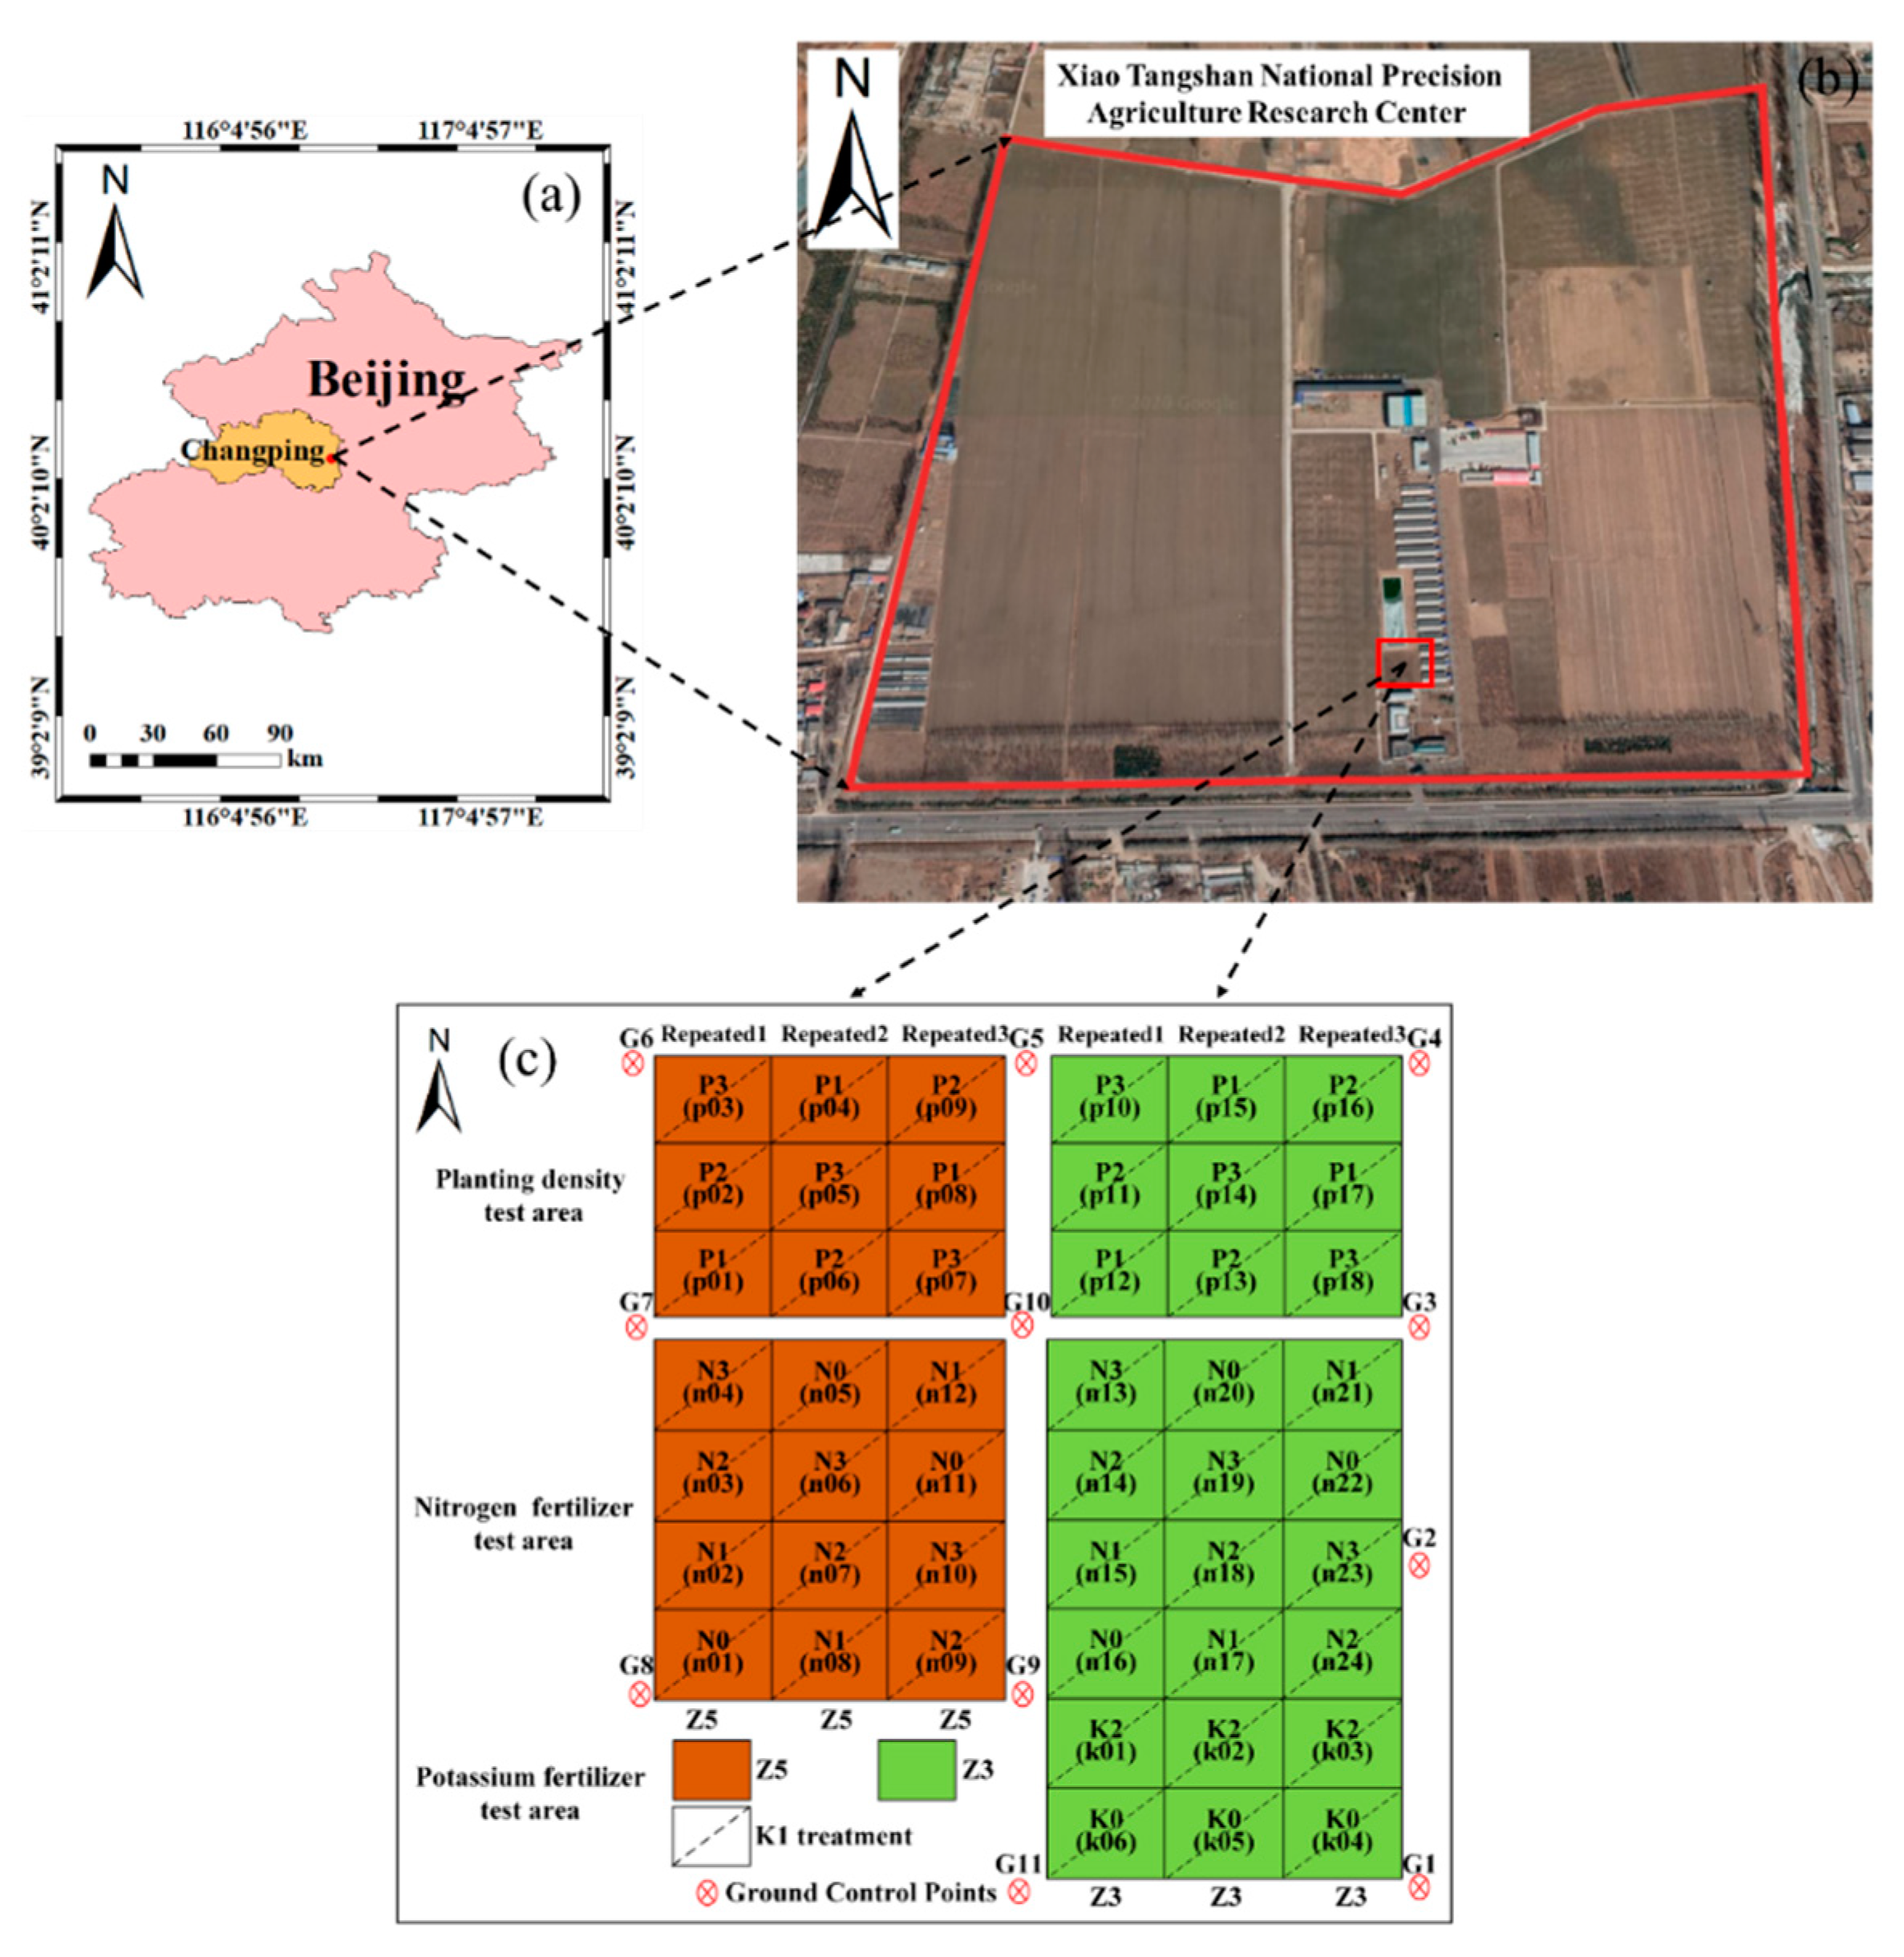
Figure 1. Location and design of experimental area: (a) location of Changping District in Beijing, (b) Xiao Tangshan National Precision Agriculture Research Center, (c) P1, P2, and P3 represent planting density treatments of 60,000, 72,000, and 84,000 plants/hm2, respectively. N0, N1, N2, and N3 represent nitrogen fertilization treatments of 0, 244.65, 489.15, and 733.50 kg/hm2, respectively. K0, K1, and K2 represent potassium fertilization treatments of 0, 970.50, and 1941 kg/hm2, respectively.
Remotesensing 14 05121 g001
Figure 2. Canopy spectral-reflectance curves of potatoes in each growth period before and after SG filtering: (a,c) Z5 potatoes, (b,d) Z3 potatoes.
Remotesensing 14 05121 g002
Figure 3. Potato canopy continuous removal spectra. V1 and V2 are two absorption valleys, DP1 is the first absorption depth, W2 is the second absorption width, A2 is the second absorption area, and SL2 and SR2 are the left and right slopes of the second absorption valley, respectively.
Remotesensing 14 05121 g003
Figure 4. Correlation coefficients between CRS, FDS and AGB at various potato-growth periods: (a) bud period, (b) tuber-formation period, (c) tuber-growth period, (d) starch-storage period.
Remotesensing 14 05121 g004
Figure 5. Determination of the influential spectra features in the AGB estimation of potatoes based on the CRS and FDS at the bud period, tuber-formation period, tuber-growth period, starch-storage period. (a,d) Cross-validation RMSEcv statistics using MWPLS based on CRS and FDS, respectively. (b,e) Reliability index statistics using MC-UVE based on CRS and FDS, respectively. (c,f) Selection probability statistics using RF based on CRS and FDS, respectively.
Remotesensing 14 05121 g005
Figure 6. Distribution of wavelengths based on CRS and FDS using three wavelength-screening methods for potatoes for each growth period. (a,d) Characteristic wavelength distribution using MWPLS based on CRS and FDS, respectively. (b,e) Characteristic wavelength distribution using MC-UVE based on CRS and FDS, respectively. (c,f) Characteristic wavelength distribution using RF based on CRS and FDS, respectively.
Remotesensing 14 05121 g006
Figure 7. Accuracy of estimating AGB based on the feature variables screened from CRS by MWPLS, MC-UVE and RF. (ac) The R2, RMSE (kg/hm2) and NRMSE (%) of AGB was estimated using the PLSR method. (df) The R2, RMSE (kg/hm2) and NRMSE (%) of AGB was estimated using the GPR method.
Remotesensing 14 05121 g007
Figure 8. Accuracy of estimating AGB based on the feature variables screened from FDS by MWPLS, MC-UVE and RF. (ac) The R2, RMSE (kg/hm2) and NRMSE (%) of AGB was estimated using the PLSR method. (df) The R2, RMSE (kg/hm2) and NRMSE (%) of AGB was estimated using the GPR method.
Remotesensing 14 05121 g008
Figure 9. Correlation coefficients of spectral-position features for measured potato AGB at bud period, tuber-formation period, tuber-growth period, and starch-storage period.
Remotesensing 14 05121 g009
Figure 10. Accuracy of estimating AGB based on the feature variables screened from spectral-position parameters by MWPLS, MC-UVE and RF. (ac) The R2, RMSE (kg/hm2) and NRMSE (%) of AGB were estimated using the PLSR method. (df) The R2, RMSE (kg/hm2) and NRMSE (%) of AGB were estimated using the GPR method.
Remotesensing 14 05121 g010
Figure 11. Correlation coefficients of vegetation indexes with measured potato AGB at bud period, tuber-formation period, tuber-growth period, and starch-storage period.
Remotesensing 14 05121 g011
Figure 12. Accuracy of estimating AGB based on the feature variables screened from vegetation indexes by MWPLS, MC-UVE and RF. (ac) The R2, RMSE (kg/hm2) and NRMSE (%) of AGB was estimated using the PLSR method. (df) The R2, RMSE (kg/hm2) and NRMSE (%) of AGB was estimated using the GPR method.
Remotesensing 14 05121 g012
Figure 13. Accuracy of estimating AGB based on the feature variables screened from composite variables by MWPLS, MC-UVE and RF. (ac) The R2, RMSE (kg/hm2) and NRMSE (%) of AGB was estimated using the PLSR method. (df) The R2, RMSE (kg/hm2) and NRMSE (%) of AGB was estimated using the GPR method.
Remotesensing 14 05121 g013
Figure 14. Scatter plots between measured and predicted values of potato AGB (kg/hm2) for modeling and verification data sets using PLSR-based composite variables screened by MWPLS, MC-UVE, and RF at different growth periods. (ad) Relationship between measured and predicted values of potato AGB based on MWPLS-PLSR for bud period, tuber-formation period, tuber-growth period, and starch-storage period, respectively. (eh) Same as panels (ad) but based on MC-UVE-PLSR. (il) show the same as panels (ad) but based on RF-PLSR.
Remotesensing 14 05121 g014
Figure 15. Scatter plots between measured and predicted values of potato AGB (kg/hm2) for modeling and verification data sets using GPR-based composite variables by MWPLS, MC-UVE, and RF at different growth periods. (ad) Relationship between measured and predicted values of potato AGB based on MWPLS-GPR for bud period, tuber-formation period, tuber-growth period, and starch-storage period, respectively. (eh) Same as panels (ad) but based on MC-UVE-PLSR. (il) show the same as panels (ad) but based on RF-GPR.
Remotesensing 14 05121 g015
Table 1. Spectral position characteristic parameters.
Parameter NamesVariablesDefinition and Description
Absorption valley depthDPThe distance from the lowest point of the absorption valley to the baseline
Absorption valley areaAAbsorption valley integration of continuous removal spectra
Absorption valley widthWDistance on either side of the absorption valley at half the depth
Slope of the left side of the absorption valleySLSlope of the line connecting the starting point on the left side of the absorption valley with the bottom point of the absorption valley
Slope of the right side of the absorption valleySRThe slope of the line connecting the starting point on the right side of the absorption valley with the bottom point of the absorption valley
Green edge amplitudeDgMaximum value of the 1st derivative with a green edge (502–554 nm)
Green edge positionλgWavelength at Dg
Green edge areaSDgSum of the 1st derivative values within the green edge
Blue edge amplitudeDbMaximum value of the 1st derivative with a blue edge (490–530 nm)
Blue edge positionλbWavelength at Db
Blue edge areaSDbSum of the 1st derivative values within the blue edge
Yellow edge amplitudeDyMaximum value of the 1st derivative with a yellow edge (562–638 nm)
Yellow edge positionλyWavelength at Dy
Yellow edge areaSDySum of the 1st derivative values within the yellow edge
Red edge amplitudeDreMaximum value of the 1st derivative with a red edge (682–758 nm)
Red edge positionλreWavelength at Dre
Red edge areaSDreSum of the 1st derivative values within the red edge
Red valley amplitudeDrvMaximum value of the 1st derivative with a red valley (650–690 nm)
Red valley positionλrvWavelength at Drv
Red valley areaSDrvSum of the 1st derivative values within the red valley
Green peak amplitudeDgpMaximum value of the 1st derivative with a green peak (510–558 nm)
Green peak positionλgpWavelength at Dgp
Green peak areaSDgpSum of the 1st derivative values within the green peak
Table 2. Vegetation indexes used in the study.
Vegetation IndicesEquationReference
MCARI (modified chlorophyll absorption ratio index)[(R700 − R670) − 0.2 × (R700R550)](R700/R670)[33]
TCARI (transformed chlorophyll absorption reflectance index)3 × [(R700 − R670) − 0.2(R700 − R550)(R700/R670)][33]
TVI (triangular vegetation index)0.5 × [120(R750 − R550) − 200 × (R670 − R550)][24]
NDVI (normalized difference index)(R800 − R680)/(R800 + R680)[35]
SIPI (structure-insensitive pigment index)(R800 − R445)/(R800 + R680)[11]
GNDVI (green normalized difference vegetation index)(R800 − R570)/(R800 + R570)[12]
RDVI (re-normalized difference vegetation index)(R800 − R670)/(R800 + R670)1/2[12]
OSAVI (optimized soil adjusted vegetation index)1.16 × (R800 − R670)/(R800 + R670 + 0.16)[33]
MSR (modified simple ratio index)(R800/R670 − 1)/(R800/R670 + 1)1/2[33]
NDRE (normalized difference red edge)(R790 − R720)/(R790 + R720)[11]
EVI (enhanced vegetation index)2.5 × (R800 − R670)/(1 + R800 + 6 × R670 − 7.5 × R500)[12]
PSND (pigment specific normalized difference)(R800 − R470)/(R800 + R470)[33]
SPVI (spectral polygon vegetation index)0.4 × [3.7(R800 − R670) − 1.2 × |R530 − R670|][33]
PSRI (plant senescence reflectance index)(R680 − R500)/R750[11]
SAVI (soil adjusted vegetation index)1.5 × (R800 − R670)/(R800 + R670 + 0.5)[12]
NRI (nitrogen reflectance index)(R570 − R670)/(R570 + R670)[12]
CRI (carotenoid reflectance index)1/R570 + 1/R800[12]
NDI (normalized difference index)(R850 − R710)/(R850 + R680)[12]
WDRVI (modified wide dynamic range vegetation index)(0.1 × R800 − R670)/(0.1 × R800 + R670)[12]
LCI (linear combination index)(R850 − R710)/(R850 + R670)1/2[33]
Table 3. Location parameters of AGB estimation model selected by MWPLS, MC-UVE, and RF methods for each potato growth period.
Growth StageVariable Selection Method
MWPLSMC-UVERF
Bud periodDP2, A1, A2, W2, SL1A1, SR2, Dre, SDre, λrvDP1, SR2, SDy, Dre, SDre
Tuber formation periodW2, SL1, SL2, SR2, SDy, Dre, SDre, λreDP2, A2, W2, SL2, SR2, SDy, Dre, SDreW1, DP2, SL1, SR2, SDy, Dre, SDre
Tuber growth periodDP2, A1, A2, SL1, SR2, DbW1, W2, λre, λrvDP1, DP2, A1, W1, W2, SL1, SR2, SDy
Starch store periodSR2, Db, DgDP2, A1, A2, SDg Drv, SDrvSL1, SL2, SR2, SDy, Drv, SDrv
Table 4. Vegetation indexes of AGB estimation model were selected by the MWPLS, MC-UVE, and RF methods for each growth period.
Growth StageVariable Selection Method
MWPLSMC-UVERF
Bud periodNDVI, SIPI, GNDVI, NDRE, EVI, PSNDSIPI, PSND, NDI, WDRVI, LCISIPI, RDVI, NDRE, EVI, SAVI, NDI
Tuber formation periodNDVI, SIPI, GNDVI, RDVI, OSAVI, MSR, NDRE, EVI, PSND, SPVITVI, SIPI, EVI, SPVI, PSRI, NRI, CRI, WDRVINDVI, SIPI, MSR, PSRI
Tuber growth periodTVI, NDVI, SIPI, GNDVI, RDVI, OSAVIMCARI, TCARI, NDVI, NDRE, PSRIMCARI, NDVI, SIPI, GNDVI, NDRE, PSRI
Starch store periodTVI, NDVI, SIPI, SAVI, NRI, NDINDVI, SIPI, SPVI, NRI, NDI, WDRVITCARI, EVI, SPVI, NDI, WDRVI, LCI
Publisher’s Note: MDPI stays neutral with regard to jurisdictional claims in published maps and institutional affiliations.