Article

A Perspective on the Impact of Grassland Degradation on Ecosystem Services for the Purpose of Sustainable Management

1
State Key Laboratory of Earth Surface Processes and Resource Ecology, School of Natural Resources, Faculty of Geographical Science, Beijing Normal University, Beijing 100875, China
2
College of Life Sciences, Beijing Normal University, Beijing 100875, China
3
School of Environment, Beijing Normal University, Beijing 100875, China
*
Author to whom correspondence should be addressed.
Remote Sens. 2022, 14(20), 5120; https://doi.org/10.3390/rs14205120
Submission received: 6 September 2022 / Revised: 3 October 2022 / Accepted: 10 October 2022 / Published: 13 October 2022
(This article belongs to the Special Issue Remote Sensing of Ecosystems)

Abstract

:
Grassland degradation seriously threatens the ability of grassland to provide ecosystem services. Grassland ecological restoration and sustainable management decision making depends on an accurate understanding of the impacts of grassland degradation on ecosystem services. Based on the assessment of grassland degradation and four key ecosystem services, including the net primary production (NPP), ecosystem carbon pool (EC), soil conservation (SC), and soil loss by wind (SL), the impacts of grassland degradation on ecosystem services and their relationships were analyzed. The impacts of climate change and grazing pressure on the relationship between grassland degradation and ecosystem services were revealed. Based on the “climate change and grazing pressure-grassland degradation-ecosystem services” network, the study puts forward specific suggestions on grassland ecological restoration and sustainable management under the premise of fully balancing ecological restoration and stakeholder relationships. The results showed that grassland degradation had a significant impact on ecosystem services and their relationships, but it varied with the types of ecosystem services. Although the degraded grassland in the study area has been in a state of recovery and ecosystem services have been improving in the past 20 years, the degradation of grassland in some areas has intensified, and there are still ecological risks, so it is necessary to continue to carry out ecological restoration work. On this basis, taking the local conditions into consideration, grassland ecological restoration and sustainable management policy suggestions were proposed. The study can provide a scientific reference for ecological protection and sustainable development in arid and semi-arid areas, and help to improve human well-being.

Graphical Abstract

1. Introduction

Grasslands cover 30–40% of the earth’s surface, and grassland degradation is a major global ecological problem that poses a severe challenge to grassland ecosystem health and inevitably affects ecosystem services [1,2]. Previous studies have shown that the vegetation composition, diversity, productivity, and soil properties of degraded grassland have changed significantly [3,4,5], which seriously threatens the ability of grasslands to provide ecosystem services [6]. Scholars in China and abroad have discussed the impacts of grassland degradation on ecosystem services at the regional scale combined with remote sensing technology. For example, Zhang et al. conducted a study in the Xilin River Basin of Inner Mongolia, China, and found that grassland degradation was negatively correlated with aboveground biomass and soil conservation, and positively correlated with water yield, but not significantly [7]. Taking the Qinghai Tibet Plateau as an example, Wen et al. analyzed the impacts of grassland degradation on net primary production (NPP), carbon storage, nitrogen recycling, and plant diversity. The results showed that the aggravation of grassland degradation had significant impacts on the trade-off and synergy of ecosystem services, and different ecosystem services had different responses to grassland degradation [8]. On the whole, most studies on grassland degradation are conducted at the sample plot scale, while the regional-scale studies often use the normalized difference vegetation index (NDVI), NPP, and other single vegetation indicators to assess grassland degradation, lacking consideration of soil characteristics, which may affect the accuracy of grassland degradation assessment [9,10]. Therefore, it is necessary to evaluate grassland degradation comprehensively combined with vegetation and soil characteristics, and use the various analysis methods such as constraint line and cluster analysis to systematically analyze the impacts of grassland degradation on a single ecosystem service, paired ecosystem services, and ecosystem service clusters, thereby improving the science and accuracy of the research.
To promote grassland sustainable management, it is necessary to understand the impacts of climate change and human activities on grassland degradation and ecosystem services [11,12,13]. At present, the related research focuses on the impacts of climate change. For instance, Zhang et al. explored the impacts of temperature, precipitation, and other factors on grassland degradation in Altay, China [14]. Underwood et al. analyzed the impacts of climate change on ecosystem services, and they put forward suggestions on resource management in Southern California, USA [15]. In addition, Talukdar et al. analyzed the impacts of land cover change on ecosystem services in the lower Ganges plain of India [16]. However, it is difficult to simulate grazing pressure at the regional scale, so there are relatively few studies on the impact of regional grazing activities on grassland degradation and ecosystem services [17,18], especially those coupled with climate change [19,20,21,22].
Under the background of grassland degradation, ecosystem restoration has gradually become an important strategy to protect biodiversity and stabilize the global climate [23,24]. With the implementation of a series of ecological restoration projects, scholars began to pay attention to the ecological and economic benefits of ecological projects such as the Green for Grain Project with the purpose of increasing forest and grassland cover and combating soil erosion on sloped cropland [25]. For instance, Ren et al. showed that grassland restoration could significantly improve the relationship between ecosystem services, and was related to the degree of restoration of degraded grassland [26]. On the whole, this ecological restoration project has achieved remarkable results in improving the regional ecological environment and effectively promoting regional economic development and ecological civilization construction, and has made great ecological, economic, and social improvements [27]. However, research on grassland ecological restoration and sustainable management is still in the exploratory stage and needs to be supported by more cases. For example, grasslands provide a variety of ecosystem services. Grassland ecological restoration should not only focus on a single index and a single dimension of restoration, but also fully consider the complexity of grassland ecosystems and strengthen the comprehensive restoration and trade-off management of multiple ecosystem services [28,29]. In addition, limited by factors including policy, capital, and human resources, it is difficult to conduct ecological restoration on a large regional scale in a short period. There is a need to highlight the key points of governance, identify the priority areas of grassland ecological restoration, and conduct refined regional classification and implementation strategies [30].
The Xilinhot steppe is an important part of the Xilingol typical steppe of Inner Mongolia in China, which is known as the “Pearl of the Grassland”. Its ecological environment has been widely studied by scholars in China and abroad [31,32,33]. The Xilinhot steppe is rich in animal husbandry resources; however, due to the influence of natural factors and human activities, the degree of grassland degradation has intensified in recent decades, which seriously limits the development of animal husbandry. Therefore, the Xilinhot steppe can provide an ideal research region for grassland degradation research.
The main objectives of this study were: (a) to comprehensively assess grassland degradation based on grassland vegetation and soil characteristics; (b) to systematically analyze the impacts of climate change and grazing pressure on grassland degradation, ecosystem services, and their relationship; (c) to explore the strategies of grassland ecological restoration and sustainable management. The grassland degradation degree was evaluated based on vegetation and soil characteristics, and four key ecosystem services including NPP, ecosystem carbon pool (EC), soil conservation (SC), and soil loss by wind (SL), which were widely focused in arid and semi-arid steppe, were quantitatively evaluated in the study area, from 2000 to 2019. On this basis, the impacts of grassland degradation on ecosystem service were systematically analyzed by various analysis methods, and the driving mechanism of climate change and grazing pressure on the relationship between grassland degradation and ecosystem services was revealed. The study also provides specific policy suggestions for local grassland ecological restoration and sustainable management.

2. Materials and Methods
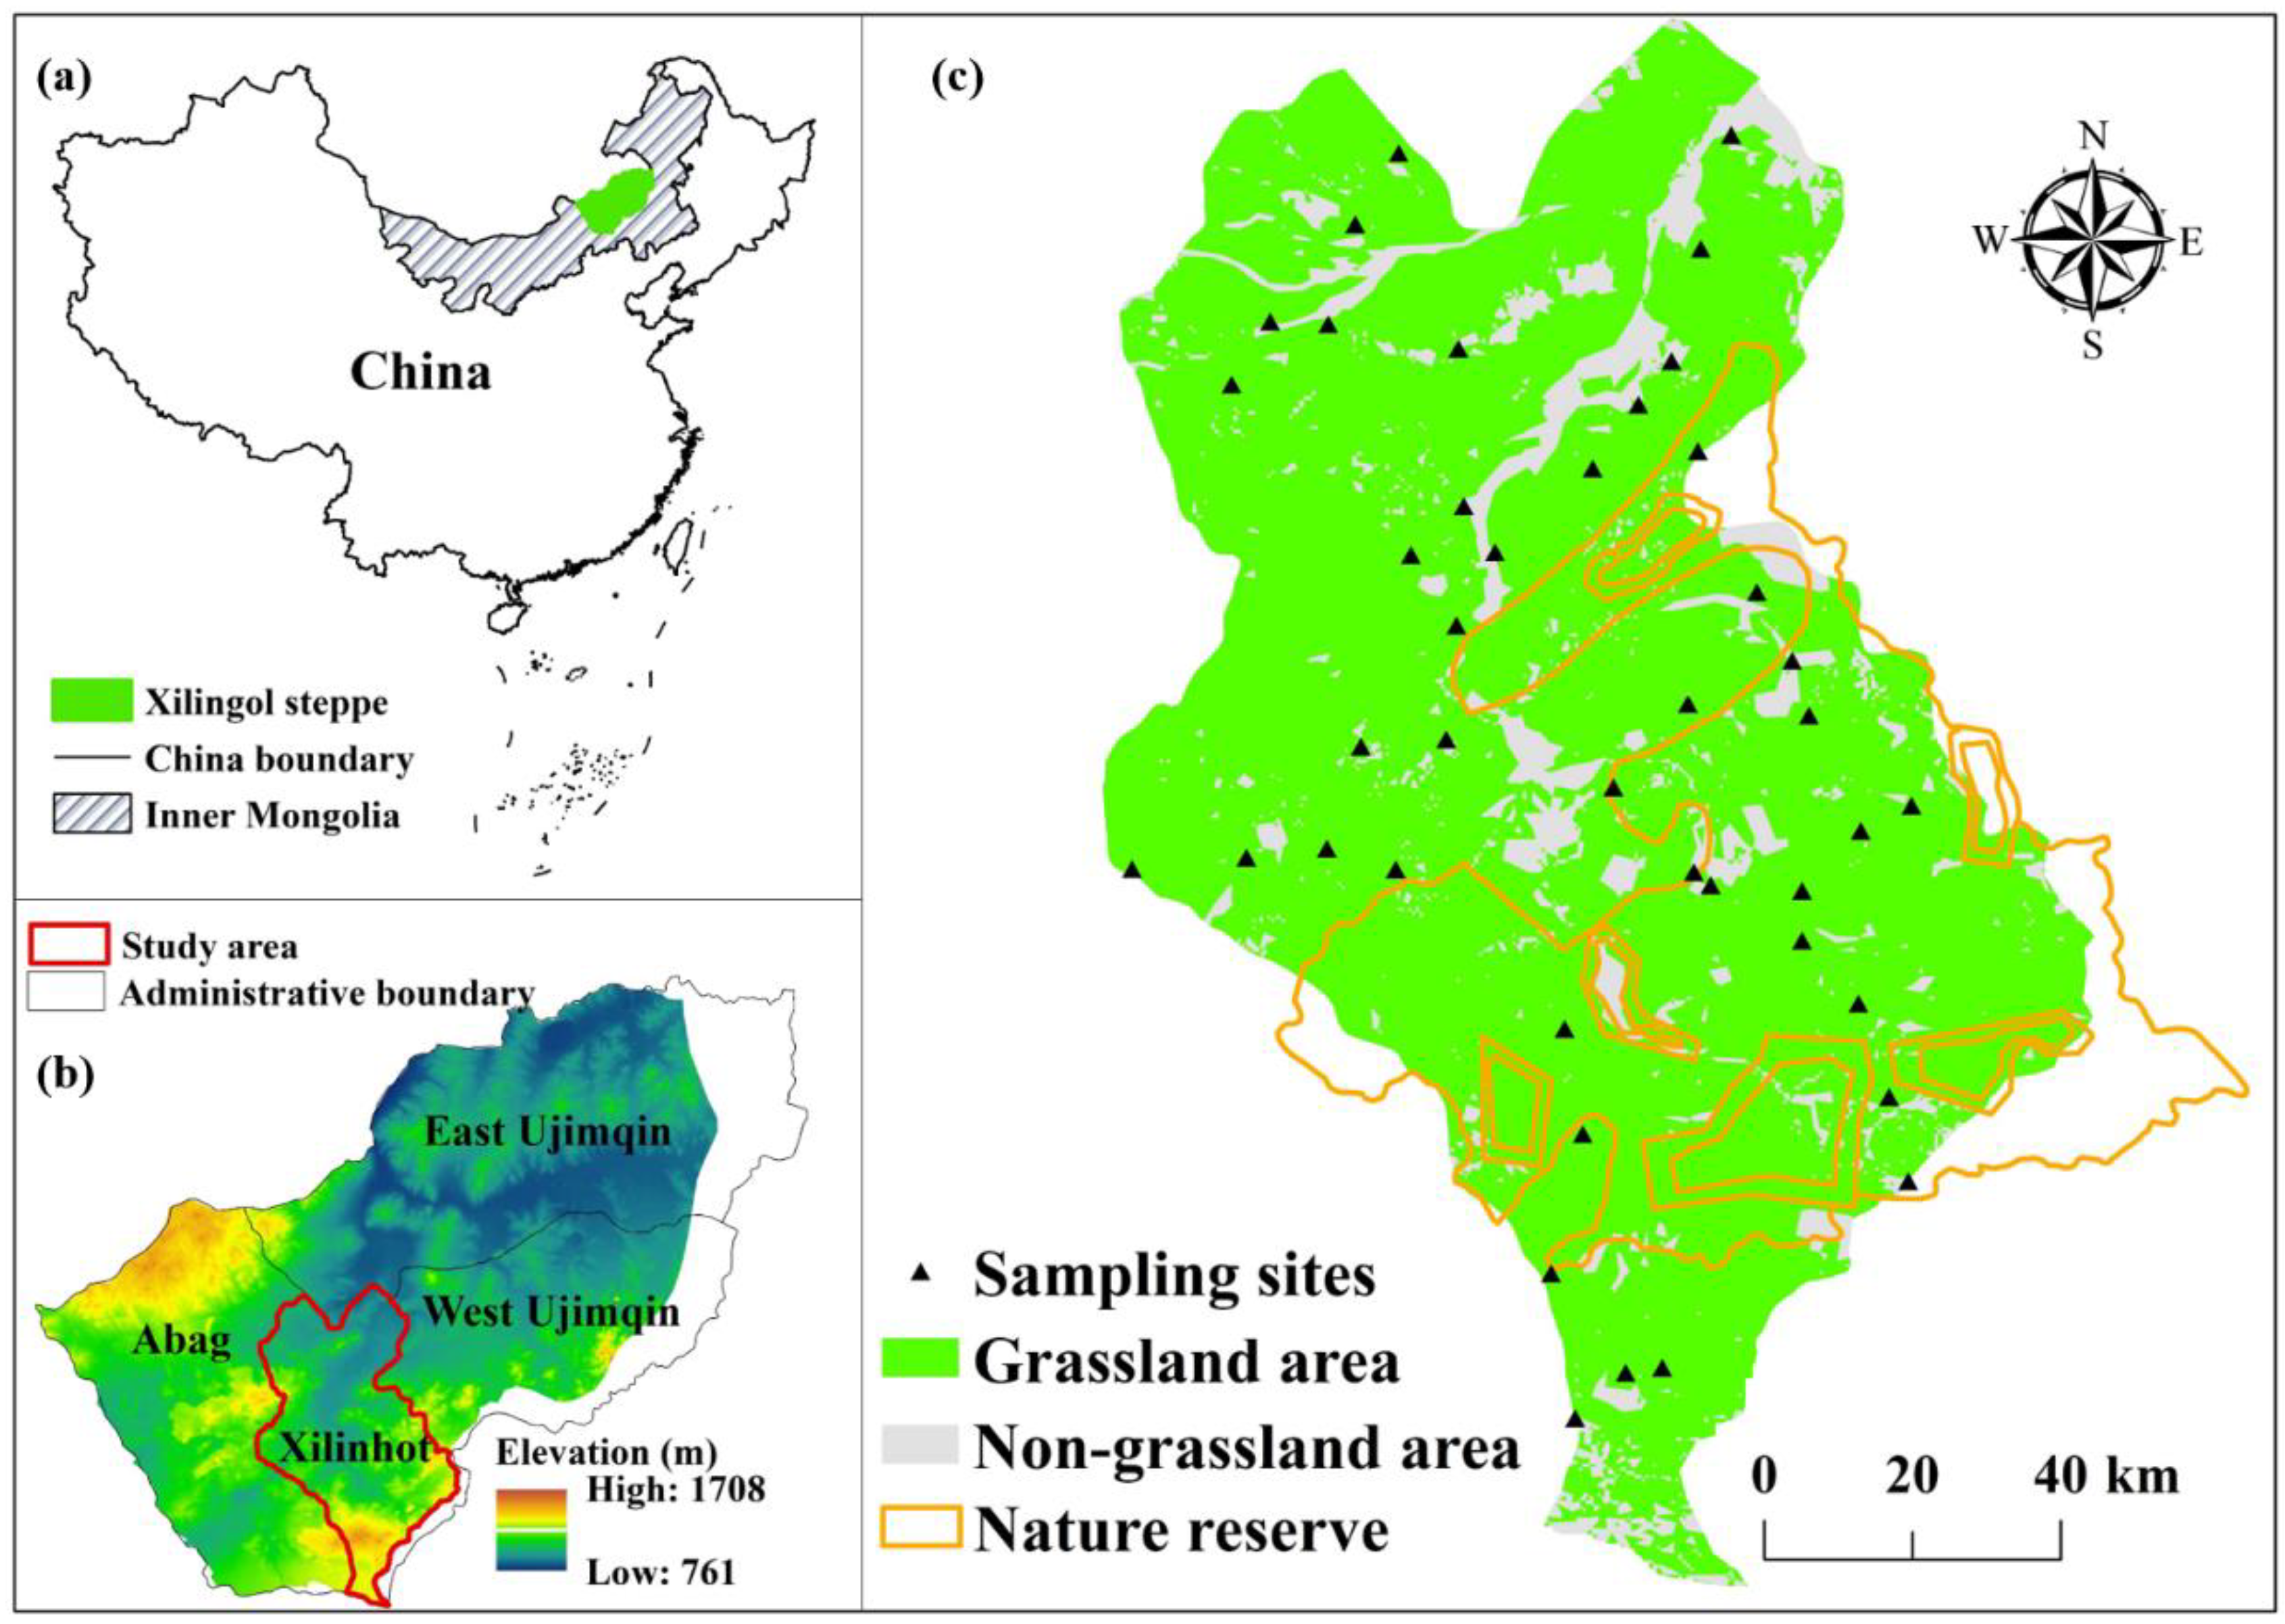
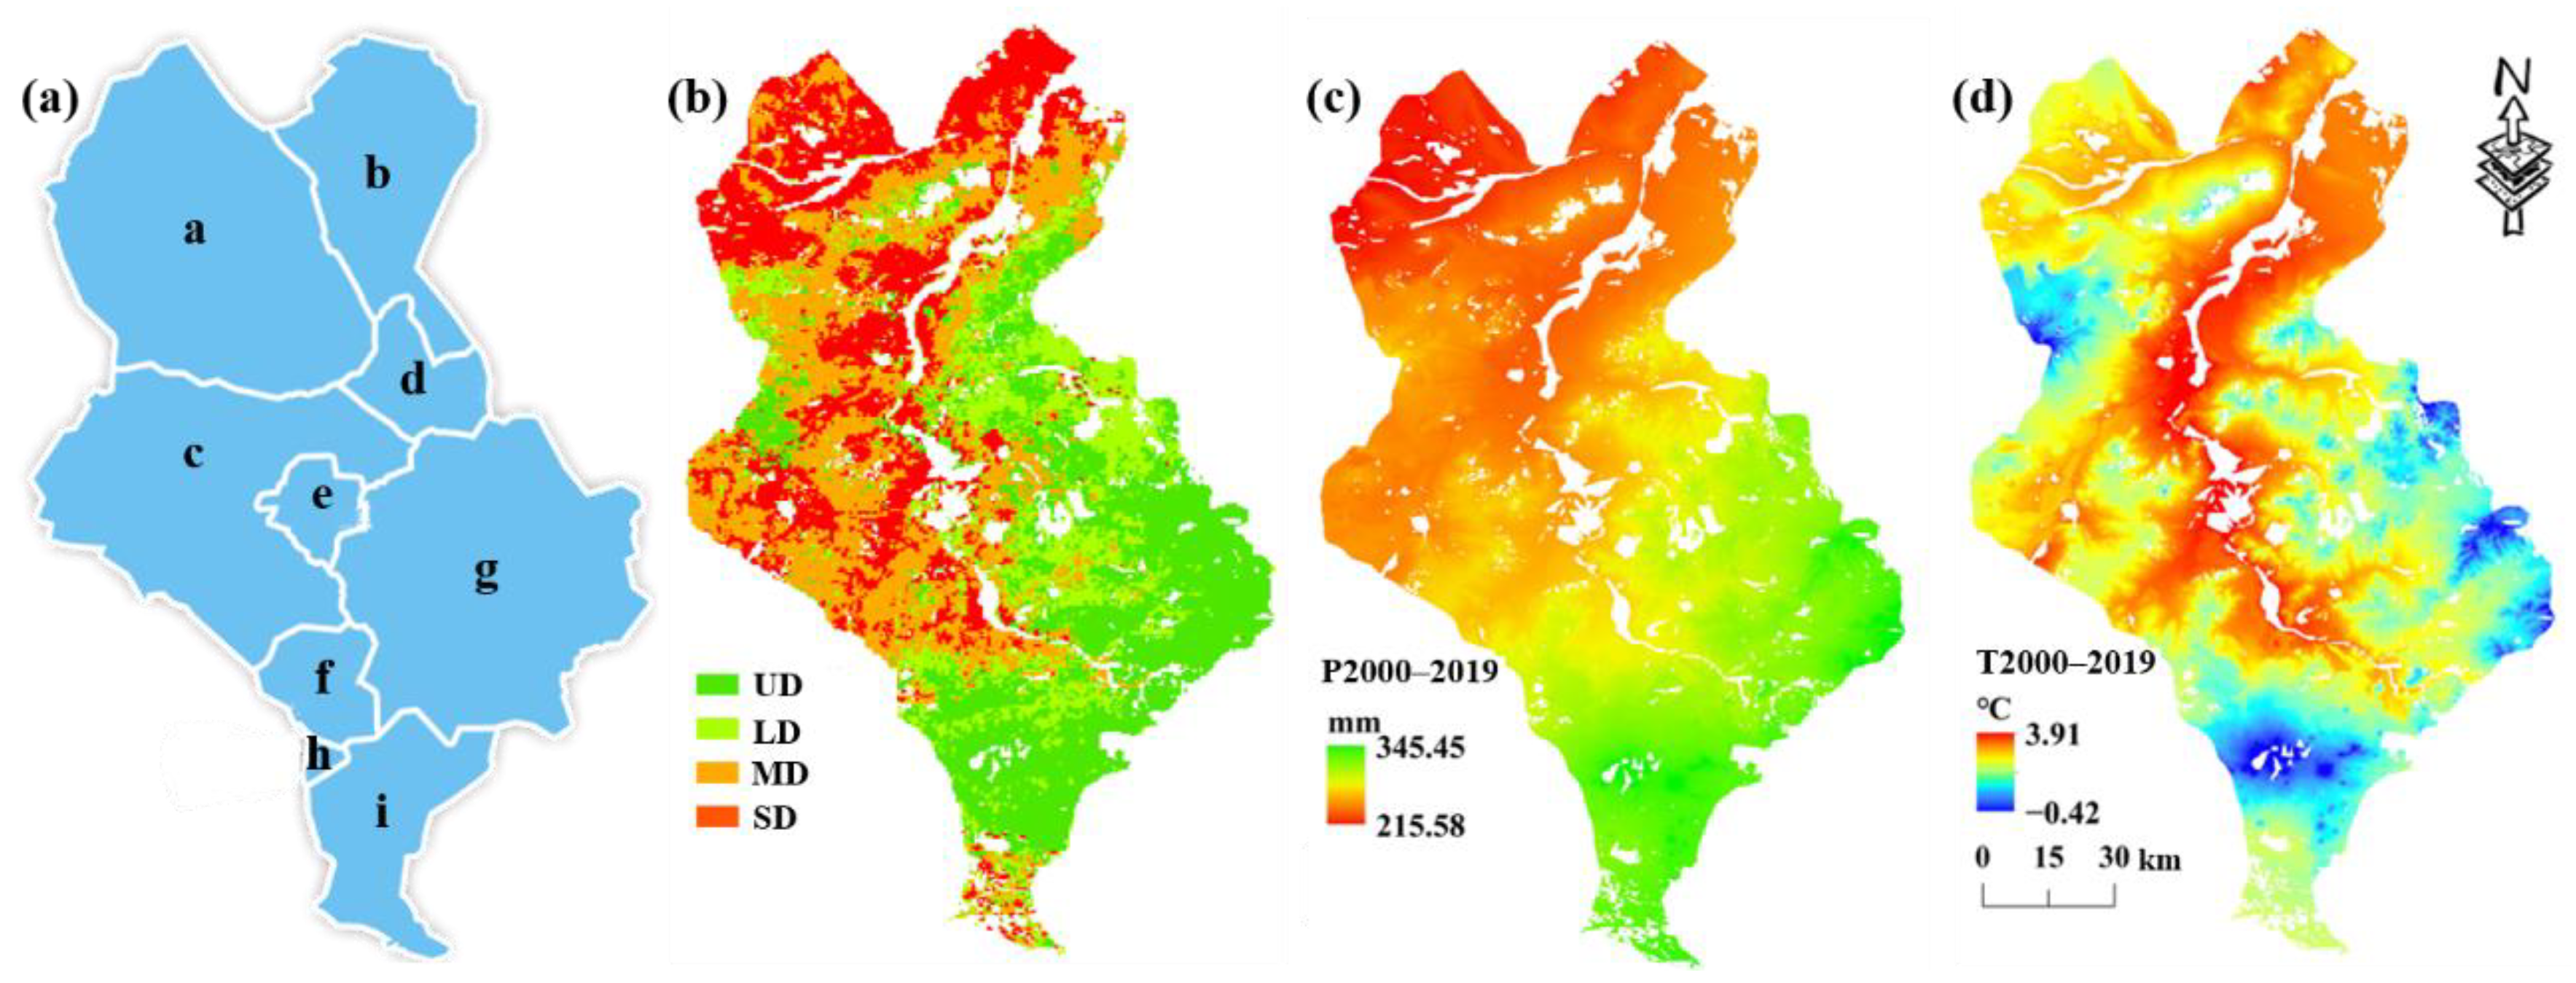
2.1. Study Area

As a typical arid and semi-arid region, Inner Mongolia is an important ecological barrier in northern China that plays an important role in maintaining the regional and global carbon balance. Xilinhot city (115°18’–117°06′E, 43°02′–44°52′N) (Figure 1), with a total area of 1.48 × 10⁴ km2, located in the middle of Inner Mongolia, is the seat of Xilingol League and is adjacent to West Ujimqin Banner, Hexigten Banner, Abag Banner, and East Ujimqin Banner [10].
The study area has a semi-arid continental climate in the middle temperate zone, with dry and cold winters and humid and warm summers. The terrain of study area is high in the south and low in the north, with an average altitude of 988.5 m [10]. The representative plants in the study area include Stipa grandis P. Smirn., Leymus chinensis (Trin.) Tzvel., and Cleistogenes squarrosa (Trin.) Keng. The Xilingol Grassland National Nature Reserve, which is included in the international biosphere monitoring system by UNESCO, is located in the study area. The study area has unique conditions for animal husbandry production and development, and is an important base for the production, processing, and export of green livestock products [32,33]. By 2020, the number of high-quality beef cattle in the city’s animal husbandry operations is projected to reach more than 1.5 × 10⁵, and the number of fattening cattle is projected to reach more than 5.0 × 10⁴ (http://www.xilinhaote.gov.cn, accessed on 31 January 2021).

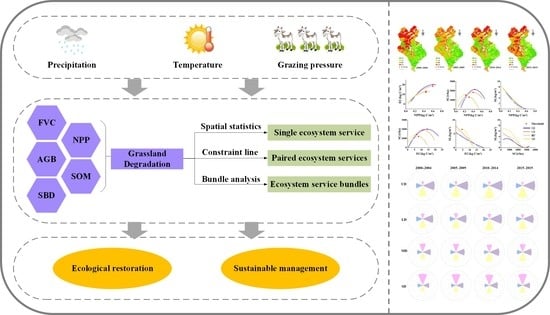
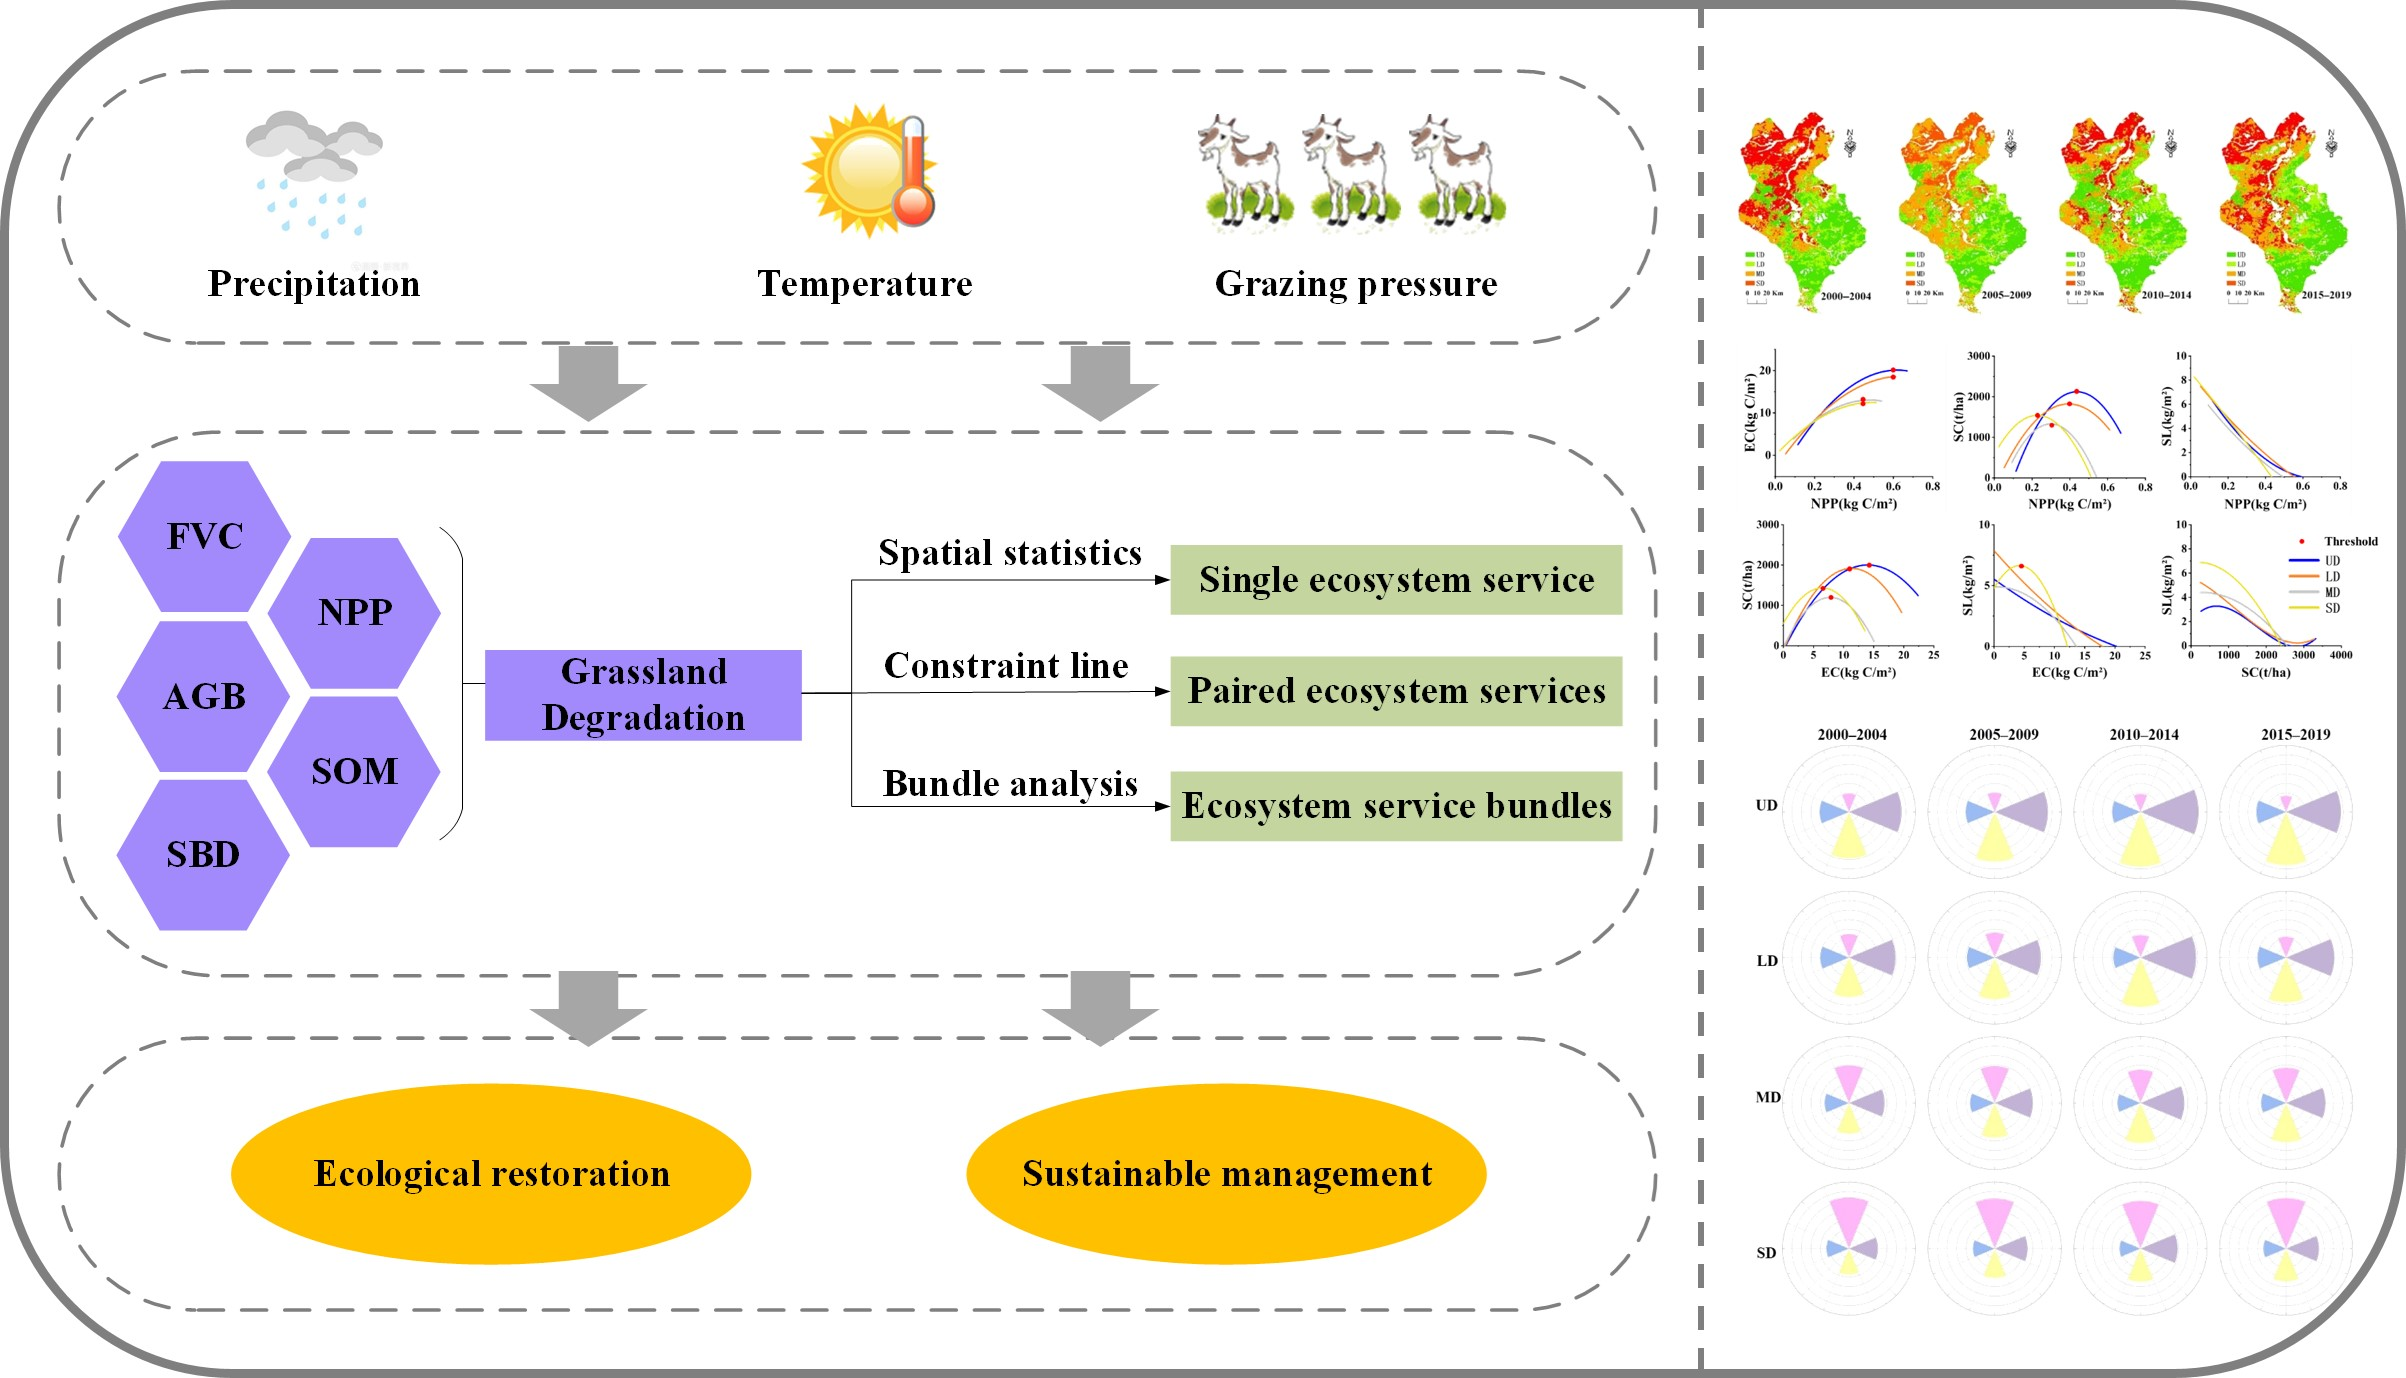
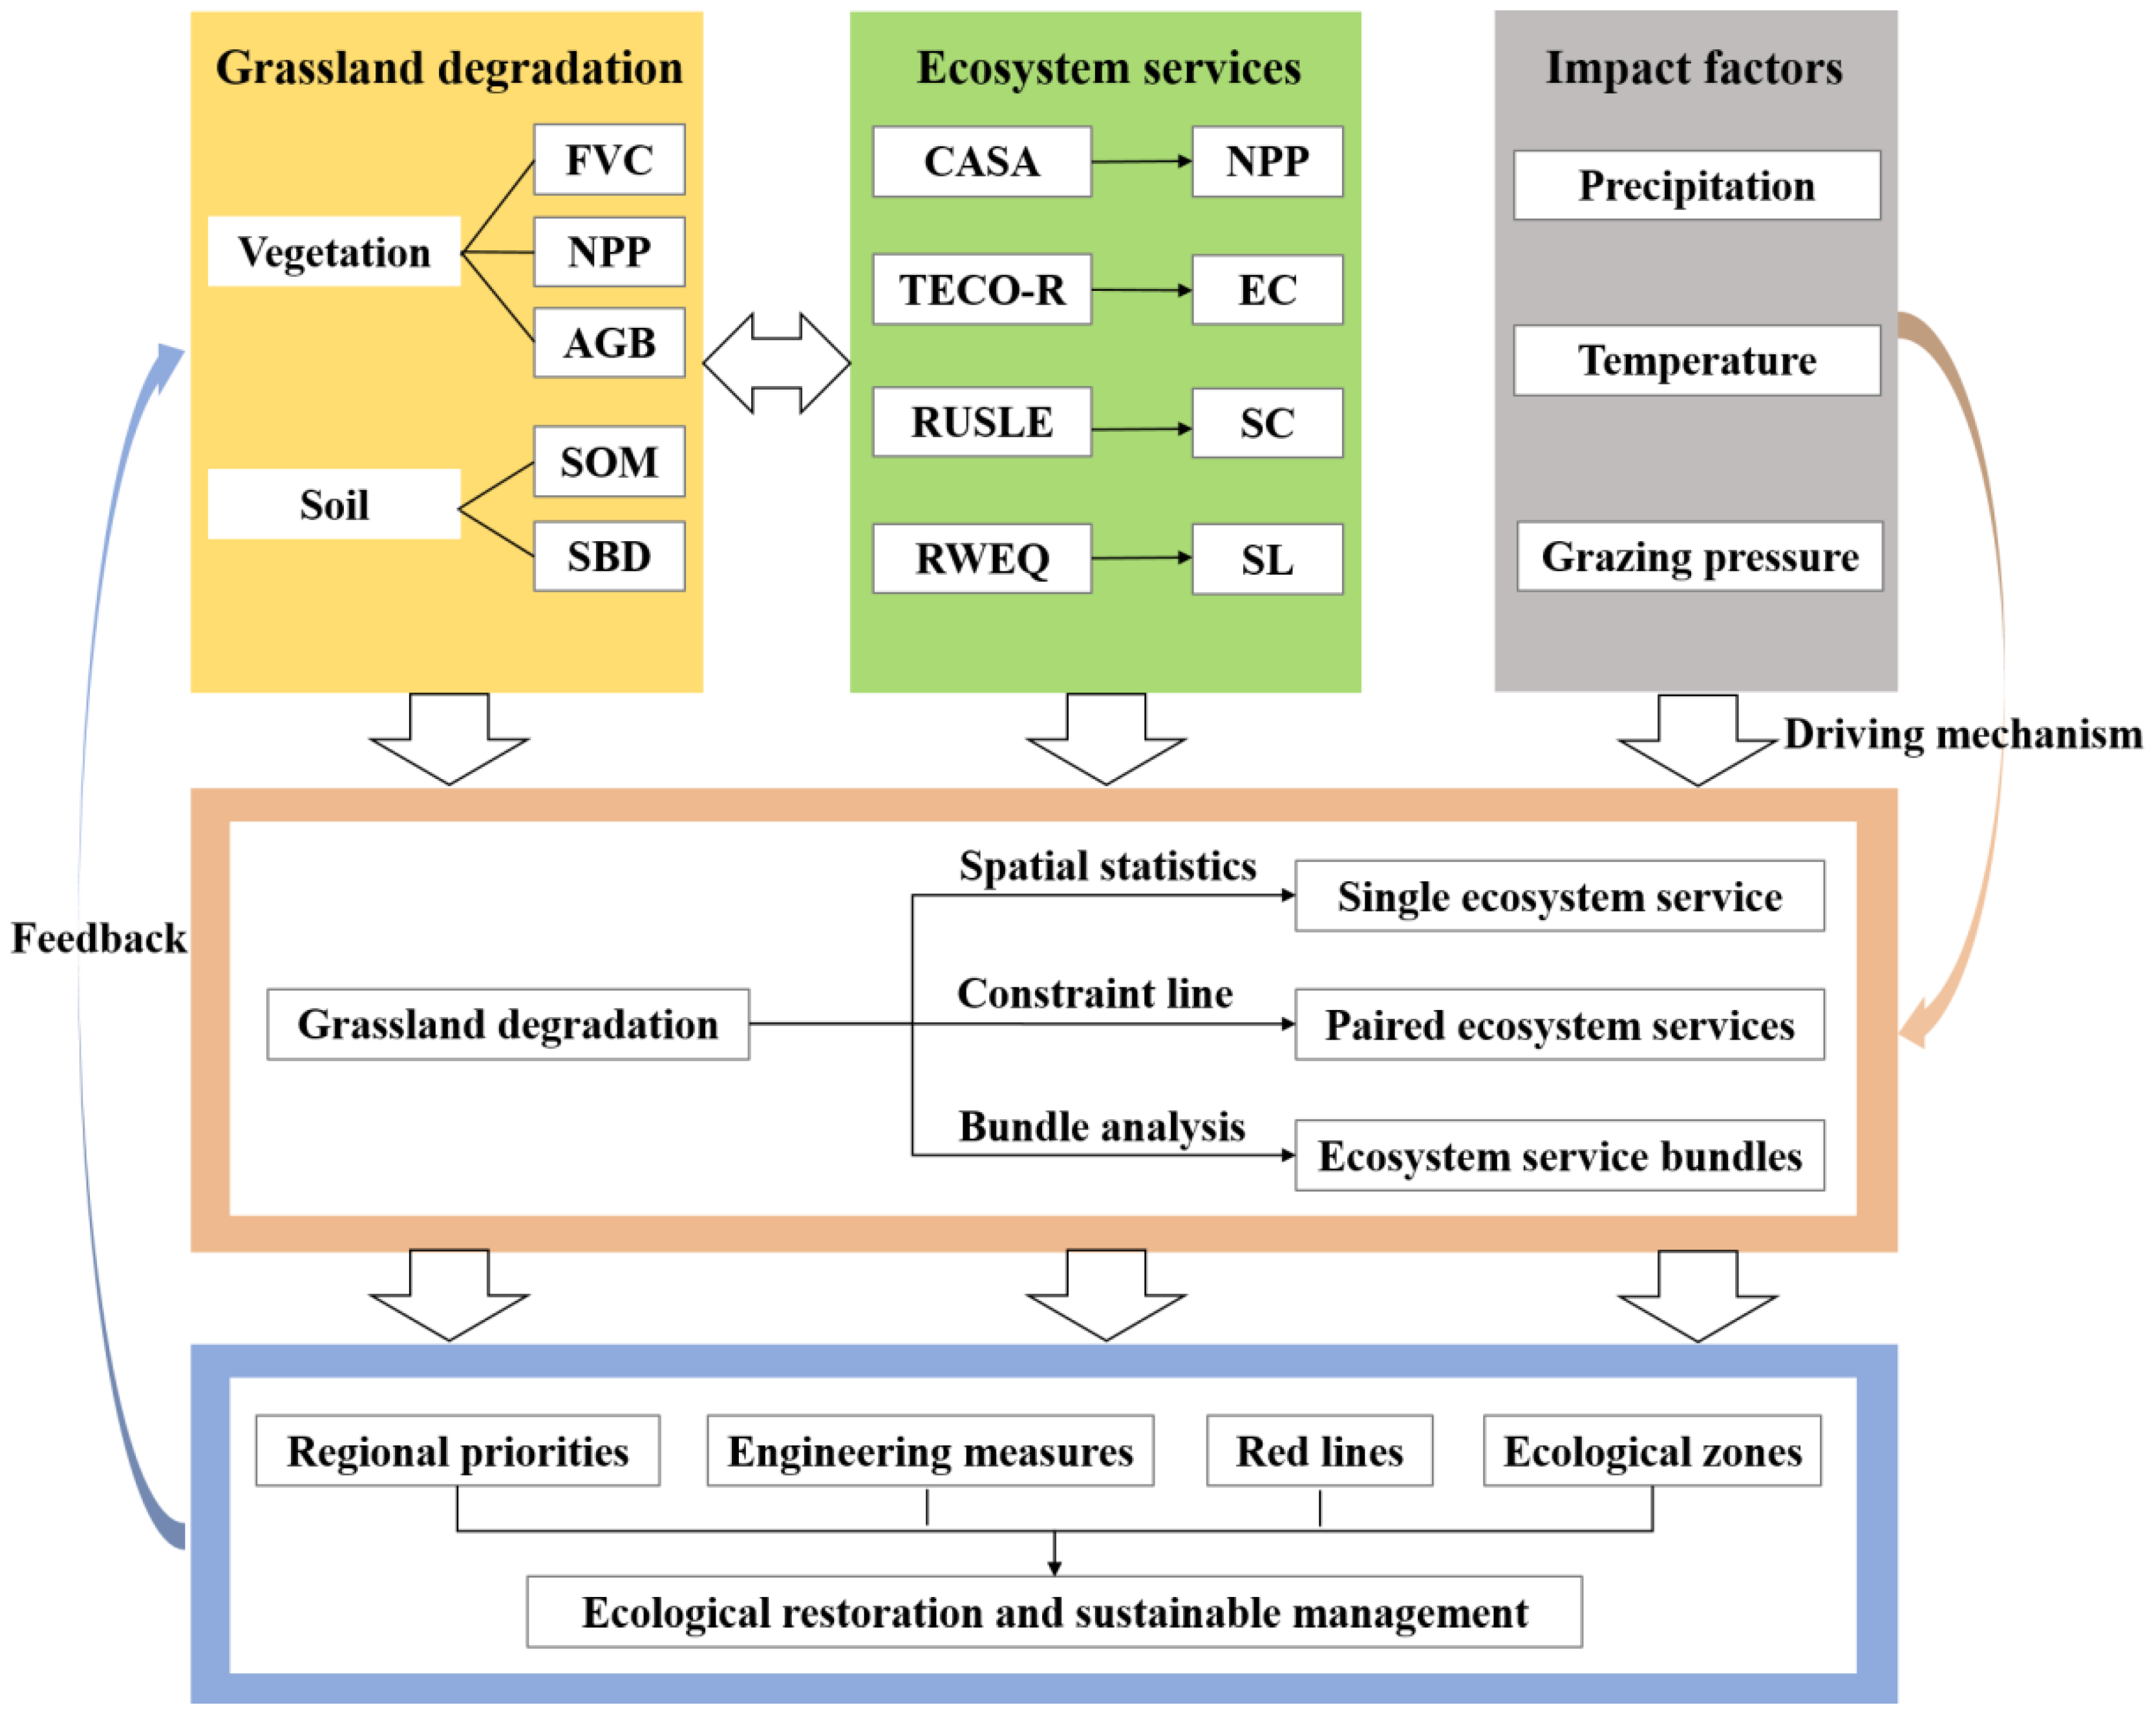
2.2. Research Framework

The framework of this study is shown in Figure 2. Firstly, based on fractional vegetation cover (FVC), NPP, aboveground biomass (AGB), soil organic matter (SOM), and soil bulk density (SBD), the grassland degradation was evaluated combined with vegetation and soil characteristics. Secondly, four ecosystem services, including NPP, EC, SC, and SL, were evaluated based on widely used biophysical models. Then, the impacts of grassland degradation on a single ecosystem service, paired ecosystem services, and ecosystem service clusters were systematically analyzed by multiple methods. Furthermore, the contributions of climate change and grazing pressure to grassland degradation, ecosystem services and their relationship were quantified. Finally, from the perspective of the “climate change and grazing pressure-grassland degradation-ecosystem services” network, suggestions on grassland ecological restoration and sustainable management were put forward. Specifically, the suggestions included four aspects: (1) identifying the priorities of regional governance; (2) improving ecological engineering measures; (3) defining the red line for ecological protection; (4) identification of ecological engineering zones.

2.3. Data Sources

The aboveground biomass, soil organic carbon, soil bulk density, and soil particle size ratio were obtained from repeated field measurements, which was carried out in July and August each year, from 2017 to 2019. The selection of the sampling sites mainly considered the spatial distribution and traffic accessibility, and the overall distance between sites was 10–20 km (refer Figure 1 for sites distribution). Three 1 m × 1 m quadrats were set for each plot to carry out vegetation and soil survey, and the depth of soil sample collection was 0–50 cm. Other data sources are shown in Table 1. Moreover, the spatial resolution of all data was unified to 250 m through the resampling function of ArcGIS software.

2.4. Models and Methods

2.4.1. Integrating Monitoring of Grassland Degradation

Grassland degradation is a complex process that is manifested in many ways, including grassland vegetation and soil characteristics. Based on the Chinese National standard “the Parameters for Degradation, Sandification, and Salification of Rangelands (GB 19377-2003)”, fractional vegetation cover, net primary production, aboveground biomass, soil organic matter (0–20 cm), and soil bulk density (0–20 cm) were selected as the evaluation indices, and then the regional grassland degradation was evaluated combined with vegetation and soil characteristics [10].
Selecting appropriate reference standard for undegraded grassland is the basis of grassland degradation assessment. The Xilingol Grassland National Nature Reserve is located in the study area, and the core area in reserve can be the reference standard (see Supplementary Information S1 for the functional zoning map of the nature reserve in Supplementary Information). The regional level of water and heat conditions often have spatial and temporal distribution differences [34,35], and the responses of grassland ecosystems to external disturbances are lagged [36,37,38]. Therefore, the study took every five years as a basis to assess the regional grassland degradation and took the five-year average values of various indicators in the core area of the Xilingol Grassland National Nature Reserve as the reference standard for undegraded grassland.

2.4.2. Quantification of Ecosystem Services

Combined with the relevant research at home and abroad, NPP was evaluated using the Carnegie–Ames–Stanford Approach (CASA) model [39,40], the improved Terrestrial Ecosystem Regional (TECO-R) model was used to evaluate EC [41,42], SC was evaluated by the Revised Universal Soil Loss Equation (RUSLE) model [43,44], and the Revised Wind Erosion Equation (RWEQ) model was used to evaluate SL [2,45]. The specific calculation processes used in these models are shown in Supplementary Information S2 (Supplementary Information) [46,47,48,49,50,51,52,53,54,55,56,57,58,59,60,61,62,63,64,65].

2.4.3. Analytical Methods

(1)
Spatial simulation of grazing pressure
Based on fractional vegetation cover, grazing pressure was calculated by the moving window method, and grazing pressure index was used to represent the grazing pressure of each pixel [66,67], which is calculated in Equation (1). The specific calculation process of this method is shown in Supplementary Information S3 (Supplementary Information). The higher the grazing pressure index, the higher the grazing pressure.
G P I i = F V C r e f e r e n c e F V C i F V C r e f e r e n c e
where G P I i is grazing pressure index of pixel i, F V C r e f e r e n c e is the average fractional vegetation cover of the reference pixel, and F V C i is the average fractional vegetation cover of pixel i.
(2)
Constraint lines
The relationship between paired ecosystem services is not only a simple trade-off or synergistic relationship, but also a certain degree of constraints. This study used the constraint line method to analyze the constraint effect between paired ecosystem services of different degraded grasslands [44,50,68,69,70].
(3)
Analysis of environmental impact
Owing to the influence of the external environment, grasslands with the same degradation gradient have different abilities to provide ecosystem services. This study explored a quantitative analysis method of this environmental impact from the perspective of ecosystem services, to improve the understanding of the “climate change and grazing pressure-grassland degradation-ecosystem services” network [11,71]. First, the minimum and maximum values of each ecosystem service of degraded grassland (excluding outliers, the minimum value was 5% quantile value and the maximum value was 95% quantile value) were calculated, and then the temperature, precipitation, and grazing pressure corresponding to the maximum value of each ecosystem service were found. The difference in precipitation and grazing pressure was used to analyze the influence mechanism of variables on the relationship between grassland degradation and ecosystem services. In addition, to quantitatively compare the effects of temperature, precipitation, and grazing pressure on the relationship between grassland ecosystem services and different degradation degrees, the effects of temperature, precipitation, and grazing pressure on each ecosystem service under different degradation gradients were calculated from the perspective of root-mean-square error (RMSE). The impacts of precipitation and grazing pressure on the relationship between grassland degradation and ecosystem services were classified as strong or weak.

3. Results

3.1. Spatiotemporal Distribution Characteristics

3.1.1. Grassland Degradation

According to Figure 3, the grassland in the northwest of the study area was mainly moderately degraded and severely degraded, from 2000 to 2019, while the grassland in the southeast was mainly undegraded and lightly degraded. The grassland degradation in the northwest of the study area was mainly classified as severe degradation, from 2000 to 2004, and moderate degradation, from 2005 to 2009. The severe degradation of grassland in the northwest of the study area had an increasing trend, from 2010 to 2014 and 2015 to 2019, but there was still significant improvement compared with 2000–2004.
As is shown in Table 2, about 70% of the grassland in the study area had different degrees of degradation, and about 50% of the grassland was in a state of moderate to severe degradation. Overall, from 2000 to 2014, the proportion of severely degraded grassland and moderately degraded grassland decreased by 8.7% in total, while the proportion of lightly degraded grassland increased by 5.7% and the proportion of undegraded grassland increased by 3.0%. Although the proportion of undegraded grassland in the study area decreased, from 2010 to 2019, the proportion of severely degraded grassland still decreased significantly compared with that in 2000 to 2004, and the proportion of lightly degraded grassland increased. This indicates that the grassland degradation in the study area was in a state of recovery as a whole, but the management situation was still very serious.

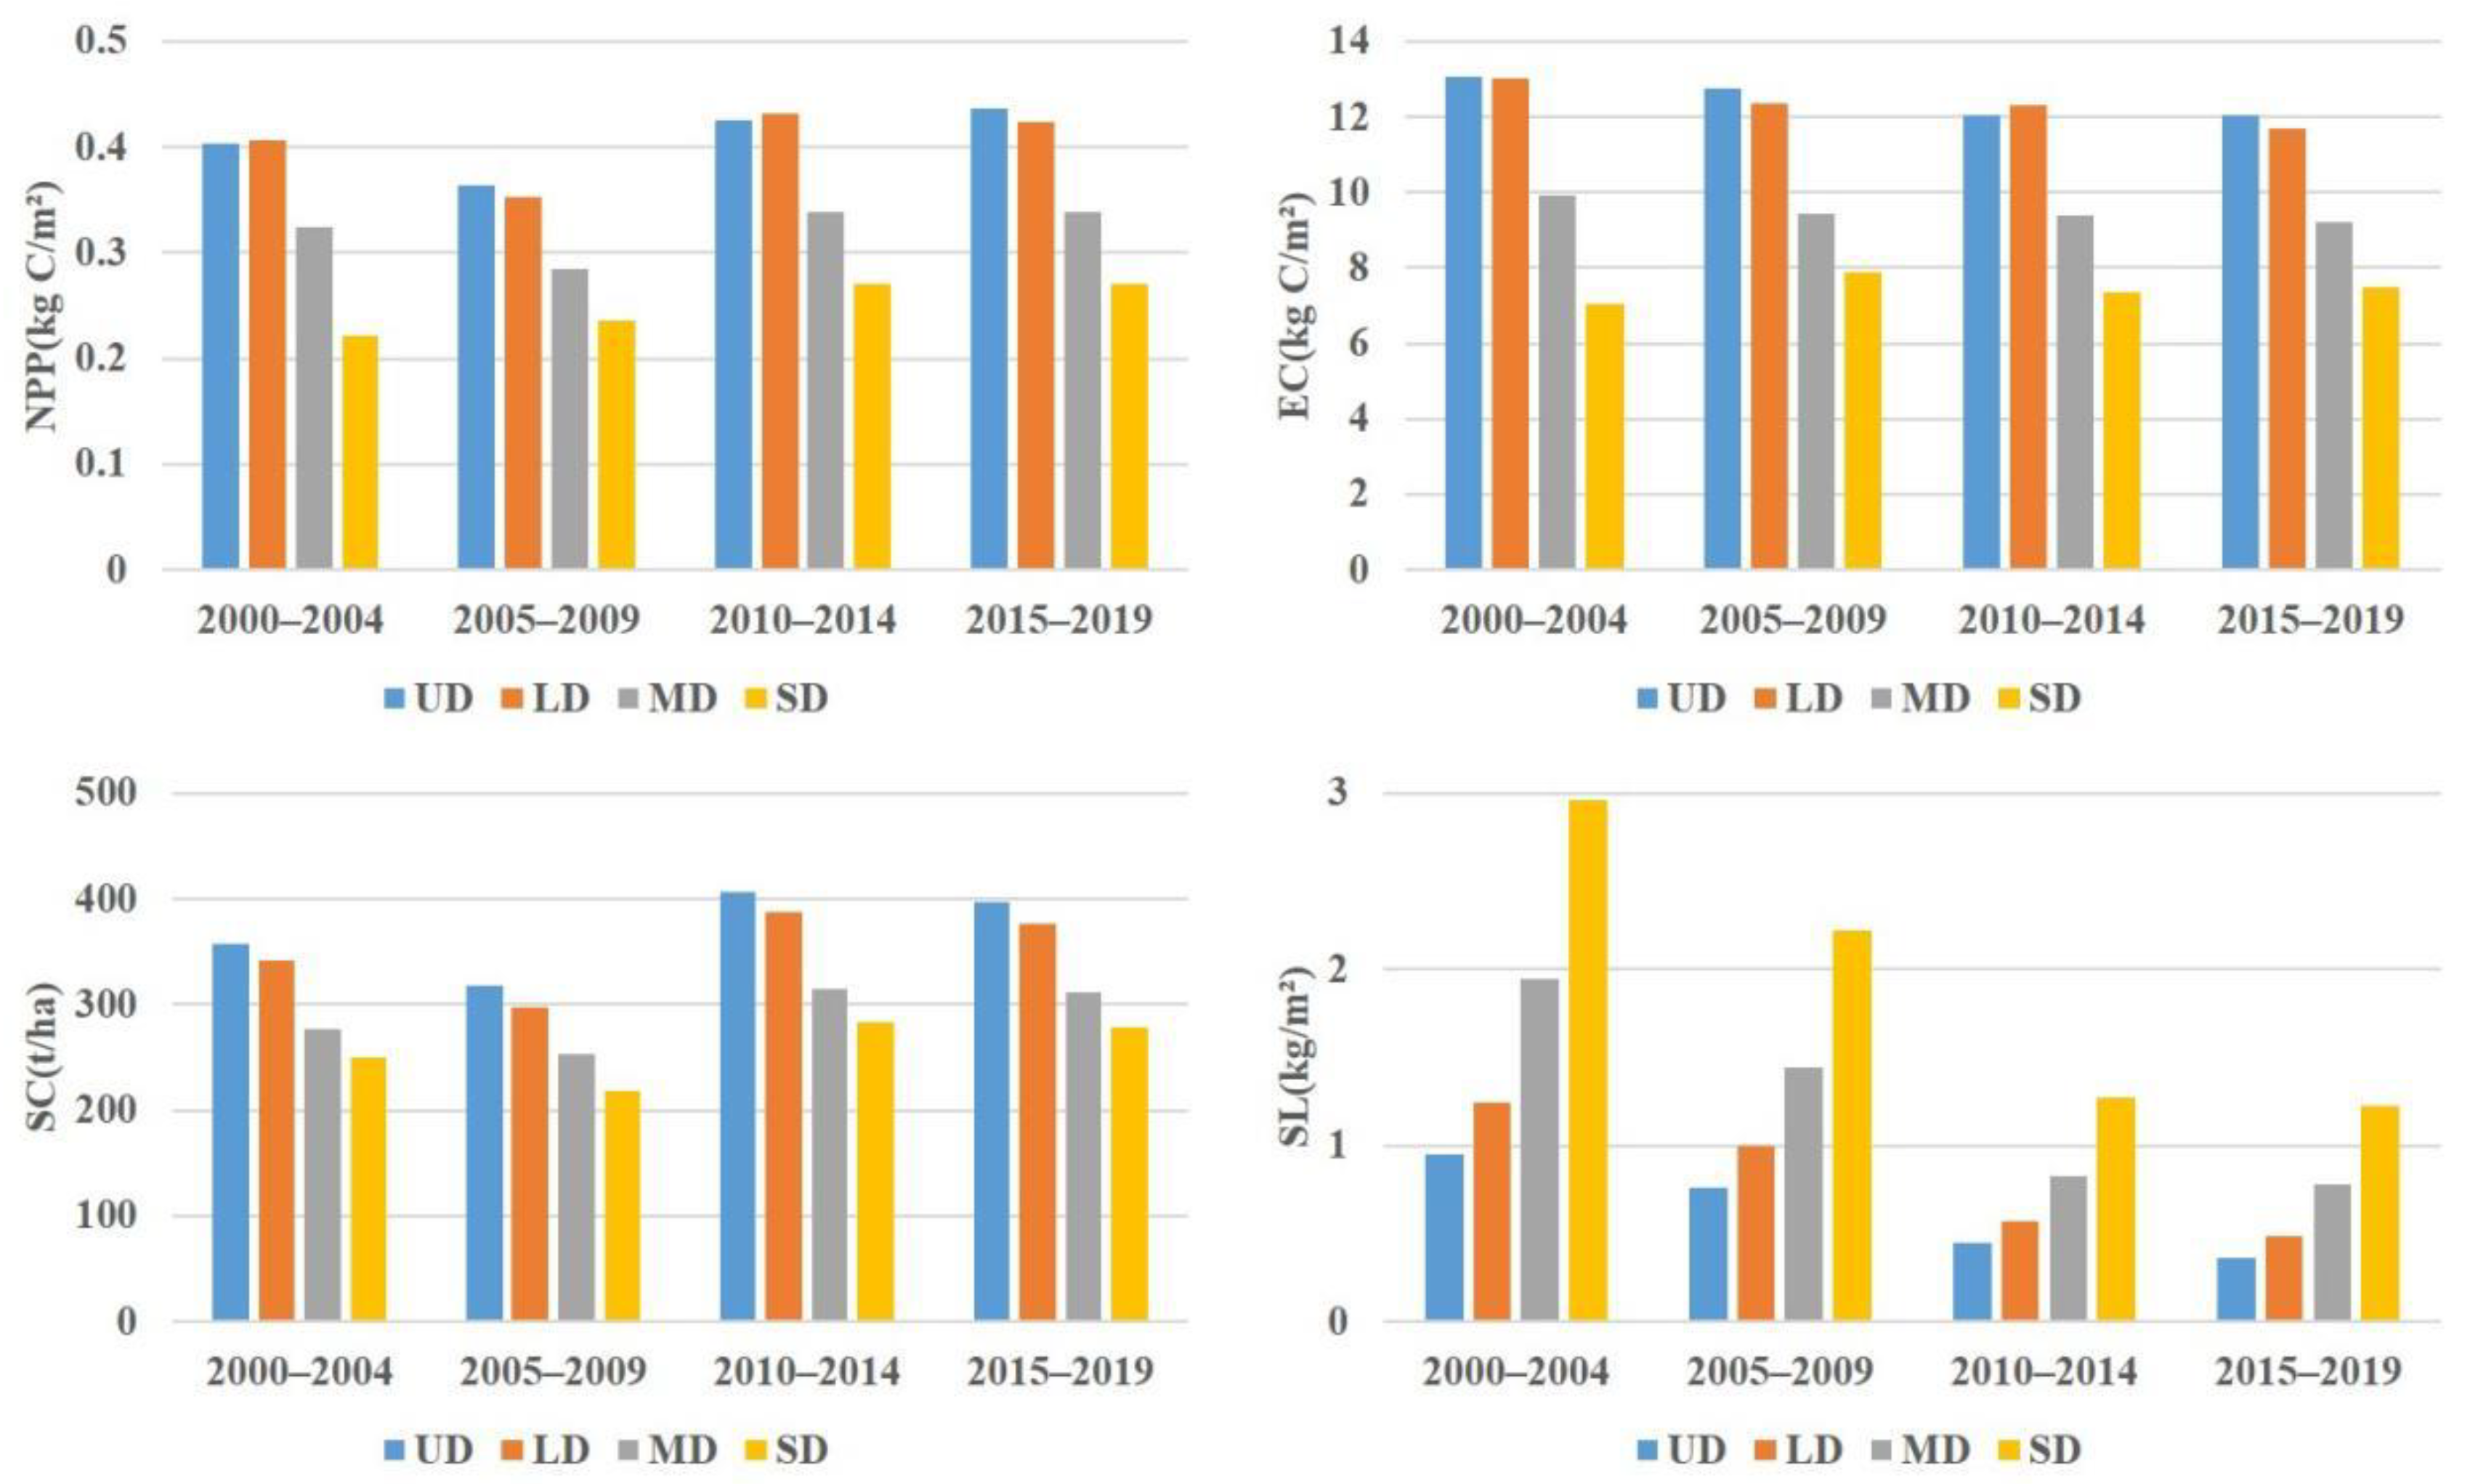
3.1.2. Ecosystem Services

The spatial distribution of four ecosystem services for each year in the study area, from 2000 to 2019 is shown in Supplementary Information S4 (Supplementary Information). The spatial distribution characteristics of NPP, EC, and SC were low in the northwest and high in the southeast, from 2000 to 2019, and the spatial distribution characteristics of SL were high in the northwest and low in the southeast. The spatial distribution of ecosystem services was characterized by fragmentation, and there were significant differences in NPP, EC, SC, and SL between adjacent regions.
As is shown in Figure 4, NPP, EC, and SC in the study area showed an overall increasing trend, from 2000 to 2019, while SL showed a significant decreasing trend (p < 0.05). However, the increasing trend of EC and SC was not significant (p > 0.05). Ecosystem services fluctuated greatly between years, and there was a periodic change trend between years.

3.2. Impacts of Grassland Degradation on Ecosystem Services

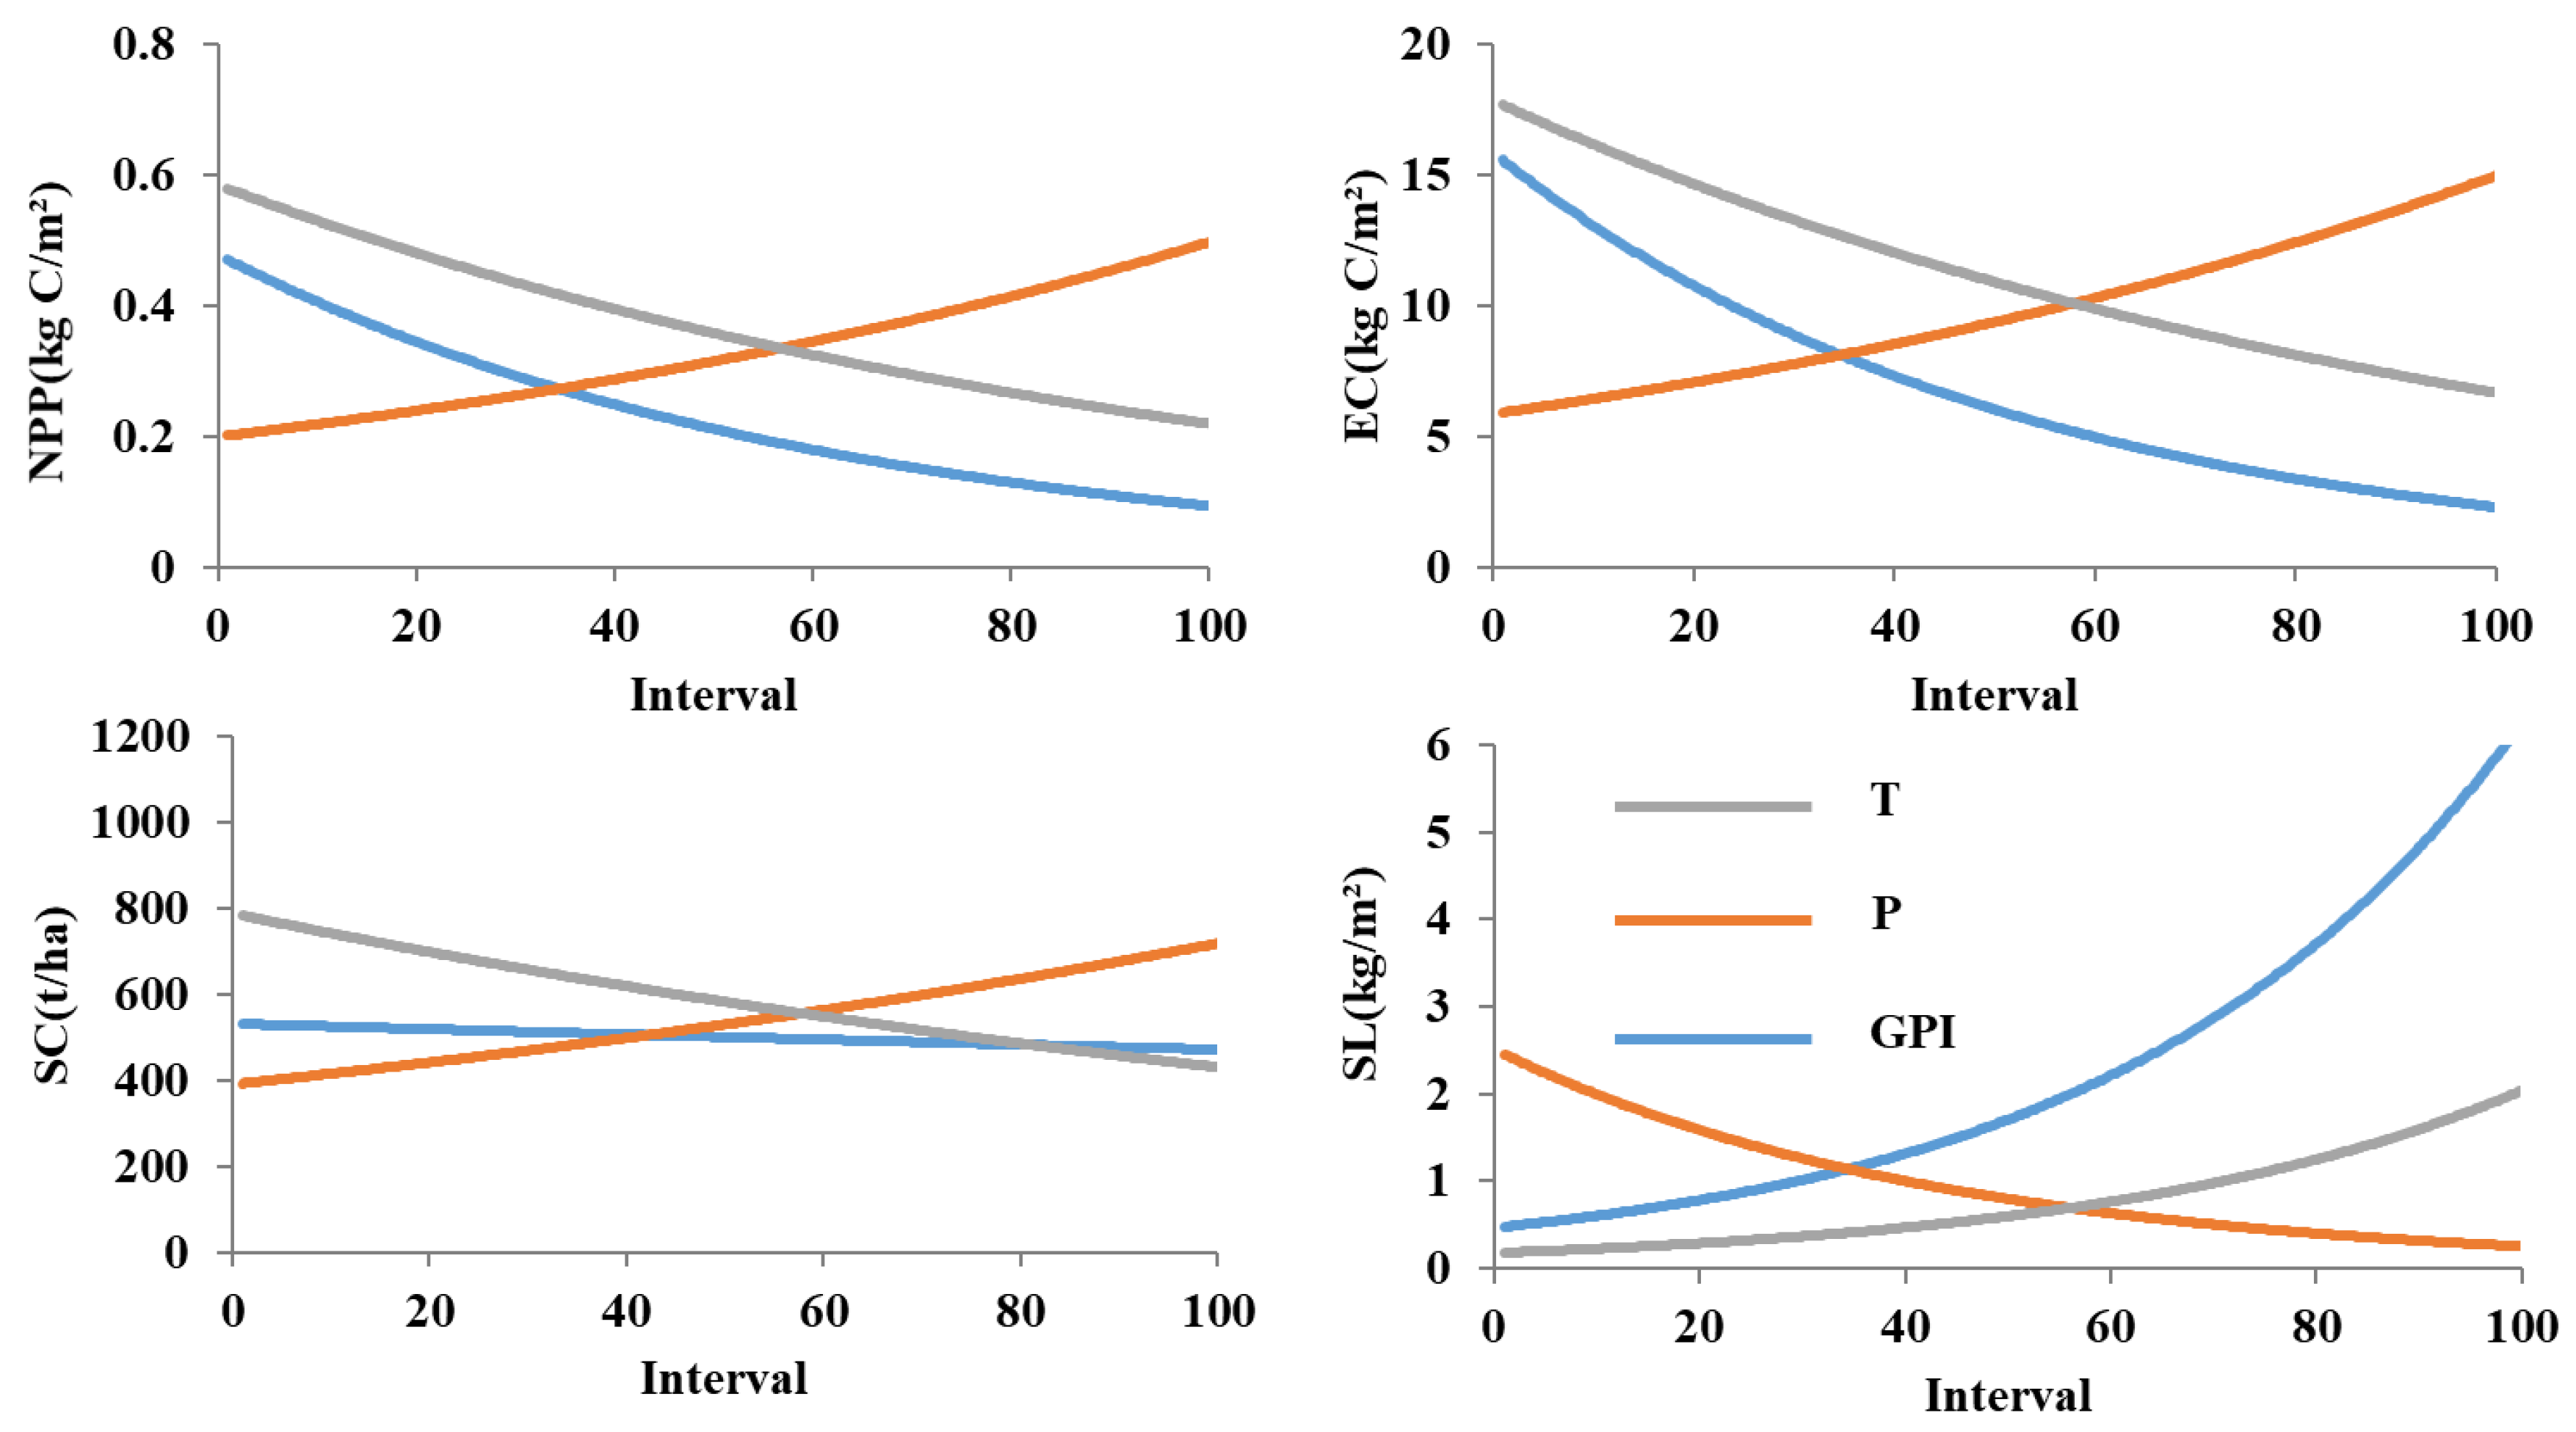
3.2.1. Single Ecosystem Service

The results (Figure 5) showed that compared with the undegraded grassland, the ecosystem services of lightly degraded grassland were slightly lower in the study area, from 2000 to 2019 (NPP, 0.01 kg C/m2 lower; EC was 0.12 kg C/m2 lower; SC, 19.31 t/ha lower; SL, 0.19 kg/m2 higher). However, compared with undegraded grassland and lightly degraded grassland, the ecosystem services of moderately degraded grassland and severely degraded grassland were significantly lower (NPP, 0.24 kg C/m2 lower; EC was 7.91 kg C/m2 lower; SC, 173.87 t/ha lower; SL, 1.72 kg/m2 higher). The results showed that the ability of grassland to provide ecosystem services decreased significantly when grassland degradation became moderate.

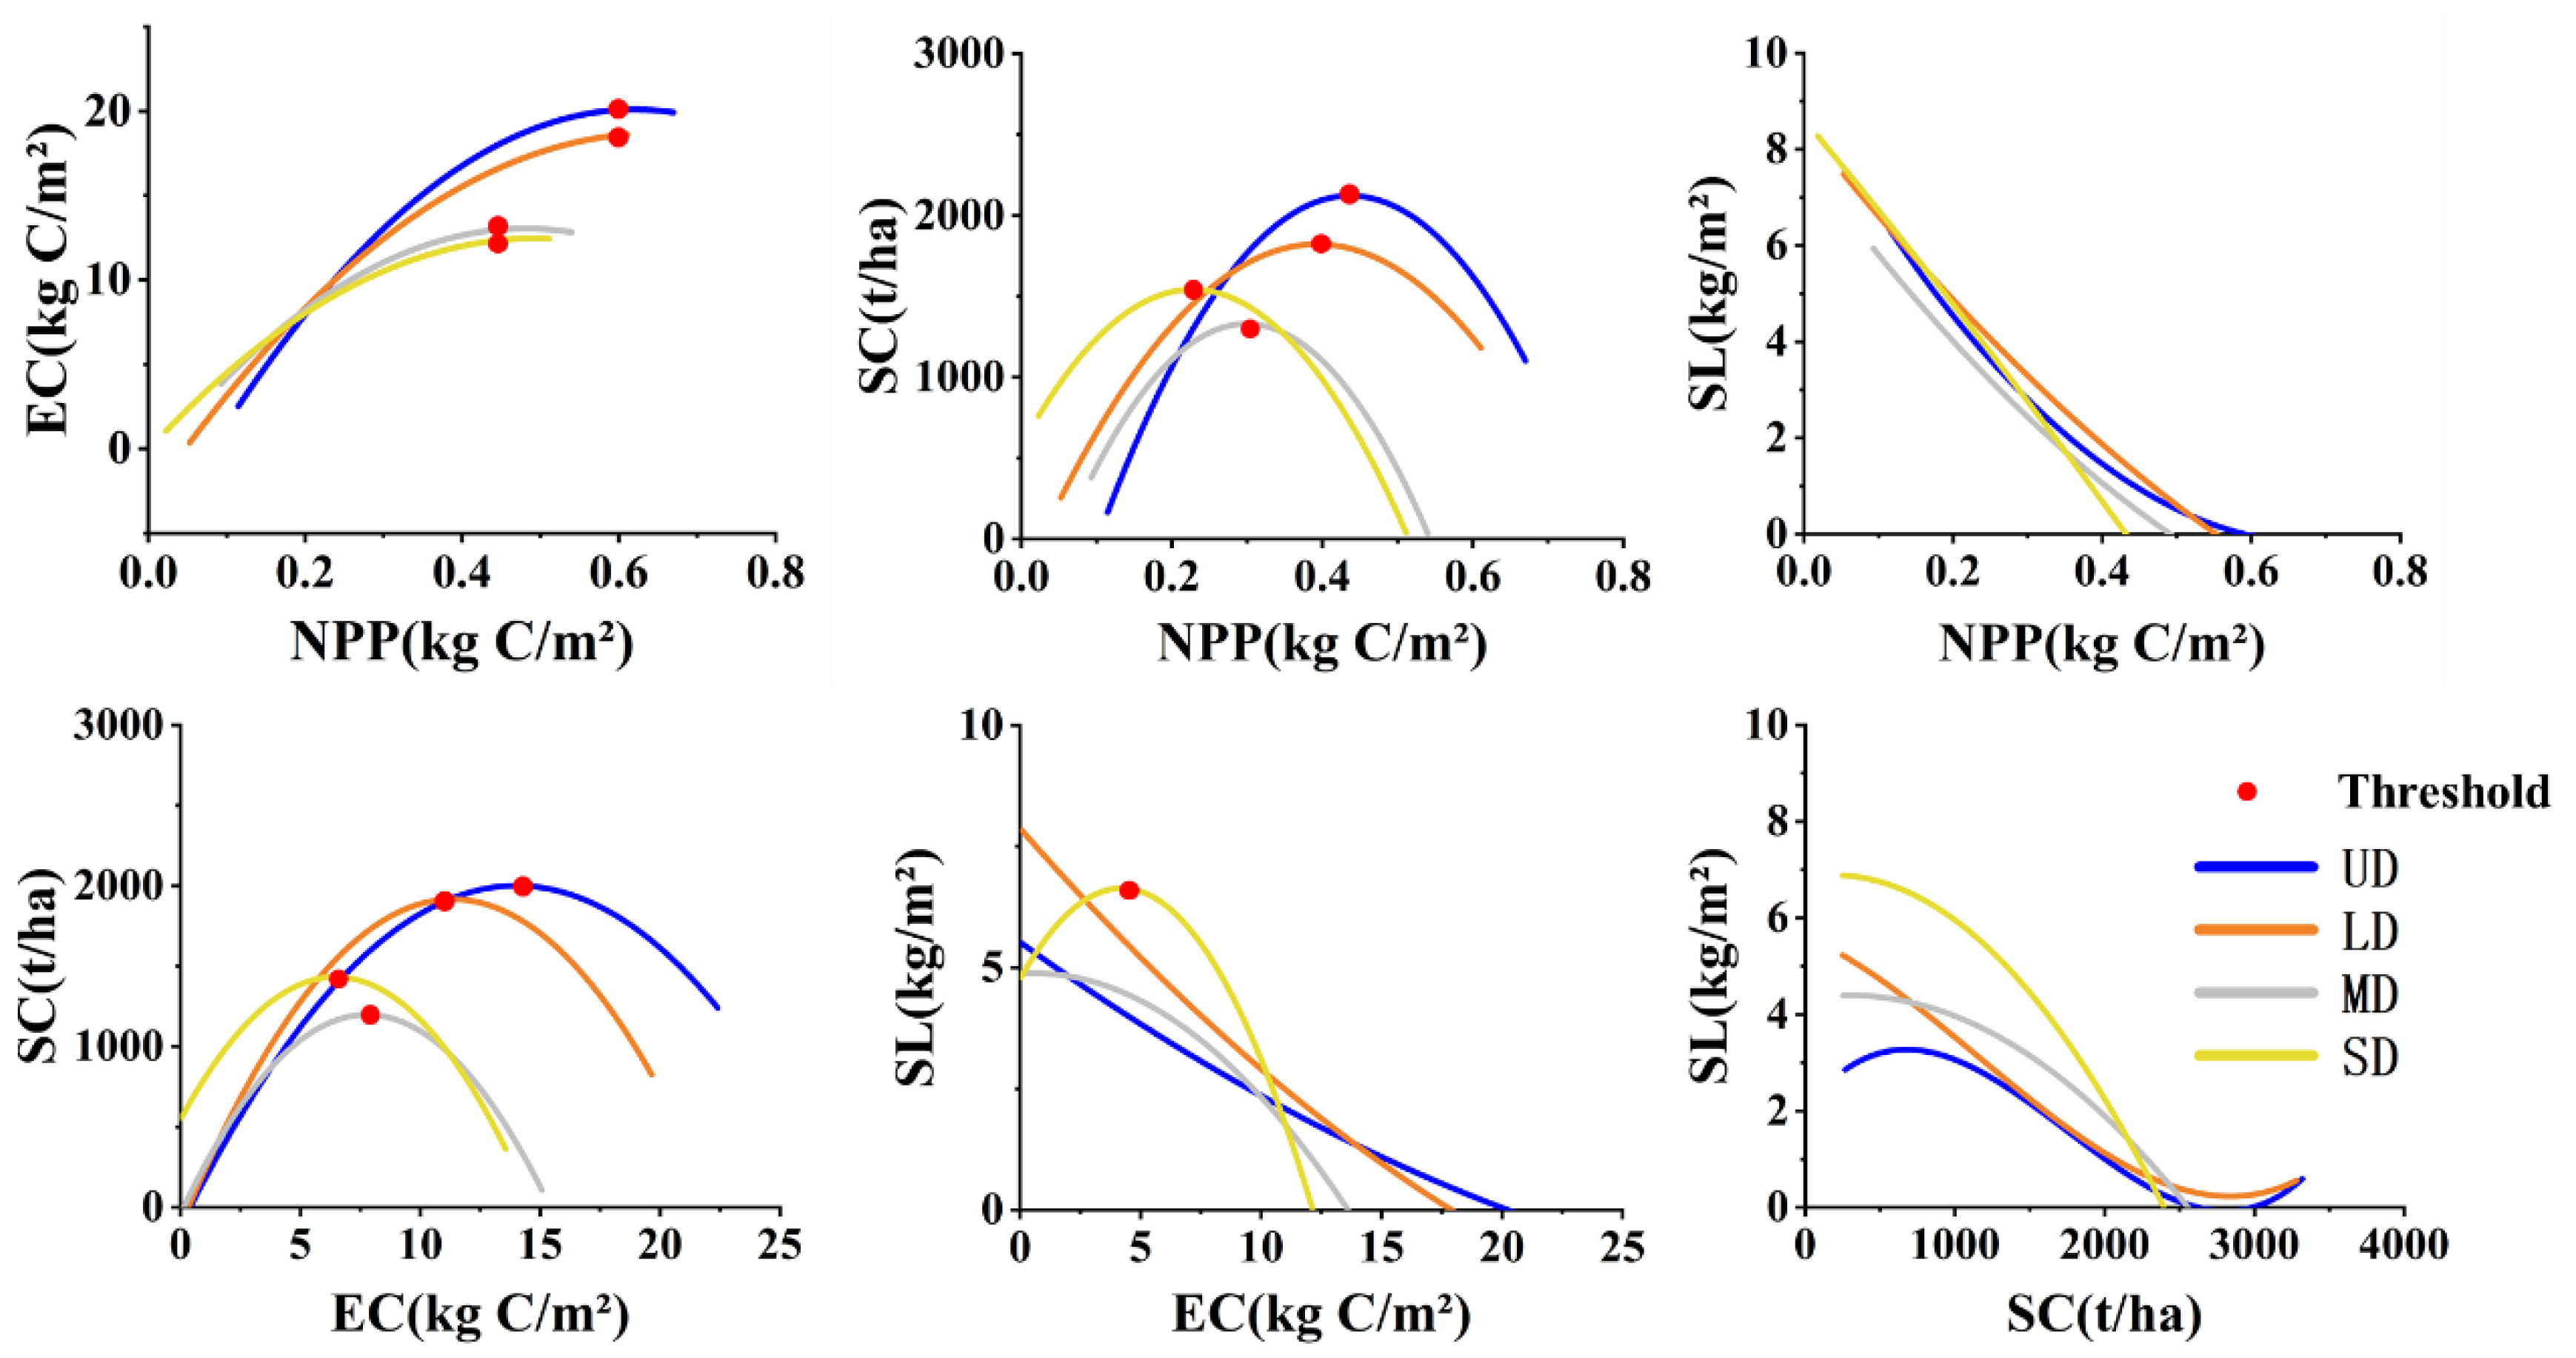
3.2.2. Paired Ecosystem Services

The results (Figure 6) showed that the constraint effect between paired ecosystem services in the process of grassland degradation succession was universal, but varied with the ecosystem service types, and was closely related to the grassland degradation degree. The constraint effect can be understood as the relativity of trade-off and synergy between paired ecosystem services, which is an important theoretical basis for ecosystem management.
With the increase in NPP, EC increased, but the increase in EC was constrained when NPP increased to a certain threshold, which was related to the grassland degradation degree. This indicated that with the aggravation of grassland degradation, the constraint effect between NPP and EC increased, and the comprehensive ability of grassland ecosystems to provide two kinds of services decreased.
With the increase in NPP, SC first increased, and then decreased when NPP increased to a certain threshold. The results showed that the lower the degradation degree, the higher the threshold value of NPP promoting soil conservation, which indicated that the soil conservation ability of grassland with a lower degradation degree was stronger. This law was similar to the relationship between EC and SC.
With the increase in SC, SL decreased, but this decrease was related to grassland degradation. Compared with undegraded grassland and lightly degraded grassland, the decrease in SL with the increase in SC in moderately degraded grassland, and especially in severely degraded grassland, was relatively greater. This law was similar to the relationship between NPP and SL.

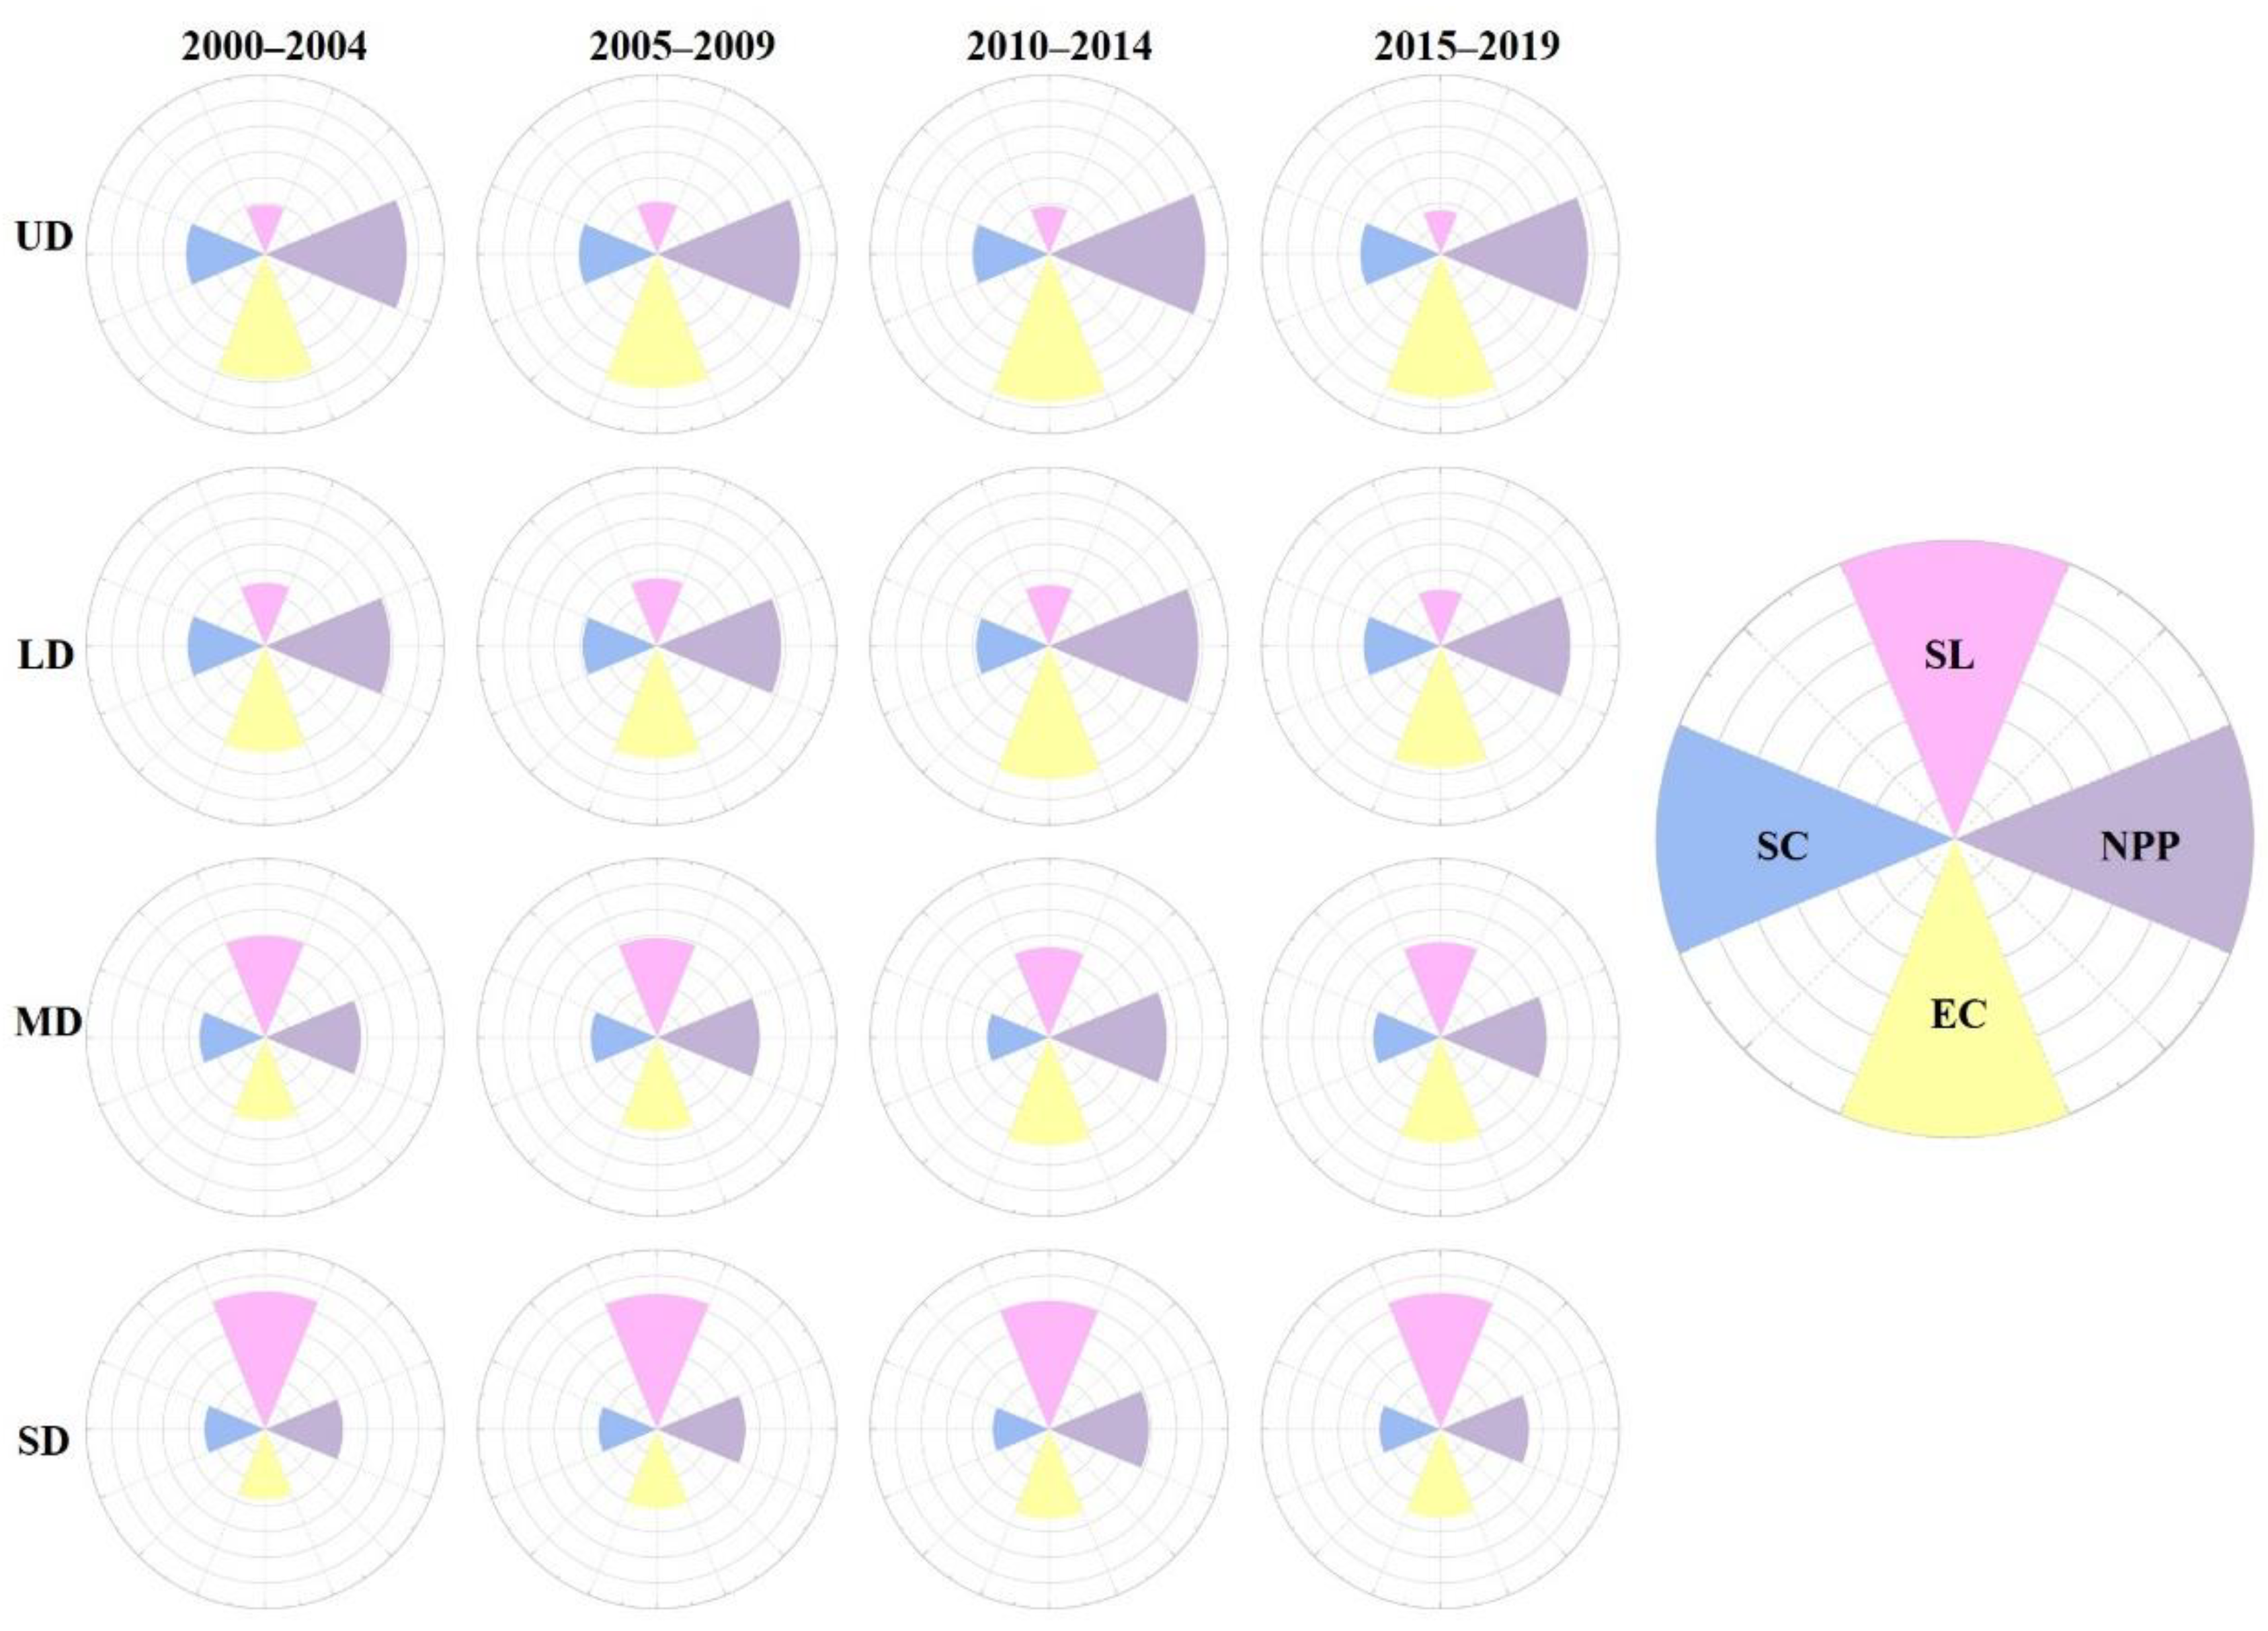
3.2.3. Ecosystem Service Bundles

Based on the gradient of grassland degradation, the cluster of ecosystem services was identified to explore the comprehensive impacts of grassland degradation on multiple ecosystem services. The results (Figure 7) showed that the NPP, EC, SC, and SL all had a certain dependence on the grassland degradation degree, and the ecosystem service clusters of different degradation gradients in the study area showed similar characteristics in 2000–2004, 2005–2009, 2010–2014, and 2015–2019. In other words, with the aggravation of grassland degradation, NPP, EC, and SC decreased significantly, SL increased significantly, ecosystem services deteriorated, and the comprehensive value of ecosystem services decreased.
Compared with SC and SL, the NPP and EC of undegraded and lightly degraded grassland always maintained a relatively higher level, which indicated that the NPP and EC were more likely to form a synergistic effect at this time. With the aggravation of grassland degradation, especially in severely degraded grassland, SL was significantly higher than the three ecosystem services of NPP, EC, and SC. At this time, the trade-off between SL and the other three services was the strongest, and the grassland ecological environment risk increased significantly.

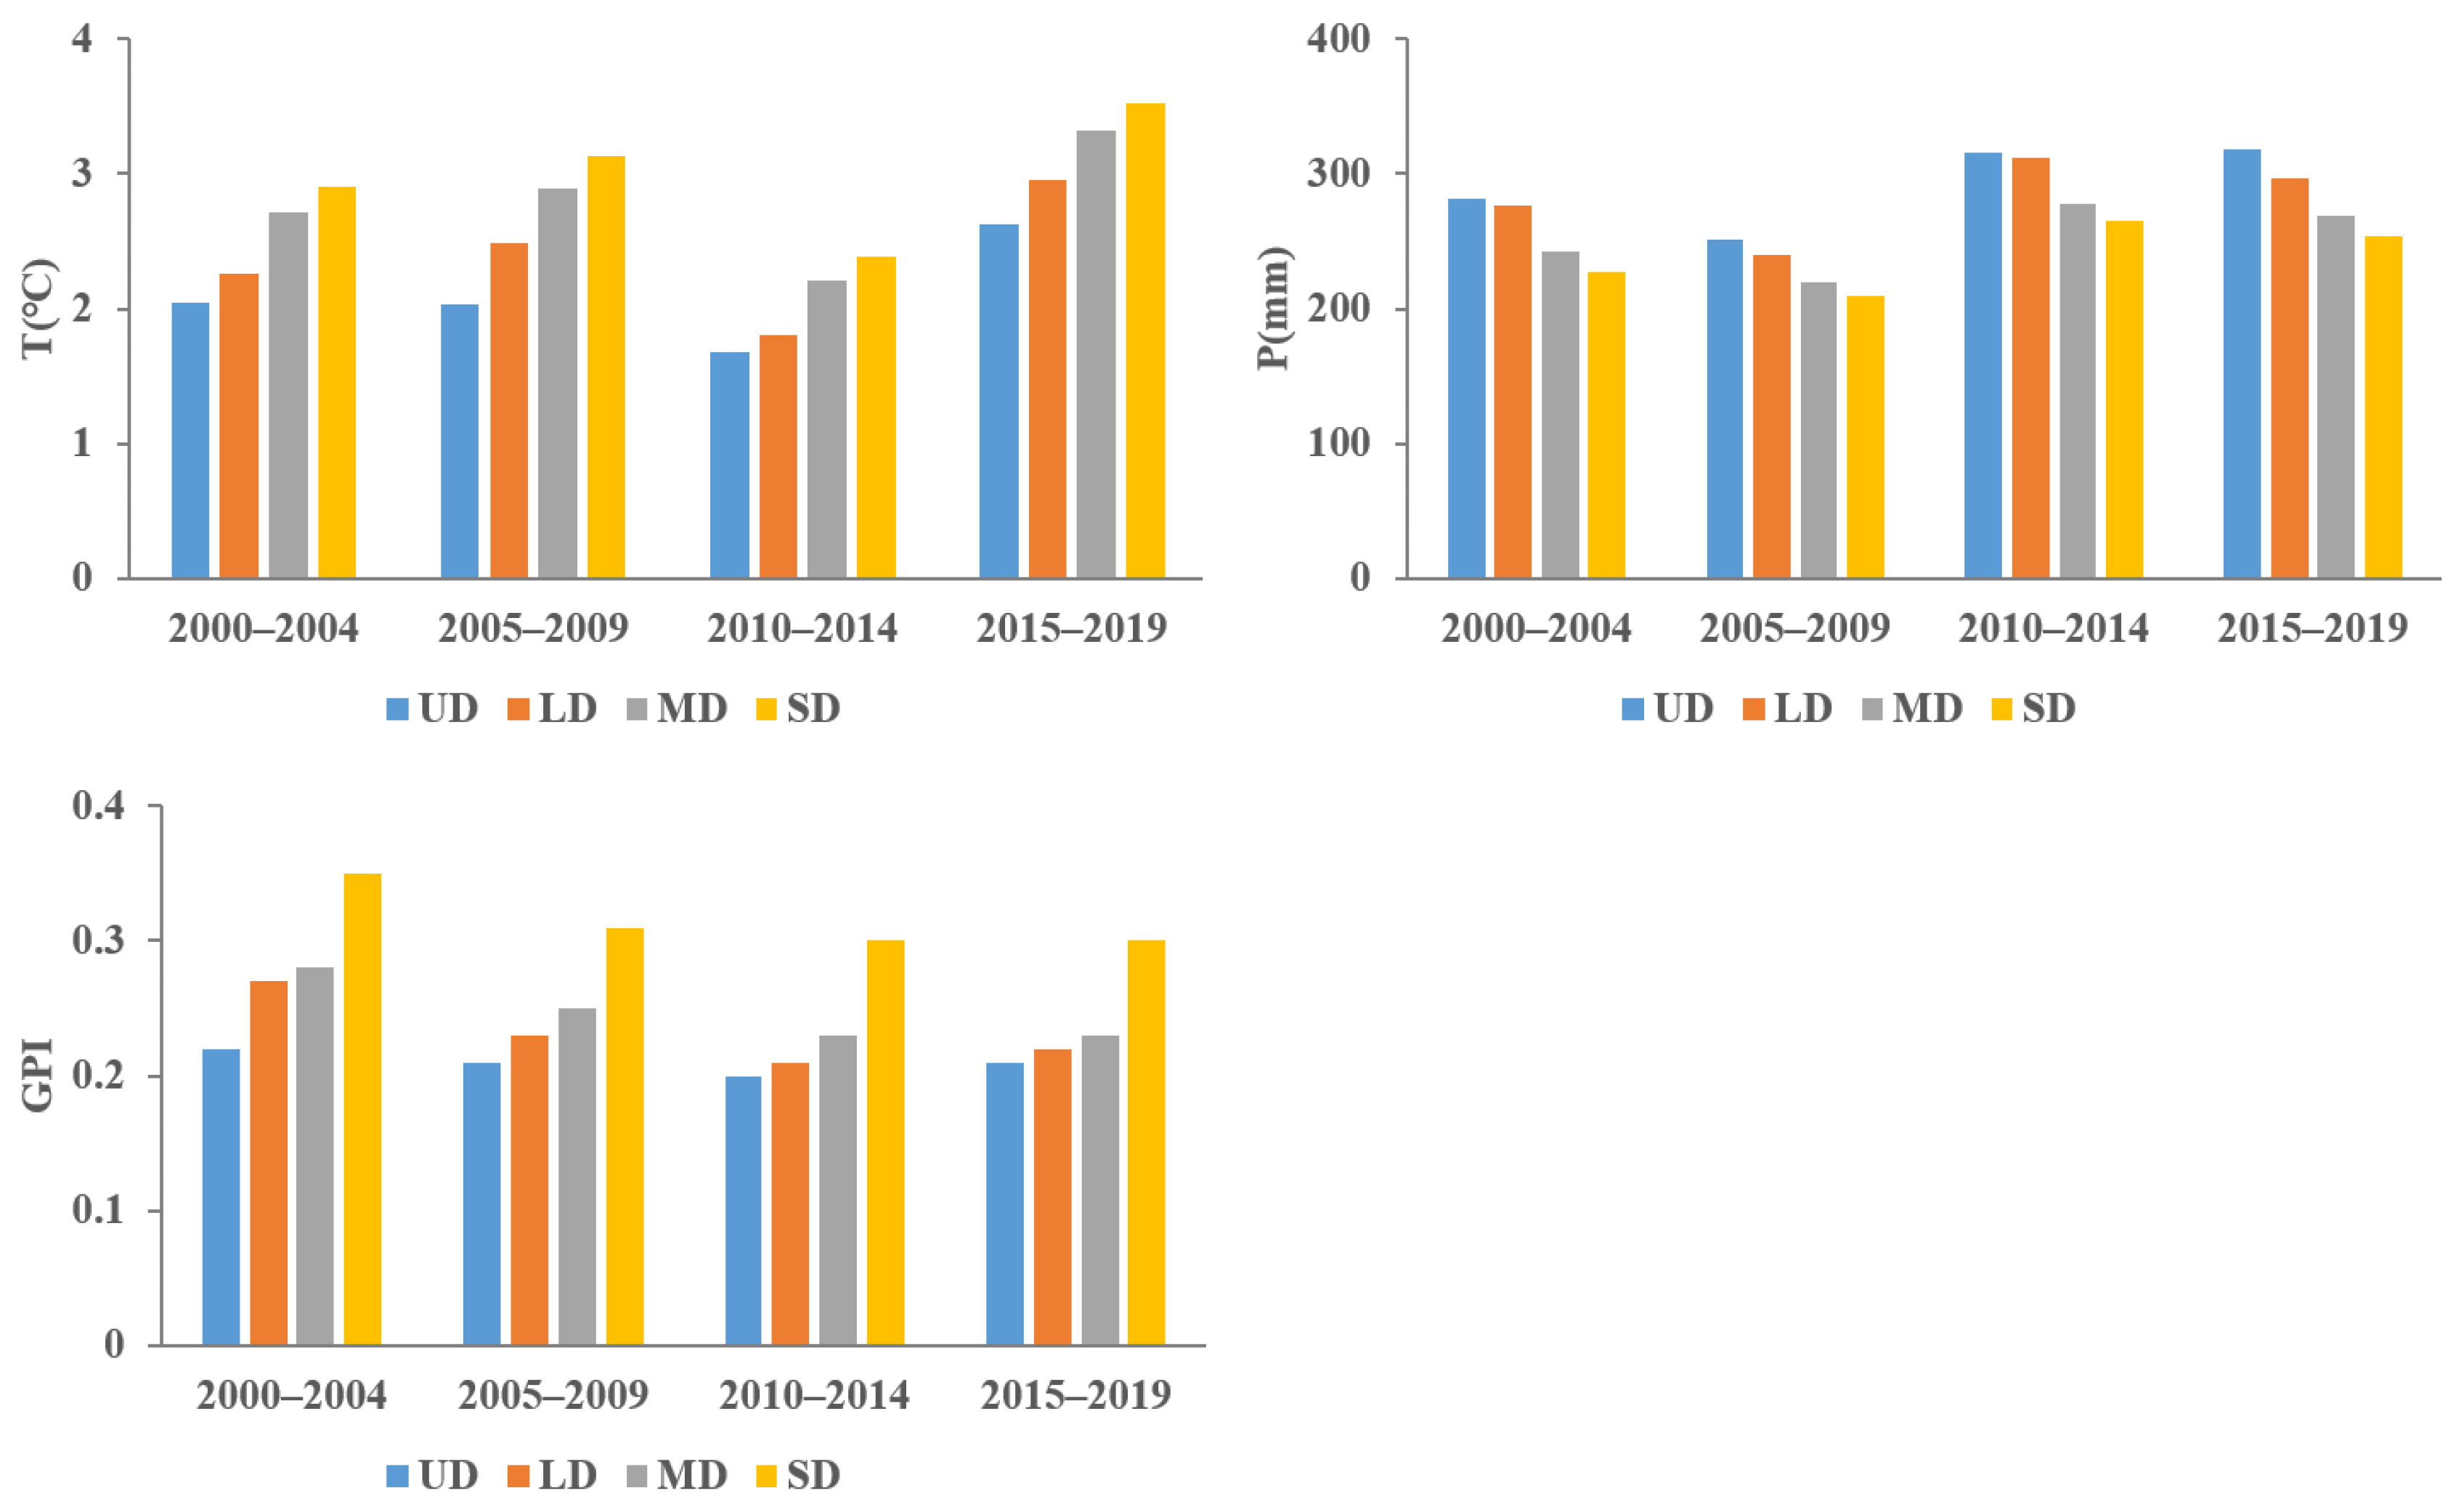
3.3. Impacts of Climate Change and Grazing Pressure on Grassland Degradation and Ecosystem Services

3.3.1. Grassland Degradation

The temporal and spatial distribution characteristics of temperature, precipitation, and grazing pressure in the study area, from 2000 to 2019, are shown in Supplementary Information S5 (Supplementary Information). According to Figure 8, temperature, precipitation, and grazing pressure were the key factors affecting grassland degradation, and the lower the temperature and grazing pressure and higher the precipitation, the lower the grassland degradation degree.

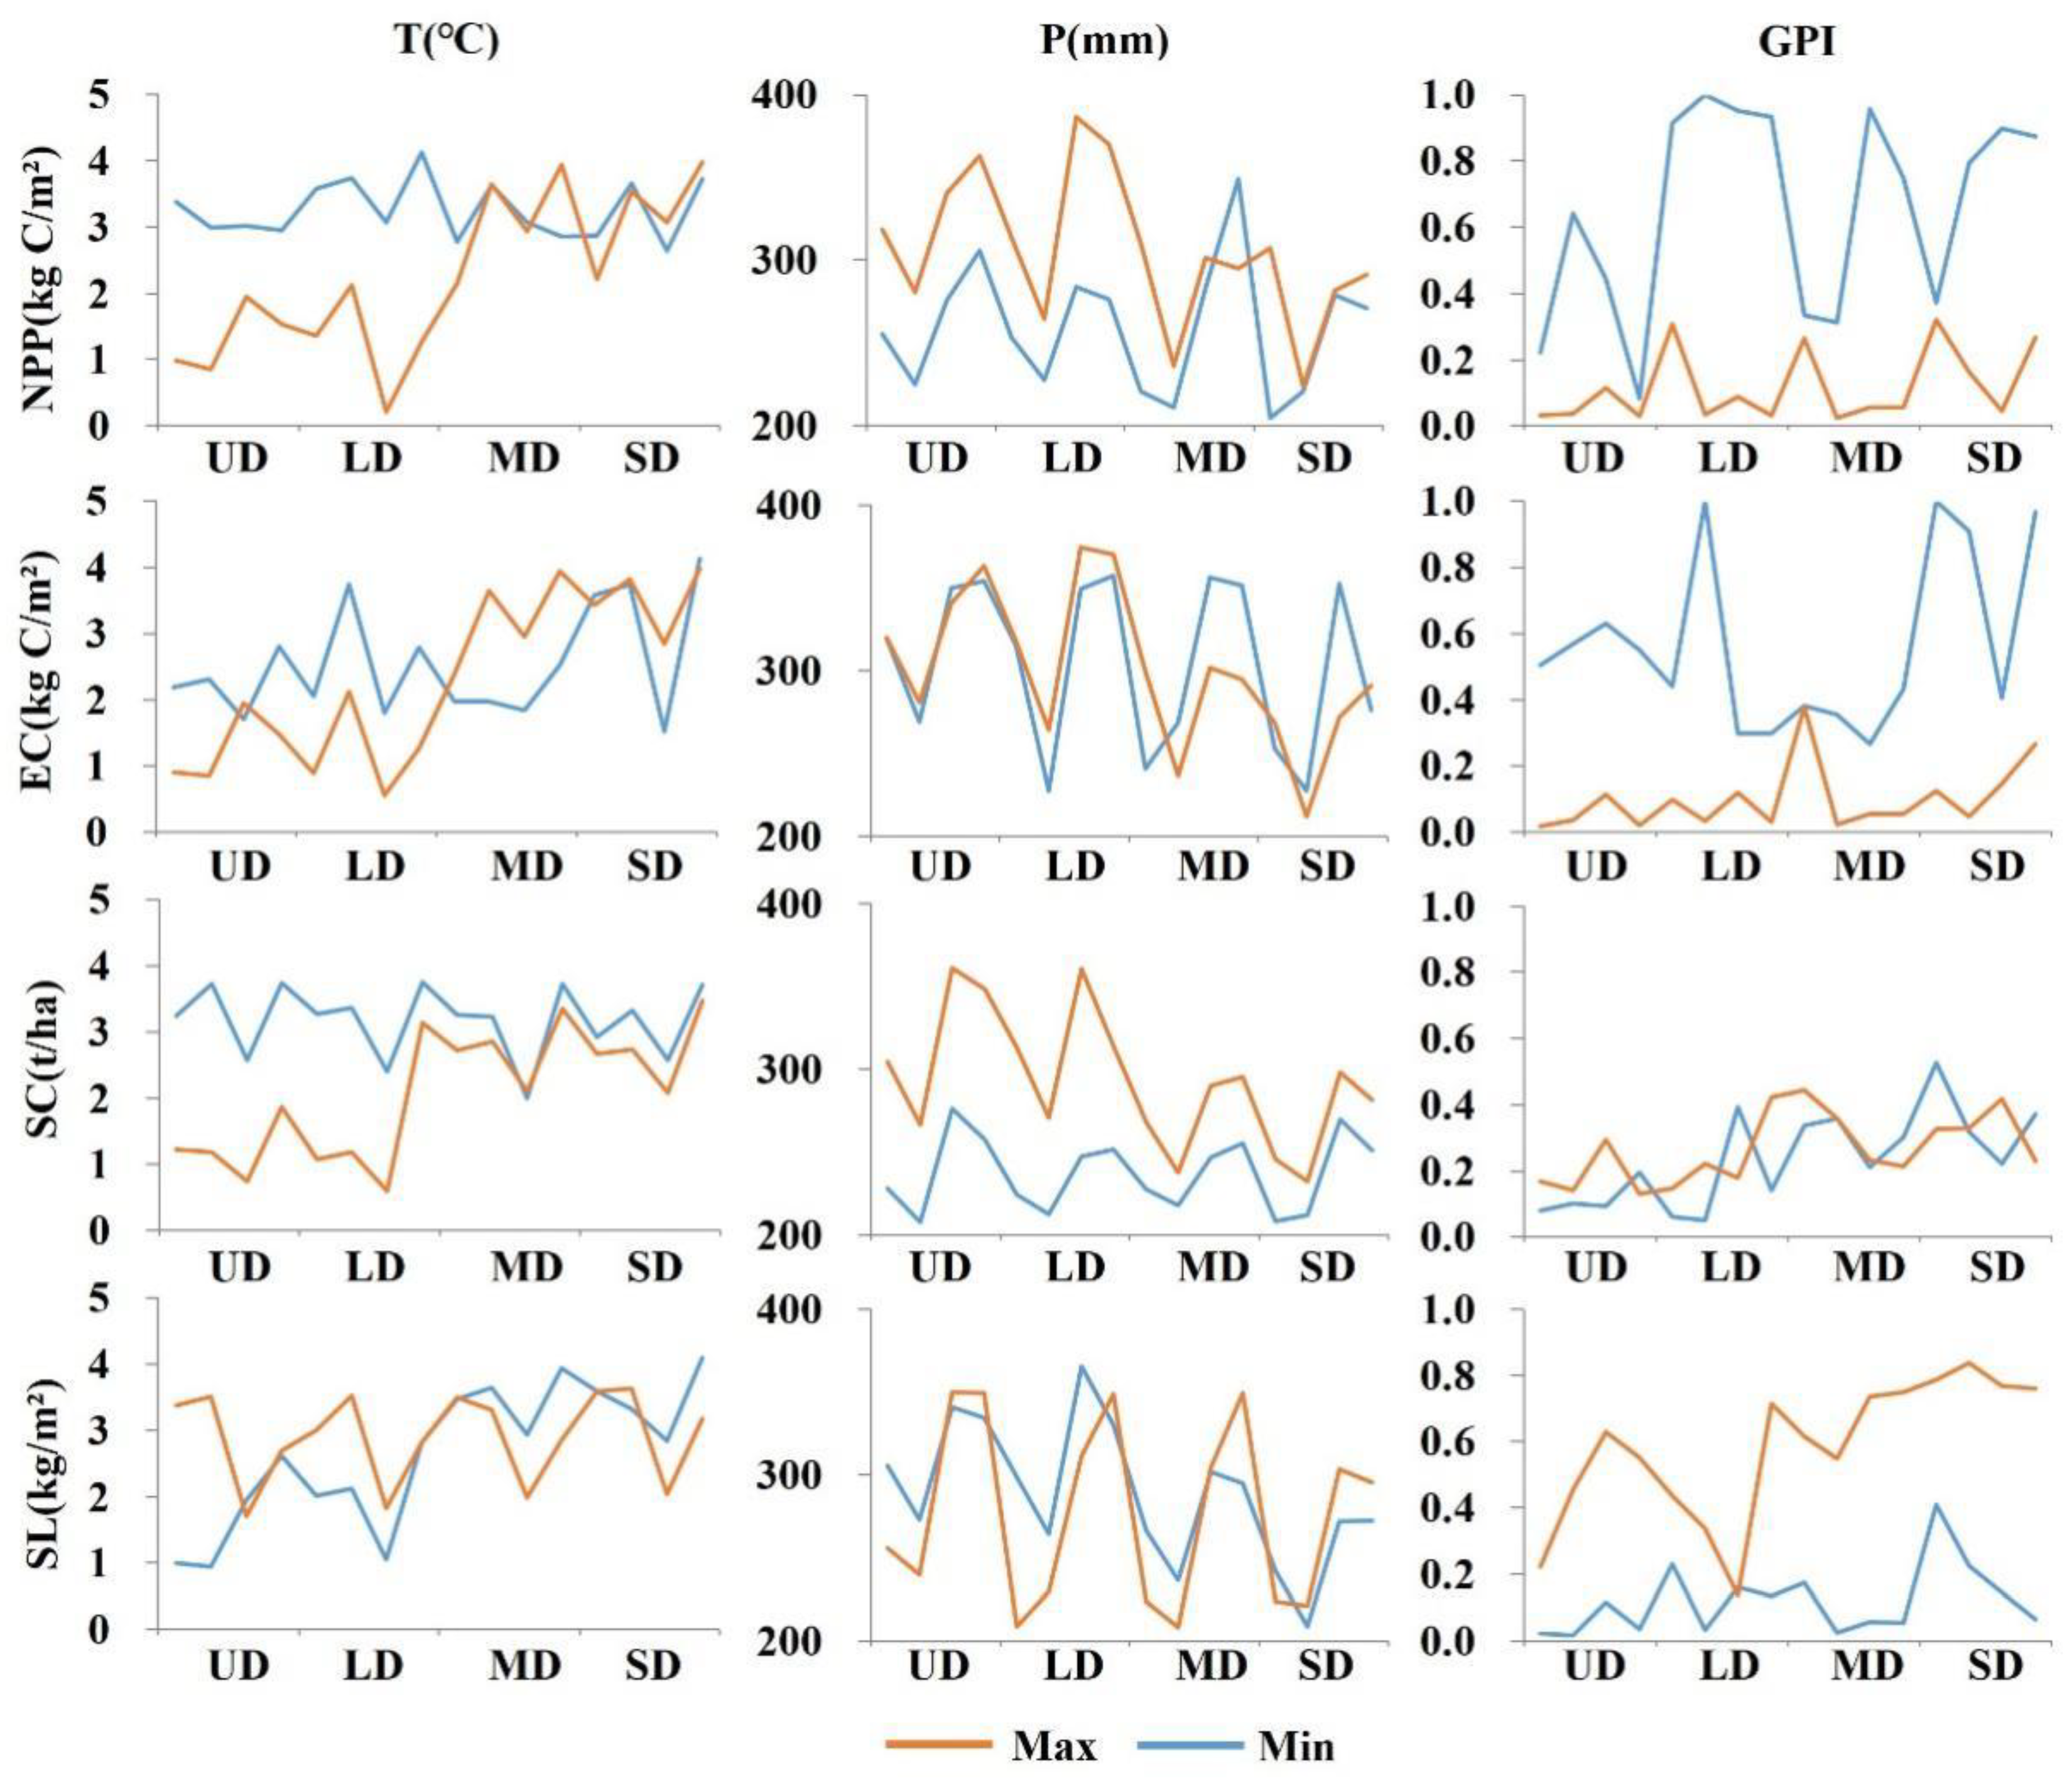
3.3.2. Ecosystem Services

In this study, climate factors and grazing pressure were divided into 100 intervals as the abscissa axis, and the ordinate axis was the average value of each ecosystem service in the corresponding interval. The research results (Figure 9) showed that there was a positive correlation between NPP, EC, and SC and precipitation, and a negative correlation between NPP, EC, and SC and temperature and grazing pressure; that is, NPP, EC, and SC increased with the increase in precipitation, and decreased with the increase in temperature or grazing pressure. There was a negative correlation between SL and precipitation, and a positive correlation between SL and temperature and grazing pressure; that is, SL decreased with the increase in precipitation, and increased with the increase in temperature or grazing pressure.
Combined with the changes in ecosystem services in different areas, the effects of temperature, precipitation, and grazing pressure on ecosystem services were quantitatively analyzed. Combined with the change value of the same ecosystem service corresponding to the unit interval of factors, the effects of temperature, precipitation, and grazing pressure on NPP and EC were similar, but the effects on SC and SL were different. Specifically, among them, temperature had the greatest impact on SC, and grazing pressure had the greatest impact on SL.

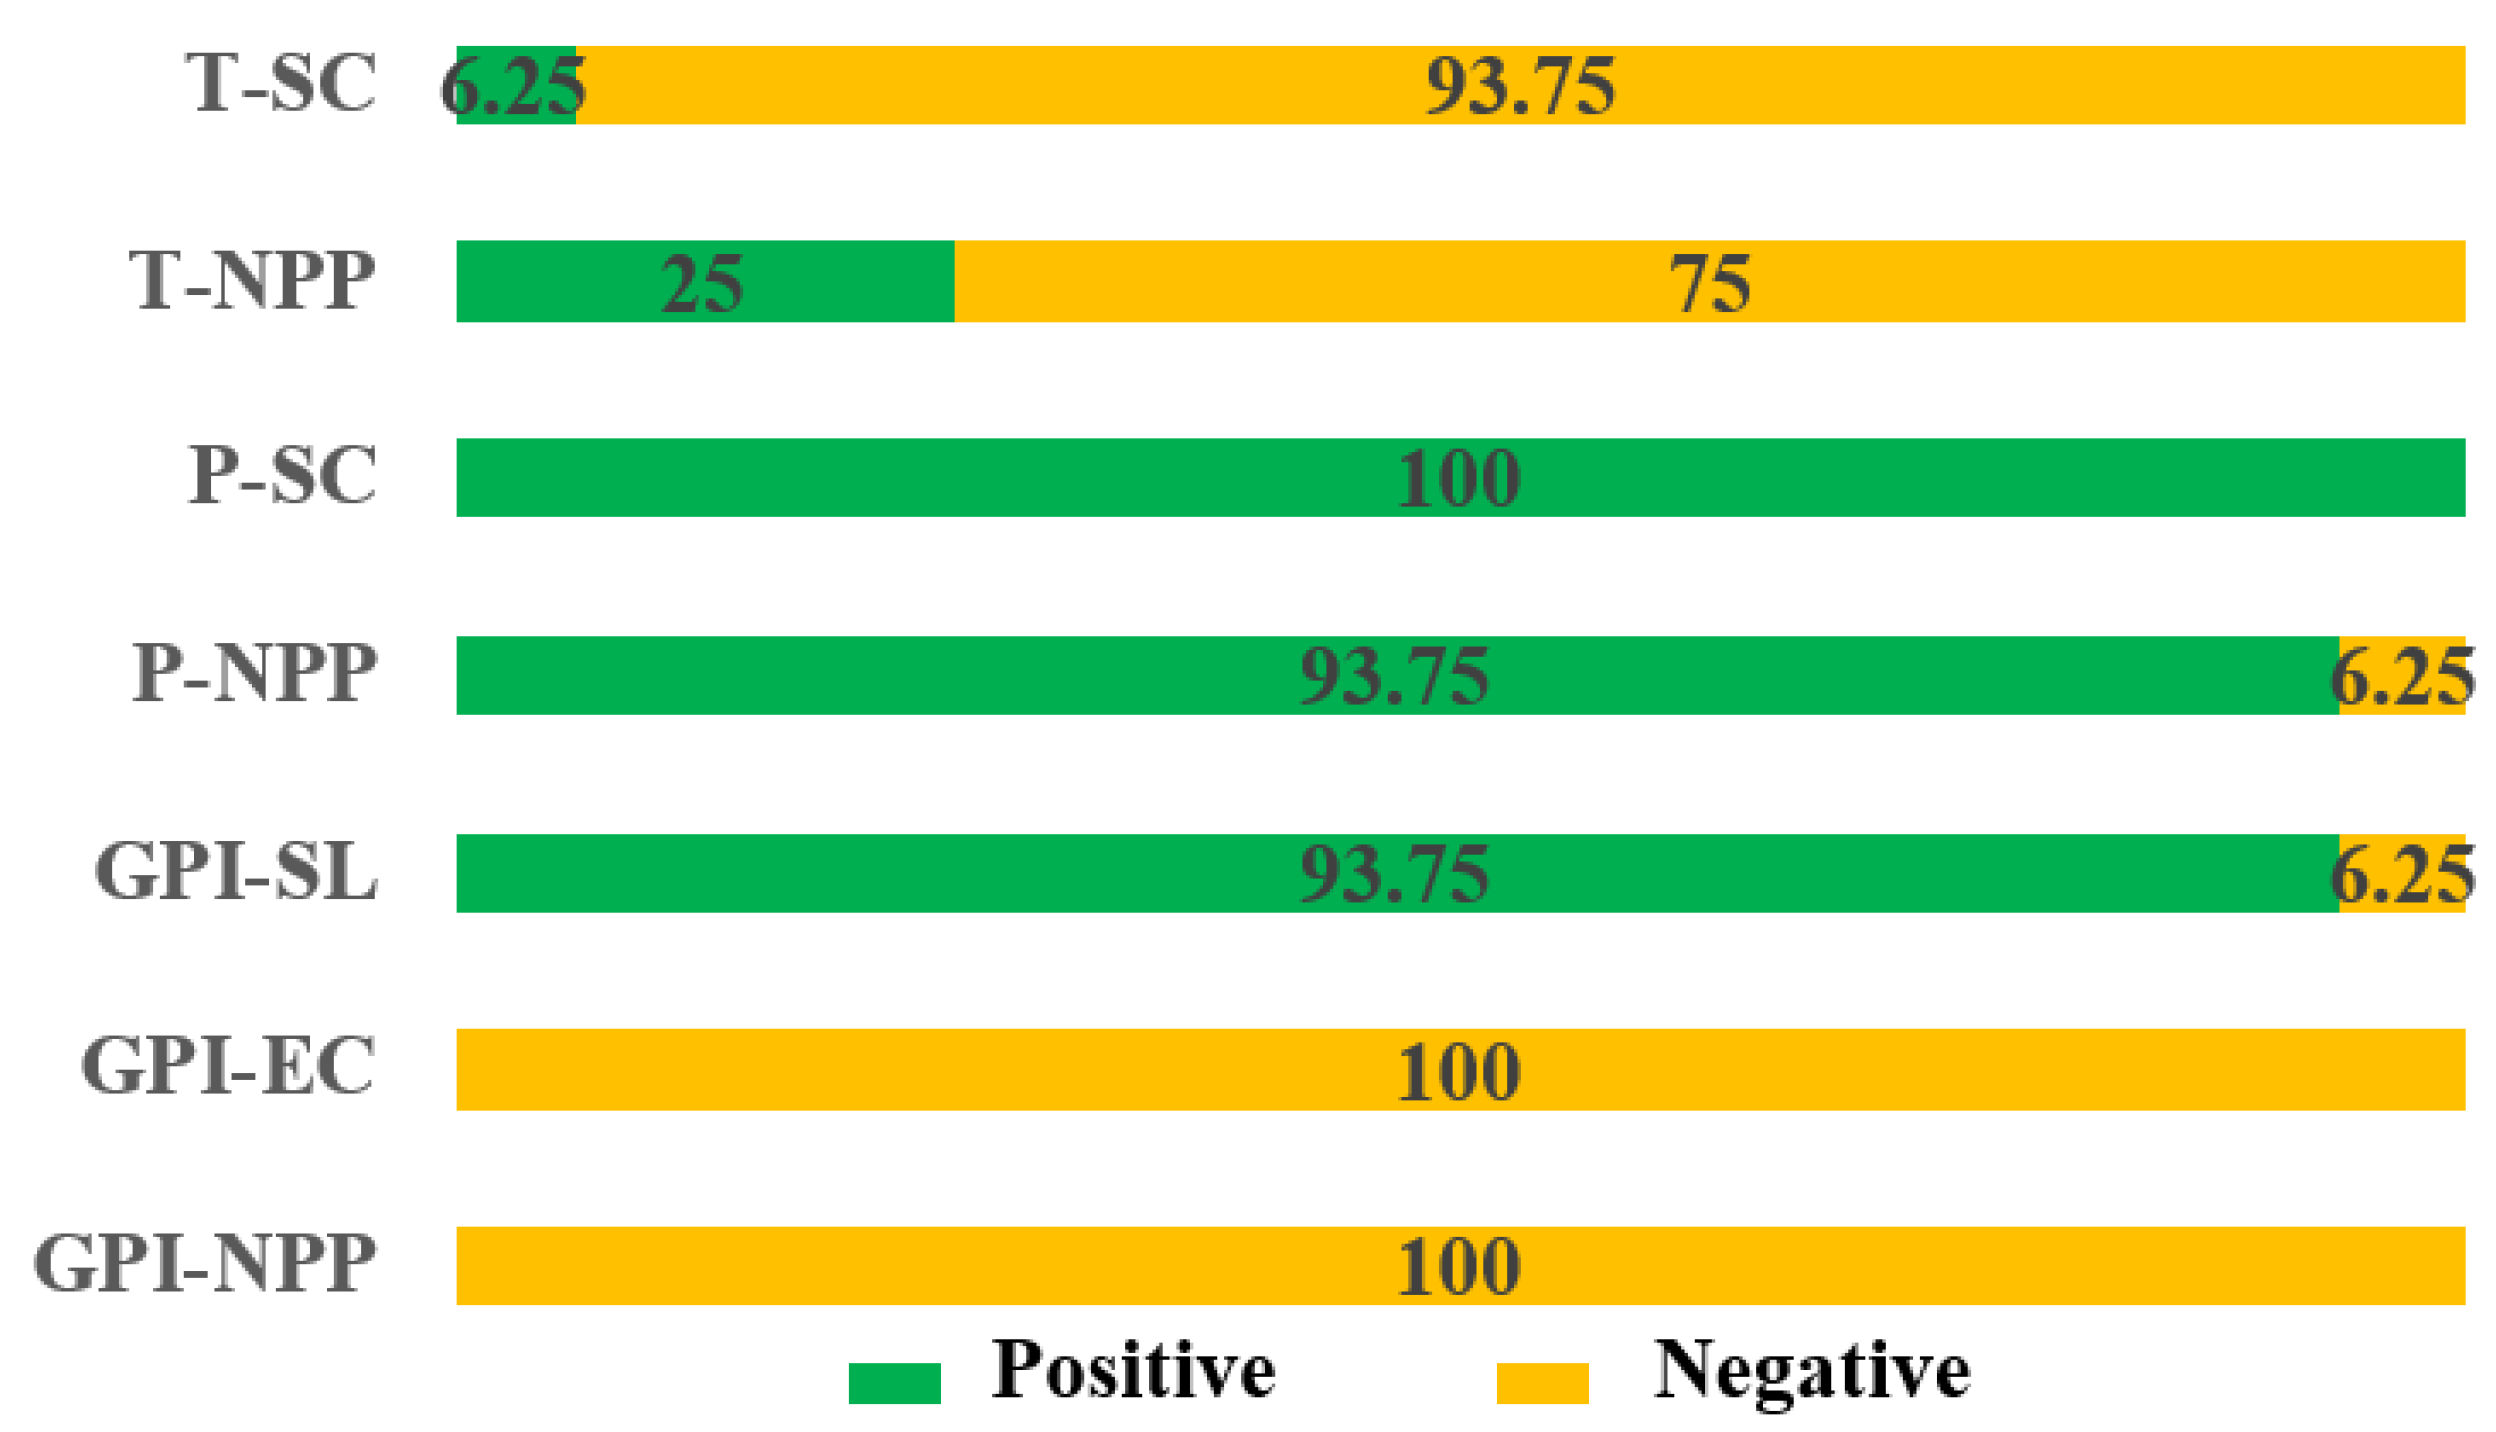
3.3.3. Relationship between Grassland Degradation and Ecosystem Services

According to Figure 10, temperature, precipitation, and grazing pressure had significant effects on the relationship between grassland degradation and ecosystem services, but the driving mechanisms were different. The relationships between grassland degradation, NPP, and SC were significantly affected by temperature. The NPP and SC were relatively higher in areas with lower temperature. Of course, the effect of temperature on NPP and SC was closely related to the grassland degradation degree. The effect was stronger in undegraded grassland and lightly degraded grassland, and it was no longer obvious when the grassland was degraded to moderate or even severe degradation. Precipitation had a significant effect on the relationship between grassland degradation, NPP, and SC. The NPP and SC were relatively higher in areas with more abundant precipitation, and this effect was gradually weakened with the aggravation of grassland degradation. Grazing pressure had a significant effect on the relationship between grassland degradation and NPP, EC, and SL, thus showing the rule of the lower the grazing pressure, the stronger the ecosystem services.
According to the influence of each variable on the relationship between grassland degradation and ecosystem services (Figure 11 and Table 3), temperature, precipitation, and grazing pressure had the greatest influence on the relationship between grassland degradation and NPP, and grazing pressure had a strong influence on the relationship between grassland degradation and ecosystem services at all stages of grassland succession. At the same time, it was found that climate factors had the strongest effect on the improvement of ecosystem services in undegraded grassland and lightly degraded grassland. In moderately and severely degraded grassland, the effects of climate factors such as precipitation increase and temperature decrease on the improvement of ecosystem services were very weak.

4. Discussion

4.1. Grassland Degradation and Ecosystem Services

4.1.1. Impacts of Grassland Degradation on Ecosystem Services

According to the research, compared with undegraded grassland and lightly degraded grassland, the average NPP of moderately degraded grassland and severely degraded grassland was 0.24 kg C/m2 lower, the average EC was 7.91 kg C/m2 lower, the average SC was 173.87 t/ha lower, and the average SL was 1.72 kg/m2 higher. With the aggravation of grassland degradation, the mean value and comprehensive value of ecosystem services decreased, and the overall capacity of grassland to provide ecosystem services decreased (Figure 5). This study further showed that the ability of grassland to provide ecosystem services decreased significantly when grassland degradation became moderate. This is basically consistent with the existing research conclusions of other scholars [6,7,8]. For instance, Zhang et al. found that the ecosystem services of alpine grassland varied along the degradation gradient, and the ecosystem services of degraded grassland were significantly lower than undegraded grassland [8]. In severely degraded grassland, the trade-off between SL and NPP, EC, and SC was the strongest, and the grassland ecological environment risk increased significantly (Figure 7). Therefore, grassland ecological restoration should focus on moderately and severely degraded grassland.
Previous studies have shown that the constraint effect between paired ecosystem services was universal [44,69]. This study further revealed that its response threshold was affected by the degree of grassland degradation. For example, the constraint threshold between NPP and SC may be because the NPP was related to the state of grassland vegetation, and the ability of vegetation to resist soil water erosion was limited. When the regional precipitation exceeded a certain amount, the soil conservation ability of vegetation decreased (Figure 6) [44]. The constraint effect between grassland degradation and ecosystem services indicated that changes in the ecological environment affected the response threshold of ecosystem services. The change in the ecological response threshold meant that grassland degradation had an essential impact on the ability of grassland to provide ecosystem services [67]. This suggests that the relevant departments should fully consider the constraint effect and response threshold between pairs of ecosystem services in grassland management, so as to formulate flexible policies and measures to improve grassland ecosystem services.

4.1.2. Relational Network of “Climate Change and Grazing Pressure-Grassland Degradation-Ecosystem Services”

This study analyzed the impacts of climate change and grazing pressure on the relationship between grassland degradation and ecosystem services, which could provide richer decision-making information for grassland management [20,21]. The increase in precipitation and the decrease in temperature and grazing pressure were conducive to the restoration of degraded grassland and the improvement of ecosystem services, and also had an impact on the relationship between grassland degradation and ecosystem services, which was related to the grassland degradation degree and varied with the types of ecosystem services (Figure 8, Figure 9 and Figure 10). The increase in precipitation and the reduction in temperature and grazing pressure helped to improve the ecosystem services of degraded grassland (Figure 10).
Temperature, precipitation, and grazing pressure had the greatest impact on the relationship between grassland degradation and NPP (Figure 11), which may have been because vegetation was the basis for the grassland to provide ecosystem services, and the impact of variables on the relationship between grassland degradation and EC, SC, and SL was achieved indirectly by affecting vegetation [72,73]. Grazing pressure had a strong effect on the relationship between grassland degradation and NPP in all stages of grassland succession (Figure 11 and Table 3). Therefore, it is important to strengthen grazing pressure management in grassland management to improve grassland ecosystem services.

4.2. Ecological Restoration and Sustainable Management

Ecological restoration is one of current research hotspots in the fields of ecology and geography and other related fields [23,29]. This study systematically discussed the grassland ecological restoration and sustainable management policy based on the relational network of “climate change and grazing pressure-grassland degradation-ecosystem services.

4.2.1. Identifying the Priorities of Regional Governance

Grassland ecological restoration depends on an accurate understanding of grassland resources. According to the characteristics of grassland ecological climate and utilization, scientific restoration measures should be formulated according to local conditions. In particular, more attention should be paid to severely degraded grassland, due to the serious degradation of ecosystem structure and loss of function in these grasslands (Figure 5, Figure 6 and Figure 7). It is suggested to highlight the regional key points, conduct routine supervision on the lightly degraded grassland, focus on the management of severely and moderately degraded grassland, and determine the regional management priority according to the climatic conditions [23].
As shown in Figure 12, the severely degraded grassland and moderately degraded grassland were mainly distributed in the surrounding areas of Arshan Baolige town, Chaokeula Sumu, Baoligen Sumu, and Xilinhot city. In addition, the precipitation was low and the temperature was high in the severely degraded areas of Arshan Baolige town and Chaokewula Sumu, and the climate conditions were the most unfavorable in these areas. These severely degraded areas should be prioritized for restoration. There were severely degraded grassland and moderately degraded grassland around Baoligen Sumu and Xilinhot city, but the proportion of severely degraded grassland was relatively low, the precipitation in this area was higher than that in Arshan Baolige town and Chaokeula Sumu, and the temperature was lower than that in Arshan Baolige town and Chaokeula Sumu. The climate conditions were relatively good, which could be used as the second stage management area. Based on the principle of addressing severe degradation before moderate degradation and combined with the climatic conditions, the priority of regional governance was determined. Grassland ecological restoration work should be conducted in the order of Arshan Baolige town > Chaokeula Sumu > Baoligen Sumu > surrounding area of Xilinhot city.

4.2.2. Improving Ecological Engineering Measures

It was found that the ecological restoration of moderately and severely degraded grasslands needs to strengthen ecological engineering measures (Figure 5, Figure 6 and Figure 7). According to the research, in the process of grassland degradation, climate factors had the strongest impact on the ability to provide ecosystem services of lightly degraded grassland (Figure 11 and Table 3). When the grasslands were moderately and severely degraded, the improvement of ecosystem services by climate factors such as precipitation increase and temperature decrease was very weak (Figure 11 and Table 3). This indicates that it is difficult to improve the ecosystem services of moderately and severely degraded grasslands through the improvement of natural conditions. Therefore, for moderately and severely degraded grasslands, it is necessary to take natural restoration measures, such as enclosure, grazing prohibition, rest grazing, and rotational grazing to further strengthen artificial intervention, and take necessary measures, such as loosening harrow, cutting turf, shallow ploughing, replanting, fertilization, and rodent and insect pest control. It is suggested that the comprehensive model of “near natural restoration + artificial restoration” should be adopted to promote the ecological restoration of moderately and severely degraded grasslands.

4.2.3. Defining the Red Line for Ecological Protection

When the resources available for allocation in the process of ecosystem management are limited, the identification of hot and cold spots of ecosystem services can provide a reference for the scientific delimitation of protection boundaries and the designation of protection priority areas (Figure 13) [74,75]. It is suggested that Maodeng Ranch, Baiyinxile Ranch, Beilike Ranch, Baiyinkulun Ranch, and Xilingol Ranch station should be set as ecological protection red line areas (regions d, g, f, i and h in Figure 12, respectively).
While delimiting the red line, it is necessary to establish a matching compensation standard to ensure the development of local government and the well-being of residents, which is very necessary for the effectiveness of ecological protection policies [76,77]. Because the typical grassland core areas of Xilingol Grassland National Nature Reserve are mostly located in the southeast of the study area, the grazing prohibition subsidy standard of the red line area of ecological protection can refer to the grazing prohibition subsidy standard of the compensation pilot of Xilingol Grassland National Nature Reserve core area (50 CNY per mu per year).

4.2.4. Identification of Ecological Engineering Zones

Using the cluster of ecosystem services to identify the cluster modes of multiple ecosystem services and divide the ecological function area of the study area is conducive to sustainable grassland management [75]. Based on the structure and distribution of ecosystem service clusters in different degradation gradients of grassland in the study area, from 2000 to 2019, and considering the location of the sumus or towns in the study area, three types of ecological function zoning were proposed.
The first kind of ecological function area is located in Maodeng Ranch, Baiyinxile Ranch, Beilike Ranch, Baiyinkulun Ranch, and Xilingol ranch station (regions d, g, f, i and h in Figure 12, respectively). As far as the whole study area is concerned, NPP, EC, and SC were the highest in these areas, while SL was the lowest. The ecological protection of this kind of ecological function area should be prioritized so as to avoid grassland degradation and maintain a high level of ecosystem services.
The second kind of ecological function area is located in Baoligen Sumu and Chaokewula Sumu (regions c and b in Figure 12, respectively). Compared with the first kind of ecological function area, the NPP, EC, and SC of these areas were relatively lower, while the SL was relatively higher. Reducing the grazing pressure in these areas is necessary to ensure the stability of the regional ecological environment and slow down grassland degradation.
The third kind of ecological function area is located in Arshan Baolige town (region a in Figure 12). In this area, the NPP, EC, and SC were the lowest, and the trade-off between SL and other services was the strongest. For this third kind of ecological function area, it is necessary to strictly control grazing pressure, implement relevant payment policies for ecosystem services, compensate herdsmen through economic compensation, and actively carry out ecological restoration of degraded grassland.

4.3. Limitations and Future Research Directions

Grassland provides a variety of ecosystem services, and we have selected only some of the key ecosystem services that are of wide interest in the arid and semi-arid steppe [69,70]. In this study, four ecosystem services including NPP, EC, SC, and SL were selected to be quantitatively evaluated and analyzed. It is necessary to introduce more ecosystem services in the future. In addition, since the results of comprehensive assessment of grassland degradation are not pixel scale, we mainly used spatial statistics and analysis methods to analyze the impacts of climate change and grazing pressure on grassland degradation, ecosystem services and their relationship, which may increase the uncertainty of the results to some extent.

5. Conclusions

From the perspective of the “climate change and grazing pressure-grassland degradation-ecosystem services” network, this study explored the grassland ecological restoration and sustainable management in the study area. This study evaluated and analyzed the spatial and temporal distribution characteristics of grassland degradation and four ecosystem services in the study area, from 2000 to 2019, systematically discussed the impact of grassland degradation on a single ecosystem service, paired ecosystem services, and ecosystem service clusters, and revealed the impacts of climate change and grazing pressure on the relationship between grassland degradation and ecosystem services from the perspective of ecosystem services. It was found that grassland degradation had a significant impact on ecosystem services and their relationships, but it varied with the types of ecosystem services. Although the degraded grassland in the study area has been in a state of recovery and ecosystem services have been improving in the past 20 years, the degradation of grassland in some areas has intensified, and there are still ecological risks, so it is necessary to continue to carry out ecological restoration work. Taking the local conditions into consideration, grassland ecological restoration and sustainable management policy suggestions were proposed. The research results have important practical significance for the ecological conservation of typical steppe areas and the formulation of sustainable development strategies in the arid and semi-arid areas.

Supplementary Materials

The following supporting information can be downloaded at: https://www.mdpi.com/article/10.3390/rs14205120/s1, Supplementary Information S1. Functional Zoning of The Xilingol Grassland National Nature Reserve; Supplementary Information S2. Quantification of 4 Ecosystem Services; Supplementary Information S3. Spatial Simulation of Grazing Pressure; Supplementary Information S4. Spatial Distribution of Ecosystem Services In the Study Area from 2000 to 2019; Supplementary Information S5. Temporal and Spatial Distribution of Temperature, Precipitation and Grazing Intensity In the Study Area from 2000 to 2019. References [46,47,48,49,50,51,52,53,54,55,56,57,58,59,60,61,62,63,64,65] are cited in the supplementary materials.

Author Contributions

Conceptualization, X.L. (Xin Lyu) and X.L. (Xiaobing Li); Data curation, X.L. (Xin Lyu), D.D., H.D. and K.W.; Funding acquisition, X.L. (Xiaobing Li); Methodology, X.L. (Xin Lyu), D.D., H.D. and K.W.; Project administration, X.L. (Xiaobing Li); Software, X.L. (Xin Lyu); Supervision, X.L. (Xiaobing Li); Visualization, X.L. (Xin Lyu); Writing—original draft, X.L. (Xin Lyu), X.L. (Xiaobing Li), D.D., H.D. and K.W.; Writing—review & editing, X.L. (Xin Lyu), X.L. (Xiaobing Li), J.G., H.W. and S.L. All authors have read and agreed to the published version of the manuscript.

Funding

This study was funded by the Key Science and Technology Special Program of Inner Mongolia Autonomous Region (grant nos. 2021ZD0015-01 and 2021ZD0011-04), and the Project Supported by State Key Laboratory of Earth Surface Processes and Resource Ecology (grant no. 2022-ZD-02).

Data Availability Statement

The data that support the findings of this study are available from the corresponding author upon reasonable request.

Conflicts of Interest

The authors declare no conflict of interest.

References

  1. Wang, B.; Yan, H.; Wen, X.; Niu, Z. Satellite-Based Monitoring on Green-Up Date for Optimizing the Rest-Grazing Period in Xilin Gol Grassland. Remote Sens. 2022, 14, 3443. [Google Scholar] [CrossRef]
  2. Lyu, X.; Li, X.; Wang, H.; Gong, J.; Li, S.; Dou, H.; Dang, D. Soil wind erosion evaluation and sustainable management of typical steppe in Inner Mongolia, China. J. Environ. Manage. 2021, 277, 111488. [Google Scholar] [CrossRef] [PubMed]
  3. Wang, C.; Wei, M.; Wu, B.; Wang, S.; Jiang, K. Alpine grassland degradation reduced plant species diversity and stability of plant communities in the Northern Tibet Plateau. Acta Oecologica. 2019, 98, 25–29. [Google Scholar] [CrossRef]
  4. Hu, A.; Millner, J.; Hou, F. Introduction of woody and herbaceous legumes influences productivity, diversity and soil properties in a degraded grassland. Land Degrad. Dev. 2021, 32, 3762–3772. [Google Scholar] [CrossRef]
  5. Zong, N.; Shi, P.; Zheng, L.; Zhou, T.; Cong, N.; Hou, G.; Song, M.; Tian, J.; Zhang, X.; Zhu, J. Restoration effects of fertilization and grazing exclusion on different degraded alpine grasslands: Evidence from a 10-year experiment. Ecol. Eng. 2021, 170, 106361. [Google Scholar] [CrossRef]
  6. Miehe, G.; Schleuss, P.-M.; Seeber, E.; Babel, W.; Biermann, T.; Braendle, M.; Chen, F.; Coners, H.; Foken, T.; Gerken, T.; et al. The Kobresia pygmaea ecosystem of the Tibetan highlands–Origin, functioning and degradation of the world’s largest pastoral alpine ecosystem: Kobresia pastures of Tibet. Sci. Total Environ. 2019, 648, 754–771. [Google Scholar] [CrossRef] [PubMed]
  7. Zhang, X.; Niu, J.; Buyantuev, A.; Zhang, Q.; Dong, J.; Kang, S.; Zhang, J. Understanding Grassland Degradation and Restoration from the Perspective of Ecosystem Services: A Case Study of the Xilin River Basin in Inner Mongolia, China. Sustainability 2016, 8, 594. [Google Scholar] [CrossRef] [Green Version]
  8. Wen, L.; Dong, S.; Li, Y.; Li, X.; Shi, J.; Wang, Y.; Liu, D.; Ma, Y. Effect of degradation intensity on grassland ecosystem services in the alpine region of Qinghai-Tibetan Plateau, China. PLoS ONE 2013, 8, e58432. [Google Scholar] [CrossRef] [PubMed] [Green Version]
  9. Wang, Z.; Ma, Y.; Zhang, Y.; Shang, J. Review of Remote Sensing Applications in Grassland Monitoring. Remote Sens. 2022, 14, 2903. [Google Scholar] [CrossRef]
  10. Lyu, X.; Li, X.; Gong, J.; Wang, H.; Dang, D.; Dou, H.; Li, S.; Liu, S. Comprehensive grassland degradation monitoring by remote sensing in Xilinhot, Inner Mongolia, China. Sustainability 2020, 12, 3682. [Google Scholar] [CrossRef]
  11. Schirpke, U.; Kohler, M.; Leitinger, G.; Fontana, V.; Tasser, E.; Tappeiner, U. Future impacts of changing land-use and climate on ecosystem services of mountain grassland and their resilience. Ecosyst. Serv. 2017, 26, 79–94. [Google Scholar] [CrossRef]
  12. Lavorel, S.; Colloff, M.J.; Locatelli, B.; Gorddard, R.; Prober, S.M.; Gabillet, M.; Devaux, C.; Laforgue, D.; Peyrache-Gadeau, V. Mustering the power of ecosystems for adaptation to climate change. Environ. Sci. Policy 2019, 92, 87–97. [Google Scholar] [CrossRef]
  13. Jäger, H.; Peratoner, G.; Tappeiner, U.; Tasser, E. Grassland biomass balance in the European Alps: Current and future ecosystem service perspectives. Ecosyst. Serv. 2020, 45, 101163. [Google Scholar] [CrossRef]
  14. Zhang, G.; Yan, J.; Zhu, X.; Ling, H.; Xu, H. Spatio-temporal variation in grassland degradation and its main drivers, based on biomass: Case study in the Altay Prefecture, China. Glob. Ecol. Conserv. 2019, 20, e00723. [Google Scholar] [CrossRef]
  15. Underwood, E.; Hollander, A.; Safford, H.; Kim, J.; Srivastava, L.; Drapek, R. The impacts of climate change on ecosystem services in southern California. Ecosyst. Serv. 2019, 39, 101008. [Google Scholar] [CrossRef]
  16. Talukdar, S.; Singha, P.; Shahfahad; Mahato, S.; Praveen, B.; Rahman, A. Dynamics of ecosystem services (ESs) in response to land use land cover (LULC) changes in the lower Gangetic plain of India. Ecol. Indic. 2020, 112, 106121. [Google Scholar] [CrossRef]
  17. Fan, F.; Liang, C.; Tang, Y.; Harker-Schuch, I.; Porter, J.R. Effects and relationships of grazing intensity on multiple ecosystem services in the Inner Mongolian steppe. Sci. Total Environ. 2019, 675, 642–650. [Google Scholar] [CrossRef] [PubMed]
  18. Nakano, T.; Bavuudorj, G.; Iijima, Y.; Ito, T.Y. Quantitative evaluation of grazing effect on nomadically grazed grassland ecosystems by using time-lapse cameras. Agric. Ecosyst Environ. 2020, 287, 106685. [Google Scholar] [CrossRef]
  19. Holling, C.S. Resilience and stability of ecological systems. Ann. Rev. Ecol. Syst. 1973, 4, 1–23. [Google Scholar] [CrossRef] [Green Version]
  20. Xu, J.; Grumbine, R.E. Building ecosystem resilience for climate change adaptation in the Asian highlands. Wires Clim. Change 2014, 5, 709–718. [Google Scholar] [CrossRef]
  21. Hodgson, D.; McDonald, J.; Hosken, D. What do you mean, ‘resilient’? Trends Ecol. Evol. 2015, 30, 503–506. [Google Scholar] [CrossRef]
  22. Gongbuzeren; Huntsinger, L.; Li, W. Rebuilding pastoral social-ecological resilience on the Qinghai-Tibetan Plateau in response to changes in policy, economics, and climate. Ecol. Soc. 2018, 23, 2. [Google Scholar] [CrossRef] [Green Version]
  23. Strassburg, B.B.N.; Beyer, H.L.; Crouzeilles, R.; Iribarrem, A.; Barros, F.; de Siqueira, M.F.; Sánchez-Tapia, A.; Balmford, A.; Sansevero, J.B.B.; Brancalion, P.H.S.; et al. Strategic approaches to restoring ecosystems can triple conservation gains and halve costs. Nat. Ecol. Evol. 2019, 3, 62–70. [Google Scholar] [CrossRef] [PubMed] [Green Version]
  24. Lang, Y.; Yang, X.; Cai, H. Assessing the degradation of grassland ecosystems based on the advanced local net production scaling method—The case of Inner Mongolia, China. Land Degrad. Dev. 2021, 32, 559–572. [Google Scholar] [CrossRef]
  25. Lu, Q.; Xu, B.; Liang, F.; Gao, Z.; Ning, J. Influences of the Grain-for-Green project on grain security in southern China. Ecol. Indic. 2013, 34, 616–622. [Google Scholar] [CrossRef] [Green Version]
  26. Ren, Y.; Lu, Y.; Fu, B. Quantifying the impacts of grassland restoration on biodiversity and ecosystem services in China: A meta-analysis. Ecol. Eng. 2016, 95, 542–550. [Google Scholar] [CrossRef]
  27. Liu, Z.; Wang, J.; Wang, X.; Wang, Y. Understanding the impacts of ‘Grain for Green’ land management practice on land greening dynamics over the Loess Plateau of China. Land Use Policy 2020, 99, 105084. [Google Scholar] [CrossRef]
  28. Zheng, X.; Zhang, J.; Cao, S. Net value of grassland ecosystem services in mainland China. Land Use Policy 2018, 79, 94–101. [Google Scholar] [CrossRef]
  29. Moreno-Mateos, D.; Alberdi, A.; Morriën, E.; van der Putten, W.H.; Rodríguez-Uña, A.; Montoya, D. The long-term restoration of ecosystem complexity. Nat. Ecol. Evol. 2020, 4, 676–685. [Google Scholar] [CrossRef]
  30. Strassburg, B.B.N.; Iribarrem, A.; Beyer, H.L.; Cordeiro, C.L.; Crouzeilles, R.; Jakovac, C.C.; Braga, J.A.; Lacerda, E.; Latawiec, A.E.; Balmford, A.; et al. Global priority areas for ecosystem restoration. Nature 2020, 586, 724–729. [Google Scholar] [CrossRef]
  31. Batunacun; Ralf, W.; Tobia, L.; Hu, Y.; Claas, N. Identifying drivers of land degradation in Xilingol, China, between 1975 and 2015. Land Use Policy 2019, 83, 543–559. [Google Scholar] [CrossRef]
  32. Zhao, Y.; Zhang, Q.; Li, Y. Patterns and drivers of household carbon footprint of the herdsmen in the typical steppe region of inner Mongolia, China: A case study in Xilinhot City. J. Clean. Prod. 2019, 232, 408–416. [Google Scholar] [CrossRef]
  33. Wang, H.; Hu, Y.; Yan, H.; Liang, Y.; Guo, X.; Ye, J. Trade-off among grain production, animal husbandry production, and habitat quality based on future scenario simulations in Xilinhot. Sci. Total Environ. 2022, 817, 153015. [Google Scholar] [CrossRef] [PubMed]
  34. Brookshire, E.N.J.; Weaver, T. Long-term decline in grassland productivity driven by increasing dryness. Nat. Commun. 2015, 6, 7148. [Google Scholar] [CrossRef] [PubMed] [Green Version]
  35. Hufkens, K.; Keenan, T.F.; Flanagan, L.B.; Scott, R.L.; Bernacchi, C.J.; Joo, E.; Brunsell, N.A.; Verfaillie, J.; Richardson, A.D. Productivity of North American grasslands is increased under future climate scenarios despite rising aridity. Nat. Clim. Change 2016, 6, 710–714. [Google Scholar] [CrossRef] [Green Version]
  36. Li, Y.; Dong, S.; Wen, L.; Wang, X.; Wu, Y. Soil carbon and nitrogen pools and their relationship to plant and soil dynamics of degraded and artificially restored grasslands of the Qinghai–Tibetan Plateau. Geoderma 2014, 213, 178–184. [Google Scholar] [CrossRef]
  37. Gao, X.; Dong, S.; Xu, Y.; Wu, S.; Wu, X.; Zhang, X.; Zhi, Y.; Li, S.; Liu, S.; Li, Y.; et al. Resilience of revegetated grassland for restoring severely degraded alpine meadows is driven by plant and soil quality along recovery time: A case study from the Three-river Headwater Area of Qinghai-Tibetan Plateau. Agric. Ecosyst. Environ. 2019, 279, 169–177. [Google Scholar] [CrossRef]
  38. Xu, Y.; Dong, S.; Gao, X.; Yang, M.; Li, S.; Shen, H.; Xiao, J.; Han, Y.; Zhang, J.; Li, Y.; et al. Trade-offs and cost-benefit of ecosystem services of revegetated degraded alpine meadows over time on the Qinghai-Tibetan Plateau. Agric. Ecosyst. Environ. 2019, 279, 130–138. [Google Scholar] [CrossRef]
  39. Potter, C.; Randerson, J.; Field, C.; Matson, P.; Vitousek, P.; Mooney, H.; Klooster, S. Terrestrial ecosystem production: A process model based on global satellite and surface data. Glob. Biogeochem. Cycles 1993, 7, 811–841. [Google Scholar] [CrossRef]
  40. Wang, Z.; Zhang, Y.; Yang, Y.; Zhou, W.; Gang, C.; Zhang, Y.; Li, J.; An, R.; Wang, K.; Odeh, I.; et al. Quantitative assess the driving forces on the grassland degradation in the Qinghai-Tibet Plateau, in China. Ecol. Inform. 2016, 33, 32–44. [Google Scholar] [CrossRef]
  41. Barrett, D.J. Steady state turnover time of carbon in the Australian terrestrial biosphere. Glob. Biogeochem. Cycles 2002, 16, 1108. [Google Scholar]
  42. Yang, B.; Gong, J.; Zhang, Z.; Wang, B.; Zhu, C.; Shi, J.; Liu, M.; Liu, Y.; Li, X. Stabilization of carbon sequestration in a Chinese desert steppe benefits from increased temperatures and from precipitation outside the growing season. Sci. Total Environ. 2019, 691, 263–277. [Google Scholar] [CrossRef]
  43. Renard, K.; Foster, G.; Weesies, G.; Porter, J. RUSLE: Revised universal soil loss equation. J. Soil. Water. Conserv. 1991, 46, 30–33. [Google Scholar]
  44. Li, S.; Li, X.; Dou, H.; Dang, D.; Gong, J. Integrating constraint effects among ecosystem services and drivers on seasonal scales into management practices. Ecol. Indic. 2021, 125, 107425. [Google Scholar] [CrossRef]
  45. Fryrear, D.; Saleh, A.; Bilbro, J. A single event wind erosion model. T. ASABE 1998, 41, 1369–1374. [Google Scholar] [CrossRef]
  46. Zhu, W.; Pan, Y.; Zhang, J. Estimation of net primary productivity of Chinese terrestrial vegetation based on remote sensing. J. Plant Ecol. 2007, 31, 413–424. [Google Scholar]
  47. Zhou, T.; Shi, P.; Luo, J.; Shao, Z. Estimation of soil organic carbon based on remote sensing and process model. Front. For. China 2008, 3, 139–147. [Google Scholar] [CrossRef]
  48. Zhou, T.; Shi, P.; Jia, G.; Li, X.; Luo, Y. Spatial patterns of ecosystem carbon residence time in Chinese forests. Sci. China Earth Sci. 2010, 53, 1229–1240. [Google Scholar] [CrossRef]
  49. Li, G.; Li, X.; Zhou, T.; Wang, H.; Li, R.; Wang, H.; Wei, D. A model for simulating the soil organic carbon pool of steppe ecosystems. Environ. Model. Assess. 2016, 21, 339–355. [Google Scholar]
  50. Lyu, X.; Li, X.; Dou, H.; Dang, D.; Li, S.; Li, X.; Li, M.; Liu, S. Evaluation of grassland carbon pool based on TECO-R model and climate-driving function: A case study in the Xilingol typical steppe region of Inner Mongolia, China. Ecol. Indic. 2020, 117, 106508. [Google Scholar] [CrossRef]
  51. Fu, B.; Liu, Y.; Lü, Y.; He, C.; Zeng, Y.; Wu, B. Assessing the soil erosion control service of ecosystems change in the Loess Plateau of China. Ecol. Complex. 2011, 8, 284–293. [Google Scholar] [CrossRef]
  52. Lü, Y.; Fu, B.; Feng, X.; Zeng, Y.; Liu, Y.; Chang, R.; Sun, G.; Wu, B. A policy-driven large scale ecological restoration: Quantifying ecosystem services changes in the Loess Plateau of China. PLoS ONE 2012, 7, e31782. [Google Scholar] [CrossRef] [PubMed] [Green Version]
  53. Wischmeier, W.H.; Smith, D.D. Predicting rainfall erosion losses-a guide to conservation planning; Agriculture handbook (United States. Dept. of Agriculture); no. 537; United States Department of Agriculture: Washington, DC, USA, 1978. [Google Scholar]
  54. Sharpley, A.N.; Williams, J.R. EPIC-erosion/productivity impact calculator: 1. Model determination; Technical Bulletin Number 1768; United States Department of Agriculture: Washington, DC, USA, 1990. [Google Scholar]
  55. Zhang, K.L.; Shu, A.P.; Xu, X.L.; Yang, Q.K.; Yu, B. Soil erodibility and its estimation for agricultural soils in China. J. Arid Environ. 2008, 72, 1002–1011. [Google Scholar] [CrossRef]
  56. Mccool, D.K.; Foster, G.R.; Mutchler, C.K.; Meyer, L.D. Revised slope length factor for the Universal Soil Loss Equation. T. ASABE 1989, 32, 1571–1576. [Google Scholar] [CrossRef]
  57. Liu, B.; Nearing, M.A.; Shi, P.; Jia, Z. Slope length effects on soil loss for steep slopes. Soil Sci. Soc. Am. J. 1994, 64, 1759–1763. [Google Scholar] [CrossRef] [Green Version]
  58. Cai, C.; Ding, S.; Shi, Z.; Huang, L.; Zhang, G. Study of applying USLE and geographical information system IDRISI to predict soil erosion in small watershed. J. Soil Water Conserv. 2000, 14, 19–24. [Google Scholar]
  59. Jia, X.; Fu, B.; Feng, X.; Hou, G.; Liu, Y.; Wang, X. The tradeoff and synergy between ecosystem services in the Grain-for-Green areas in Northern Shaanxi, China. Ecol. Indic. 2014, 43, 103–113. [Google Scholar] [CrossRef]
  60. Van Pelt, R.S.; Zobeck, T.M.; Potter, K.N.; Stout, J.E.; Popham, T.W. Validation of the wind erosion stochastic simulator (WESS) and the revised wind erosion equation (RWEQ) for single events. Environ. Modell. Softw. 2004, 19, 191–198. [Google Scholar] [CrossRef]
  61. Fu, Q.; Li, B.; Hou, Y.; Bi, X.; Zhang, X. Effects of land use and climate change on ecosystem services in Central Asia’s arid regions: A case study in Altay Prefecture, China. Sci. Total Environ. 2017, 607–608, 633–646. [Google Scholar] [CrossRef]
  62. Jiang, C.; Nath, R.; Labzovskii, L.; Wang, D. Integrating ecosystem services into effectiveness assessment of ecological restoration program in northern China’s arid areas: Insights from the Beijing-Tianjin Sandstorm Source Region. Land Use Policy 2018, 75, 201–214. [Google Scholar] [CrossRef]
  63. Gong, G.; Liu, J.; Shao, Q. Wind erosion in Xilingol League, Inner Mongolia since the 1990s using the revised wind erosion equation. Prog. Geogr. 2014, 33, 825–834. [Google Scholar]
  64. Fryrcar, D.W.; Chen, W.N.; Lester, C. Revised Wind Erosion Equation. Ann. Arid Zone 2001, 40, 265–279. [Google Scholar]
  65. Guo, Z.; Zobeck, T.M.; Zhang, K.; Li, F. Estimating potential wind erosion of agricultural lands in northern China using the Revised Wind Erosion Equation and geographic information systems. J. Soil Water Conserv. 2013, 68, 13–21. [Google Scholar] [CrossRef]
  66. Chi, D.; Wang, H.; Li, X.; Liu, H.; Li, X. Assessing the effects of grazing on variations of vegetation NPP in the Xilingol Grassland, China, using a grazing pressure index. Ecol. Indic. 2018, 88, 372–383. [Google Scholar] [CrossRef]
  67. Li, X.; Lyu, X.; Dou, H.; Dang, D.; Li, S.; Li, X.; Li, M.; Xuan, X. Strengthening grazing pressure management to improve grassland ecosystem services. Glob. Ecol. Conserv. 2021, 31, e01782. [Google Scholar] [CrossRef]
  68. Mills, A.J.; Fey, M.V.; Grongroft, A.; Petersen, A.; Medinski, T.V. Unravelling the effects of soil properties on water infiltration: Segmented quantile regression on a large data set from arid south-west Africa. Aust. J. Soil Res. 2006, 44, 783–797. [Google Scholar] [CrossRef]
  69. Hao, R.; Yu, D.; Wu, J. Relationship between paired ecosystem services in the grassland and agro-pastoral transitional zone of China using the constraint line method. Agric. Ecosyst. Environ. 2017, 240, 171–181. [Google Scholar] [CrossRef]
  70. Hao, R.; Yu, D.; Sun, Y.; Shi, M. The features and influential factors of interactions among ecosystem services. Ecol. Indic. 2019, 101, 770–779. [Google Scholar] [CrossRef]
  71. Dong, S.; Sherman, R. Enhancing the resilience of coupled human and natural systems of alpine rangelands on the Qinghai-Tibetan Plateau. Rangeland. J. 2015, 37, 1. [Google Scholar] [CrossRef] [Green Version]
  72. Wen, X.; Deng, X.; Zhang, F. Scale effects of vegetation restoration on soil and water conservation in a semi-arid region in China: Resources conservation and sustainable management. Resour. Conserv. Recycl. 2019, 151, 104474. [Google Scholar] [CrossRef]
  73. Löbmann, M.T.; Tonin, R.; Stegemann, J.; Zerbe, S.; Geitner, C.; Mayr, A.; Wellstein, C. Towards a better understanding of shallow erosion resistance of subalpine grasslands. J. Environ. Manage. 2020, 276, 111267. [Google Scholar] [CrossRef] [PubMed]
  74. Lin, S.; Wu, R.; Yang, F.; Wang, J.; Wu, W. Spatial trade-offs and synergies among ecosystem services within a global biodiversity hotspot. Ecol. Indic. 2018, 84, 371–381. [Google Scholar] [CrossRef]
  75. Dou, H.; Li, X.; Li, S.; Dang, D.; Li, X.; Lyu, X.; Li, M.; Liu, S. Mapping ecosystem services bundles for analyzing spatial trade-offs in inner Mongolia, China. J. Clean. Prod. 2020, 256, 120444. [Google Scholar] [CrossRef]
  76. Hu, Y.; Huang, J.; Hou, L. Impacts of the Grassland Ecological Compensation Policy on Household Livestock Production in China: An Empirical Study in Inner Mongolia. Ecol. Econ. 2019, 161, 248–256. [Google Scholar] [CrossRef]
  77. Zhang, Y.; Guan, D.; Wu, L.; Su, X.; Zhou, L.; Peng, G. How can an ecological compensation threshold be determined? A discriminant model integrating the minimum data approach and the most appropriate land use scenarios. Sci. Total Environ. 2022, 852, 158377. [Google Scholar] [CrossRef] [PubMed]
Figure 1. The location of the study area. (a) The location of the study area relative to China; (b) the location of the study area relative to Xilingol typical steppe; (c) the scope of study area and sampling sites. The nature reserve is the Xilingol Grassland National Nature Reserve.
Remotesensing 14 05120 g001
Figure 2. Research framework. FVC, fractional vegetation cover (%); NPP, net primary production (kg C/m2); AGB, aboveground biomass (g/m2); SOM, soil organic matter (0–20 cm, kg C/m2); SBD, soil bulk density (0–20 cm, g/m3); CASA, the Carnegie–Ames–Stanford Approach model; TECO-R, the improved Terrestrial Ecosystem Regional model; RUSLE, the Revised Universal Soil Loss Equation model; RWEQ, the Revised Wind Erosion Equation model; NPP, net primary production (kg C/m2); EC, ecosystem carbon (kg C/m2); SC, soil conservation (t/ha); SL, soil loss by wind (kg/m2).
Remotesensing 14 05120 g002
Figure 3. Spatial distribution of grassland degradation in the study area, from 2000 to 2019. UD, undegraded grassland; LD, lightly degraded grassland; MD, moderately degraded grassland; SD, severely degraded grassland.
Remotesensing 14 05120 g003
Figure 4. Spatiotemporal of ecosystem services in the study area, from 2000 to 2019. (a) Interannual variability; (b) spatial distribution of the average value of ecosystem services, from 2000 to 2019. NPP, net primary production (kg C/m2); EC, ecosystem carbon (kg C/m2); SC, soil conservation (t/ha); SL, soil loss by wind (kg/m2).
Remotesensing 14 05120 g004
Figure 5. Comparison of ecosystem services of different grassland degradation degrees in the study area, from 2000 to 2019. UD, undegraded grassland; LD, lightly degraded grassland; MD, moderately degraded grassland; SD, severely degraded grassland; NPP, net primary production (kg C/m2); EC, ecosystem carbon (kg C/m2); SC, soil conservation (t/ha); SL, soil loss by wind (kg/m2).
Remotesensing 14 05120 g005
Figure 6. Constraint effect of grassland degradation on paired ecosystem services in the study area, from 2000 to 2019. UD, undegraded grassland; LD, lightly degraded grassland; MD, moderately degraded grassland; SD, severely degraded grassland; NPP, net primary production (kg C/m2); EC, ecosystem carbon (kg C/m2); SC, soil conservation (t/ha); SL, soil loss by wind (kg/m2).
Remotesensing 14 05120 g006
Figure 7. Rose chart of ecosystem services with different degradation degrees in the study area, from 2000 to 2019. UD, undegraded grassland; LD, lightly degraded grassland; MD, moderately degraded grassland; SD, severely degraded grassland; NPP, net primary production (kg C/m2); EC, ecosystem carbon (kg C/m2); SC, soil conservation (t/ha); SL, soil loss by wind (kg/m2).
Remotesensing 14 05120 g007
Figure 8. Effects of climate change and grazing pressure on grassland degradation. T, temperature (℃); P, precipitation (mm); GPI, grazing pressure index; UD, undegraded grassland; LD, lightly degraded grassland; MD, moderately degraded grassland; SD, severely degraded grassland.
Remotesensing 14 05120 g008
Figure 9. Impacts of climate change and grazing pressure on ecosystem services. T, temperature (℃); P, precipitation (mm); GPI, grazing pressure index; NPP, net primary production (kg C/m2); EC, ecosystem carbon (kg C/m2); SC, soil conservation (t/ha); SL, soil loss by wind (kg/m2).
Remotesensing 14 05120 g009
Figure 10. Effects mechanism of climate change and grazing pressure on the relationship between grassland degradation and ecosystem services. T, temperature (℃); P, precipitation (mm); GPI, grazing pressure index; NPP, net primary production (kg C/m2); EC, ecosystem carbon (kg C/m2); SC, soil conservation (t/ha); SL, soil loss by wind (kg/m2).
Remotesensing 14 05120 g010
Figure 11. Quantitative effects of climate change and grazing pressure on the relationship between grassland degradation and ecosystem services. T, temperature (℃); P, precipitation (mm); GPI, grazing pressure index; NPP, net primary production (kg C/m2); EC, ecosystem carbon (kg C/m2); SC, soil conservation (t/ha); SL, soil loss by wind (kg/m2).
Remotesensing 14 05120 g011
Figure 12. Regional priority of grassland ecological restoration. (a) Schematic diagram of towns distribution; (b) spatial distribution of grassland degradation in the study area, from 2015 to 2019; (c) spatial distribution of precipitation in the study area, from 2000 to 2019; (d) spatial distribution of temperature in the study area, from 2000 to 2019. UD, undegraded grassland; LD, lightly degraded grassland; MD, moderately degraded grassland; SD, severely degraded grassland; T, temperature; P, precipitation. a, Arshan Baolige town; b, Chaokewula Sumu; c, Baoligen Sumu; d, Maodeng Ranch; e, Xilinhot city; f, Beilike Ranch; g, Baiyinxile Ranch; h, Xilingol ranch station; i, Baiyinkulun Ranch.
Remotesensing 14 05120 g012
Figure 13. The cold and hot spots distribution of four ecosystem services in the study area, from 2000 to 2019.
Remotesensing 14 05120 g013
Table 1. Data description and sources.
TypeDescriptionSpatial
Resolution
Source
Remote sensing dataMOD13Q1250 mNASA (https://www.nasa.gov/, accessed on 10 February 2020)
Vegetation dataVegetation-type map1 kmResource and Environment Science and Data Center (http://www.resdc.cn/, accessed on 10 February 2020)
Soil dataSoil-type map1 kmResource and Environment Science and Data Center (http://www.resdc.cn/, accessed on 20 March 2020)
Meteorological dataMonthly temperature250 mChina Meteorological Sharing Service System (http://data.cma.cn/, accessed on 12 May 2020)
Monthly precipitation250 m
Monthly radiation250 m
Basic dataSTRM90 mGeospatial Data Cloud (http://www.gscloud.cn/, accessed on 10 January 2020)
Land use-cover change30 mResource and Environment Science and Data Center (http://www.resdc.cn/, accessed on 20 March 2020)
Border vector mapN/ANational Geomatics Center of China (http://www.ngcc.cn/ngcc/, accessed on 25 January 2020)
Nature ReserveN/ANational Forestry and Grassland Administration of China
Note: N/A, not applicable.
Table 2. Proportion of grassland distribution area with different degradation degrees in the study area, from 2000 to 2019.
Proportion (%)2000–20042005–20092010–20142015–2019
UD31.529.334.529.3
LD16.922.322.517.4
MD22.831.024.329.1
SD28.817.418.724.2
Note: UD, undegraded grassland; LD, lightly degraded grassland; MD, moderately degraded grassland; SD, severely degraded grassland.
Table 3. Effects of climate change and grazing pressure on the relationship between grassland degradation and ecosystem services under different degradation gradients.
UDLDMDSD
T-SC0.280.210.010.01
T-NPP0.220.390.010.01
P-SC0.190.210.040.03
P-NPP0.110.180.090.08
GPI-SL0.200.160.370.36
GPI-EC0.280.300.080.53
GPI-NPP0.130.740.360.39
Note: UD, undegraded grassland; LD, lightly degraded grassland; MD, moderately degraded grassland; SD, severely degraded grassland; T, temperature (℃); P, precipitation (mm); GPI, grazing pressure index; NPP, net primary production (kg C/m2); EC, ecosystem carbon (kg C/m2); SC, soil conservation (t/ha); SL, soil loss by wind (kg/m2).
Publisher’s Note: MDPI stays neutral with regard to jurisdictional claims in published maps and institutional affiliations.

