Article

Analysis of Drought Characteristics Projections for the Tibetan Plateau Based on the GFDL-ESM2M Climate Model

1
College of Water Resources and Architectural Engineering, Northwest A&F University, Xianyang 712100, China
2
Key Laboratory of Agricultural Soil and Water Engineering in Arid and Semiarid Areas, Ministry of Education, Northwest A&F University, Xianyang 712100, China
3
School of Water and Environment, Chang’an University, Xi’an 710054, China
4
Key Laboratory of Subsurface Hydrology and Ecological Effects in Arid Region of the Ministry of Education, Chang’an University, Xi’an 710054, China
5
Northwest Engineering Corporation Limited, Power China, Xi’an 710065, China
6
Environmental Engineering Evaluation Center in Tibet Autonomous Region, Lhasa 850000, China
*
Author to whom correspondence should be addressed.
Remote Sens. 2022, 14(20), 5084; https://doi.org/10.3390/rs14205084
Submission received: 16 August 2022 / Revised: 4 October 2022 / Accepted: 8 October 2022 / Published: 12 October 2022

Abstract

:
Under conditions of continuous global warming, research into the future change trends of regional dry-wet climates is key for coping with and adapting to climate change, and is also an important topic in the field of climate change prediction. In this study, daily precipitation and mean temperature datasets under four representative concentrative pathway (RCP) scenarios in the geophysical fluid dynamics laboratory Earth system model with modular ocean model (GFDL-ESM2M) version 4 were used to calculate the standardized precipitation-evapotranspiration index of the Tibetan Plateau (TP) at different time scales. Using a multi-analytical approach including the Mann–Kendall trend test and run theory, the spatiotemporal variation characteristics of drought in the TP from 2016 to 2099 were studied. The results show that the overall future climate of the TP will develop towards warm and humid, and that the monthly-scale wet–dry changes will develop non-uniformly. As the concentration of carbon dioxide emissions increases in the future, the proportion of extremely significant aridification and humidification areas in the TP will significantly increase, and the possibility of extreme disasters will also increase. Moreover, influenced by the increase of annual TP precipitation, the annual scale of future drought in the region will tend to decrease slightly, and the spatial distributions of the frequency and intensity of droughts at all levels will develop uniformly. Under all four RCP scenarios, the drought duration of the TP was mainly less than 3 months, and the drought cycle in the southern region was longer than that in the northern region. The results of this study provide a new basis for the development of adaptive measures for the TP to cope with climate change.

1. Introduction

Drought is one of the most common and widely distributed natural disasters, and is often responsible for serious losses [1]. It often causes problems such as reduced agricultural production and exacerbated ecological deterioration [2,3]. Especially under the influences of global climate change and rapid urbanization, frequent drought disasters seriously restrict the sustainable development of economies and societies [4,5] and lead to ecological and environmental problems, such as water shortages, land degradation, and desertification [6,7,8,9]. Over the past 40 years, about 12 million hectares of land have been lost to drought and desertification each year, and this trend will continue to expand in the 21st century, especially in the mid-latitudes [10,11].
According to the Drought Numbers Report, from 1998 to 2017, the global economic loss caused by drought was as high as $124 billion. Since 2000, the number and duration of droughts globally has increased by 29%, affecting about 1.4 billion people. Over the past century, more than 10 million people have died from major drought events, costing the global economy hundreds of billions of dollars, and both numbers are rising [12,13,14]. Frequent drought disasters have become important in restricting regional sustainable development and ecological protection [15]. In addition, the AR6 Working Group I report released by the United Nations Special Assessment Committee on Climate Change pointed out that in the future, global warming will intensify, and the frequency of extreme high temperature events and marine heat waves will increase accordingly. Additional studies have also shown that future drought duration, frequency, and intensity will increase to varying degrees [16]. Therefore, analyzing the spatiotemporal variation characteristics of future drought is not only beneficial to regional disaster prevention and mitigation, but is also important for rationally managing and distributing regional water resources, as well as for improving regional economic and social development planning.
However, most studies focus on the social, agricultural, and environmental impacts of droughts on a global or regional scale for historical periods [17]. For example, Zhu et al. [18] constructed a dynamic evaluation model and applied it to the distribution and development trend of comprehensive drought disaster risk in Xuzhou, China; Hu et al. [19] used the crop water deficit index for evaluation of agricultural drought, described the spatiotemporal variation of drought in the growth period of winter wheat in the Huang-Huai-Hai plain, and constructed a drought disaster risk index of winter wheat in each growth period; and Orimoloye et al. [20] used the enhanced vegetation index and standardized precipitation index (SPI) to study drought disaster events and their temporal and spatial patterns in Free State Province, South Africa. Overall, there are relatively few studies on the changing characteristics of drought under different climate scenarios in the future, considering the increase of carbon dioxide concentration. In particular, the Tibetan Plateau (TP) region, which is sensitive to climate change and has an active hydrological cycle, presents significant knowledge gaps [21].
In addition, existing studies on meteorological drought mainly focus on arid and semi-arid regions [22]. For example, Annette et al. [23] used the ParFlow-CLM model to study the driving factors of drought-related changes in the southern United States; Wang et al. [24] evaluated the drought monitoring effect of remote sensing precipitation products based on a proposed grid drought index, revealing the drought characteristics of the Yellow River Basin from 1998 to 2016; and Yang et al. [25] constructed a composite drought index to determine the duration, peak, and severity of drought in the Weihe River Basin, to assess multivariate drought risk. However, little is known about the variation characteristics of drought in the TP, which is rich in glacier resources, especially in terms of the variation characteristics of drought at different time scales in the future [26]. TP glaciers are important buffers for regional drought resistance [27]. They can significantly affect the climate model in East Asia and atmospheric circulation in the northern hemisphere through dynamic, thermal, and frictional atmospheric effects; affect the regional and surrounding land-atmosphere interactions and dry–wet changes; and also play a greater role in adapting to climate change pressures [28,29]. In the context of global warming, the temperature of the TP has increased significantly, accelerating the melting of ice and snow and increasing permafrost activities [30,31]. How will the dry and wet conditions of the TP change under global warming in the future? This is a very important scientific question in the field of climate science.
This study is aimed at addressing this question. Considering TP as the study area, according to the climate change prediction results obtained using the geophysical fluid dynamics laboratory Earth system model with modular ocean model (GFDL-ESM2M) version 4, and based on the annual scale standardized precipitation-evapotranspiration index (SPEI), the spatiotemporal variation trends of meteorological drought in the TP under various future emissions scenarios were predicted. In addition, based on the monthly SPEI, the spatiotemporal evolution characteristics of future meteorological droughts in the TP were systematically analyzed with respect to the duration, frequency, intensity, and cycle of drought events, and the characteristics of changes in drought under different climate scenarios were compared and analyzed. The results contribute to a better understanding of the evolution of meteorological drought on the TP and provide a scientific basis for relevant agencies to further improve drought prevention systems and formulate appropriate drought disaster prevention measures and countermeasures.

2. Materials and Methods

2.1. Study Area

The TP, located in southwest China, has a total area of ~2.5 million km2 (26°00′–39°47′N, 73°19′–104°47′E). It is the largest plateau in China and the highest plateau in the world, sometimes called “the roof of the world”. The TP has a mean elevation of more than 4000 m and its 12 major rivers flow to East Asia, Southeast Asia, and South Asia. The major outflow rivers include the Yangtze, Yellow, Lancang, Nujiang, and Yarlung Zangbo rivers, and the lake area of the TP comprises more than 1500 large and small lakes. The more famous lakes are the Nam Co, Qinghai, Qarhan Salt, and Eling lakes (Figure 1a). The TP belongs to a plateau climate zone with distinct dry and wet conditions and frequent nighttime rains. The mean annual precipitation in the southern part of the TP is more than 1500 mm, whereas the mean annual precipitation in the Qaidam Basin (QB) in the northeast is less than 200 mm (Figure 1b). In addition, the TP experiences strong radiation, a high degree of sunshine, low temperatures, and low cumulative temperatures. The temperatures decrease with increasing altitude and latitude. The daily temperature difference is large. The mean annual temperature of the plateau hinterland is below 0 °C, and the mean temperature of the warmest month in large regions is less than 10 °C (Figure 1c).

2.2. Data Source and Climate Model

A precipitation and temperature dataset for the TP from 1980 to 2015 was obtained from the Resources and Environment Science and Data Center of the Chinese Academy of Sciences (http://www.resdc.cn/, accessed on 11 November 2021) [32]. The dataset was based on daily observation data from more than 2400 meteorological stations in China and was generated by sorting, calculation, and spatial interpolation processing. In this study, the dataset for precipitation and temperature on the TP from 1980 to 2015 was obtained by mask extraction.
The future climate model selected for this study uses the GFDL-ESM2M. GFDL-ESM2M is a coupled model intercomparison project phase 5 (CMIP5) global coupled carbon-climate model proposed by the US National Oceanic and Atmospheric Administration (NOAA) that is similar to GFDL’s previous generation climate model 2.1 (CM2.1) [33]. CM2.1 has exhibited efficient performance in simulating and reproducing global climate interannual variability and climate characteristics [34]. In contrast to the CM2.1 model, the GFDL-ESM2M uses modular ocean model version 4.1, with vertical pressure layers and new biogeochemical algorithms and stoichiometric phytoplankton functional group dynamics. GFDL-ESM2M includes a revised land model to simulate competing vegetation distributions and functions, including carbon cycling among vegetation, soil, and the atmosphere [35]. Therefore, GFDL-ESM2M has a wide range of applications and can be adapted to various climatic conditions around the world. Jia et al. [36] conducted a comprehensive evaluation of GFDL–ESM2M by comparing the performance of 33 CMIP5 general circulation models (GCMs) in a temperature simulation of the TP. Their results showed that GFDL-ESM2M exhibits better temperature simulation performance than other GCMs, which indicates that GFDL-ESM2M is well suited to the simulation of future climate changes in the TP. In addition, China’s special program for climate change science and technology development during the 12th five-year plan period has simulated the future water resources situation in China based on the GFDL-ESM2M climate model [37]. Based on that climate model, Ma et al. [38] predicted the future trend of dry–wet area and climate change in China. The study showed that the GFDL-ESM2M climate model has a good application effect in China. Therefore, GFDL-ESM2M was considered in this study to predict future drought changes in the TP.
The GFDL-ESM2M climate model includes the representative concentrative pathways (RCP) 2.6, 4.5, 6.0, and 8.5 climate scenarios. The RCP2.6, RCP4.5, RCP6.0, and RCP8.5 climate scenarios represent very low, low, medium, and high levels of greenhouse gas emissions, respectively, meaning that radiative forcing will stabilize at 2.6, 4.5, 6.0, and 8.5 W/m2, respectively, by 2100, and the carbon dioxide concentration will reach 490, 650, 850, and 1370 ppm, respectively. In this study, we used daily precipitation and temperature datasets from multiple climate models from the National Tibetan Plateau Data Center (TPDC; http://data.tpdc.ac.cn, accessed on 16 November 2021) [39,40]. In addition, the geographic coordinate system of all datasets was uniformly transformed into GCS_WGS_1984.

2.3. Methods

2.3.1. Standardized Precipitation-Evapotranspiration Index (SPEI)

The meteorological drought index integrates different climatic factors that represent the overall climate and environment of the region [41]. The commonly used meteorological drought indices include the SPI, Palmer drought severity index (PDSI), and SPEI [42]. The SPEI, proposed by Vicente-Serrano et al. [43], is used to characterize meteorological drought. This index inherits the characteristics of the PDSI, considering evapotranspiration to be sensitive to temperature, as well as the advantages of SPI with respect to simplicity of calculation, multiple time scales, and multiple spatial comparisons [44,45]. In the context of global warming, temperature increase has become one of the most important factors affecting regional drought [46,47,48]. Therefore, SPEI has unique advantages in studying the characteristics of drought on different time scales in the future, which is of great significance to further understand the impact of climate change on drought. Previous studies have shown that the annual-scale SPEI (SPEI-12) is more suitable for long-term drought trend assessment [49], and the monthly-scale SPEI (SPEI-1) is sensitive to short-term dry and wet variation [50]. Therefore, in this study, SPEI was used to analyze the future drought variation characteristics of the TP on both the annual and monthly scales. The calculation method of SPEI refers to Vicente-Serrano et al., but it should be noted that in this study, we used the Thornthwaite approach with a limited range of mean air temperatures to calculate the potential evapotranspiration (PET) for the TP [51,52]. The formula used is as follows:
PET = { 0   if   T < 0 16 ( 10 T I ) α   if   26.5 > T 0 415.85 + 32.24 T 0.43 T 2   if   T 26.5
where I is the heat index, T is the average air temperature (in °C), and α is estimated using an I-related third-order polynomial:
I = i = 1 12 ( T i 5 ) 1.514 ,
α = 0.49239 + 1.792 × 10 2 I 7.71 × 10 5 I 2 + 6.75 × 10 7 I 3 ,
According to the “Meteorological Drought Grade” classification standard, the SPEI values were divided into nine classes, as shown in Table 1.

2.3.2. Mann–Kendall (M-K) Test

The M-K test is often used to analyze the changing trend and significance of various factors [53,54]. The change trend of SPEI can be expressed as:
Slope = median ( x j x k j k ) ,
where Slope is the rate of change, Slope > 0 represents a wetting trend, and Slope < 0 represents a drought trend.
The significance calculation formula is as follows:
Z = { S 1 n ( n 1 ) ( 2 n + 5 ) / 18 for   S > 0 0 for   S = 0 , S + 1 n ( n 1 ) ( 2 n + 5 ) / 18 for   S < 0
S = k = 1 n 1 j = k + 1 n sgn ( x j x k ) ,
where S is the Kendall sum statistic, sgn is a symbolic function, and xj and xk are the parameter values at times j and k, respectively. When |Z| ≥ Z1−α/2, the null hypothesis that the trend is not significant is not rejected. In this study, α = 0.01, α = 0.05, and α = 0.1 significance levels were considered, and the corresponding value of Z1−α/2 were 2.58, 1.96, and 1.64, respectively [55,56]. Based on the SPEI trend, it is further divided into six levels, as detailed in Table 2.

2.3.3. Run Theory

The run theory is typically used to identify drought events requiring a cutoff level k (k = drought level corresponding to SPEI) [57,58]. In this study, combined with the drought characteristics of each grade of the TP, the value of k is –1 (i.e., moderate drought and above). When the value of the random variable (SPEI) is greater than –1, it has a positive run; otherwise, it has a negative run. In drought research, the length of a negative run is called the drought duration (D), and the drought intensity (S) is the area encompassed by the drought duration and the intercept level (Figure 2).
According to the run theory, to calculate the return periods of different run lengths [59,60], the calculation steps are as follows:
P = 1 n t = 1 n x f ( x ) x = 1 , 2 , , n ,
where P is the mean probability of occurrence of different drought durations, x is the drought duration, n is the number of months in the series of monthly precipitation for many years, and f(x) is the number of occurrences of drought duration x.
The expected length (E) of the runs of different drought durations can be expressed by the following formula:
E = t = 1 n x f ( x ) / t = 1 n f ( x ) ,
After eliminating the influence of dependent effects, the migration probability (Pz) of different drought durations can be expressed as follows:
P z = n ( E 1 ) / ( E ( n 1 ) ) .
Hence, the one-dimensional run probability distribution function (F(x)) with parameters including the drought duration and intensity can be expressed as follows:
F ( x ) = 1 + ( 1 P z ) ( n x ) 1 + ( 1 P z ) ( n 1 ) P z x 1 .
According to the definition of the run-length return period (T(x)), T(x) can be expressed by the following formula:
T ( x ) = x + ( P z x 1 ) / ( 1 P z ) 12 .
In order to reflect the main research content more clarity, we have drawn a flowchart (Figure 3), which mainly illustrates the input datasets, calculations, methods, and output results of this study.

3. Results

3.1. Model Simulation Capability Assessment

Because the CMIP5 model shows different simulation performances for different climate elements in different regions, the model with the poorest performance will have a serious impact on the results [61]. Therefore, according to the simulation ability of different models in the TP for precipitation and mean temperature, this study selected the best model, and on this basis, analyzed the future drought variation characteristics of the TP. In order to more comprehensively and intuitively analyze the precipitation and mean temperature simulation capabilities of the five CMIP5 models in the TP, the Taylor diagrams analysis method is introduced here [62]. The Taylor diagrams comprehensively examine the matching degree of model simulation and observation data from three aspects: the spatial correlation coefficient, ratio of standard deviation, and centralization root mean square error (RMSD).
Figure 4 shows the Taylor diagrams of precipitation and mean temperature over the TP for five CMIP5 models under the RCP2.6 climate scenario from 2007 to 2015. The Taylor diagram results show that the precipitation simulation capabilities of different models differ to a certain degree, and the simulation results of the HadGEM2-ES, GFDL-ESM2M, and NorESM1-M climate models are significantly better than the IPSL-CM5A-LR and MIROC5 climate simulations. In addition, the variation amplitudes of the GFDL-ESM2M, NorESM1-M, and IPSL-CM5A-LR climate model simulation results are close to the observed data (Figure 4a). The five CMIP5 models have a similar ability to simulate the mean temperature time series, and the spatial correlation coefficients are all above 0.9. Among them, the GFDL-ESM2M climate model is the closest to the observational data, indicating that this model can better simulate the variation characteristics of mean temperature (Figure 4b). Overall, the GFDL-ESM2M model is better than the other four CMIP5 models in terms of its ability to comprehensively simulate precipitation and mean temperature in the TP.

3.2. Spatiotemporal Variation of SPEI

3.2.1. Temporal Variation Characteristics of SPEI

To explore the characteristics of the future drought evolution of the TP, the trends in SPEI-12 from 2016 to 2099 under four climatic scenarios were analyzed (Figure 5). Under the RCP2.6, RCP4.5, and RCP8.5 climate scenarios, the mean values of SPEI-12 for the TP exhibit insignificant increases (p > 0.1), i.e., 8.93 × 10⁻⁵, 7.21 × 10⁻⁴, and 1.52 × 10⁻³, respectively. Under the RCP6.0 climate scenario, the mean value of SPEI-12 for the TP exhibits an insignificant (p > 0.1) decreasing trend of 2.07 × 10⁻⁴. In addition, under RCP2.6, RCP4.5, RCP6.0, and RCP8.5, the annual drought probabilities for the TP from 2016 to 2099 are 13.10%, 9.52%, 10.71%, and 14.29%, respectively, and the forecasted drought in each case is mainly light drought.
In general, the mean value of SPEI-12 for the TP from 2016 to 2099 under the RCP2.6, RCP4.5, and RCP8.5 climatic scenarios mainly exhibit an increasing trend, indicating that the drought degree in the study area will be slowing in the future. This is mainly because of the increasing trends of precipitation and temperature over the TP in the future, with precipitation having a more significant effect on wet–dry changes over the TP.
To further research the intra-year distribution characteristics of the future wet–dry variation on the TP, a statistical map of the temporal variation of the TP SPEI-1 from 2016 to 2099 under the four climatic scenarios was drawn (Figure 6). Under the RCP2.6, RCP4.5, RCP6.0, and RCP8.5 climate scenarios, the future dry months (SPEI-1 < −0.5) on the TP will be concentrated in the summer (June to August) and will account for 96.50%, 94.74%, 95.48%, and 92.86% of the total dry months, respectively. The wet months (SPEI-1 > 0.5) will be concentrated in the spring (March to May) and October and will account for 88.67%, 89.80%, 92.35%, and 90.61% of the total wet months, respectively. In addition, under RCP2.6, RCP4.5, RCP6.0, and RCP8.5 for the period of 2016–2099, regarding the monthly extreme difference and standard deviation (Std) of the SPEI-1 of the TP, it can be expected that the maximum and minimum values will occur in May and December, respectively. As the concentration of carbon dioxide emissions increases, the maximum value of the monthly extreme difference (and the Std) will increase, as evidenced by predicted values of 1.87 (0.40), 1.70 (0.38), 2.14 (0.42), and 2.25 (0.45), respectively.
In general, under the four climate scenarios, the characteristics of monthly wet–dry variation and the annual distribution patterns for the TP are highly similar. However, as the concentration of carbon dioxide emissions increases, the dispersion of intra-year wet–dry variation will gradually increase, that is, towards the direction of non-uniform development. This indicates that as the concentration of carbon dioxide emissions increases, the intensity of climate extremes on the TP may also increase.

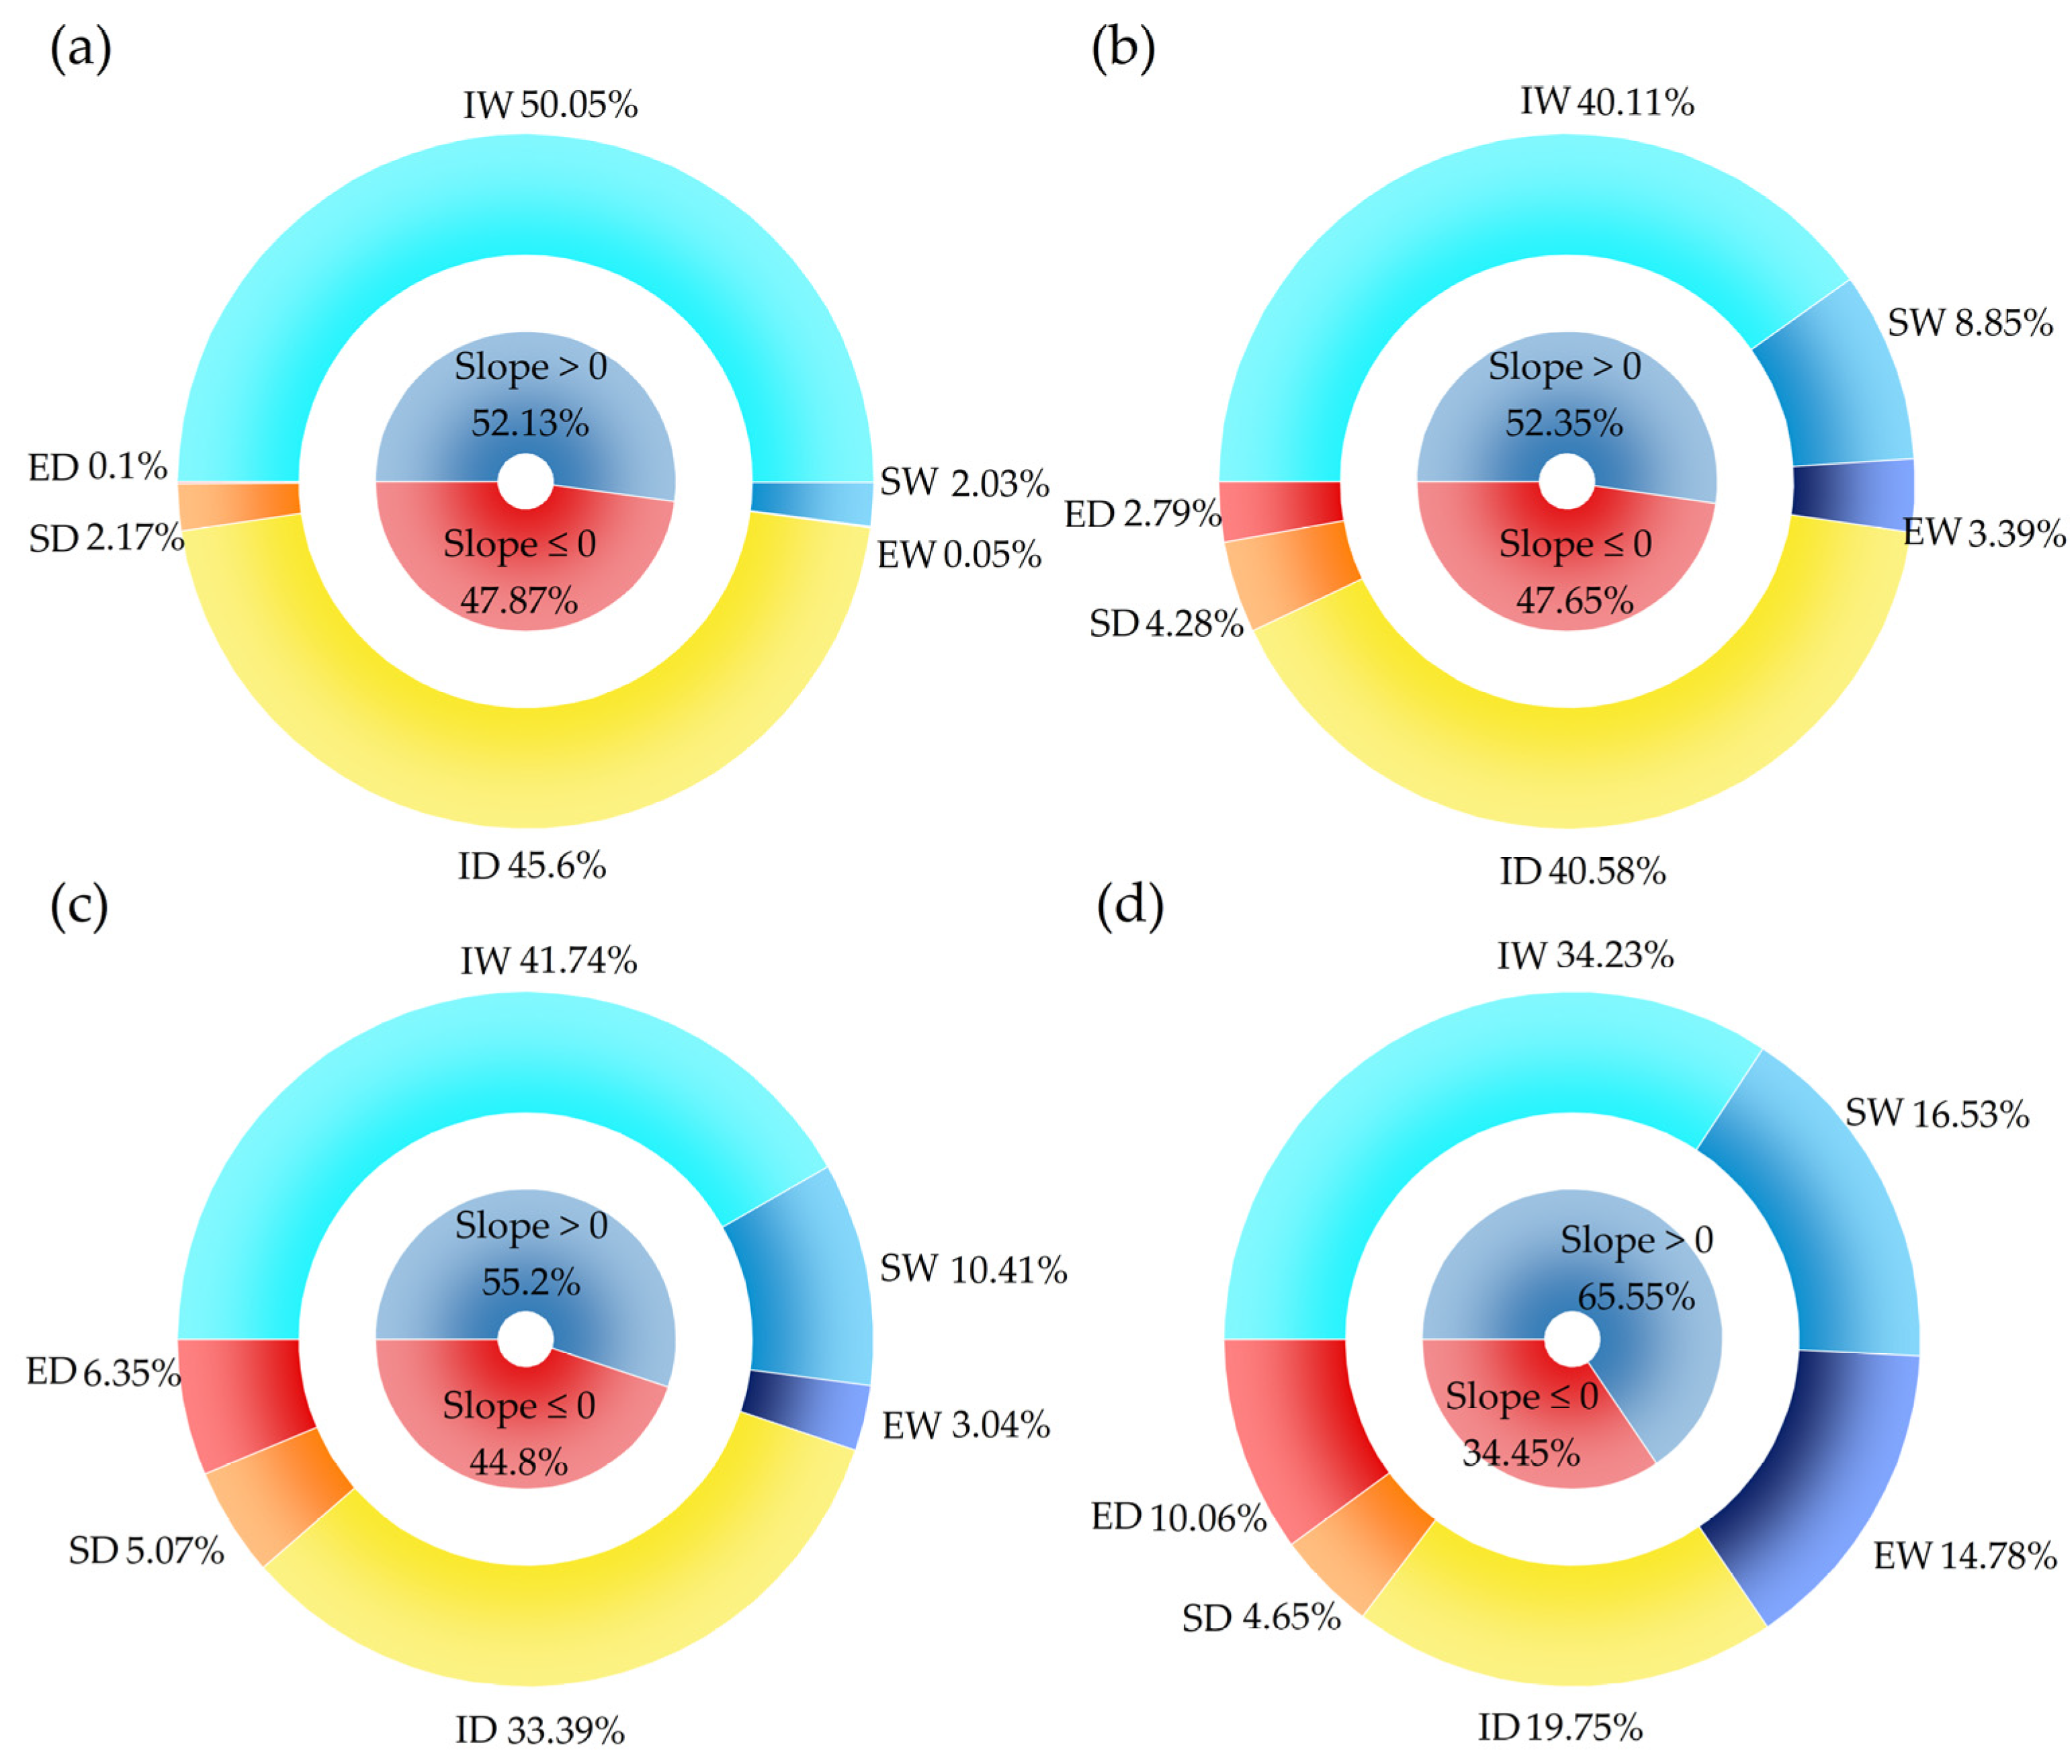
3.2.2. Spatial Variation Characteristics of SPEI

In this study, only the spatial variation characteristics of SPEI-12 under four future climate scenarios were analyzed based on Equation (4). Under the RCP2.6, RCP4.5, RCP6.0, and RCP8.5 climate scenarios, there will be a certain extent in the SPEI-12 of the TP from 2016 to 2099 (Figure 7). The SPEI-12/10 years ranges from –0.152 to 0.116, from –0.196 to 0.167, from –0.325 to 0.181, and from –0.374 to 0.269, respectively, for the four climate scenarios, as listed above. These results indicate that as carbon dioxide emissions increase, climate change on the TP will become more extreme in the future, and the trend of increasing extreme drought events will become more obvious. Under RCP2.6, the resulting aridification areas will be mainly concentrated in the Qilian Mountains, the Hengduan Mountains, and Lhasa. Under RCP4.5, RCP6.0, and RCP8.5, the aridification areas will be mainly concentrated in the QB, Kunlun Mountains, and Altun Mountains.
Under the RCP2.6, RCP4.5, RCP6.0, and RCP8.5 climate scenarios, 47.87%, 47.65%, 44.80%, and 35.45%, respectively, of the TP region will exhibit a trend of aridification in the future; that is, the SPEI will exhibit a decreasing trend (Figure 8). Under the four climate scenarios, the aridification of the TP will be dominated by insignificant aridification, and the proportions of insignificant aridification will be 45.60%, 40.58%, 33.39%, and 19.75%, respectively. As the carbon dioxide emissions concentration increases, the proportion of the area of the TP exhibiting extremely significant aridification will also increase in the future, from 0.01% to 2.79% to 6.35% to 10.06% for RCP2.6 to RCP8.5, respectively.
In addition, as the concentration of carbon dioxide emissions increases, the proportion of humidified areas in the TP will increase under the RCP2.6, RCP4.5, RCP6.0, and RCP8.5 climate scenarios, from 52.13% to 52.35% to 55.20% to 65.55%, respectively. Moreover, the proportions of insignificantly humidified area will be 50.05%, 40.11%, 41.74%, and 34.23%, respectively. In the future, the TP will exhibit extremely significant humidified area ratios of 0.05%, 3.39%, 3.04%, and 14.78%, respectively.
In summary, as the concentration of carbon dioxide emissions increases in the future, the proportion of areal aridification on the TP will decrease, but the proportions of extremely significant aridification and humidified areas will increase. This suggests that the TP will be more prone to extreme droughts and floods in the future.

3.3. Analysis of Drought Change Characteristics

Based on meteorological predictions for the different climatic scenarios, SPEI-1 was used to analyze the characteristics of drought changes for the TP from 2016 to 2099. In this study, we mainly analyzed the changing characteristics of drought frequency, drought intensity, and drought cycles for the TP under the four climate scenarios.

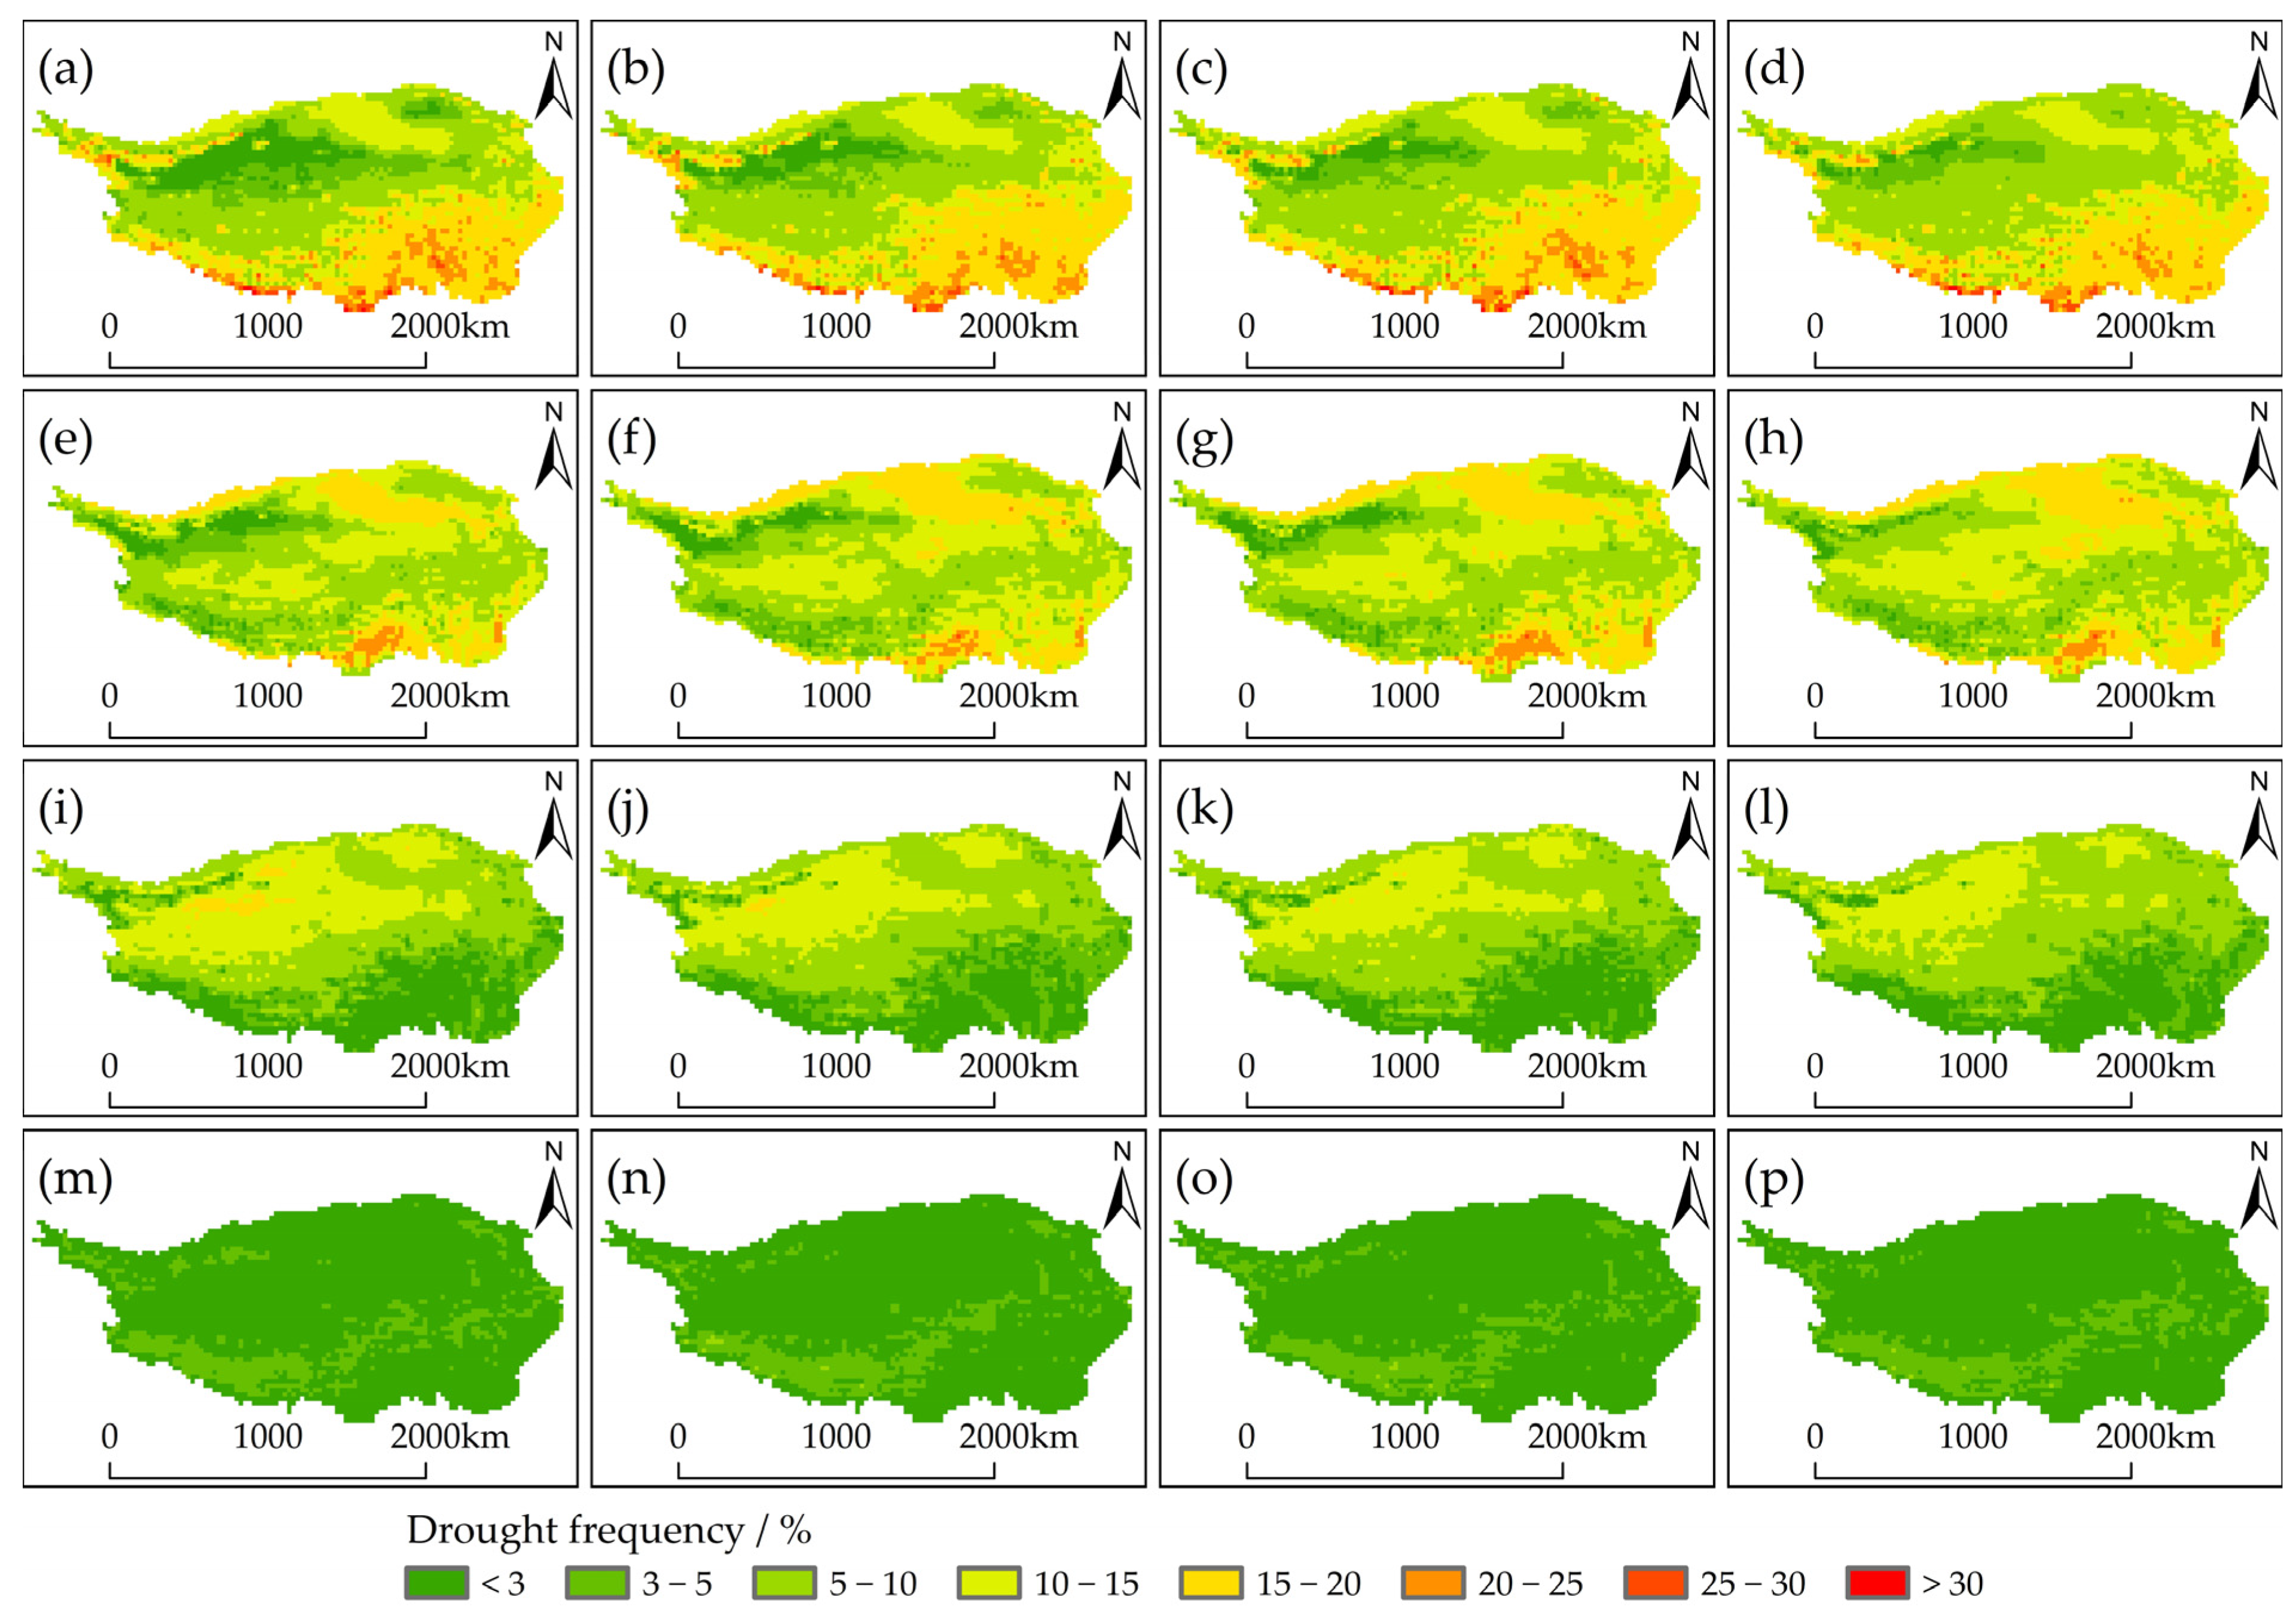
3.3.1. Variation Characteristics of Drought Frequency in Different Grades

According to the drought identification method, combined with the SPEI-1 calculation results for the 0.25° × 0.25° grid of the TP, the droughts in different regions of the TP were distinguished, and the frequencies of drought events predicted from 2016 to 2099 for each grid under the four climate scenarios were summarized and counted (Figure 9). Under the RCP2.6, RCP4.5, RCP6.0, and RCP8.5 climate scenarios, the spatial variation characteristics of the overall drought frequency on the TP in the future will conform to light drought > moderate drought > severe drought > extreme drought ranking. Under the four climatic scenarios, the frequency of light drought will be between 0.11% and 40.84%, mainly in the southern regions of the TP. The frequency of moderate drought will be between 0.08% and 25.50%, mainly in the QB and southern regions of the TP. The frequency of severe drought will be less than 16.94%, mainly in the northwestern regions of the TP. Extreme droughts will occur less frequently, mainly concentrated in the western and central regions of the TP, with a maximum of 6.32%.
To examine further the variation characteristics of future drought changes of various categories for the TP, a statistical analysis of the different categories of drought at each grid point was carried out (Figure 10). Under the four climate scenarios, the mean frequencies of monthly droughts on the TP from 2016 to 2099 were relatively similar, but overall, the mean frequency of droughts is predicted to increase at a rate of 2.65% as the concentration of carbon dioxide emissions increase (RCP8.5 (30.27%) > RCP6.0 (30.23%) > RCP4.5 (30.07%) > RCP2.6 (29.49%)). The mean frequencies of light droughts are predicted to be RCP2.6 (10.81%) < RCP8.5 (11.30%) < RCP4.5 (11.42%) < RCP6.0 (11.33%), with the largest rate of increase being 5.72%. The mean frequencies of moderate and extreme droughts are predicted to increase (i.e., RCP2.6 < RCP4.5 < RCP6.0 < RCP8.5), and the rates of increase for moderate and extreme droughts are predicted to be 9.07% and 4.74%, respectively. The mean frequencies of severe droughts are predicted to decrease gradually (i.e., RCP2.6 (7.34%) > RCP4.5 (6.89%) > RCP6.0 (6.77%) > RCP8.5 (6.66%)), with a decreasing rate of 9.25%. In addition, under the four climatic scenarios from RCP2.6 to RCP8.5, the Std of various drought categories in the TP are in the order of: light drought > moderate drought > severe drought > extreme drought, and Cv of various drought categories are in the order of: extreme drought > severe drought > light drought > moderate drought. These results also indicate that, as the concentration of carbon dioxide emissions increases, the Std and Cv of various drought categories on the TP are predicted to exhibit overall decreasing trends.
In general, as the concentration of carbon dioxide emissions increases, the frequency of monthly droughts on the TP from 2016 to 2099 will increase, the increase of the frequency of moderate droughts will become even more pronounced, and all categories of drought will trend toward more uniform spatial distributions. The degree of dispersion of the spatial distribution of droughts at different levels for the four climate scenarios are in the order of: extreme drought > severe drought > light drought > moderate drought.

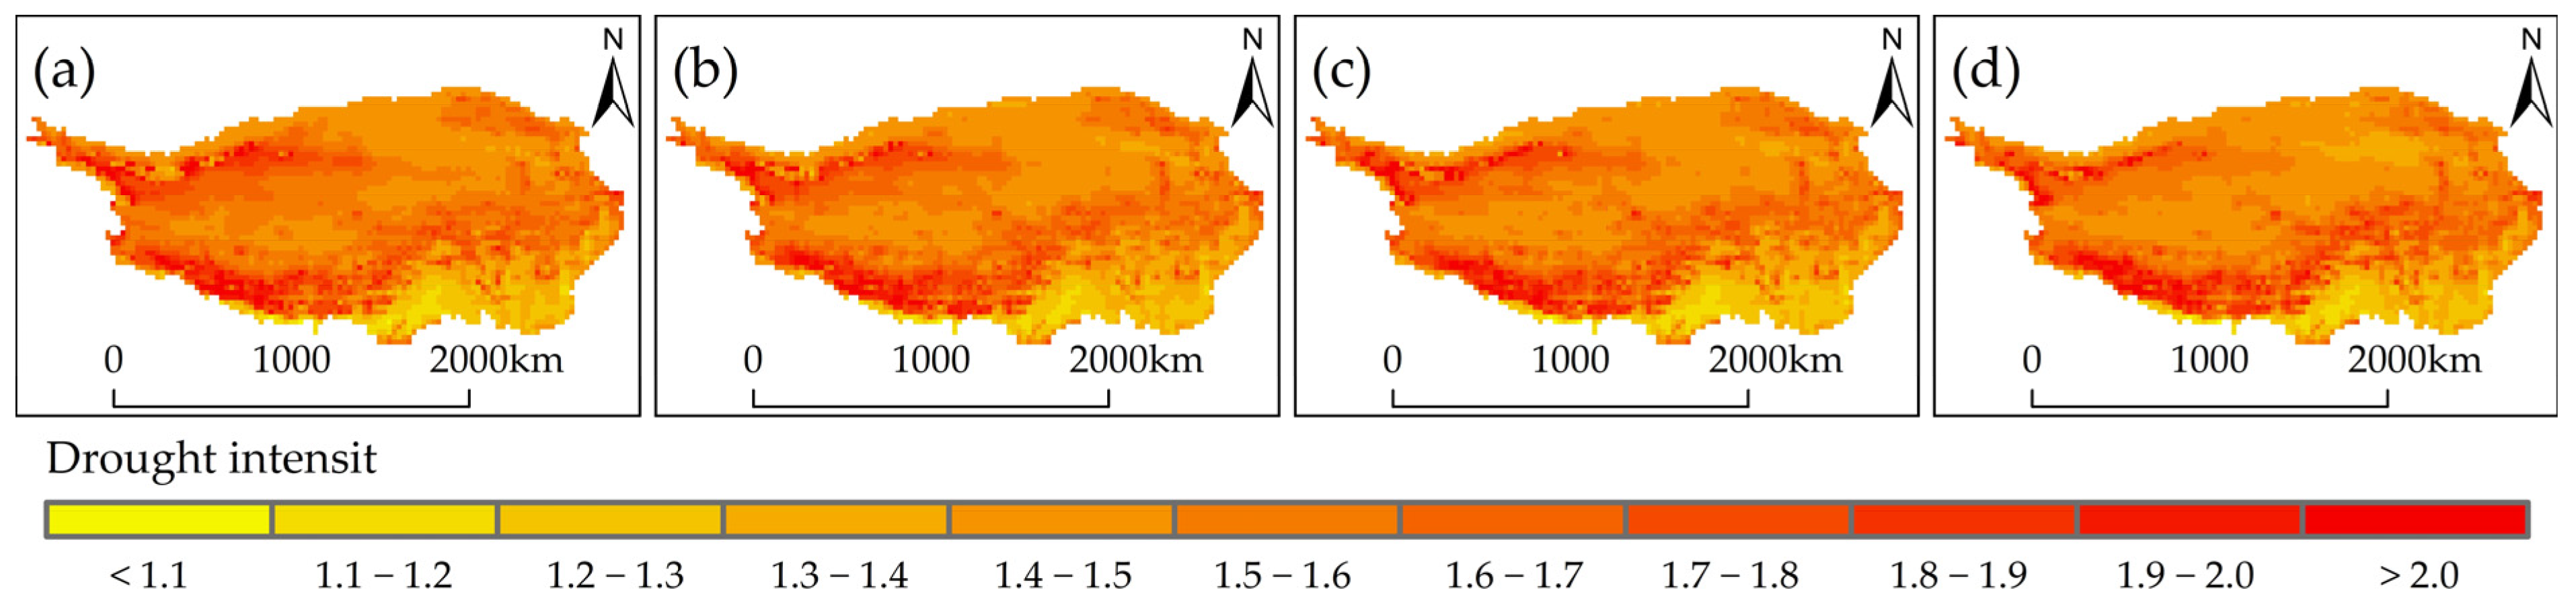
3.3.2. Variation Characteristics of Drought Intensity under Different Climatic Scenarios

Based on the calculated sub-mean drought intensity of each grid point, the spatial distribution map of the sub-mean drought intensity for the four climatic scenarios considered for the TP from 2016 to 2099 was drawn (Figure 11). Under the RCP2.6, RCP4.5, RCP6.0, and RCP8.5 climate scenarios, the sub-mean drought intensities on the TP will range from 1.030 to 3.106, 1.042 to 3.044, 1.027 to 2.973, and 1.033 to 2.759, respectively. The region with the strongest drought intensity is located mainly in the northwest and central part of the TP, while the region with the weakest drought intensity is located mainly in the south of the TP. As the concentration of carbon dioxide emissions increases, the spatial means of the sub-mean drought intensity on the TP from 2016 to 2099 are predicted to be 1.549, 1.535, 1.534, and 1.531, respectively; the Std values are predicted to be 0.169, 0.165, 0.168, and 0.163, respectively; and the Cv values are predicted to be 0.109, 0.107, 0.109, and 0.107, respectively.
In general, there are certain differences in the spatial distributions of the sub-mean drought intensities for the four climatic scenarios for the TP from 2016 to 2099, but the spatial distribution of drought intensities is more uniform than that of drought frequency. The spatial mean values of the sub-mean drought intensity are low, not exceeding 1.55, and the Cv values are also low, not exceeding 0.11. As the concentration of carbon dioxide emissions increases, the overall change in the spatial mean of sub-mean drought intensity is predicted to exhibits a decreasing trend, and the spatial distribution of sub-mean drought intensity develops in a more uniform direction.

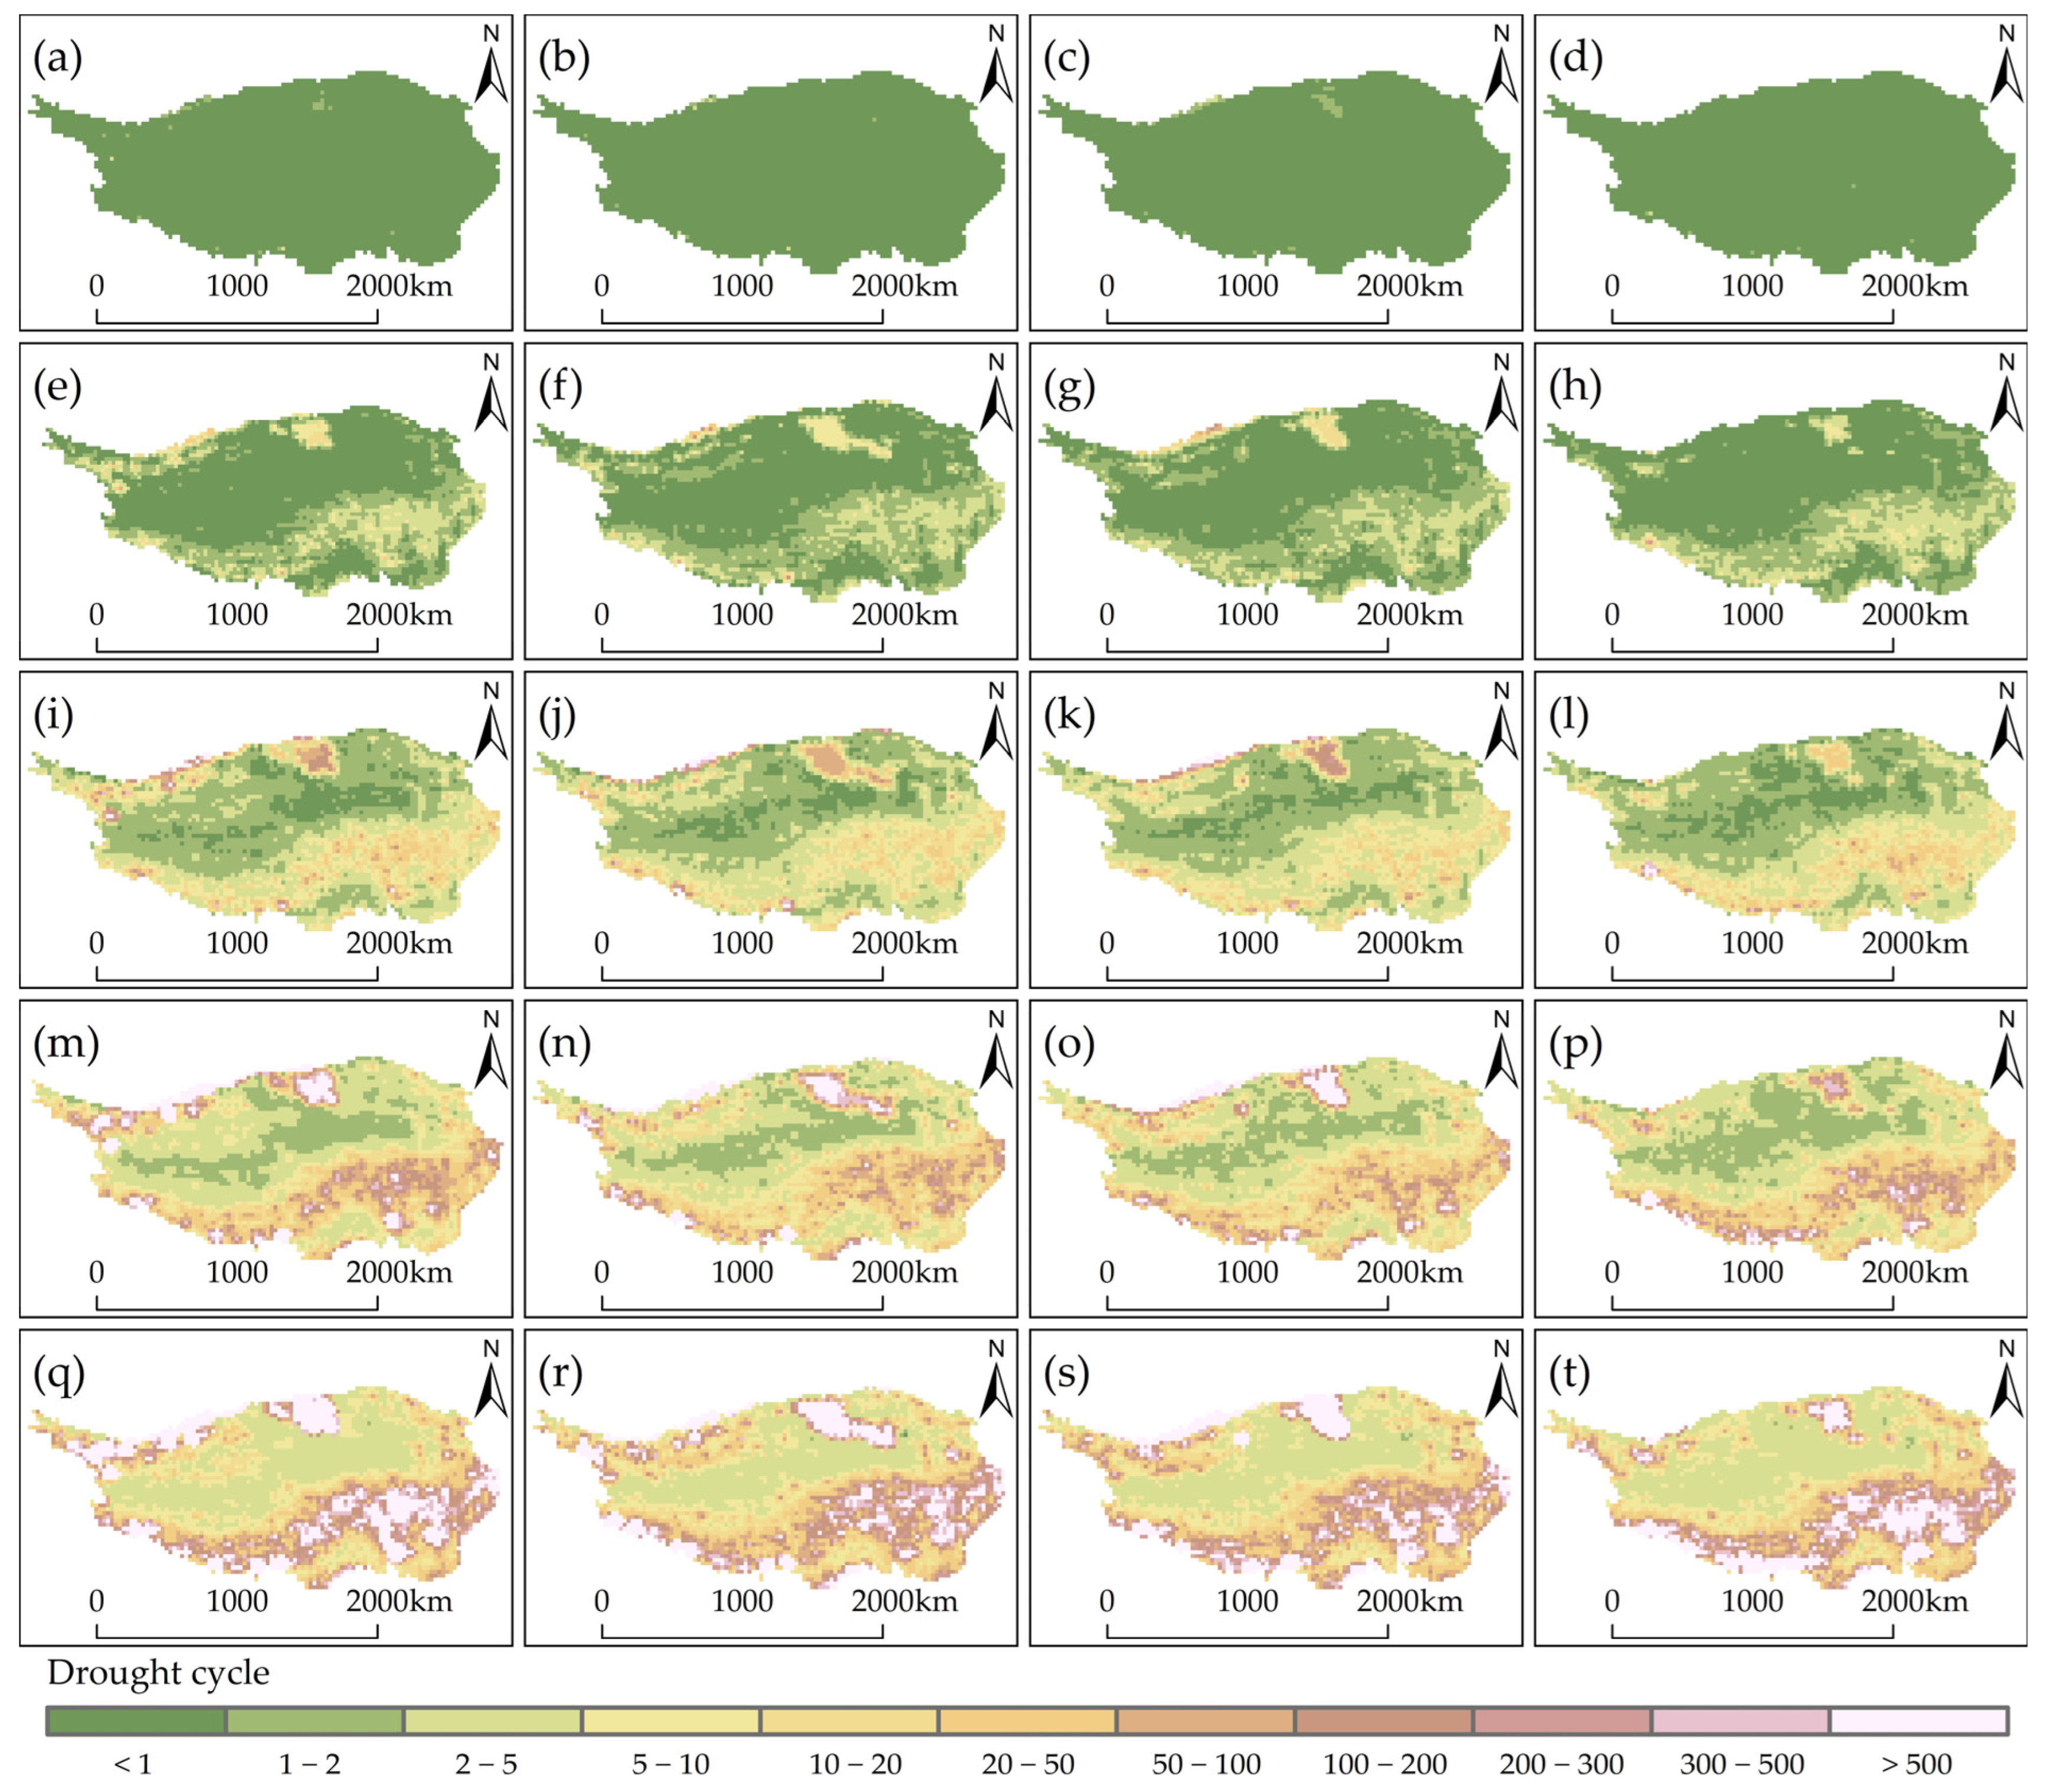
3.3.3. Migration Probabilities and Return Periods of Different Drought Durations

In this study, the run theory was used to calculate the migration probabilities and return periods of different drought durations on the TP under the four climatic scenarios. In calculating the migration probabilities of different drought durations, combined with the SPEI drought grade distribution and the impacts of different grades of drought on the TP, k is taken as –1, i.e., this study only examined the migration probabilities of moderate and more severe droughts on the TP (Figure 12). Under the four climatic scenarios, the drought duration of the TP exhibited approximately the same trend as the theoretical probability distribution. As the drought duration increases, the theoretical probability density decreases exponentially, and when the drought duration exceeds 5 months, the theoretical probability density approaches 0. In addition, under the RCP2.6, RCP4.5, RCP6.0, and RCP8.5 climate scenarios, the drought duration on the TP is mainly less than 3 months, accounting for 82.09%, 80.89%, 79.80%, and 78.28% of the total drought duration, respectively. This indicates that as the concentration of carbon dioxide emissions increases, the possibility of long-lasting meteorological drought on the TP gradually increases.
When the TP drought duration exceeds 5 months, the theoretical probability density will approach zero. Therefore, only the spatial distribution map of the TP drought cycle from 1 to 5 months (Figure 13) was drawn in this study. It can be seen from Figure 13 that for the same drought duration conditions, the spatial distribution of the drought cycles on the TP under the four climate scenarios was relatively consistent. However, as the concentration of carbon dioxide emissions increases, the drought cycle of the TP is gradually shortened. In addition, under the four climate scenarios, the drought cycle of drought duration for one month on the TP is less than one year. The distribution of drought cycles of drought durations of 2–5 months shows obvious differences between the north and south, and the drought cycles in the southern region are longer than in the northern region. The drought cycle of 2-month drought duration in the southern region of the TP is between 2 and 10 years, and that in the northern region is between 1 and 2 years. The cycle of 3-month drought duration in the southern region is between 10 and 50 years, and that in the northern region is between 2 and 5 years. The cycle of 4-month drought duration in the southern region is between 50 and 200 years, and that in the northern region is between 2 and 10 years. The cycle of 5-month drought duration in the southern region is between 200 and 500 years, and that in the northern region is between 5 and 20 years.
Based on these results, it can be concluded that the drought duration is different across the different regions of the TP, and the distribution of drought cycles is also different. The greater the drought duration, the longer the drought cycle. From the perspective of the spatial distribution of drought cycles, the southern region of the TP has a longer drought cycle than the northern region, indicating that the northern region is more susceptible to drought, which is consistent with the actual situation. The reason for this is that the southern region of the TP has a subtropical and tropical northern marginal mountain forest climate, with an annual precipitation of more than 1000 mm, while the annual precipitation in the northern region of the TP is less than 600 mm (Figure 1b). In addition, precipitation in the northern region of the TP is more concentrated in summer, therefore, spring and autumn droughts are more likely to occur in the northern region.

4. Discussion

4.1. Adaptability Analysis of SPEI Index

To evaluate the ability of the SPEI index to reflect the annual scale of drought on the TP, the SPEI, SPI, and precipitation anomaly in percentage (PA) indices of each grid point under the four climate scenarios from 2016 to 2099 were used to conduct a correlation analysis (Figure 14). The following levels of degree of correlation were defined: greater than 0.60, a strong positive correlation; between 0.40 and 0.60, a significant correlation; between 0 and 0.4, a weak positive correlation; and less than 0, a negative correlation.
Judging from the spatial distribution results of the correlation coefficients of the three drought indices under the four climate scenarios, the correlations between the SPEI, SPI, and PA indices for the southern part of the TP are stronger than those for the northern part, because the southern region receives more precipitation and is mostly a high-altitude mountainous area, with relatively low temperatures and evaporation [63,64]. The change in precipitation dominates the wet–dry change in the southern part of the TP [65]. Therefore, the SPI and PA indices, which only consider precipitation, can better reflect the wet–dry changes in the southern part of the TP. The SPI, PA, and SPEI indices are all strongly positively correlated. However, the precipitation in the northern part of the TP is relatively low, especially in the QB, where precipitation and evaporation jointly dominate the wet–dry changes in this region [66,67]. Therefore, the correlations between the SPI, PA, and SPEI indices in the northern region are poorer than in the southern region.
In addition, the temperature and evaporation of the TP increase with carbon dioxide emissions, and the correlations between the SPEI index (which considers precipitation and evaporation) and the SPI and PA indices (which only consider precipitation) gradually decrease. This is especially true for the QB under the RCP8.5 climate scenario: the correlation coefficients of the SPI, PA, and SPEI indices were all less than 0.4, indicating weak positive correlations. This indicates that as the temperature increases in the future, the influence of evaporation on climate change on the TP will gradually increase, and the SPEI index (which considers precipitation and evaporation) will better reflect the characteristics of climate change on the TP [68] This is consistent with research results obtained by Xu et al. [69], who found that by using different drought indices to predict the drought characteristics of humid subtropical basins in China in the context of climate warming, the SPI would not reflect the effect of evaporation and would underestimate the frequency of regional droughts.

4.2. Difference Analysis of Drought Variation at Different Time Scales

The annual-scale degree of drought in the region will tend to decrease slightly in the future (Figure 5) as a result of the increases in precipitation and temperature in the TP, except under the RCP6.0 climate scenario. Xu et al. [70] analyzed China’s past drought trends and found that the TP has exhibited a wetting trend, which is consistent with our research findings on the future drought trends predicted for the TP. In addition, we found that the frequency of monthly-scale droughts in the TP is predicted to increase, which is consistent with the results of Han et al. [57] and Wang et al. [71], who found that southwest China may suffer from more severe drought disasters in the future.
In general, there will be differences in the characteristics of drought change at different time scales on the TP in the future. The main reasons for this phenomenon are that the frequency of severe drought and extreme drought will increase significantly and that extremely humid events will also become more frequent, especially under the RCP8.5 climate scenario (Figure 8). The annual-scale SPEI can reflect the relationship between the long-term trend and interannual variation of drought, but it is less sensitive to extreme events, so it is more suitable for long-term drought trend assessment [49]. The monthly-scale SPEI can reflect the characteristics of regional short-term dry and wet variation and is more sensitive to extreme events, and thus it is more suitable for the analysis of drought characteristics [50]. Therefore, this study analyzed the future drought variation characteristics of the TP on annual and monthly scales, which can better reflect the drought variation characteristics of the study area under different climate scenarios.

4.3. Analysis of Difference in Spatiotemporal Variation of Drought Characteristics

As global carbon dioxide emission concentrations, as well as the extreme difference and Std of the SPEI-1 for the TP, are predicted to increase, this indicates that the dispersion of dry-wet changes in each month will also gradually increase, and that the annual distribution law will gradually develop in a non-uniform direction (Figure 6). The main reasons for this phenomenon are that extreme precipitation in the TP will respond strongly to warming in the future, daily mean precipitation extremes will increase, extreme precipitation events will occur significantly more frequently, and the intra-annual distribution of precipitation will be more uneven than in the past, which is consistent with previous research results [72,73,74].
Spatially, as the carbon dioxide emission concentration increases, the spatial distributions of drought and sub-mean drought intensity at all levels on the TP will develop in a more uniform direction (Figure 8 and Figure 10). There are two main reasons for this phenomenon. First, in the context of climate warming, the temperature of the TP has increased significantly, which has aggravated the melting of ice and snow and the increase of permafrost active layers [75,76]. These changes have led to soil moisture change and migration (especially in the upper layer), and have affected water and heat exchange between the land and air [77]. Second, the TP has a high altitude and complex terrain, with a large spatial variability of annual and seasonal precipitation [78,79]. As the overall precipitation on the TP increases, the spatial distribution of water differences decreases [80].
In general, the annual precipitation on the TP will increase in the future, and the annual distribution will develop in a more uneven direction, resulting in differences in the spatiotemporal variation of drought on the TP and increasing the frequency of extreme climate events on the TP. Previous studies have shown that ~45% of the world’s land is affected by drought disasters, and the annual losses due to drought are as high as 6 to 8 billion dollars [81]. In the future, the global area affected by drought will continue to expand, and there will be a trend of gradual expansion of drought from arid areas to sub-humid and humid areas [11]. By the end of this century, it is expected that dry land will cover half of the Earth’s land surface, and the total area of extremely dry land will increase by more than double [82,83]. In addition, studies have shown that future aridification will not only cause huge economic losses but also lead to systematic and abrupt changes in various ecosystem properties [84,85]. Under the scenario of future global warming, the TP, as a sensitive and vulnerable region, will face a greater threat of drought, especially extreme drought events. Therefore, we should continue to pay close attention to climate change in the TP and improve our abilities to predict and provide early warnings of extreme climate disasters [86,87].

5. Conclusions

Annual and monthly scale SPEI drought indices were used with the GFDL-ESM2M climate model to study predicted drought trends for the TP from 2016 to 2099 under four RCP scenarios: RCP2.6, RCP4.5, RCP6.0, and RCP8.5, representing very low, low, medium, and high levels of greenhouse gas emissions, respectively. The duration, frequency, intensity, and cycle of drought events were analyzed based on the variation of SPEI on the TP over different time, and the applicability of different drought indices was examined. The following conclusions are drawn from the results:
(1) The future climate of the TP is predicted to be warmer and more humid than that of the past, and these changes are most obvious under the RCP8.5 climate scenario. As the concentration of carbon dioxide emissions increases, the annual wet–dry variation of the TP will tend to develop in a non-uniform direction, and the proportion of areas of extremely significant aridity and humidification will both increase significantly, which indicates the possibility of increased extreme disasters for the region in the future.
(2) Under all four climate scenarios, the TP will be dominated by light drought in the future. As the carbon dioxide emission concentration increases, the frequency of occurrence of droughts in the TP will gradually increase, yet the spatial average value of sub-mean drought intensity will decrease. However, the spatial distribution of both these factors will tend to develop in a uniform direction.
(3) Under all four climate scenarios, the drought duration of the TP is mainly less than 3 months, and when the drought duration exceeds 5 months, the theoretical probability density will approach 0. As the carbon dioxide emission concentration increases, the drought cycle of the TP will gradually shorten. The southern region of the TP has a longer drought cycle than the northern region, which indicates that the northern region is more susceptible to drought.

Author Contributions

Conceptualization, Y.L., Z.J. and X.M.; methodology, Y.L. and Z.J.; software, Y.L.; validation, Y.L.; formal analysis, Y.L.; investigation, Z.J.; resources, Z.J. and X.M.; data curation, Y.L. and W.Z.; writing—original draft preparation, Y.L., Y.W., R.G. and Z.J.; writing—review and editing, Y.L., Y.W., Z.G., Y.G. and X.M.; visualization, X.M.; supervision, Y.L. and Z.J.; project administration, Z.J. and X.M.; funding acquisition, Z.J. and X.M. All authors have read and agreed to the published version of the manuscript.

Funding

This research was funded by the National Natural Science Foundation of China (52179048, 42001033), the National Key R&D Program of China (2021YFD1900600), and the Natural Science Basic Research Plan in Shaanxi Province of China (2021JQ-237).

Institutional Review Board Statement

Not applicable.

Informed Consent Statement

Not applicable.

Data Availability Statement

Not applicable.

Acknowledgments

The authors gratefully acknowledge the National Tibetan Plateau Data Center and the Institute of Geographic Sciences and Natural Resources Research, CAS for providing support.

Conflicts of Interest

The authors declare no conflict of interest.

References

  1. Dai, A. Increasing drought under global warming in observations and models. Nat. Clim. Chang. 2013, 3, 52–58. [Google Scholar] [CrossRef]
  2. Liu, Z.P.; Wang, Y.Q.; Shao, M.G.; Jia, X.X.; Li, X.L. Spatiotemporal analysis of multiscalar drought characteristics across the Loess Plateau of China. J. Hydrol. 2016, 534, 281–299. [Google Scholar] [CrossRef]
  3. Duan, W.L.; Zou, S.; Chen, Y.N.; Daniel, N.; Fang, G.H.; Wang, Y. Sustainable water management for cross-border resources: The Balkhash Lake Basin of Central Asia, 1931–2015. J. Clean. Prod. 2020, 263, 121614. [Google Scholar] [CrossRef]
  4. Lin, Y.; Grimm, N.B. Modelling potential impacts of climate change on water and nitrate export from a mid-sized, semiarid watershed in the US Southwest. Clim. Chang. 2013, 120, 419–431. [Google Scholar]
  5. Zha, X.B.; Luo, P.P.; Zhu, W.; Wang, S.T.; Lyu, J.Q.; Zhou, M.M.; Huo, A.D.; Wang, Z.H. A bibliometric analysis of the research on Sponge City: Current situation and future development direction. Ecohydrology 2021, 14, e2328. [Google Scholar] [CrossRef]
  6. Huang, W.J.; Duan, W.L.; Chen, Y.N. Rapidly declining surface and terrestrial water resources in Central Asia driven by socioeconomic and climatic changes. Sci. Total. Environ. 2021, 784, 147193. [Google Scholar] [CrossRef]
  7. Mu, D.R.; Luo, P.P.; Lyu, J.Q.; Zhou, M.M.; Huo, A.D.; Duan, W.; Nover, D.; He, B.; Zhao, X.L. Impact of temporal rainfall patterns on flash floods in Hue City, Vietnam. J. Flood Risk Manag. 2020, 14, e12668. [Google Scholar] [CrossRef]
  8. Xie, D.N.; Duan, L.; Si, G.Y.; Liu, W.J.; Zhang, T.; Mulder, J. Long–term 15N balance after single–dose input of 15N–labeled NH4+ and NO3– in a subtropical forest under reducing N deposition. Glob. Biogeochem. Cycles 2021, 35, e2021GB006959. [Google Scholar] [CrossRef]
  9. Zhang, Y.; Luo, P.P.; Zhao, S.F.; Kang, S.X.; Wang, P.B.; Zhou, M.M.; Lyu, J.Q. Control and remediation methods for eutrophic lakes in the past 30 years. Water Sci. Technol. 2020, 81, 1099–1113. [Google Scholar] [CrossRef]
  10. Feng, S.; Fu, Q. Expansion of global drylands under a warming climate. Atmos. Chem. Phys. Discuss. 2013, 13, 14637–14665. [Google Scholar] [CrossRef] [Green Version]
  11. Huang, J.P.; Yu, H.P.; Guan, X.D.; Wang, G.Y.; Guo, R.X. Accelerated dryland expansion under climate change. Nat. Clim. Chang. 2016, 6, 166–171. [Google Scholar] [CrossRef]
  12. United Nations Convention to Combat Desertification. The Global Land Outlook, 1st ed.; UNCCD: Bonn, Germany, 2017. [Google Scholar]
  13. Liu, Y.W.; Liu, Y.B.; Wang, W. Inter-comparison of satellite-retrieved and Global Land Data Assimilation System-simulated soil moisture datasets for global drought analysis. Remote Sens. Environ. 2019, 220, 1–18. [Google Scholar] [CrossRef]
  14. Akhtar-Schuster, M.; Stringer, L.C.; Metternicht, G.; Barger, N.N.; Chotte, J.-L.; Kust, G. Assessing the impact of science in the implementation of the United Nations Convention to Combat Desertification. Land 2022, 11, 568. [Google Scholar] [CrossRef]
  15. Lkhagvadorj, N.; Zhang, J.H.; Battsetseg, T.; Yang, S.S.; Sonam, R.; Ahmed, P.F.; Pangali, S.T.P. Assessment of drought impact on net primary productivity in the terrestrial ecosystems of Mongolia from 2003 to 2018. Remote Sens. 2021, 13, 2522. [Google Scholar]
  16. Huang, J.L.; Zhai, J.Q.; Jiang, T.; Wang, Y.J.; Li, X.C.; Wang, R.; Xiong, M.; Su, B.D.; Fischer, T. Analysis of future drought characteristics in China using the regional climate model CCLM. Clim. Dyn. 2018, 50, 507–525. [Google Scholar] [CrossRef]
  17. Wang, Y.X.; Lv, J.; Jamie, H.; Wang, Y.C.; Sun, H.Q.; Lucy, J.B.; Ma, M.M.; Su, Z.C.; Michael, E. Linking drought indices to impacts to support drought risk assessment in Liaoning province, China. Nat. Hazards Earth Syst. Sci. 2020, 20, 889–906. [Google Scholar] [CrossRef] [Green Version]
  18. Zhu, Y.N.; Lei, L.; Zhao, Y.; Liang, Z.M.; Li, H.H.; Wang, L.Z.; Wang, Q.M. Regional comprehensive drought disaster risk dynamic evaluation based on projection pursuit clusterin. Water Policy 2018, 20, 410–428. [Google Scholar] [CrossRef]
  19. Hu, Z.; Wu, Z.; Islam, A.R.M.T.; You, X.Y.; Liu, C.; Li, Q.; Zhang, X.S. Spatiotemporal characteristics and risk assessment of agricultural drought disasters during the winter wheat-growing season on the Huang-Huai-Hai Plain, China. Theor. Appl Climatol. 2021, 143, 1393–1407. [Google Scholar] [CrossRef]
  20. Orimoloye, I.R.; Ololade, O.O.; Belle, J.A. Satellite-based application in drought disaster assessment using terra MOD13Q1 data across free state province, South Africa. J. Environ. Manag. 2021, 285, 112112. [Google Scholar] [CrossRef]
  21. Li, L.; Zhang, R. Effect of upper-level air temperature changes over the Tibetan Plateau on the genesis frequency of Tibetan Plateau vortices at interannual timescales. Clim. Dyn. 2021, 57, 341–352. [Google Scholar] [CrossRef]
  22. Abraham, J.G.; Danielle, C.V.K.; Greg, R.H.; Garry, W. Catchment-scale drought: Capturing the whole drought cycle using multiple indicators. Hydrol. Earth Syst. Sci. 2020, 24, 1985–2002. [Google Scholar]
  23. Annette, H.; Laura, C.; Reed, M. Evaluating the relative importance of precipitation, temperature and land-cover change in the hydrologic response to extreme meteorological drought conditions over the North American High Plains. Hydrol. Earth Syst. Sci. 2019, 23, 1931–1950. [Google Scholar]
  24. Wang, F.; Yang, H.B.; Wang, Z.M.; Zhang, Z.Z.; Li, Z.H. Drought evaluation with CMORPH satellite precipitation data in the Yellow River Basin by using gridded standardized precipitation evapotranspiration index. Remote Sens. 2019, 11, 485. [Google Scholar] [CrossRef] [Green Version]
  25. Yang, J.; Chang, J.X.; Wang, Y.M.; Li, Y.Y.; Hu, H.; Chen, Y.T.; Huang, Q.; Yao, J. Comprehensive drought characteristics analysis based on a nonlinear multivariate drought index. J. Hydrol. 2018, 557, 651–667. [Google Scholar] [CrossRef]
  26. Immerzeel, W.W.; Beek, L.P.H.v.; Bierkens, M.F.P. Climate change will affect the Asian water towers. Science 2010, 328, 1382–1385. [Google Scholar] [CrossRef] [PubMed]
  27. Pritchard, H.D. Retraction: Asia′s glaciers are a regionally important buffer against drought. Nature 2018, 555, 274. [Google Scholar] [CrossRef] [Green Version]
  28. Wu, G.X.; Liu, Y.M.; He, B.; Bao, Q.; Duan, A.M.; Jin, F.F. Thermal controls on the Asian summer monsoon. Sci. Rep. 2012, 2, 404. [Google Scholar] [CrossRef] [Green Version]
  29. Wang, M.R.; Wang, J.; Duan, A.M.; Liu, Y.M.; Zhou, S.W. Coupling of the quasi-biweekly oscillation of the Tibetan Plateau summer monsoon with the arctic oscillation. Geophys. Res. Lett. 2018, 45, 7756–7764. [Google Scholar] [CrossRef]
  30. Duan, A.M.; Xiao, Z.X. Does the climate warming hiatus exist over the Tibetan Plateau? Sci. Rep. 2015, 5, 13711. [Google Scholar] [CrossRef] [Green Version]
  31. An, S.; Chen, X.Q.; Zhang, X.Y.; Lang, W.G.; Ren, S.L.; Xu, L. Precipitation and minimum temperature are primary climatic controls of alpine grassland autumn phenology on the Qinghai-Tibet Plateau. Remote Sens. 2020, 12, 431. [Google Scholar] [CrossRef] [Green Version]
  32. Resources and Environment Data Cloud Platform of the Chinese Academy of Sciences. Available online: http://www.resdc.cn/ (accessed on 11 November 2021).
  33. Dunne, J.P.; John, J.G.; Adcroft, A.J.; Griffies, S.M.; Hallberg, R.W.; Shevliakova, E.; Stouffer, R.J.; Cooke, W.; Dunne, K.A.; Harrison, M.J.; et al. GFDL’s ESM2 Global coupled climate–carbon Earth system models. Part I. J. Clim. 2012, 25, 6646–6665. [Google Scholar] [CrossRef] [Green Version]
  34. Ng, B.; Cai, W.J.; Walsh, K. Nonlinear feedbacks associated with the Indian Ocean Dipole and their response to Global warming in the GFDL-ESM2M coupled climate model. J. Clim. 2014, 27, 3904–3919. [Google Scholar] [CrossRef]
  35. Dunne, J.P.; John, J.G.; Shevliakova, E.; Stouffer, R.J.; Krasting, J.P.; Malyshev, S.L.; Milly, P.C.D.; Sentman, L.T.; Adcroft, A.J.; Cooke, W.; et al. GFDL’s ESM2 Global coupled climate–carbon Earth system models. Part II. J. Clim. 2013, 26, 2247–2267. [Google Scholar] [CrossRef] [Green Version]
  36. Jia, K.; Ruan, Y.F.; Yang, Y.Z.; You, Z. Assessment of CMIP5 GCM simulation performance for temperature projection in the Tibetan Plateau. Earth Space Sci. 2019, 6, 2362–2378. [Google Scholar] [CrossRef]
  37. Bi, Y.J.; Zhao, J.; Wu, D.; Zhao, Y. Spatiotemporal variations of future potential evapotranspiration in the Beijing-Tianjin-Hebei region under GFDL-ESM2M climate model. Trans. Chin. Soc. Agric. Eng. 2020, 36, 140–149. [Google Scholar]
  38. Ma, D.Y.; Deng, H.Y.; Yin, Y.H.; Wu, S.H.; Zhang, D. Sensitivity of arid/humid patterns in China to future climate change under a high-emissions scenario. J. Geogr. Sci. 2019, 29, 29–48. [Google Scholar] [CrossRef] [Green Version]
  39. Pan, X.D.; Zhang, L.; Huang, C.L. Future climate projection in Northwest China with RegCM4.6. Earth Space Sci. 2020, 7, e2019EA000819. [Google Scholar] [CrossRef]
  40. National Tibetan Plateau Data Center. Future Climate Projection of China Based on Regcm4.6 (2007–2099). Available online: http://data.tpdc.ac.cn (accessed on 16 November 2021).
  41. Yao, N.; Li, L.C.; Feng, P.Y.; Feng, H.; Liu, D.L.; Liu, Y.; Jiang, K.T.; Hu, X.T.; Li, Y. Projections of drought characteristics in China based on a standardized precipitation and evapotranspiration index and multiple GCMs. Sci. Total Environ. 2020, 704, 135245. [Google Scholar] [CrossRef] [PubMed]
  42. Liu, Y.; Tian, J.Y.; Liu, R.H.; Ding, L.Q. Influences of climate change and ruman activities on NDVI changes in China. Remote Sens. 2021, 13, 4326. [Google Scholar] [CrossRef]
  43. Vicente-Serrano, S.M.; Beguerà a, S.; López-Moreno, J.I. A Multiscalar drought index sensitive to Global warming: The standardized precipitation evapotranspiration index. J. Clim. 2010, 23, 1696–1718. [Google Scholar] [CrossRef] [Green Version]
  44. Ndehedehe, C.E.; Agutu, N.O.; Ferreira, V.G.; Getirana, A. Evolutionary drought patterns over the Sahel and their teleconnections with low frequency climate oscillations. Atmosp. Res. 2020, 233, 104700. [Google Scholar] [CrossRef] [Green Version]
  45. Zhang, B.Q.; Long, B.; Wu, Z.Y.; Wang, Z.K. An evaluation of the performance and the contribution of different modified water demand estimates in drought modeling over water-stressed regions. Land Degrad. Develop. 2017, 28, 1134–1151. [Google Scholar] [CrossRef]
  46. Zhang, R.W.; Zhao, C.Y.; Ma, X.F.; Brindha, K.; Han, Q.F.; Li, C.F.; Zhao, X.N. Projected spatiotemporal dynamics of drought under Global warming in Central Asia. Sustainability 2019, 11, 4421. [Google Scholar] [CrossRef] [Green Version]
  47. Zhang, Y.Z.; Huang, C.C.; Tan, Z.H.; Chen, Y.L.; Qiu, H.J.; Huang, C.; Li, Y.Q.; Zhang, Y.X.; Li, X.G.; Shulmeister, J.; et al. Prehistoric and historic overbank floods in the Luoyang Basin along the Luohe River, middle Yellow River basin, China. Quat. Int. 2019, 521, 118–128. [Google Scholar] [CrossRef]
  48. Jung, I.W.; Chang, H. Climate change impacts on spatial patterns in drought risk in the Willamette River Basin, Oregon, USA. Theor. Appl. Climatol. 2012, 108, 355–371. [Google Scholar] [CrossRef]
  49. Chen, S.D.; Zhang, L.P.; Liu, X.; Guo, M.Y.; She, D.X.; Qian, B.D. The use of SPEI and TVDI to assess temporal-spatial variations in drought conditions in the Middle and Lower Reaches of the Yangtze River Basin, China. Adv. Meteorol. 2018, 2018, 1–11. [Google Scholar] [CrossRef]
  50. Li, X.Z.; Huang, W.R. How long should the pre-existing climatic water balance be considered when capturing short-term wetness and dryness over China by using SPEI? Sci. Total Environ. 2021, 786, 147575. [Google Scholar] [CrossRef]
  51. Thornthwaite, C.W. An approach toward a rational classification of climate. Soil Sci. 1948, 66, 77. [Google Scholar] [CrossRef] [Green Version]
  52. Willmott, C.J.; Rowe, C.M.; Mintz, Y. Climatology of the terrestrial seasonal water cycle. J. Climatol. 1985, 5, 589–606. [Google Scholar] [CrossRef]
  53. Wei, X.D.; Wang, N.; Luo, P.P.; Yang, J.; Zhang, J.; Lin, K.L. Spatiotemporal assessment of land marketization and its driving forces for sustainable urban–rural development in Shaanxi Province in China. Sustainability 2021, 13, 7755. [Google Scholar] [CrossRef]
  54. Güçlü, Y.S. Improved visualization for trend analysis by comparing with classical Mann-Kendall test and ITA. J. Hydrol. 2020, 584, 124674. [Google Scholar] [CrossRef]
  55. Hamed, K.H. Exact distribution of the Mann–Kendall trend test statistic for persistent data. J. Hydrol. 2008, 365, 86–94. [Google Scholar] [CrossRef]
  56. Meng, X.Y.; Gao, X.; Li, S.Y.; Lei, J.Q. Spatial and temporal characteristics of vegetation NDVI changes and the driving forces in Mongolia during 1982–2015. Remote Sens. 2020, 12, 603. [Google Scholar] [CrossRef] [Green Version]
  57. Han, R.C.; Li, Z.L.; Li, Z.J.; Han, Y.Y. Spatial–temporal assessment of historical and future meteorological droughts in China. Atmosphere 2021, 12, 787. [Google Scholar] [CrossRef]
  58. Wu, R.N.; Zhang, J.q.; Bao, Y.H.; Guo, E.L. Run theory and copula-based drought risk analysis for songnen grassland in Northeastern China. Sustainability 2019, 11, 6032. [Google Scholar] [CrossRef]
  59. Moyé, L.A.; Kapadia, A.S. Predictions of drought length extreme order statistics using run theory. J. Hydrol. 1995, 169, 95–110. [Google Scholar] [CrossRef]
  60. Guo, H.; Bao, A.M.; Liu, T.; Guli·, J.; Felix, N.; Jiang, L.L.; Alishir, K.; Philippe, D.M. Spatial and temporal characteristics of droughts in Central Asia during 1966–2015. Sci. Total Environ. 2017, 624, 1523–1538. [Google Scholar] [CrossRef]
  61. Gallegati, M. Multiscale evaluation of CMIP5 models using wavelet-based descriptive and diagnostic techniques. Clim. Chang. 2022, 170, 41. [Google Scholar] [CrossRef]
  62. Giuseppe, M.; Alfonso, S. Evaluation of parametric and statistical approaches for the regionalization of flow duration curves in intermittent regimes. J. Hydrol. 2013, 480, 19–32. [Google Scholar]
  63. Wang, C.P.; Huang, M.T.; Zhai, P.M. Change in drought conditions and its impacts on vegetation growth over the Tibetan Plateau. Adv. Clim. Chang. Res. 2021, 12, 333–341. [Google Scholar] [CrossRef]
  64. Li, L.; Zhang, R.H.; Wen, M.; Lv, J.M. Regionally different precipitation trends over the Tibetan Plateau in the warming context: A perspective of the Tibetan Plateau vortices. Geophys. Res. Lett. 2021, 48, e2020GL091680. [Google Scholar] [CrossRef]
  65. Gao, Y.H.; Li, X.; Leung, L.R.; Chen, D.L.; Xu, J.W. Aridity changes in the Tibetan Plateau in a warming climate. Environ. Res. Lett. 2015, 10, 034013. [Google Scholar] [CrossRef]
  66. Liu, J.; Zhang, T.J.; Wu, Q.B.; Jiang, G.L. Recent climate changes in the Northwestern Qaidam Basin inferred from geothermal gradients. Earth Sci. Inform. 2020, 13, 261–270. [Google Scholar] [CrossRef]
  67. Jia, Y.X.; Wu, H.B.; Zhang, W.C.; Li, Q.; Yu, Y.Y.; Zhang, C.X.; Sun, A.Z. Quantitative cenozoic climatic reconstruction and its implications for aridification of the Northeastern Tibetan Plateau. Palaeogeogr. Palaeoclimatol. Palaeoecol. 2021, 567, 110244. [Google Scholar] [CrossRef]
  68. Zarei, A.R.; Shabani, A.; Moghimi, M.M. Accuracy Assessment of the SPEI, RDI and SPI drought indices in regions of Iran with different climate conditions. Pure Appl. Geophys. 2021, 178, 1387–1403. [Google Scholar] [CrossRef]
  69. Xu, K.; Wu, C.H.; Zhang, C.; Hu, B.X. Uncertainty assessment of drought characteristics projections in humid subtropical basins in China based on multiple CMIP5 models and different index definitions. J. Hydrol. 2021, 600, 126502. [Google Scholar] [CrossRef]
  70. Xu, K.; Yang, D.W.; Yang, H.B.; Li, Z.; Qin, Y.; Shen, Y. Spatio-temporal variation of drought in China during 1961–2012: A climatic perspective. J. Hydrol. 2015, 526, 253–264. [Google Scholar] [CrossRef]
  71. Wang, L.; Chen, W.; Zhou, W. Assessment of future drought in Southwest China based on CMIP5 multimodel projections. Adv. Atmosp. Sci. 2014, 31, 1035–1050. [Google Scholar] [CrossRef]
  72. Easterling, D.R.; Kunkel, K.E.; Wehner, M.F.; Sun, L. Detection and attribution of climate extremes in the observed record. Weather. Clim. Extrem. 2016, 11, 17–27. [Google Scholar] [CrossRef] [Green Version]
  73. Donat, M.G.; Lowry, A.L.; Alexander, L.V.; O’Gorman, P.A.; Maher, N. More extreme precipitation in the world′s dry and wet regions. Nat. Clim. Chang. 2016, 6, 508–513. [Google Scholar] [CrossRef]
  74. Allan, R.P.; Soden, B.J. Atmospheric warming and the amplification of precipitation extremes. Science 2008, 321, 1481–1484. [Google Scholar] [CrossRef] [PubMed] [Green Version]
  75. Wang, C.H.; Wang, Z.L.; Kong, Y.; Zhang, F.M.; Yang, K.; Zhang, T.J. Most of the Northern Hemisphere permafrost remains under climate change. Sci. Rep. 2019, 9, 3295. [Google Scholar] [CrossRef] [Green Version]
  76. Yang, K.; Wu, H.; Qin, J.; Lin, C.G.; Tang, W.J.; Chen, Y.Y. Recent climate changes over the Tibetan Plateau and their impacts on energy and water cycle: A review. Global. Planet. Chang. 2014, 112, 79–91. [Google Scholar] [CrossRef]
  77. Kang, S.C.; Xu, Y.W.; You, Q.L.; Flügel, W.A.; Pepin, N.; Yao, T.D. Review of climate and cryospheric change in the Tibetan Plateau. Environ. Res. Lett. 2010, 5, 015101. [Google Scholar] [CrossRef]
  78. Eyring, V.; Cox, P.M.; Flato, G.M.; Gleckler, P.J.; Abramowitz, G.; Caldwell, P.; Collins, W.D.; Gier, B.K.; Hall, A.D.; Hoffman, F.M.; et al. Taking climate model evaluation to the next level. Nat. Clim. Chang. 2019, 9, 102–110. [Google Scholar] [CrossRef] [Green Version]
  79. Xu, Y.; Xu, C.H. Preliminary Assessment of simulations of climate changes over China by CMIP5 multi-models. Atmosp. Ocean. Sci. Lett. 2012, 5, 489–494. [Google Scholar]
  80. Su, F.G.; Duan, X.L.; Chen, D.L.; Hao, Z.C.; Cuo, L. Evaluation of the Global climate models in the CMIP5 over the Tibetan Plateau. J. Clim. 2013, 26, 3187–3208. [Google Scholar] [CrossRef]
  81. Keyantash, J.; Dracup, J.A. The quantification of drought: An evaluation of drought indices. Bull. Am. Meteorol. Soc. 2002, 83, 1167–1180. [Google Scholar] [CrossRef]
  82. Cook, B.I.; Mankin, J.S.; Marvel, K.; Williams, A.P.; Smerdon, J.E.; Anchukaitis, K.J. Twenty-first century drought projections in the CMIP6 forcing scenarios. Earth′s Future 2020, 8, e2019EF001461. [Google Scholar] [CrossRef] [Green Version]
  83. Yadu, P.; Farshid, F.; Yusuke, S.; Julien, B.; Peter, B.; Anne, G.; Dieter, G.; Gosling, S.N.; Manolis, G.; Lukas, G.; et al. Global terrestrial water storage and drought severity under climate change. Nat. Clim. Chang. 2021, 11, 226–233. [Google Scholar]
  84. Miguel, B.; Manuel, D.; Santiago, S.; Rocío, H.; Zhao, Y.C.; Gaitán, J.J.; Nicolas, G.; Hugo, S.; Vincent, M.; Anika, L.; et al. Global ecosystem thresholds driven by aridity. Science 2020, 367, 787–790. [Google Scholar]
  85. Saleska, S.R.; Wu, J.; Kaiyu, G.; Araujo, A.C.; Huete, A.; Nobre, A.D.; Restrepo-Coupe, N. Dry-season greening of Amazon forests. Nature 2016, 531, E4–E5. [Google Scholar] [CrossRef] [PubMed]
  86. RonnieJ, A.C.; María, B.; Jerónimo, P. Benchmarking of drought and climate indices for agricultural drought monitoring in Argentina. Sci. Total Environ. 2021, 790, 148090. [Google Scholar]
  87. Sutanto, S.J.; Lanen, H.A.J.V.; Wetterhall, F.; Llort, X. Potential of Pan-European seasonal hydrometeorological drought forecasts obtained from a multihazard early warning system. Bull. Am. Meteorol. Soc. 2020, 101, E368–E393. [Google Scholar] [CrossRef]
Figure 1. Main environmental characteristics of the TP: (a) geographical location, topography and river system of the study area, (b) spatiotemporal variation characteristics of precipitation in the study area from 1985 to 2015, (c) spatiotemporal variation characteristics of mean temperature in the study area from 1985 to 2015. River name abbreviations: LR-Lancang; NR-Nujiang; YR-Yellow; YTR-Yangtze; YZR-Yarlung Zangbo.
Remotesensing 14 05084 g001
Figure 2. Schematic diagram of drought characteristics recognition process.
Remotesensing 14 05084 g002
Figure 3. Flowchart including the main steps of input dataset, computation, method, and output result. The climate models are defined as follows: HadGEM2-ES-Hadley Centre global environment model version 2-Earth system configuration, IPSL-CM5A-LR-Institut Pierre-Simon Laplace to study natural climate variability and climate response to natural and anthropogenic forcings as part of the 5th phase of the coupled model intercomparison project, MIROC5-model of interdisciplinary research on climate version 5, and NorESM1-M-Norwegian Earth system model.
Remotesensing 14 05084 g003
Figure 4. Taylor diagrams of different parameterization schemes under the RCP2.6 climate scenario: (a) precipitation and (b) mean temperature from 2007 to 2015.
Remotesensing 14 05084 g004
Figure 5. Temporal variation of SPEI-12 in the TP from 2016 to 2099 under the (a) RCP2.6, (b) RCP4.5, (c) RCP6.0, and (d) RCP8.5 climate scenarios.
Remotesensing 14 05084 g005
Figure 6. Temporal variation of the SPEI-1 on the TP from 2016 to 2099 under four climate scenarios: (a) RCP2.6, (b) RCP4.5, (c) RCP6.0, and (d) RCP8.5.
Remotesensing 14 05084 g006
Figure 7. Spatial distribution of SPEI-12 trends on the TP from 2016 to 2099 under four climate scenarios: (a) RCP2.6, (b) RCP4.5, (c) RCP6.0, and (d) RCP8.5.
Remotesensing 14 05084 g007
Figure 8. SPEI-12 changes on the TP from 2016 to 2099 under four climate scenarios: (a) RCP2.6, (b) RCP4.5, (c) RCP6.0, and (d) RCP8.5. IW-insignificant wetting, SW-significant wetting, EW-extremely significant wetting, ID-insignificant drought, SD-significant drought, ED-extremely significant drought.
Remotesensing 14 05084 g008
Figure 9. Spatial distributions of the frequency of droughts of various grades on the TP from 2016 to 2099 under four climatic scenarios: Frequency of light drought under the (a) RCP2.6, (b) RCP4.5, (c) RCP6.0, and (d) RCP8.5 climatic scenarios; frequency of moderate drought under (e) RCP2.6, (f) RCP4.5, (g) RCP6.0, and (h) RCP8.5; frequency of severe drought under (i) RCP2.6, (j) RCP4.5, (k) RCP6.0, and (l) RCP8.5; and frequency of extreme drought under (m) RCP2.6, (n) RCP4.5, (o) RCP6.0, and (p) RCP8.5.
Remotesensing 14 05084 g009
Figure 10. Predicted drought frequencies for various categories at each grid point on the TP from 2016 to 2099 under four climatic scenarios.
Remotesensing 14 05084 g010
Figure 11. Spatial distribution characteristics of sub-mean drought intensity on the TP from 2016 to 2099 under the (a) RCP2.6, (b) RCP4.5, (c) RCP6.0, and (d) RCP8.5 climate scenarios.
Remotesensing 14 05084 g011
Figure 12. Relationship between drought duration and migration probability distribution on the TP under the (a) RCP2.6, (b) RCP4.5, (c) RCP6.0, and (d) RCP8.5 climate scenarios.
Remotesensing 14 05084 g012
Figure 13. Distribution maps of the drought cycle of the TP for drought durations of 1–5 months under four climatic scenarios: drought duration of 1 month under the (a) RCP2.6, (b) RCP4.5, (c) RCP6.0, and (d) RCP8.5 climate scenarios; drought duration of 2 months under (e) RCP2.6, (f) RCP4.5, (g) RCP6.0, and (h) RCP8.5; drought duration of 3 months under (i) RCP2.6, (j) RCP4.5, (k) RCP6.0, and (l) RCP8.5; drought duration of 4 months under (m) RCP2.6, (n) RCP4.5, (o) RCP6.0, and (p) RCP8.5; drought duration of 5 months under (q) RCP2.6, (r) RCP4.5, (s) RCP6.0, and (t) RCP8.5.
Remotesensing 14 05084 g013
Figure 14. Correlations of three drought indices under different climate scenarios: PA index and SPEI index correlation under the (a) RCP2.6, (b) RCP4.5, (c) RCP6.0, and (d) RCP8.5 climate scenarios; SPI index and SPEI index correlation under (e) RCP2.6, (f) RCP4.5, (g) RCP6.0, and (h) RCP8.5.
Remotesensing 14 05084 g014
Table 1. Categorization according to the SPEI values.
SPEI ValueCategorySPEI ValueCategorySPEI ValueCategory
<−2Extreme drought−1 to −0.5Light drought1 to 1.5Moderately wet
−2 to −1.5Severe drought−0.5 to 0.5Normal1.5 to 2Severely wet
−1.5 to −1Moderate drought0.5 to 1Lightly wet>2Extremely wet
Table 2. Index Classification.
Data TypeSlope|Z|DescriptionClassSlope|Z|DescriptionClass
SPEI>0[2.58, +∞)Extremely significant humidificationEW<0[2.58, +∞)Extremely significant aridificationED
[1.64, 2.58)Significant humidificationSW[1.64, 2.58)Significant aridificationSD
[0, 1.64)Insignificant humidificationIW[0, 1.64)Insignificant aridificationID
Publisher’s Note: MDPI stays neutral with regard to jurisdictional claims in published maps and institutional affiliations.

