
The Orientation of the Kofun Tombs


Abstract
:1. Introduction
2. A Brief Description of the Kofun Phenomenon
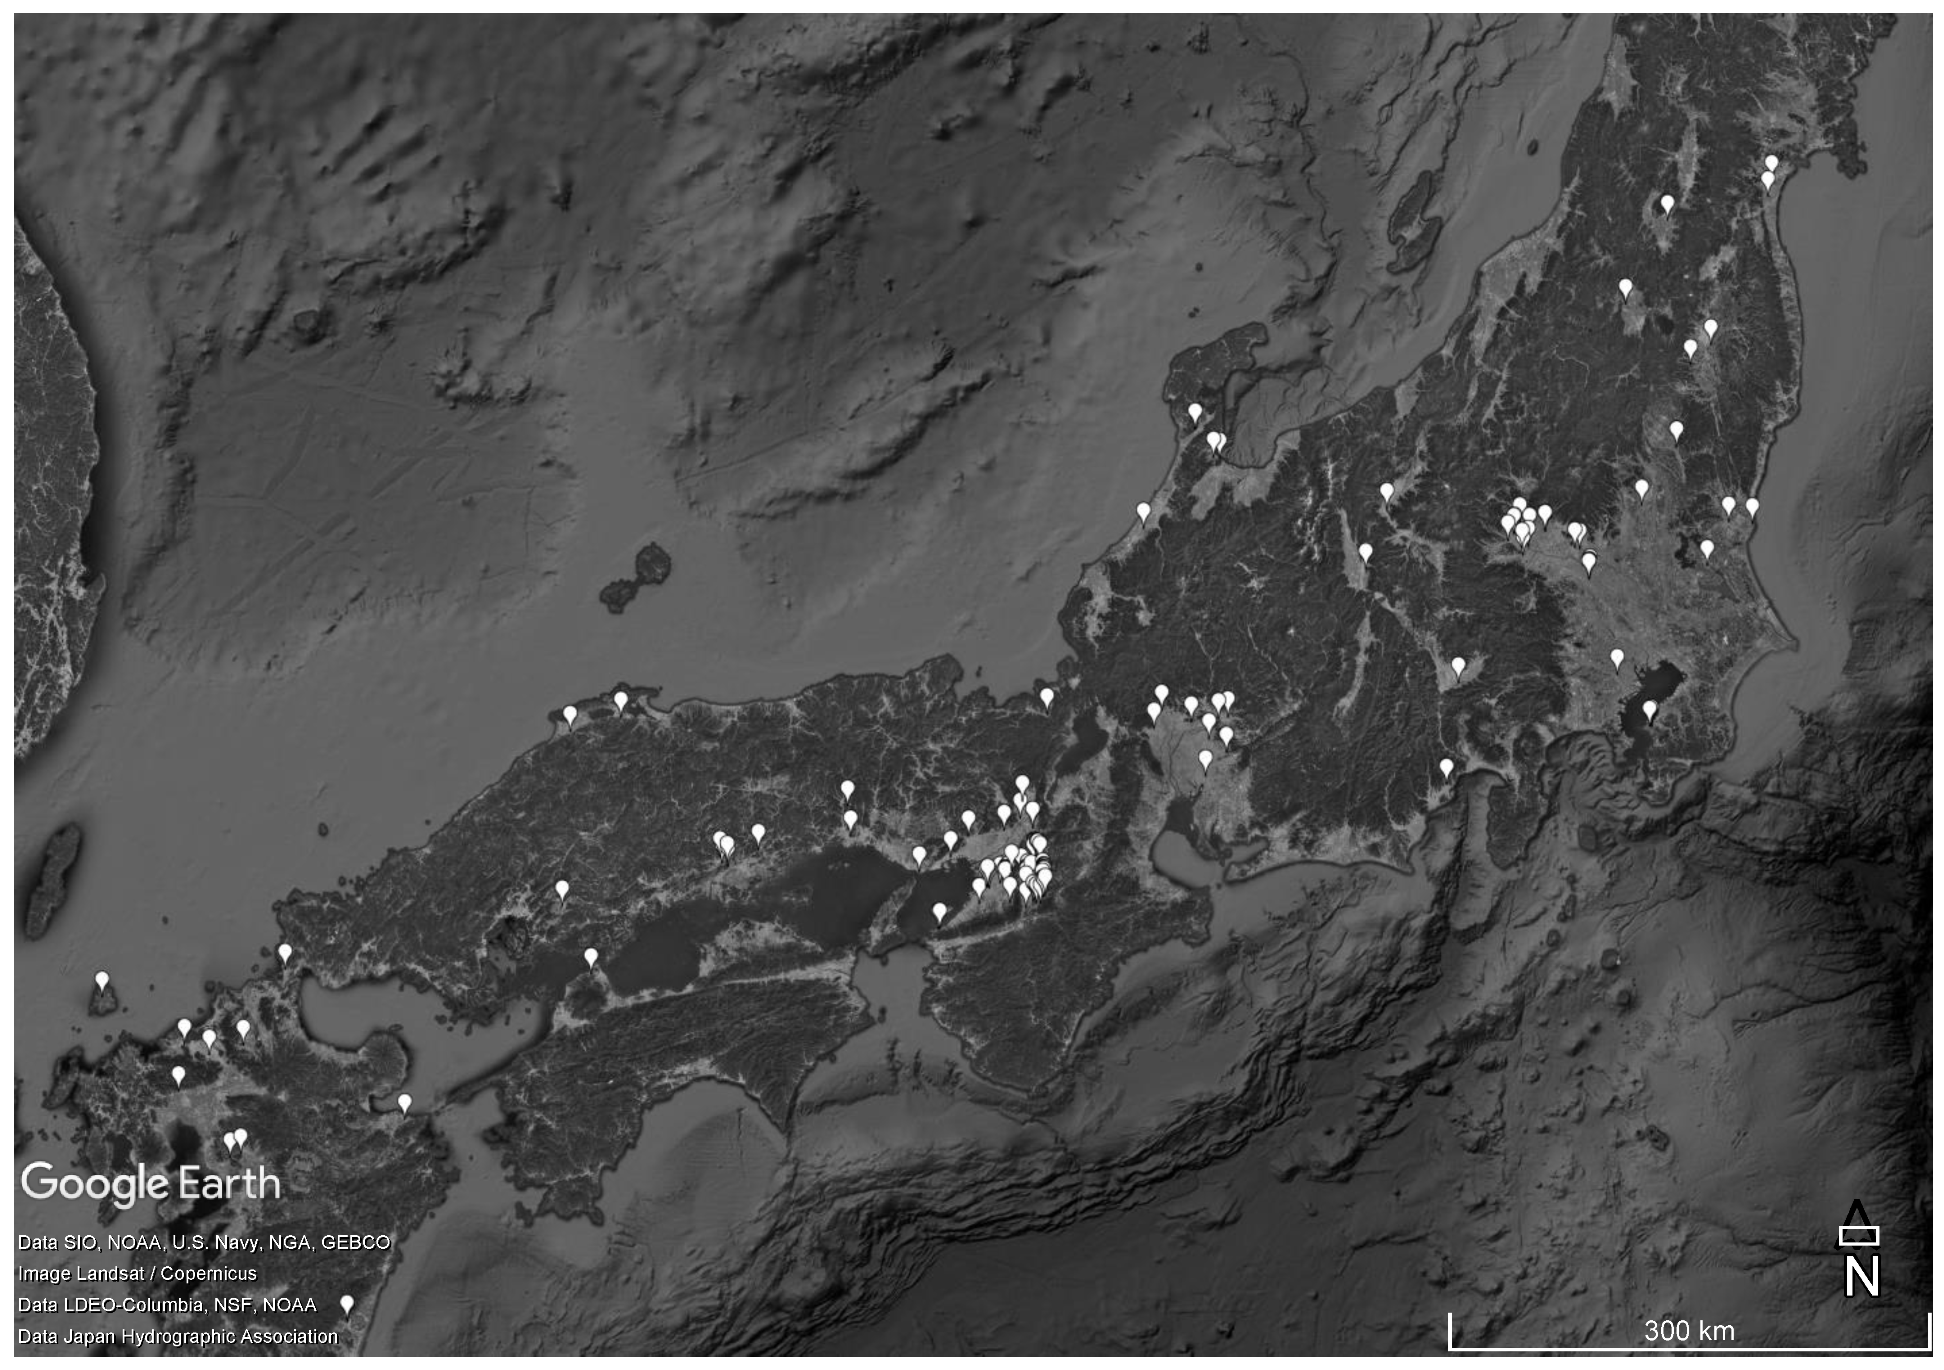
3. Materials and Methods
4. Results
4.1. The Orientation of the Kofun Access Corridors
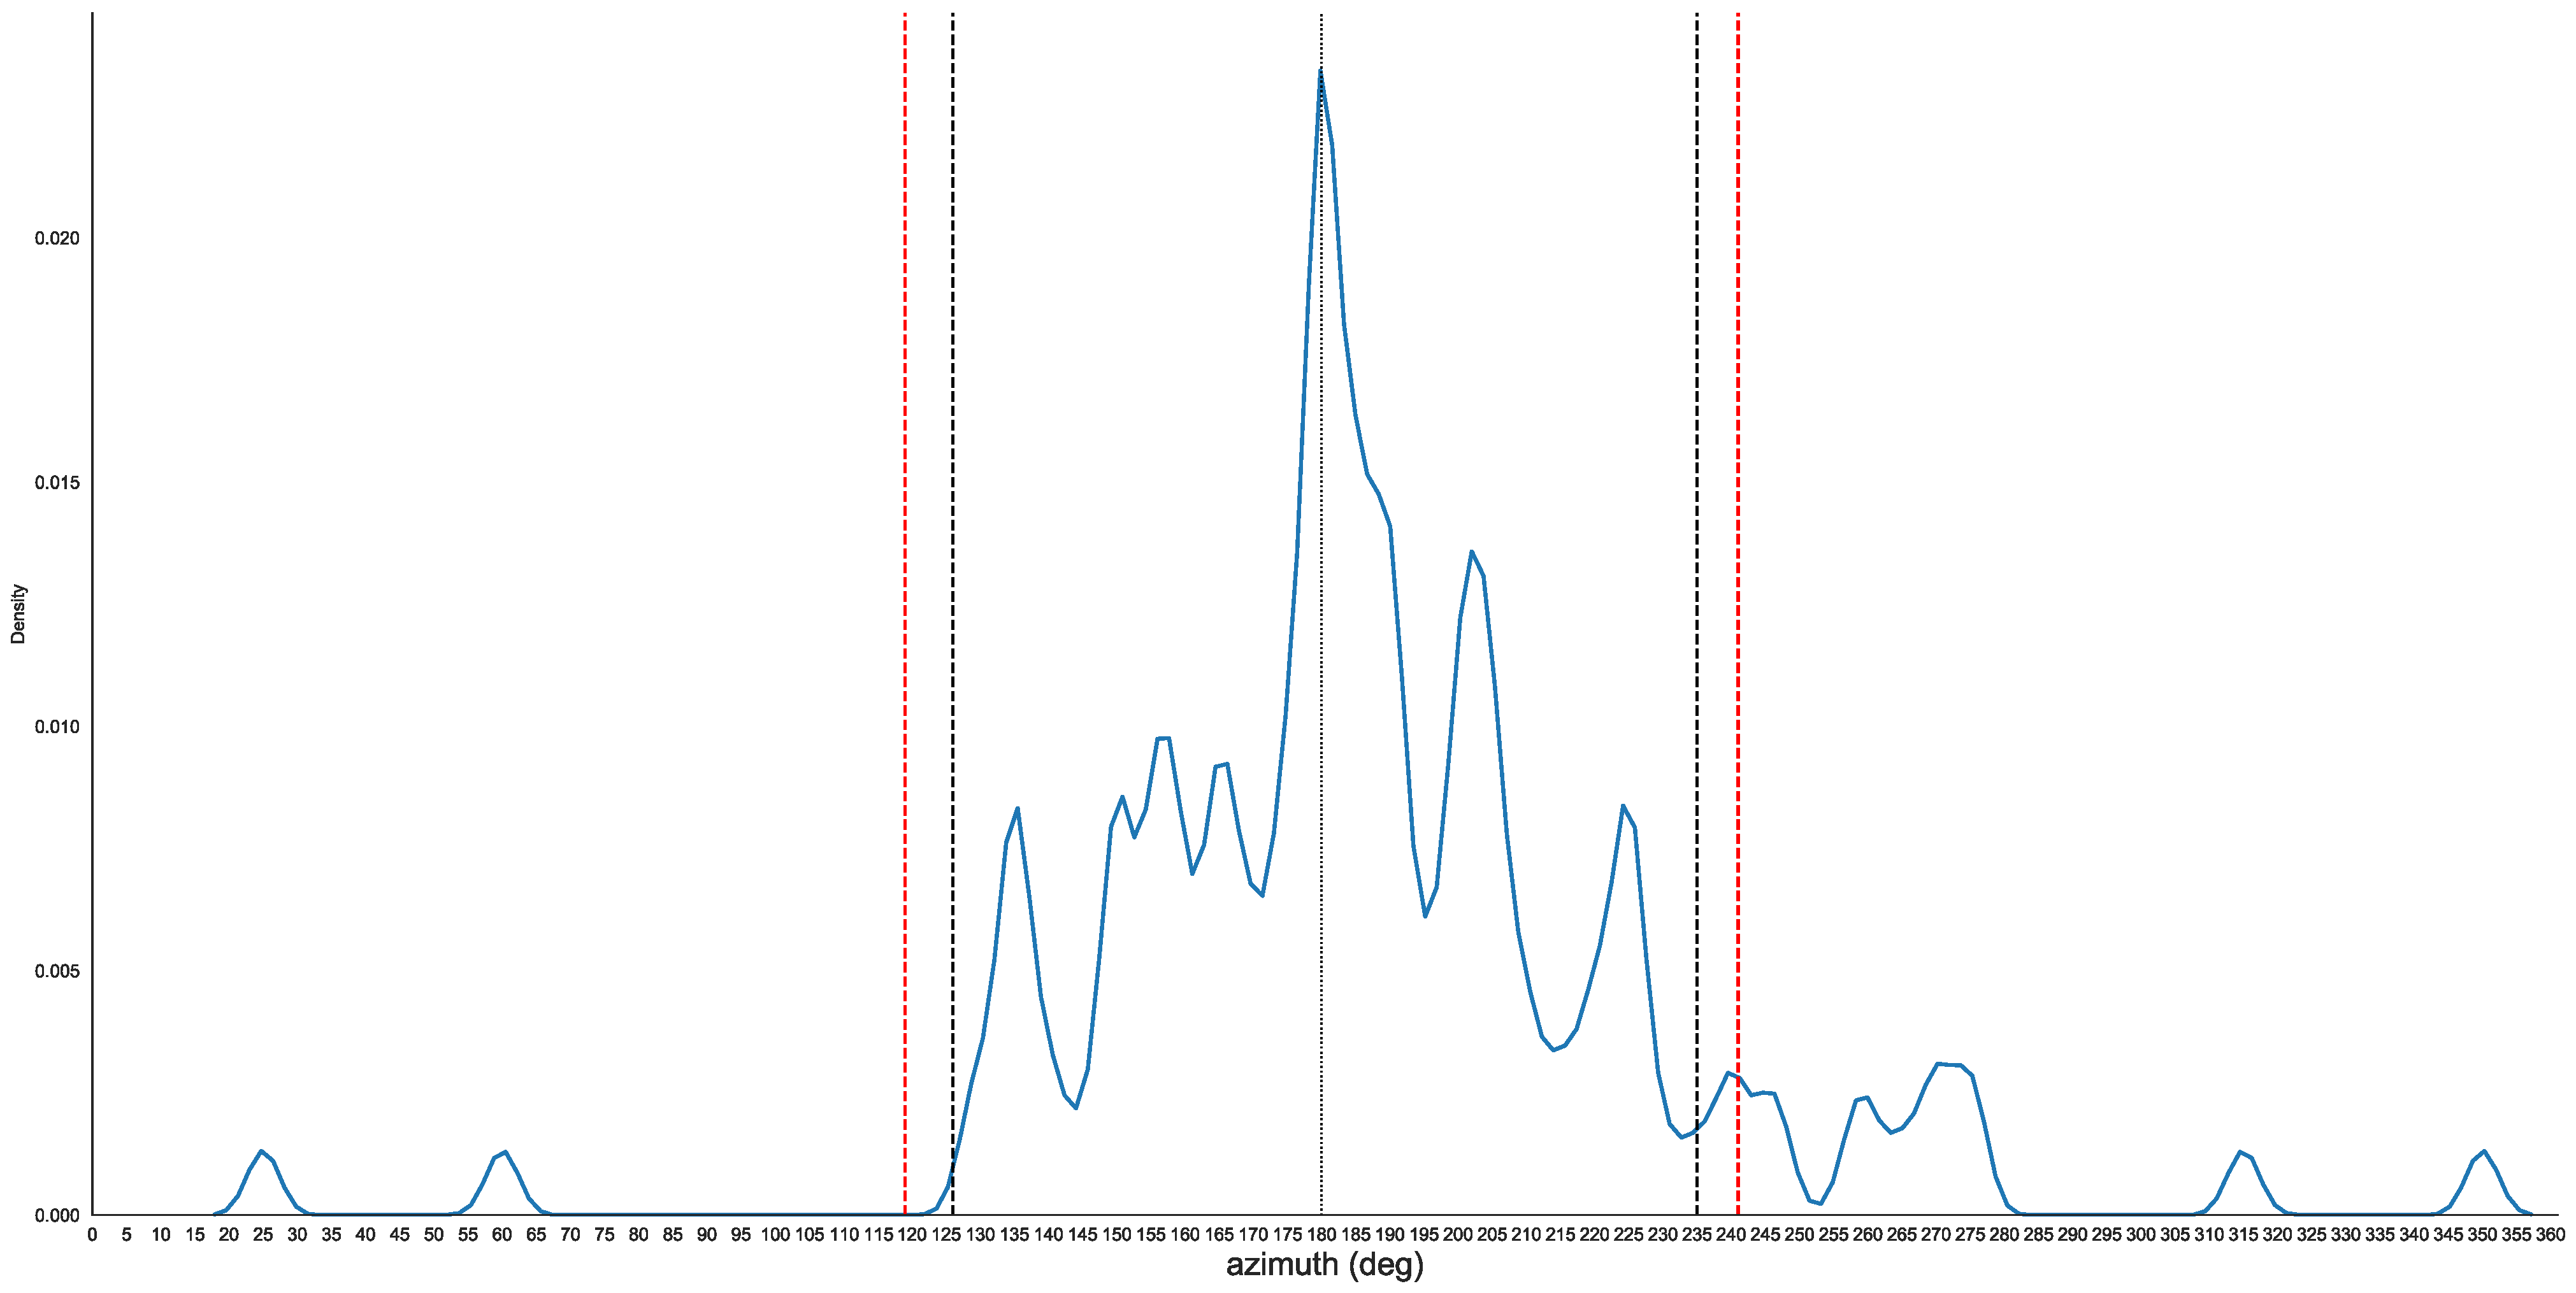
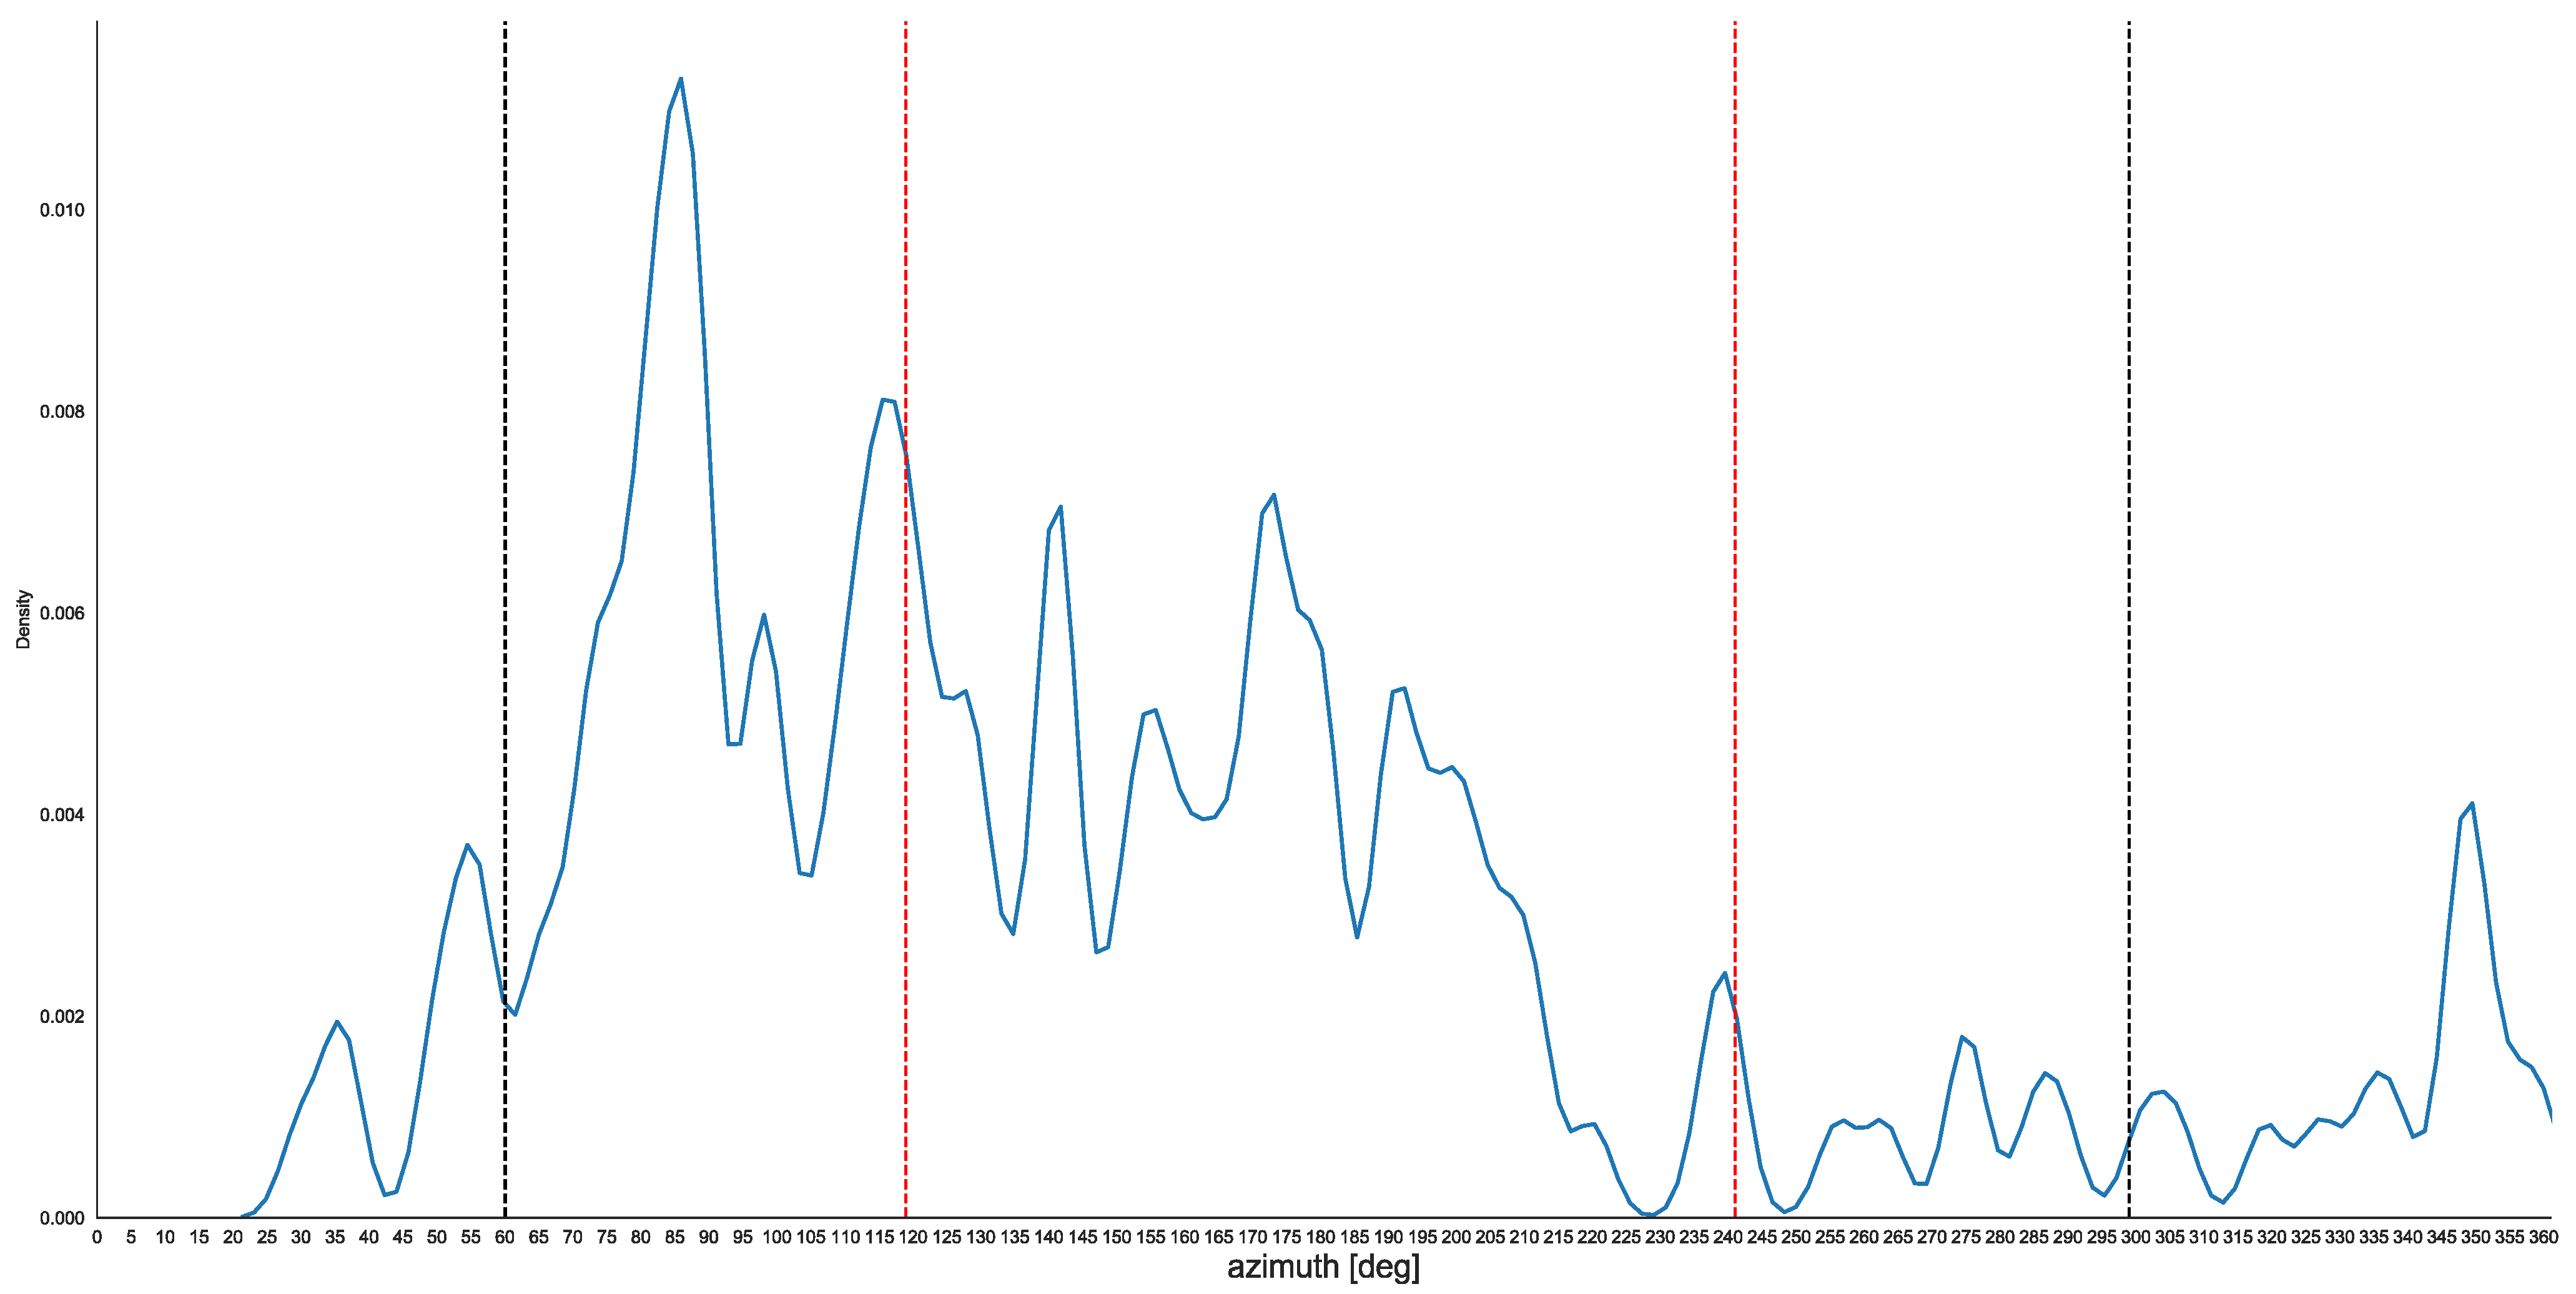
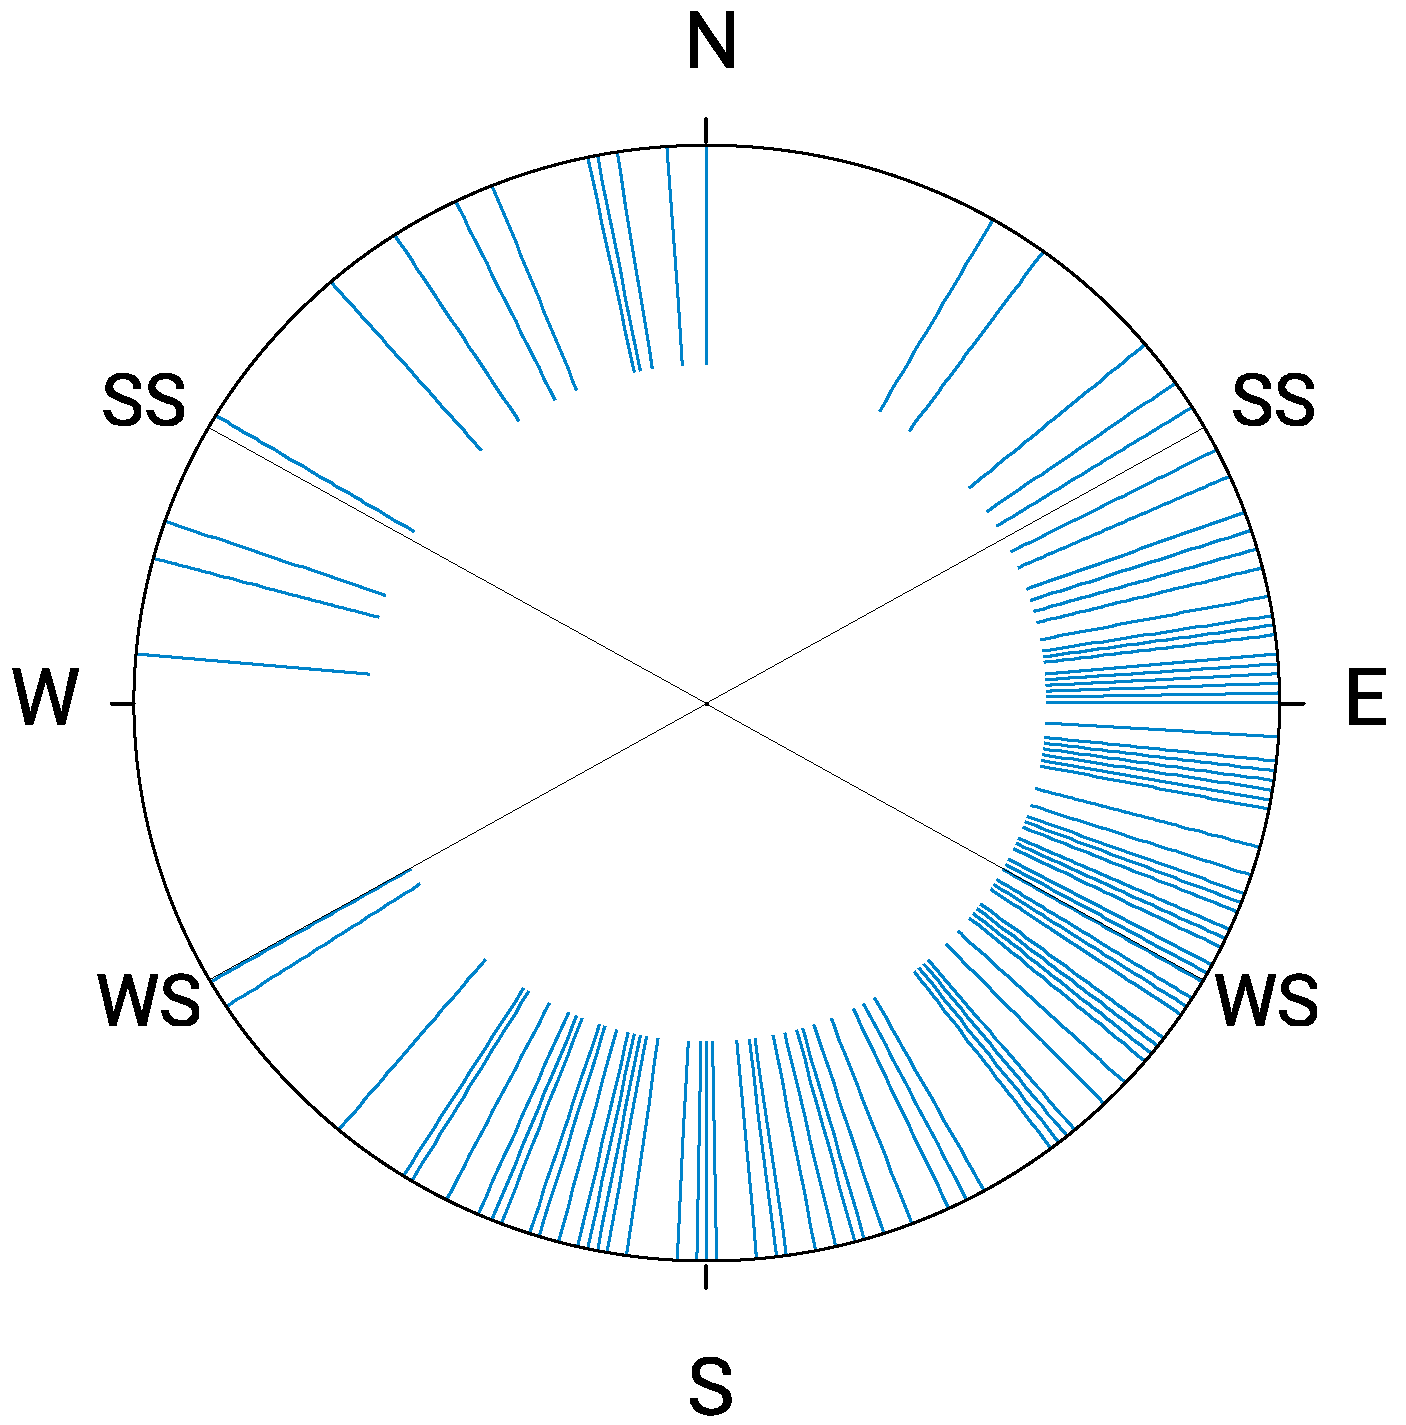
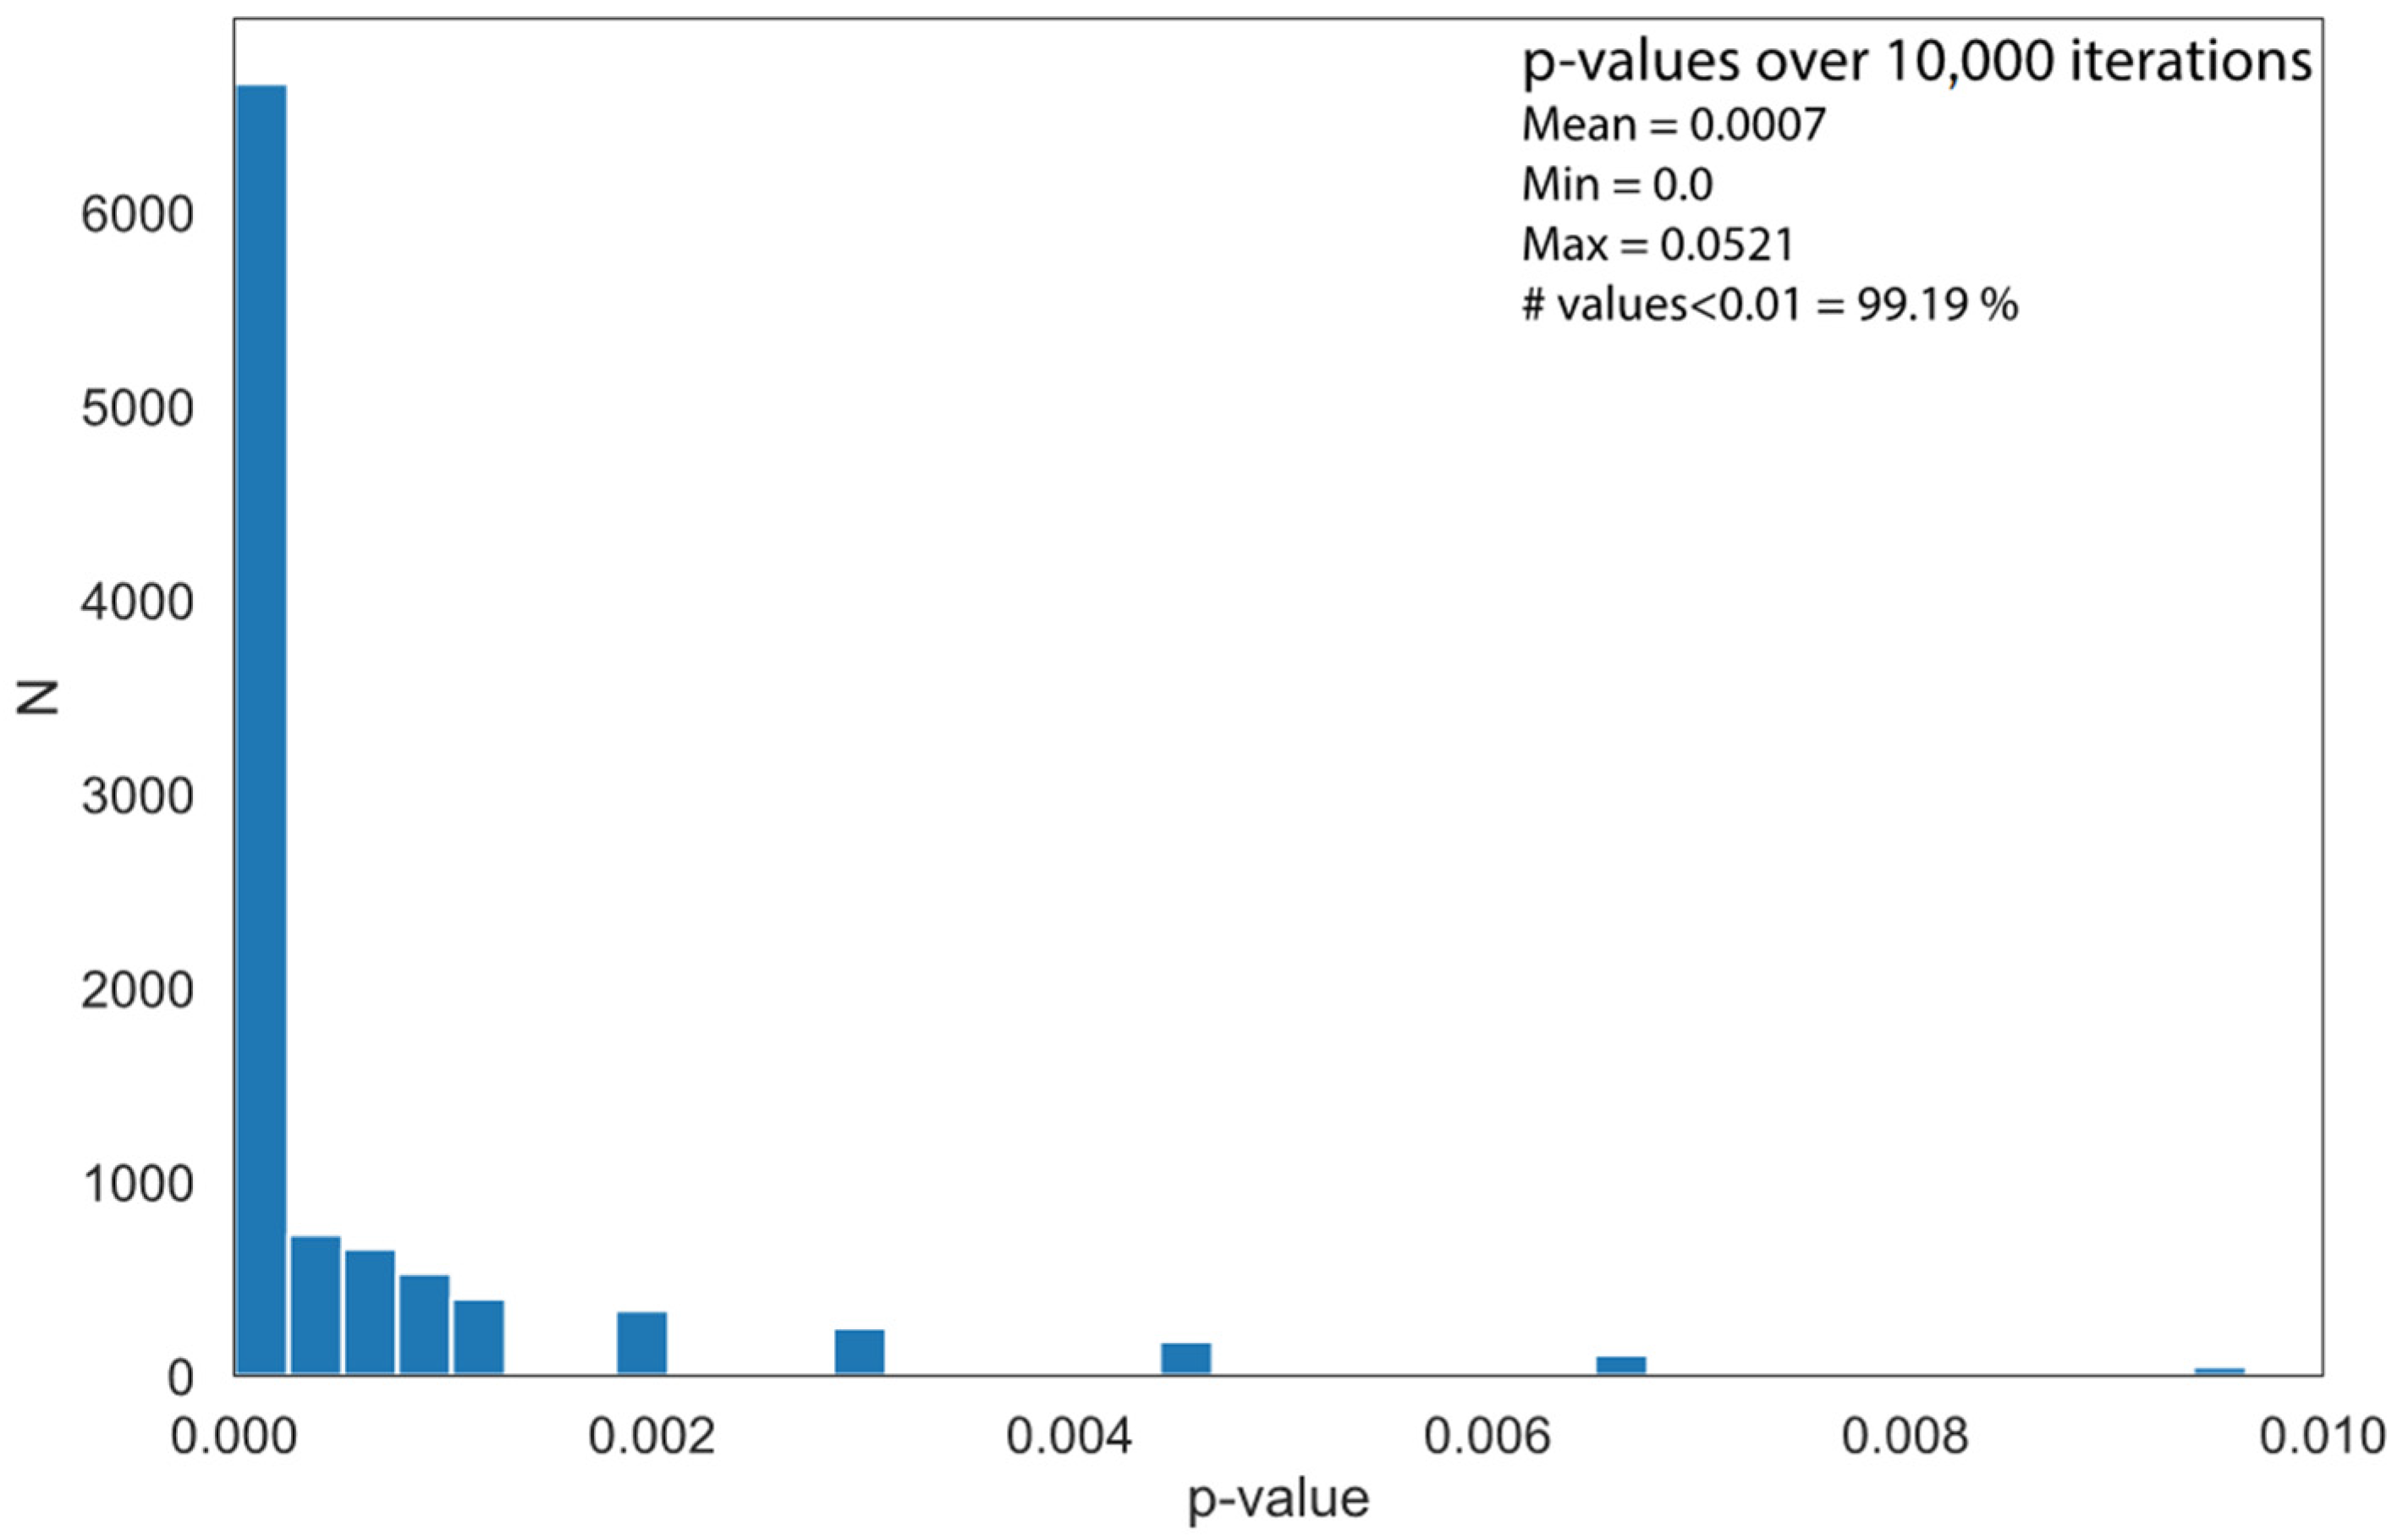
4.2. The Orientation of the Keyhole Kofun
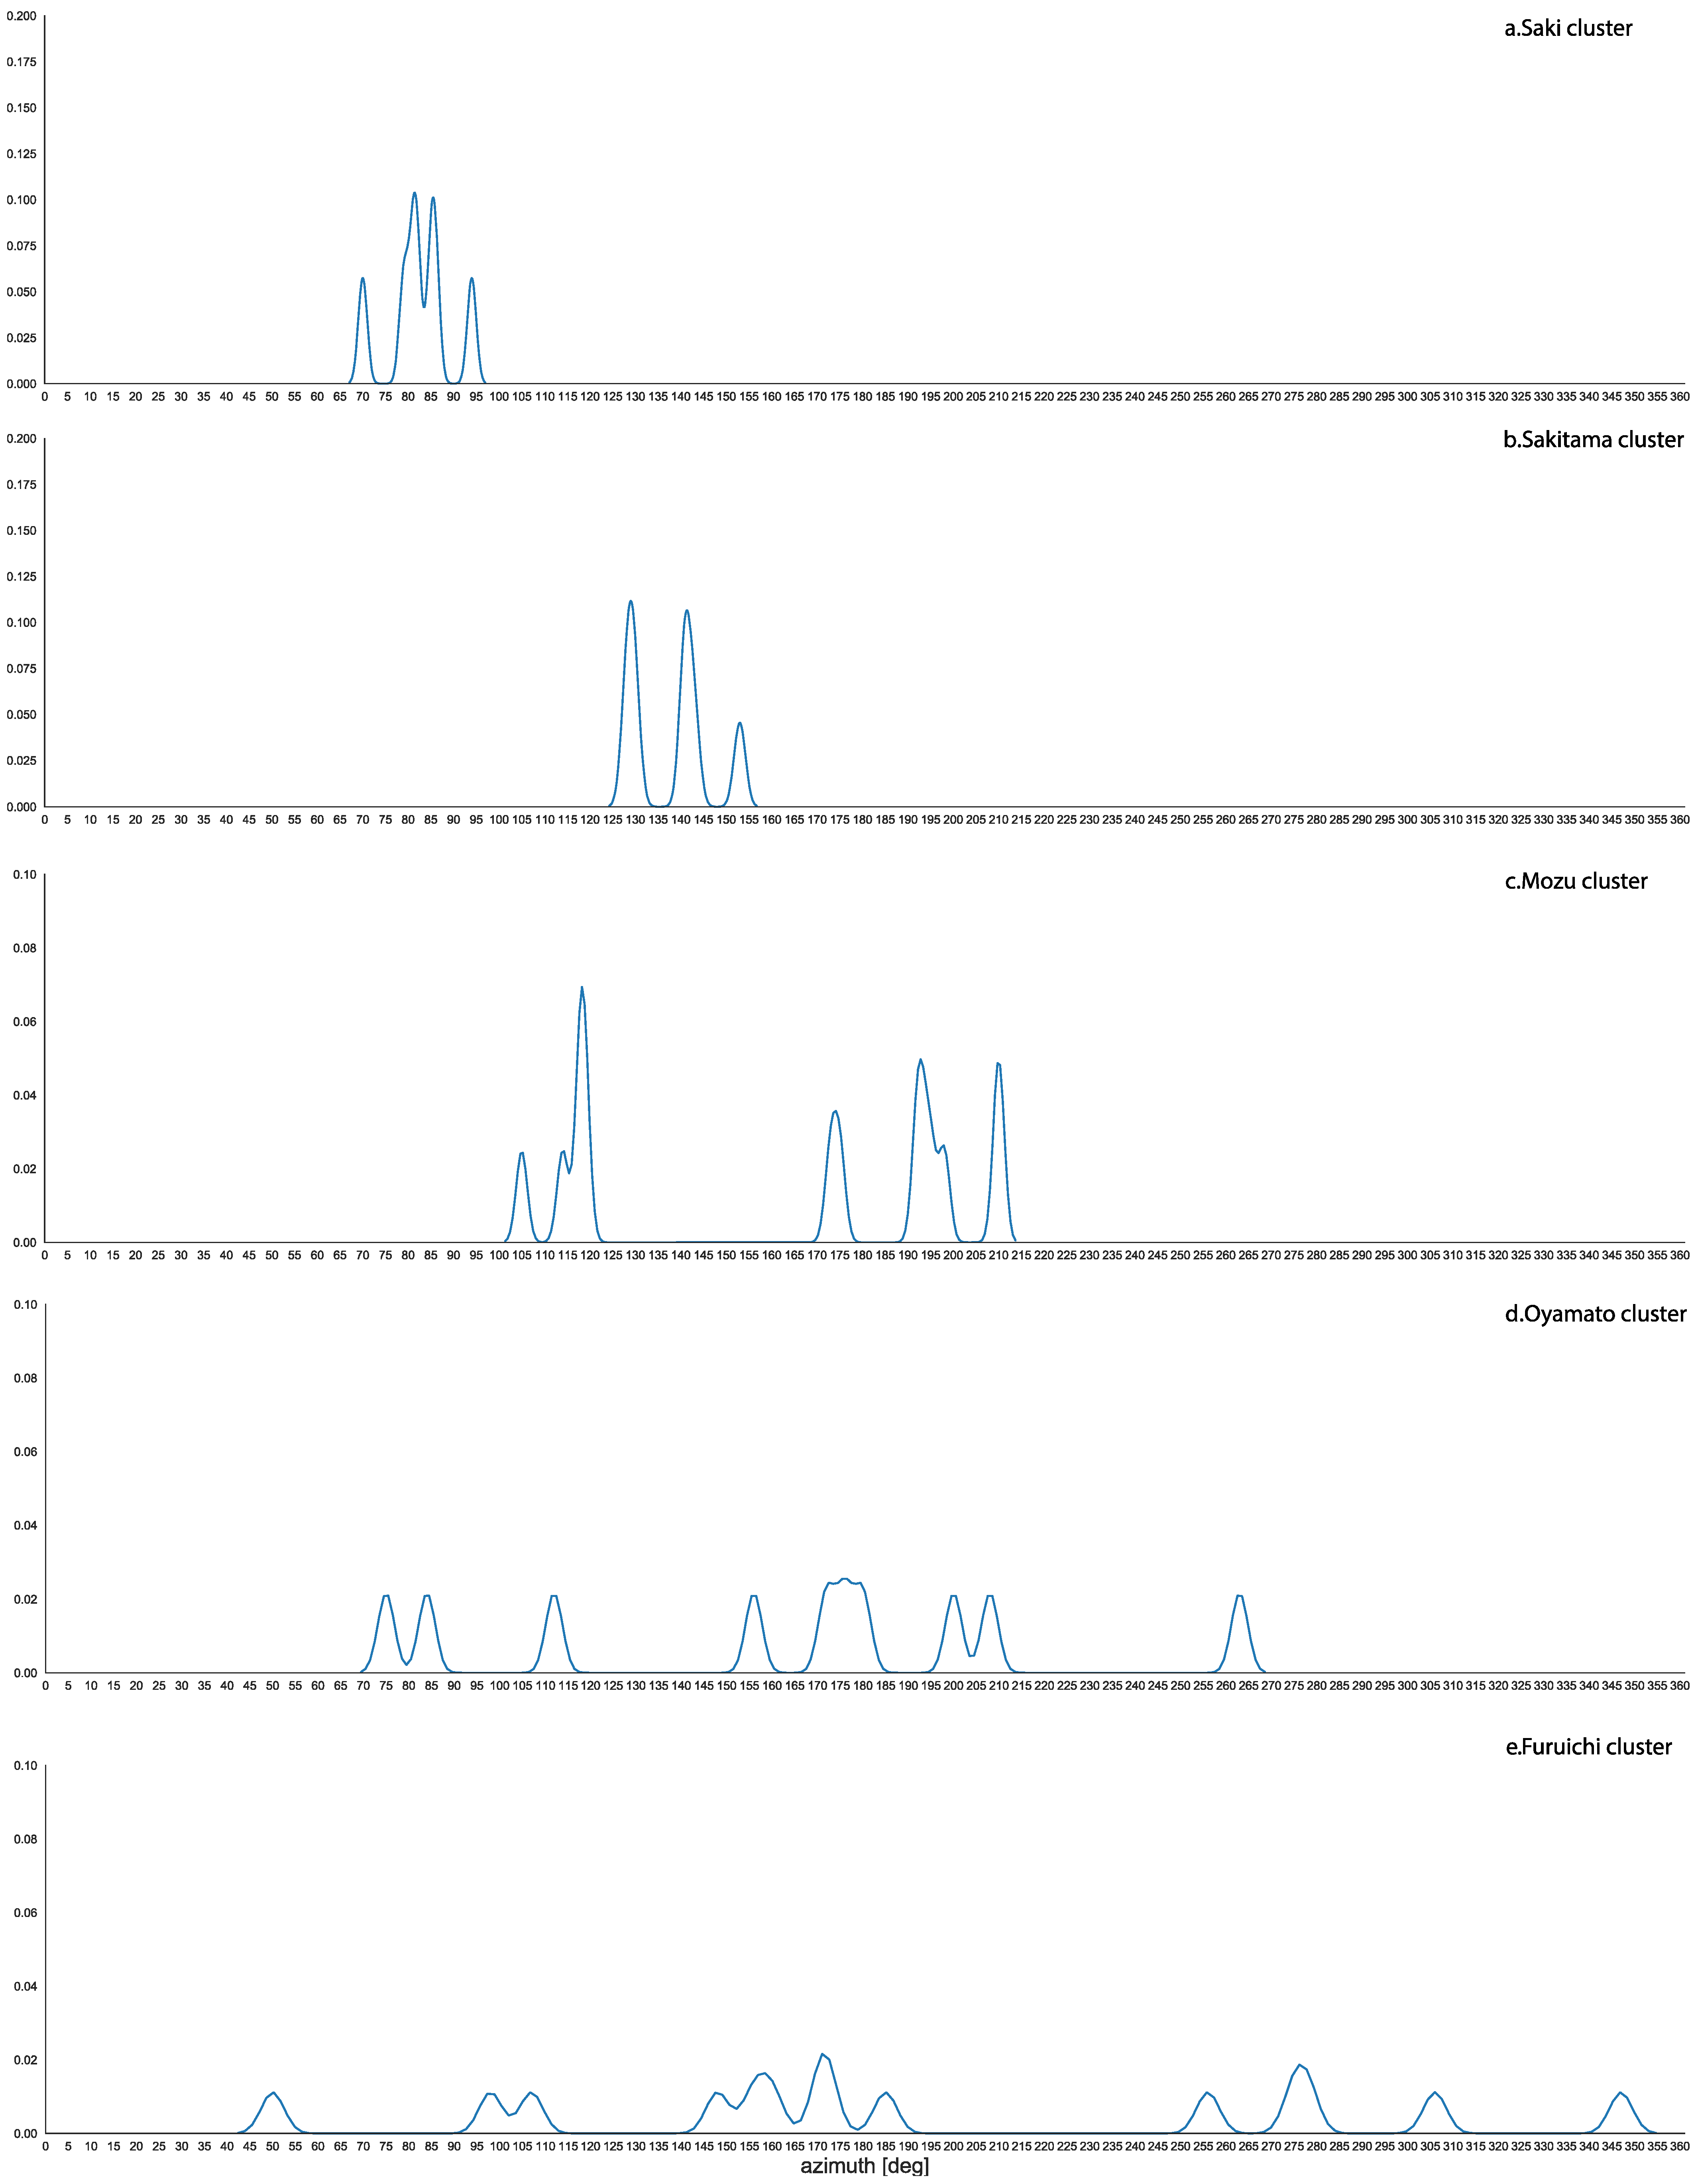
4.3. The Clusters
- In the Saki and Sakitama clusters, the orientation of the principal tomb directly governed the orientation of the others (Figure 10a,b).
- In the Mozu cluster, the orientation of the principal tomb (the Daisen Kofun, oriented to summer solstice sunset) governed that of the others in the sense that a part is orientated in the same way and another part are orientated (almost) orthogonally (azimuths greater of about 90°) (Figure 10c).
- No pattern is discernible in the orientations of the Oyamato and Furuichi clusters; although, at least in the first case, topographical reasons connected to the mountain range of Mount Miwa may have played a role (Figure 10d,e).
5. Discussion
6. Conclusions
Author Contributions
Funding
Institutional Review Board Statement
Data Availability Statement
Conflicts of Interest
Appendix A

| n° | Prefecture | Nameor (Cluster) | Lat (N) | Long (E) | Baseline Orientation (°) | Baseline Length (m) | Symmetry Axis Length (m) | Hill Plain Slopes | Principal Prob Principal Satellite |
|---|---|---|---|---|---|---|---|---|---|
| 1 | Aichi | Aotsuka | 35°19′36″ | 136°55′45″ | 123 | 66 | 117 | P/S | P |
| 2 | Danpusan | 35°07′51″ | 136°54′12″ | 55 | 119 | 144 | P | ||
| 3 | Shidami | 35°15′11″ | 137°02′29″ | 128 | 15 | 46 | S | PP | |
| 4 | Chiba | (Dairizuka) | 35°19′11″ | 139°51′30″ | 87 | 65 | 105 | P | PP |
| 5 | (Dairizuka) | 35°19′01″ | 139°51′30″ | 72 | 48 | 77 | P | PP | |
| 6 | (Dairizuka) | 35°19′11″ | 139°50′47″ | 127 | 77 | 106 | P | PP | |
| 7 | Dairizuka (Dairizuka) | 35°19′34″ | 139°51′26″ | 118 | 74 | 133 | P | PP | |
| 8 | Sanjozuka (Dairizuka) | 35°19′18″ | 139°51′43″ | 114 | 122 | P | PP | ||
| 9 | Ehime | Myokenyama | 34°03′31″ | 132°55′51″ | 349 | 30 | 58 | H | P |
| 10 | Fukui | Jonozuka | 35°28′04″ | 135°52′29″ | 82 | 40 | 85 | S | PP |
| 11 | Fukuoka | Hiwazuka | 33°31′24″ | 130°26′19″ | 179 | 12 | 34 | P | P |
| 12 | Otsuka | 33°34′24″ | 130°16′14″ | 66 | 40 | 55 | S | P | |
| 13 | Ozuka | 33°35′20″ | 130°39′50″ | 112 | 58 | 86 | P/S | P | |
| 14 | Fukushima | Kamegamori | 37°35′35″ | 139°49′45″ | 190 | 50 | 117 | P | P |
| 15 | Kamegamori Chinjumori | 37°35′32″ | 139°49′40″ | 190 | 26 | 56 | P | PP | |
| 16 | Oyasuba | 37°21′21″ | 140°24′14″ | 285 | 30 | 70 | P | P | |
| 17 | Ryugatsuka | 37°15′06″ | 140°15′ 13″ | 197 | 15 | 33 | P | P | |
| 18 | Gifu | 35°28′57″ | 136°37′19″ | 83 | 39 | 74 | S | P | |
| 19 | 35°28′57″ | 136°37′19″ | 122 | 24 | 67 | S | PP | ||
| 20 | 35°28′57″ | 136°37′19″ | 155 | 24 | 74 | S | PP | ||
| 21 | Hirui Otsuka | 35°23′15″ | 136°34′17″ | 141 | 64 | 140 | S | P | |
| 22 | Kotozuka | 35°25′06″ | 136°48′53″ | 108 | 84 | 124 | S | P | |
| 23 | Gunma | 36°17′56″ | 139°02′02″ | 55 | 78 | 168 | P | PP | |
| 24 | Futako Ideyama (Hodota) | 36°22′43″ | 138°59′02″ | 151 | 60 | 97 | P | ||
| 25 | Hachimantsuka (Hodota) | 36°22′52″ | 138°59′09″ | 74 | 61 | 101 | P | ||
| 26 | Hachiman Kannonzuka | 36°20′30″ | 138°56′28″ | 202 | 75 | P | |||
| 27 | Maebashi Hachimanyama | 36°22′35″ | 139°05′20″ | 212 | 48 | 75 | P | P | |
| 28 | 36°23′11″ | 139°11′47″ | 162 | 30 | 72 | P | |||
| 29 | Nanakoshiyama | 36°15′42″ | 139°02′24″ | 191 | 92 | 140 | P | P | |
| 30 | Sho-Futago | 36°23′22″ | 139°11′38″ | 203.5 | 33 | P | |||
| 31 | 36°23′28″ | 139°11′41″ | 211 | P | |||||
| 32 | Tenjinyama | 36°17′32″ | 139°23′29″ | 133 | 127 | 196 | P | PP | |
| 33 | Tsukamaki | 36°17′07″ | 139°25′26″ | 172 | 5 | 19 | P | ||
| 34 | Ushirofutago | 36°23′15″ | 139°11′44″ | 169 | 128 | P | |||
| 35 | Watanuki Kannonyama | 36°18′26″ | 139°04′39″ | 240 | 97 | P | |||
| 36 | Hiroshima | Mitsujo | 34°25′02″ | 132°44′00″ | 327 | 48 | 83 | P | |
| 37 | Hyogo | Goshikizuka | 34°37′48″ | 135°02′46″ | 116 | 52 | 176 | P | |
| 38 | Yoro Hisagotsuka | 34°49′03″ | 134°36′ | 110 | 40 | 103 | P | ||
| 39 | Otomezuka | 34°42′41″ | 135°14′51″ | 89 | 14 | 55 | P | PP | |
| 40 | Ibaraki | Chokushizuka | 36°22′53″ | 140°36′57″ | 140 | 32 | 74 | P | PP |
| 41 | Funatsukayama | 36°10′04″ | 140°17′24″ | 167 | 87 | 180 | P | P | |
| 42 | Sarashii | 36°23′48″ | 140°27′06″ | 55 | 130 | P | PP | ||
| 43 | Ishikawa | Akitsuneyama | 36°26′59″ | 136°31′09″ | 115 | 30 | 100 | P | PP |
| 44 | Ame-no Miya A | 36°58′33″ | 136°52′18″ | 349 | 29 | 59 | H | PP | |
| 45 | Ame-no Miya B | 36°58′36″ | 136°52′22″ | 142 | 25 | 65 | H | PP | |
| 46 | Iwate | Tsunokuza | 39°08′29″ | 141°05′38″ | 85 | 22 | 40 | P | PP |
| 47 | Kumamoto | Eta/Eda Funayama | 32°58′16″ | 130°35′58″ | 142 | 38 | 63 | S/P | P |
| 48 | Iwabaru Futagozuka (Iwabaru) | 32°59′46″ | 130°40′10″ | 220 | 47 | 100 | S | P | |
| 49 | Kokuku Kurazuka | 32°58′13″ | 130°35′54″ | 173 | 56 | S/P | PP | ||
| 50 | Yokoyama (Iwabaru) | 32°59′42″ | 130°40′16″ | 250 | 16 | 36 | S | S | |
| 51 | Kyoto | Amatsuka | 35°00′26″ | 135°42′44″ | 63 | 40 | 66 | P | P |
| 52 | Igenoyama | 34°54′52″ | 135°41′52″ | 58 | 80 | 128 | P | P | |
| 53 | Kutsukawa A (Kutsukawa) | 34°52′04″ | 135°46′41″ | 96 | 50 | 100 | P | P | |
| 54 | Kutsukawa B (Kutsukawa) | 34°51′55″ | 135°46′45″ | 99 | 143 | P | P | ||
| 55 | Miyazaki | Saitobaru #1 | 32°06′39″ | 131°23′40″ | 183 | 12 | 45 | PP | |
| 56 | Saitobaru #13 | 32°06′42″ | 131°23′41″ | 98 | 27 | 81 | P | ||
| 57 | Saitobaru #202 | 32°06′49″ | 131°23′30″ | 76 | 38 | 55 | PP | ||
| 58 | Saitobaru #46 | 32°06′47″ | 131°23′38″ | 360 | 38 | 89 | PP | ||
| 59 | Saitobaru A | 32°06′46″ | 131°23′42″ | 111 | 18 | 65 | PP | ||
| 60 | Saitobaru B | 32°06′49″ | 131°23′42″ | 188 | 9 | 31 | PP | ||
| 61 | Saitobaru C | 32°06′54″ | 131°23′41″ | 79 | 27 | 76 | PP | ||
| 62 | Miyagi | Raijinyama | 38°09′04″ | 140°52′47″ | 120 | 90 | 162 | P | |
| 63 | Tomizuka | 38°14′17″ | 140°54′53″ | 89 | 61 | 119 | P | PP | |
| 64 | Nagano | Koboyama | 36°12′45″ | 137°59′02″ | 36 | 63 | S | PP | |
| 65 | Mori Shogunzuka | 36°31′53″ | 138°08′14″ | 140 | 28 | 94 | H | P | |
| 66 | Nagasaki | Soroku | 33°47′55″ | 129°42′14″ | 207 | 26 | H | P | |
| 67 | Nara | Maruyama (G121) | 34°28′33″ | 135°47′54″ | 180 | 260 | P | P | |
| 68 | Nenbutsuji yama | 34°41′00″ | 135°49′26″ | 72 | 64 | 104 | P | P | |
| 69 | Kawai Otsukayama (Umami) | 34°35′10″ | 135°44′35″ | 79 | 109 | 194 | P | P | |
| 70 | Masuyama Chongjin | 34°28′34″ | 135°46′45″ | 319 | 83 | 205 | S | PP | |
| 71 | Mesuriyama | 34°29′56″ | 135°50′52″ | 179 | 72 | 209 | S | P | |
| 72 | Muro Miyayama | 34°26′35″ | 135°44′02″ | 165 | 104 | 198 | S | P | |
| 73 | Nishiyama | 34°35′33″ | 135°50′36″ | 159 | 73 | 178 | S | P | |
| 74 | (Oyamato) | 34°34′12″ | 135°50′55″ | 263 | 40 | 105 | S | PP | |
| 75 | Sujinryo (Oyamato) | 34°33′26″ | 135°50′59″ | 208.5 | 103 | 242 | S | P | |
| 76 | (Oyamato) | 34°33′36″ | 135°50′36″ | 176 | 44 | 126 | S | PP | |
| 77 | Hashinakayama (Oyamato) | 34°32′22″ | 135°50′28″ | 156 | 109 | 262 | S | PP | |
| 78 | Hatagozuka (Oyamato) | 34°34′19″ | 135°50′53″ | 180 | 140 | S | P | ||
| 79 | Kushiyama (Oyamato) | 34°33′25″ | 135°51′08″ | 200 | 60 | 123 | S | P | |
| 80 | Nakayama Otsuka (Oyamato) | 34°33′58″ | 135°50′54″ | 112 | 58 | 130 | S | PP | |
| 81 | Nishi Tonozuka (Oyamato) | 34°34′07″ | 135°51′04″ | 84 | 107 | 200 | S | P | |
| 82 | Shibutani-Mukouyama (Oyamato) | 34°33′03″ | 135°50′58″ | 171.5 | 161 | 286 | S | P | |
| 83 | Shimoikeyama (Oyamato) | 34°34′08″ | 135°50′47″ | 75 | 120 | S | PP | ||
| 84 | Jingu Kogoroyo (Saki) | 34°42′23″ | 135°47′07″ | 79 | 172 | 273 | P | PP | |
| 85 | Iwanohime Kogoroyo (Saki) | 34°42′06″ | 135°48′10″ | 93.5 | 136 | 218 | P | P | |
| 86 | Seimuryo (Saki) | 34°42′01″ | 135°47′15″ | 85 | 111 | 207 | P | P | |
| 87 | Konabe (Saki) | 34°41′53″ | 135°48′17″ | 82 | 125 | 200 | P | P | |
| 88 | Hibasuhimeryo (Saki) | 34°41′59″ | 135°47′21″ | 81 | 89 | 209 | P | P | |
| 89 | Uwanabe (Saki) | 34°41′52″ | 135°48′33″ | 86 | 123 | 251 | P | P | |
| 90 | Senka Empire | 34°28′41″ | 135°46′48″ | 301 | 72 | 150 | S | PP | |
| 91 | Shima no yama (Umami) | 34°35′02″ | 135°45′57″ | 66 | 86 | 185 | P | PP | |
| 92 | Shiro yama (Umami) | 34°35′21″ | 135°44′45″ | 100 | 68 | 102 | P | PP | |
| 93 | Suininryo (Saki) | 34°40′49″ | 135°46′52″ | 70 | 116 | 229 | P | P | |
| 94 | Sakurai Chausuyama | 34°30′42″ | 135°51′25″ | 88 | 55 | 173 | S | PP | |
| 95 | Tsukiyama (Umami) | 34°31′23″ | 135°43′51″ | 348 | 108 | 212 | P | P | |
| 96 | Udo Tsuka | 34°37′04″ | 135°42′09″ | 275 | 30 | 60 | P | PP | |
| 97 | Nagareyama (Umami) | 34°33′37″ | 135°44′10″ | 87 | 62 | 103 | P | PP | |
| 98 | Nikiyama (Umami) | 34°33′02″ | 135°44′13″ | 351 | 110 | 193 | P | P | |
| 99 | Suyama (Umami) | 34°33′23″ | 135°44′27″ | 289 | 102 | 203 | P | P | |
| 100 | Oita | Kamezuka | 33°14′06″ | 131°44′23″ | 85 | 40 | 112 | H | P |
| 101 | Okayama | Ryoguzan | 34°44′24″ | 134°00′09″ | 50 | 117 | 188 | P | P |
| 102 | Sakuzan | 34°39′55″ | 133°46′11″ | 124 | 131 | 254 | P | P | |
| 103 | 34°41′52″ | 133°45′20″ | 356 | 21 | 28 | P | PP | ||
| 104 | 34°41′52″ | 133°45′20″ | 181 | 18 | 27 | P | PP | ||
| 105 | Zozan | 34°40′26″ | 133°48′14″ | 120 | 167 | 313 | P/S | P | |
| 106 | Osaka | Tsudo-shiroyama | 34°34′55″ | 135°35′37″ | 50.2 | 168 | 272 | P | P |
| 107 | Hazamiyama | 34°33′42″ | 135°36′07″ | 347 | 59 | 98 | P | PP | |
| 108 | Hakayama | 34°33′28″ | 135°36′17″ | 171 | 148 | 226 | P | PP | |
| 109 | Minegazuka | 34°33′08″ | 135°35′51″ | 159.5 | 42 | 89 | P | PP | |
| 110 | Hakuchoryo | 34°33′05″ | 135°36′16″ | 172.5 | 154 | 195 | P | PP | |
| 111 | Chuai-tenno-ryo | 34°33′57″ | 135°35′39″ | 107 | 174 | 240 | P | P | |
| 112 | Hachizuka | 34°34′05″ | 135°35′44″ | 185 | 46 | 58 | P | S | |
| 113 | Ingyo-tenno-ryo | 34°34′23″ | 135°37′00″ | 274.9 | 164 | 227 | P | P | |
| 114 | Nakatsuhime-no-mikoto-ryo | 34°34′13″ | 135°36′47″ | 148 | 192 | 296 | P | P | |
| 115 | Komuroyama | 34°34′05″ | 135°36′34″ | 306 | 94 | 153 | P | PP | |
| 116 | Otorizuka | 34°34′00″ | 135°36′32″ | 97.5 | 45 | 104 | P | PP | |
| 117 | Konda-maruyana Ojin tenno | 34°33′43″ | 135°36′35″ | 256 | 300 | 413 | P | P | |
| 118 | Higashiumazuka | 34°33′49″ | 135°36′41″ | 278 | 71 | 122 | P | S | |
| 119 | Imashirozuka | 34°51′00″ | 135°35′42″ | 201 | 157 | 180 | P/S | P | |
| 120 | Kawachi Otsukayana | 34°34′20″ | 135°34′05″ | 74 | 215 | 335 | P | P | |
| 121 | Mayuyama | 34°27′47″ | 135°25′57″ | 36 | 97 | 177 | P | P | |
| 122 | Richu-tenno-ryo | 34°33′17″ | 135°28′41″ | 118 | 239 | 376 | P | P | |
| 123 | Itasuke | 34°33′12″ | 135°29′09″ | 198 | 89 | 150 | P | PP | |
| 124 | Gobyoyama | 34°33′17″ | 135°29′28″ | 192 | 118 | 195 | P | PP | |
| 125 | Haji Nisanzai | 34°32′48″ | 135°29′58″ | 195 | 215 | 280 | P | P | |
| 126 | Nagayama | 34°34′06″ | 135°29′13″ | 114 | 59 | 92 | P | S | |
| 127 | Magodayuyama | 34°33′37″ | 135°29′06″ | 210 | 25 | 63 | P | S | |
| 128 | Tatsusayama | 34°33′40″ | 135°29′00″ | 210 | 32 | 63 | P | S | |
| 129 | Maruhoyama | 34°34′02″ | 135°29′08″ | 118 | 34 | 84 | P | S | |
| 130 | Nagatsuka | 34°33′28″ | 135°29′16″ | 193 | 64 | 95 | P | PP | |
| 131 | Hatazuka | 34°33′24″ | 135°28′58″ | 175 | 24 | 60 | P | PP | |
| 132 | Zenizuka | 34°33′19″ | 135°29′04″ | 173 | 42 | 72 | P | PP | |
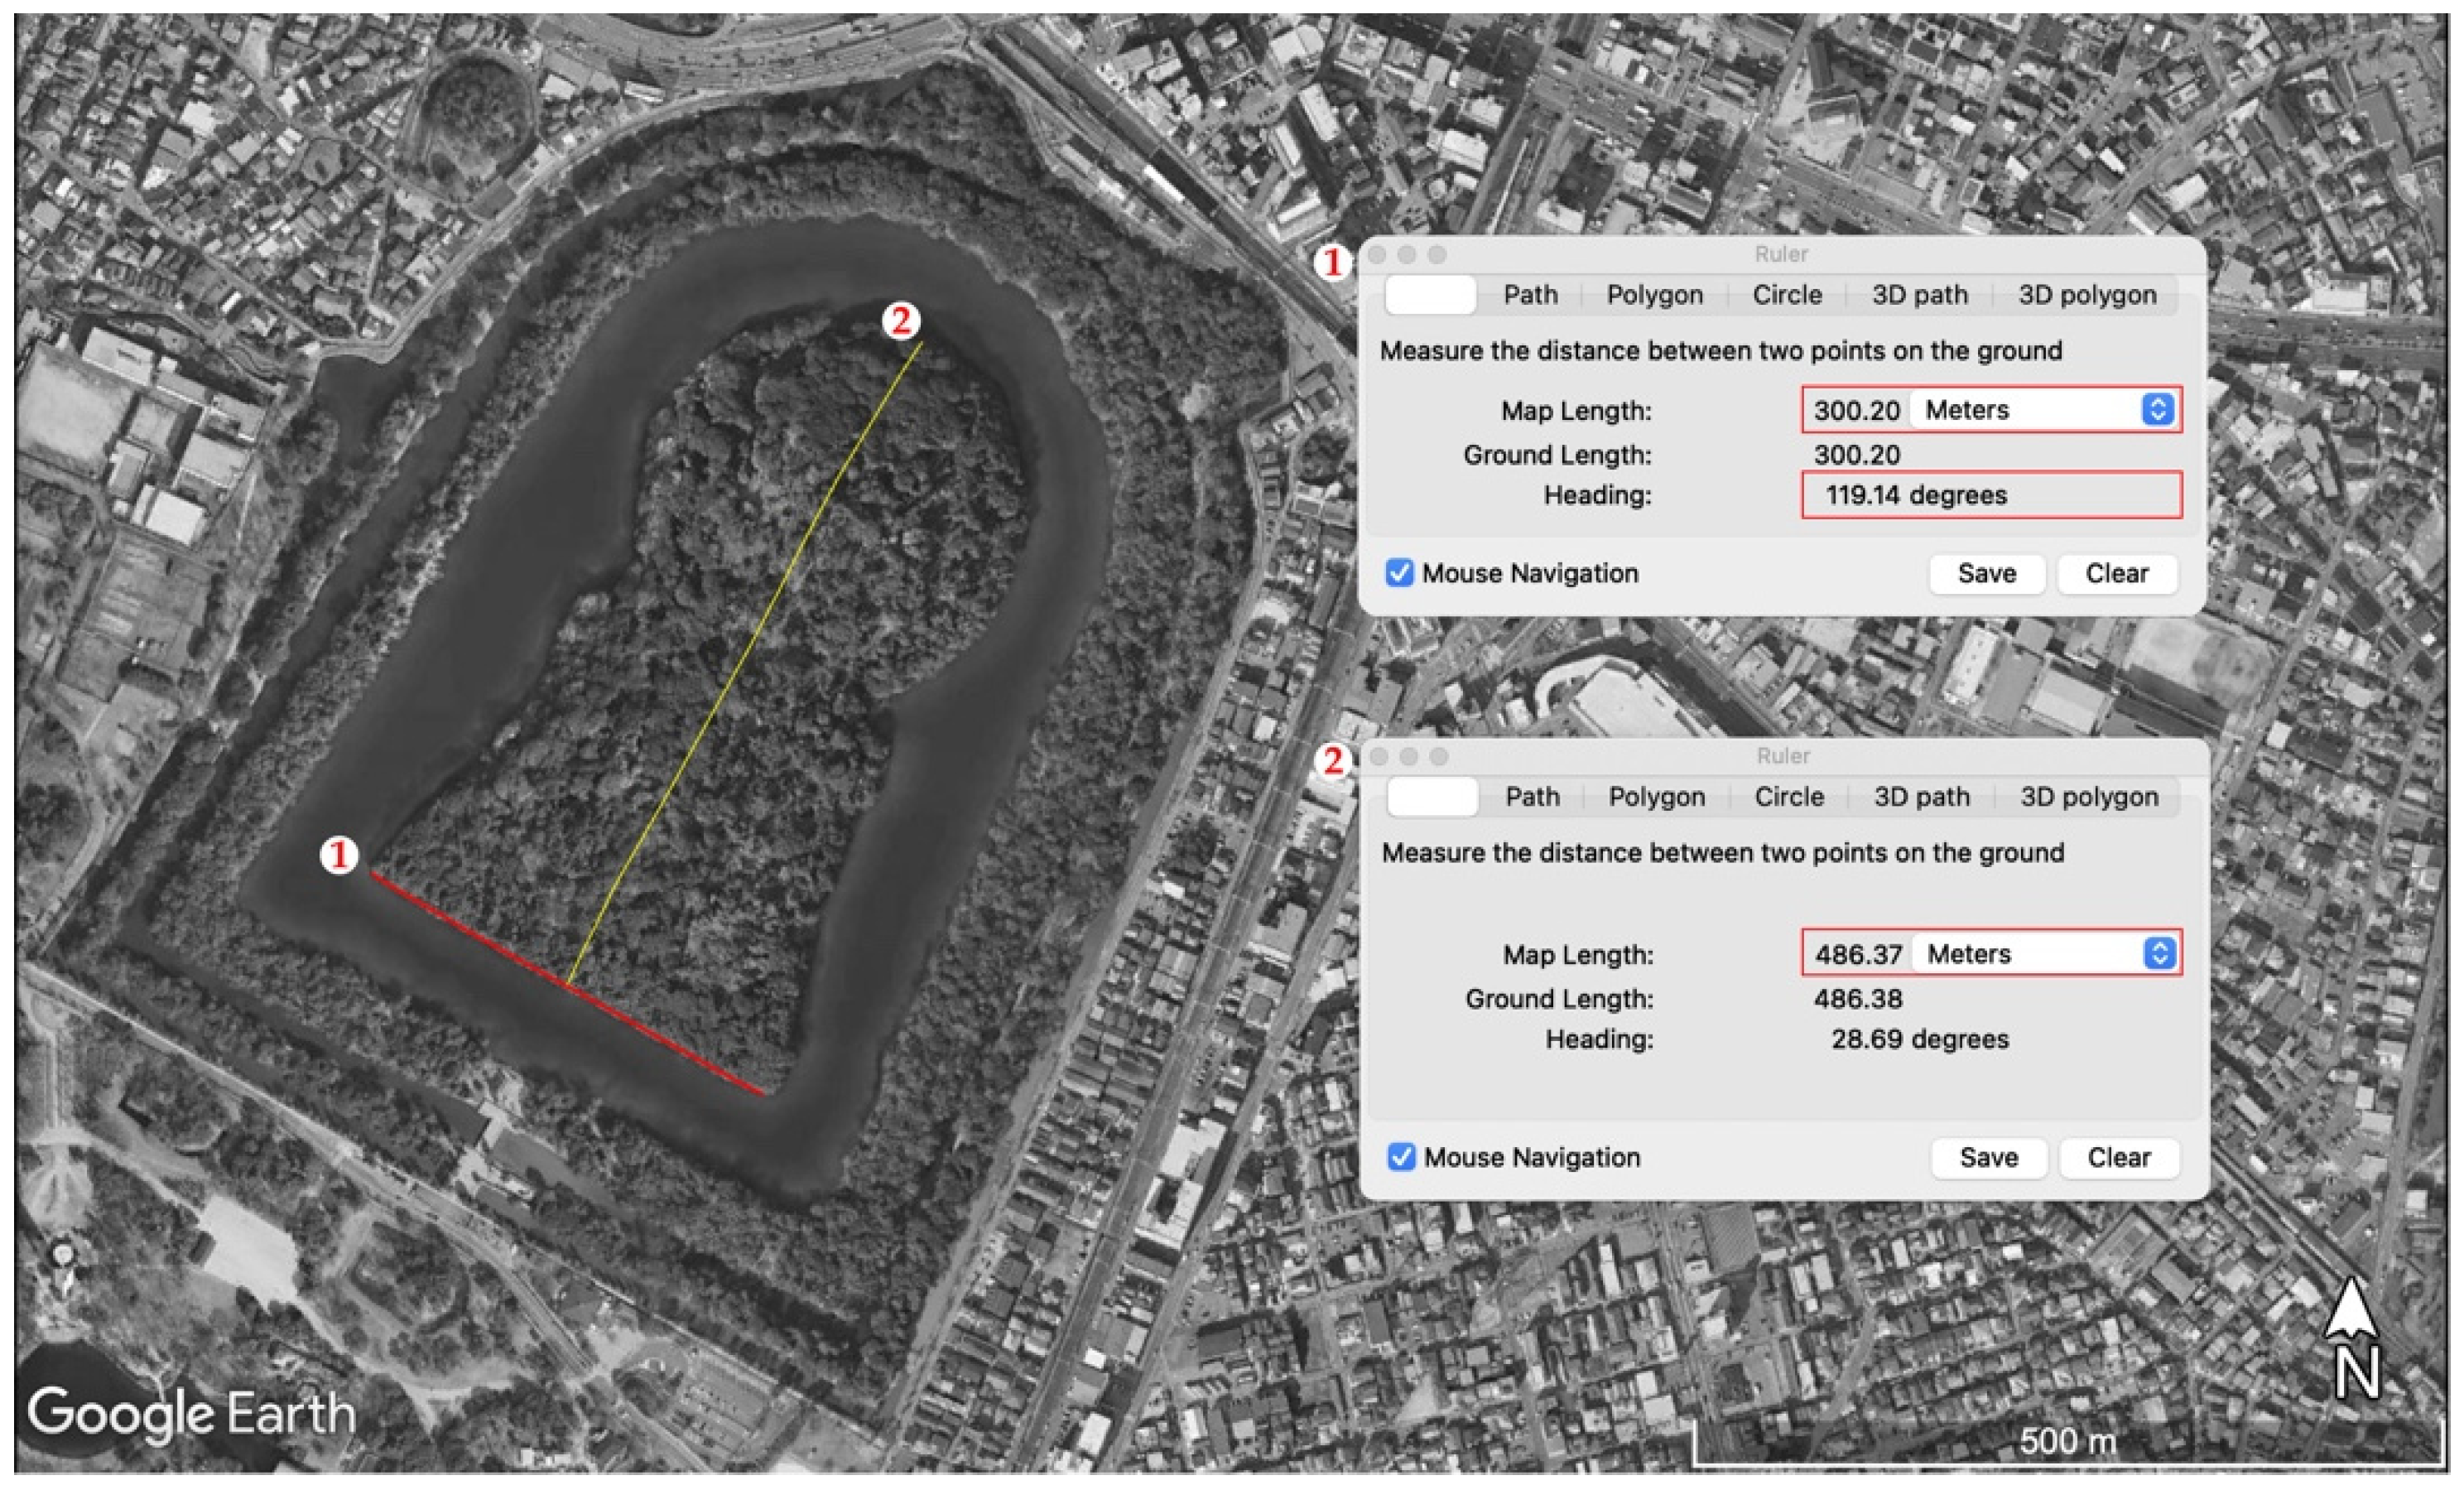
| 133 | Nintoku-tenno-ryo -Daisen- | 34°33′54″ | 135°29′17″ | 119 | 300 | 486 | P | P | |
| 134 | Hanzei-tenno-ryo | 34°34′34″ | 135°29′19″ | 105 | 111 | 158 | P | P | |
| 135 | Sairyo | 34°19′36″ | 135°10′08″ | 115 | 132 | 209 | S | P | |
| 136 | (Furuichi) | 34°32′56″ | 135°36′02″ | 156 | 122 | 118 | P | P | |
| 137 | Shionjiyama | 34°38′22″ | 135°38′27″ | 89 | 41 | 131 | P | P | |
| 138 | Taninowa Goryo | 34°19′50″ | 135°10′45″ | 153 | 97 | 172 | S | P | |
| 139 | Saga | Funatsuka | 36°07′39″ | 139°28′40″ | 130 | 84 | 131 | P | |
| 140 | Saitama | Futakoyama (Sakitama) | 36°07′39″ | 139°28′40″ | 130 | 84 | 131 | P | |
| 141 | Gunzan (Sakitama) | 36°07′39″ | 139°28′40″ | 129 | 71 | 110 | P | ||
| 142 | Inariyama (Sakitama) | 36°07′39″ | 139°28′40″ | 128 | 80 | 115 | P | ||
| 143 | Nakayama (Sakitama) | 36°07′39″ | 139°28′40″ | 153 | 35 | 75 | P | ||
| 144 | Shogunyama (Sakitama) | 36°07′39″ | 139°28′40″ | 141 | 68 | 97 | P | ||
| 145 | Taruzuka (Sakitama) | 36°07′39″ | 139°28′40″ | 141 | 48 | 71 | P | ||
| 146 | Yamako (Sakitama) | 36°07′39″ | 139°28′40″ | 143 | 44 | 69 | P | ||
| 147 | Shimane | Imaichi Kofun (G36) | 35°21′47″ | 132°45′53″ | 240 | 100 | P | ||
| 148 | Okadayama | 35°25′40″ | 133°05′29″ | 88 | 14 | 26 | PP | ||
| 149 | Shizuoka | Miikedaira | 35°03′12″ | 138°28′52″ | 30 | 30 | 68 | S | P |
| 150 | Tochigi | (Machizuka) | 36°48′54″ | 140°07′25″ | 90 | 10 | 28 | P | PP |
| 151 | Shimo Samurai tsuka (Machizuka) | 36°48′48″ | 140°07′23″ | 97 | 33 | 87 | P | PP | |
| 152 | Tsukayama | 36°30′22″ | 139°51′37.2″ | 164 | 60 | 90 | P | P | |
| 153 | Tokyo | Noge Otsuka | 35°36′18″ | 139°38′35″ | 136 | 27 | 72 | P | |
| 154 | Toyama | Sakuraya | 36°48′59″ | 137°01′52″ | 334 | 25 | 55 | P/S | PP |
| 155 | Yanaidanu-no-oyama | 36°49′23″ | 136°59′30″ | 237 | 43 | 105 | P | ||
| 156 | Yamaguchi | Wakamiya | 34°00′46″ | 130°55′28″ | 101 | 25 | 48 | P | P |
| 157 | Yamanashi | Kai Saikozuka | 35°35′32″ | 138°34′41″ | 338 | 65 | 168 | S | P |
| 158 | Yamagata | Inarimori | 38°02′23″ | 140°09′26″ | 116 | 30 | 96 | P/S | PP |
Appendix B
| n° | Satellite | Resolution | mm/dd/yyyy |
|---|---|---|---|
| 1 | Airbus | 50 cm | 1/11/2020 |
| 2 | Airbus | 50 cm | 3/7/2019 |
| 3 | Maxar Technologies | 30 cm | 4/18/2019 |
| 4 | Maxar Technologies | 30 cm | 4/13/2019 |
| 5 | Maxar Technologies | 30 cm | 12/18/2020 |
| 6 | Maxar Technologies | 30 cm | 4/13/2019 |
| 7–8 | Maxar Technologies | 30 cm | 12/17/2020 |
| 9 | Maxar Technologies | 30 cm | 05/04/2021 |
| 10 | Maxar Technologies | 30 cm | 04/15/2021 |
| 11 | Maxar Technologies | 30 cm | 04/17/2021 |
| 12 | Maxar Technologies | 30 cm | 01/04/2021 |
| 13 | Maxar Technologies | 30 cm | 06/14/2017 |
| 14–15 | Maxar Technologies | 30 cm | 08/03/2018 |
| 16 | Maxar Technologies | 30 cm | 04/30/2020 |
| 17 | Maxar Technologies | 30 cm | 04/02/2014 |
| 18–21 | Maxar Technologies | 30 cm | 01/23/2012 |
| 22 | Maxar Technologies | 30 cm | 10/08/2018 |
| 23 | Maxar Technologies | 30 cm | 05/16/2018 |
| 24–25 | PlanetScope | 3.7 m | 12/18/2020 |
| 26 | Maxar Technologies | 30 cm | 04/29/2018 |
| 27 | Maxar Technologies | 30 cm | 03/15/2013 |
| 28–31 | Maxar Technologies | 30 cm | 04/29/2018 |
| 32 | Maxar Technologies | 30 cm | 01/30/2019 |
| 33 | Maxar Technologies | 30 cm | 05/05/2018 |
| 34 | Maxar Technologies | 30 cm | 04/29/2018 |
| 35 | Maxar Technologies | 30 cm | 05/16/2018 |
| 36 | Maxar Technologies | 30 cm | 07/10/2018 |
| 37 | Maxar Technologies | 30 cm | 02/22/2019 |
| 38 | Maxar Technologies | 30 cm | 11/02/2019 |
| 39 | Maxar Technologies | 30 cm | 05/24/2020 |
| 40 | Maxar Technologies | 30 cm | 02/20/2021 |
| 41 | PlanetScope | 3.7 m | 11/10/2019 |
| 42 | Maxar Technologies | 30 cm | 02/20/2021 |
| 43 | Maxar Technologies | 30 cm | 03/13/2017 |
| 44–45 | Maxar Technologies | 30 cm | 09/27/2012 |
| 46 | Maxar Technologies | 30 cm | 10/05/2017 |
| 47 | Maxar Technologies | 30 cm | 05/07/2019 |
| 48 | PlanetScope | 3.7 m | 11/13/2020 |
| 49 | Maxar Technologies | 30 cm | 05/07/2019 |
| 50 | PlanetScope | 3.7 m | 11/13/2020 |
| 51–54 | Maxar Technologies | 30 cm | 01/30/2019 |
| 55–61 | Maxar Technologies | 30 cm | 12/01/2020 |
| 62 | Maxar Technologies | 30 cm | 04/05/2016 |
| 63 | Maxar Technologies | 30 cm | 11/17/2020 |
| 64–65 | Maxar Technologies | 30 cm | 12/15/2017 |
| 66 | Maxar Technologies | 30 cm | 11/12/2020 |
| 67 | Maxar Technologies | 30 cm | 03/11/2021 |
| 68 | PlanetScope | 3.7 m | 09/07/2019 |
| 69 | Maxar Technologies | 30 cm | 05/08/2019 |
| 70 | Maxar Technologies | 30 cm | 03/11/2021 |
| 71 | Maxar Technologies | 30 cm | 03/11/2021 |
| 72 | Maxar Technologies | 30 cm | 03/11/2021 |
| 73–83 | Maxar Technologies | 30 cm | 03/11/2021 |
| 84 | Maxar Technologies | 30 cm | 01/30/2019 |
| 90 | Maxar Technologies | 30 cm | 03/11/2021 |
| 91–92 | Maxar Technologies | 30 cm | 03/11/2021 |
| 93 | Maxar Technologies | 30 cm | 01/30/2019 |
| 94 | Maxar Technologies | 30 cm | 03/18/2021 |
| 95 | Maxar Technologies | 30 cm | 03/11/2021 |
| 96 | PlanetScope | 3.7 m | 03/09/2020 |
| 97–99 | Maxar Technologies | 30 cm | 03/11/2021 |
| 100 | Maxar Technologies | 30 cm | 12/06/2020 |
| 101–105 | Maxar Technologies | 30 cm | 03/26/2021 |
| 106–138 | Maxar Technologies | 30 cm | 11/24/2020 |
| 139 | Maxar Technologies | 30 cm | 05/01/2016 |
| 140–146 | Maxar Technologies | 30 cm | 05/05/2018 |
| 147 | Maxar Technologies | 30 cm | 06/17/2017 |
| 148 | Maxar Technologies | 30 cm | 02/04/2017 |
| 149 | Maxar Technologies | 30 cm | 08/25/2020 |
| 150–151 | Maxar Technologies | 30 cm | 09/29/2014 |
| 152 | Maxar Technologies | 30 cm | 07/02/2018 |
| 153 | Maxar Technologies | 30 cm | 05/24/2019 |
| 154–155 | Maxar Technologies | 30 cm | 05/28/2014 |
| 156 | Maxar Technologies | 30 cm | 02/18/2019 |
| 157 | Maxar Technologies | 30 cm | 03/24/2021 |
| 158 | Maxar Technologies | 30 cm | 11/04/2015 |
References
- Mizoguchi, K. An Archaeological History of Japan; University of Pennsylvania Press: Philadelphia, PA, USA, 2002. [Google Scholar]
- Magli, G. Astronomy and Feng Shui in the projects of the Tang, Ming and Qing royal mausoleums: A satellite imagery approach. Archaeol. Res. Asia 2018, 17, 98–108. [Google Scholar] [CrossRef]
- Magli, G. The Orientation of the Daisen Kofun. Available online: https://papers.ssrn.com/sol3/papers.cfm?abstract_id=3604011 (accessed on 18 May 2020).
- Mizoguchi, K. Yayoi-shakai no soshiki to kategori (The organization and categories of the Yayoi society). In Yayoi-jidai no kokogaku, Volume 8. Shuraku kara yomu Yayoishakai (The Archaeology of the Yayoi Period, Volume 8. The Yayoi Society as Seen from the Settlement); Matsugi, T., Fujio, S., Shitara, H., Eds.; Doseisha: Tokyo, Japan, 2008; pp. 74–95. [Google Scholar]
- Kang, I. Che-5-jang Hanbando ŭi chŏnbang huwŏnbun [Chapter 5 Keyhole tombs of the Korean peninsula]. In Minjok Munhwa Yŏn’gu ch’ongsŏ; Hagyon Munhwasa: Seoul, Korea, 1983; Volume 10, pp. 257–312. [Google Scholar]
- Lee, D.H.S. Keyhole-Shaped Tombs and Unspoken Frontiers: Exploring the Borderlands of Early Korean-Japanese Relations in the 5th–6th Centuries; University of California: Los Angeles, CA, USA, 2014. [Google Scholar]
- Kidder, J.E. The Fujinoki Tomb and Its Grave-Goods. Monum. Nippon. 1987, 42, 57. [Google Scholar] [CrossRef]
- Mizoguchi, K. The Archaeology of Japan; Cambridge University Press: Cambridge, UK, 2013. [Google Scholar]
- Ishino, H. Rites and rituals of the Kofun period. Jpn. J. Relig. Stud. 1992, 19, 191–216. [Google Scholar] [CrossRef]
- Yoshitaka, H. Burial mounds, volcanoes, and the sun. Quat. Res. 2017, 56, 97–110. [Google Scholar]
- Mizoguchi, K. The emergence of anthropomorphic representation. In Image and Imagination: A Global Prehistory of Figurative Representation; Renfrew, C., Morley, I., Eds.; McDonald Institute for Archaeological Research: Cambridge, UK, 2007; pp. 185–195. [Google Scholar]
- Parcak, S.H. Satellite Remote Sensing for Archaeology; Routledge: London, UK; New York, NY, USA, 2009. [Google Scholar]
- Parcak, S.; Gathings, D.; Childs, C.; Cline, G.M.E. Satellite Evidence of Archaeological Site Looting in Egypt: 2002–2013. Antiquity 2016, 90, 188–205. [Google Scholar] [CrossRef] [Green Version]
- Rayne, L.; Gatto, M.; Abdulaati, L.; Al-Haddad, M.; Sterry, M.; Sheldrick, N.; Mattingly, D. Detecting Change at Archaeo-logical Sites in North Africa Using Open-Source Satellite Imagery. Remote Sens. 2020, 12, 3694. [Google Scholar] [CrossRef]
- Romain, W.F. Solstice Alignments at Angkor Wat and Nearby Temples: Connecting to the Cycles of Time. J. Skyscape Archaeol. 2018, 4, 176–200. [Google Scholar] [CrossRef]
- Baratta, N.C.; Magli, G. The Role of Astronomy and Feng Shui in the Planning of Ming Beijing. Nexus Netw. J. 2021, 23, 1–21. [Google Scholar] [CrossRef]
- Zhao, Q.; Yu, L.; Li, X.; Peng, D.; Zhang, Y.; Gong, P. Progress and Trends in the Application of Google Earth and Google Earth Engine. Remote. Sens. 2021, 13, 3778. [Google Scholar] [CrossRef]
- Potere, D. Horizontal Positional Accuracy of Google Earth’s High-Resolution Imagery Archive. Sensors 2008, 8, 7973–7981. [Google Scholar] [CrossRef] [PubMed]
- González-García, C.; Šprajc, I. Astronomical significance of architectural orientations in the Maya Lowlands: A statistical approach. J. Archaeol. Sci. Rep. 2016, 9, 191–202. [Google Scholar] [CrossRef]
- Silva, F. A probabilistic framework and significance test for the analysis of structural orientations in skyscape archaeology. J. Archaeol. Sci. 2020, 118, 105138. [Google Scholar] [CrossRef]
- Gowland, W. XX.—The Dolmens and Burial Mounds in Japan. Archaeologia 1897, 55, 439–524. [Google Scholar] [CrossRef]
- Hoskin, M. Tombs, Temples, and Their Orientations. A New Perspective on Mediterranean Prehistory; Ocarina Books: Bognor Regis, UK, 2001. [Google Scholar]
- Barnes, G.L. A hypothesis for early Kofun rulership. Jpn. Rev. 2014, 27, 3–29. [Google Scholar]
- Kishimoto, N. Dual Kingship in the Kofun Period as Seen from the Keyhole Tombs. UrbanScope (Electron. J.) 2013, 4, 1–21. [Google Scholar]
- Tsude, H. Chiefly lineages in Kofun-period Japan: Political relations between centre and region. Antiquity 1990, 64, 923–929. [Google Scholar] [CrossRef]
- Edwards, W. Mirrors on Ancient Yamato: The Kurozuka Kofun Discovery and the Question of Yamatai. Monum. Nippon. 1999, 54, 75. [Google Scholar] [CrossRef]
- Comina, C.; Sotiropoulos, P.; Maroulakis, S.; Vacha, D.; Mandrone, G.; Masturzo, N.; Matsumoto, N.; Seike, A.A. Geophysical surveys over and inside the Tobiotsuka Kofun–Okayama prefecture. J. Archaeol. Sci. 2020, 30, 102256. [Google Scholar] [CrossRef]
- Renshaw, S.L.; Ihara, S. Archaeoastronomy and Astronomy in Culture in Japan: Paving the Way to Interdisciplinary Study. Archaeoastronomy 1999, 14, 59–88. [Google Scholar]
- Renshaw, S.L.; Ihara, S. A Cultural History of Astronomy in Japan. In Astronomy across Cultures. Science across Cultures: The History of Non-Western Science; Selin, H., Xiaochun, S., Eds.; Springer: Dordrecht, The Netherlands, 2000; Volume 1, pp. 385–407. [Google Scholar]


Publisher’s Note: MDPI stays neutral with regard to jurisdictional claims in published maps and institutional affiliations. |
© 2022 by the authors. Licensee MDPI, Basel, Switzerland. This article is an open access article distributed under the terms and conditions of the Creative Commons Attribution (CC BY) license (https://creativecommons.org/licenses/by/4.0/).
Share and Cite
Baratta, N.C.; Magli, G.; Picotti, A. The Orientation of the Kofun Tombs. Remote Sens. 2022, 14, 377. https://doi.org/10.3390/rs14020377
Baratta NC, Magli G, Picotti A. The Orientation of the Kofun Tombs. Remote Sensing. 2022; 14(2):377. https://doi.org/10.3390/rs14020377
Chicago/Turabian StyleBaratta, Norma Camilla, Giulio Magli, and Arianna Picotti. 2022. "The Orientation of the Kofun Tombs" Remote Sensing 14, no. 2: 377. https://doi.org/10.3390/rs14020377
APA StyleBaratta, N. C., Magli, G., & Picotti, A. (2022). The Orientation of the Kofun Tombs. Remote Sensing, 14(2), 377. https://doi.org/10.3390/rs14020377