Article

Detection and 3D Modeling of Potential Buried Archaeological Structures Using WorldView-3 Satellite Imagery

by
Raghda El-Behaedi
Department of Near Eastern Languages and Civilizations, University of Chicago, Chicago, IL 60637, USA
Remote Sens. 2022, 14(1), 92; https://doi.org/10.3390/rs14010092
Submission received: 1 November 2021 / Revised: 15 December 2021 / Accepted: 23 December 2021 / Published: 25 December 2021
(This article belongs to the Special Issue Remote Sensing of Archaeology)

Abstract

:
Throughout the world, cultural heritage sites are under the direct threat of damage or destruction due to developing environmental and anthropogenic hazards, such as urban expansion, looting, and rising water levels. Exacerbating this problem is the fact that many of the most vulnerable sites’ exact locations and/or full spatial extents have yet to be uncovered, making any attempts at their protection exceedingly difficult. However, the utilization of earth observation data has recently emerged as an unmatched tool in the exploration and (digital) preservation of endangered archaeological sites. The presented research employs very high-resolution WorldView-3 satellite imagery (~30 cm) for identifying and delineating previously unknown subsurface archaeological structures at the ancient Egyptian site of Hermopolis (el-Ashmunein). A particular emphasis is placed on the application of spectral indices, specifically those looking at vegetation cropmarks and iron oxide levels. Through this analysis, seven promising structures were identified, including three elongated installations, which may have been utilized for storage purposes, and a potential casemate foundation structure. As 2D outlines of structures are often difficult to visualize, the newly identified archaeological features were expanded into a realistic, georeferenced 3D model using the computer programs, SketchUp Pro and Chaos V-Ray. The goal of this 3D model is to ensure that the results derived from this research are more accessible (and tangible) to a wider audience—the scientific community and the public alike. The methodological scheme presented in this article is highly adaptable and with some minor modifications can be replicated for other archaeological sites worldwide.

Graphical Abstract

1. Introduction

Throughout the MENA (Middle East and North Africa) region, many ancient sites currently lie concealed beneath dense sand, vegetation growth, and a shifting anthropogenic landscape (e.g., agricultural fields and urban pockets). It is due to these environmental factors that the exact location and/or full spatial extent of many archaeological sites around the region remain largely undiscovered. While in most cases the use of traditional on-ground investigations (e.g., archaeological excavations) have proven ineffective for quickly detecting such unknown sites, earth observation data has recently emerged as an unparalleled tool [1,2,3]. The rapid and widespread discovery of these previously undetected cultural heritage sites is not only important from an intellectual standpoint, as archaeologists can better piece together information about past societies, but it is also crucial for ensuring the safety of such vulnerable areas. In other words, it is simply impossible to protect what one does not know exists. As such, the use of high-resolution satellite imagery has permitted cultural resource managers, policy holders, and urban planners, among others, to record, evaluate, manage, and mitigate any environmental or man-made threats to these areas before their possible destruction [4].
The application of remote sensing techniques for the exploration of archaeological sites worldwide has facilitated the rapid (digital) preservation of highly threatened and vulnerable areas [5,6,7,8]. Since the declassification of various imaging reconnaissance satellites (e.g., CORONA and U2), as well as the advent of high-resolution spaceborne satellite data (e.g., QuickBird, WorldView, and Pléiades), archaeologists have been able to successfully locate, identify, and digitally preserve thousands of cultural heritage sites [9,10,11,12]. The utilization of these temporally continuous satellite images, especially multispectral data, to investigate archaeological locations has proven to be increasingly effective because large spatial extents can now be captured and analyzed at unprecedented speeds and accuracies. Furthermore, as satellite data is both non-invasive and non-destructive, it is possible to analyze a site safely from thousands of miles above the Earth’s surface, no matter how geographically or politically inaccessible the study area is [13]. In fact, not only does one not have to step foot on the site itself, but most importantly, there is little to no disturbance or destruction to the archaeological area—a crucial component in the mission to safeguard these endangered places.
A particularly useful application of remote sensing for archaeological prospection comes in the form of assessing localized soil and vegetation changes across a site [14]. A series of spectral-enhancement indices, such as the Normalized Difference Vegetation Index (NDVI) and the Green Normalized Difference Vegetation Index (GNDVI), are often applied to multispectral satellite imagery to measure the quantity and quality of photosynthetic material in green vegetation [15,16]. From the use of such indices, vegetation marks known as “cropmarks” can be identified. These cropmarks form as a result of the differential growth and health of arable plants overlaying near-surface archaeological features [17]. As buried archaeological structures can impact the growth rate of crops in the soil above them, a distinctive pattern between the healthy (above undisturbed soil) and stressed (above an archaeological structure) vegetation starts to become apparent. For example, previous studies in Europe have been able to identify many Roman-period ruins, such as Roman forts, transitory camps, and roadways, through the detection of such cropmarks [18]. Similarly, recent projects in the Nile Delta (Egypt) have also uncovered settlement mounds and ancient river courses using vegetation analysis [19]. It is important to note that many of the studies dealing with vegetation changes as a proxy for archaeological presence have relied solely on the use of relatively moderate resolution satellite imagery, such as Landsat (30 m spatial resolution) and Sentinel-2 (10–20 m spatial resolution). However, very high-resolution imagery, with a finer spatial resolution of ~30–50 cm, has been shown to be much more reliable in both detecting cropmark anomalies and distinguishing small-scale details [20,21].
In addition to the utilization of remote sensing techniques, archaeologists have also recently started to turn to 3D modeling as a way to both study and share their results, including data collected from field excavations or large-scale data derived using geospatial technologies [22,23,24]. As we live in a three-dimensional world, 3D visual reconstructions are imperative in conceptualizing the information that is often lost in 2D images (e.g., maps and planimetric plans), such as shape, dimension, and physical consistency [25,26]. The adoption of such 3D technologies has enabled the continued reusability of data by scientists at a larger scale, fostering more collaborative efforts across disciplines [27]. However, 3D modeling is not only crucial for making data more tangible and understandable to scientists and the public alike, but it is also essential in ensuring the digital protection of cultural heritage and the preservation of collective memory for future generations [26].

2. Research Aim

The aim of this article is two-fold. First, to present a methodological framework for delineating previously unknown subsurface archaeological features using very high-resolution satellite imagery (at a sub-meter scale). An emphasis is placed on the application of edge-detection spatial filtering and spectral-enhancement indices, particularly those looking at vegetation marks and iron oxide levels. Second, to construct a realistic georeferenced 3D model of the buried structures detected using remote sensing techniques. This 3D reconstruction is primarily intended to help scientists and the public to conceptualize what the buried structures may have looked like in antiquity. The present research is highly interdisciplinary in nature, integrating various aspects of archaeology, geospatial sciences, computer science, and earth science for one sole goal: to digitally conserve a threatened cultural heritage site.

3. Study Area

The settlement of Hermopolis is situated near the small agricultural village of el-Ashmunein, approximately 40 km south of the modern city of Minya (Figure 1A). Strategically located at the confluence of Upper and Lower Egypt, Hermopolis functioned as a central meeting point where several ancient cultures and traditions converged [28,29]. Often described as a “melting pot”, the city featured a unique blend of both Egyptian and Greco-Roman cultures, best exemplified by the presence of sanctuaries dedicated to Egyptian, Greek, and Roman deities [28]. Originally founded in the Old Kingdom Period (c. 2686-2160 BCE), the settlement quickly rose to prominence, becoming the capital of the important 15th Upper Egyptian nome, known as the Hare nome [30,31]. For millennia, Hermopolis held an influential role in the political, economic, and especially religious spheres of Pharaonic and Greco-Roman Egypt. In fact, early on it was chosen as the principal cult center of the Egyptian Ibis-headed god, Thoth, and as preserved in its ancient toponym—“Hermopolis Magna” or the “Great City of Hermes”—it later became the religious center of the Hellenistic deity, Hermes [32]. Unfortunately, much of this important site has yet to be explored; however, projects by the German Hermopolis mission (1929–1939), British Museum (1980–1990), and University of Alexandria (late 1940s and 1950s) have been able to excavate small segments of the Pharaonic, Ptolemaic, and Christian city.
Today, the archaeological site is characterized by a multi-period stratified mound, which covers an area of 1.5 km2 (1 by 1.5 km) (Figure 1B). As a result of the anthropogenic and environmental developments in the area, only ~56.7% of the original tell, roughly 0.85 km2 (0.85 by 1 km), is currently accessible [33]. With the archaeological remains bounded by two small agricultural villages, el-Idara to the north and el-Ashmunein to the south, as well as by agricultural fields to the east and west, rapid urban encroachment has become a prime threat to the longevity of the archaeological remains. According to a study by El-Bayomi and Ali (2015), the Minya Governorate (where Hermopolis is located) has one of the highest population growths in Egypt, with a staggering ~3.1% annual increase and still rising [34]. In addition to this urban sprawl, the subsoil water table in the Delta and lower Nile Valley areas has risen at an unprecedented rate [35]. Without the annual Nile flood, which was halted by the construction of the Aswan High Dam in the 1960s, the salts found in the soil are no longer naturally flushed out [36]. For this reason, agricultural fields now need to be perennially irrigated. This has created two key problems; the water table has risen exponentially, and the ground water now contains much higher concentrations of salt. At Hermopolis, specifically, the agricultural lands bordering the site are irrigated using canal-fed irrigation. This form of irrigation is particularly harmful, as it discharges a considerable volume of water—more than needed for normal irrigation—which further amplifies the water table level and the soil salinization problems [37]. In fact, most pre-New Kingdom (prior to c.1550 BCE) occupation levels at Hermopolis are located below the current ground water [32]. Furthermore, this combination of higher ground water and increased salinization is detrimental to the ancient structures at the site, particularly those made of stone and mudbrick. As the ground water percolates into the structures and eventually evaporates, it leaves highly concentrated levels of salt in the stone/mudbrick, which over time lead to the weakening and decaying of the monuments [38]. It is due to these aforementioned anthropic and environmental progressions that the site of Hermopolis is considered highly threatened and must be comprehensively explored and (digitally) preserved for future generations.

4. Materials and Methods

The workflow for this research consisted of two main procedures: first, a spectral analysis of sub-surface archaeological features using vegetation and iron oxide indices; second, the creation of a georeferenced 3D model of the remotely sensed findings.

4.1. Pre-Processing of Multispectral Imagery

To conduct a comprehensive remote sensing analysis of the near-surface structures at Hermopolis, WorldView-3 (WV-3) imagery was utilized. Originally launched in August 2014, WV-3 is an American Earth observation satellite that is part of the DigitalGlobe, Inc satellite constellation. The images captured by this satellite consist of one panchromatic band (450–800 nm) and eight multispectral channels: red, red edge, coastal, blue, green, yellow, near-IR1, and near-IR2 (400–1040 nm). The WV-3 data used for the archaeological site was acquired by the satellite on 20 June 2017 and was 100% cloud-free. The image was obtained as a Level-2A product and was, therefore, geometrically corrected (orthorectified) using the rational polynomial coefficient (RPC) model. The availability of the panchromatic channel, in conjunction with the multispectral bands, provides the ability to create VHR multispectral pan-sharpened imagery. The orthorectified scene was pan-sharpened by means of the widely used Gram-Schmidt Pan Sharpening algorithm using the nearest neighbor resampling method [39]. This sharpening algorithm relies primarily on the higher spatial resolution panchromatic data to sharpen the multispectral data’s pixel resolution. Through this process, the WorldView-3’s spatial resolution improved by approximately four-fold, from 1.24 m to 31 cm. The resulting pan-sharpened image held critical information that improved the overall performance and accuracy of subsequent image analysis algorithms [6,40].
Before starting to manipulate the imagery, the Forward Minimum Noise Fraction (MNF) transform, a widely used pre-processing step, was first applied to the multispectral image in order to denoise the data. The isolation of noise was performed using the filtration of the eigenvalues and associated images. The resulting product included a cascading principal component analysis (PCA) for the eight WV-3 spectral bands, thus allowing for the identification of the “noisiest” bands (possessing the least amount of useable data) [41]. In addition to denoising, the MNF process can also help in lessening the computational requirements necessary for later image processing algorithms [42]. Through this MNF process, it was found that PCA bands 1 through 4 (the coastal, blue, green, and yellow bands, respectively) contained the least noise and the most significant information for the above-mentioned WV-3 image. These four MNF components were retained as the input variables for use in the subsequent classification.

4.2. Satellite Image Classification

A pixel-based classification using the hard-clustering algorithm, K-Means Unsupervised Classification, was performed in order to map the main land cover of the study site and segregate vegetated areas from the rest of the surroundings. The classification utilized the aforementioned MNF image, in order to focus on the bands containing the largest quantity of data. All the pixels encompassing the study area of Hermopolis were classified into clusters based on their spectral similarity to one another. The resulting image contained two spectral categories: vegetated and non-vegetated areas. Using a total of 6200 pixels, an accuracy assessment for the WV-3 derived classification resulted in an overall high level of accuracy of 98.8%.

4.3. Satellite Spectral Analysis

4.3.1. Spectral Analysis of Vegetation

Since a dense layer of vegetation, primarily camel thorn and coarse grass, covers the archaeological ruins of Hermopolis due to the high-water table (Figure 2), it was imperative to explore in detail the general vegetation greenness and health at the site. Traditionally, the flora growing atop an archaeological feature will be very stressed, while the vegetation on an undistributed area will be much more robust and greener [43]. Previous studies have found that the near-infrared (NIR) spectral channel is more effective in revealing the robustness or stress of vegetation than the bands in the visible portion of the electromagnetic spectrum [14]. Thus, the NIR spectral band is most frequently used for the prospection of new archaeological features. In the infrareds (near and middle wavelengths), the pigments found in healthy vegetation have a very high reflectance, while those in stressed vegetation exhibit a much lower level of reflectance [44]. This variance in reflectance between healthy and stressed vegetation is an instrumental tool for the detection and identification of potential archaeological structures.
By applying different vegetation indices to raw satellite data, scholars can extract significant information such as vegetation type, quantity, and condition. The collection of spectral-enhancement indices that analyze vegetation greenness and health is commonly known as the “Broadband Greenness Vegetation” indices. All the indices in this group measure the amount and quality of photosynthetic material (chlorophyll) in vegetation. For the present study, several spectral indices were employed, including the Normalized Difference Vegetation Index (NDVI), Green Normalized Difference Vegetation Index (GNDVI), and the Infrared Percentage Vegetation Index (IPVI).
  ρ NIR ρ Red ρ NIR + ρ Red = NDVI  
  ρ NIR ρ Green ρ NIR + ρ Green = GNDVI  
  ρ NIR ρ NIR + ρ Red = IPVI
By using the NIR and red/green spectral bands, subtle physical differences in stressed versus healthy vegetation can be easily recognized. In the resulting processed image, the stressed vegetation appears brighter than the neighboring pixels. This contrast in colors allows for visual ease in detecting linear, circular, or rectilinear archaeological features. In addition to qualitative information, the vegetation indices also produce important quantitative information for categorizing the condition of the flora. The most vital information produced is a value ranging from −1 or 0 to +1, which gives a numerical assessment of the state of robustness of the vegetation. The closer to +1, the healthier the vegetation is, while the closer to 0 (IPVI) or −1 (NDVI and GNDVI), the more stressed it is [45]. To further enhance the results, a 3 × 3 ENVI directional filter mask at 45 degrees was applied to the processed IPVI image. As an edge detector, directional filtering allows for the amplification and/or enhancement of selective linear features, which is beneficial for a more detailed analysis of the satellite imagery [46]. In addition, directional filtering can also be utilized as a light source to generate a 3D-shaded relief-image effect, which, when merged with the original processed satellite image (in this case, the IPVI image), allows for subtle features to be easily recognized and delineated [46].

4.3.2. Spectral Analysis of Iron Oxide

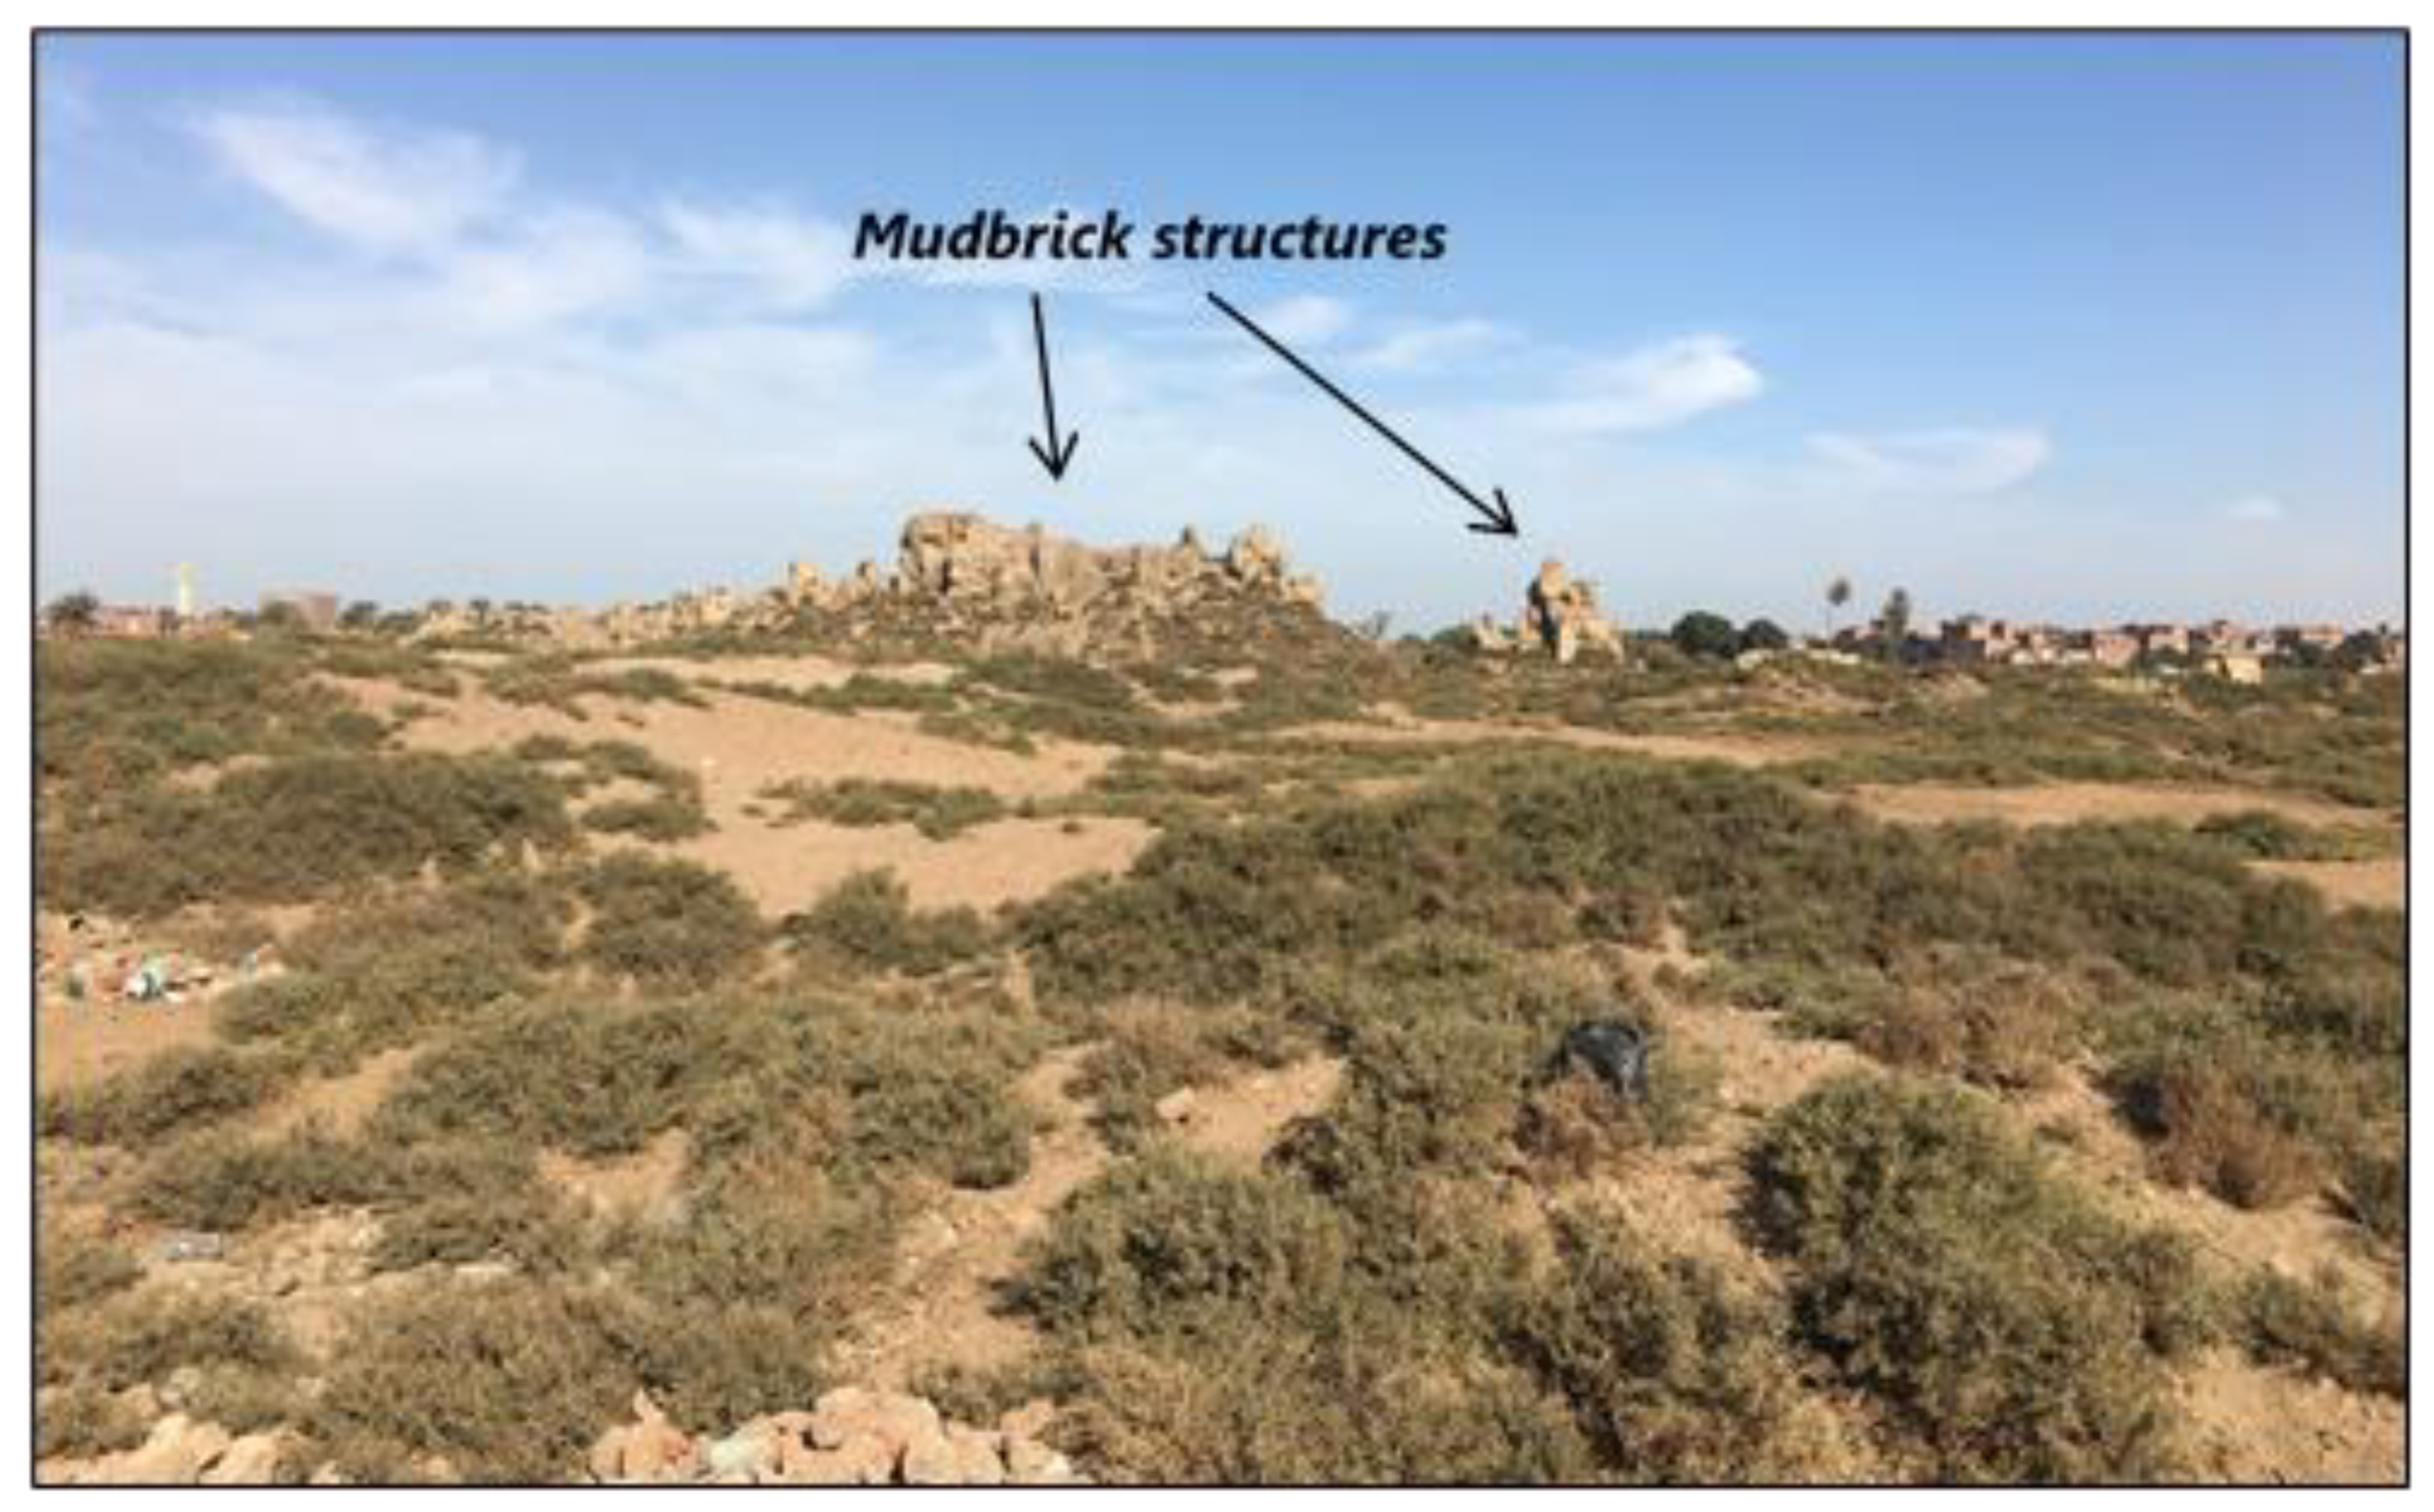
Unfired mudbrick was the most common building material in ancient Egypt, with Hermopolis being no exception (Figure 3). These mudbricks were utilized for the construction of various domestic installations, in addition to some administrative and palatial complexes [47]. Sun-dried mudbricks comprise large amounts of clay, of which ~5 to 6% is the chemical compound iron oxide (Fe2O3) [48]. For this reason, studying the patterns of presence/absence of iron oxide via satellite imagery could assist in the identification of possible archaeological remnants. To conduct this study, the WorldView New Iron Index (WV-II) was utilized. The WV-II is a geological index, which pinpoints pixels rich in iron oxide, and can thus be indicative of subsurface mudbrick features. By using the visible light portion of the electromagnetic spectrum, specifically the green, yellow, and blue wavelengths, pixels with spectral signatures corresponding to that of iron oxide are identified.
  ρ Green   ×   ρ Yellow ρ Blue   ×   ρ Red = WV   II
In the resulting WV-II processed image, the areas with higher levels of iron oxide appear darker in their response than the rest of the background. Unlike the vegetation indices, the spectral indices testing for certain geological substances are very rarely applied to archaeological case studies. Therefore, this research strives to apply this often-unused technique to delineate archaeological remains by exploring a certain geological component, in this case, iron oxide. Similar to the spectral analysis of vegetation (4.3.1), a 3 × 3 ENVI directional filter mask at 45 degrees was applied to the processed WV-II image in order to enhance any linear features.

4.4. Satellite Spectral Analysis

As mapped 2D structures are often so difficult to visualize, the newly identified archaeological features were expanded into a geo-referenced 3D model. This reconstruction is intended to help archaeologists conceptualize what these structures may have looked like in antiquity and, more generally, to give a tangible picture of the understudied eastern section of Hermopolis. The final model was constructed in two main sections: First, the architectural footprint of the structures was created, and then the materials/textures were mapped using the 3D-modeling computer program, SketchUp Pro. Second, the materials, textures, and landscape of the model were realistically rendered using the powerful rendering and simulation software, Chaos V-Ray. It should be noted that while SketchUp has been often utilized in archaeology for the creation of 3D models [49,50], the use of Chaos V-Ray for rendering archaeological structures/features is still very new.
The fabrication of the 3D reconstruction started with determining the general parameters of the model. The size parameters, the length (modelLength) and width (modelWidth), of the entire area were first measured from the 2D model and then rendered in SketchUp Pro. It should be emphasized that the exact height (modelHeight) is unknown, as remote sensing analysis merely detects the foundations of a structure. However, similar surviving structures in Egypt were used as the prototype for the model’s height (more in the Results and Discussion section). Next, the roomLength and roomWidth of each individual room within the structures was measured and mapped into the model. As the type of ceiling of the uncovered structures is also unknown, extant examples from ancient Egypt were utilized for this model. After the addition of the ceiling, realistic materials used in ancient Egyptian structures—mudbrick with both vegetal and non-vegetal inclusions—were mapped on the exterior and interior surfaces. Grain plants and grass features were then added around the structures to enhance the landscape of the model. Finally, the completed model was transferred to Chaos V-Ray and the geometry settings/presets for the model were adjusted for the materials/texture and landscape features (e.g., grass) in order to render them in the most realistic way possible.

5. Results and Discussion

5.1. Classification

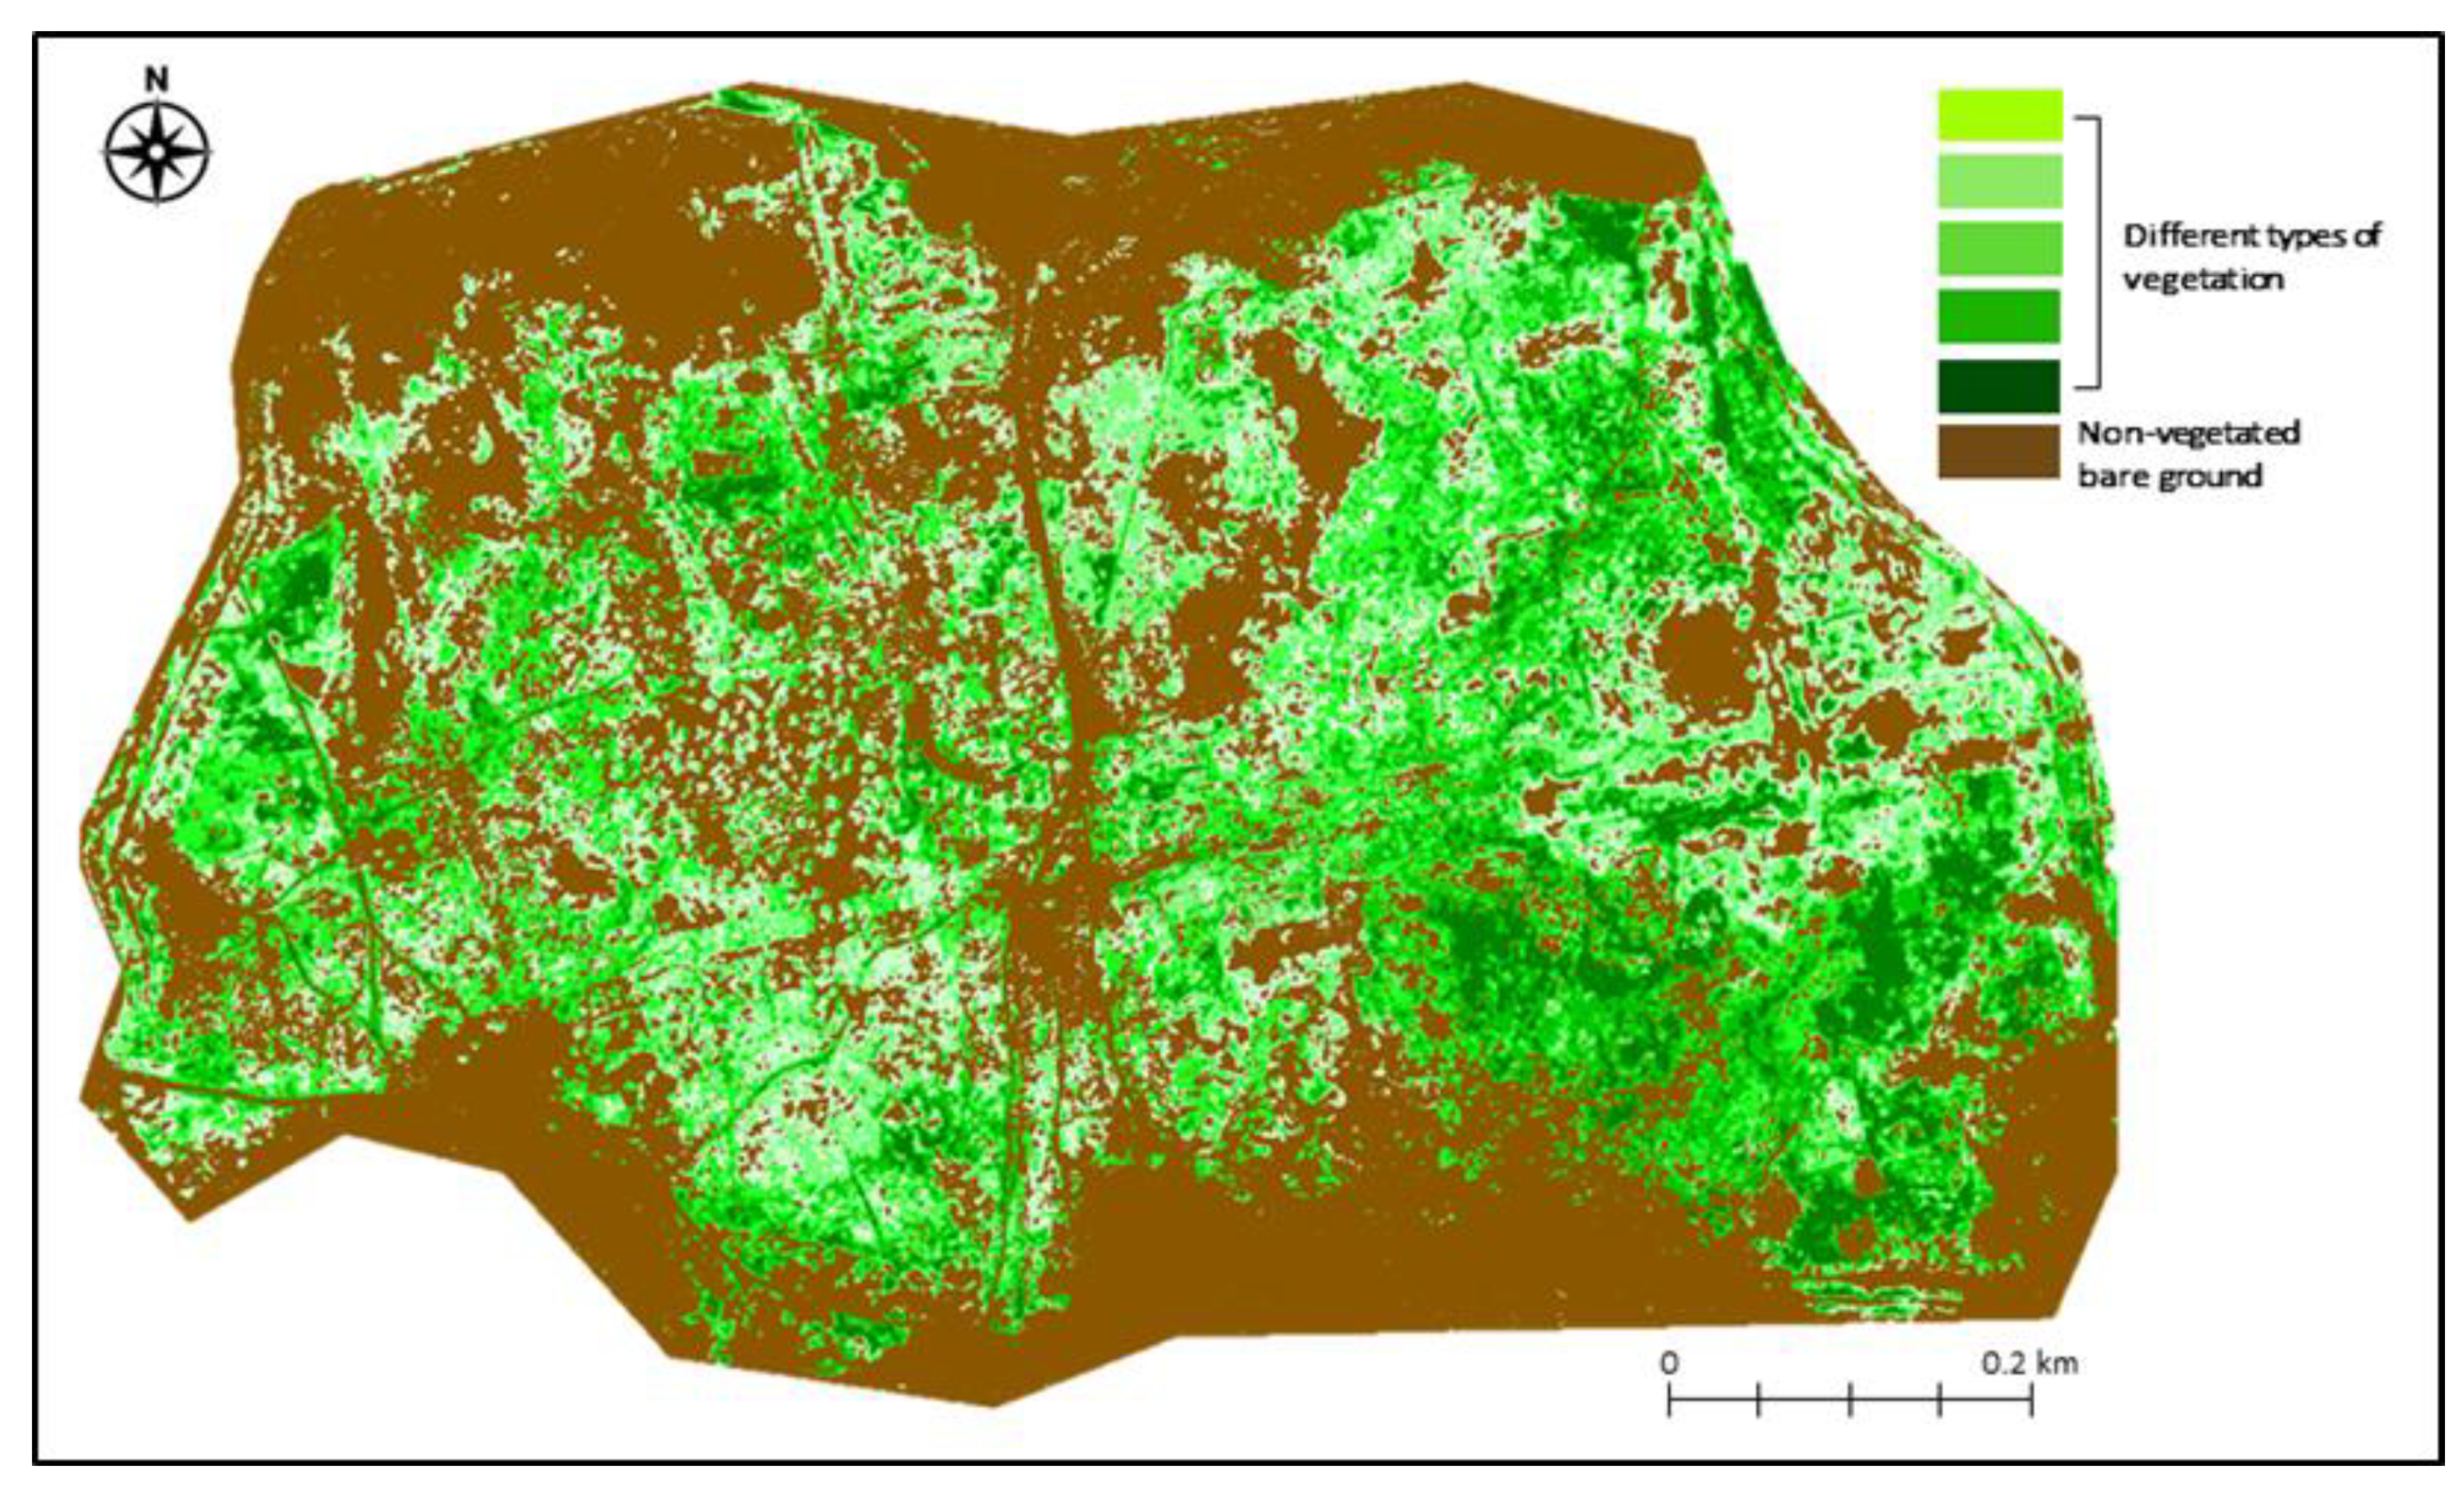
As an initial step, the MNF-based K-Means classification permitted the extraction of the land cover of the study site (Figure 4). The analysis showed that the study area of Hermopolis (646,230 m2) comprises approximately 49.5% (320,115 m2) of non-vegetated surface, whereas the remaining 50.5% (326,115 m2) of the area was covered with a variety of flora. The derived classification layer had a high level of overall accuracy of 98.8% and a kappa (k) coefficient of 0.97. This kappa coefficient value indicated that 97% of the pixels were classified by means of the classifier, whereas the rest (3% of the pixels) were classified randomly. The kappa coefficient accounted for the random distribution effects and examined whether the result of the error matrix was significantly better than any random classification pattern.

5.2. Satellite Spectral Analysis

The use of spectral-enhancement indices (IPVI and WV-II) coupled with edge-detection spatial filtering resulted in the identification of numerous potential archaeological features that had yet to be recorded by any expedition in the eastern sector.

5.2.1. Spectral Analysis of Vegetation

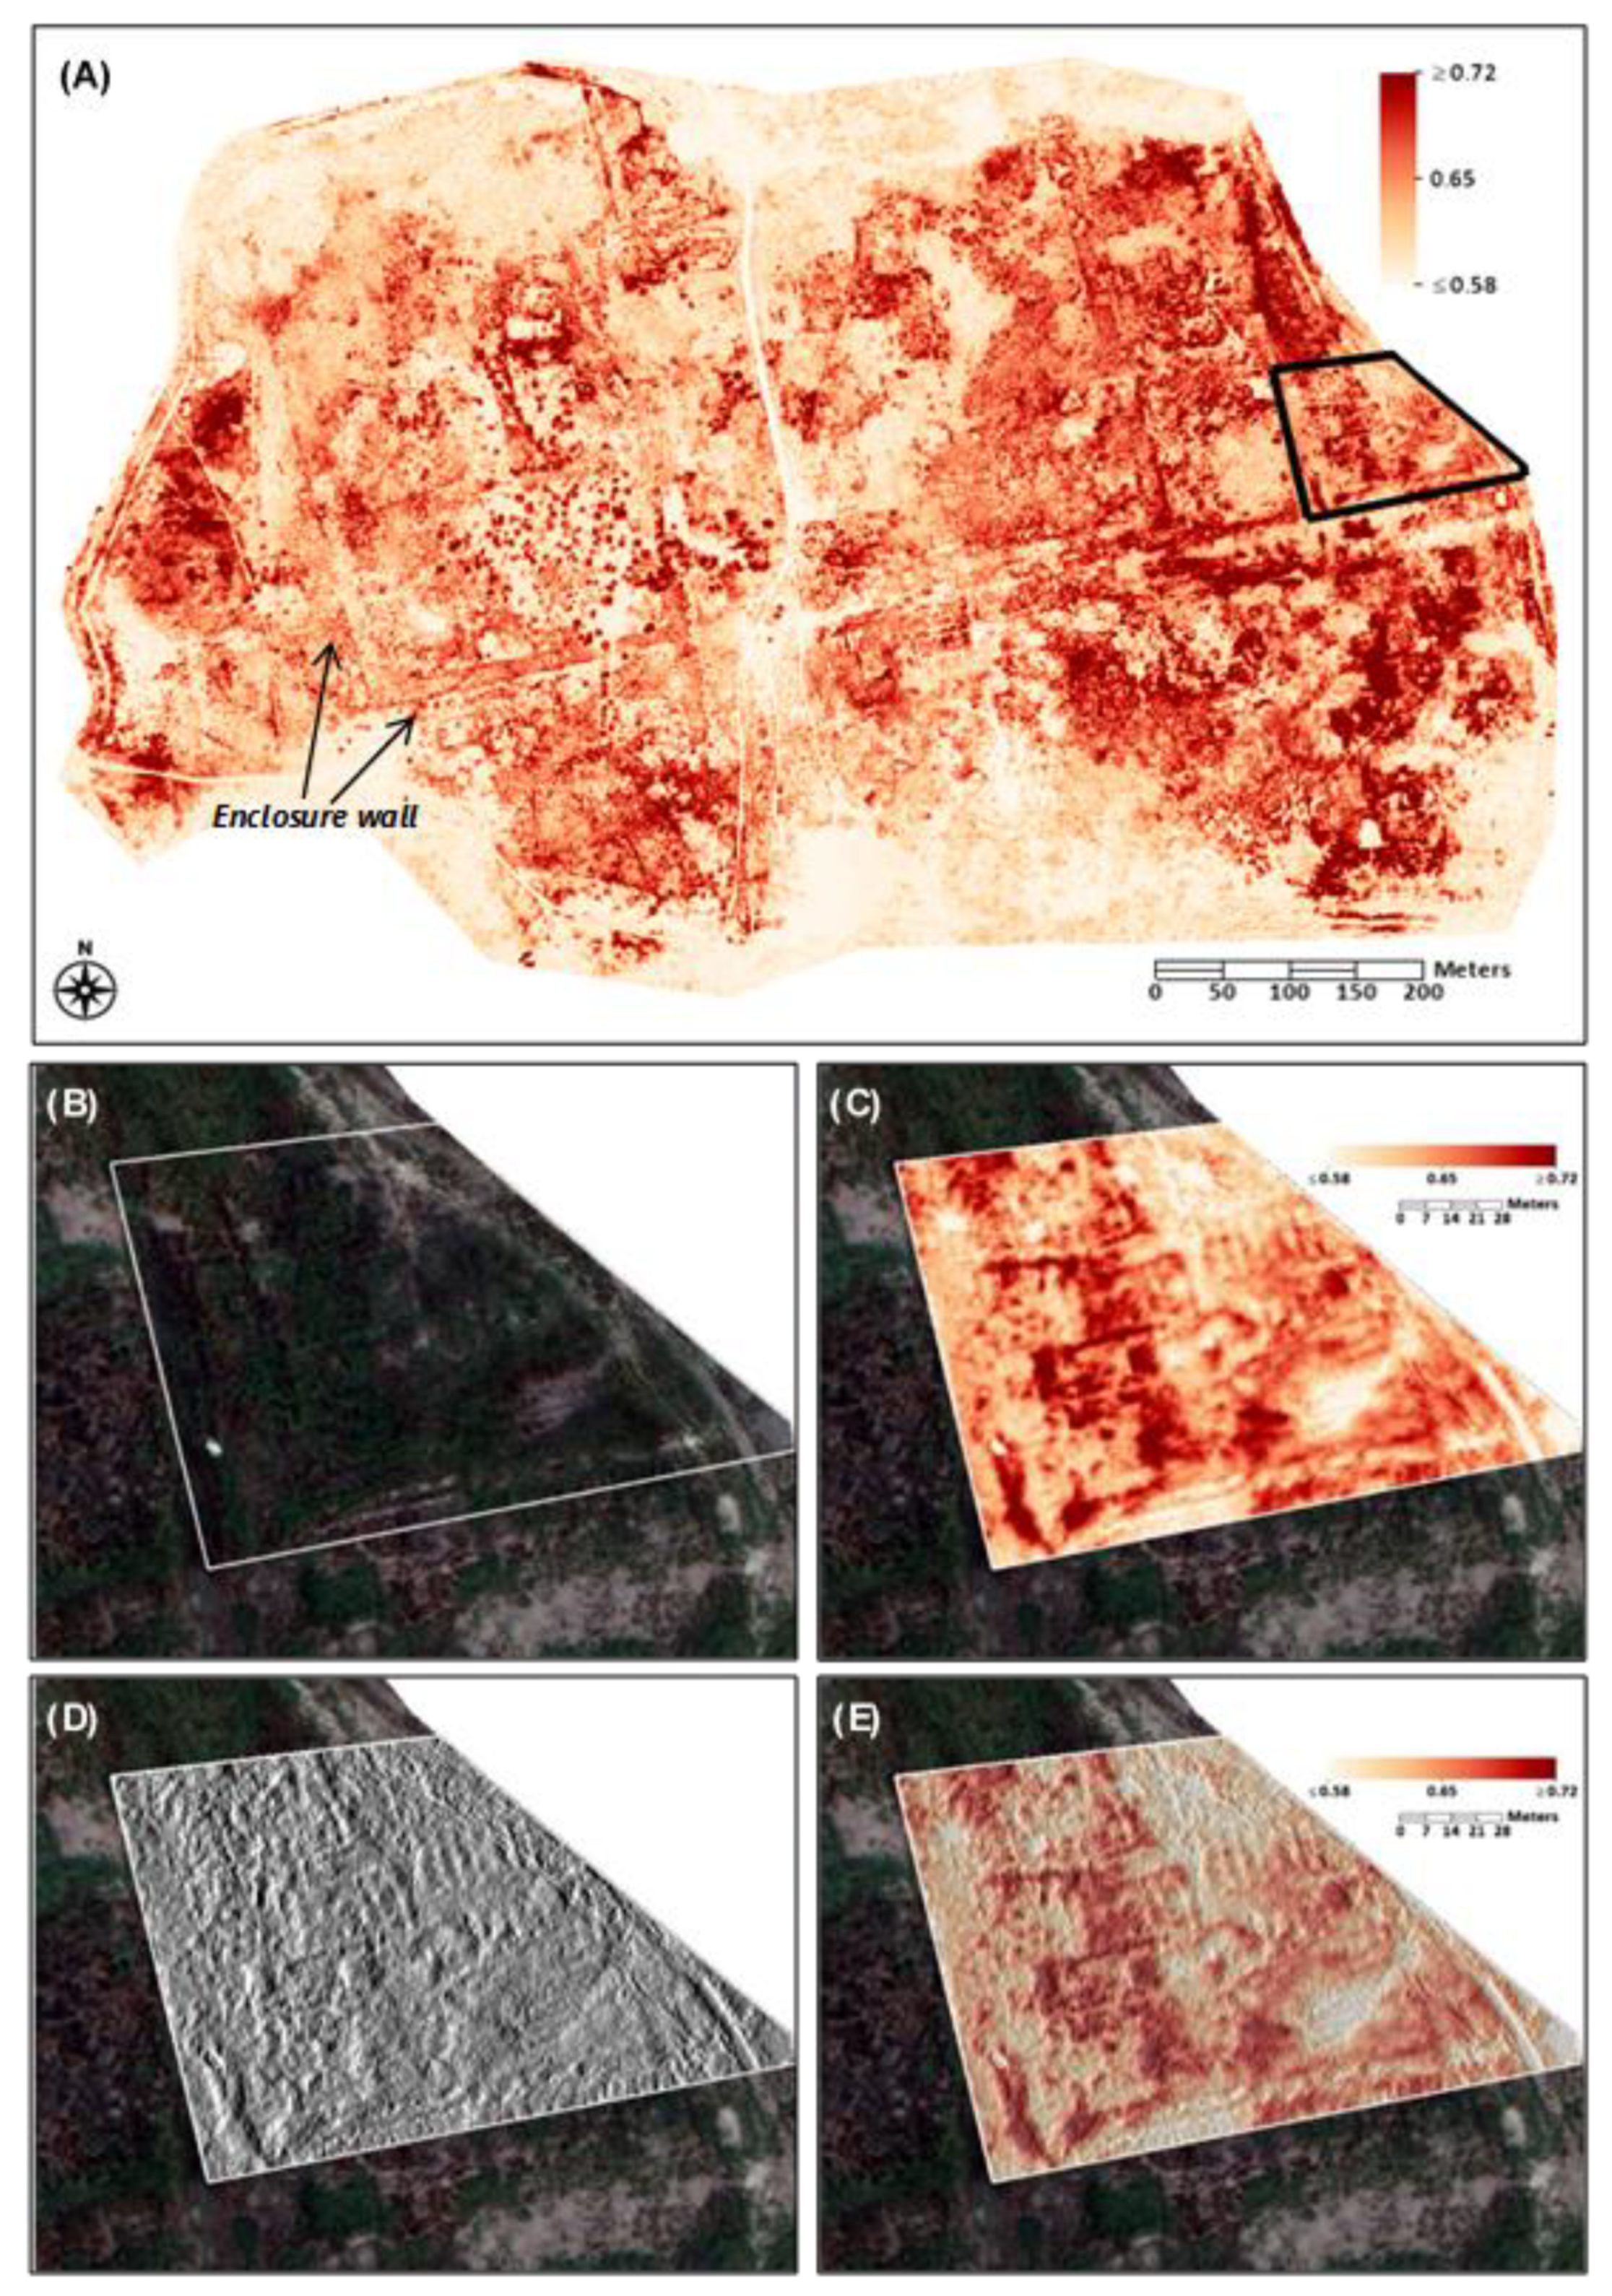
By utilizing the IPVI, a dense subsurface network of urban structures was found directly adjacent to the eastern section of the Dynasty 30 temple enclosure wall (Figure 5). In the IPVI image, the detected linear cropmarks of possible buried structures exhibited a very high IPVI value (~0.72) in comparison to the rest of the surrounding area, thus indicative of a high level of plant vigor. Conventionally, as seen in studies on Roman ruins across Europe, darker vegetation marks (higher NDVI or IPVI value) are indicative of the presence of water or hollow features, such as ditches or ancient waterways. This is because the topsoil extends farther down in these locations than in the rest of the surrounding areas [43,51]. In this instance, the vegetation growing atop the filled-in ditches and waterways usually has more nutrients and moisture and is, therefore, healthier and greener than the rest of the vegetation (Figure 6). On the other hand, vegetation that appears more stressed and paler than the surroundings is most likely suggestive of the buried stone walls of buildings or forts [43,51]. In this case, the topsoil is shallower with fewer nutrients and moisture than the rest of the vegetation. However, it is important to note that in Egypt the opposite case is true, as many structures are most often constructed of sun-dried mudbrick instead of stone. The Nile clay found in the mudbrick, as well as the vegetal binding materials, such as chaff or straw, act as a natural fertilizer that promotes vegetation growth instead of inhibiting the plant’s development like stone. For this reason, in Egyptian case studies, vegetation growing above (mudbrick) walls will usually exhibit higher IPVI or NDVI values, thus mimicking the spectral signature of ditches and defunct waterways.
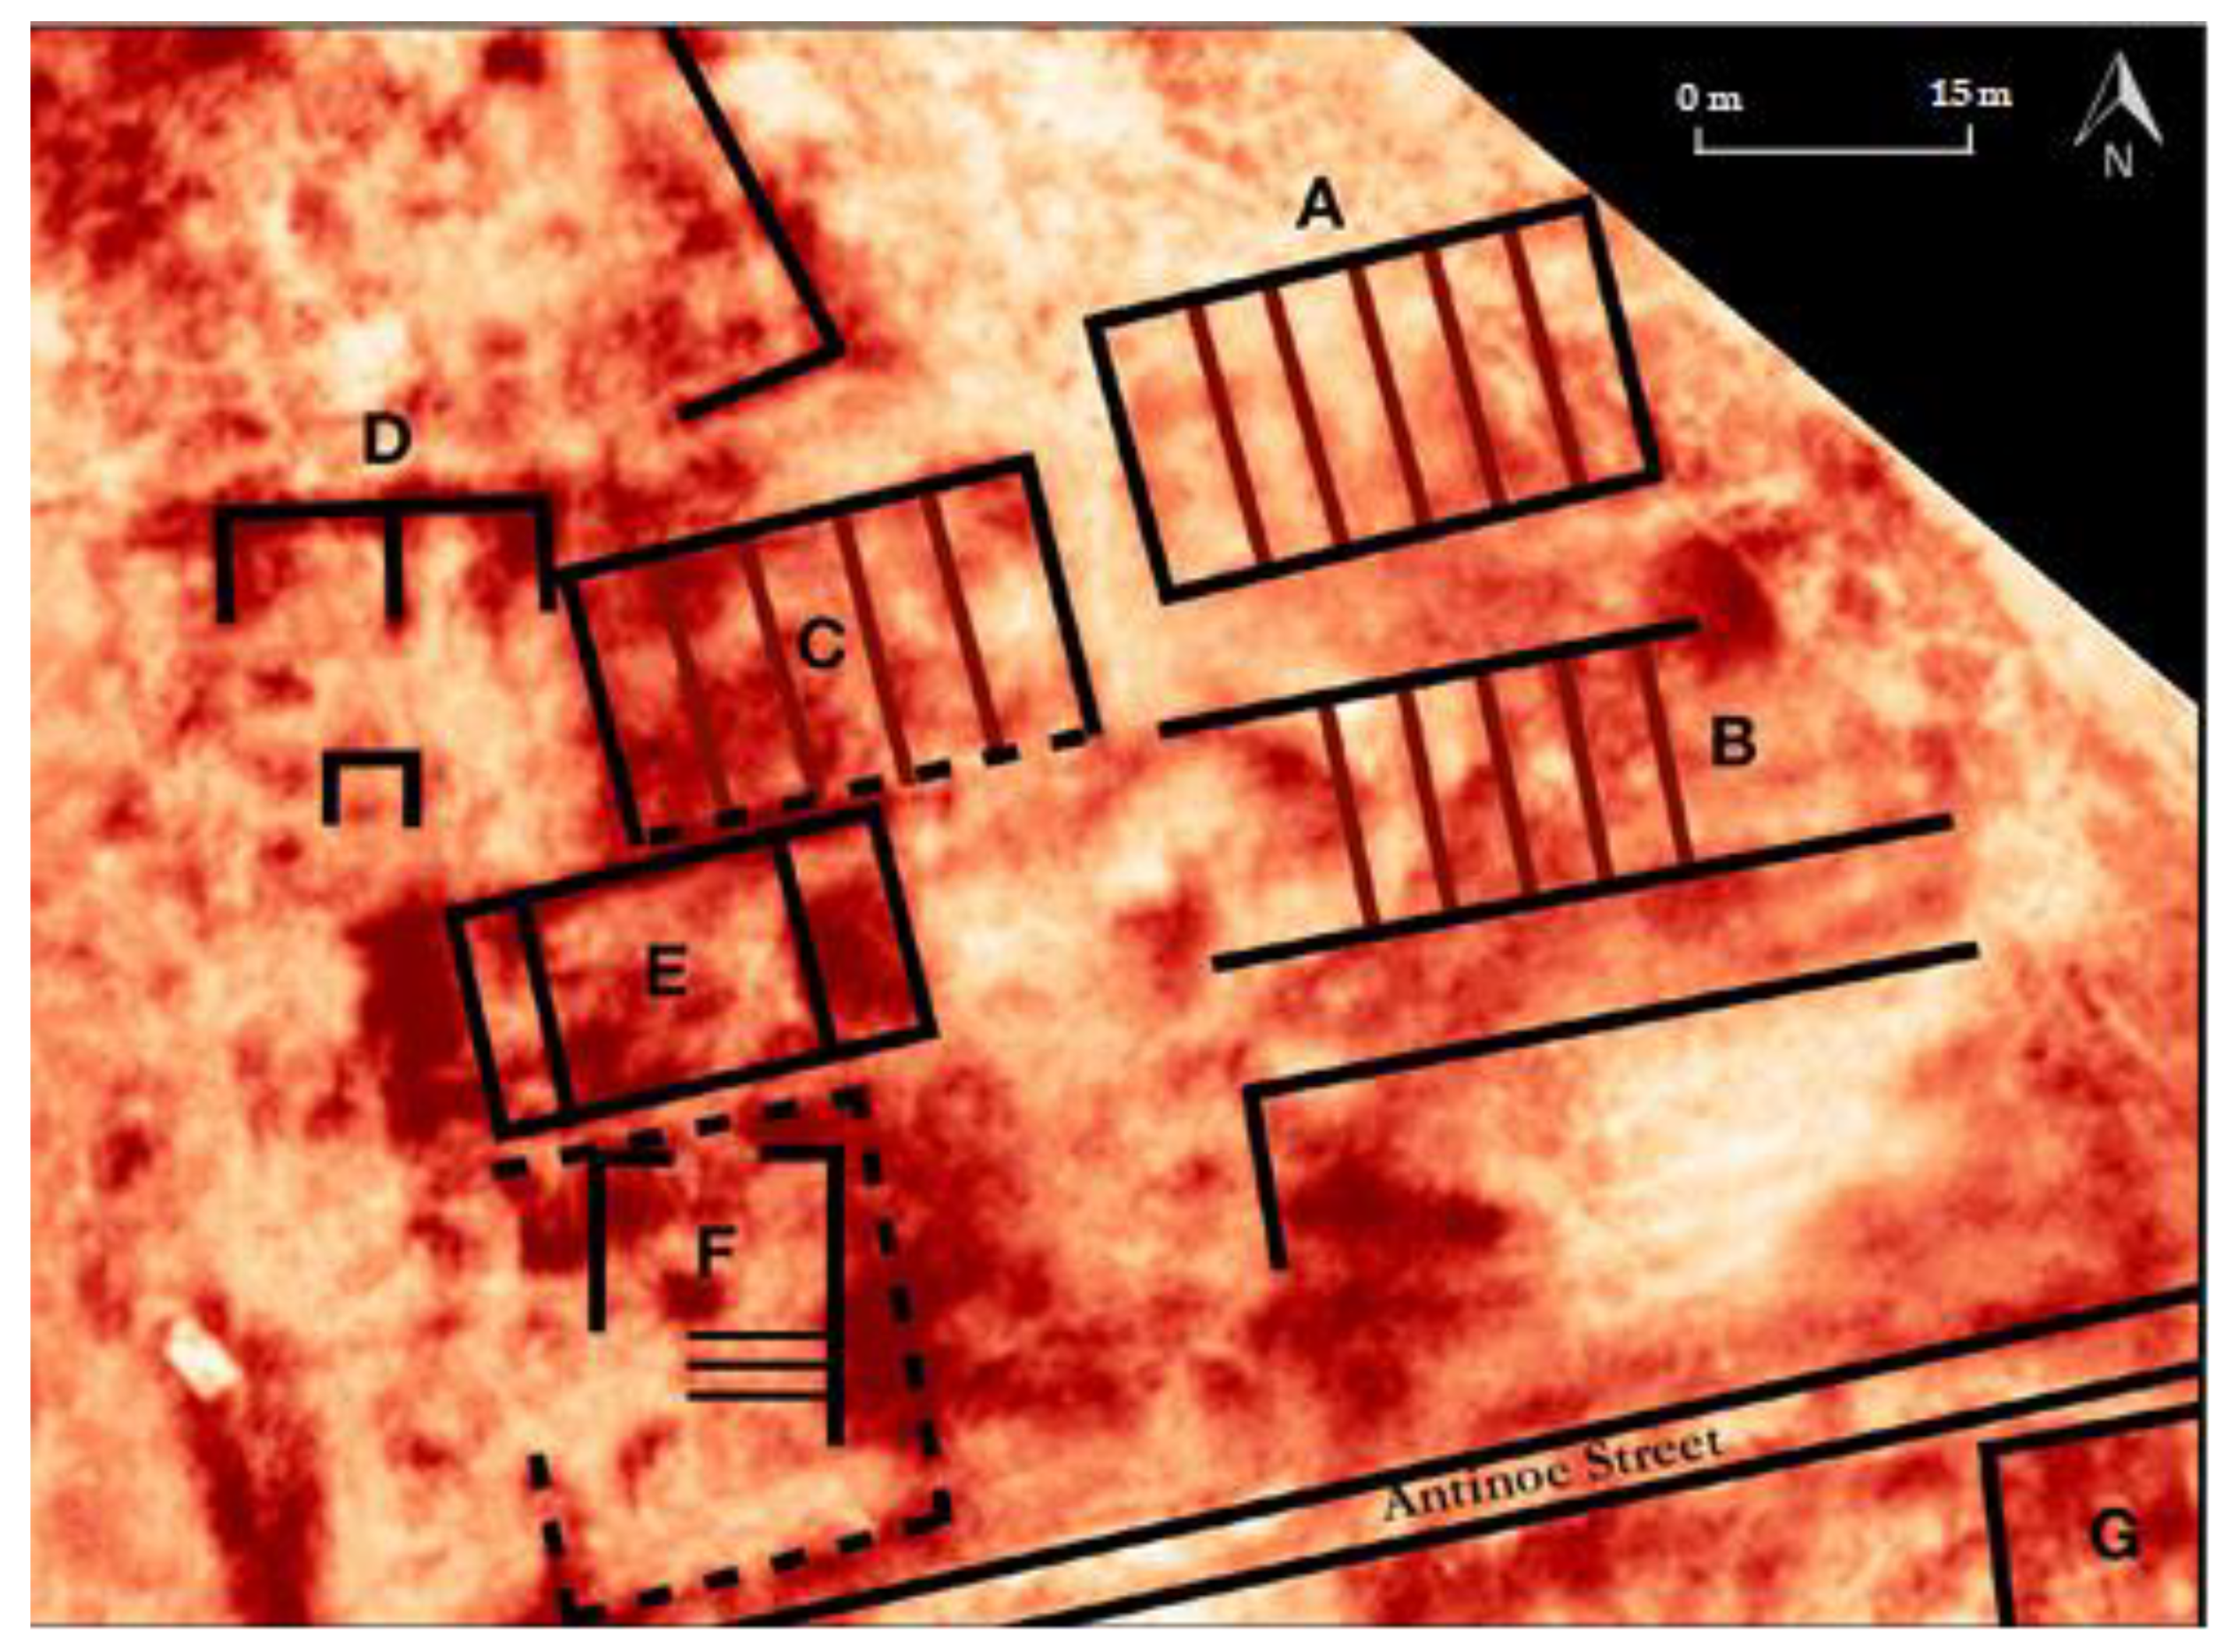
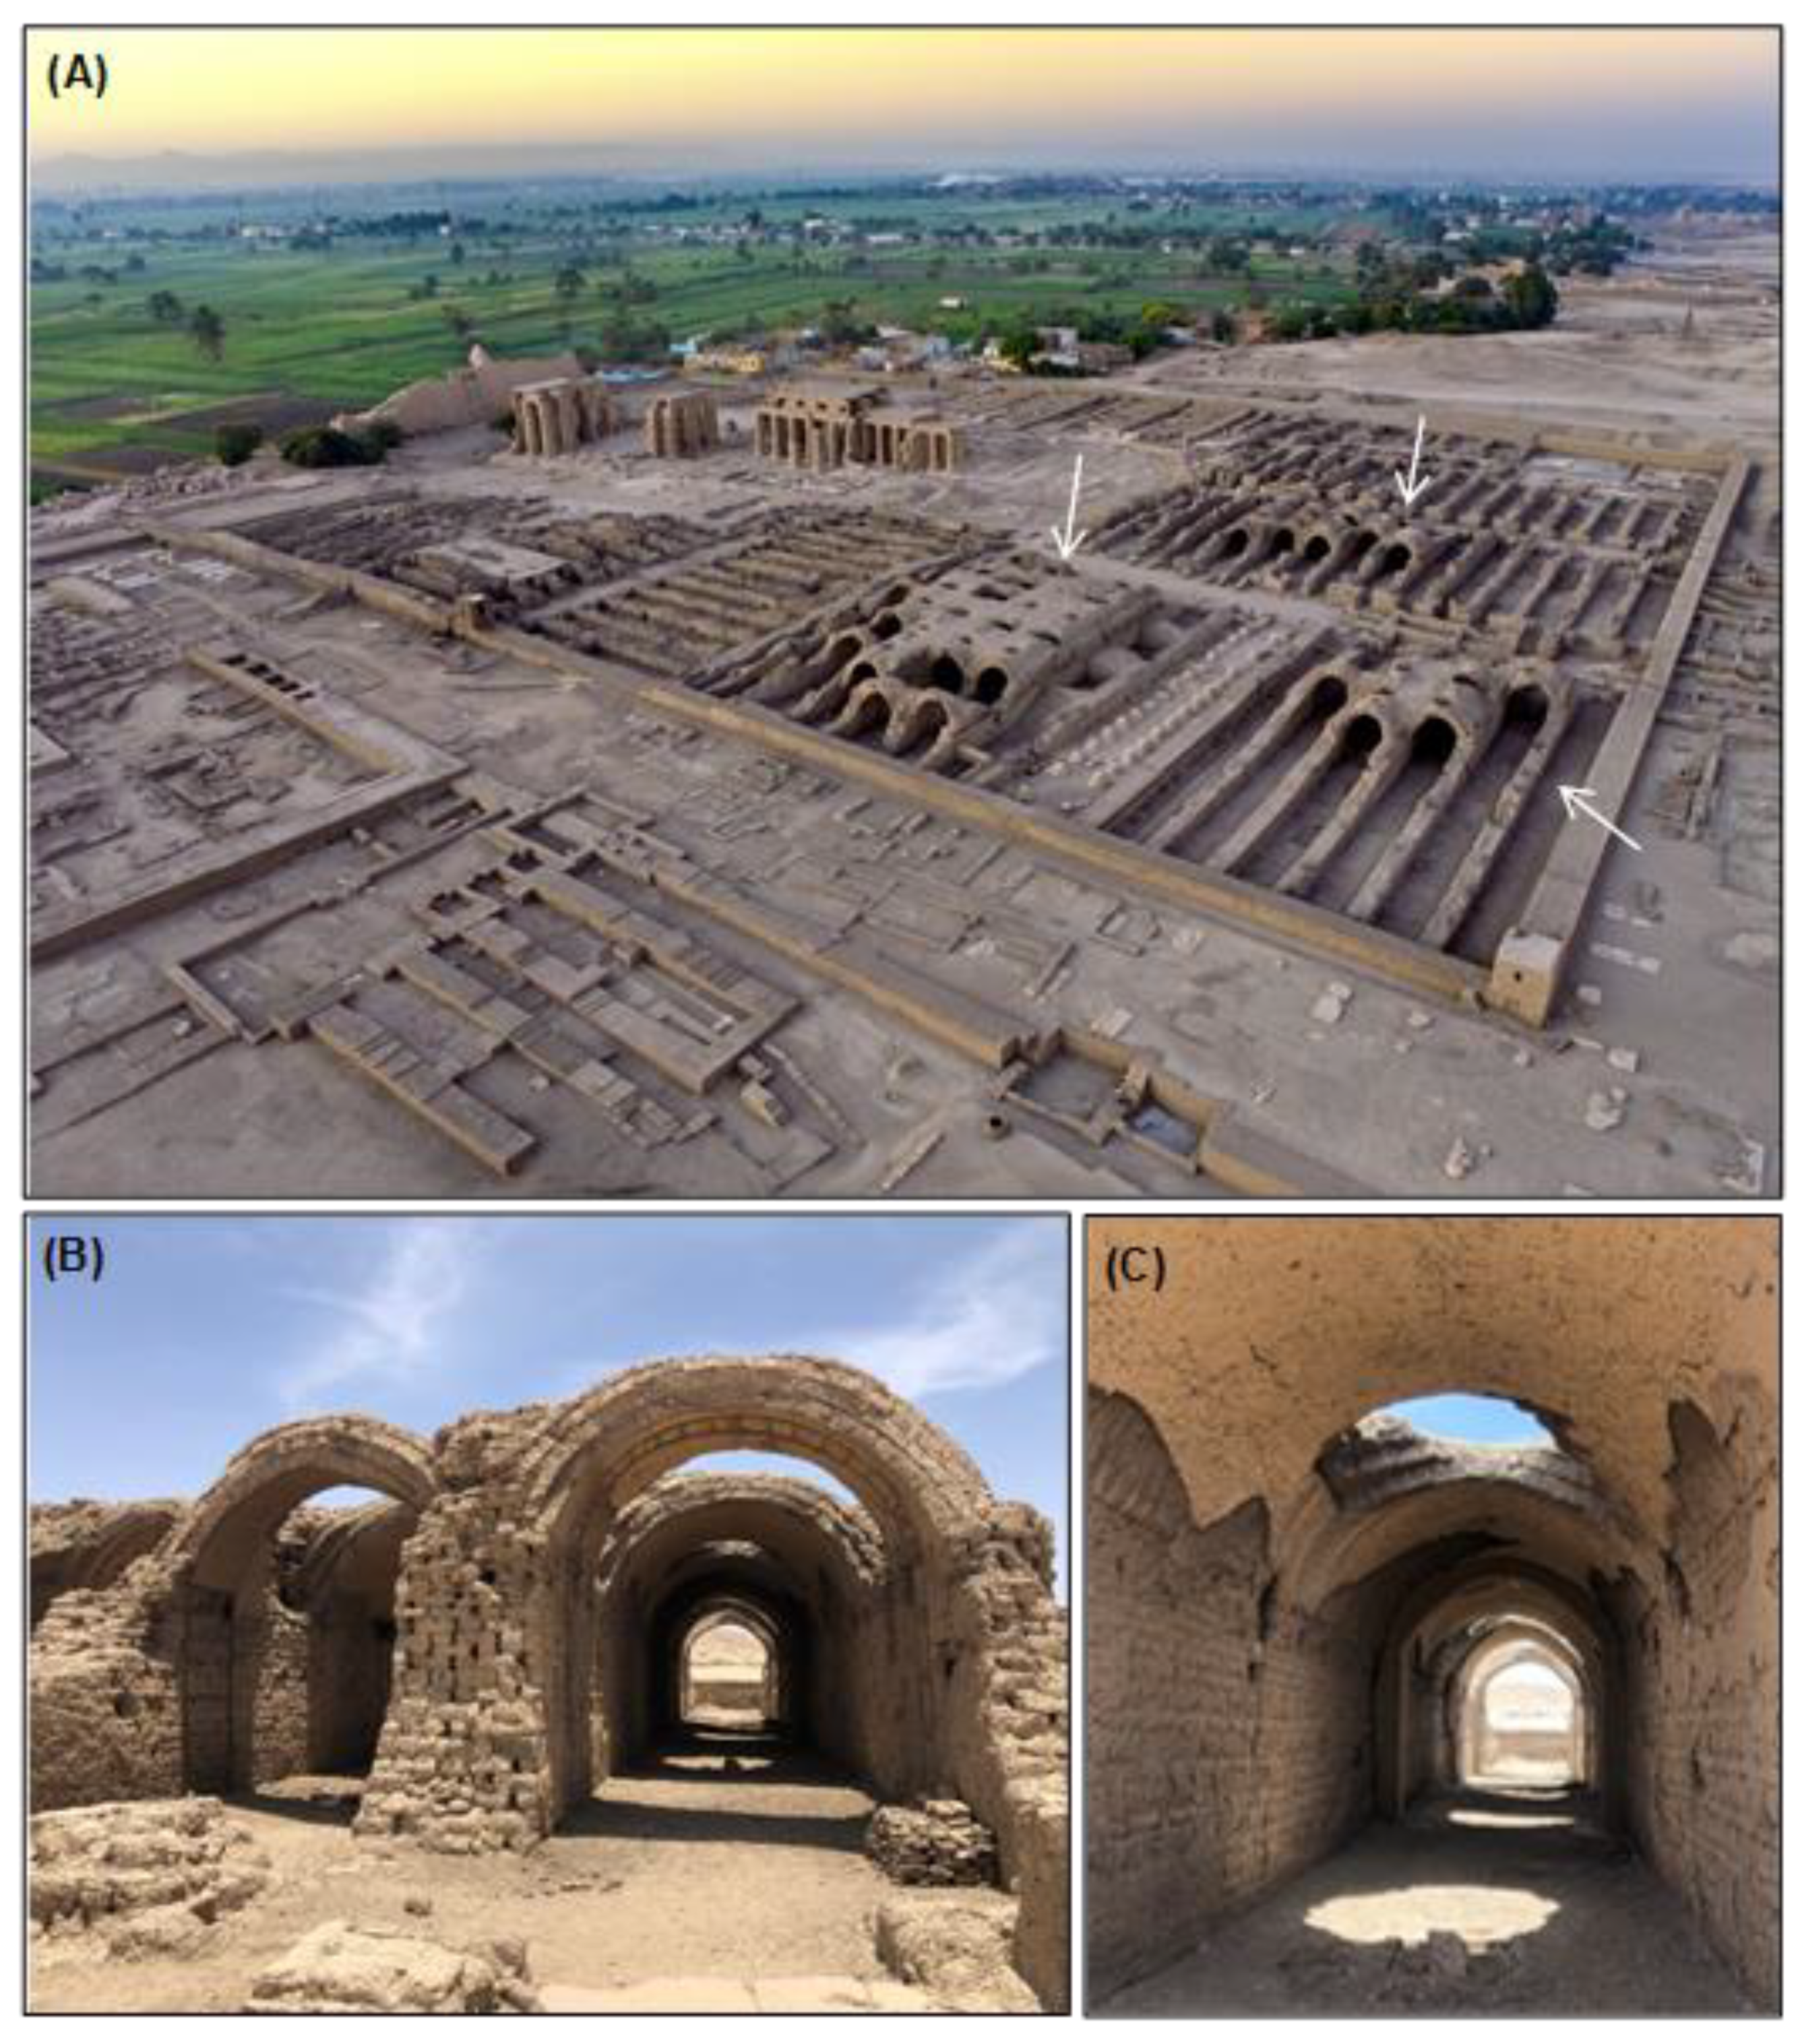
From the buried structures uncovered in the eastern sector of the archaeological mound, the clearest installations that materialized were three long, narrow rectangular structures with a general east-west orientation (Figure 7). As seen in Figure 7, a rectilinear structure, named by the author “Installation A”, is approximately 30 m long and 17.5 m wide and comprises six largely symmetrical rooms, which are each around 5–6 m wide. This rectangular installation also appeared to have a symmetrical sister structure immediately south of it (Installation B). The sister installation was not as well defined as Installation A, as only four of the six rooms could be easily delineated from the linear cropmarks. To the immediate west of Installations A and B is the analogous Installation C, which is roughly the same length and width (~28–29 m by 17.5 m) of the other two and comprises five rooms/galleries instead of six. While the purpose or function of these newly detected structures is undetermined, they are evocative of a few comparable installations found at other sites in Egypt. At first glance, the structures look increasingly like Pharaonic storerooms. These long, narrow storage installations, similar to Installations A–C, were found in connection with a number of mortuary temples and palaces of the New Kingdom Period (c. 1550–1069 BCE). Specifically, this new architectural form (in association with temples) can be seen at the mortuary temple of Ay/Horemheb, the Ramesseum, Medinet Habu, Amenhotep III’s palace at Malkata, and the Temple of Seti I at Abydos, in addition to several other temples in Egypt and Nubia [52]. Typically, these standardized magazines were very thick-walled to support the unbaked mudbrick arched roofing [53,54]. A variety of commodities necessary for temple rituals and services were housed in these structures, including perishable foodstuffs such as wine, oils, honey, grain, and incense [55]. Today, the Ramesseum is one of the only (and best) preserved examples of such architecture—the mortuary temple of Pharoah Ramesses II includes numerous mudbrick storage magazines with partially preserved arched roofs (Figure 8).
In terms of the storage-like structures found at Hermopolis, the high-water table of the site leads one to believe that they are most likely later period installations, since most Pharaonic period structures (pre-New Kingdom), especially in the southeastern section of the site, are under the current water table [32]. Nonetheless, the increasingly elongated nature of the rooms points to these structures probably having some storage functionality, potentially relating to or associated with the network of buildings (e.g., installations D–F, more later) found to the immediate west of the three installations.
In terms of potential dating, these storage-like structures could be New Kingdom storage magazines up to Roman horrea, based on what is known about the architectural style and the fact that nearly all pre-New Kingdom (pre-1550 BCE) structures are destroyed at the site. However, the architectural style of the Hermopolis storage installations is most comparable in layout to those found at the Ramesseum, a New Kingdom period temple complex. The particular storerooms found at the Ramesseum feature congruent and symmetrical sets of vertical storage rooms (each room with a width of around 4.5–6 m) facing one another, similar to the plan of Installations A and B at Hermopolis. It is important to note that this is all careful speculation; excavations would be needed to definitively confirm the purpose of these structures (and their period of origin).
In addition, a number of new linear features were also detected directly adjacent to Installations A–C. Of interest are three large rectilinear structures, which have been named “Installations D, E, and F” (Figure 7). Installation D is very closely located to Installation C, with their walls nearly touching. Only part of the structure can be outlined—on the eastern/western sides only fragments remain (~5 m), while the southern side is completely undetected. The top of the structure, however, is clearly defined and is approximately 18 m long, in total. A wall runs down the middle of the building, dividing it into two identical sections of 9 m each. To the south of Installation C is a medium sized rectilinear structure (Installation E) partitioned into three disproportional zones. The structure itself is around 28 m long and 15 m wide, with three sections divided as follows: 3.5 m, 17 m, and 7.5 m wide. Immediately south to Installation E is another partially detected rectangular feature, Installation F. The northern façade of this feature is missing the center way but is, in total, approximately 18 m long. The IPVI picked up more of the eastern segment of the structure, while only a small portion of the western section was identified. Around Installation F, there appears to be a wall encompassing much of the structure. Identifying this construction as a small enclosure wall for Installation F or an earlier (or later) structure built on/around Installation F would be possible, but for now unreasonable without some geophysical surveying or excavation. On the Deutschen Hermopolis-Expedition mission’s final map of the sacred temple precinct, Günther Roeder, the director of the project, sketched a portion of the fragmentary building in the area in question [56]. There were no notes as to whether the expedition excavated this structure (highly unlikely) or if this was simply a structure seen above the surface (most likely). This finding is promising, as it corroborates that the eastern quarter of the tell did indeed have some ancient human building activity, be it domestic or industrial in nature. Ultimately, this is a form of validation for the results derived from the remotely sensed analysis of the site.
While the Normalized Difference Vegetation Index (NDVI) is the most common spectral index used for archaeological prospection [57], through the present study it was found that the Infrared Percentage Vegetation Index (IPVI) was the most effective vegetation index for exploring the site of Hermopolis, specifically. In this case, the different parameters present at Hermopolis were simply much more receptive to the IPVI than to the NDVI or GNDVI, demonstrating that certain vegetation indices are more conducive to particular sites. This may be explained by the type of plant growth, as spectral signatures derived from terrestrial photosynthetic activity differ greatly depending on the type and density of the vegetation.

5.2.2. Spectral Analysis of Iron Oxide

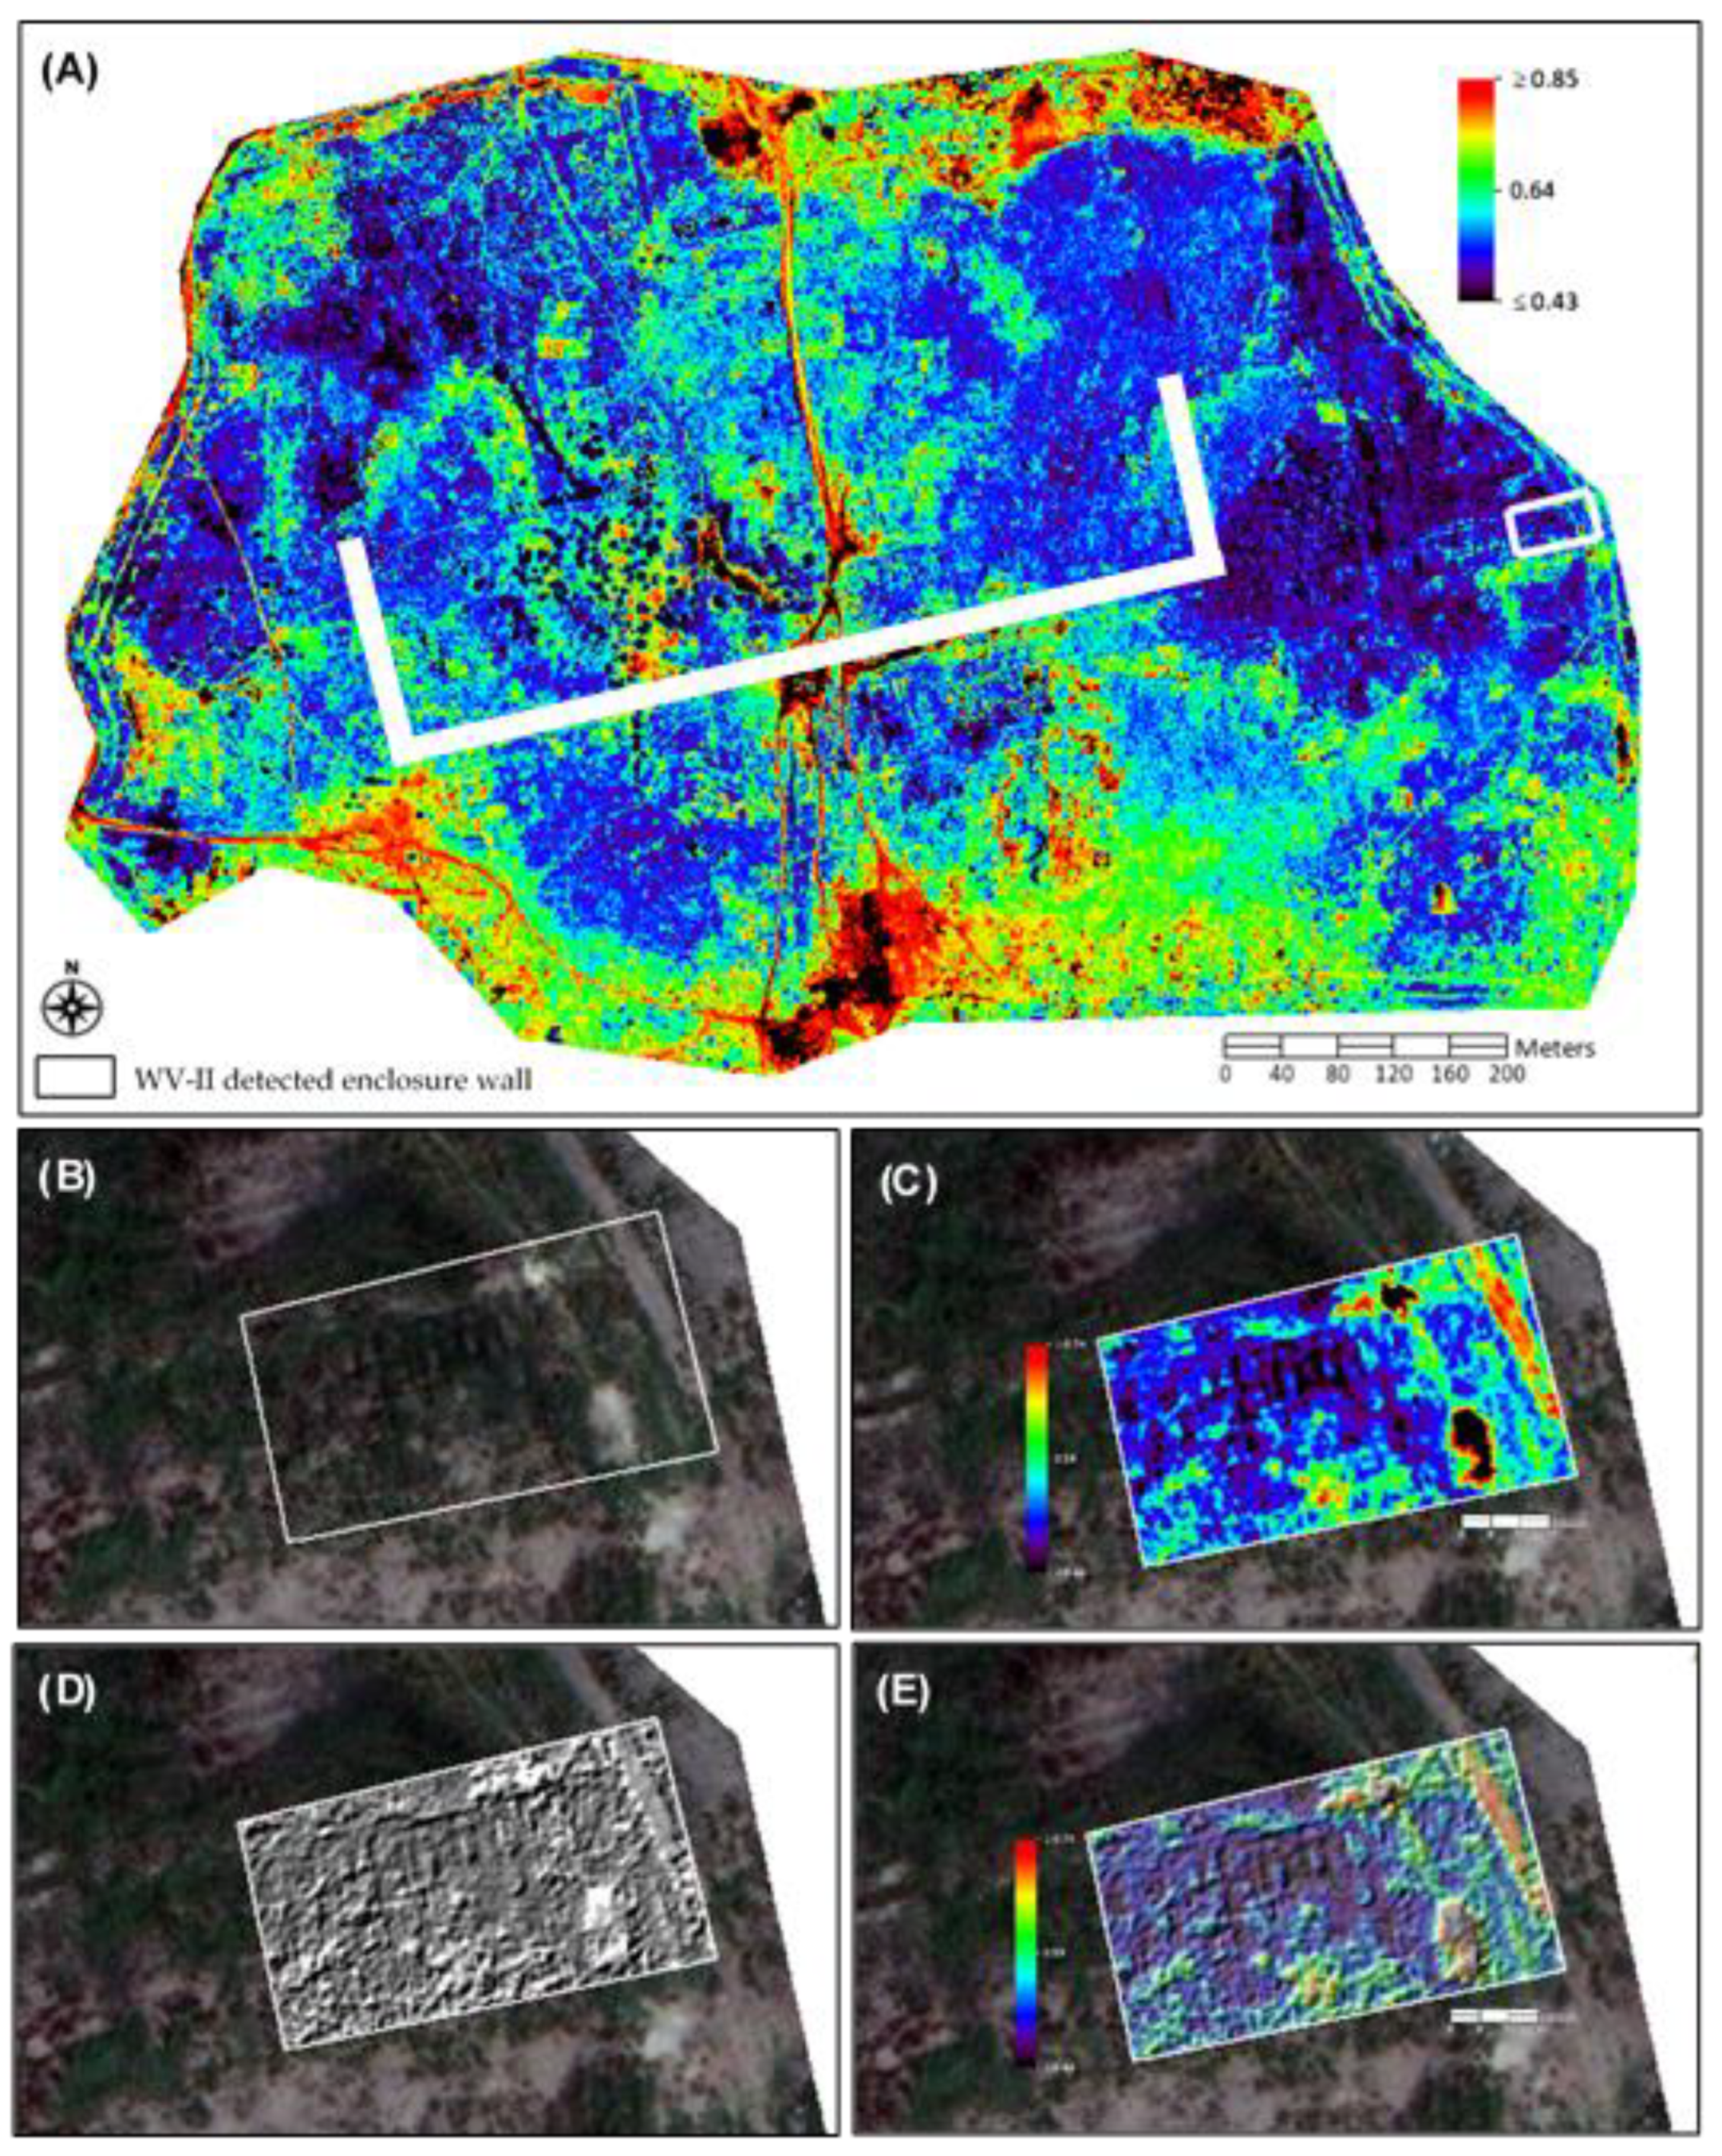
By using the WV-II index, large sections of the ancient city’s known temple enclosure wall were identified (Figure 9). This mudbrick wall, which is over 14 m wide and 2000 m long, once encircled the sacred temple precinct of the ancient city. Originally constructed during Dynasty 19, the monumental enclosure was later enlarged in Dynasty 30 [31]. This expansion is supported by an inscription of Pharoah Nectanebo I on a stela found at the site, which details the enlargement of the mudbrick wall as well as the whole sacred complex within the wall [33]. While the full extent of the Dynasty 30 wall has been mostly identified by archaeological work from previous excavations, the WV-II image was able to recognize it rapidly and clearly. In the derived WV-II image, the 14 m wide wall displays high WV-II values, demonstrating medium to high iron oxide content (Figure 9). The on-ground validation of the wall by other missions is important in that it confirms the effectiveness of remote sensing, especially the use of mineral indices, for archaeological prospection.
Additionally, through the use of the WV-II index, a clearly delineated structure (named “Installation G”) located directly underneath the east-west Antinoe Street was uncovered (Figure 9). Installation G is approximately 20 by 24 m and has well-defined north, east, and west walls. Found in the interior are void-like areas, which may have been rooms or chambers. In the final WV-II image, the outline of the structure exhibits much lower WV-II index values (~0.44) than the surrounding area, which indicates the low content or absence of iron oxide. Unlike the enclosure wall, which was mapped due to the high levels of iron-oxide detected, Installation G was identified because of its low levels of the compound. This is an instance in which the patterns of absence (versus just presence) are as effective in the detection of a hidden feature. It should be noted that the walls of Installation G are most likely constructed out of mudbrick, even though it appears to be negative for iron oxide. Segments of the structure appear in two different indices, the IPVI and WV-II. In IPVI, the walls can be delineated due to the lush, healthy vegetation growing atop it, which is indicative of a mudbrick construction. On the other hand, in WV-II, due to the obscurement of the high vegetation coverage, the analysis shows a very low component of iron oxide—a negative signal versus the surrounding area.
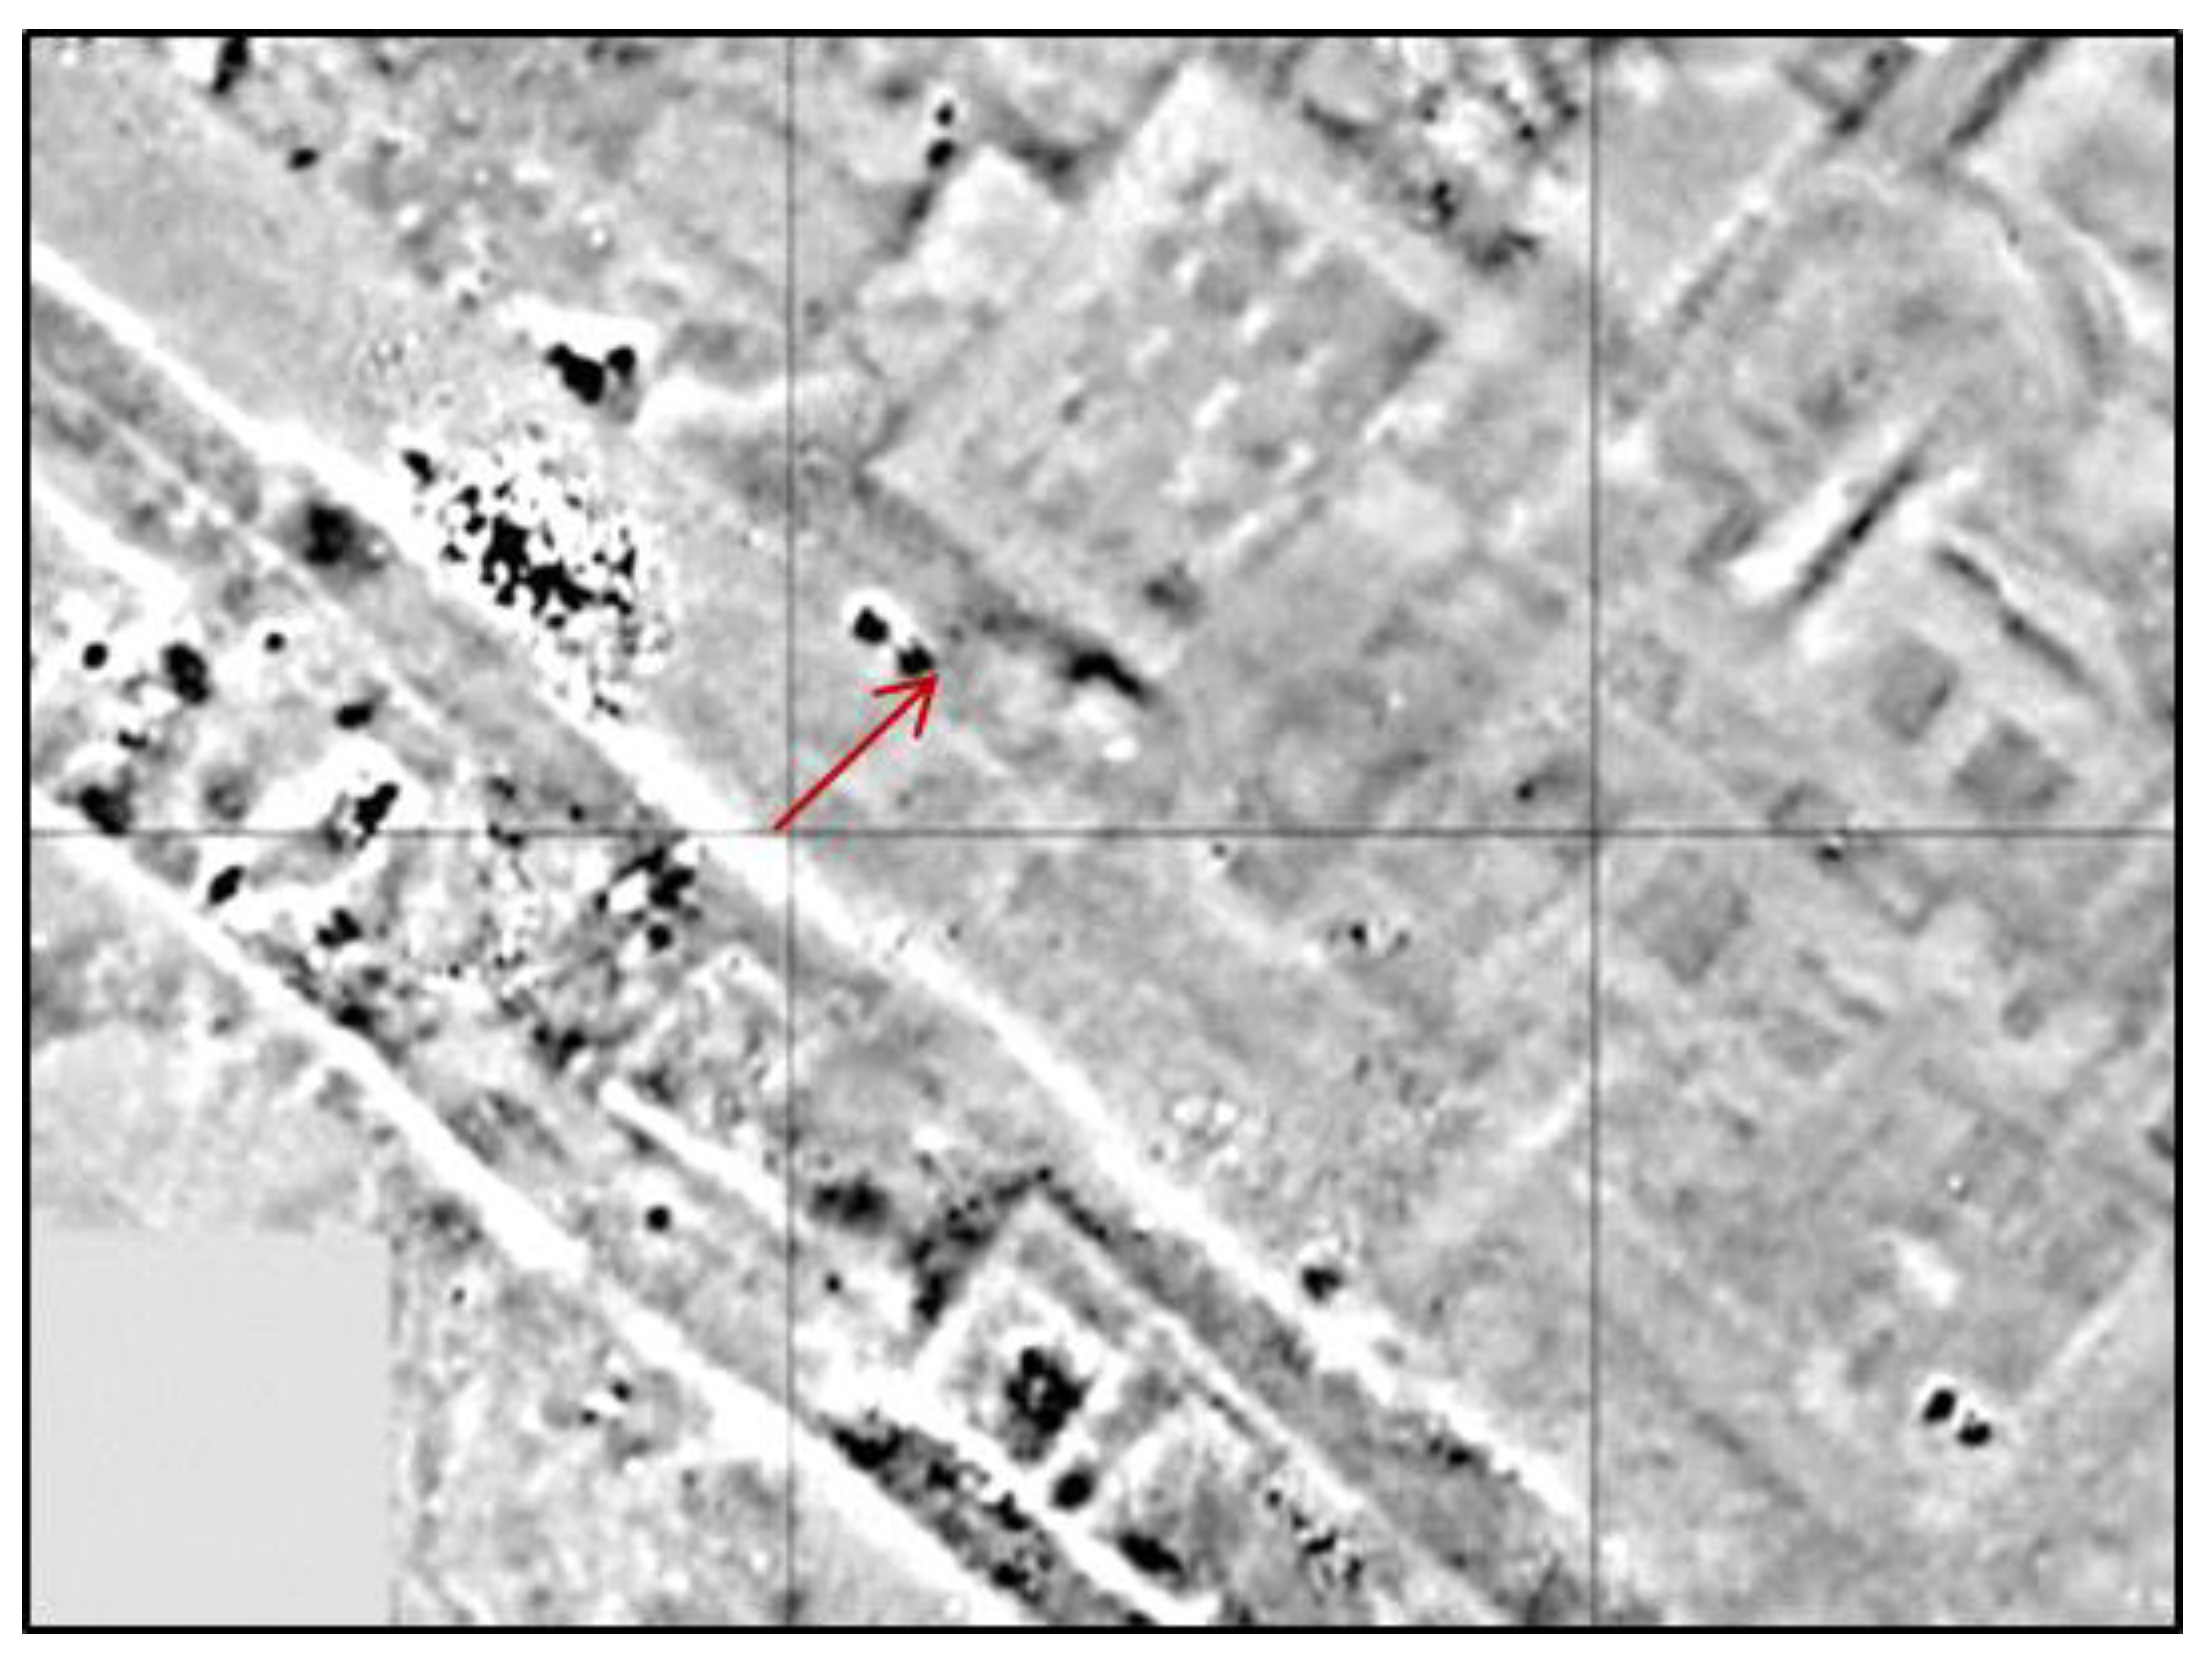
While conclusions on the function or purpose of this installation cannot be made merely through the use of remote sensing analysis, two architecturally similar structures to Installation G can be found at Tell el-Balamun (northeastern Nile Delta; Figure 10). The two structures at Tell el-Balamun were identified as Saite period casemate-type buildings (one very large and one smaller) with numerous chambers compacted between thick divisions/walls [58,59]. Traditionally, casemate foundations usually have numerous chambers or cells that are filled with sand, earth, brick, or rubble [60]. It is important to mention a theory that the casemate structures at Tell el-Balamun were, in fact, military forts used during the Saite Period (664-525 BCE), but for now this is simply speculation [58]. Likewise, at the site of Naukratis (western Nile Delta), there is a comparable casemate building (termed the “Great Mound”) located inside the southern half of the Great Temenos. This building, like Installation G at Hermopolis, comprises numerous cells or what are described as forty-one deep vertical “chambers” [61]. Most of the cells were filled solid with mudbricks, while others were filled with rubble from masons’ shops. Considering that cellular or casemate constructions were common ancient Egyptian building styles, which were not limited to military use [61], it is therefore difficult to deduce the function of Installation G as having military, domestic, or administrative purposes solely based on the presences of the cells/chambers.
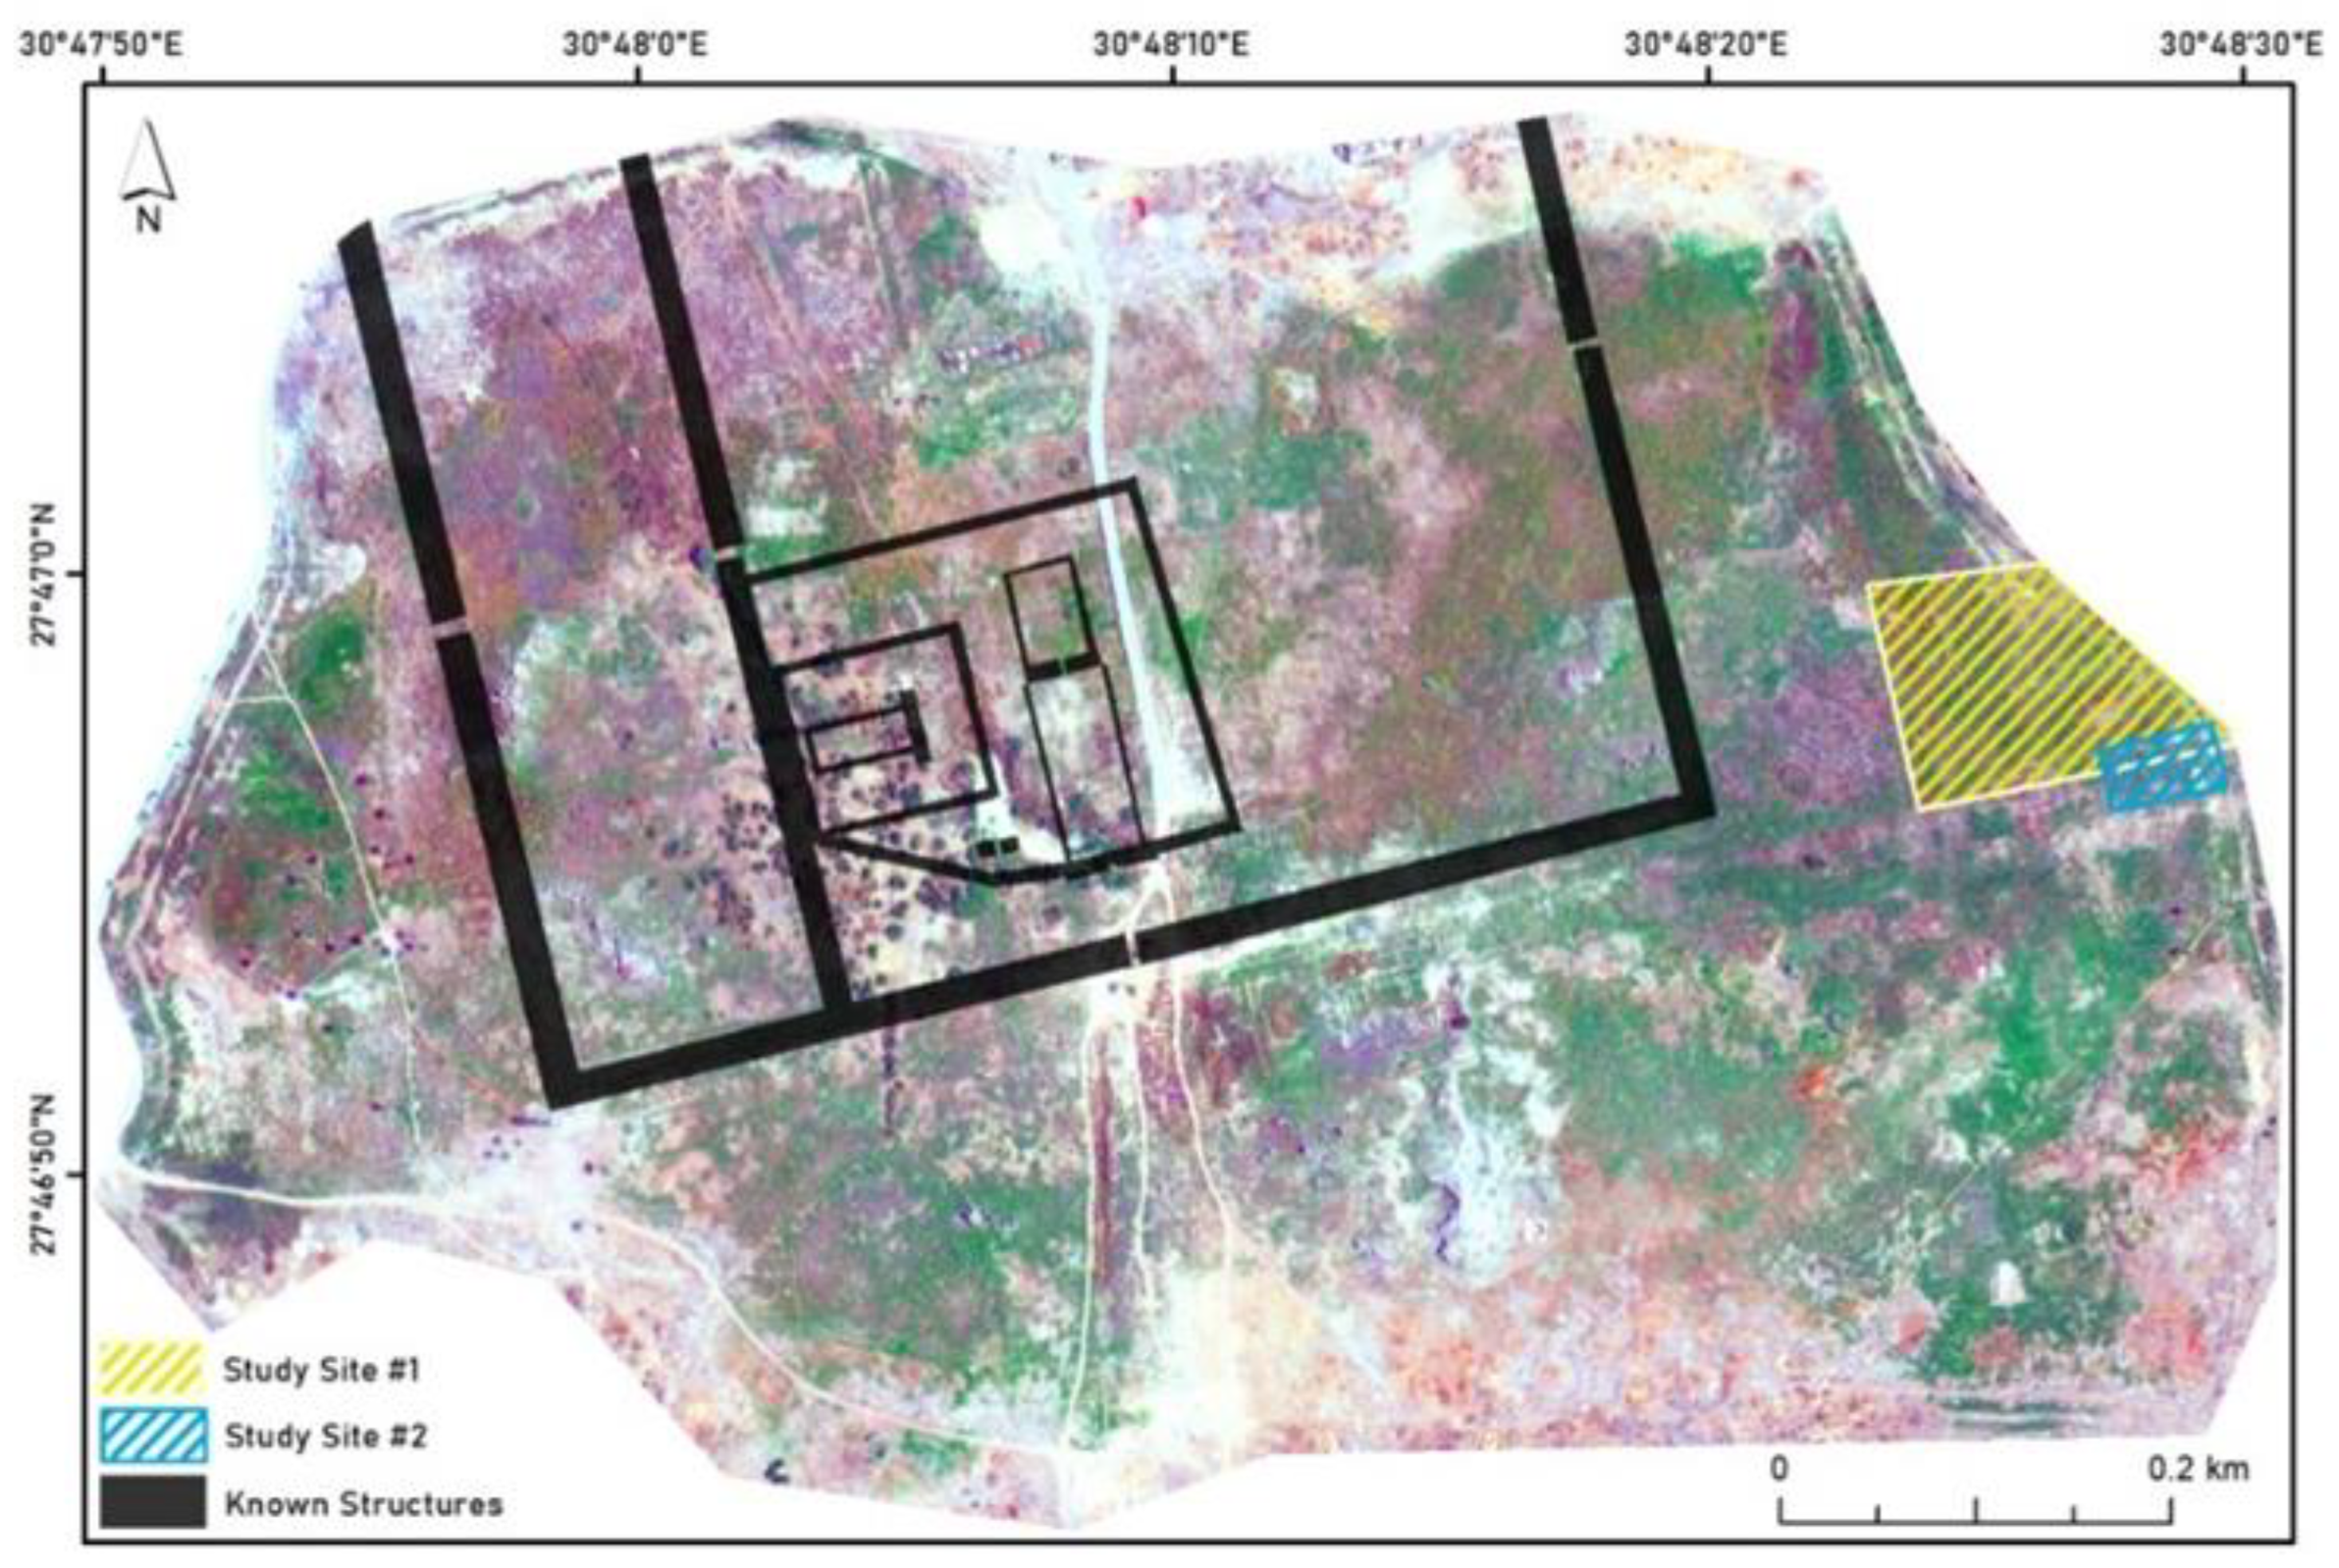
For the purpose of validation, a map with the previously detected structures from earlier archaeological excavations of the site [32] was georeferenced and digitized in ArcGIS (Figure 11). A clear match was found between the digitized (known) lower part of the wall and those detected by remote sensing (IPVI and WV-II). From this map, it is apparent that the newly identified structures in the eastern section of Hermopolis were previously unmapped by earlier projects and are located outside the excavated areas of the site.

5.3. Creation of 3D Model

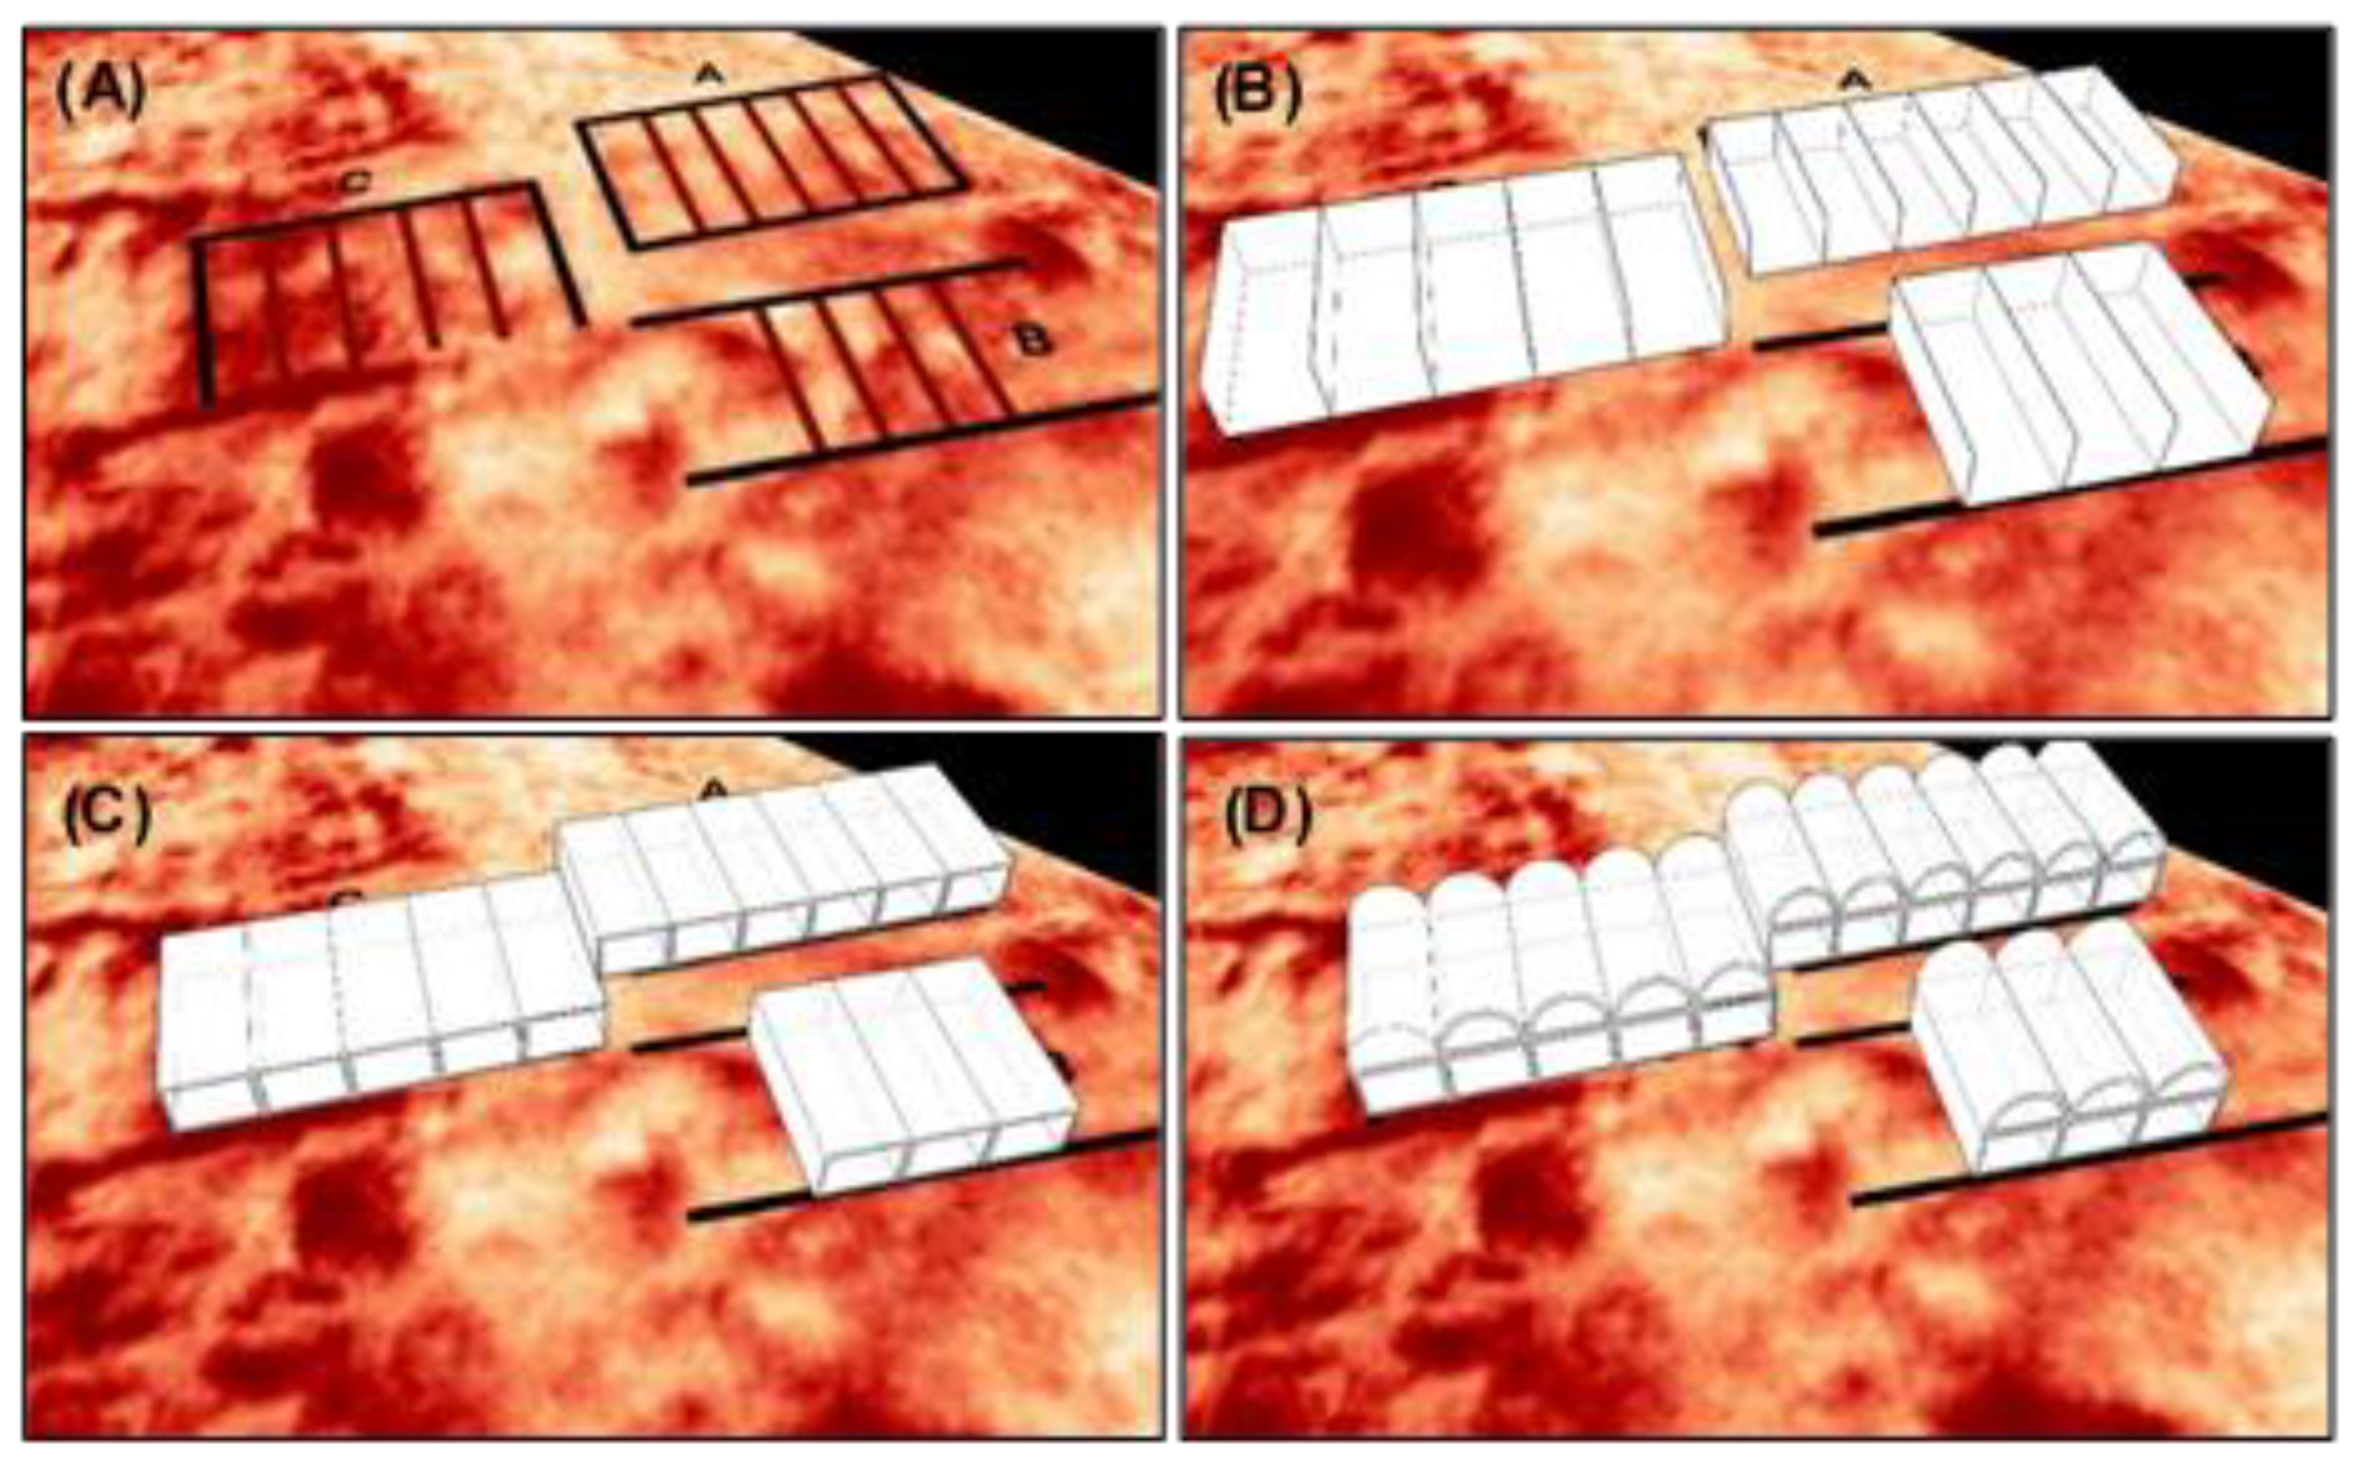
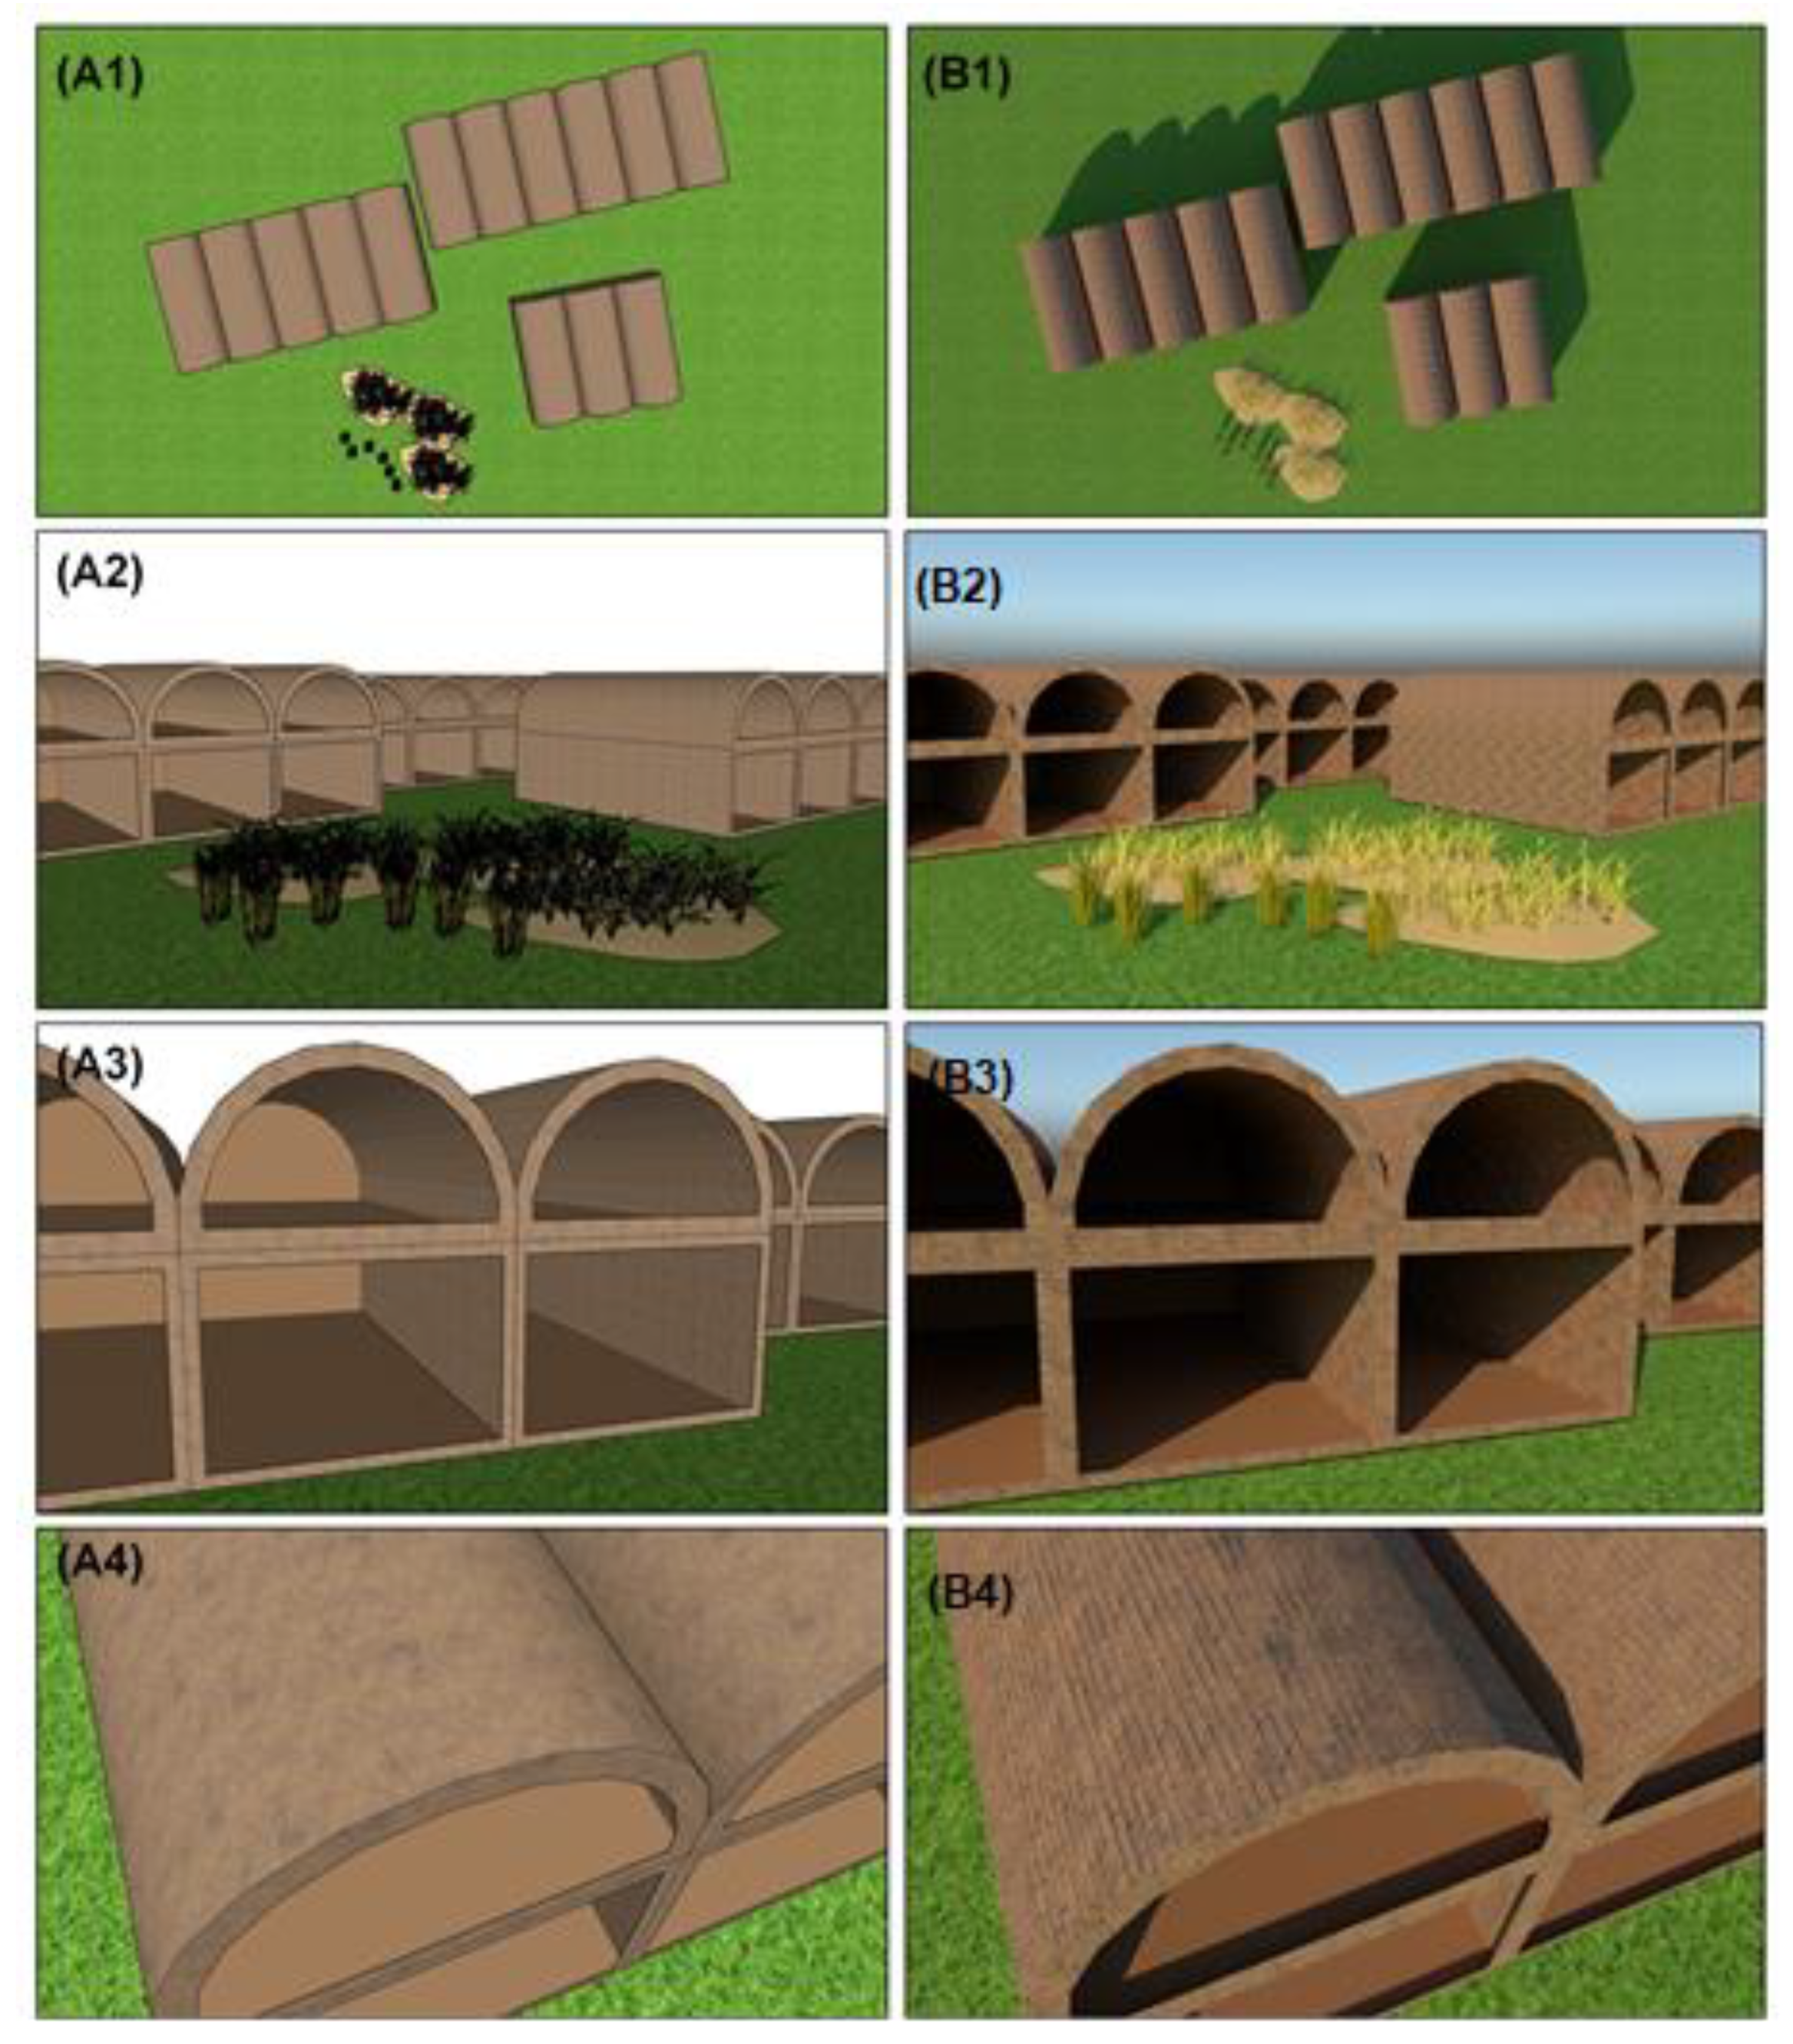
To make the results more understandable, the linear vegetation marks of the best-preserved structures, Installations A–C, were expanded into a 3D model. Figure 12 shows the evolution of the model, from a simple 2D outline of the walls of the buildings, to a rectangular closed structure, and lastly, to a completed Pharaonic storeroom with barrel vault ceilings, as seen at the Ramesseum. To ensure the most accurate and realistic rendering of Installations A–C, textures and materials that imitate those used for ancient Egyptian construction were mapped onto the model (Figure 13). A sun-dried mudbrick material that included small vegetal and non-vegetal inclusions was used for the exterior of the buildings (Figure 8).
The mudbricks used in ancient Egypt were largely fabricated with clay and mud obtained from riverine silts and sediments deposited by the Nile River. Vegetal binding materials, such as rice chaff or chopped straw, were also added to the clay and mud concoction [62,63]. The importance of these two extraneous tempers can be seen by a New Kingdom model letter in which there was an official complaint about the lack of local straw for making mudbrick [47]. Miscellaneous ingredients such as sand, ash, sherds, animal dung, and fragments from stone working have also been detected in ancient mudbricks [47]. On the other hand, for the inside of the structure, including the top and bottom floors, a lighter compressed dirt/clay material with small vegetal aggregates and inclusions was used (Figure 8). The ancient Egyptians are known to have used a natural clay substance, akin to mortar, to hold together the unfired mudbricks [64]. When rendered in Chaos V-Ray, these above-mentioned materials were transformed into 3D textures with significant depth (Figure 13). The key goal of expanding the remotely sensed structures to a georeferenced 3D model was to make such scientific results more understandable to the general public. In addition, it is meant to demonstrate how remote sensing can have a multifaceted outcome—from first seeing nothing from the raw satellite image, to uncovering possible structures using spectral indices, and finally rendering them into a more tangible format in the third dimension.

6. Conclusions

Throughout the world, archaeological sites are under the direct threat of damage or destruction due to developing environmental and anthropogenic hazards, such as rapid urban intrusion. In many cases, these sites have either never been excavated or have only been partially explored by archaeologists. With the damage of such sites, a remarkable quantity of valuable archaeological information is permanently lost. The recent use of earth observation data for rapid archaeological prospection and digital preservation, however, has begun to change this. The present study reveals one of the many ways in which remote sensing techniques, particularly spectral indices, can help “virtually” explore a large swath of an endangered site. At Hermopolis, the spectral-enhancement indices assessing vegetation health (IPVI) and iron oxide presence (WV-II) were able to uncover more than seven unmapped urban features. A number of promising structures were identified based on this analysis, including three elongated installations, which may have been utilized for storage purposes, and a potential casemate foundation structure. In order to make the 2D results more perceptible and immersive, 3D technologies were utilized to create a realistic visual reconstruction of the best-preserved structures, the storage-like installations. Three-dimensional reconstructions have profound implications for ensuring that humankind’s cultural heritage remains in the collective memory of both present and future generations.
As a validation tool, the layouts of previously mapped and/or excavated areas, such as the Dynasty 30 temple enclosure wall, were confirmed by means of the same aforementioned remote sensing processing techniques. However, considering that remote sensing is merely an exploratory tool, the plethora of linear and rectilinear features detected through this study warrant future exploration (e.g., archaeological excavations and/or geophysical survey). The results derived from this remotely sensed data will greatly assist those conducting future excavation or geophysical work at Hermopolis, as a previously unknown urban sector of the site has now been uncovered. It should be noted that the methodological scheme presented in this article is highly adaptable and with some minor modifications can be replicated on other archaeological sites, with similar environmental parameters as that of Hermopolis. As the archaeological remains of Hermopolis and other sites around the world continually come under threat from inordinate population growth and the rising water table, immediate attention should be given to rapidly exploring and mapping these highly vulnerable sites.

Funding

This research was partially funded by the Helen Rich Memorial Fund of the Oriental Institute of the University of Chicago.

Acknowledgments

The author would like to acknowledge the Helen Rich Memorial Fund for funding the purchase of the WorldView-3 satellite imagery and for covering the article publication fee. Special thanks are given to Nadine Moeller (Yale University) for her guidance and support during the duration of the research. The author would also like to express her gratefulness to David Schloen (University of Chicago) and Gregory Marouard (Yale University) for their consultation on this project. Lastly, thanks are given to Luiza Da Silva (University of Chicago) for her assistance in editing the early form of this manuscript.

Conflicts of Interest

The author declares no conflict of interest. The funders had no role in the design of the study; in the collection, analyses, or interpretation of data; in the writing of the manuscript, or in the decision to publish the results.

References

  1. Hillier, J.K.; Bunbury, J.M.; Graham, A. Monuments on a migrating Nile. J. Archaeol. Sci. 2007, 34, 1011–1015. [Google Scholar] [CrossRef] [Green Version]
  2. Parcak, S.H. Satellite Remote Sensing for Archaeology; Routledge: New York, NY, USA, 2009. [Google Scholar]
  3. Orengo, H.A.; Conesa, F.C.; Garcia-Molsosa, A.; Lobo, A.; Green, A.S.; Madella, M.; Petrie, C.A. Automated detection of archaeological mounds using machine-learning classification of multisensor and multitemporal satellite data. Proc. Natl. Acad. Sci. USA 2020, 117, 18240–18250. [Google Scholar] [CrossRef]
  4. Stubbs, J.H.; McKee, K.L. Applications of Remote Sensing to the Understanding and Management of Cultural Heritage Sites. In Remote Sensing in Archaeology; Wiseman, J., El-Baz, F., Eds.; Springer: New York, NY, USA, 2006; pp. 515–540. [Google Scholar]
  5. Agapiou, A.; Lysandrou, V.; Alexakis, D.; Themistocleous, K.; Cuca, B.; Argyriou, A.; Sarris, A.; Hadjimitsis, D. Cultural heritage management and monitoring using remote sensing data and GIS: The case study of Paphos area, Cyprus. Comput. Environ. Urban Syst. 2015, 54, 230–239. [Google Scholar] [CrossRef]
  6. El-Behaedi, R.; Ghoneim, E. Flood risk assessment of the Abu Simbel temple complex (Egypt) based on high-resolution spaceborne stereo imagery. J. Archaeol. Sci. Rep. 2018, 20, 458–467. [Google Scholar] [CrossRef]
  7. Keay, S.J.; Parcak, S.H.; Strutt, K.D. High resolution space and ground-based remote sensing and implications for landscape archaeology: The case from Portus, Italy. J. Archaeol. Sci. 2014, 52, 277–292. [Google Scholar] [CrossRef]
  8. Plekhov, D.; Gosner, L.R.; Smith, A.J.; Nowlin, J. Applications of Satellite Remote Sensing for Archaeological Survey: A Case Study from the Sinis Archaeological Project, Sardinia. Adv. Archaeol. Pr. 2020, 8, 192–205. [Google Scholar] [CrossRef]
  9. Goossens, R.; De Wulf, A.; Bourgeois, J.; Gheyle, W.; Willems, T. Satellite imagery and archaeology: The example of CORONA in the Altai Mountains. J. Archaeol. Sci. 2006, 33, 745–755. [Google Scholar] [CrossRef]
  10. Casana, J.; Cothren, J. Stereo analysis, DEM extraction and orthorectification of CORONA satellite imagery: Archaeological applications from the Near East. Antiquity 2008, 82, 732–749. [Google Scholar] [CrossRef] [Green Version]
  11. Parcak, S.; Tuttle, C.A.; Tuttle, S.P.A. Hiding in Plain Sight: The Discovery of a New Monumental Structure at Petra, Jordan, Using WorldView-1 and WorldView-2 Satellite Imagery. Bull. Am. Sch. Orient. Res. 2016, 375, 35–51. [Google Scholar] [CrossRef]
  12. Hammer, E.; Ur, J. Near Eastern Landscapes and Declassified U2 Aerial Imagery. Adv. Archaeol. Pr. 2019, 7, 107–126. [Google Scholar] [CrossRef] [Green Version]
  13. Gabellone, F.; Lanorte, A.; Masini, N.; Lasaponara, R. From remote sensing to a serious game: Digital reconstruction of an abandoned medieval village in Southern Italy. J. Cult. Heritage 2017, 23, 63–70. [Google Scholar] [CrossRef]
  14. Bennett, R.; Welham, K.; Hill, R.A.; Ford, A.L.J. The Application of Vegetation Indices for the Prospection of Archaeological Features in Grass-dominated Environments. Archaeol. Prospect. 2012, 19, 209–218. [Google Scholar] [CrossRef]
  15. Gitelson, A.A.; Merzlyak, M.N. Remote sensing of chlorophyll concentration in higher plant leaves. Adv. Space Res. 1998, 22, 689–692. [Google Scholar] [CrossRef]
  16. Xue, J.; Su, B. Significant Remote Sensing Vegetation Indices: A Review of Developments and Applications. J. Sens. 2017, 2017, 1–17. [Google Scholar] [CrossRef] [Green Version]
  17. Lasaponara, R.; Masini, N. Detection of archaeological crop marks by using satellite QuickBird multispectral imagery. J. Archaeol. Sci. 2007, 34, 214–221. [Google Scholar] [CrossRef]
  18. Zanni, S.; De Rosa, A. Remote Sensing Analyses on Sentinel-2 Images: Looking for Roman Roads in Srem Region (Serbia). Geosciences 2019, 9, 25. [Google Scholar] [CrossRef] [Green Version]
  19. Ullmann, T.; Nill, L.; Schiestl, R.; Trappe, J.; Lange-Athinodorou, E.; Baumhauer, R.; Meister, J. Mapping buried paleogeographical features of the Nile Delta (Egypt) using the Landsat archive. EG Quat. Sci. J. 2020, 69, 225–245. [Google Scholar] [CrossRef]
  20. De Laet, V.; Paulissen, E.; Waelkens, M. Methods for the extraction of archaeological features from very high-resolution Ikonos-2 remote sensing imagery, Hisar (southwest Turkey). J. Archaeol. Sci. 2007, 34, 830–841. [Google Scholar] [CrossRef]
  21. Agapiou, A.; Lysandrou, V.; Lasaponara, R.; Masini, N.; Hadjimitsis, D.G. Study of the Variations of Archaeological Marks at Neolithic Site of Lucera, Italy Using High-Resolution Multispectral Datasets. Remote Sens. 2016, 8, 723. [Google Scholar] [CrossRef] [Green Version]
  22. Ercek, R.; Viviers, D.; Warzée, N. 3D reconstruction and digitalization of an archeological site, Itanos, Crete. Virtual Archaeol. Rev. 2010, 1, 81–85. [Google Scholar] [CrossRef] [Green Version]
  23. Guidi, G.; Russo, M.; Angheleddu, D. 3D survey and virtual reconstruction of archeological sites. Digit. Appl. Archaeol. Cult. Heritage 2014, 1, 55–69. [Google Scholar] [CrossRef]
  24. Brůha, L.; Laštovička, J.; Palatý, T.; Štefanová, E.; Štych, P. Reconstruction of Lost Cultural Heritage Sites and Landscapes: Context of Ancient Objects in Time and Space. ISPRS Int. J. Geo-Inf. 2020, 9, 604. [Google Scholar] [CrossRef]
  25. Groen, I.I.; Baker, C.I. Scenes in the Human Brain: Comparing 2D versus 3D Representations. Neuron 2019, 101, 8–10. [Google Scholar] [CrossRef] [PubMed] [Green Version]
  26. Valenti, R.; Paternò, E. 3D Integrated Survey for the Study of Archaeological Sites: The Case Study of Euryalus Castle in Siracusa. IOP Conf. Ser. Earth Environ. Sci. 2021, 767, 012015. [Google Scholar] [CrossRef]
  27. Dawn, S.; Biswas, P. Technologies and Methods for 3D Reconstruction in Archaeology. Commun. Comput. Inf. Sci. 2019, 968, 443–453. [Google Scholar] [CrossRef]
  28. Aly, Z. A Propos of a Greek Inscription from Hermopolis Magna. Annu. Br. Sch. Athens 1951, 46, 219–231. [Google Scholar] [CrossRef]
  29. Nasser, M. The Path to the New Hermopolis: The History, Philosophy, and Future of the City of Hermes; Rubedo Press: Auckland, New Zealand, 2019. [Google Scholar]
  30. Ikram, S. Hermopolis Magna, Tuna-Gebel (Pharaonic). In The Encyclopedia of Ancient History; Bagnall, R.S., Brodersen, K., Champion, C., Erskine, A., Huebner, S., Eds.; Wiley-Blackwell: Hoboken, NJ, USA, 2013. [Google Scholar]
  31. Moeller, N. The Archaeology of Urbanism in Ancient Egypt: From the Predynastic Period to the End of the Middle Kingdom; Cambridge University Press: Cambridge, UK, 2016; pp. 216–217. [Google Scholar]
  32. Snape, S. The Complete Cities of Ancient Egypt; AUC Press: Cairo, Egypt, 2014; pp. 136–139, 164–165. [Google Scholar]
  33. Bard, K.A.; Shubert, S.B. el-Ashmunein. In Encyclopedia of the Archaeology of Ancient Egypt; Routledge: New York, NY, USA, 1999; pp. 167–171. [Google Scholar]
  34. El-Bayomi, G.; Ali, R. Assessment of Urban Sprawl on El Minya Archeological Sites, Egypt. J. Appl. Sci. 2015, 15, 264–270. [Google Scholar] [CrossRef]
  35. El-Sayed, S.; Atta, E.; Al-Ashri, K. Groundwater table rise in northwest Nile Delta: Problems and Recommendations. J. Radiat. Res. Appl. Sci. 2012, 15, 141–171. [Google Scholar]
  36. Bard, K. An Introduction to the Archaeology of Ancient Egypt, 2nd ed.; John Wiley & Sons: Hoboken, NJ, USA, 2015; pp. 55–56. [Google Scholar]
  37. Masseroni, D.; Ricart, S.; De Cartagena, F.R.; Monserrat, J.; Gonçalves, J.M.; De Lima, I.; Facchi, A.; Sali, G.; Gandolfi, C. Prospects for Improving Gravity-Fed Surface Irrigation Systems in Mediterranean European Contexts. Water 2017, 9, 20. [Google Scholar] [CrossRef] [Green Version]
  38. Ahmed, A.A.; Fogg, G.E. The impact of groundwater and agricultural expansion on the archaeological sites at Luxor, Egypt. J. Afr. Earth Sci. 2014, 95, 93–104. [Google Scholar] [CrossRef] [Green Version]
  39. Chavez, P.S., Jr.; Sides, S.C.; Anderson, J.A. Comparison of three different methods to merge multiresolution and multispectral data: Landsat TM and SPOT panchromatic. Photogramm. Eng. Remote Sens. 1991, 57, 295–303. [Google Scholar]
  40. Ghoneim, E.; Mashaly, J.; Gamble, D.; Halls, J.; AbuBakr, M. Nile Delta exhibited a spatial reversal in the rates of shoreline retreat on the Rosetta promontory comparing pre- and post-beach protection. Geomorphology 2015, 228, 1–14. [Google Scholar] [CrossRef]
  41. Ghoneim, E.M. Ibn-Batutah: A possible simple impact structure in southeastern Libya, a remote sensing study. Geomorphology 2009, 103, 341–350. [Google Scholar] [CrossRef]
  42. Boardman, J.W.; Kruse, F. Automatic Spectral Analysis: A Geological Example Using AVIRIS Data, North Grapevine Mountain, Nevada. In Proceedings of the 10th Thematic Conference on Geologic Remote Sensing, San Antonio, TX, USA, 9–12 May 1994; pp. 407–418. [Google Scholar]
  43. Stewart, C. Detection of Archaeological Residues in Vegetated Areas Using Satellite Synthetic Aperture Radar. Remote Sens. 2017, 9, 118. [Google Scholar] [CrossRef] [Green Version]
  44. Calleja, J.F.; Pagés, O.R.; Díaz-Álvarez, N.; Peón, J.; Gutiérrez, N.; Martín-Hernández, E.; Relea, A.C.; Melendi, D.R.; Álvarez, P.F. Detection of buried archaeological remains with the combined use of satellite multispectral data and UAV data. Int. J. Appl. Earth Obs. Geoinf. 2018, 73, 555–573. [Google Scholar] [CrossRef]
  45. Crippen, R. Calculating the vegetation index faster. Remote Sens. Environ. 1990, 34, 71–73. [Google Scholar] [CrossRef]
  46. Guo, W.; Li, D.; Watson, A. Directional filtering as a multi-purpose tool in image processing. In Proceedings of the 2001 International Conferences on Info-Tech and Info-Net. Proceedings (Cat. No.01EX479), Beijing, China, 29 October–1 November 2001; pp. 332–336. [Google Scholar]
  47. Nicholson, P.T.; Shaw, I. (Eds.) Including Mud-brick Architecture. In Ancient Egyptian Materials and Technology; Cambridge University Press: Cambridge, UK, 2009; pp. 78–103. [Google Scholar]
  48. Hool, G.A.; Johnson, N.C. Handbook of Building Construction: Data For Architects, Designing and Construction Engineers, and Contractors; Nabu Press: New York, NY, USA, 2010. [Google Scholar]
  49. Volta, B.; Levy, T.E.; Braswell, G. The virtual Chichén Itzá project: Modelling an ancient Maya city in Google SketchUp. Antiquity 2009, 83, 321. [Google Scholar]
  50. Douglass, M.J.; Day, Z.R.; Brunette, J.C.; Bleed, P.; Scott, D. Virtual Reconstruction as Archaeological Observation: Embracing New Ways of Treating Sites, Places and Landscapes. Adv. Archaeol. Pr. 2019, 7, 127–139. [Google Scholar] [CrossRef]
  51. Stewart, C.; Labrèche, G.; González, D. A Pilot Study on Remote Sensing and Citizen Science for Archaeological Prospection. Remote Sens. 2020, 12, 2795. [Google Scholar] [CrossRef]
  52. Manassa Darnell, C. Transition 18th–19th Dynasty. In UCLA Encyclopedia of Egyptology; Grajetzki, W., Wendrich, W., Eds.; UCLA Department of Near Eastern Languages and Cultures: Los Angeles, CA, USA, 2015; pp. 1–15. [Google Scholar]
  53. Lacovara, P. New Kingdom Royal City; Routledge: London, UK, 2013; pp. 44–45. [Google Scholar]
  54. El-Derby, A.A.; Elyamani, A. The Adobe Barrel Vaulted Structures in Ancient Egypt: A Study Of Two Case Studies For Conservation Purposes. Mediterr. Archaeol. Archaeom. 2016, 16, 295–315. [Google Scholar] [CrossRef]
  55. Lecuyot, G. The Ramesseum (Egypt): Recent Archaeological Research; CNRS: Paris, France, 2000; pp. 1–14. [Google Scholar]
  56. Roeder, G. Hermopolis 1929–1939: Ausgrabungen der Deutschen Hermopolis-Expedition in Hermopolis, Ober-Ägypten; Gerstenberg: Hildesheim, Germany, 1959. [Google Scholar]
  57. Lasaponara, R.; Masini, N. Identification of archaeological buried remains based on the normalized difference vegetation index (NDVI) from Quickbird satellite data. IEEE Geosci. Remote Sens. Lett. 2006, 3, 325–328. [Google Scholar] [CrossRef]
  58. Spencer, A.J. Excavations at Tell-Balamun, 2003–2008; British Museum Press: London, UK, 2009; pp. 106–107. [Google Scholar]
  59. Herbich, T. Magnetic survey of the Late Period grate temple enclosure in Tell el-Balamun, Egypt. ArchéoSciences 2009, 33, 77–79. [Google Scholar] [CrossRef]
  60. Malecka-Drozd, N. The Emergence and Development of Architecture on the Casemate Foundation Platforms in the Nile Delta. Rech. Archéologiques Nouv. 2012, 4, 69–96. [Google Scholar]
  61. Muhs, B. The Great Temenos of Naukratis. J. Am. Res. Cent. Egypt 1994, 31, 99. [Google Scholar] [CrossRef]
  62. Lucas, A. Ancient Egyptian Materials and Industries, 3rd ed.; Edward Arnold and Co.: London, UK, 1948; pp. 62–64. [Google Scholar]
  63. El Emam, A.; Abdallatif, T.; Suh, M.; Odah, H. Delineation of Egyptian mud bricks using magnetic gradiometer techniques. Arab. J. Geosci. 2014, 7, 489–503. [Google Scholar] [CrossRef]
  64. Emery, V. Mud-Brick. In UCLA Encyclopedia of Egyptology; Wendrich, W., Ed.; UCLA Department of Near Eastern Languages and Cultures: Los Angeles, CA, USA, 2011; pp. 1–10. [Google Scholar]
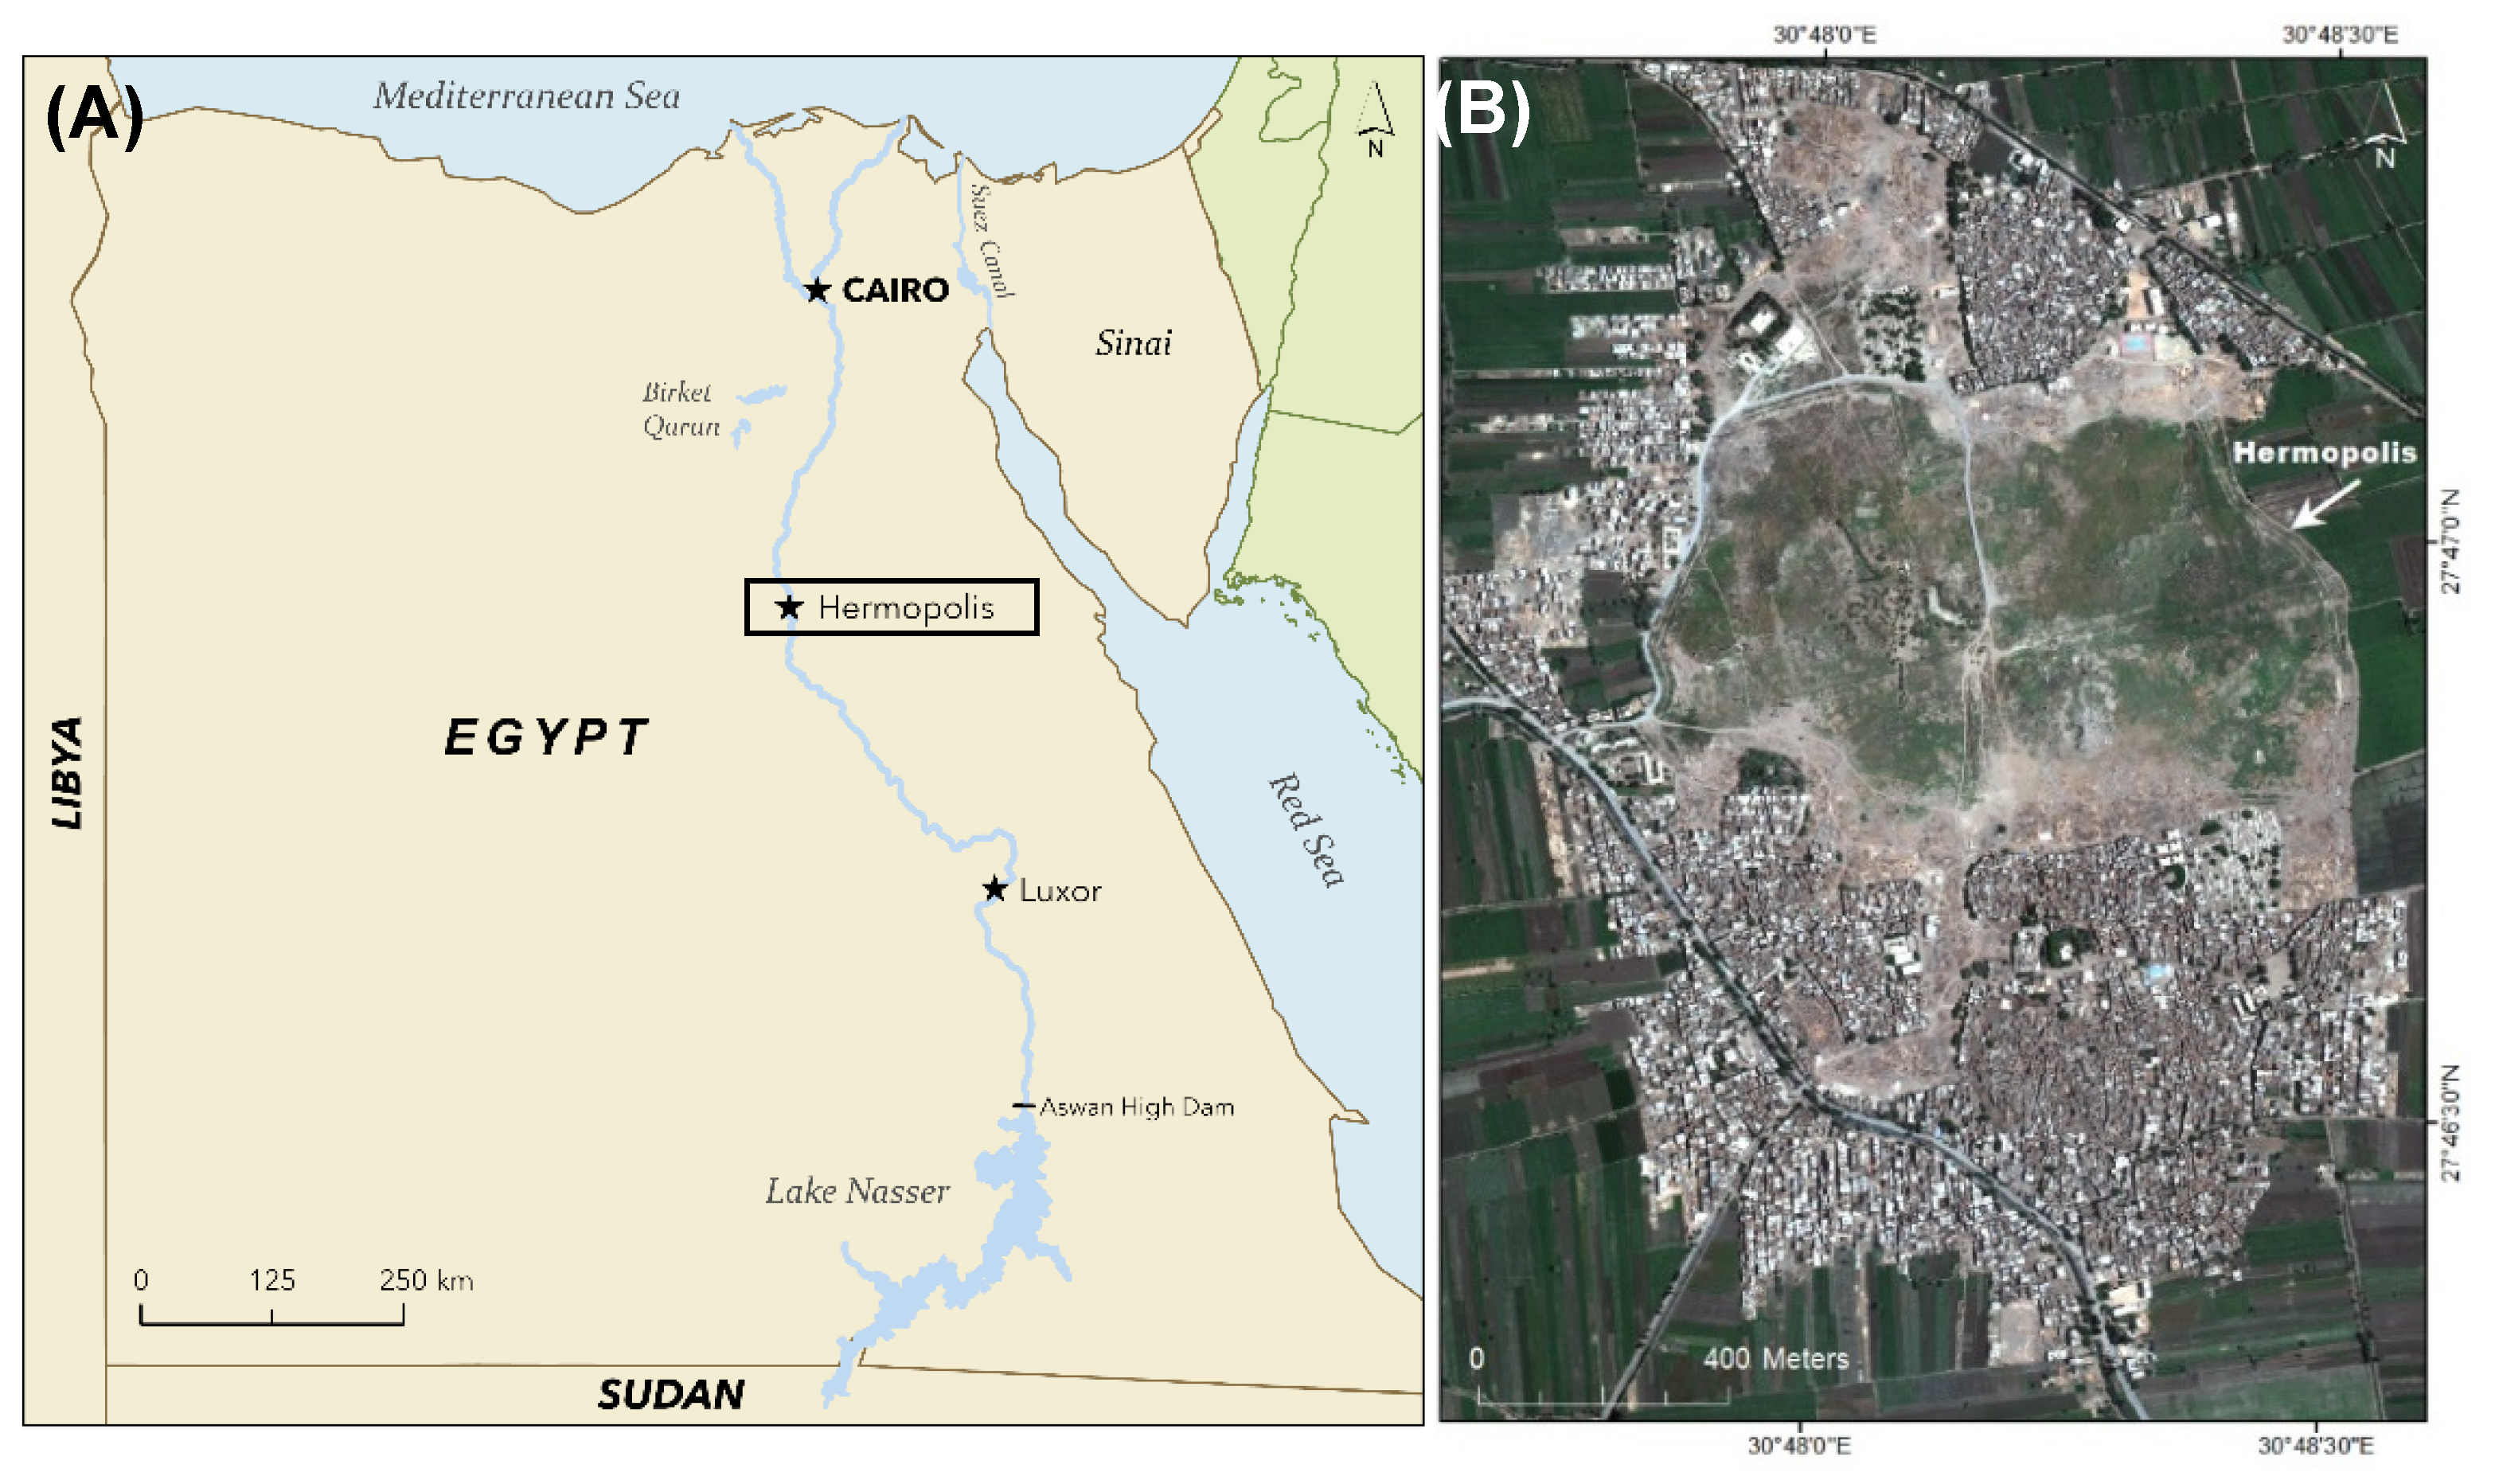
Figure 1. Simplified map of Egypt showing the location of the study site, highlighted by the black box (A). WorldView-3 satellite imagery displayed in true color for the archaeological area of Hermopolis. The image shows the archaeological site delimited by urban clusters and agricultural fields (B).
Remotesensing 14 00092 g001
Figure 2. Different vegetation growth at the site of Hermopolis (photo taken by author).
Remotesensing 14 00092 g002
Figure 3. Deteriorating remnants of mudbrick structures at Hermopolis (photo taken by author).
Remotesensing 14 00092 g003
Figure 4. MNF-based K-Means classification showing vegetated versus non-vegetated (bare ground) land cover.
Remotesensing 14 00092 g004
Figure 5. Infrared Percentage Vegetation Index (IPVI) for the entire study area with the detected site highlighted in the black box (A). WV-3 true color image showing the area covered by surface vegetation (B). Dense network of archaeological structures revealed by IPVI. The high IPVI value (0.7) indicates enhanced vegetation health atop the sub-surface linear features (C). Linear features are visible using edge-detection spatial filtering (D). IPVI overlaid onto the edge detection in order to accentuate the buried linear structures (E).
Remotesensing 14 00092 g005
Figure 6. Diagram showing the difference between vegetation growth atop a ditch (healthy) versus a stone wall (stressed).
Remotesensing 14 00092 g006
Figure 7. Seven structures (Installations AG) that were mapped from IPVI spectral analysis. Installations AC are believed to have had storage funcitonality. Note: solid lines indicate linear features that are clearly visible, whereas dotted lines indicate partial features.
Remotesensing 14 00092 g007
Figure 8. Aerial photo of the Ramesseum, the mortuary temple of King Ramesses II, which includes numerous mudbrick storerooms, pointed out with white arrows (source: Adobe Stock, WitR photos). The remotely sensed structures (Installations AC) at Hermopolis, shown in Figure 7, resemble these storerooms (A). Photos taken of exterior (B) and interior (C) of the mudbrick storerooms at the Ramesseum (photo taken by author).
Remotesensing 14 00092 g008
Figure 9. WorldView New Iron Index (WV-II) for the entire study area with the detected site highlighted in the white box. The WV-II-identified lower section of the city’s known mudbrick enclosure wall is also highlighted in white. The detection of this wall is due to the presence of mid to high iron oxide content (A). WV-3 true color image showing the area covered by surface vegetation (B). Installation G revealed by very low WV-II content (C). Linear feature visible using edge-detection spatial filtering (D). WV-II overlaid onto the edge detection in order to accentuate the buried linear structure (E).
Remotesensing 14 00092 g009
Figure 10. Casemate structure at Tell el-Balamun detected using magnetic survey [59]. The remotely sensed structure (Installations G) at Hermopolis, shown in Figure 9, resembles the Tell el-Balamun structure.
Remotesensing 14 00092 g010
Figure 11. The study area image in RGB, the digitized structures from previous excavations [32], as well as the two newly detected sites in the eastern section of Hermopolis, located outside the excavated zones.
Remotesensing 14 00092 g011
Figure 12. Process of constructing the 3D model for remotely sensed Installations A–C in SketchUp Pro.
Remotesensing 14 00092 g012
Figure 13. Constructed 3D model of the remotely sensed Installations A–C. (A1A4) show varying angles of the structures generated via SketchUp Pro. (B1B4) show the final product with rendered materials and textures via the Chaos V-Ray software.
Remotesensing 14 00092 g013
Publisher’s Note: MDPI stays neutral with regard to jurisdictional claims in published maps and institutional affiliations.