1. Introduction
The availability of suitable aquatic habitats is a crucial part of the life cycle of a malarial mosquito [
1]. Indeed, an established strategy for controlling malaria vector mosquito populations is Larval Source Management (LSM) which involves the systematic treatment or management of an aquatic mosquito breeding site: pools of water that are suitable for mosquito oviposition and larval development through to emergence as an adult mosquito. For diseases such as malaria, there is a long history of the successful use of LSM for controlling or even eliminating the disease [
2,
3,
4,
5]. Yet, this intervention remains relatively underused, compared to indoor interventions such as Long-Lasting Insecticidal bed Nets (LLINs) and Indoor Residual Spraying (IRS) of insecticide, due, in part, to the effort needed to develop and maintain reliable maps of potential larval habitats. For cost-effective deployment of LSM we need reliable and efficient ways of providing baseline maps of potential mosquito larval habitats to treatment teams [
6].
Drones technology has the potential to transform the way that modern LSM is delivered. This, in large part, is due to their ability to capture high precision (<10 cm resolution) images of the ground below in a timely and economical manner. In the case of malaria, important mosquito breeding sites can often be smaller than 1 m and therefore generating maps with high precision is crucial, this representing a significant drawback of most satellite Earth Observation based solutions [
7]. Perhaps more significantly, drones can be flown under the clouds, overcoming a major limitation of optical satellite imaging solutions, especially in tropical and temperate locations where cloud cover is persistent [
7,
8,
9,
10]. Additionally, due to the relatively low-cost and ease-of-use of many drone systems, there is greater potential for them to be owned and operated by disease control managers (e.g., National Malaria Control programs) rather than relying on external organizations, often from the Global North. In this sense, there is a potential for drones to help in the transition towards the democratization of key technologies.
Using drones, imagery can be acquired rapidly over relatively large areas, e.g., ~400–600 ha (4–6 km
2) in a single day (although this figure varies considerably according to flying height, camera type, drone-use restrictions, drone type). This imagery can be used to generate maps of potential mosquito habitats [
7,
8,
9,
11,
12], that can subsequently be used by ground-based teams to direct their LSM programme. This approach can revolutionize a key component of LSM where maps are produced conventionally through ground-based efforts that require a large number of fieldworkers, with coverage often being limited by accessibility issues due to private land/property or challenging terrain (e.g., dense thicket or forest, extensive swamp or flooded areas such as rice paddies). In this respect, the use of drones could provide a step-change in the way LSM is delivered.
Specifically, in terms of mapping potential malarial mosquito larval habitats, previous studies have focussed on the use of supervised image classification approaches [
9,
11], which offers a number of benefits. Following the manual delineation of training data, a trained classifier can be used to rapidly identify features over the entire image, representing efficiency gains over a manual digitizing approach where a human operator is expected to manually delineate every feature of interest (i.e., a potential breeding site) in the image. Sophisticated machine learning methods are able to exploit complex relationships between the dependent variable (i.e., surface water bodies that are considered to be potential or actual larval habitats) and the independent variables–typically, independent variables are the spectral bands that the drone-mounted sensor has, or some combination of these bands in the form of ratios or normalized difference ratios.
Furthermore, once a classifier is trained, it can be transferred and applied to a new image, negating the need to carry out the time-consuming task of manually delineating training data, therefore representing an automated, scalable solution for mapping potential larval habitats. For this to work reliably, the originally trained classifier must be representative of any new site: for tropical landscapes this is a challenge as they are often heterogenous in nature with dynamic hydrological conditions, i.e., the same site will have very different land cover characteristics between the wet and dry seasons. In Malawi, Stanton et al. (2021) assessed the quality of a Random Forest supervised classification to create maps of potential malarial mosquito larval habitats. Although the overall results demonstrated good agreement with test samples (mean overall accuracy 91%), when the trained classifier was applied outside the initial calibration area, the accuracy noticeably reduced (mean overall accuracy 76%). As such, the supervised classification approach may not necessarily represent the best mapping approach to adopt for operational mapping of potential malarial mosquito larval habitats. Specifically, the implication of mapping errors needs to be carefully considered. For instance, an accuracy score of ~90% may be considered successful in many land cover classification studies, but if 1 in 10 mapped water bodies is incorrect, then this could lead to a lot of wasted effort on the part of the field LSM operative (due to false positives) or potential important larval habitats being missed (due to false negatives).
In malarial regions across Africa, malarial mosquito breeding site types tend to be diverse within highly heterogenous landscapes (i.e., a mix of many different land cover types). For example, in Zanzibar, distinct and discrete surface water bodies such as lakes and ponds are rare due to their high-infiltrating soils and geology, with potential larval habitats being a diverse mixture of rice paddies, rainfall fed agriculture, drainage ditches and surface ponding along road/track networks [
13,
14]. These features represent a challenge for reliable mapping using a supervised classification approach due to their (1) relatively small size, (2) fragmented nature (not continuous water body units), (3) high suspended sediment load making them spectrally similar to bare soil, and (4) high fraction of emergent vegetation making them spectrally similar to crops and non-inundated grasses. However, many of these features are readily identifiable by the human operator by considering the context of the feature, alongside its shape and colour. As such, a manual approach may provide a more reliable means of mapping potential mosquito larval habitats, but this kind of approach tends to be ignored because of its laborious nature.
Given the range of drone technology available and the progress made in mapping larval habitats using drone imagery, the scientific community should be in a position to establish protocols that can be deployed operationally, yet key questions remain: Given the spectral similarity between aquatic larval habitats and other land cover types, what approach should be taken to extract information from drone imagery to help direct LSM efforts? In the context of an operational vector control programme in Zanzibar, we tested a state-of-the-art supervised classification procedure with a new approach that uses computer vision approaches to assist manual digitizing: a process we are terming “Technology Assisted Digitising”. Here, we present a comparison between these two approaches in terms of the quality of the mapped product and operator/computational time required to generate those mapped products.
2. Materials and Methods
2.1. Study Site
The study site was located on the island of Unguja, the main island of the Zanzibar archipelago (
Figure 1). Unguja receives between 1000 and 2250 mm of rainfall per year. Rainfall is strongly seasonal, typically with dry and hot weather during January and February, heavy rains from March to May, a dry season during June to September and light rains during October to December [
15,
16].
Unguja is characterized by a karstic geology, largely comprising coralline limestone with high soil infiltration rates occurring in most areas apart from doline areas where fine-grained sediment supports shallow water bodies and cultivation [
13]. The land cover is largely vegetated, comprising secondary forest, mangrove swamps, and degraded fallow bush. Agriculture is mainly dominated by root crops, vegetables and both rain-fed and irrigated rice plantations [
13,
17]. There is one main urban settlement in Unguja, Stone Town, which accounts for approximately 20% of the total population of the archipelago.
Zanzibar is in the pre-elimination phase of its malaria control programme following nearly two decades of successful interventions, including widespread dissemination of artemisinin-based combination therapy (ACT), long-lasting insecticidal nets (LLINs) and indoor residual spraying (IRS) that has seen a 96% reduction in
Plasmodium falciparum community prevalence between 2003 and 2015 [
18]. Currently, the Zanzibar Malaria Elimination Program (ZAMEP) are looking to integrate LSM into their elimination strategy to help tackle outdoor biting mosquitos, notably
Anopheles arabiensis.
Household-level malaria case surveillance data was used to define malaria transmission hotspots across the island of Unguja. Within these hotspot areas, 10 locations were randomly selected as test sites (
Figure 1) with a total area of 533.3 ha, sites varied in size from 22.8 to 84.9 ha. The 10 sites were geographically spread across Unguja, representing a range of different rural settings: agricultural areas dominated by rice paddies, irrigated plantations and rainfall-fed agriculture; extensive villages and road networks; high infiltrating coral rag and associated scrub; densely forested areas.
2.2. Ethics Statement
Our study was approved by the Zanzibar Health Research Institute reference ZAHREC/03/AMEND/OCT/2020/07 on the 29 September 2020. Prior to drone deployment, community perceptions of drone use were assessed through a series of focus groups with key stakeholders (not presented in this paper). The results of this work led to the development of a community engagement plan to ensure that stakeholder groups remained informed of drone activities and gave their consent.
2.3. Data Collection and Pre-Processing
All 10 sites were surveyed in line with Tanzanian Civil Aviation Authority regulations, using a DJI Phantom 4 Advanced+, weighing ~1.3 kg, with a maximum flying time of 30 min, fitted with a standard 1-inch CMOS red, green, blue camera with an effective pixel count of 20 M. Surveys took place in February 2021. The flights were planned and executed using DroneDeploy mobile application [
19]. Flight parameters were designed to maximize the coverage that could be made with each flight: Flying height ~120–150 m, flying speed set to 15 m/s, images at 75% Front Overlap, 65% side Overlap.
Agisoft MetaShape’s Structure from Motion (SfM) routine was used to construct orthomosaics for each site with a pixel resolution of 20 cm (with the exception of Mwera that was generated at a pixel resolution of 10 cm). Although higher pixel resolutions could be achieved, visual sensitivity analysis showed that 20 cm was able to capture key targets (i.e., surface water body features that have the potential to be mosquito larval habitats) whilst minimizing the computational burden both in terms of processing time and storage (which were important factors for project partners ZAMEP for the operational use of this technology). SfM parameters: aligning photos set to “high accuracy”; dense point cloud set to “high quality” and “moderate depth filtering”. No attempt was made to atmospherically correct the orthomosaics. By standardising imagery to surface reflectance confusion between target classes may be reduced however the collection of field spectra, necessary for implementing, for instance, an empirical line atmospheric correction, would detract from the operational-readiness of a drone-based mapping approach for supporting LSM. A MacBook Pro (Intel core i7, 16GB RAM, HD Graphics 1536 MB) was used for image pre-processing and subsequent analysis as described below.
2.4. Supervised Classification
Visual inspection of the drone imagery, combined with direct field observations and experience of the landscape determined several dominant land cover classes to be included in the supervised classification routine (
Table 1). The main features of interest were surface waterbody features, i.e., class numbers 1–3: open water, open water sunglint and emergent vegetation, but efforts were made to train and classify other, dry, land cover types (i.e., classes 4–11) to aid the classification process.
For each site, training data samples were defined for each of the land cover classes through manual digitization within QGIS 3.10. A Jeffries Matusita (JM) distance test was run to quantify spectrally separability between these classes [
20]. A number of classes were shown to be spectrally similar (JM distance < 1.9), and therefore difficult/unlikely to be separated in a classification routine (
Table 2). Significantly for mapping potential larval habitats: open water was shown to be similar to bare soil and crops/grasses; inundated vegetation was shown to similar to tree canopies and crops/grasses.
Despite the spectral similarity between these classes, an object-based land cover image classification routine was applied to each site using functions from the open source python library RSGISLib [
21]. A range of machine learning classification routines are available with broadly comparable results. For this study, we used the Extra Trees classifier (otherwise known as ‘Extremely Random Forests’), which is an ensemble routine that fits a number of randomized decision trees to various sub-samples of the input dataset, using averaging to reduce over-fitting and improve the accuracy of the final result [
22]. Extra Trees as been shown to outperform Random Forests as well as being computational more efficient [
23,
24].
The following steps were applied. All steps were coded in a Jupyter Python Notebook that is freely available [
25] (accessed on 20 December 2021):
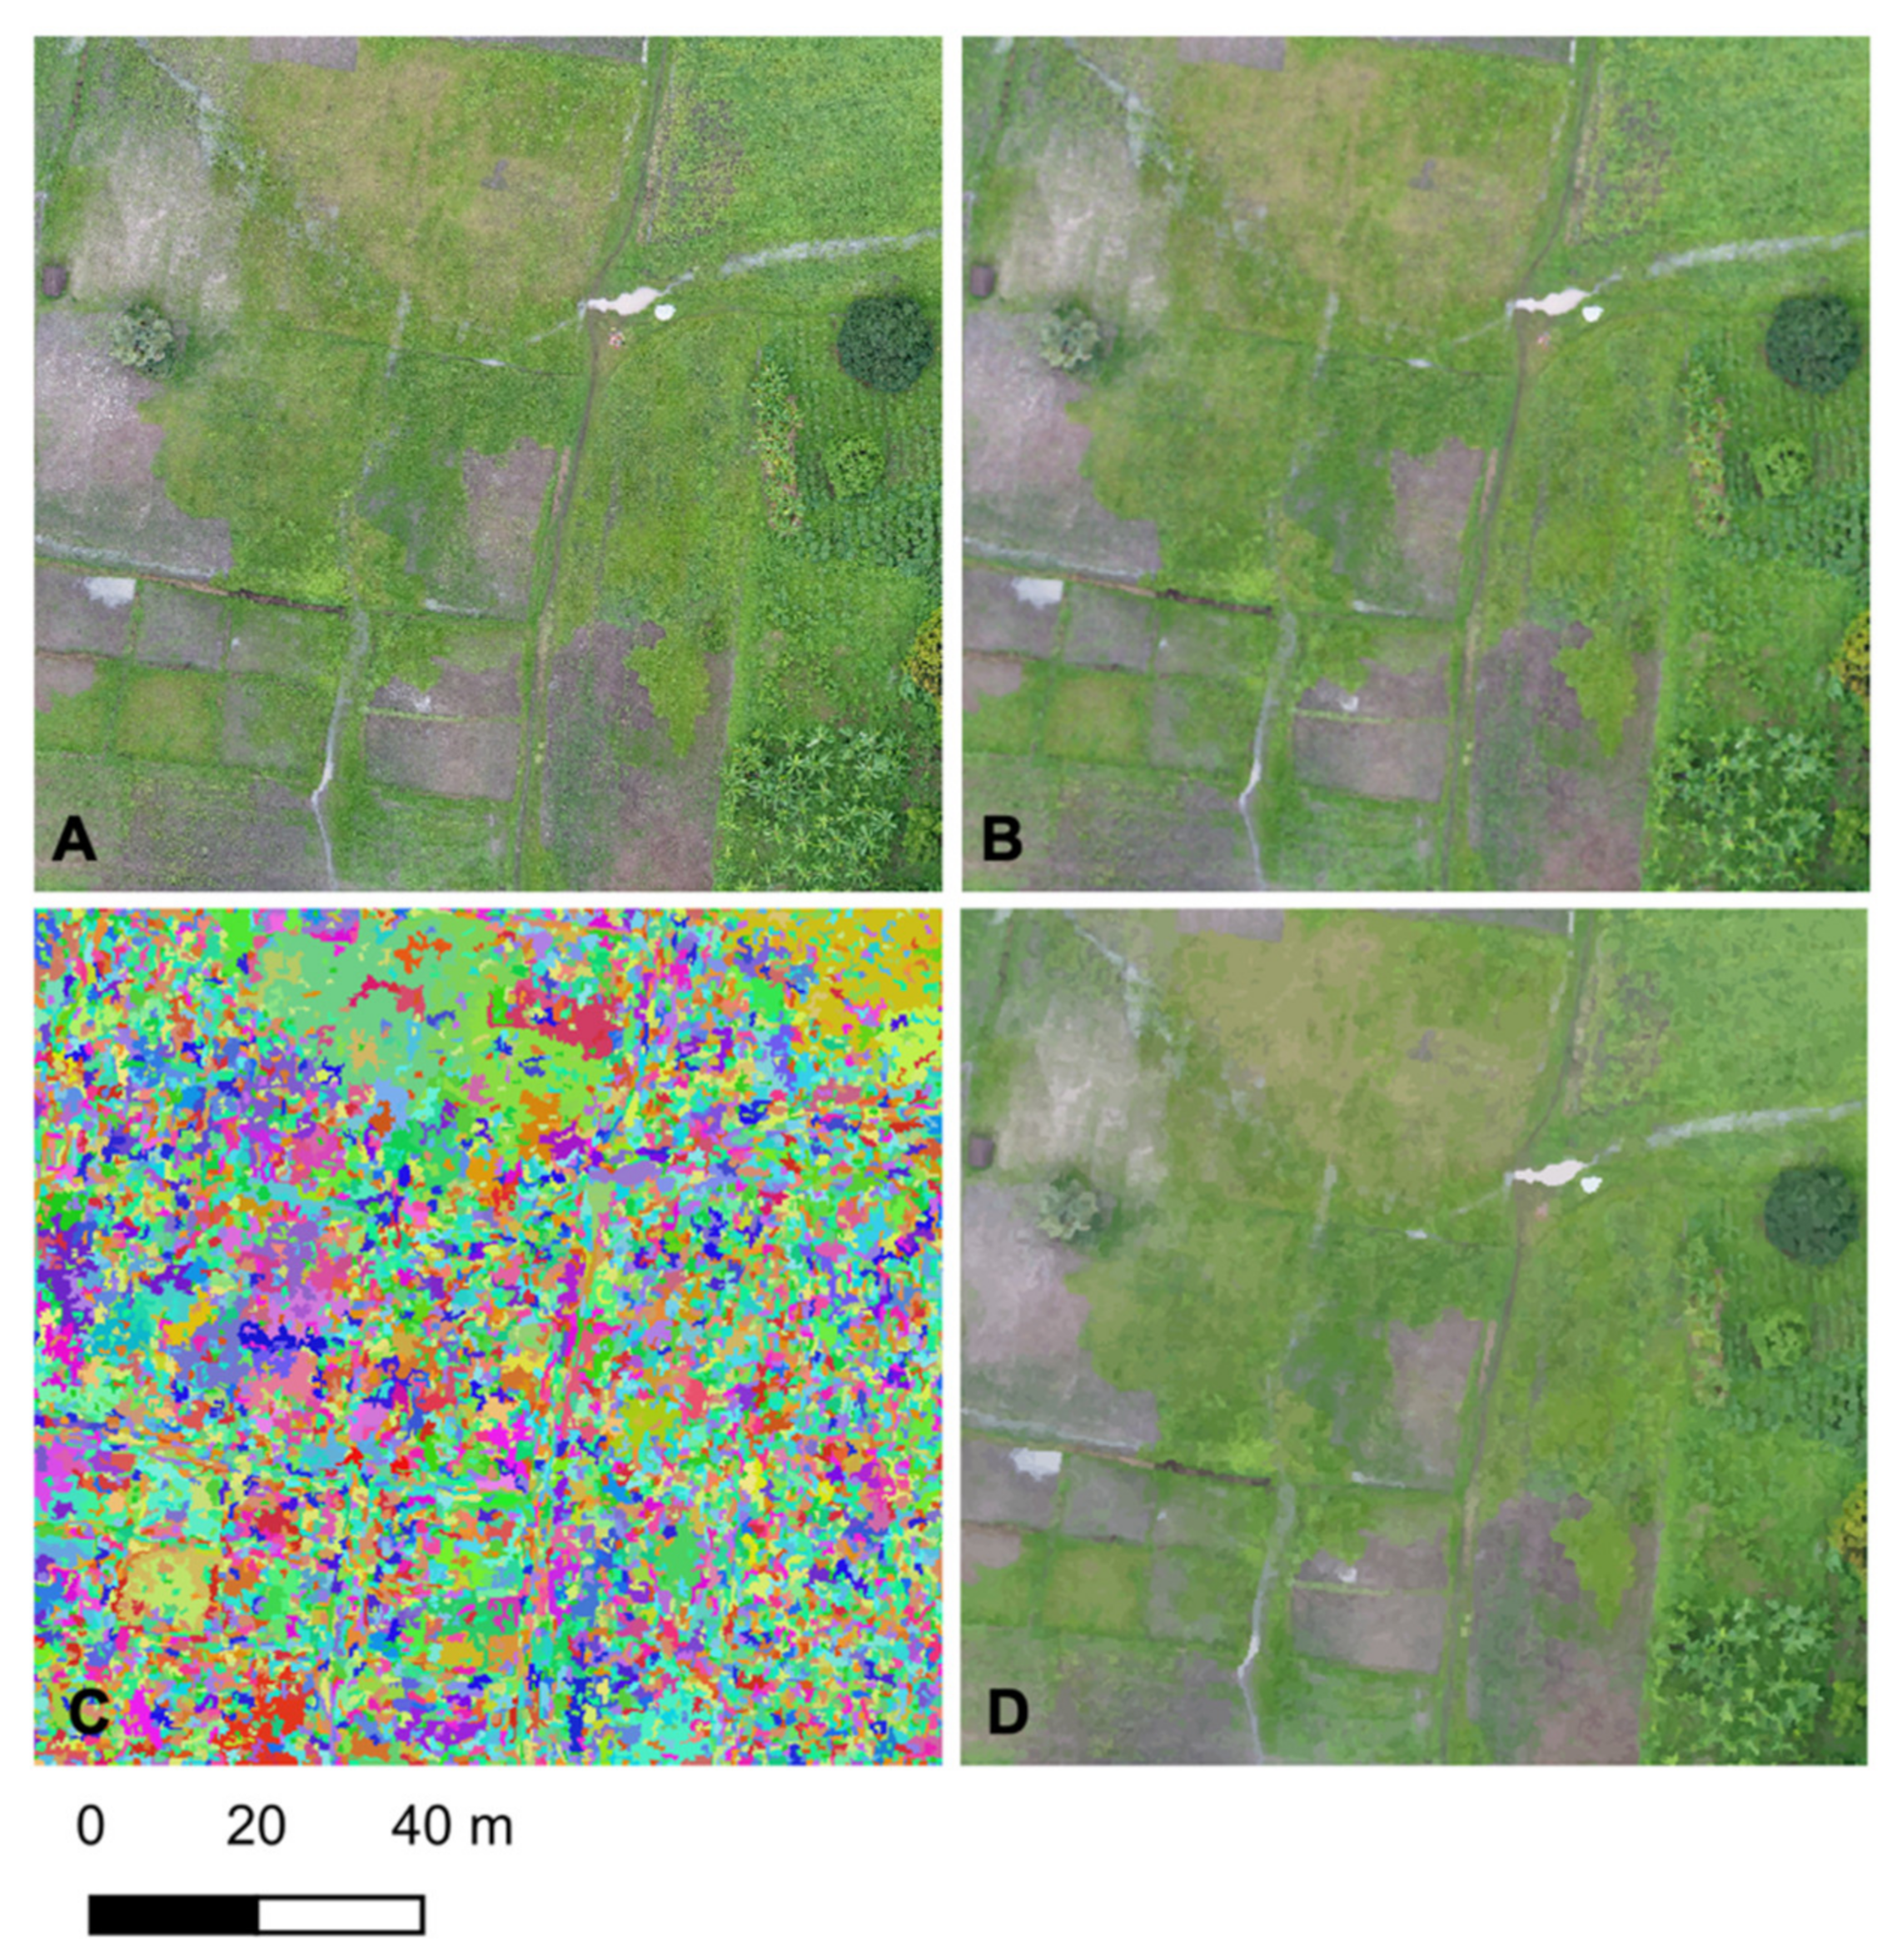
A 3 × 3 median filter was applied to the drone imagery to filter out small scale noise and variation (
Figure 2B).
A Shepherd segmentation [
26] was applied converting the original orthomosaic into a set of a spectrally homogenous objects (
Figure 2C). This approach takes advantage of spatially contiguous nature of landscape features, i.e., pixels neighbouring each other tend to be from the same land cover type, enabling a more efficient classification routine whilst minimizing the salt-and-pepper artefacts often associated with pixel-based classifications of high-resolution imagery [
27]. Visual sensitivity analysis was used to determine an optimal set of parameters for the segmentation ensuring that objects/segments were small enough to capture small scale features (e.g., small pool of water in road track): minimum number of pixels = 10, number of clusters within the KMeans clustering = 60, distance threshold for joining pixels = 100, maximum iterations for KMeans = 200.
Raster Attribute Table (RAT) resulting from the image segmentation is populated with statistics from the original orthoimage, i.e., mean value in each object for the red, green and blue channels (
Figure 2D).
RAT populated with class training data.
Training samples balanced so that all land cover classes have the same number of samples—an important step to avoid bias and over-classification of classes with a greater number of training samples.
A grid search is applied to identify the optimal parameter set for running an extra trees classifier. The following parameter range was applied: number of estimators = [10, 100, 500], maximum number of features = [
1,
2,
3].
The most optimal parameter set is used to train the Extra Trees classifier.
The classification result from within the RAT is “collapsed” into a raster output image.
For each processing step, including the manual training data selection process, was timed to give an overall time to classify each site.
Most machine learning classification routines require a minimum number of samples per class for a reliable classifier to be built. We used the general minimum number of samples per class = 10 × the number of independent predicting variables used [
28]. Our independent variables were the mean red, green and blue values per image object. Previous object-based analysis approaches have found it valuable to include a greater range of variables including the minimum, maximum, range and standard deviation of the input image bands [
24] (i.e., in this instance, the red, green blue channels). However, Pearson correlation showed that for the sites in Zanzibar, many of these variables were co-linear (r > 0.7 or <−0.7) and, therefore, should not be used together in the classifier. Additionally, unlike previous studies, we chose not to include the drone-derived digital surface model output as a variable because (i) the high infiltrating nature of the geology/lithology means that topography does not necessarily have a significant control on surface hydrology; (ii) given the large number of trees the digital surface model would not accurately depict the terrain below.
With just three predicting variables (mean red, green and blue) we needed a minimum of 30 training samples per land cover class. Despite this relatively low number, at some sites, some land cover types were insufficiently common to provide this minimum number of samples. As such, at the sites Donge 1, Donge 2 and Tunduni, we were not able to classify potential larval habitats (i.e., class numbers 1–3: open water, open water sunglint and emergent vegetation), an important limitation of the supervised classification approach that will be discussed later.
2.5. Technology-Assisted Digitising (TAD)
Manual digitizing has the advantage that the human operator is able to consider the context of a feature and its likelihood of belonging to a particular thematic class. As noted by Husson et al. [
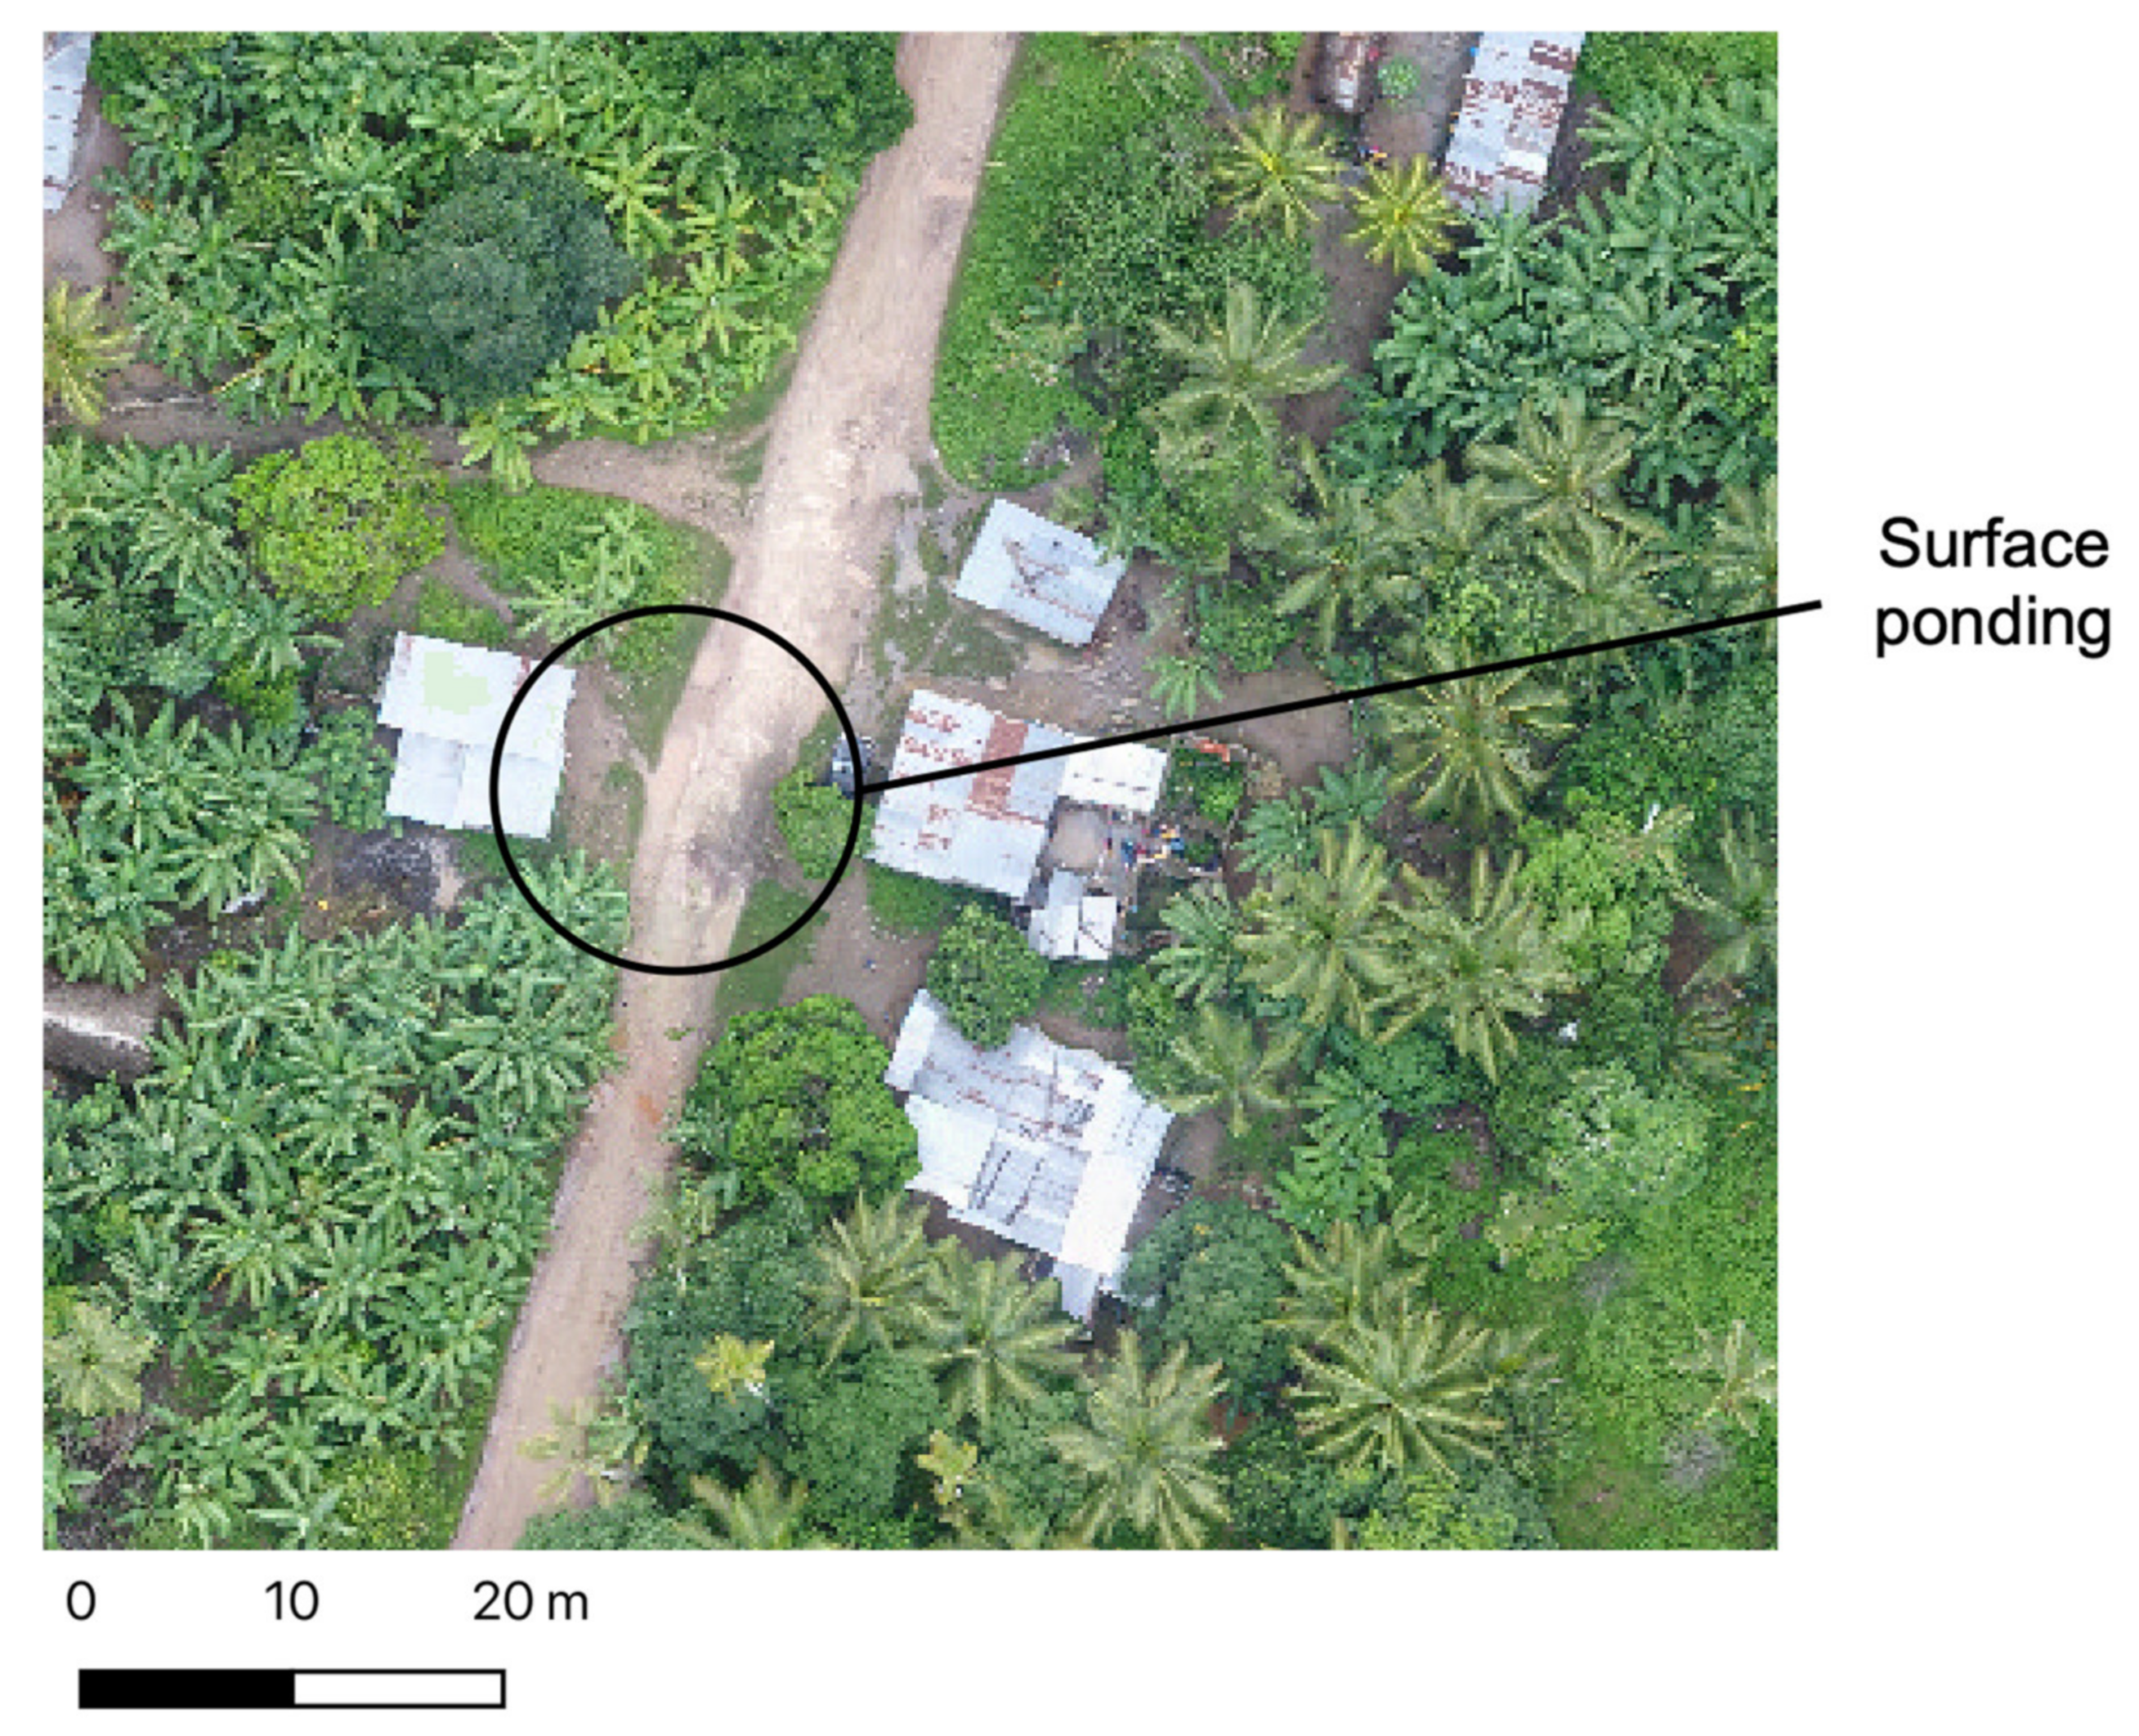
29], analysts were able to manually identify key plant species in drone imagery with a high degree of accuracy as the human operator is able to account for an array of visual characteristics (e.g., size, shape, colour, texture, pattern, locational context, etc.) that might not otherwise be possible using a classification approach. In terms of water body mapping, some surface water features with a high sediment load may appear similar in colour to bare soil, but their smooth texture and distinct edges could be considered by the human operator and mapped as surface ponding (
Figure 3). In the present application, manual digitizing is also beneficial because we are primarily interested in one land cover type: surface water bodies representing potential malarial mosquito larval habitats. Therefore, the operator can focus their efforts solely on the mapping of this land cover type rather than needing to determine the land cover class of all other features in the image, i.e., dry areas that do not represent potential larval habitats.
However, manual digitizing is a slow, laborious process, requiring a great deal of effort and concentration to precisely digitize often complex features. To ease the burden of this process, we developed a region growing tool to assist the human operator. Other region growing tools exist, implemented in open-source GIS software such as QGIS, but a range of deficiencies led to the need to develop a new tool, i.e., lack of transparency over algorithm employed; pixels joined to the region are not contiguous or neighboring (i.e., “Magic Wand”), leading to over-estimation of the feature extent; only available as a tool embedded within a broader toolbox (“Semi-Automated Classification Toolbox”) leading to extra steps to extract useable data (e.g., need to export to common vector format, difficulties in importing and editing existing features) reducing the ability of the tool to be used by a non-expert operator, an important consideration if the mapping approach is to be used within National Malaria Control programs. The developed tool, RegionGrow is implemented as a free plugin for the open source software QGIS 3.16 (available at:
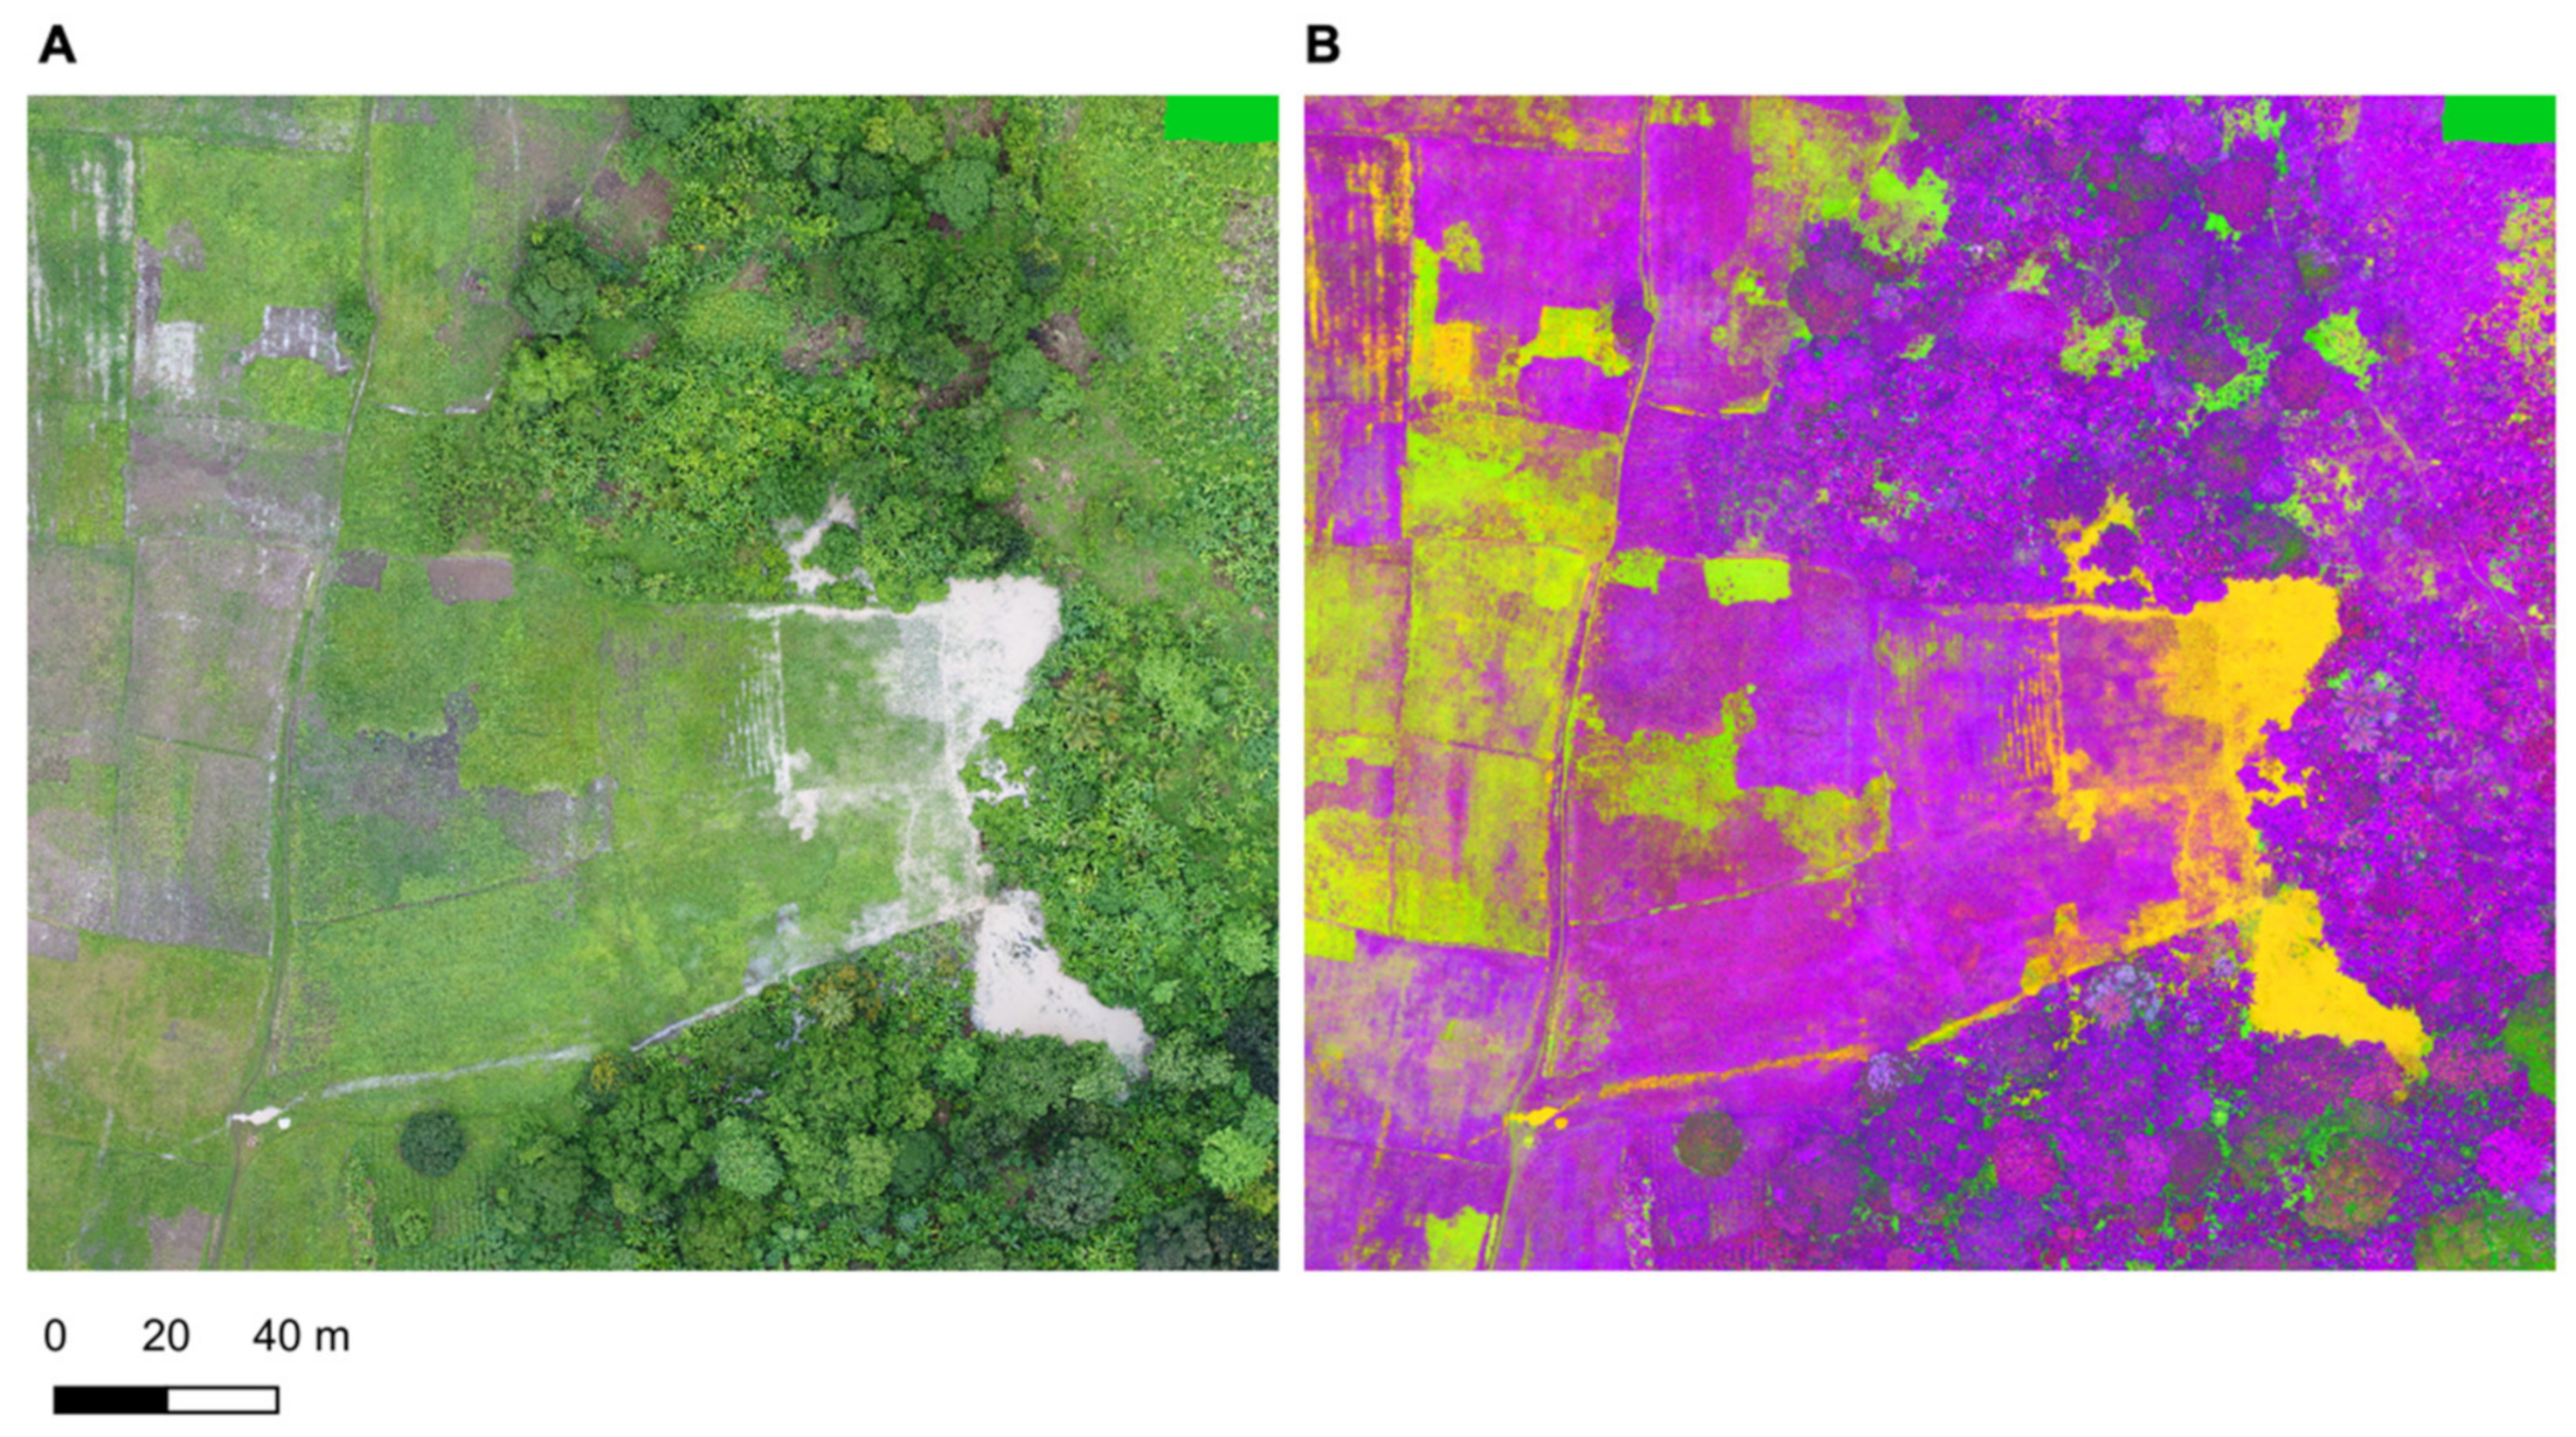
https://github.com/gro5-AberUni/RegionGrow accessed on 20 December 2021). Firstly, the user selects the drone imagery to be digitized, which then undergoes LAB colour transformation, converting the RGB pixels into components of L = Lightness between 0–100, A = Position on a Green–Red Spectrum, B = Position on a Yellow–Blue Spectrum. This increases the apparent depth of the image, making features more distinct and easier to distinguish (
Figure 4).
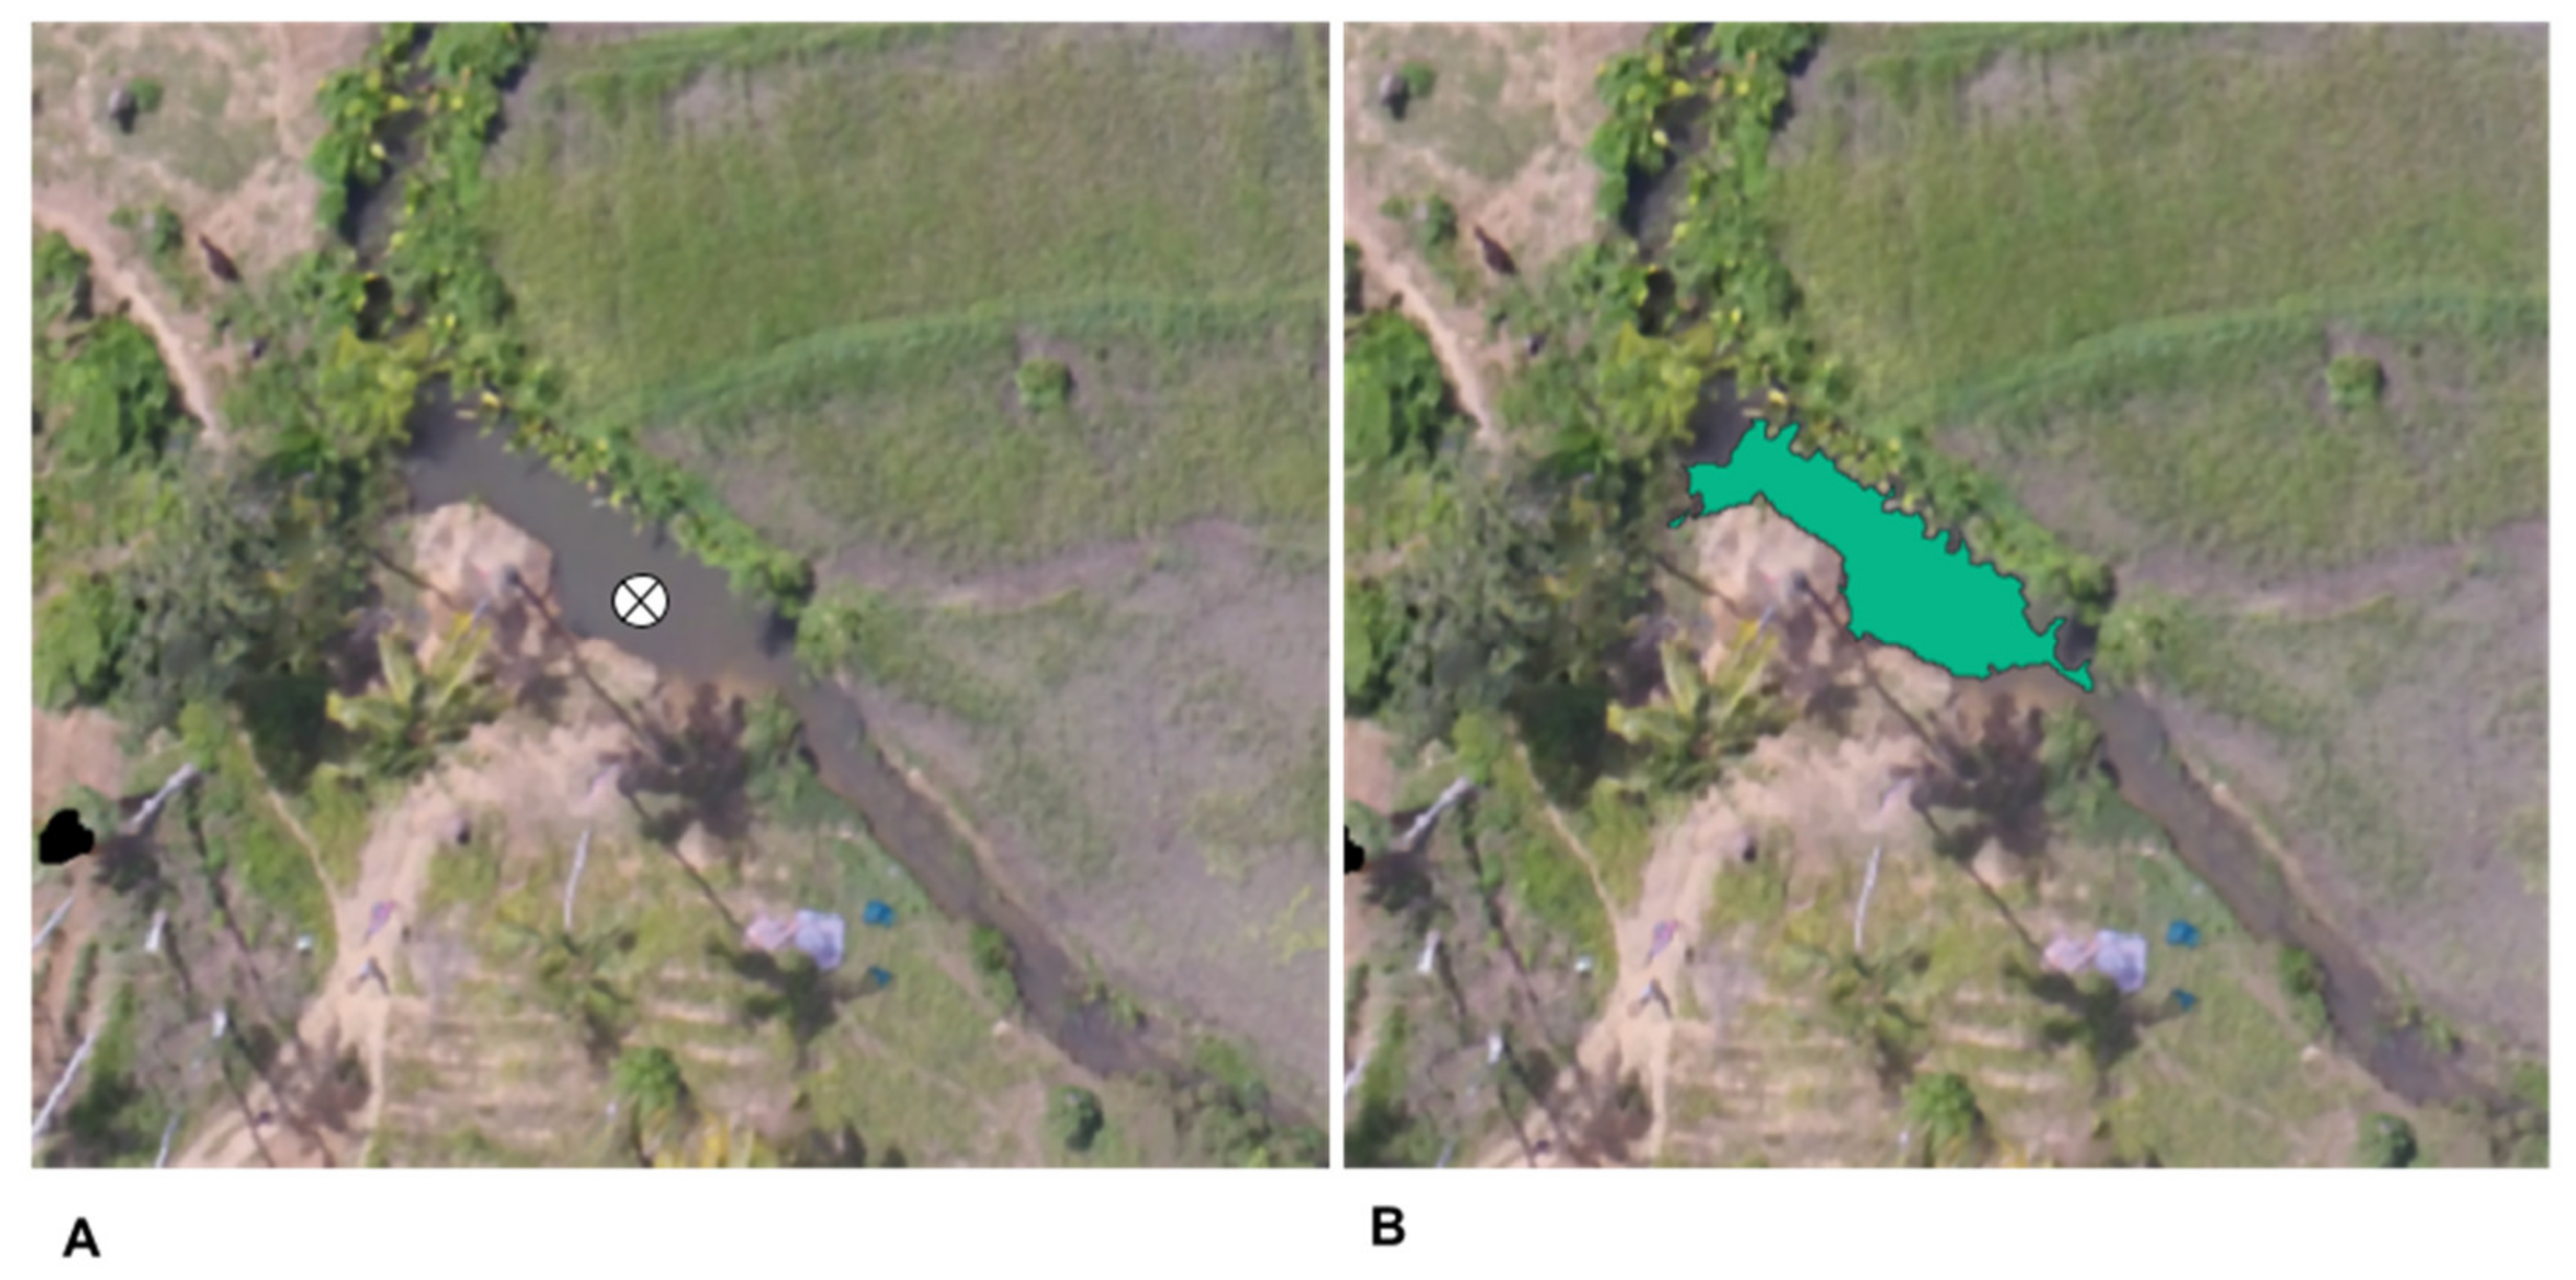
Once the image is converted to a LAB colour space, the operator can begin the digitizing process. The user selects a point within the image that he/she believes is a potential breeding site (
Figure 5). A window is then formed around this point, the size of which can be adapted by the user. All the pixels in this window are plotted in the LAB colour space, and their Euclidean distance (within this feature space) to the selected point are calculated. A threshold (can be adapted by the user) is then used to determine whether a pixel within the window is sufficiently similar to the selected point. If it is deemed to be similar, it is added to the region. To ensure complete coverage of the image, a 100 × 100 m grid is generated over the input image by the RegionGrow tool to help guide the operator, i.e., the operator interrogates each grid square and digitizes any potential larval habitats found.
2.6. Accuracy Assessment
For the supervised classification mapped products, an independent accuracy assessment was made by randomly allocating ~50 points in each thematic class using the Stratified Random Sample function in the R library “raster”. Each point was interrogated against the drone imagery to determine whether it was correctly classified. If a false classification was made, a record was made of the correct class. The classification points were used to construct an error matrix for each site, which was subsequently used to calculate accuracy statistics, including % overall accuracy, kappa coefficient and quantity and allocation disagreement scores [
30].
In the present application, we are interested in the land cover classes that correspond to potential mosquito larval habitats: open water, open water sunglint and emergent vegetation. Therefore, a secondary accuracy assessment was made by merging these classes and reusing the accuracy assessment points to determine the number of correctly/incorrectly classified potential larval habitats. This was quantified using the F1 score that accounts for the precision and recall of the classification output.
The accuracy assessment procedure was repeated for the results of the TAD approach using the RegionGrow tool. Approximately 80 points were randomly allocated within the areas delineated as potential larval habitats, and a further ~80 points allocated outside of these delineated areas representing other “dry” land covers types. Overall accuracy metrics, as well as the F1 score were calculated to enable a direct comparison with the results from the supervised classification results.
2.7. Field Data
The water body’s ability to support anopheles mosquito oviposition and larval development through to emergence as an adult mosquito is a key question. If particular water body types emerge as significantly more productive, or indeed, water bodies that emerge as entirely unproductive, then efforts can be made to target LSM efforts according to the characteristics of candidate water bodies. Conversely, no significant pattern may emerge, and therefore all surface water bodies need to be treated as potential mosquito larval habitats. To help answer this question for Zanzibar, we carried out a basic entomological survey.
At eight of the 10 sites, a field survey was carried out. Eight 600 × 600 m sites were defined that are geographically coincident with the sites used for the classification/digitizing routines. Each 600 × 600 m site is split into a series of 10 × 10 m grid squares. An attempt was made to visit each grid square on the day of the drone flight, and if a surface water body is encountered, its location is recorded using a standard GPS. In addition, the characteristics of the water body are recorded (i.e., presence of emergent vegetation, turbidity, surface vegetation/algae, the proportion of overhanging vegetation or other sources of shading), as well as a basic entomological survey where the water is sampled using a standard 350 mL dipper, placed in a white plastic tray and the presence pupae and the presence and number of
anopheles/
culex larvae are recorded [
16]. Note, no efforts were made to speciate the larvae–for this study, any
anopheles habitat was treated as a potential source of malaria vector mosquitoes, although previous work has demonstrated that
Anopheles arabiensis accounts for the majority (>80%) of malaria vectors in Zanzibar [
31].
Out of a possible 28,800 grid squares, 9324 were visited (32.4%). Missing grid squares were due to accessibility issues either due to extensive flooding, dense scrub/undergrowth, or squares within private property.
3. Results
Processing time, from data preparation through to extraction of thematic information from the classifier, ranged from 20 min to 1 h and 19 min on a standard laptop (Intel core i7, 16GB RAM, HD Graphics 1536 MB) (
Table 3). The sites ranged in extent from 22.8 ha to 94.6 ha, but there was no relationship between site extent and overall processing time. All computational processes were efficient, with the segmentation process being the most demanding step with a mean processing time of 85 s per image. Almost 95% of the overall time taken to carry out the supervised classification process was accounted for by the training data selection process.
A total of 2189 points were visited as part of the accuracy assessment of the supervised classification sites. Overall, classification accuracy was poor, indicated by relatively low overall accuracy scores (mean overall accuracy 61.7%, range 50–70%; mean kappa 0.56, range 0.42 to 0.66). The disagreement metrics [
30] provide further evidence of these poor classification results with a mean overall disagreement of 0.38 (range 0.3–0.5). Overall the quantity disagreement scores exceeded the allocation disagreement scores indicating a significant level of error in the spatial distribution of each class. The key classes of interest, i.e., those that relate to potential larval habitats, demonstrated a varied but overall poor classification accuracy, indicated by the mean user’s and producer’s accuracy scores for these classes. For some sites, the user’s accuracy results for the open water class may appear encouraging (e.g., Miwani 2: 92%) but this is counter-balanced by a poor producer’s accuracy score (e.g., Miwani 2: 55%) indicating over-classification, often due to the misclassification of bare soil as open water (
Table 4). Conversely, for emergent vegetation, the producer’s accuracy tended to be much higher than the user’s accuracy (mean user’s accuracy = 30.3%, mean producer’s accuracy = 75.3%), indicating under-classification, largely a result of emergent vegetation being misclassified as crops or dry grasses (for example see
Figure 6).
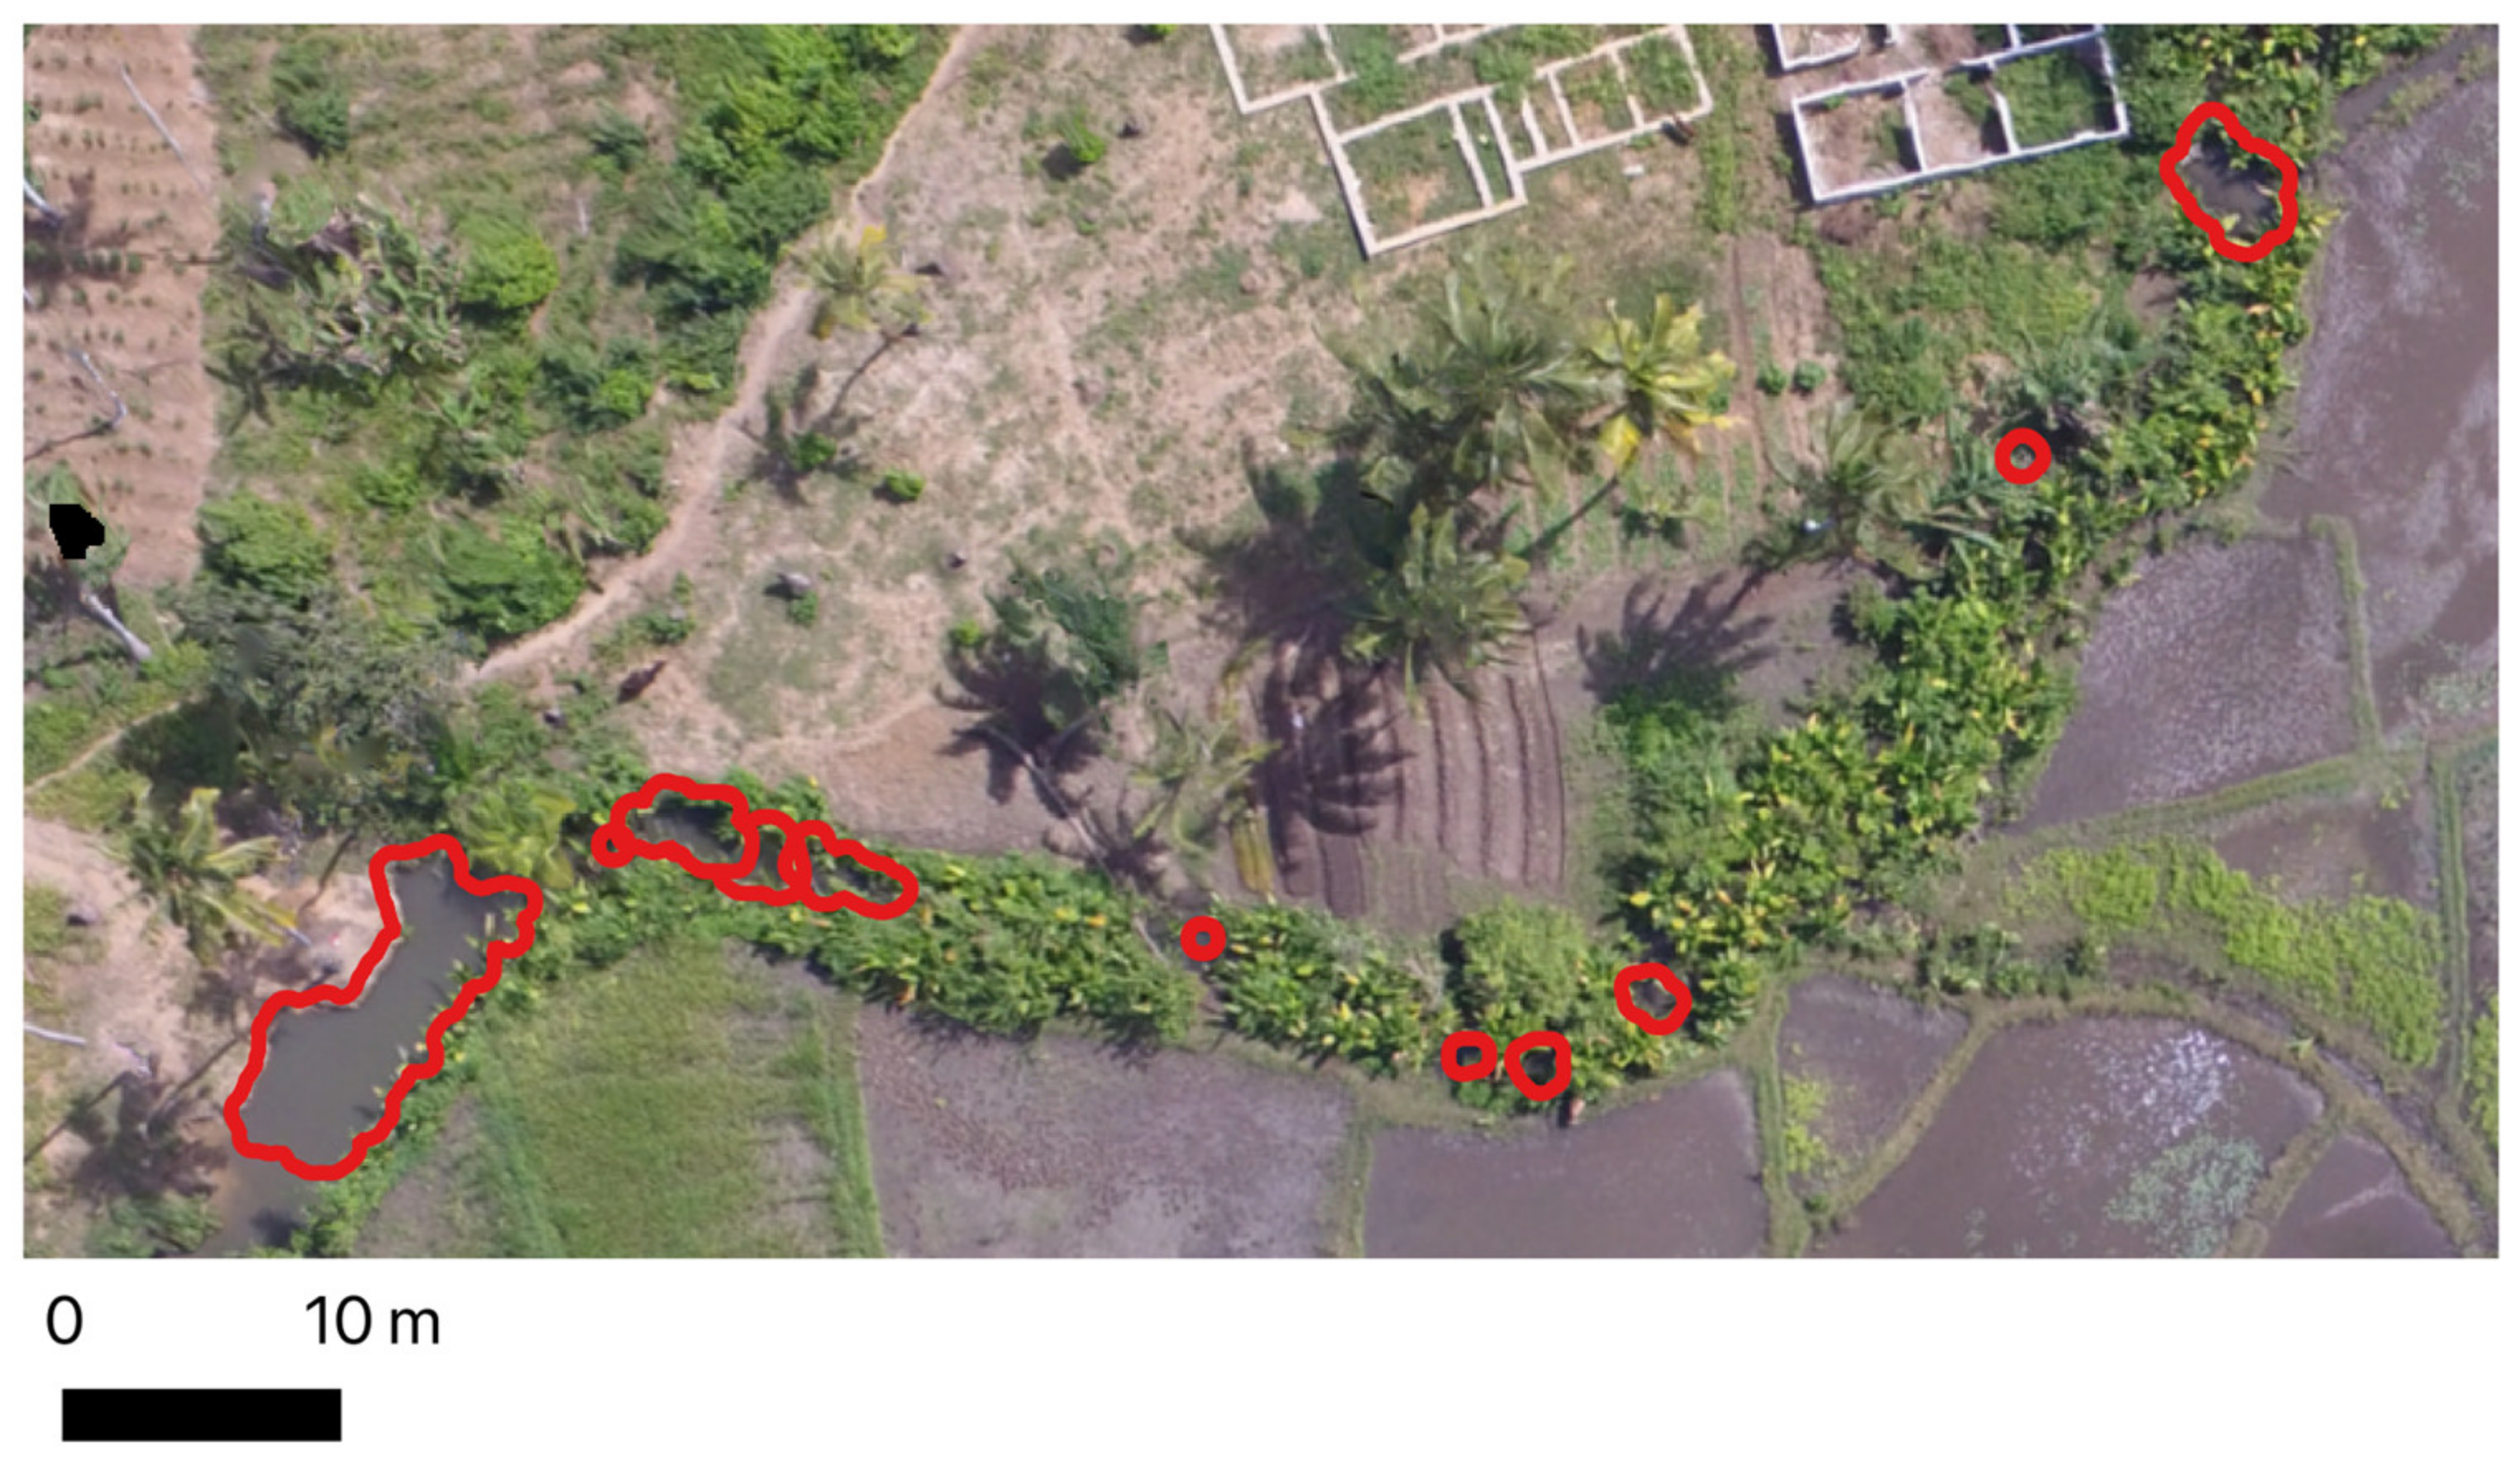
A total of 1660 points were interrogated as part of the accuracy assessment of the TAD sites. The overall accuracy scores for the TAD approach using RegionGrow was consistently high, with a mean of 95.7% and a range from 89.3% to 99% (
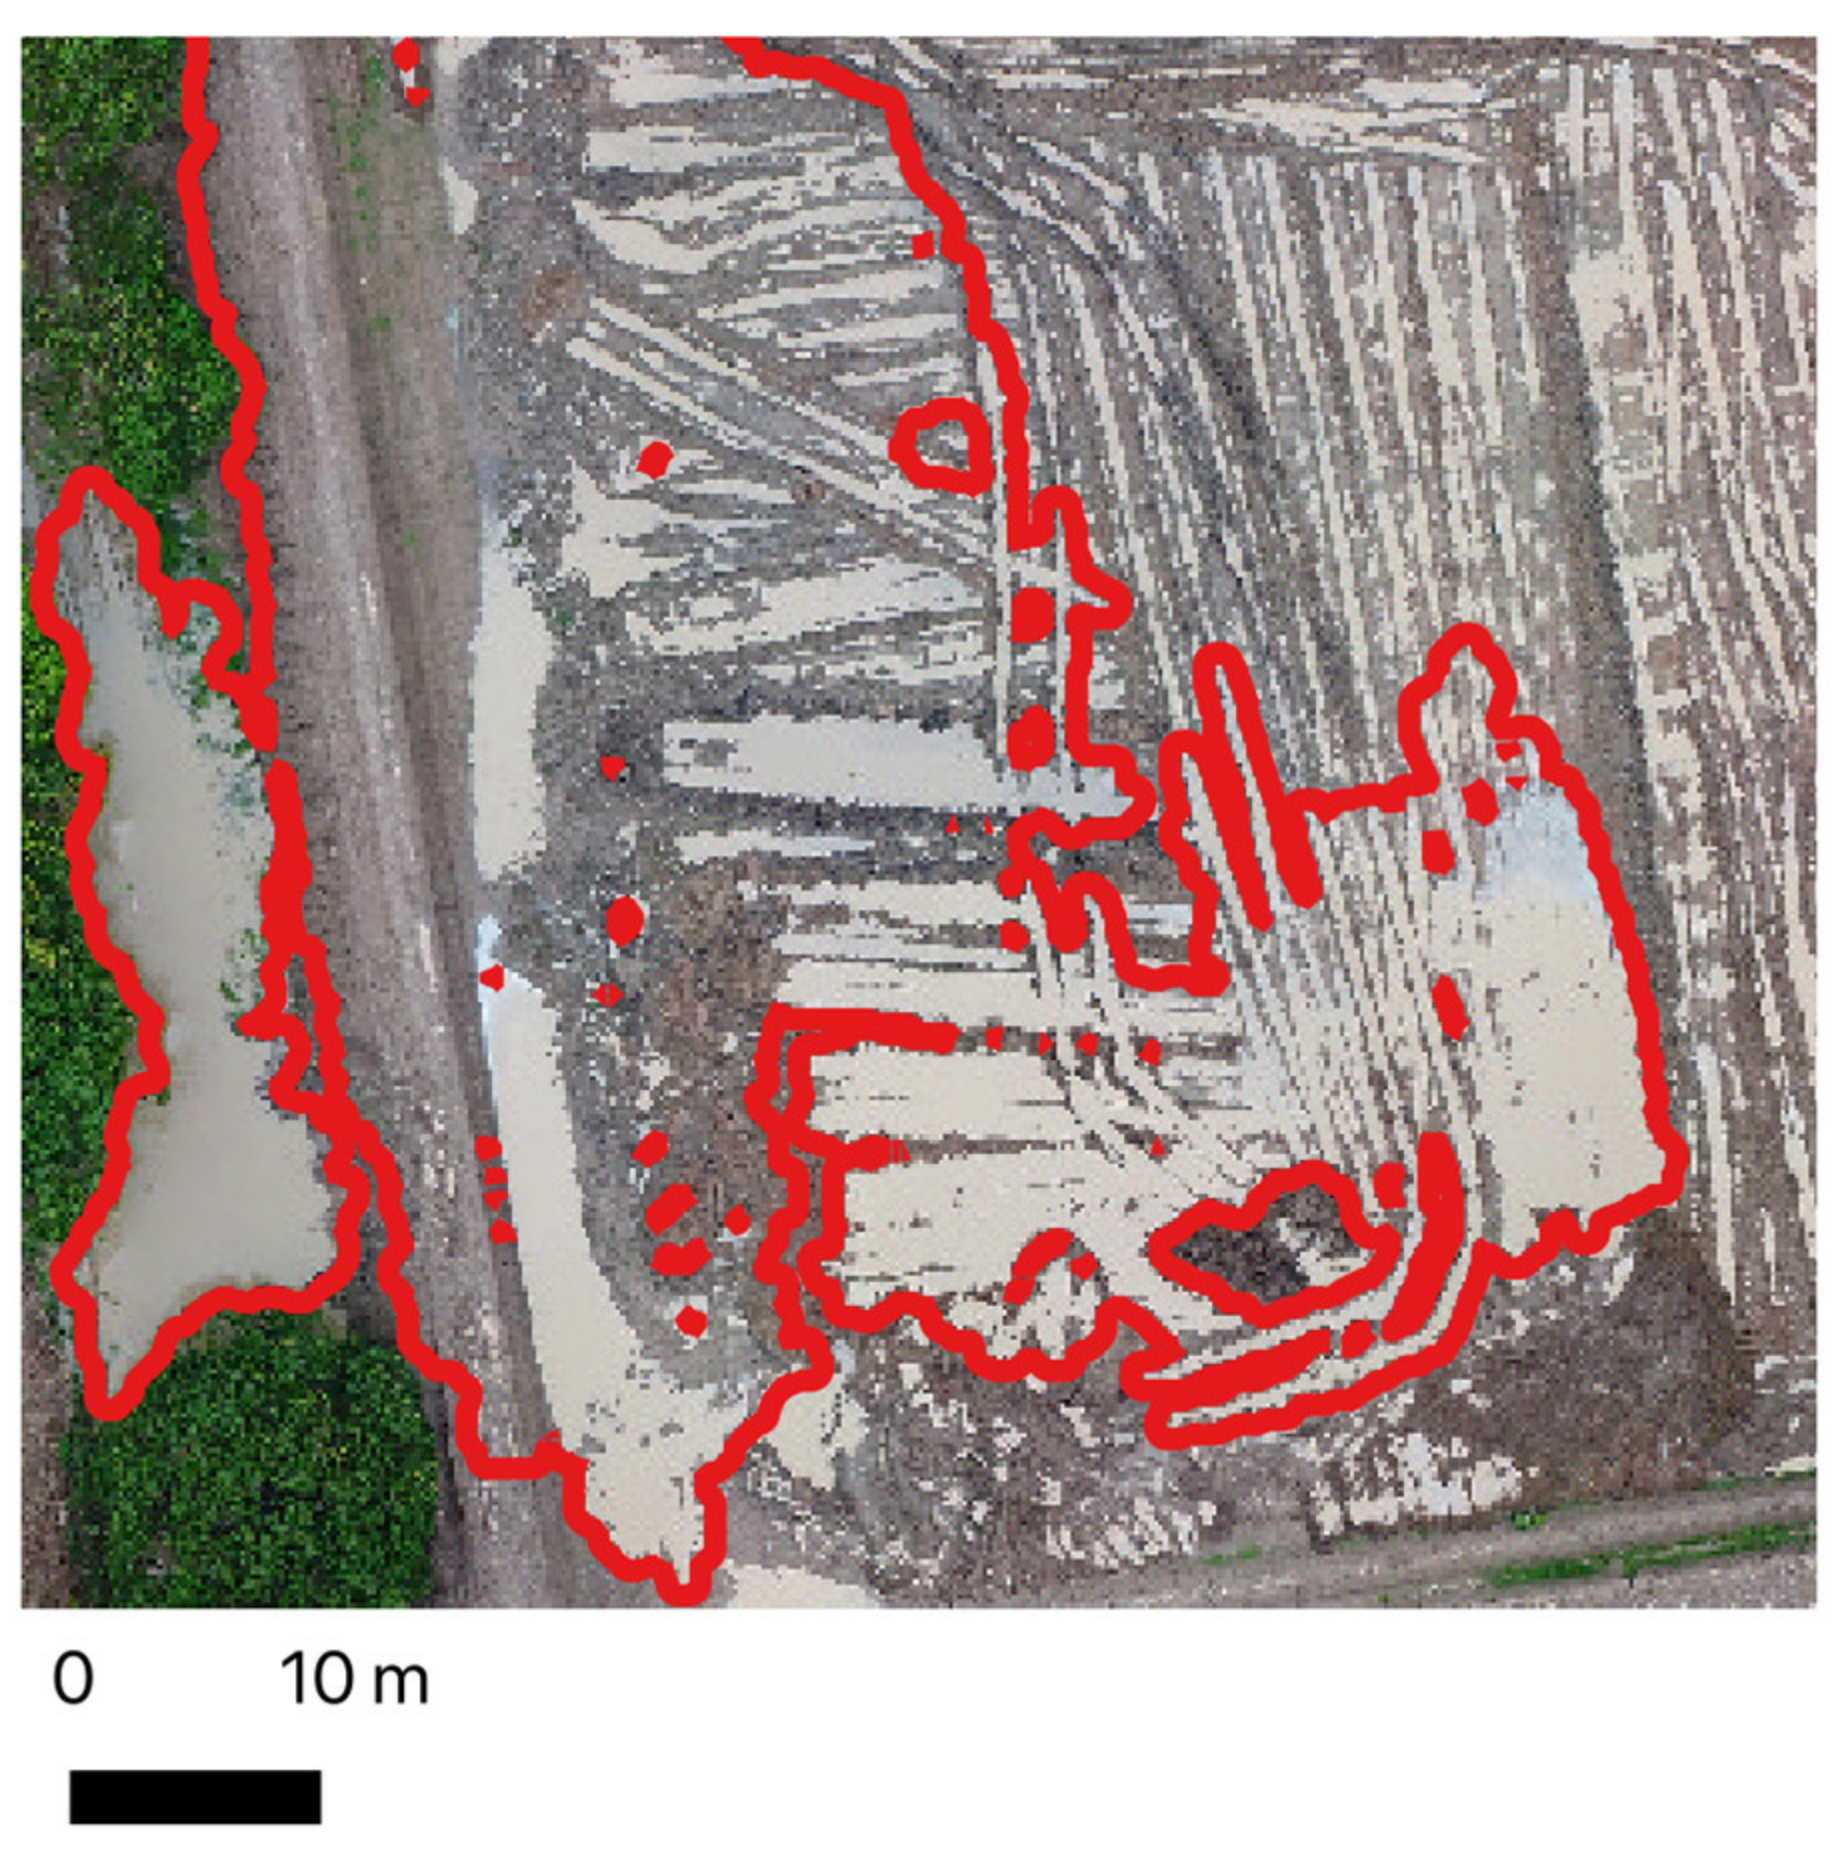
Table 5). The F1 scores, measuring both recall and precision also demonstrated a high level of accuracy (mean 0.95, range 0.88 to 0.99). Errors occurred where neighbouring pixels had similar spectral characteristics but belonged to different land cover types. For instance, extensive open water in tilled rice paddy: here open water with heavy sediment load is spectrally very similar to surrounding bare soil/mud (for example, see
Figure 7)—although, these instances could be alleviated by adapting the Euclidean distance thresholds within RegionGrow. Additionally, overhanging vegetation canopies obscured the water surface below and were not visible in the drone imagery. In most instances, this occurred along stream channels with riparian vegetation overhanging the channel making the water body feature appear fragmented (
Figure 8).
The time taken to complete the TAD process varied from 11 to 51 min (mean 31.1 min) (
Table 5). There was no relationship between time and the size of the image, or the overall extent of water in the image. Rather, digitizing time was related to the complexity of the water bodies in the image with larger, distinct water body features (e.g., inundated field) being quick to identify and digitize, compared to fractured, smaller, less distinct water body features (e.g., puddles in tyre ruts).
To enable a direct comparison of the mapping approaches the supervised classification approach was converted into a binary classification map: 1 = surface water classes (open water, open water sunglint and emergent vegetation) and 0 = all other, dry, classes. The resulting F1 score (mean 0.47, st dev 0.24) was significantly lower than the F1 score (mean 0.95, st dev 0.03) for the TAD approach (t = 5.1, p < 0.01). Overall the TAD approach was marginally faster in terms of end-to-end processing with a mean processing time of 31.1 min, compared to the classification approach with a mean processing time of 35.2 min but there was no significant difference in these times (t = 0.11, p = 0.91).
Field Data
A field entomology survey was carried out on the same day as the drone imagery acquisition at nine TAD sites and three supervised classification sites. The field data collection was restricted in its coverage due to accessibility challenges such as private property and difficult terrain (i.e., dense thicket, swamps and inundated rice paddies), meaning that it carries inherent bias, e.g., extensively inundated areas were poorly represented. As such, rather than representing a definitive set of records for validating the two mapping approaches, this dataset could be used to determine Type I errors (false positives).
The survey identified 181 potential larval habitats, i.e., surface water inundation with the potential to support mosquito ovipositioning and larval development. Out of these 181 sites, 17 tested positive for anopheles larvae. Rice paddy was the most dominant type of potential breeding site (34% of the total number) but isolated ponds, typically hand-dug shallow wells, were the dominant habitat type for anopheles positive sites (33%). However, ANOVA did not reveal any significant difference in terms of the mean number of larvae found per habitat type. As such, surface water should be mapped indiscriminately and treated as a potential breeding site instead of targeting mapping efforts based on the perceived understanding of breeding site preference, i.e., only mapping water bodies that are perceived to support anopheles mosquito oviposition and larval development.
Of 181 potential larval habitats recorded in the field survey, 69% were correctly identified using the TAD approach. Of the 18 larval habitats recorded in the field survey (i.e., water bodies that tested positive for anopheles larvae) 76% were correctly identified by the TAD approach. Conversely, the supervised classification approach identified just 13 out of 181 (7%) potential larval habitats and only 1 out of 18 (5%) anopheles positive larval habitats.
4. Discussion
The quality of the TAD approach was high (mean F1 score = 0.95), demonstrating the success of RegionGrow to enable operators to extract precise and accurate spatial intelligence to help direct larviciding efforts. Manual digitizing is a laborious process, but by using RegionGrow, mapping times were equivalent to the supervised classification approach but with a far superior mapping quality. Significantly, the operator that implemented the TAD approach has not been formally trained in applying GIS or remote sensing functions. Conversely, the supervised classification approach was implemented by an experienced operator with formal training (post graduate taught and research degrees).
The quality of the supervised classification approach was poor (mean F1 score = 0.47), with potential larval habitats being consistently over-classified. Operationally, the supervised classification approach offers benefits in that a trained classifier can be applied to new areas [
9], negating the need for the training data selection process—the most time-consuming part of the approach. Due to the low accuracy scores found in this study, the transfer of the developed classifiers was not explored. Moreover, If the resulting thematic maps were to be used in operational larviciding, a great deal of effort would be wasted by field teams visiting these sites, far out-weighing any savings in time made in the baseline mapping potential larval habitats (i.e., compared to the timely and laborious processing of ground-based mapping).
In this study, we used the extremely random forest classifier. Although considered to be a state-of-the-art machine learning approach, there are many other techniques and methods available. Some may offer incremental improvements on the results found in this study; for instance, deep convolutional neural networks (CNNs, or Deep Learning) has been shown to outperform machine learning approaches in broad scale wetland mapping studies using satellite optical imagery [
32]. These sophisticated artificial intelligence approaches are assumed to be better at capturing the complexities of dynamic and variable targets such as surface water, rather than more conventional machine learning classification approaches that primarily rely on the spectral separation between target classes at a pixel or object level [
33]. However, Deep Learning approaches demand a great deal of processing power and a large amount of training samples [
34] which, in this study, has already been identified as an issue at relatively dry sites, i.e., the insufficient extent of surface water body features to train the classifier.
Exploring the use of more sophisticated sensors with a greater spectral range might also be considered. Spectral channels beyond the visible part of the spectrum, such as the near infrared (NIR), can reveal a greater distinction between potential mosquito larval habitats and other land cover types in drone imagery [
11]. However, Stanton et al. [
9] found no discernible improvement when including the NIR channel. The value of the shortwave infrared (SWIR) channel—commonly used in surface water mapping applications using optical satellite imagery because of its high absorption rate over water bodies [
34,
35]—has not been explored in this, or previous studies, and therefore remains an unknown potential for use in drone-based mosquito breeding site mapping.
By default, many drone systems capture imagery in JPEG format. This format stores image pixels as integer values to save on data storage requirements, scaled from 0 to 255. Whilst this format might reduce file size, it also reduces the radiometric level: the number of colour levels or colour detail stored in each pixel. In effect, the spectral detail is degraded compared to the original RAW format. For example, an image acquired by DJI Phantom 4 Advanced+ in JPEG format with 4000 × 2250 pixels had a file size of 4.2 Mb (data type byte) and has a possible 16,777,216 colour levels. The same image acquired in RAW format had 3920 × 2242 pixels, a file size of 107.4 Mb (data type 32 bit Float) and has a possible 1.02 × 1039 colour levels. When performing a classification using the compressed JPEG imagery, the feature space is much smaller than it would be in RAW format, potentially reducing the capability of a classifier to differentiate between classes. Systems such as the DJI Phantom 4 Advanced+ are capable of capturing and storing imagery in RAW format, but currently, most automated drone flight planning software do not enable imagery to be collected in this format. Proprietary flight planning software, such as Litchi, has this capability but this kind of software is not straightforward to install and use.
The challenge with these potential solutions (i.e., increased sensor capability, image colour depth, or more sophisticated classification routines) is that they may detract from the original goal: forming a practical solution for operational deployment by National Malaria Control programmes. More sophisticated hardware and processing are likely to increase cost, alongside the increase in technical capacity required to develop and run these solutions. As demonstrated in Zanzibar, the TAD approach using RegionGrow, is a simple and effective solution to drawing information about potential larval habitats from drone imagery.
In Zanzibar, a range of sites with varying hydrological conditions were surveyed. The results remained consistently high, independent of overall surface water extent, giving confidence that the TAD approach will work well in dry season conditions, typical of sub-Saharan African landscapes. Conversely, the supervised classification approach could not even be applied to drier sites at Donge 1, Donge 2 and Tunguni due to an inadequate amount of training data available for surface water classes. Therefore, if the dry season refugia concept [
36] is to be exploited—i.e., carry out LSM interventions during the dry season during which the number of aquatic habitats are relatively limited—then the lack of available training data becomes an important limiting factor for supervised classification approaches.
As well as targeting LSM efforts in the dry season, it would also be beneficial to target LSM efforts in specific habitat types [
37,
38]. For instance, in the Kilombero Valley, in mainland Tanzania, dry season
anopheles larvae were significantly more abundant in disconnected river channels and spring-fed ponds [
16], meaning that mapping and treatment activities could be focussed on these habitat types. However, in this study in Zanzibar, there was no discernible difference between the
anopheles positivity rate for any particular habitat type. As such, all surface water bodies should be considered a potential breeding site. It is important that methods for extracting information from drone imagery should include water bodies with emergent vegetation as well as open water sources. This study demonstrates that RegionGrow is able to map both of these water body types with a high level of accuracy.
Optical drone remote sensing approaches have an inherent drawback: drone imagery cannot be used to map water bodies obscured by roof structures and tree canopies. Often, however, water body features were only partially obscured, with mapped features representing part of a larger, continuous water body, such as a stream channel. In these instances, we recommend that the operator could infer a broader water body and digitize it manually, thereby taking advantage of the human operator’s ability to consider the hydrological context when making decisions over what constitutes a potential breeding site or not. It should be noted, however, that Deep Learning might be able to capture this kind of contextual information, if adequately trained, potentially providing an approach that can automatically map these complex features. This remains an important line of enquiry, despite its operational drawbacks as discussed earlier (processing power, sufficient training data).
An additional barrier to the use of drone technology is that in some areas, flying drones is simply not permitted. Examples include privately defined no-fly zones and areas with increased security risk or conflict zones, such as Yemen, Syria and parts of Mozambique (2021) where the use of drones may be assumed to be part of a military deployment. Additionally, 15 countries have banned the use of drones, ten of which lie within malaria endemic zones. In these areas, the approach presented in this paper could not be applied.
Given the high accuracy of the TAD approach, and the clear benefits over a supervised classification approach, we recommend its use for extracting spatial intelligence from drone imagery in support of LSM programmes in Zanzibar. However, what remains to be considered is the evaluation of a drone-based mapping approach over conventional ground-based methods. What benefits does a drone-based approach offer in terms of coverage, effort and mapping quality, balanced against the cost of the equipment and training?
Additionally, although the TAD accuracy assessment results were very good (mean overall accuracy > 95%), some missed water bodies may represent important habitats that maintain the local population of malarial mosquitoes. In this sense, when evaluating a mapping routine for malaria vector control, false negative errors need careful consideration—particularly in the case of larval habitats that are close to people’s homes, which are likely to play an important role in sustaining malaria transmission. As such, we recommend that drone-based surveying should not entirely replace ground-based observations. Rather, the drones offer an ability to vastly increase the coverage of baseline habitat mapping, particularly in difficult to access areas, which could complement ground-based mapping efforts within village settings where high tree canopy cover and overhanging roof structures make drone-based observations of water body features difficult.


