Abstract
Urbanization has not only promoted economic development, but also significantly changed land use and development strategy. The environmental problems brought by urbanization threaten ecological security directly. Therefore, it is necessary to introduce changes in land use when constructing an ecological security pattern. This study takes the Yangtze River Delta urban agglomeration, one of the most economically developed regions in China, as the research area. Based on its land use status, the Cellular Automata–Markov model was used to predict the quantitative change and transfer of land-use types in 2025, and three types of land-use patterns were simulated under different scenarios. Combined with the pressure–state–response model, the Entropy TOPSIS comprehensive evaluation model is used to evaluate the three phases in the years of 2005, 2010, and 2015, and the results indicated that the safety level dropped from 85.45% to 82.94%. Five spatial associations were obtained from the spatial autocorrelation analysis using GeoDA, and the clustering distribution of the three phases was roughly the same. Based on the requirements of “Natural Growth” scenario, “Urban Sprawl” scenario, and “Ecological Protection” scenario, the transfer matrix of the various land-use types were modified rationally. The results of scenario simulations illustrated that the level of urbanization was inversely proportional to the level of ecological security. The surrounding cities in the northern part of Taihu Lake were developing rapidly, with low levels of ecological security. The hilly cities in the southern part, in contrast, developed slowly and had a high level of ecological security. Based on the temporal and spatial changes in the ecosystem, an ecosystem optimization model was proposed to determine the ecological functional areas. The nature of each functional area provided the basis to formulate urban construction and management plans and achieve sustainable urban development.
1. Introduction
With the renewal and iteration of remote sensing technology, the spatial resolution of remote sensing images has moved forward to the sub meter level, and the time scale has gradually improved. Due to the rapid and large-scale monitoring function of remote sensing, China has conducted many application tests of environmental monitoring. For example, LUCC dynamics and climate change are analyzed based on MODIS and global 30 products [1]; PM is retrieved by combining different satellite products and simulation outputs [2,3]. In addition, there are urban heat island effect [4], water pollution, air pollution [5,6], and other ecological security issues [7], so as to provide reference for the follow-up development of regional ecological environment remote sensing monitoring. In the past 30 years, the Landsat Series in the United States has obtained the longest continuous record of the earth’s surface and has become the main remote sensing information source for urbanization expansion monitoring research [8]. At present, the degradation of ecological environment and related pollution in various cities have been linked to the ES of urban development [9], which is gaining more and more attention. However, the relationship between land use and ecological has only been discussed in a limited number of articles. If this issue is elevated to the national level, it will set off a boom [10].
Ecological security (ES) is a state of human living environment and ecological conditions. A healthy ecosystem can continuously maintain its structure and capacity, so as to achieve sustainable development. A large number of researchers have studied ES from various aspects, such as national level [11,12], regional scale [13,14], citywide [15,16,17], water bodies [18], and different artificial systems [19]. The ES pattern has been improved in practice and combined with a wide range of disciplines to expand its role [20]. It includes landscape ecological analysis [21,22], ecological footprint [23,24], and basic and extended pressure–state–response model [25,26]. Despite a variety of evaluation work with different methods having been carried out, few studied the optimization of related ecosystem models from the perspective of land-use change.
Since the land use and cover change (LUCC) are the indicator of socio-economic composite system in time and space, the research focus of land use has switched from quantitative prediction to spatio-temporal simulation prediction. Many scholars have studied the spatio-temporal dynamic prediction models of land-use change extensively, such as the Conversion Of Land Use And Its Effects At Small Region Extent (CLUE-S) model [27], the System Dynamics (SD) model [28], and so on. The CLUE-S model can realize the synchronous simulation of different land-use changes, directly reflect the simulation results in the spatial location, and ensure the calculation accuracy, but it is only applicable to the land change pattern in small-scale areas [29]; the SD model can conduct comprehensive simulation from various angles of change and development according to the actual situation, but it cannot meet the demand for future scenario simulation of land cover driven by the coupling of natural and human factors on a long time scale [30]. Some machine learning based algorithms have been applied to LUCC detection or prediction, such as ANN (artificial neural network)—Cellular Automata (CA) [31] and Support Vector Machine (SVM) [32] models. The ANN-CA model is very simple, convenient, and accurate in obtaining conversion rules, but due to the “black box” in neural network Structure, users cannot clearly know the operation mechanism of the model, and it is difficult to understand the specific physical meaning of many model parameters [33]. The SVM model has high precision, fast speed, and can monitor land use in a long sequence, but it is lack of multifaceted situation prediction. Cellular Automata–Markov (CA-Markov) model provides a convenient method for solving the problem of spatiotemporal dynamic modeling of LUCC changes in complex systems [34]. The ability of the model to integrate geospatial, remote sensing data, socio-economic data, and various information can more comprehensively simulate the change process of land-use change rate.
As an important link between the two national strategies of the “One Belt One Road” and the Yangtze River Economic Belt, the Yangtze River Delta (YRD) region is a key platform for China to participate in international competition and an important engine for economic and social development. The YRD region plays a pivotal role in the overall situation of the country’s modernization and opening up. With the in-depth promotion of regional urbanization construction and the transformation and upgrading of industrialization, the expansion areas and development degree of urban land have increased gradually, which have not only dramatically changed the regional land use and coastal land ecological pattern, but have also posed a serious threat to the land ecological health and land ecological security of urban agglomeration in the YRD.
Based on the socio-economic data and remote sensing image data of the YRD, the CA-Markov model was used to predict the land-use pattern of the three scenarios in 2025, and the PSR model was used to evaluate the ecological security of 2005, 2010, and 2015. The land-use model of this scenario predicted the ecological security model of the YRD in 2025, provided a scientific basis for the sustainable development of the YRD, and promoted the coordinated development of social economy and ecological environment.
2. Study Area and Data
2.1. Study Area
The YRD is one of the regions with the most active economic development, the highest degree of openness, and the strongest innovation ability in China. It plays an important strategic role in the overall situation of China’s modernization and all-round opening-up pattern. In this study, the YRD region refers to the YRD urban agglomeration included in the “YRD Urban Agglomeration Development Plan”. The plan was approved by the State Council in May 2016, including 26 cities such as Shanghai, Nanjing, and Hangzhou (Figure 1). The landform is mainly plain, with an altitude of less than 10 m, and low hills between the southwest and the south. The land area of the whole region is 211,700 square kilometers, accounting for 2.21% of the total land area of the country. It is located in the subtropical monsoon climate area, with an annual precipitation of 800–1600 mm. It is hot and rainy in summer. In addition, coastal beaches and wetlands are relatively rich in resources, and superior natural and geographical conditions provide a good resource and environmental background foundation for the development of YRD area.
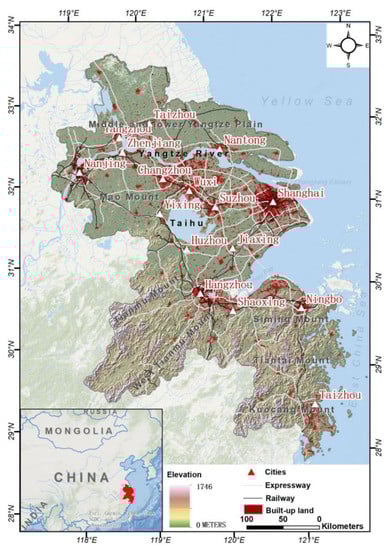
Figure 1.
Location map of the study area.
2.2. Data Source
The influencing factors of urban land-use change are complex. In the selection of factors, we should pay attention to the comprehensiveness of various factors, including natural factors and economic factors, as shown in Table 1.

Table 1.
The data used in the study.
3. Methodology
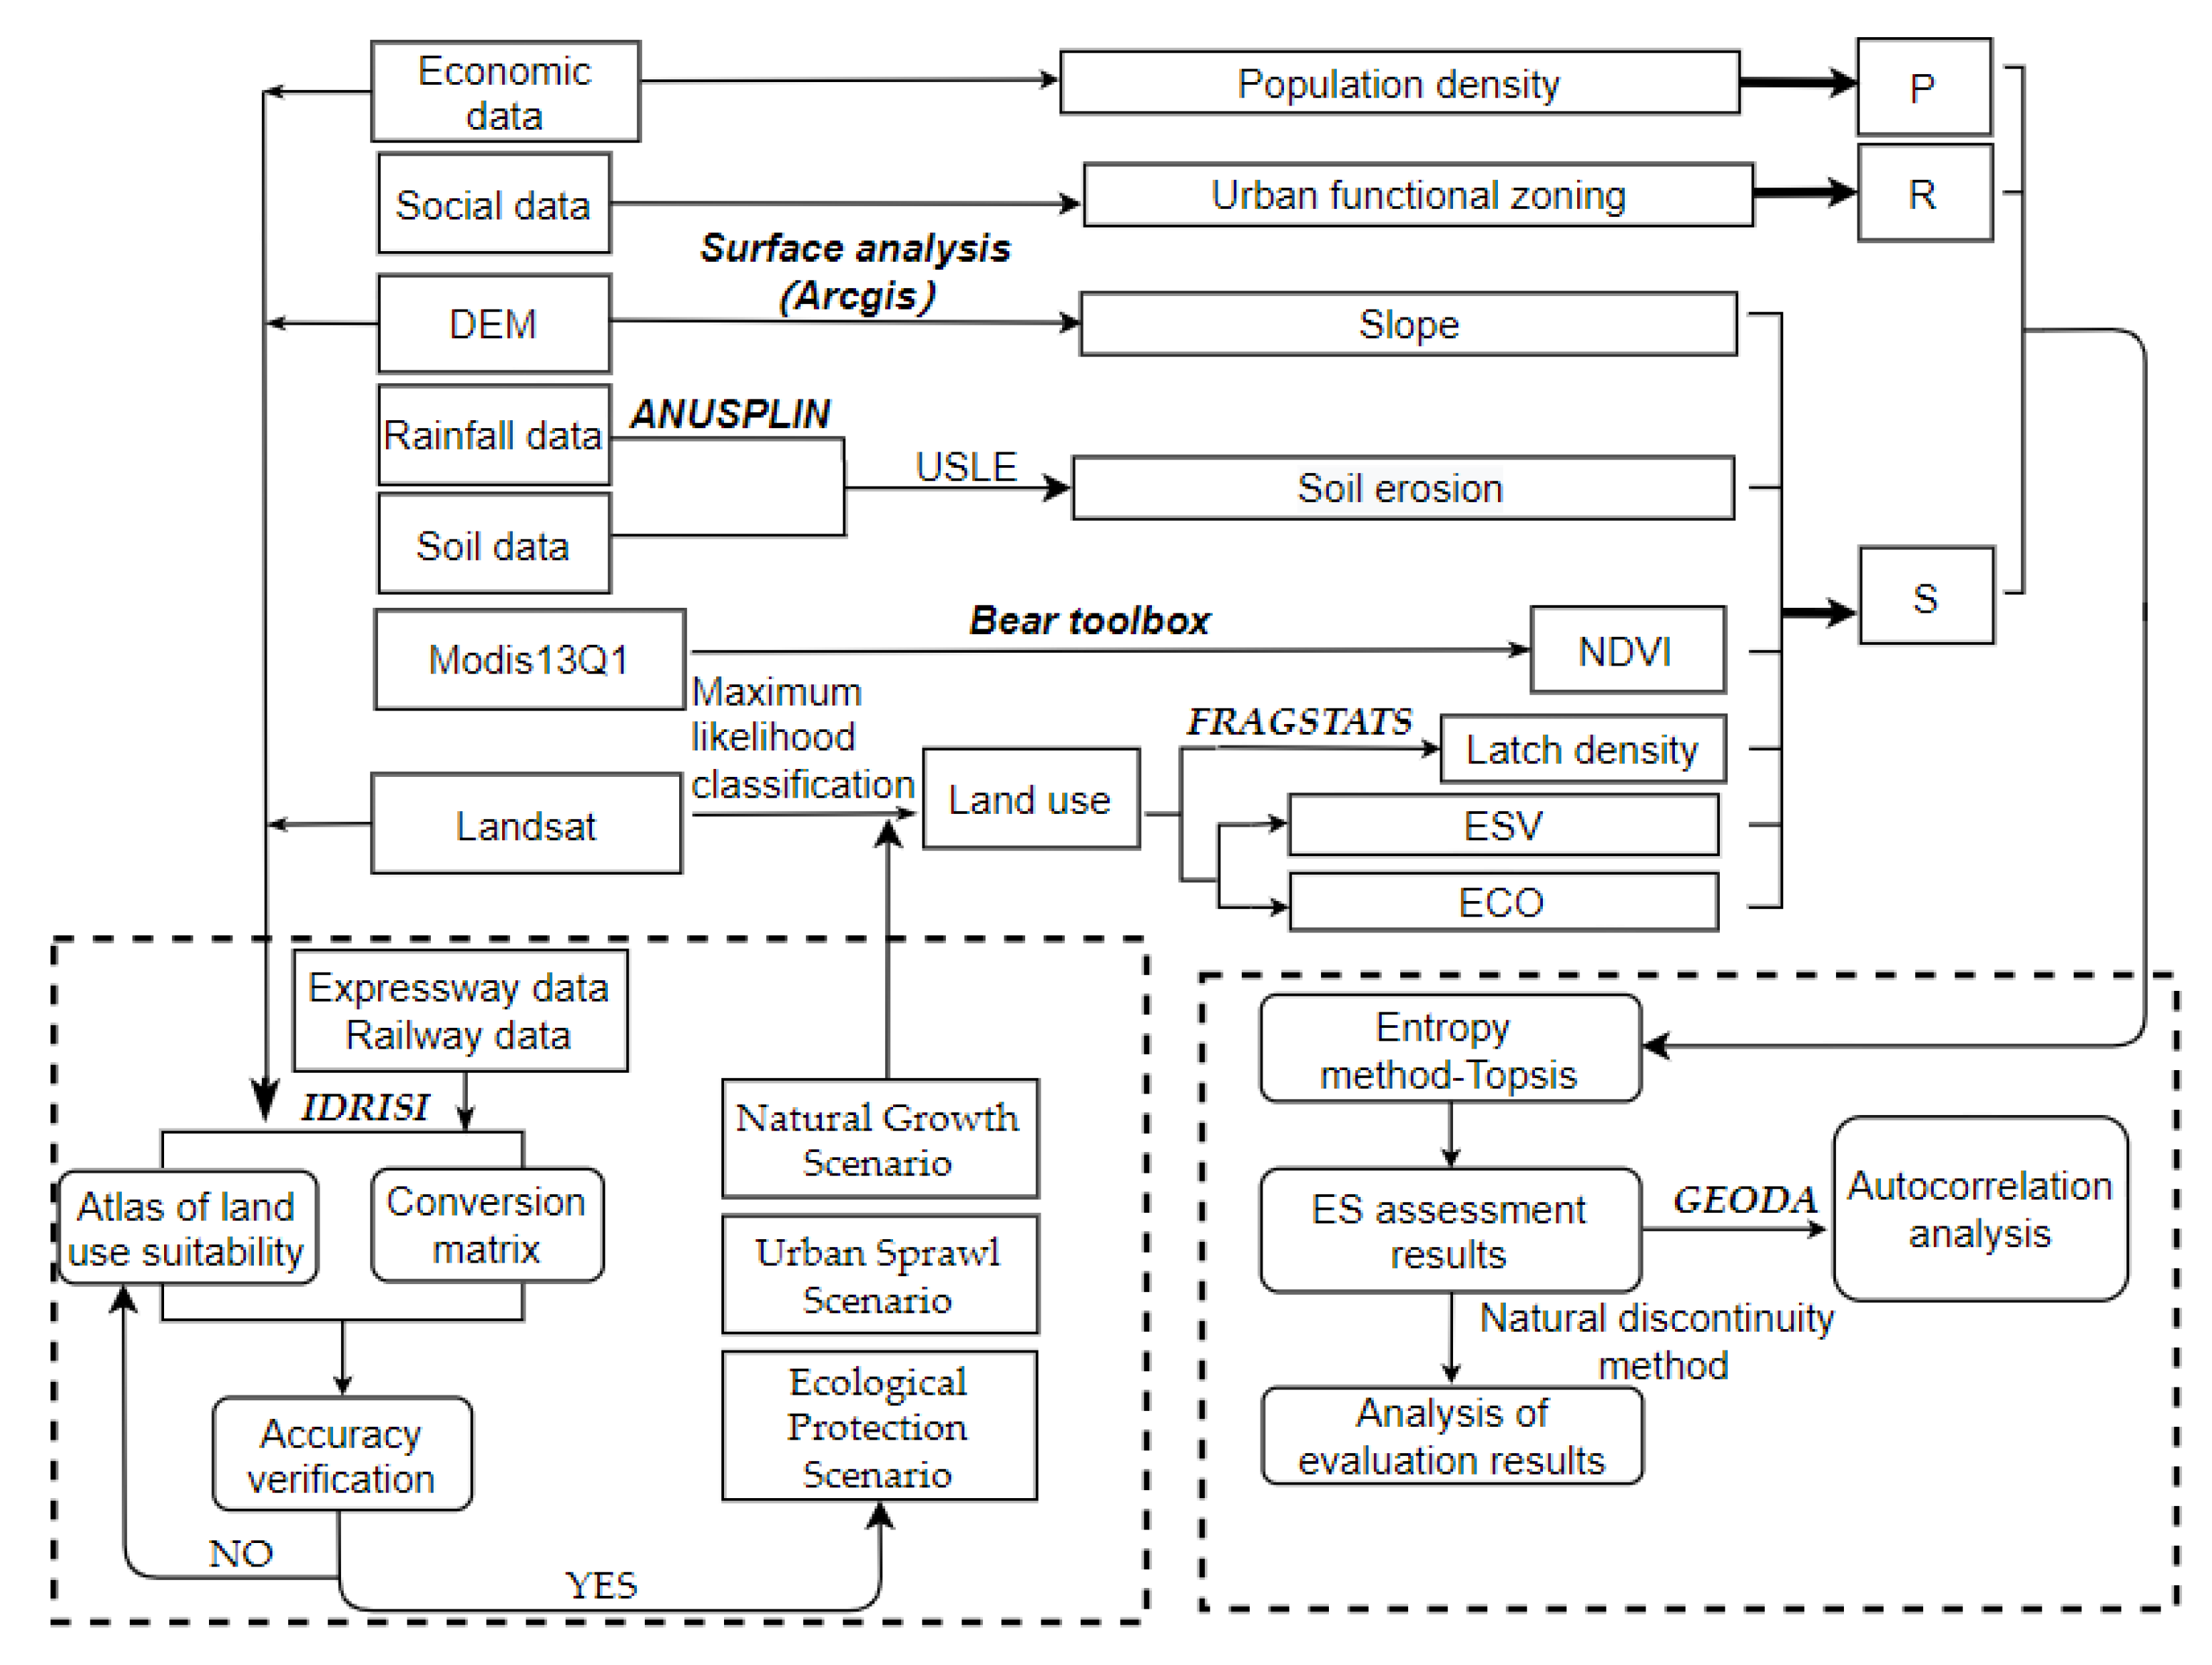
This study includes three processes (Figure 2): land-use classification, future land-use simulation, and ecological security pattern evaluation.
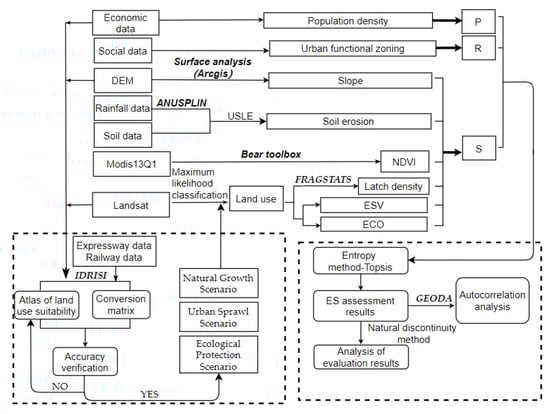
Figure 2.
Technical flowchart.
3.1. Land-Use Classification
All the Landsat TM (2005 and 2010) and OLI (2015) images used in this paper have passed the system radiation correction. Based on the ground control points and DEM data, the geometric fine correction has been realized, which eliminates the deviation caused by the sensor platform, earth rotation, earth curvature and topographic factors, and meets the accuracy requirements of data processing and analysis in this paper. In addition, due to the wide coverage of the YRD, and more clouds and fog in some areas, it was impossible to accurately judge the land-use type at the cloud and fog covered areas. Therefore, it was necessary to use images with similar time phase and no cloud occlusion to supplement and replace the cloud covered area, so as to ensure the image integrity of the YRD in each research period and meet the research needs.
The platform carried out maximum likelihood classification under the ENVI5.1, combined the near-infrared band, NDVI band, and the first band of principal component analysis, selected the training sample area based on visual interpretation, performed supervised classification, and obtained the maximum likelihood classification map. The training sample area was selected in the toolbar ROI, and the selection, color matching, and naming of the training sample area were completed and saved in this operation interface to facilitate subsequent modification. Remote sensing images and ROI files of training sample area under the prompt of the operating system were added to perform the maximum likelihood classification operation, and the classification post-processing was conducted.
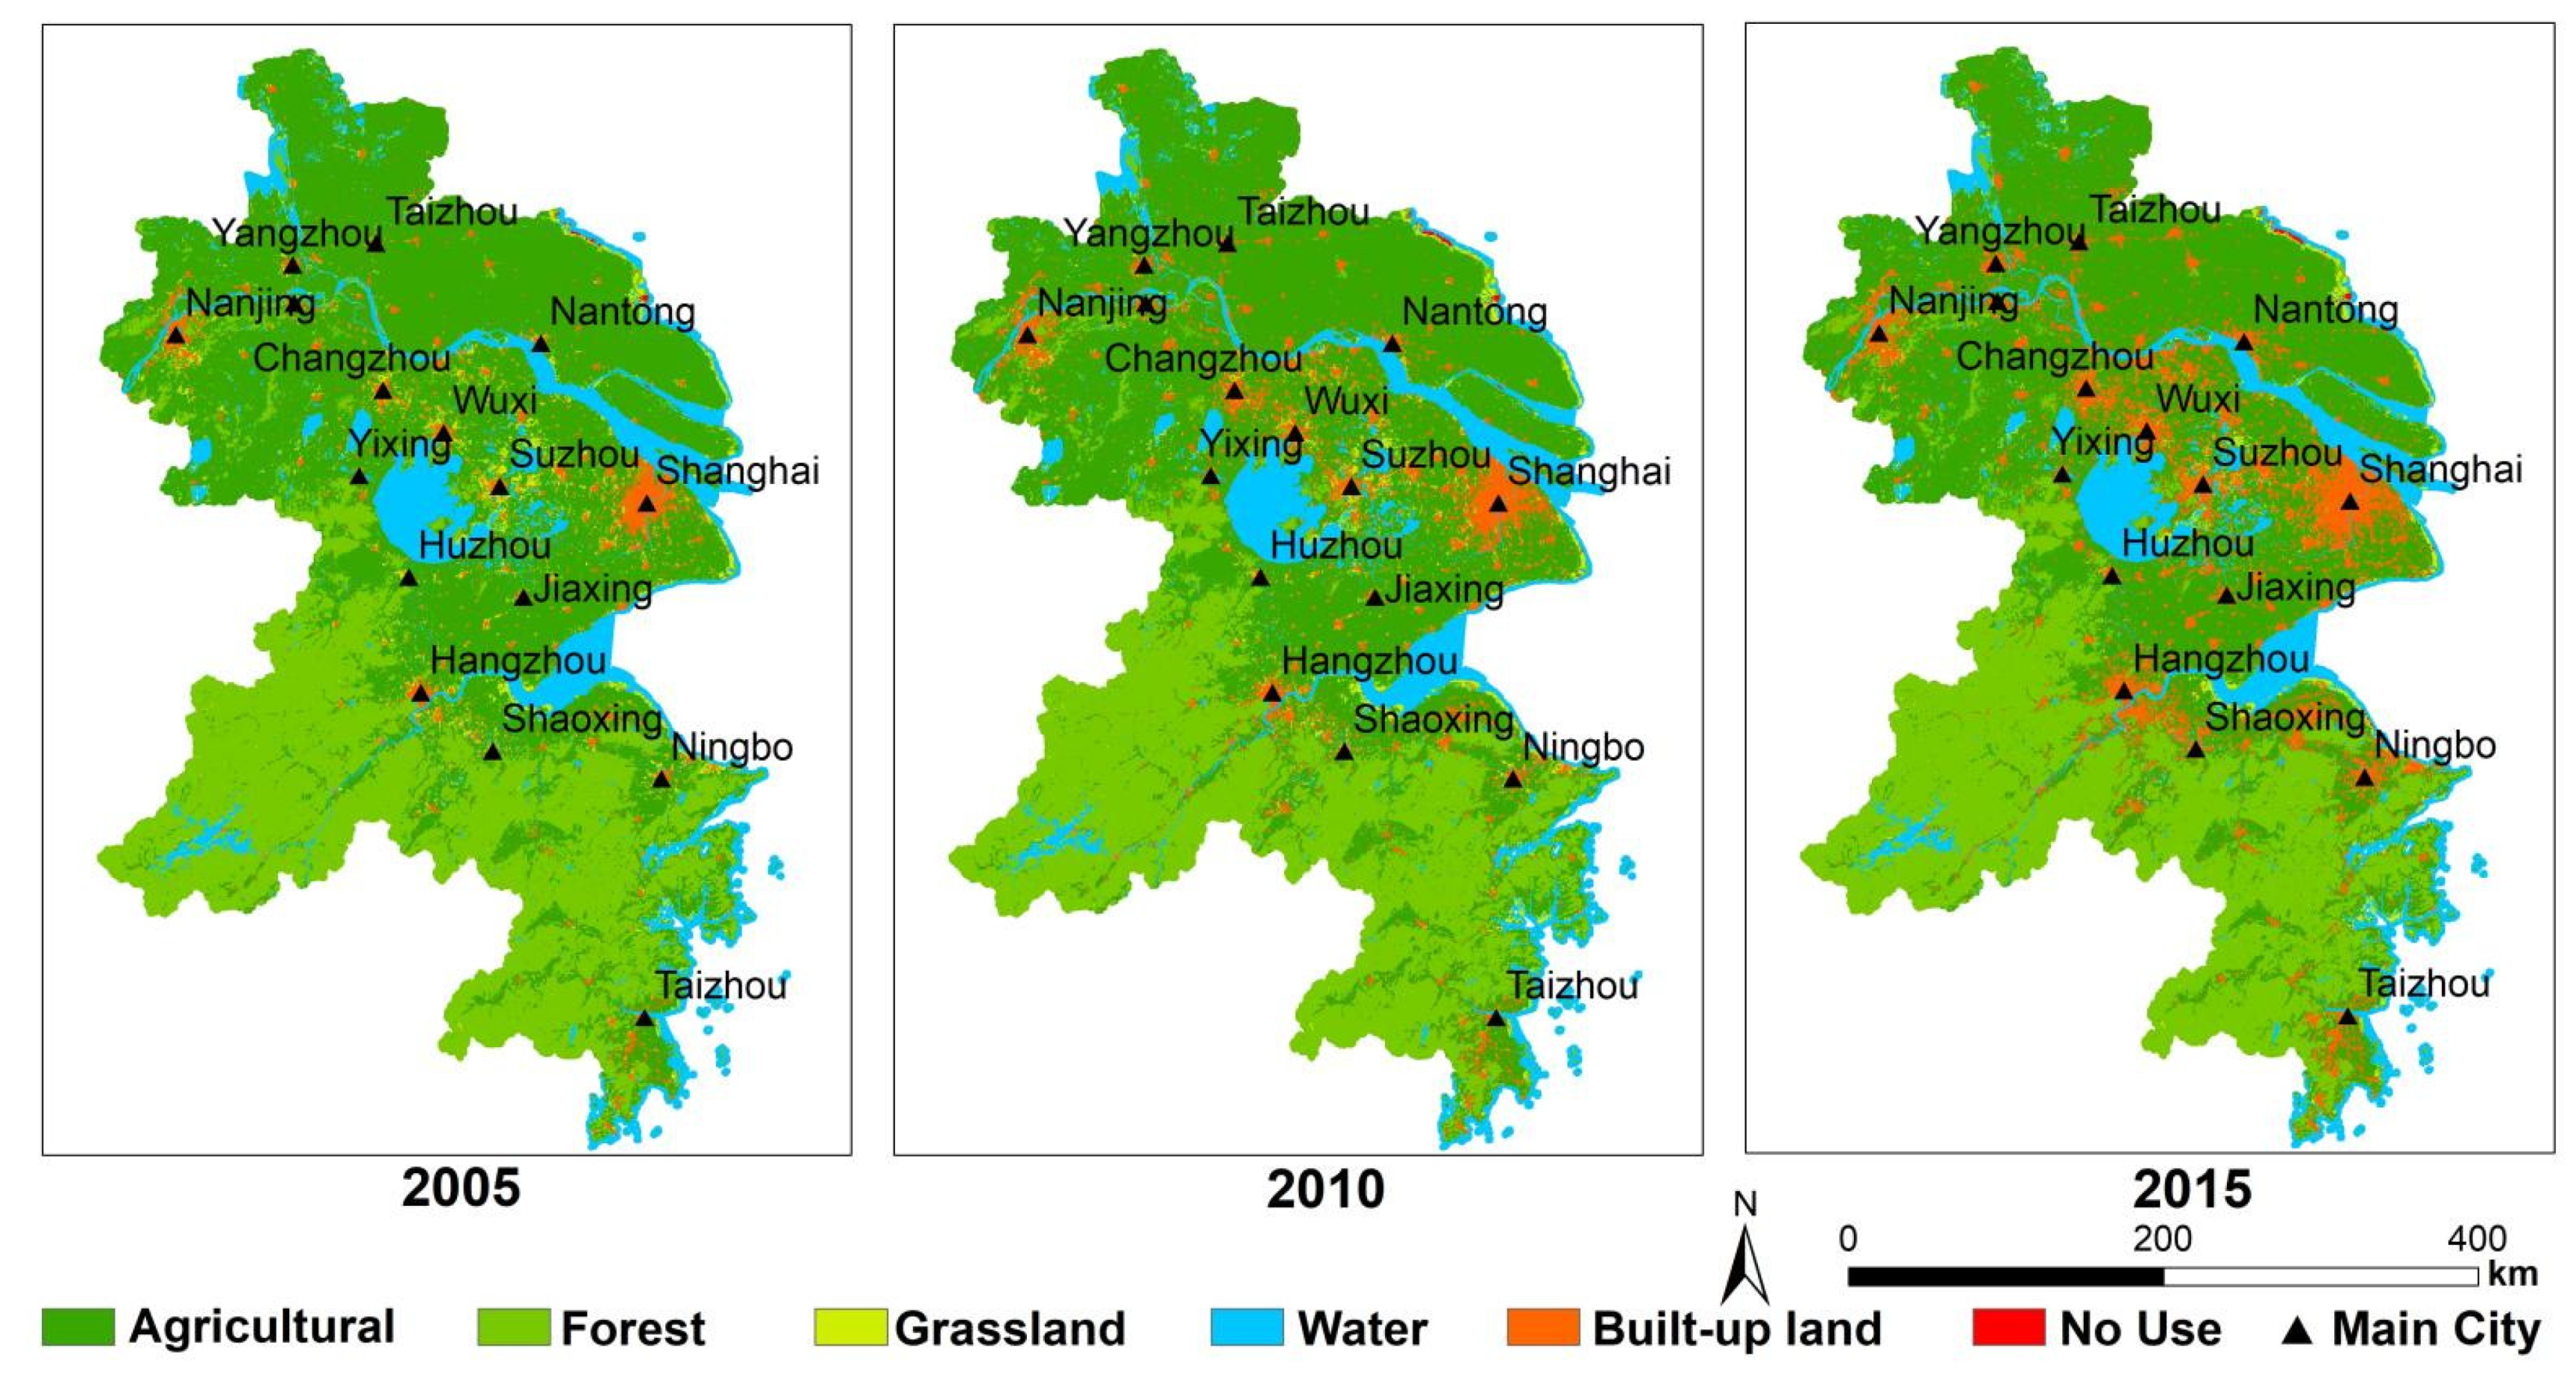
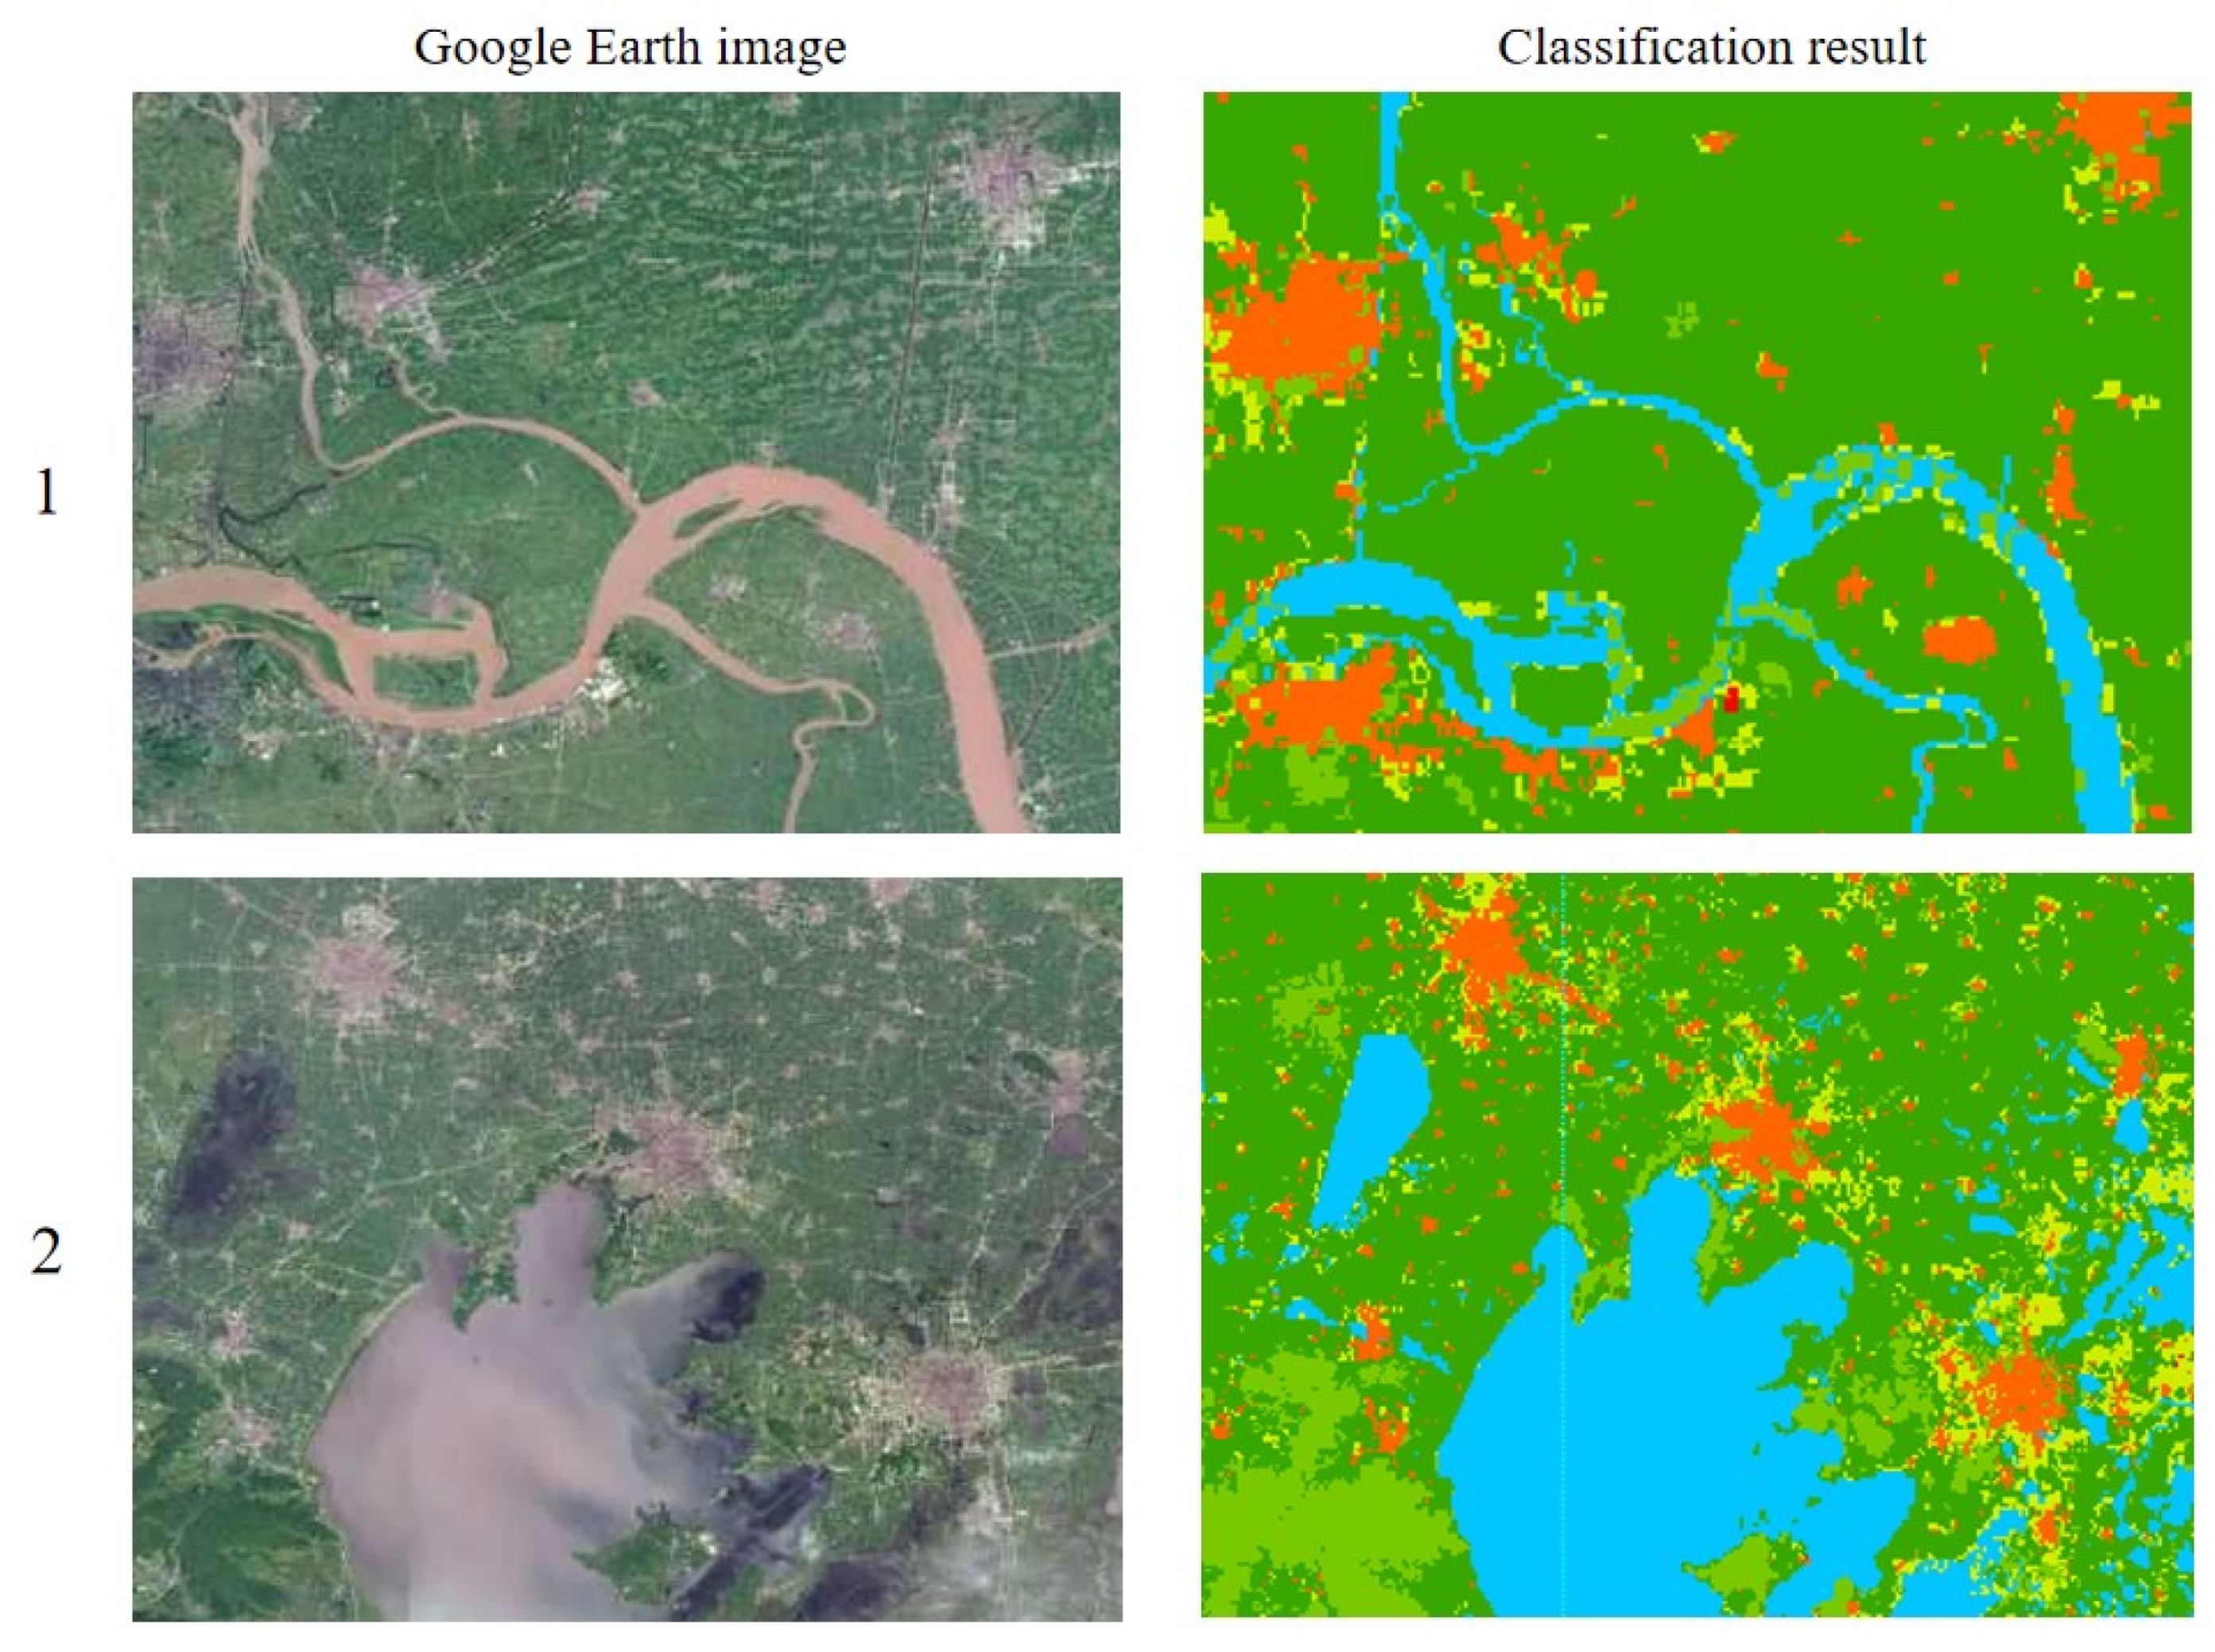
Regarding the purpose of classification accuracy evaluation, all of the 450 randomly and uniformly generated points in the interpretation results were compared with the high score images, the comparison matrix was established, and the classification accuracy was calculated. It was concluded that the extraction accuracy of land-use remote sensing information in this paper was greater than 85%, which meets the requirements of this study. Finally, the land use in the study area in 2005, 2010, and 2015 is present in Figure 3, while the local verification comparison is shown in Figure 4.

Figure 3.
The land-use types of the YRD in 2005, 2010, and 2015.

Figure 4.
The local comparison of classification results.
3.2. LUCC Simulation
Based on land-use images, this study used IDRISI model to calculate land-use transfer probability matrix and made suitability atlas, and finally completed the prediction through the CA-Markov model.
3.2.1. Land-Use Transfer Matrix
The Markov chain is a traditional method for modeling land-use change. In the Markov process, the future state of the system only depends on the current state, and its stability is dominant [34]. The Markov chain describes the change in land use from one period to another, and forecasts the future change on this basis. One of its disadvantages is that it lacks spatial knowledge, that is, neither the geographical factors nor the spatial distribution of each land-use type was considered [35].
In Formulas (1)–(3), St is the state of the random event at: time; St+1 is the state of the random event at time t + 1; P is the transition matrix with a value of 0~1; and n is the land-use type.
This study used the Markov module in IDRISI to obtain the land-use transfer matrix. The land use in 2005 and 2010 were taken as the basic data, the image time interval and period were set to 5A, and the proportional error was set to 0.15 to obtain the transfer probability and transfer area of each land type from 2010 to 2015.
3.2.2. Land-Use Image Prediction
CA is a dynamic model with discrete time, space, and state, which has the characteristics of spatio-temporal calculation. The model reflects the dynamics of land-use change based on the transition rules driving the change in land units from one state to another [36]. CA model available:
In Formula (4), t and t + 1 are the time before and after the cell is located; S is the cell state aggregation; f is the transformation rule; and N is the cell neighborhood.
This study used LOGISTIC module to select altitude, slope, distance from town, distance from highway, and distances from railway and population as simulation driving factors to establish suitability atlas. Based on the land use data in 2010, the CA-Markov module was used to import the transfer probability matrix between 2010 and 2015, and the filter was set to 5 × 5. The number of CA cycles was 5, and the land-use simulation map in 2015 was obtained.
In 2015, land-use images and simulated images were imported into the cross table tool of IDRISI software for accuracy verification. The kappa value was 0.81, the error of the number of grids in different regions was mostly about 2%, the proportion of different regions was relatively close, the simulation effect of the model was excellent, and the reliability of the results was high.
3.2.3. Scene Modeling
Due to the rapid development of the YRD over the years, considering that the cultivated land area has been reduced to a certain extent, this study determined three future simulation scenarios by inhibiting the reduction in cultivated land and promoting urban development: “Natural Growth Scenario (ND)”, “Urban Sprawl Scenario (US)”, and “Ecological Protection Scenario (EP)”. Repeated steps 3.3.1 and 3.3.2, and realized scenario prediction by changing the transfer matrix of land type (Table 2) according to the research of the same model and the same background [37].
Table 2.
Land transition probability matrix under different scenarios from 2015 to 2025 (US and EP omit the same transition probability as ND).
Scenario 1 is an ND: there is no restriction on any rules and the development rules of YRD urban agglomeration from 2005 to 2015 are followed.
Scenario 2 is a US: based on the needs of economic and urban development, its urban construction is promoted, while the conversion probability of cultivated land and forest land to built-up land is increased. The conversion probability of other land remains the same.
Scenario 3 is an EP: based on the vision of environmental protection, the protection of basic farmland and forest land is highlighted, and the conversion probability of forest land and cultivated land to built-up land is reduced. The conversion probability of other land remains the same.
3.3. Comprehensive Evaluation Model
3.3.1. Index System
High intensity land use is the main factor leading to the deterioration of regional land ES. The acceleration of urbanization and the overexploitation of built-up land undermine the stability of ES [38,39]. Illegal occupation of cultivated land, overgrazing, and cutting down trees cause large areas of land desertification [40]. The change in land type brings pressure to the local ecological environment and affects the regional ES to a certain extent. Nowadays, due to the seriousness of the problem, a series of measures have been made, such as the establishment of nature reserves, and the restrictive effects of various governments on regional land spatial planning, which have resulted in the improvement of the land ecological level to a certain extent. We selected the pressure state response (PSR) model to construct the ES pattern of urban agglomeration in the YRD from three aspects: land ecological change pressure, land ES state, and land ecological regulation response. The domestic total population density index is selected to represent P, which is used to represent the oppression brought by the process of urbanization. S can be reflected by land ecological structure security, functional security, and land ecological restoration capacity. Normalized Difference Vegetation Index (NDVI), soil erosion, patch density (PD), ecosystem service value (ESV), ecosystem elasticity (ECO), and slope were chosen to represent regional conditions. R can be selected by ecological functional areas to improve adverse effects.
Among them, the population density was obtained from the statistical yearbook and reduced to 1 × 1 square kilometer; the USLE Model was used for soil erosion, and thin disk interpolation is used for precipitation data. The MODIS data were processed by MRT and bear toolbox software, and NDVI was obtained by normalization, background value removal, and clipping through ENVI5.1. The land-use data were imported into FRAGSTATS to calculate the patch density. ArcGIS 10.3 was used to obtain slope from digital elevation model data. ESV and ECO were calculated according to land-use types [37,41]:
ESV = 820260.95 × Agricultural area + 3940320.9 × Forest area + 1787961.33 ×
Grassland area + 5971781.53 × Water area
Grassland area + 5971781.53 × Water area
ECO = (0.5 × Agricultural area + 0.9 × Forest area + 0.6 × Grassland area + 0.8
× Water area + 0.2 × Built-up land + 0.3 × No use)/total area
× Water area + 0.2 × Built-up land + 0.3 × No use)/total area
3.3.2. Entropy Weight TOPSIS Model
Technique for Order Preference by Similarity to Ideal Solution (Entropy Weight TOPSIS) is a comprehensive evaluation method proposed by Hwang and Yoon in 1981, which is suitable for comparing and selecting multiple schemes according to multiple indicators. The basic idea is to determine the Euclidean distance between each scheme and the positive and negative ideal value, so as to obtain the similarity between the scheme and the optimal scheme, and judge the advantages and disadvantages of each scheme [42]. The determination of weight is an important aspect of the TOPSIS method, while the weight of the traditional TOPSIS method is determined in advance and has certain subjectivity. The Entropy Weight method determines the objective weight according to the variability of the index. Therefore, the use of Entropy Weight method can eliminate the impact of subjective weighting on the evaluation results to a certain extent [43]. Based on this, this paper uses the Entropy Weight TOPSIS method to comprehensively evaluate the ecological security of urban agglomeration in the YRD. The calculation steps are as follows:
Step 1. Standardize the selected indicators (Formulas (7) and (8)):
where Xij is the raw data of the indicator i in j years, and Pij is the value after standardization;
Step 2. Calculate the standardized evaluation matrix (Formulas (9)–(11)):
where Rij is the normalized value of Xij, m is the number of evaluation indexes, n is the number of evaluation years, ei is the entropy of the index, and wi is the weight of the index.
Step 3. Establish weighted decision evaluation matrix (Formula (12)):
where the weight vector W is composed of the index weight wi, and the weighted normalization matrix V is obtained by combining the standardization matrix P.
Step 4. Determine the positive and negative ideal solutions V+ and V− (Formulas (13) and (14)):
Step 5. Calculate the Euclidean distance between the evaluation values and the positive (negative) ideal solution (Formulas (15) and (16)):
Step 6. Calculate the pasting progress.
The posting progress is usually represented by Tj, which represents the proximity between the annual evaluation objectives and the optimal scheme (Formula (17)):
Obviously, Tj ∈ (0, 1). When Tj tends to 1, it indicates that the evaluation object is more proximate to the ideal solution, and when it tends to 0, it indicates greater distance.
The ES evaluation system is shown in Table 3, and the results were categorized into five grades: unsafety, relative unsafety, general safety, relative safety, and safety (Table 4).
Table 3.
The evaluation index system of YRD ecosystem.
Table 4.
The classification standard of ES pattern of urban agglomeration in YRD.
3.4. Spatial Autocorrelation Analysis
Spatial autocorrelation analysis is used to measure whether the distribution of spatial variables has aggregation [44]. The ES evaluation results were imported into GeoDA to obtain Lisa diagram and Moran’s I value. Moran’s I can be used to measure the similarity (positive correlation) or difference (negative correlation) between the attribute values of observation units and surrounding units (Formula (18)).
Lisa shows the significant spatial aggregation degree of similar values around the observation points, and the local spatial aggregation, namely, hot spots, is determined as the significant location of Lisa (Formulas (19) and (20)).
where n is the number of spatial units, and represent the observed values of unit i and unit j, respectively, () is the deviation between the observed value and the average value on the ith spatial unit, and is the spatial weight matrix established based on the adjacency relationship of spatial K.
4. Results
4.1. LUCC Simulation
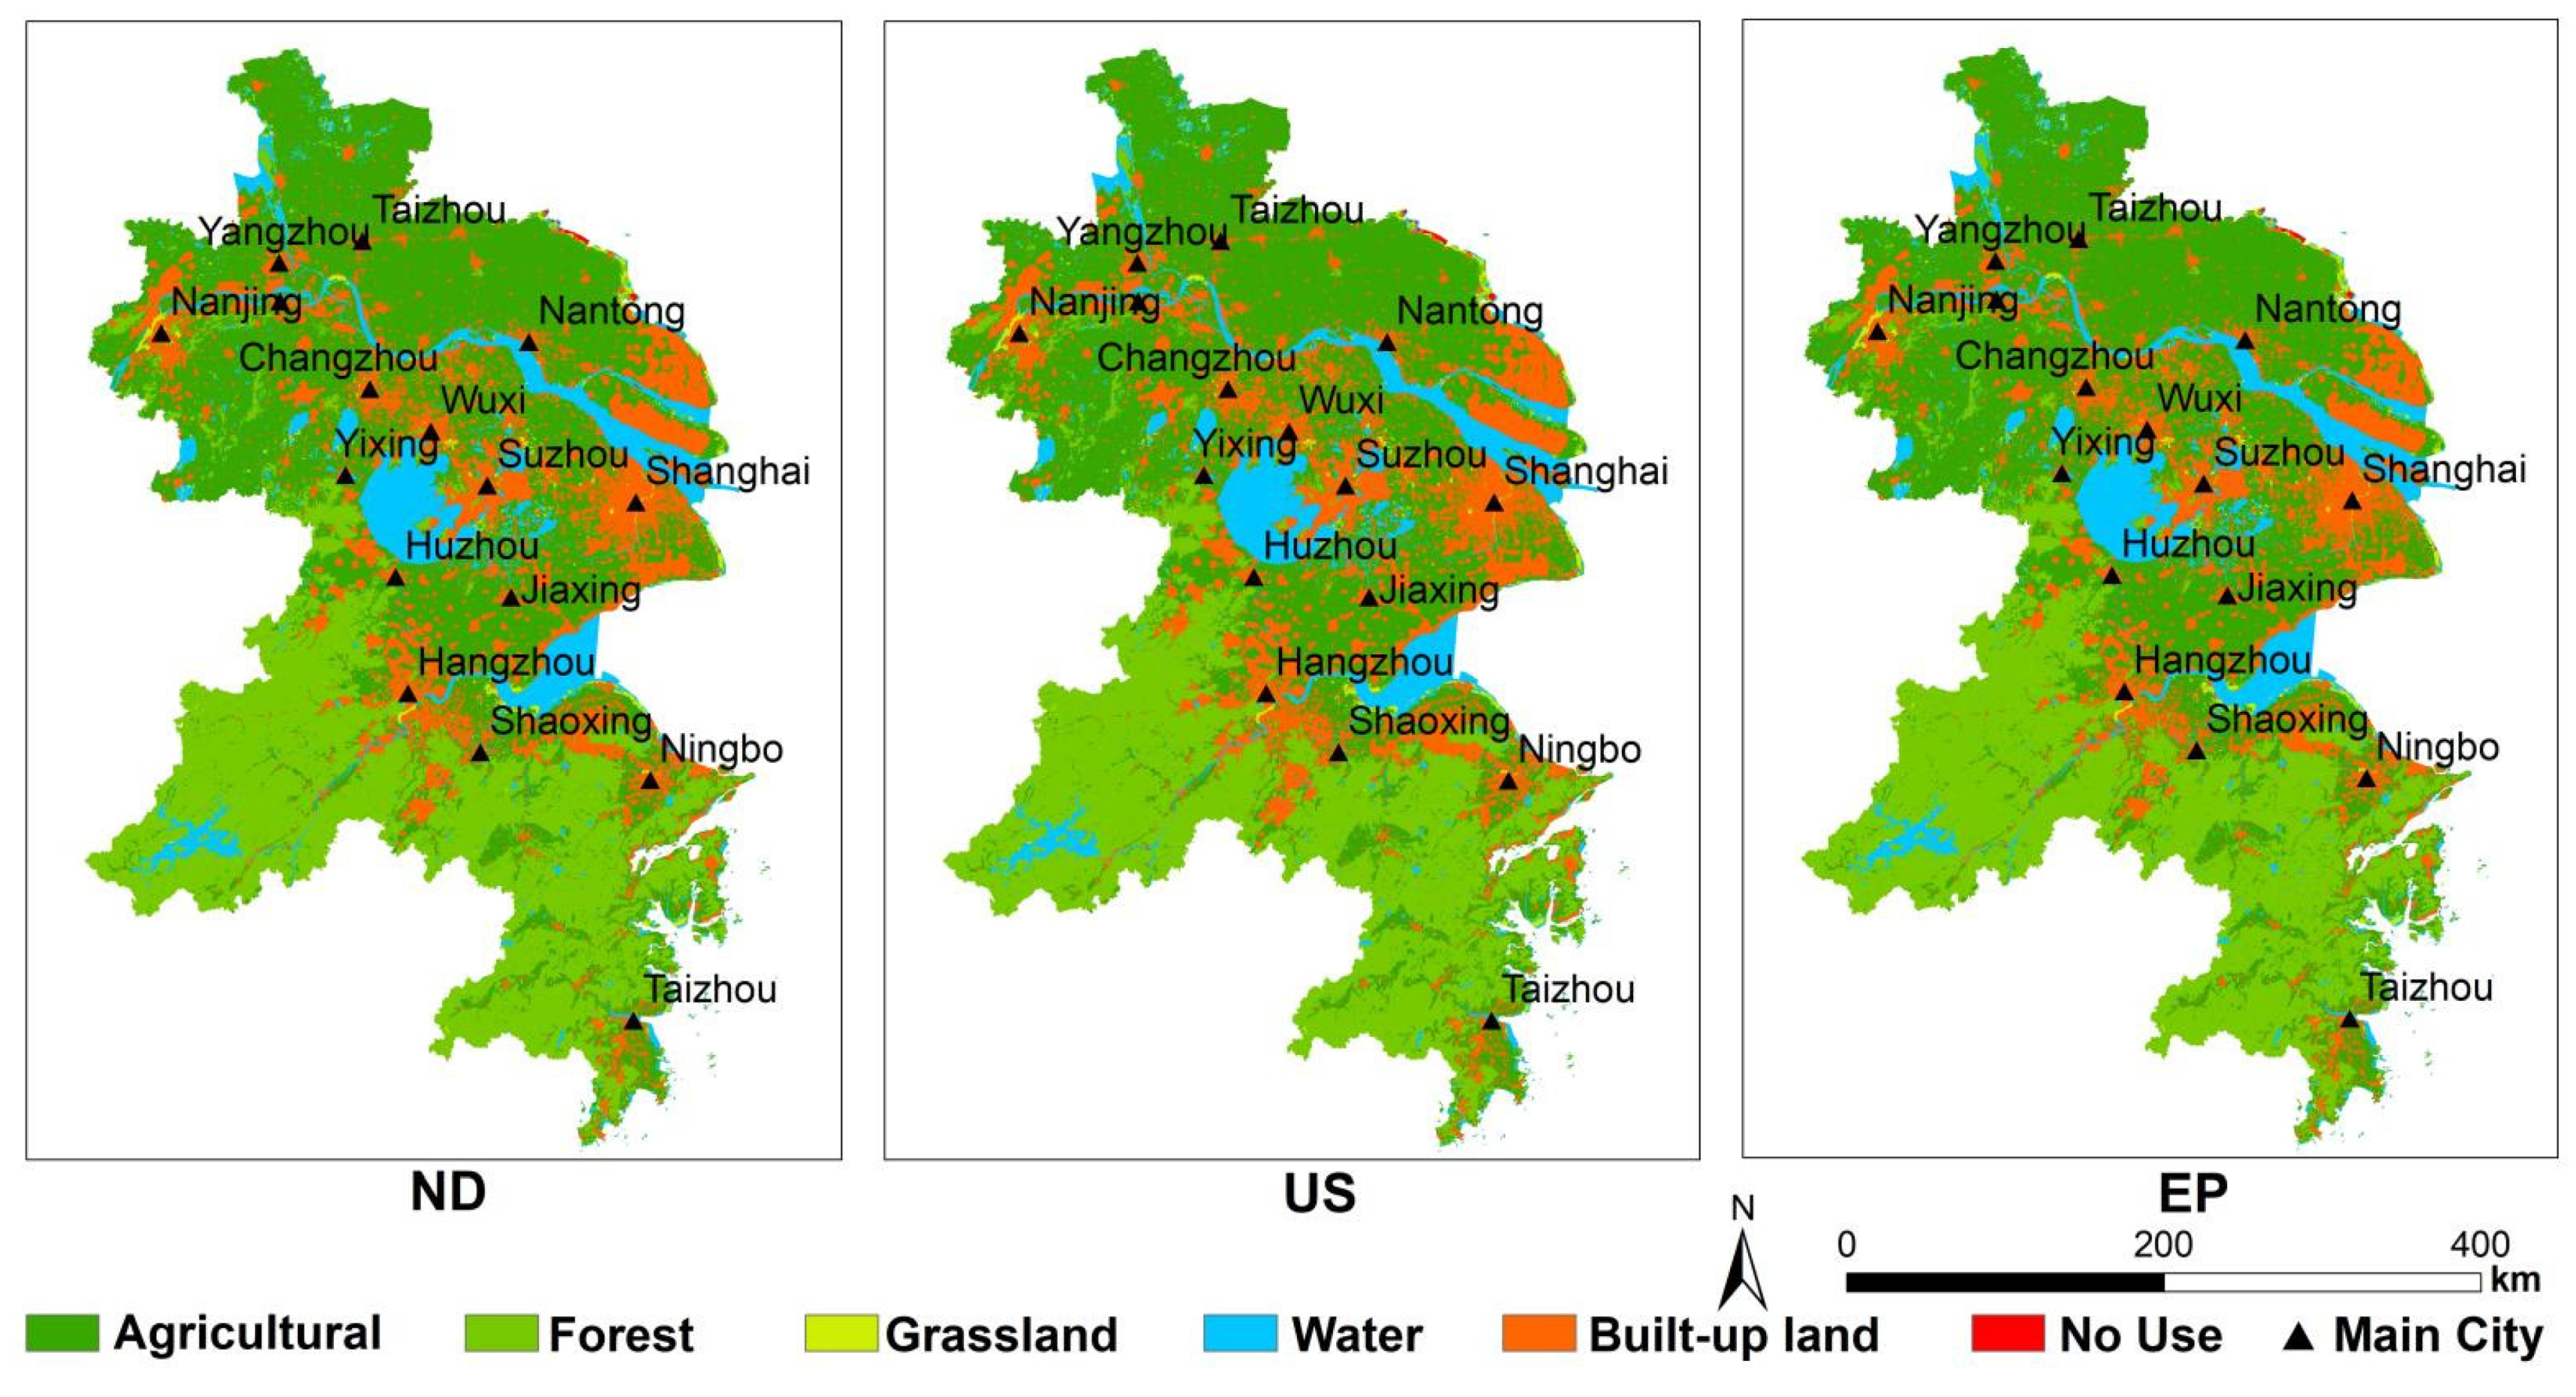
According to the regional land-use data distribution of YRD urban agglomeration from 2005 to 2015, cultivated land has decreased significantly, mainly due to the occupation of urban expansion. Especially in the eastern region, along the East China Sea and the Yellow Sea in the East and the Yangtze River in the middle, which has many excellent ports and strong industrial foundation. At the same time, the pressure on population and resources is becoming more serious year by year. The prediction results of land use in 2025 show that the trend of urban expansion is becoming more and more serious (Figure 5).
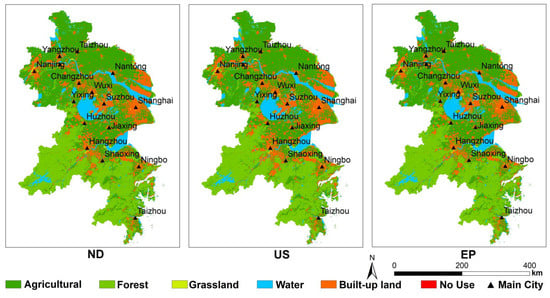
Figure 5.
The land-use types of the YRD under three scenarios.
4.1.1. ND Scenarios
Cultivated land is the main land type, accounting for 43.83% of the total area; forest land is second only to cultivated land, accounting for 28.44% of the total area. The built-up land is centered on the urban areas and expanded to the surrounding areas, whose portion is 17.76%. The areas of water body and the other land types account for 8.80% and less than 2%, respectively.
4.1.2. US Scenario
Under the urban sprawl scenario, farmland is the main land-use type, and followed by woodland. However, the trend of land-use change is obviously different from the other two scenarios. Firstly, the proportion of cultivated land and forest land is slightly lower than that of the other two scenarios due to their accelerated transformation. Secondly, the proportion of built-up land reaches 19.37% under the accelerated expansion of urban construction, which is significantly higher than that of the other two scenarios. This finding is most obvious in Shanghai, Nantong, and other coastal areas.
4.1.3. EP Scenario
Under the eco-environmental protection scenario, cultivated land and forest land still occupy the dominant position, accounting for 44.83% and 28.53% of the total area respectively. Moreover, development progress of cultivated land and forest is prohibited, so their proportions are higher than other scenarios. Moreover, the built-up land in all parts of the territory is greatly reduced, especially in the coastal areas and their adjacent areas. The proportion of the whole built-up land area is only 16.66%.
4.2. ES Pattern
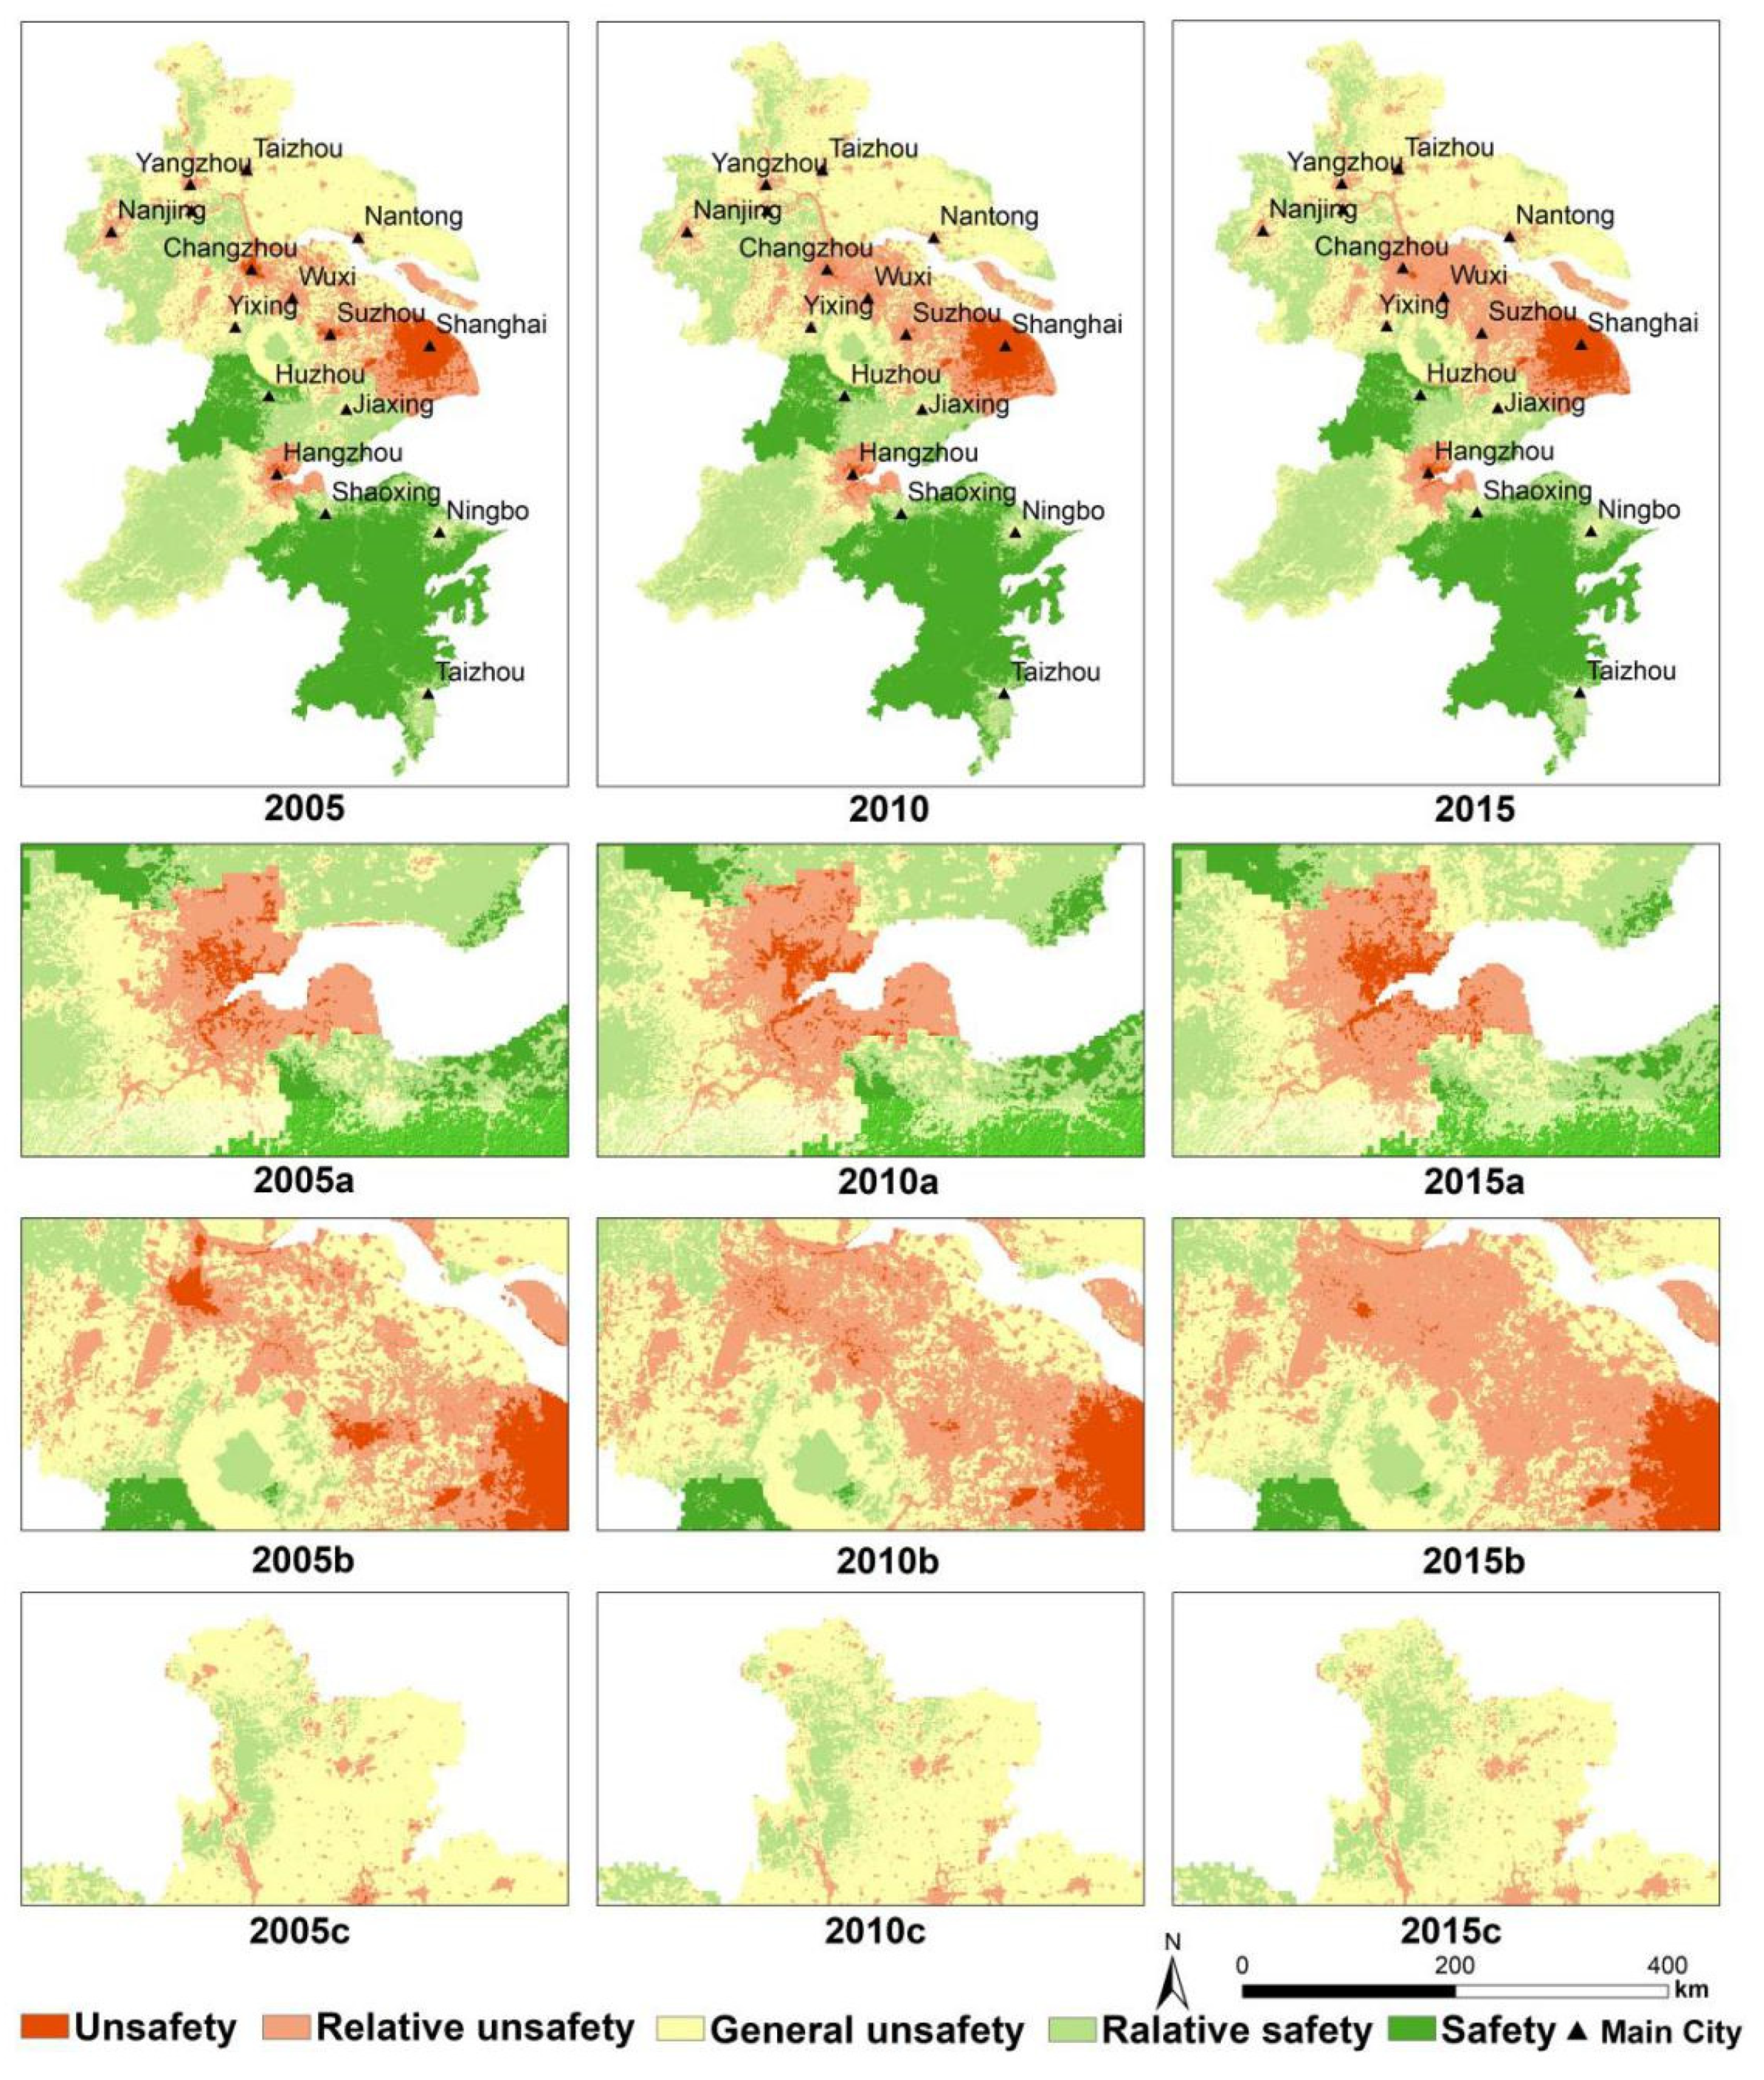
According to the ES results of the YRD from 2005 to 2015 (Figure 6), about 60% of the study area is at the level of “Safety” and “Relative Safety”, and 20% is at the level of “Unsafety” and “Relative safety”. From the perspective of spatial distribution, the overall ES pattern of urban agglomeration in the YRD shows that the central coastal area is low, and the inland and southern mountainous and hilly areas of urban agglomeration are good. The southwest side of the urban agglomeration around Taihu Lake is above “General safety”. Compared with the ES of each urban area, the eastern area is worse than the western area.
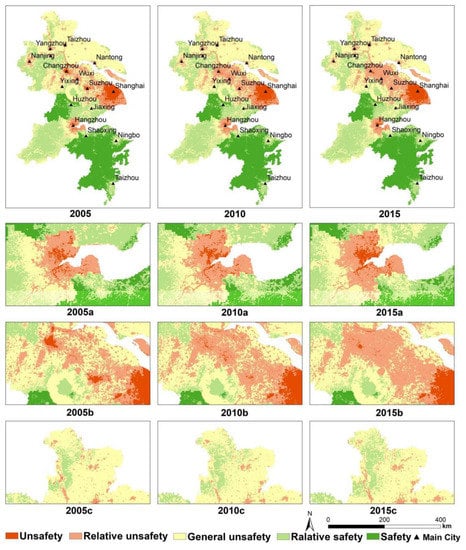
Figure 6.
The ES pattern of the YRD in 2005, 2010, and 2015 (where a, b, and c represent their respective regions, respectively; 2005a, 2010a, and 2015a represent the ES pattern of region a in 2005, 2010, and 2015, respectively. The rest are the same).
In terms of time distribution, the distribution of ES in YRD urban agglomeration from 2005 to 2015 is roughly the same, but the gap is obvious in some regions. The “Unsafe” areas in the eastern coastal area are expanding year by year, while the “Unsafety” areas are expanding intensively. As a result, the aggregation of ES is downgraded by one level. Hangzhou can be regarded as a typical area, and it pays attention to urban planning and environmental greening in the process of economic development (Figure 6a). The “Unsafe” areas around Taihu Lake are getting better year by year, but the “Relative unsafe” areas are becoming increasingly larger. Consequently, the ES between urban areas is declining, forming a large area of poor quality (Figure 6b). It is worth noting that the development of inland urban agglomerations has improved year by year, especially in the northwest of the urban agglomerations in the YRD (Figure 6c), this area is mainly low mountains and hills, which is distant from the city.
4.3. Spatial Autocorrelation Analysis
In this study, GeoDA software was used to analyze the spatial autocorrelation of land ecological security index in YRD region, where p-value represents the probability, which reflects the probability of an event, and z-scores represent the multiple of the standard deviation, which can reflect the dispersion of a data set. The p-value of each landscape index is equal to 0.001 (Table 5), indicating that the spatial autocorrelation under 99.9% confidence is significant. The ES index in the study area is concentrated from 2005 to 2015, with few discrete points. The Moran’s I indexes in 2005, 2010, and 2015 are 0.981, 0.979, and 0.981, respectively (Figure 7), which are positive numbers, indicating that the ecological vulnerability index in the study area is positively correlated in space. Among them, the Moran’s I indexes in 2005 and 2015 are large, and the Moran’s I index in 2010 is the smallest, indicating that the ecological security aggregation degree of the study area is high in 2005 and 2015. During the study period, Moran’s I index decreased first and then increased, and decreased by 0.002 from 2005 to 2010, mainly due to the aggregation of discrete points in the first quadrant and the third quadrant; it increased by 0.002 from 2005 to 2015, mainly due to the role of the first quadrant and the third quadrant.
Table 5.
The significance analysis index of YRD in 2005, 2010, and 2015.
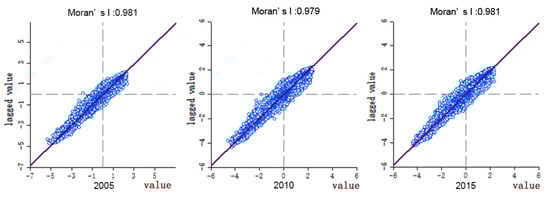
Figure 7.
Moran’s I of the YRD in 2005, 2010, and 2015.
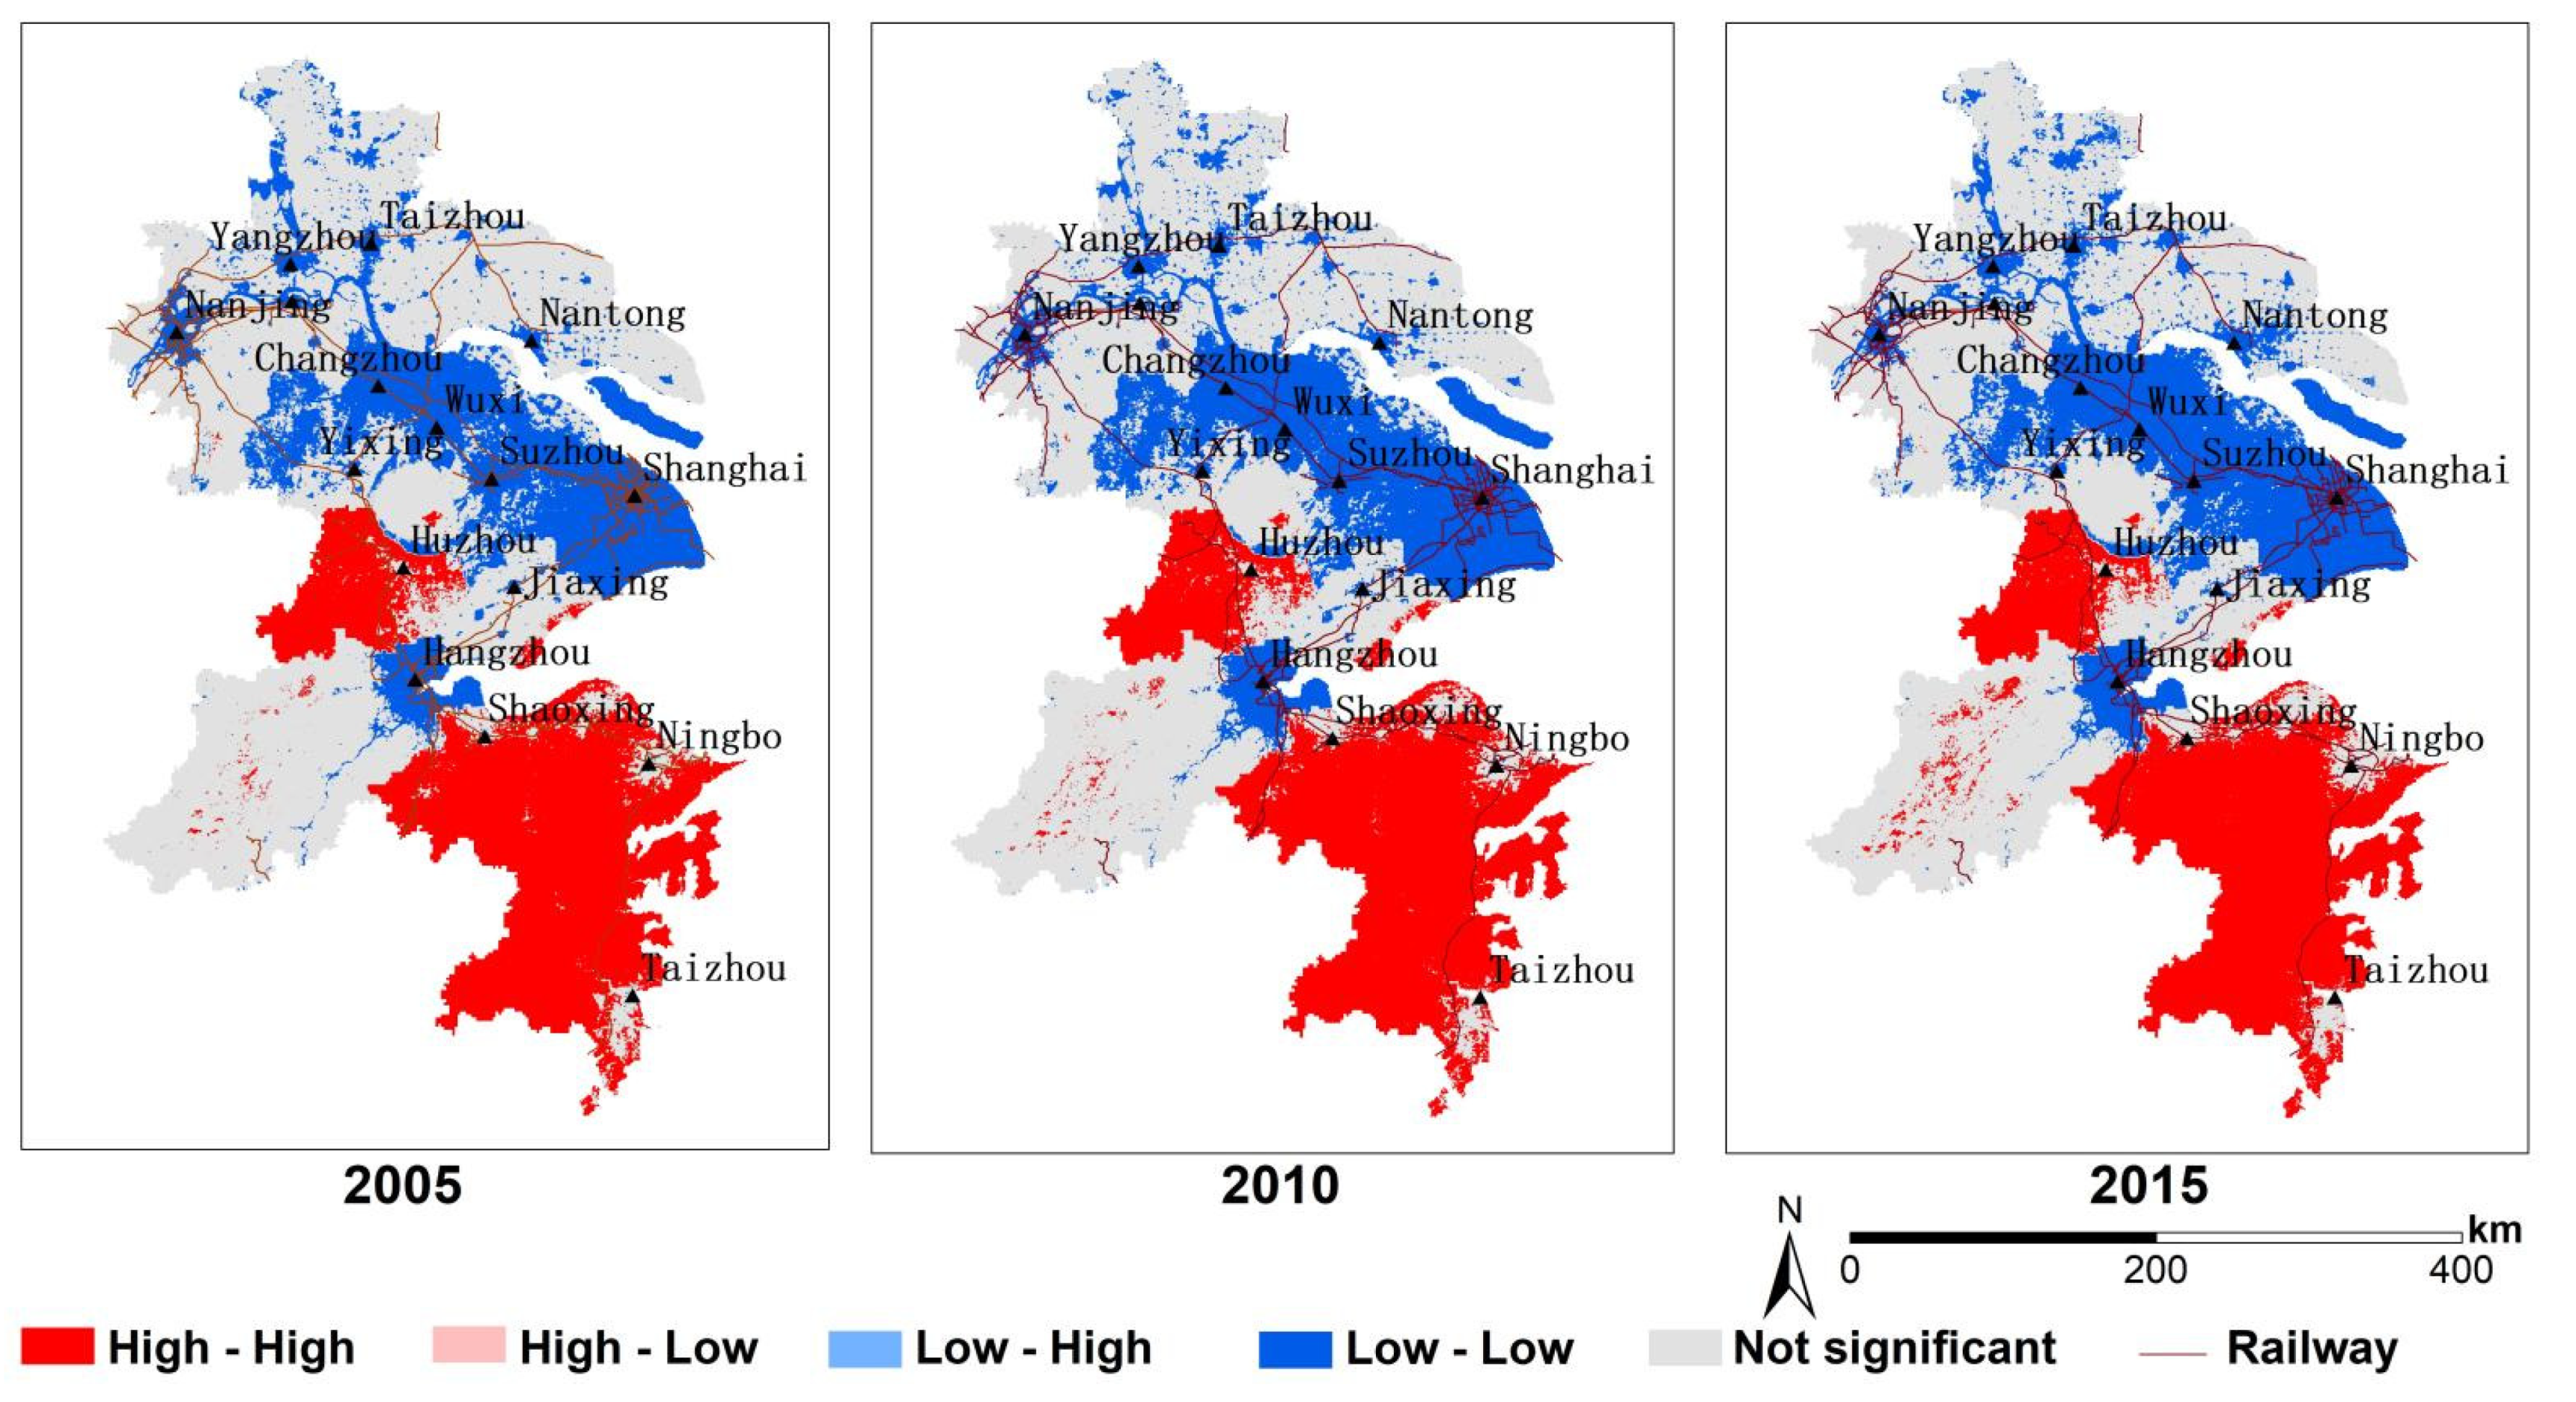
According to Figure 8 urban land expansion in the YRD region is mainly along the trunk network of the Yangtze River, Shanghai–Nanjing Railway, Shanghai–Hangzhou Railway, and other core cities (Shanghai, Nanjing, Hangzhou, Suzhou, etc.), and is spatially concentrated in a low degree. The local spatial correlation distribution of urban land development intensity in the YRD region is shown in Figure 8, and the dynamic change trend of urban land development and utilization pattern is obvious. The high-high cluster is mainly distributed in southern mountainous and hilly areas; the low-low cluster is concentrated in the Taihu Lake with developed industry. Due to the advancement of urbanization and industrialization, low-low clusters in the coastal areas of Nantong City have greatly increased. Moreover, urban land development is mainly expanded from the core cities (Shanghai, Nanjing, Suzhou, etc.) to the periphery, and the land development is concentrated and connected. Corresponding to the spatial and temporal pattern analysis of urban land development intensity, land development in the surrounding sub-region has been at a low level and the Lisa value is low. Future economic development should break through the existing ideas, make use of local unique natural resources to develop a green and environmentally friendly economy, and finally, to realize the coordination and complementarity of development advantages among cities.
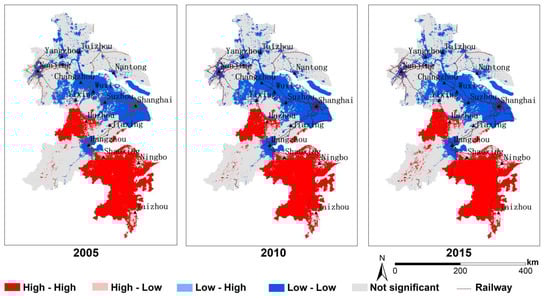
Figure 8.
The Lisa clustering map of YDR in 2005, 2010, and 2015: (1) high-high denotes spatial clustering of similar high values, (2) low-low denotes spatial clustering of similar low values, (3) low-high clustering denotes low values surrounded by high values, and (4) high-low clustering denotes high values surrounded by low values.
4.4. Scenario Simulation of ES Pattern
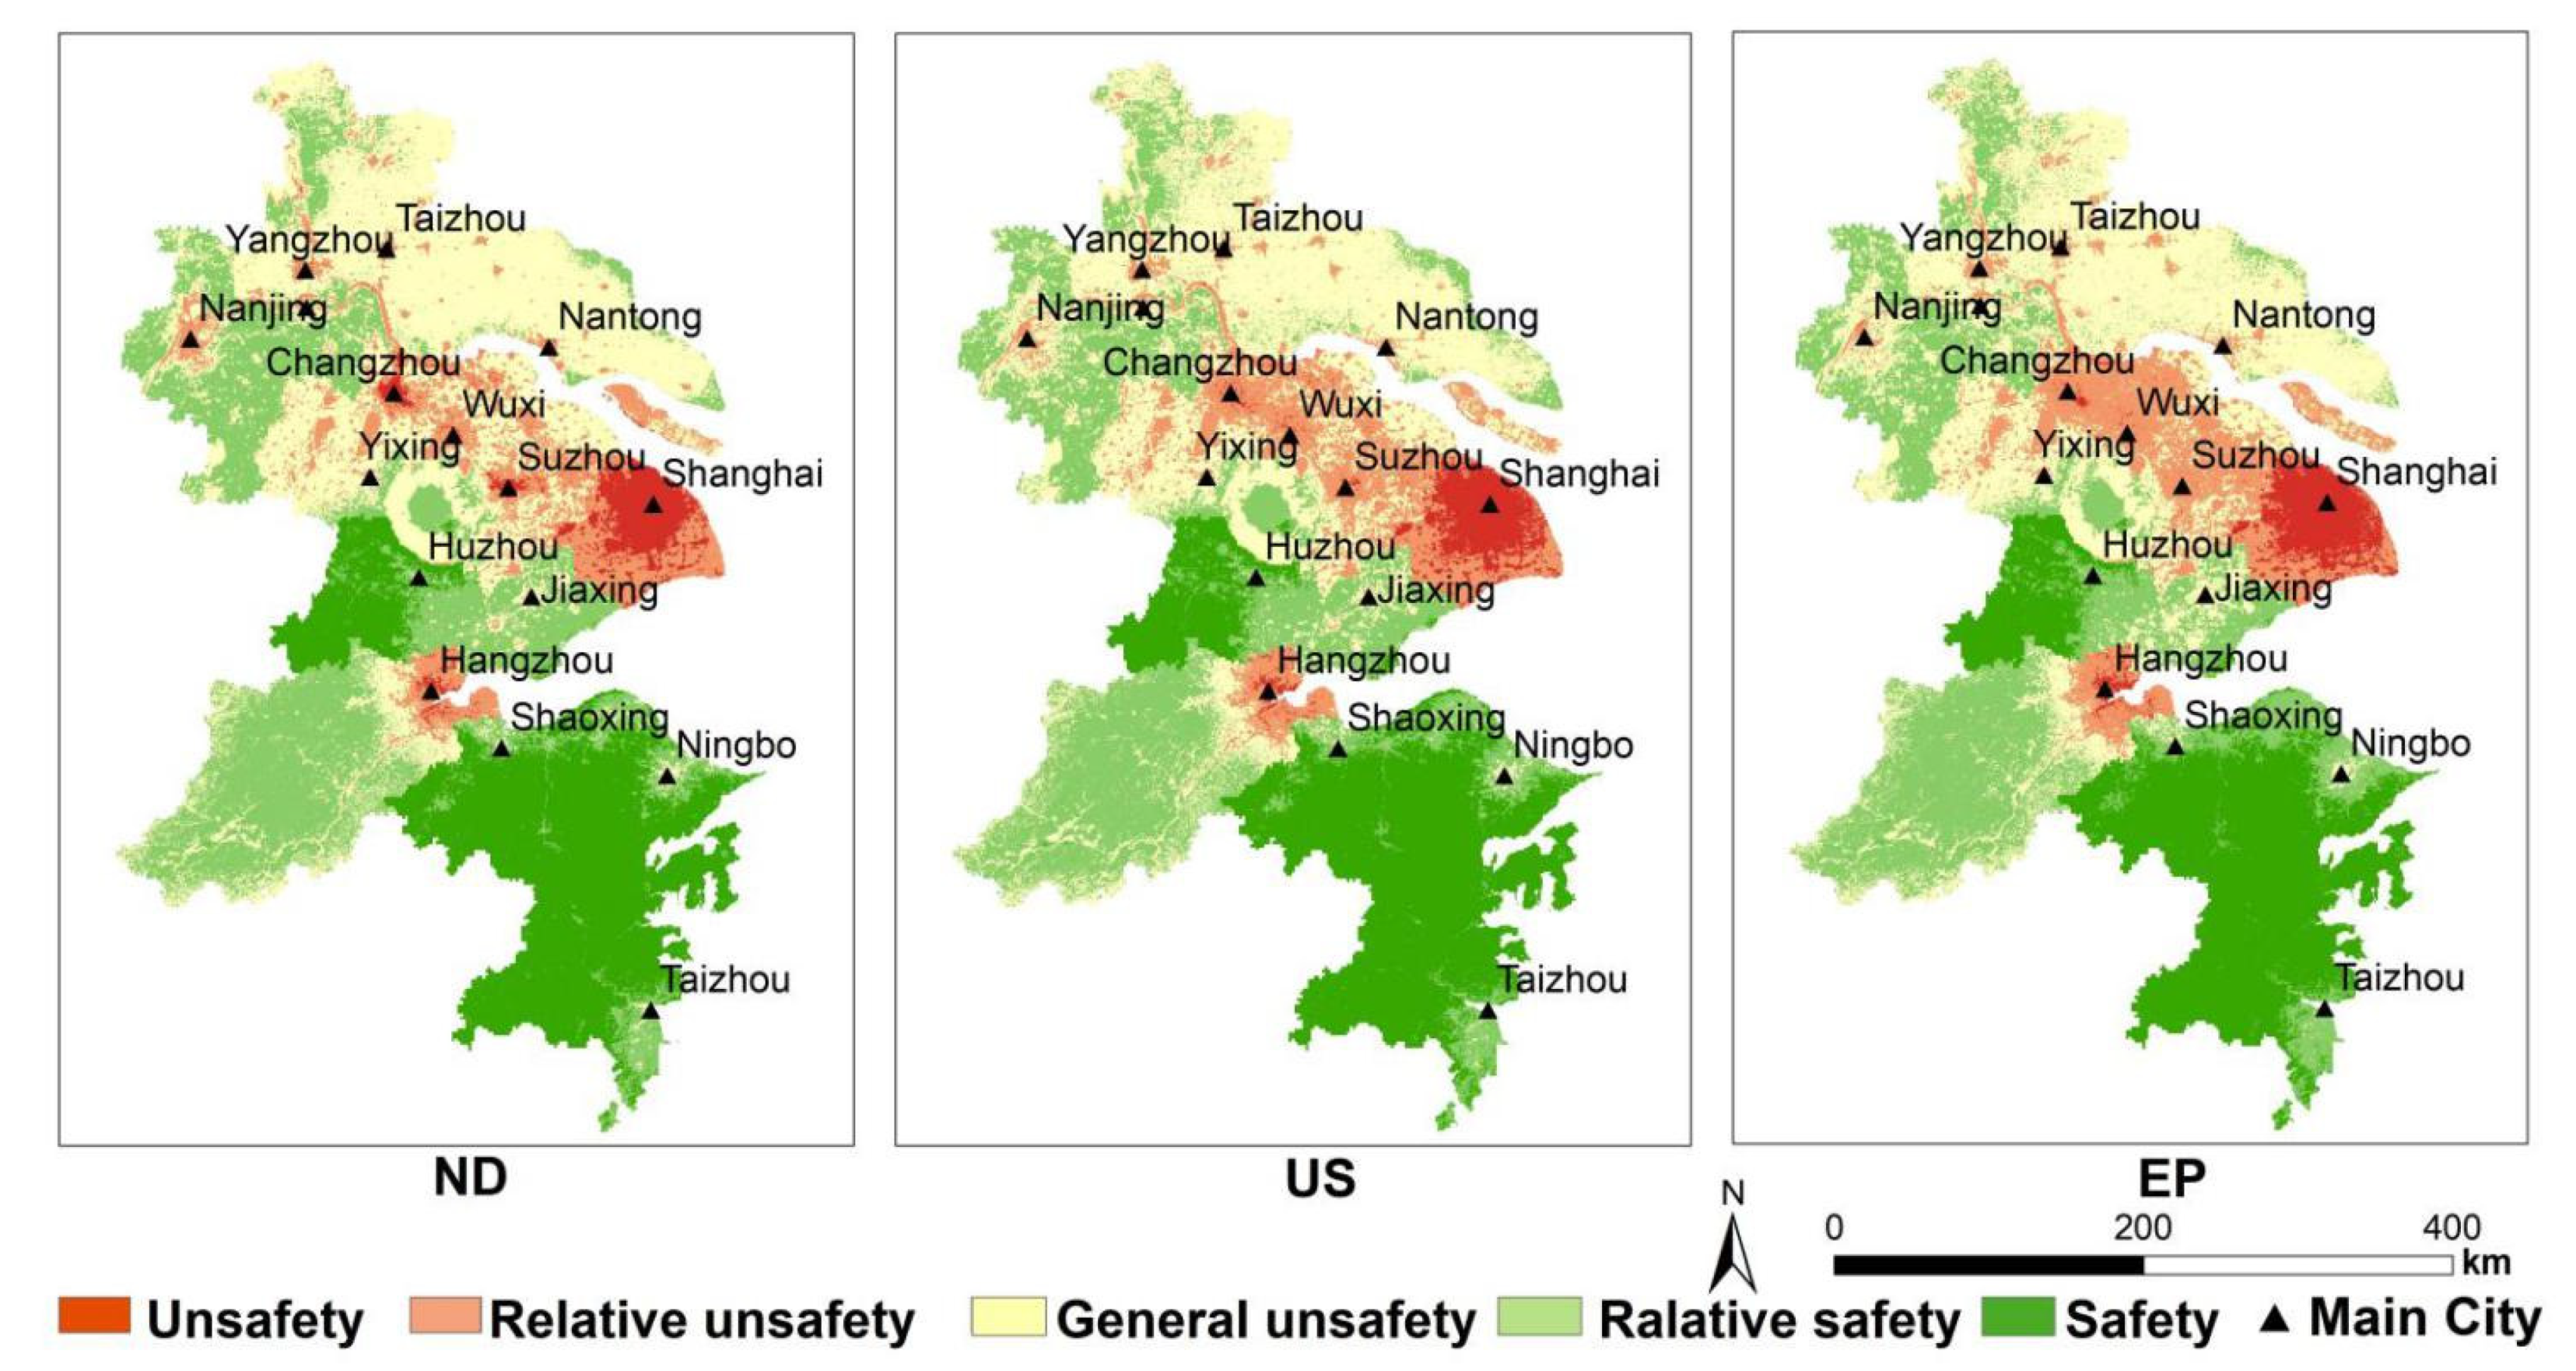
It can be seen from Figure 9 and Table 6 that under the three scenarios, the sum of Safety, Relative safety, and General safety is 81.60%, 81.03%, and 81.76%, respectively. The proportion of unsafe and relatively unsafe states in 15 cities is: Shanghai > Suzhou > Wuxi > Changzhou > Hangzhou > Taizhou > Yangzhou > Nantong > Nanjing > Zhenjiang > Jiaxing > Huzhou > Shaoxing > Ningbo > Taizhou. Among them, the sum of insecurity and relative insecurity in Shanghai accounts for more than 99% of the whole study area and less than 1% in Taizhou.

Figure 9.
ES pattern of the YRD in 2025 in three scenarios.
Table 6.
Proportion of ES levels of the YRD in 2025.
The spatial details of multiple ES in different scenarios can be examined on a regional scale. We focus on four expanded regions that represent the changes in ES caused by LUCC.
Figure 10a shows the ES pattern of water area. This area is located in Taihu Lake, and the surface is mainly water. Compared with 2015, urban land expanded greatly, and the ecological security of Taihu Lake decreased. Compared with ND and EP scenarios, the relative security distribution area under US scenario is the smallest, especially in the northeast of Taihu Lake, which may be due to the existence of multiple cities in the east of Taihu Lake. In order to meet the needs of social and economic development and solve population pressure, cities must gradually expand, resulting in the decline of ecological security of Taihu Lake. Under the EP scenario, the development process of construction land is slowed down. Under the protection of Taihu Lake for many years, the ecological security may remain in its original state and may be restored.
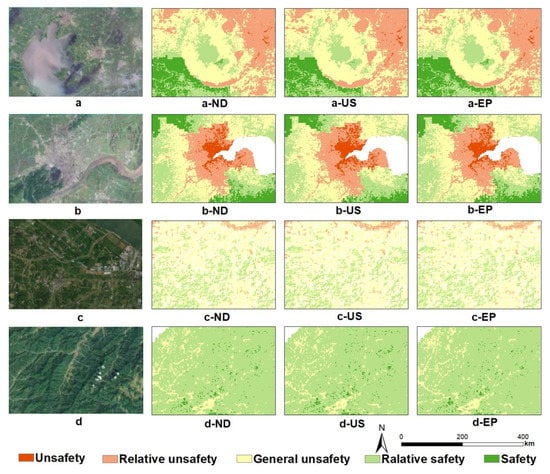
Figure 10.
Ecological pattern of each land type in 2025 in three scenarios ((a) is water area, a-ND, a-US, and a-EP, respectively, represent the ES pattern of water area under ND scenario, US scenario, EP scenario; (b) is built-up land; (c) is cultivated land; (d) is forest).
Figure 10b shows the ES pattern of the city. As a national ecological garden city, Hangzhou has played a warning role in coordinating ecology and development. The area is mainly construction land, and cultivated land is around the city. Due to the scenario setting, the relative insecurity in Hangzhou expands with the expansion of construction land. The high ecological security around Hangzhou city may be because the area is adjacent to Hangzhou Bay in the East, with a sufficient water source, rich vegetation, and superior terrain conditions. Under EP and ND scenarios, the safety grade distribution area is closer to the construction land in Hangzhou. It can be seen that urban expansion not only causes ES changes in its expansion area, but also affects ES around the expansion area.
Figure 10c shows the ES pattern of cultivated land. The area is located in the Yangtze River Basin. Generally speaking, the ES under the three scenarios is not different, mainly distributed as general safety and relative safety. Among them, the distribution proportion of relative safety area is: EP > ND > US. In the US scenario, more unsafe areas are distributed slightly, while the EP scenario is the least. LUCC has little effect on cultivated land ecological security. The region is rich in ecological resources and convenient transportation. On the premise of ensuring sustainable development, reasonably plan the city, step up the connectivity between economy and ecology, and realize intensive land use.
Figure 10d shows the ES pattern of forest land. The area is located in the west of the YRD, with high terrain, mainly mountains and rivers. The ecological security of the three scenarios is high, mainly relative security. The safety area under EP scenario is significantly larger than that under ND and US scenarios. Due to the large ecological elasticity in this area, the land system has strong recovery ability and good overall level.
5. Discussion
5.1. Ecosystem Model of Urban Agglomerations in the YRD
According to the results of ES evaluation, the ES pattern of the YRD changed little from 2005 to 2015. High ecological security areas are mainly in areas with less impact of human activities such as forests and waters; low ecological security areas are mainly in areas with high cultivated land utilization rate and urbanization level; and medium ecological security areas are in mountains and valleys, and its internal vegetation coverage is high. From the perspective of the temporal dynamics of the ecosystem pattern in the YRD, the degree of urbanization determines the direction of land-use type transfer, and there is an obvious correlation between regional development level and ES status.
Using ArcGIS 10.3 software, combined with spatial autocorrelation analysis, the results indicate that the level distribution degree of the ES pattern is consistent with the overall spatial clustering. As the city has developed, the land types around it have been gradually homogenized. Especially in the central region of the YRD, the change in land-use type heads to a single direction. First, according to the response of national policies, sustainable development is the basis of urban development. In the process of urbanization in the YRD, more attention needs to be paid to the occupation rate of built-up land to the forest land and cultivated land, and ES and urban development should be coordinated. Second, the urban agglomeration in the YRD is widely distributed, and there are enormous differences in urban development. It can be considered to integrate the coordinated development of similar cities in the YRD and establish ecosystem and functional areas. From 2005 to 2015, the urban clustering was consistent. The YRD has formed five zones, which can be divided into: East, Central, West, South, and North. East and Central are densely populated and economically industrial areas. The focus of construction is to control pollutant emissions, strengthen the construction of Eco industrial parks, develop Eco-economic industries, promote the sustainable utilization of agricultural resources, and build an ecological civilized city [27]. In the North, provincial key environmental protection regulatory zones with regional ecological and environmental problems, together with strengthening pollution control, will be incorporated into the Development Zone, which will accelerate the transformation of the economic growth mode, put improving growth quality and efficiency first, and will improve the level of participation in the integrated division of labor and competition [45]. The western and southern regions should give priority to protect, develop moderately, and focus on development, along with developing an ecological economy and characteristic industries according to local conditions, strengthening ecological restoration and environmental protection, guiding the orderly transfer of overloaded population, and gradually becoming important regional ecological functional areas.
5.2. Pattern Optimization of ES Pattern
The spatial and temporal dynamics of the ecological pattern in the YRD, based on the LUCC simulation, showed that they will be reduced in the ES pattern of the YRD in 2025, compared to that in 2015. Therefore, according to the changes in spatial relations and the level of urban environmental safety over the past decade (Figure 9 and Table 6), the 15 cities in the YRD can be divided into three categories: (1) The first category is relatively high in terms of the level of urban safety and good natural conditions, including Shaoxing, Ningbo, Taizhou, and Huzhou. (2) The second type of city, including Nantong, Taizhou, Zhenjiang, Nanjing, Hangzhou, Jiaxing. and Yangzhou, has a relatively high overall safety level, and the cities’ ES is kept at a medium level. (3) The third category of city, including Shanghai, Suzhou, Changzhou, and Wuxi, has a relatively high proportion of unsafe and relatively unsafe cities and poor performance of ES. Furthermore, considering the regional ecological characteristics, ecosystem service functions, and ecological sensitivity, the ecological function zones of the YRD were divided.
The first type of city has a high level of ecological security due to favorable geographical positional conditions and the limited level of social and economic development. These four cities can serve as ecological barriers for the development of the YRD, providing functions of biodiversity conservation, water and soil conservation balance, and agricultural products supply.
The level and degree of urbanization in the second-tier cities are relatively high. Residents pay more and more attention to the needs of the natural environment and increase investment in ecological protection. Compared to the first category of cities, the urbanization level and ecological protection in this region can develop in a more coordinated way and provide a more comfortable living environment for residents. Therefore, this area is delimited as the guarantee of the ecological function area of human habitation. In the process of planning and management, on the one hand, the stakeholders are expected to participate in decision making, and the ecological compensation is implemented based on the supply and demand of ecosystem services. On the other hand, it is necessary to identify the trade-off characteristics of ecosystem services on a time scale to avoid the long-term irreversible effects of short-term planning [46].
The third kind of city has a high degree of urbanization and low awareness of natural environment protection. It is suggested that in the future, land-use planning and management, and the supply and demand characteristics of regional ecosystem service functions should be comprehensively considered, the favorable and unfavorable spatial arrangements of regional types should be determined, and the urban living capacity and health status should be strengthened [47]. It is necessary to arrange basic farmland or build a protective forest isolation belt at the edge of ecological land to reduce the interference caused by external land-use change [48]. This area can be identified as an ecological restoration area of an ecological functional city. The third kind of city has a high degree of urbanization and low awareness of natural environment protection.
5.3. Comparison with Other Studies
As we all know, the YRD and the Pearl River Delta (PRD) are China’s two major economic zones, representing the highest level of China’s economic development. Public data show that in 2019, the sum of GDP in the YRD and the PRD accounted for 32.7% of the total national economy. Compared with the PRD case [41], the two research methods are similar. CA-Markov was used to predict the land use in 2025, and finally the ES results under the future scenario were obtained. In terms of regional area, the YRD covers one city and three provinces, while the PRD has a small area and intensive urban construction. In a short time, the economy of the PRD has developed rapidly, and the per capita GDP has already exceeded that of the YRD, but the environmental problems cannot be ignored. From the case results, the similarity of ES in the PRD changed from low to high clustering from 2005 to 2015, the ecological insecurity area in the PRD expanded rapidly, and the environmental problems became more and more serious. The YRD has comparative advantages in ecological protection. According to the development results of the case simulation scenario, the ES in the PRD is inversely proportional to the urban economic development. Consistent with the results of this study, it can be explained that urban expansion plays a decisive role in the decline of ES in China’s coastal areas.
Compared to the case of Hangzhou [37], the same method was adopted to simulate and calculate ES in each study area, and the land-use data and ES results under different scenarios in Hangzhou in 2030 were obtained. Compared with the Hangzhou area of this study, the result trend is consistent.
The ES and urbanization levels of Foshan research are not always inversely proportional, and the integrity and connectivity of the whole ecosystem are the essence of planning [49].
6. Conclusions
Taking the YRD region as the research object, this paper identifies ecological sources from three aspects: pressure, state, and response, and analyzes them by using a spatial autocorrelation method, so as to construct a regional ES pattern. On this basis, the optimal pattern of ES of “three ecological function zones” is identified. The results show that in the three scenarios, the area of built-up land is gradually increasing, accounting for more than 19.2% of the total area, while the ecosystem is gradually unbalanced. In the past decade, the ES pattern in the YRD showed a good trend, with the safety level reaching 85.45%, 85.70%, and 82.94%, respectively, and the proportion of unsafe and relative unsafe was 3.10–3.41% and 11.44–13.65%, respectively. Meanwhile, it is obvious that the level of urbanization development is inversely proportional to ES.
According to the changes of LUCC in time and space, the evaluation of the urban ecosystem can provide an applicability method to construct the pattern of an urban ecosystem. However, this study has defects in data and practical operation: (1) the impact of driving factors on land use is relatively limited and cannot grasp the state of future simulation; (2) there are few ecological security indicators and these cannot well grasp the accuracy of ecological security pattern; and (3) the scenario setting is relatively absolute and has a certain gap with the actual development. Further research should attract attention and solve it.
Author Contributions
Writing—original draft, S.Z.; Investigation, H.S.; Visualization, X.L.; Software, W.X.; Validation, Q.S.; Writing—review & editing, Z.Y.; Project administration, F.L.; Supervision, J.Q. All authors have read and agreed to the published version of the manuscript.
Funding
This study was supported by the National Natural Science Fund of China (Grant No. 41401659); the Science and Technology Department of Sichuan Province (Grant No. 2015JY0145) and the Department of natural resources of Sichuan Province (Grant No. AZ20210002).
Institutional Review Board Statement
Not applicable.
Informed Consent Statement
Not applicable.
Data Availability Statement
Landsat8 OLI, Landsat5 TM and DEM are available via Geospatial data cloud. Modis13Q1 is available via NASA. Soil data and Rainfall data are available via Qinghai Tibet Plateau scientific data center. GDP density data and Population density data are available via the resource and environmental science and data center of Chinese Academy of Sciences. Expressway data and Railway data are available via Geographic information professional knowledge service system.
Conflicts of Interest
The authors declare no conflict of interest.
References
- Sorek-Hamer, M.; Chatfield, R.; Liu, Y. Review: Strategies for using satellite-based products in modeling PM2.5 and short-term pollution episodes. Environ. Int. 2020, 144, 106057. [Google Scholar] [CrossRef] [PubMed]
- Basit, A.; Ghauri, B.M.; Qureshi, M.A. Estimation of Ground Level PM2.5 by using MODIS Satellite data. In Proceedings of the 2019 Sixth International Conference on Aerospace Science and Engineering (ICASE), Islamabad, Pakistan, 12–14 November 2019; pp. 1–5. [Google Scholar]
- Feng, H.; Li, J.; Feng, H.; Ning, E.; Wang, Q. A high-resolution index suitable for multi-pollutant monitoring in urban areas. Sci. Total Environ. 2021, 772, 145428. [Google Scholar] [CrossRef] [PubMed]
- Xiong, Y.; Luo, Z.; Chen, Z.; Yu, G.; Duan, W.; Liu, L.; Li, F.; Wu, K. Study on Ultraviolet Imaging Remote Sensing Monitoring Technology for SO2Gas Emission. Spectrosc. Spectr. Anal. 2020, 40, 1289–1296. [Google Scholar] [CrossRef]
- Mak, H.; Joshua, L.; Fung, J.; Zhu, Q.; Cohen, R. Improved Satellite Retrieval of Tropospheric NO2 Column Density via Updating of Air Mass Factor (AMF): Case Study of Southern China. Remote Sens. 2018, 10, 1789. [Google Scholar] [CrossRef] [Green Version]
- Yuan, Q.; Wang, H. Research on Ecological Environment Changes Based on Remote Sensing Monitoring Perspective. In IOP Conference Series: Earth and Environmental Science; IOP Publishing: Bristol, UK, 2021; Volume 621, p. 012136. [Google Scholar]
- Zhou, Y.; Liu, N.; Yu, R. Analysis of remote sensing monitoring methods for construction land at home and abroad. In IOP Conference Series: Earth and Environmental Science; IOP Publishing: Bristol, UK, 2021; Volume 783, p. 012127. [Google Scholar] [CrossRef]
- Qiu, L.; Pan, Y.; Zhu, J.; Amable, G.S.; Xu, B. Integrated analysis of urbanization-triggered land use change trajectory and implications for ecological land management: A case study in Fuyang, China. Sci. Total Environ. 2019, 660, 209–217. [Google Scholar] [CrossRef]
- Li, Z.-T.; Yuan, M.-J.; Hu, M.-M.; Wang, Y.-F.; Xia, B.-C. Evaluation of ecological security and influencing factors analysis based on robustness analysis and the BP-DEMALTE model: A case study of the Pearl River Delta urban agglomeration. Ecol. Indic. 2019, 101, 595–602. [Google Scholar] [CrossRef]
- Ezeonu, I.C.; Ezeonu, F.C. The environment and global security. Environmentalist 2000, 20, 41–48. [Google Scholar] [CrossRef]
- Yang, Q.; Liu, G.; Hao, Y.; Coscieme, L.; Zhang, J.; Jiang, N.; Casazza, M.; Giannetti, B.F. Quantitative analysis of the dynamic changes of ecological security in the provinces of China through emergy-ecological footprint hybrid indicators. J. Clean. Prod. 2018, 184, 678–695. [Google Scholar] [CrossRef]
- Zhang, D.; Wang, X.; Qu, L.; Li, S.; Lin, Y.; Yao, R.; Zhou, X.; Li, J. Land use/cover predictions incorporating ecological security for the Yangtze River Delta region, China. Ecol. Indic. 2020, 119, 106841. [Google Scholar] [CrossRef]
- Li, Z.-T.; Hu, M.-M.; Li, M.; Jiao, M.-Y.; Xia, B.-C. Identification and countermeasures of limiting factors of regional sustainable development: A case study in the Pearl River Delta of China. Environ. Dev. Sustain. 2019, 22, 4209–4224. [Google Scholar] [CrossRef]
- Dai, X.; Gao, Y.; He, X.; Liu, T.; Jiang, B.; Shao, H.; Yao, Y. Spatial-temporal pattern evolution and driving force analysis of ecological environment vulnerability in Panzhihua City. Environ. Sci. Pollut. Res. 2021, 28, 7151–7166. [Google Scholar] [CrossRef] [PubMed]
- Fan, Y.; Fang, C. Evolution process and obstacle factors of ecological security in western China, a case study of Qinghai province. Ecol. Indic. 2020, 117, 106659. [Google Scholar] [CrossRef]
- Lu, S.S.; Qin, F.; Chen, N.; Yu, Z.Y.; Xiao, Y.M.; Cheng, X.Q.; Guan, X.L. Spatiotemporal differences in forest ecological security warning values in Beijing: Using an integrated evaluation index system and system dynamics model. Ecol. Indic. 2019, 104, 549–558. [Google Scholar] [CrossRef]
- Hu, G.; Zeng, W.; Yao, R.; Xie, Y.; Liang, S. An integrated assessment system for the carrying capacity of the water environment based on system dynamics. J. Environ. Manag. 2021, 295, 113045. [Google Scholar] [CrossRef]
- Gao, Y.; Zhang, C.; He, Q.; Liu, Y. Urban Ecological Security Simulation and Prediction Using an Improved Cellular Automata (CA) Approach—A Case Study for the City of Wuhan in China. Int. J. Environ. Res. Public Health 2017, 14, 643. [Google Scholar] [CrossRef] [Green Version]
- Liu, X.; Wei, M.; Zeng, J. Simulating Urban Growth Scenarios Based on Ecological Security Pattern: A Case Study in Quanzhou, China. Int. J. Environ. Res. Public Health 2020, 17, 7282. [Google Scholar] [CrossRef]
- Gao, J.; Du, F.; Zuo, L.; Jiang, Y. Integrating ecosystem services and rocky desertification into identification of karst ecological security pattern. Landsc. Ecol. 2021, 36, 2113–2133. [Google Scholar] [CrossRef]
- Jin, X.; Wei, L.; Wang, Y.; Lu, Y. Construction of ecological security pattern based on the importance of ecosystem service functions and ecological sensitivity assessment: A case study in Fengxian County of Jiangsu Province, China. Environ. Dev. Sustain. 2021, 23, 563–590. [Google Scholar] [CrossRef] [Green Version]
- Tian, S.; Wang, S.; Bai, X.; Zhou, D.; Luo, G.; Yang, Y.; Hu, Z.; Li, C.; Deng, Y.; Lu, Q. Ecological security and health risk assessment of soil heavy metals on a village-level scale, based on different land use types. Environ. Geochem. Health 2020, 42, 3393–3413. [Google Scholar] [CrossRef]
- Chu, X.; Deng, X.; Jin, G.; Wang, Z.; Li, Z. Ecological security assessment based on ecological footprint approach in Beijing-Tianjin-Hebei region, China. Phys. Chem. Earth 2017, 101, 43–51. [Google Scholar] [CrossRef]
- Wen, J.; Hou, K.; Li, H.; Zhang, Y.; He, D.; Mei, R. Study on the spatial-temporal differences and evolution of ecological security in the typical area of the Loess Plateau. Environ. Sci. Pollut. Res. 2021, 28, 23521–23533. [Google Scholar] [CrossRef] [PubMed]
- Tang, Y.; Zhou, Q.; Jiao, J.-L. Evaluating water ecological achievements of leading cadres in Anhui, China: Based on water resources balance sheet and pressure-state-response model. J. Clean. Prod. 2020, 269, 122284. [Google Scholar] [CrossRef]
- Zhang, R.; Lu, J. Simulation of Land Use Pattern Evolution from a Multi-Scenario Perspective: A Case Study of Suzhou City in Anhui Province, China. Int. J. Environ. Res. Public Health 2021, 18, 921. [Google Scholar] [CrossRef]
- Wang, H.; Bao, C. Scenario modeling of ecological security index using system dynamics in Beijing-Tianjin-Hebei urban agglomeration. Ecol. Indic. 2021, 125, 107613. [Google Scholar] [CrossRef]
- Peng, K.; Jiang, W.; Deng, Y.; Liu, Y.; Wu, Z.; Chen, Z. Simulating wetland changes under different scenarios based on integrating the random forest and CLUE-S models: A case study of Wuhan Urban Agglomeration. Ecol. Indic. 2020, 117, 106671. [Google Scholar] [CrossRef]
- Pei, X.; Zhao, D. A GIS-SD-based spatio-temporal modelling and regulating policies on water pollution in Dalian gulf. J. Remote Sens. 2000, 4, 118–124. [Google Scholar]
- Xu, Q.; Wang, Q.; Liu, J.; Liang, H. Simulation of Land-Use Changes Using the Partitioned ANN-CA Model and Considering the Influence of Land-Use Change Frequency. ISPRS Int. J. Geo-Inf. 2021, 10, 346. [Google Scholar] [CrossRef]
- Din, S.U.; Mak, H.W.L. Retrieval of Land-Use/Land Cover Change (LUCC) Maps and Urban Expansion Dynamics of Hyderabad, Pakistan via Landsat Datasets and Support Vector Machine Framework. Remote Sens. 2021, 13, 3337. [Google Scholar] [CrossRef]
- Yang, X.; Zhao, Y.; Chen, R.; Zheng, X. Simulating land use change by integrating landscape metrics into ANN-CA in a new way. Front. Earth Sci. 2016, 10, 245–252. [Google Scholar] [CrossRef]
- Hyandye, C.; Martz, L.W. A Markovian and cellular automata land-use change predictive model of the Usangu Catchment. Int. J. Remote Sens. 2017, 38, 64–81. [Google Scholar] [CrossRef]
- Chen, Z.; Huang, M.; Zhu, D.; Altan, O. Integrating Remote Sensing and a Markov-FLUS Model to Simulate Future Land Use Changes in Hokkaido, Japan. Remote Sens. 2021, 13, 2621. [Google Scholar] [CrossRef]
- Yang, X.; Zheng, X.-Q.; Lv, L.-N. A spatiotemporal model of land use change based on ant colony optimization, Markov chain and cellular automata. Ecol. Model. 2012, 233, 11–19. [Google Scholar] [CrossRef]
- Feng, Y.; Liu, Y.; Tong, X. Comparison of metaheuristic cellular automata models: A case study of dynamic land use simulation in the Yangtze River Delta. Comput. Environ. Urban Syst. 2018, 70, 138–150. [Google Scholar] [CrossRef]
- Cui, W.; Cai, L.; Xi, H.; Yang, F.; Chen, M. Ecological seurity asessment and muli-scenario simulation analysis of Zhejiang Greater Bay Area based on LUCC. Acta Eoologica Sin. 2022, 42, 1–13. [Google Scholar]
- Jiao, M.; Wang, Y.; Hu, M.; Xia, B. Spatial deconstruction and differentiation analysis of early warning for ecological security in the Pearl River Delta, China. Sustain. Cities Soc. 2021, 64, 102557. [Google Scholar] [CrossRef]
- Li, Q.; Wang, L.; Gul, H.N.; Li, D. Simulation and optimization of land use pattern to embed ecological suitability in an oasis region: A case study of Ganzhou district, Gansu province, China. J. Environ. Manag. 2021, 287, 112321. [Google Scholar] [CrossRef]
- Sun, S.; Xiao, Y.; Guo, L. The study on the spatial-temporal changes of land use pattern in eastern Sichuan basin based on RS/GIS. In IOP Conference Series: Earth and Environmental Science; IOP Publishing: Bristol, UK, 2018; Volume 113, p. 012220. [Google Scholar] [CrossRef]
- Li, Z.-T.; Li, M.; Xia, B.-C. Spatio-temporal dynamics of ecological security pattern of the Pearl River Delta urban agglomeration based on LUCC simulation. Ecol. Indic. 2020, 114, 106319. [Google Scholar] [CrossRef]
- Li, W.; Yi, P.; Zhang, D. Sustainability Evaluation of Cities in Northeastern China Using Dynamic TOPSIS-Entropy Methods. Sustainability 2018, 10, 4542. [Google Scholar] [CrossRef] [Green Version]
- Sun, Y.; Tong, L.; Liu, D. An Empirical Study of the Measurement of Spatial-Temporal Patterns and Obstacles in the Green Development of Northeast China. Sustainability 2020, 12, 10190. [Google Scholar] [CrossRef]
- Peng, C.; Li, B.; Nan, B. An analysis framework for the ecological security of urban agglomeration: A case study of the Beijing-Tianjin-Hebei urban agglomeration. J. Clean. Prod. 2021, 315, 128111. [Google Scholar] [CrossRef]
- Fang, Q.; Ma, D.; Zhang, L.; Zhu, S. Marine functional zoning: A practical approach for integrated coastal management (ICM) in Xiamen. Ocean Coast. Manag. 2021, 207, 104433. [Google Scholar] [CrossRef]
- Politi, V. To the issue of the environmental development of housing construction in the integrated land use management. In E3S Web of Conferences; EDP Sciences: Les Ulis, France, 2018; Volume 33, p. 03017. [Google Scholar] [CrossRef]
- Chi, Y.; Mak, H. From Comparative and Statistical Assessments of Liveability and Health Conditions of Districts in Hong Kong towards Future City Development. Sustainability 2021, 13, 8781. [Google Scholar] [CrossRef]
- Zhang, S.; Hu, W.; Zhang, J.; Li, M.; Zhu, Q. Zhang Mismatches in Suppliers’ and Demanders’ Cognition, Willingness and Behavior with Respect to Ecological Protection of Cultivated Land: Evidence from Caidian District, Wuhan, China. Int. J. Environ. Res. Public Health 2020, 17, 1156. [Google Scholar] [CrossRef] [PubMed] [Green Version]
- Su, Y.; Zhang, H.; Chen, X.; Huang, G.; Ye, Y.; Wu, Q.; Huang, N.; Kuang, Y. The ecological security patterns and construc-tion land expansion simu-lation in Gaoming. Acta Ecol. Sin. 2013, 33, 1524–1534. [Google Scholar] [CrossRef]


Publisher’s Note: MDPI stays neutral with regard to jurisdictional claims in published maps and institutional affiliations. |
© 2022 by the authors. Licensee MDPI, Basel, Switzerland. This article is an open access article distributed under the terms and conditions of the Creative Commons Attribution (CC BY) license (https://creativecommons.org/licenses/by/4.0/).