
Spatiotemporal Evolution Analysis and Future Scenario Prediction of Rocky Desertification in a Subtropical Karst Region


Abstract
:1. Introduction
2. Data and Materials
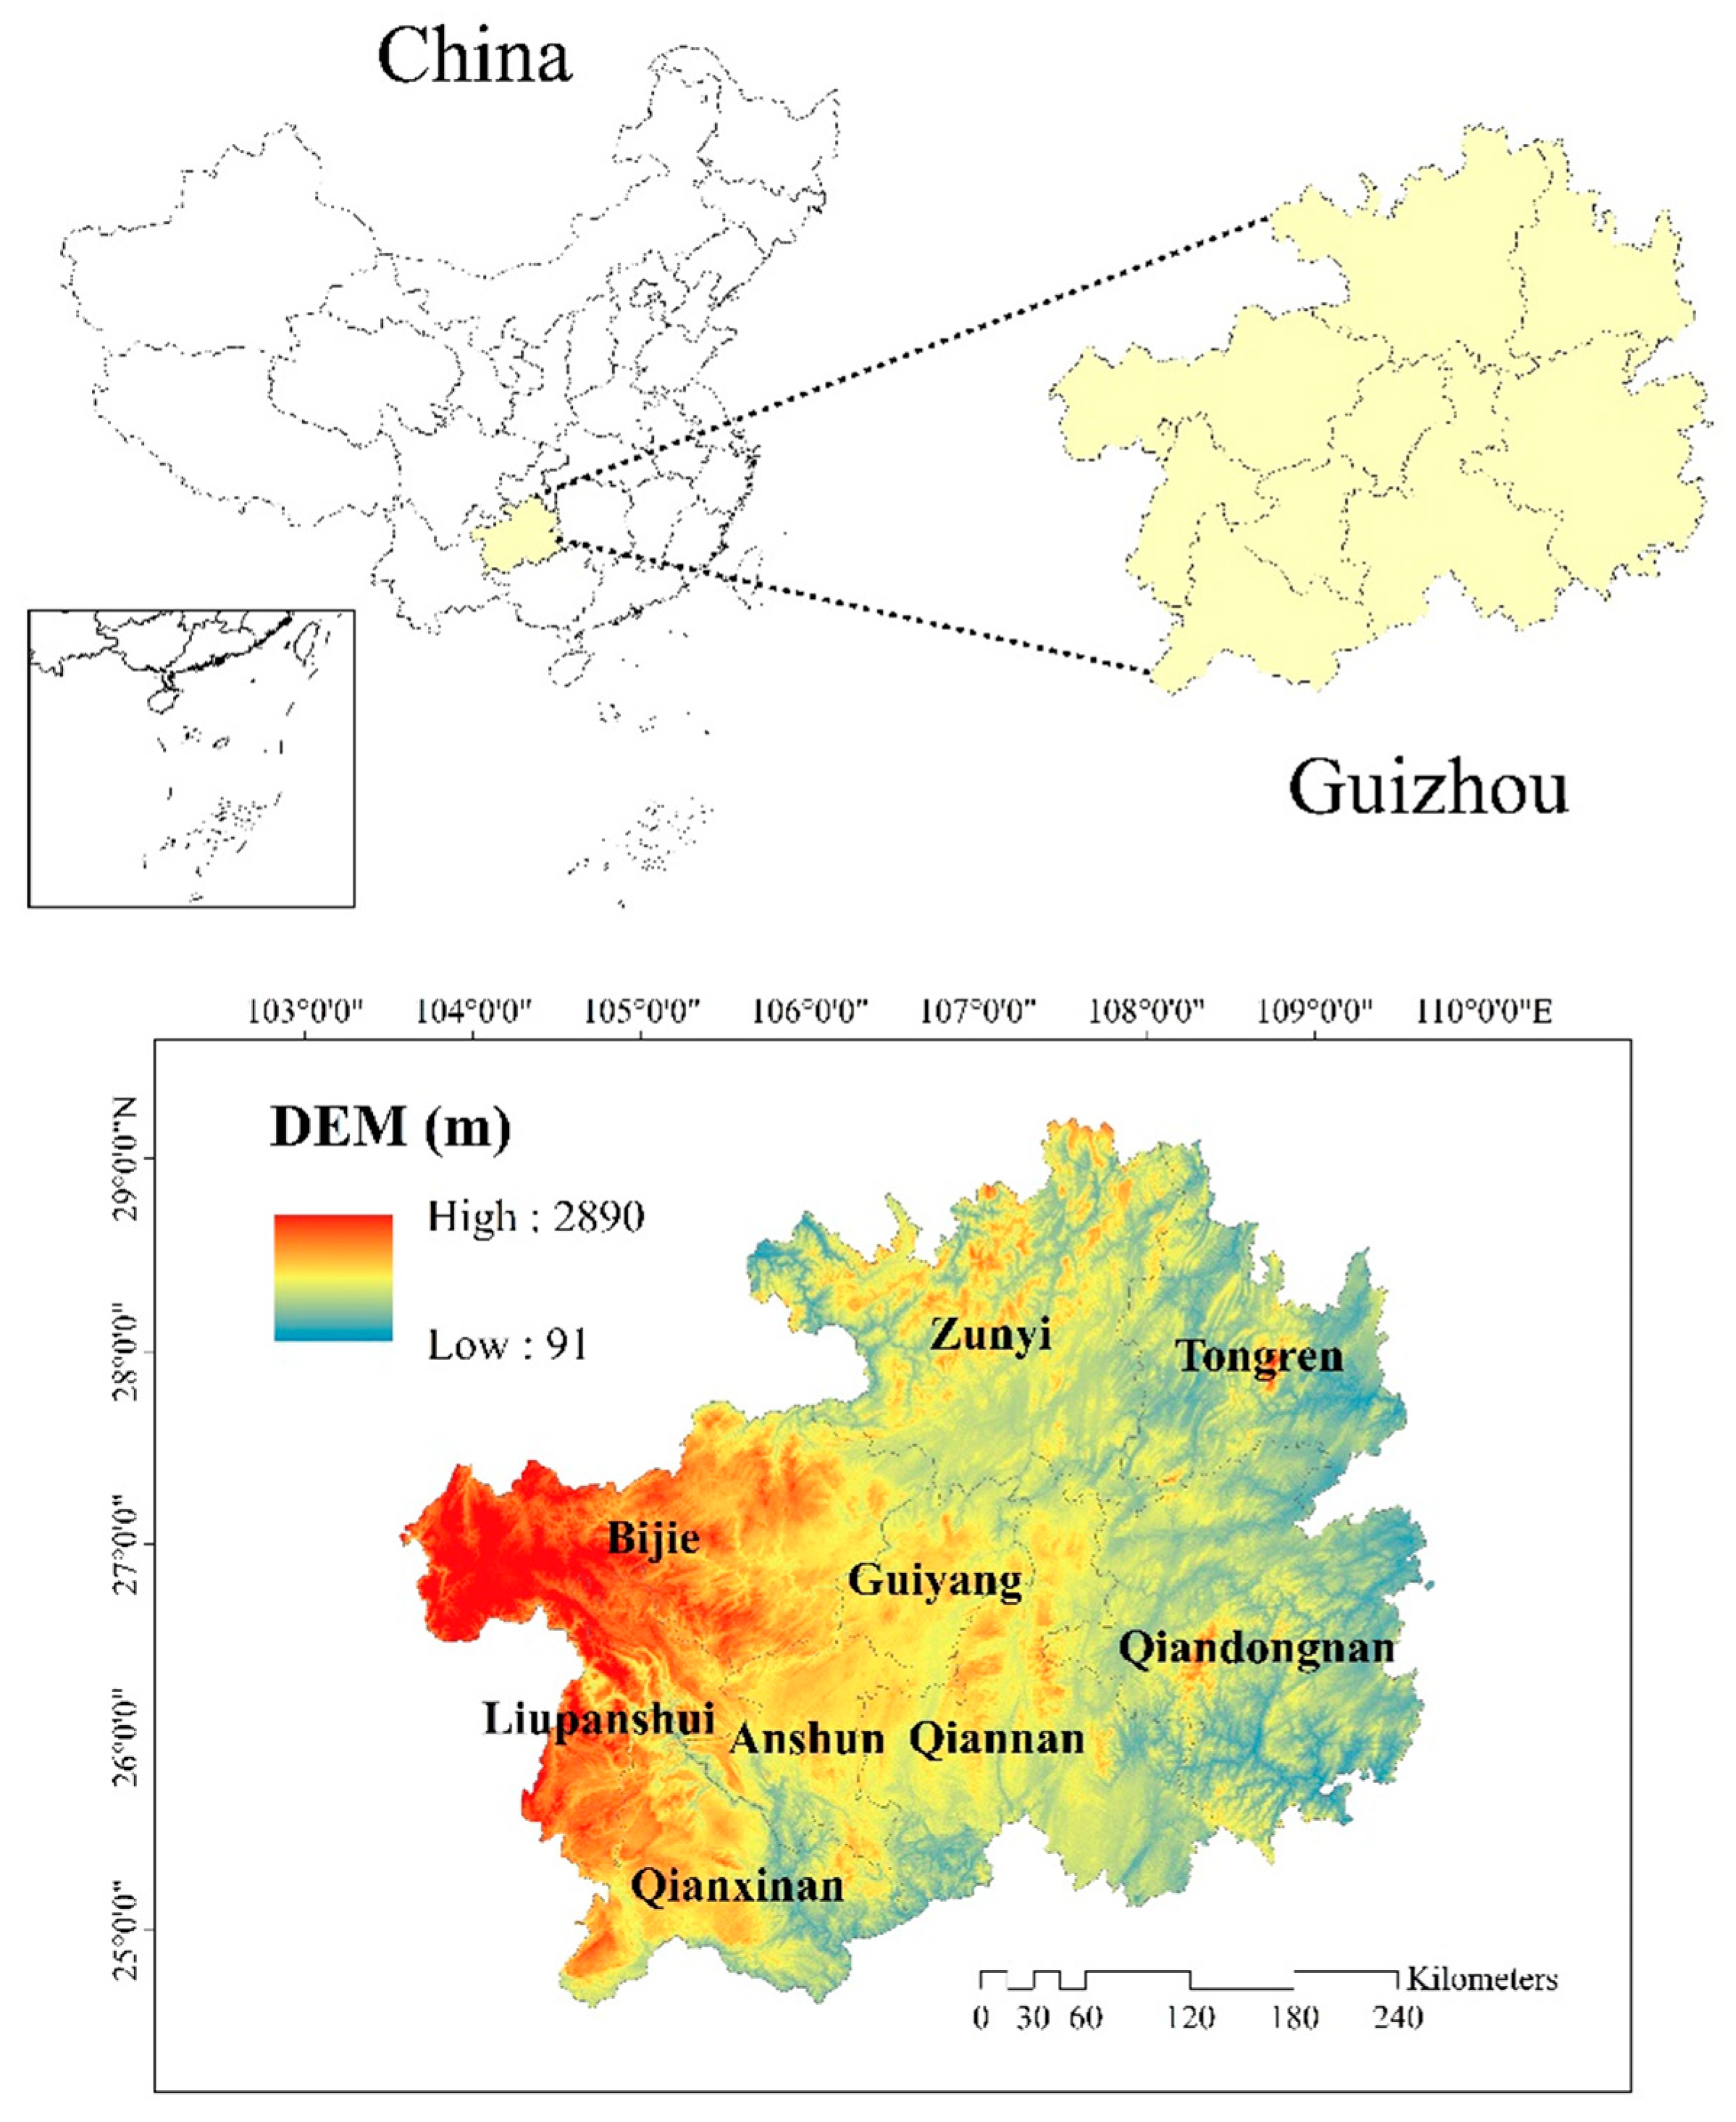
2.1. Research Area
2.2. Data
3. Technical Approach
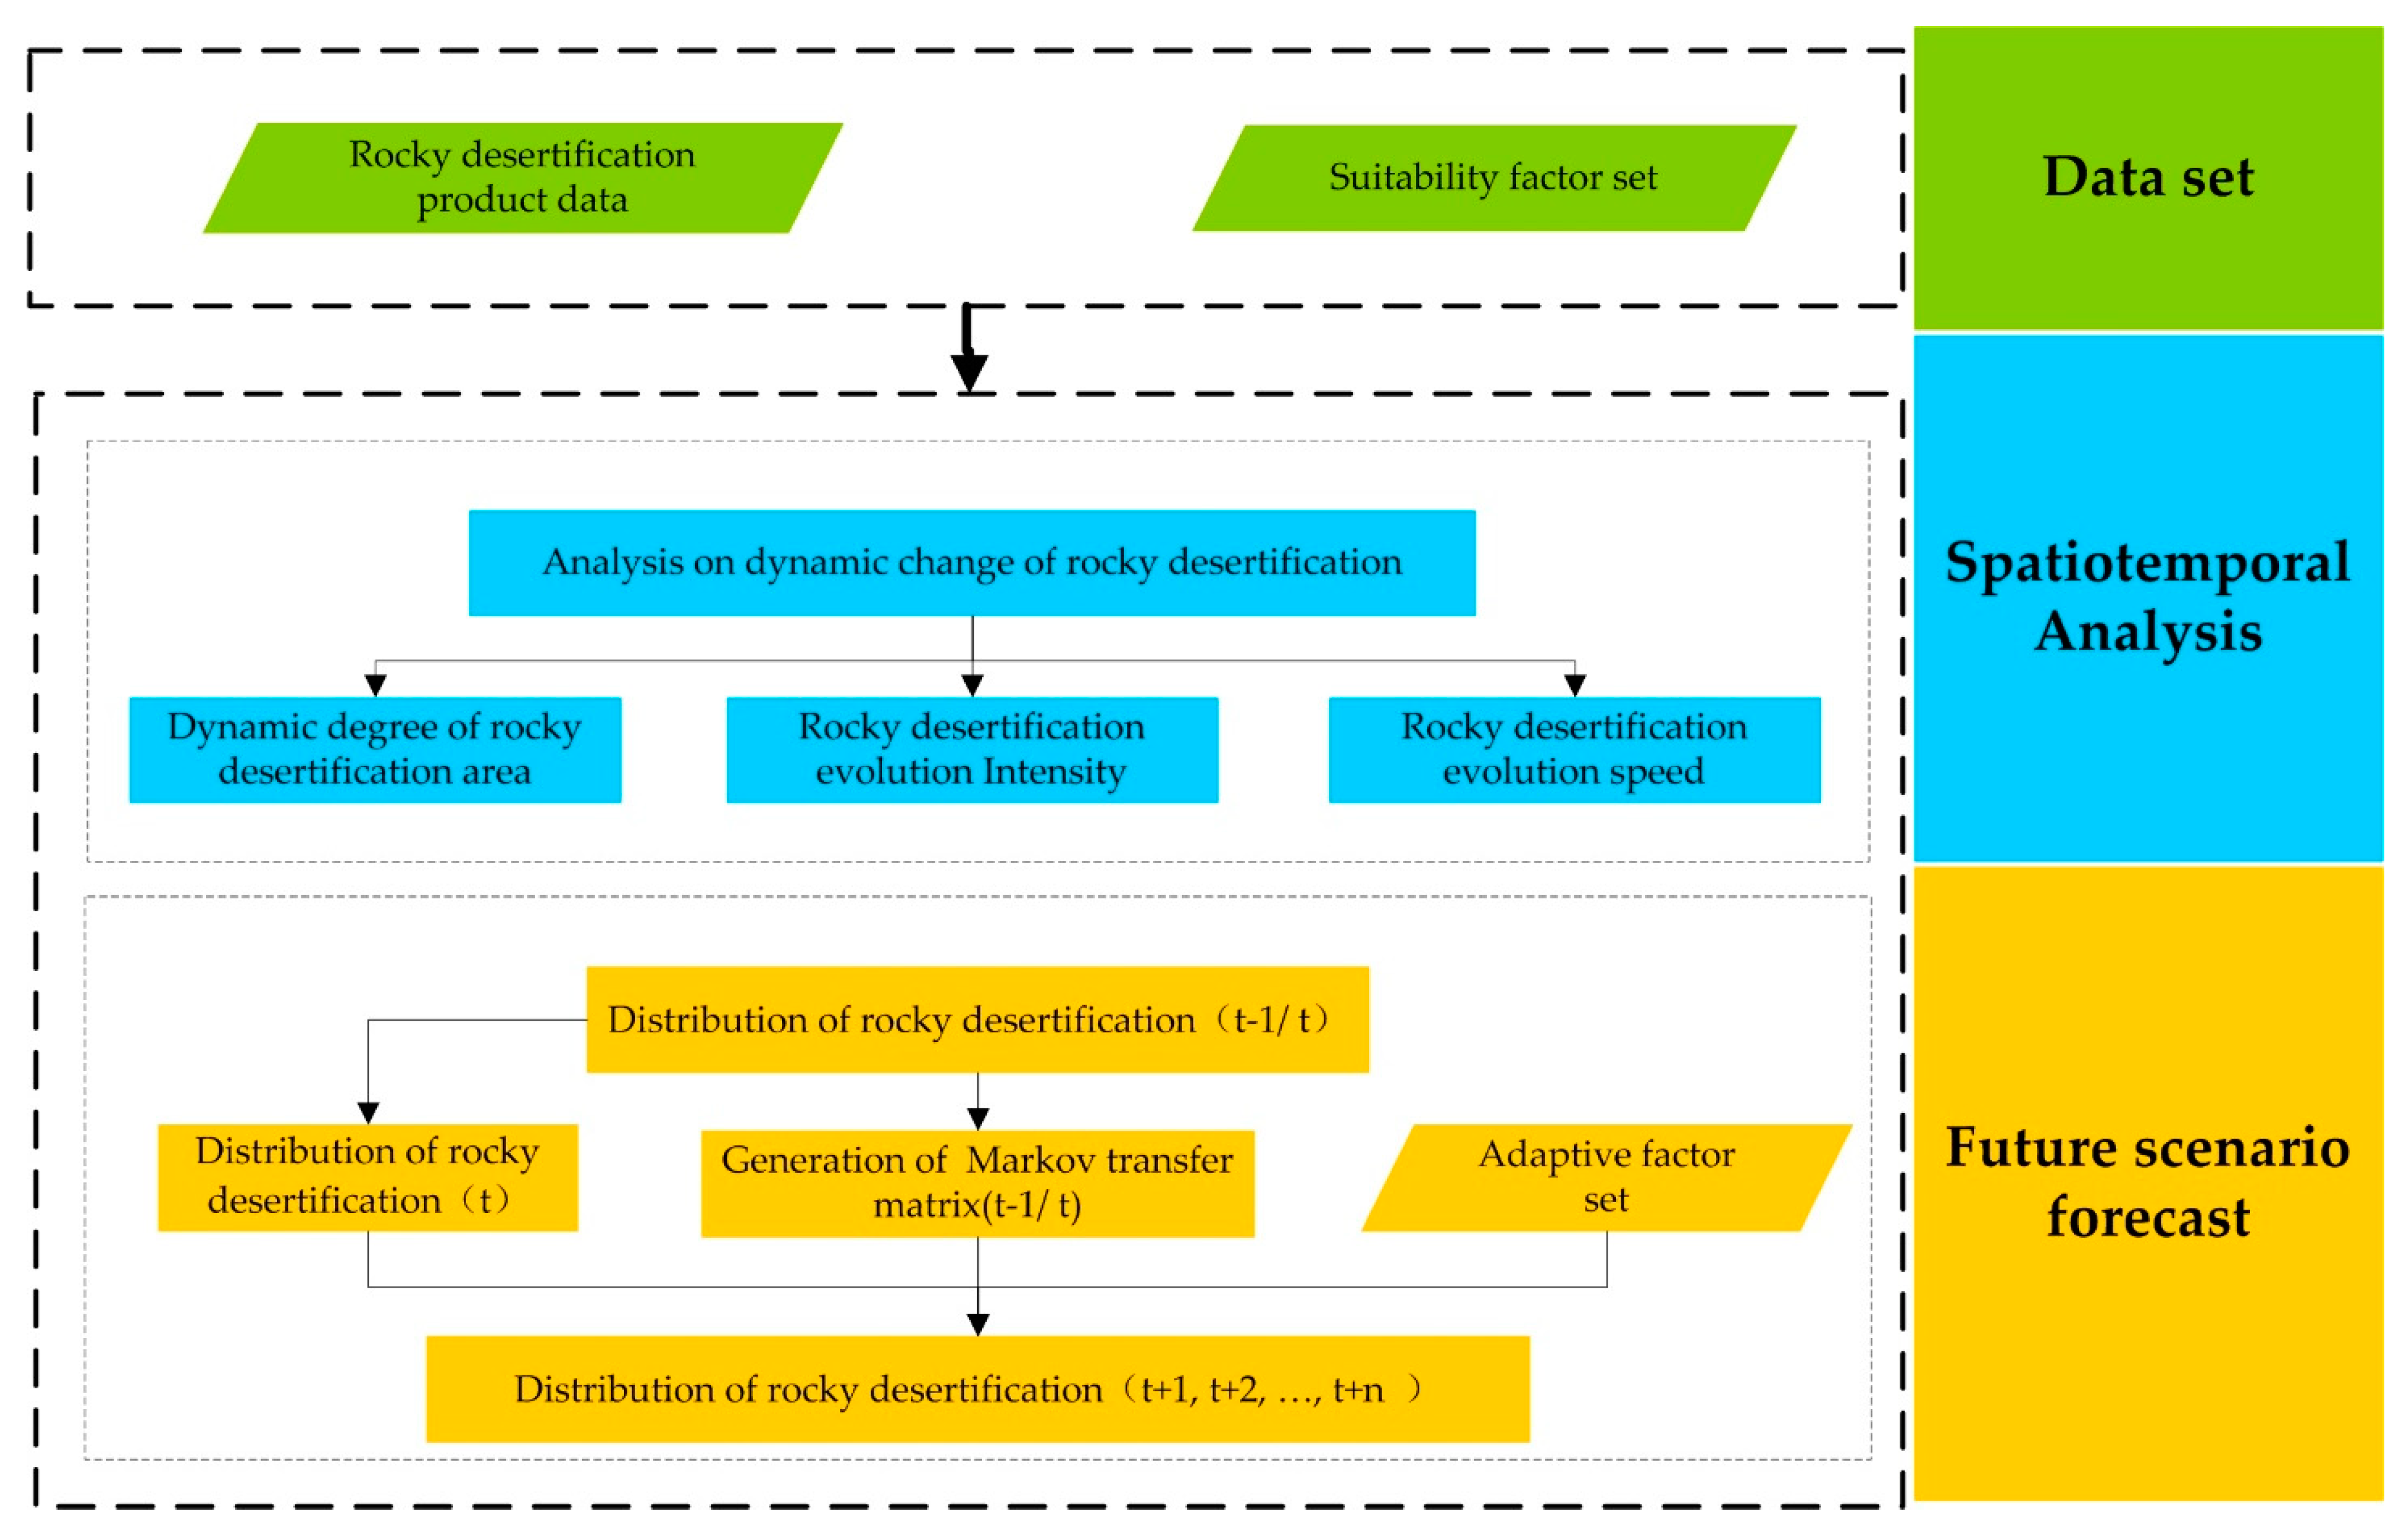
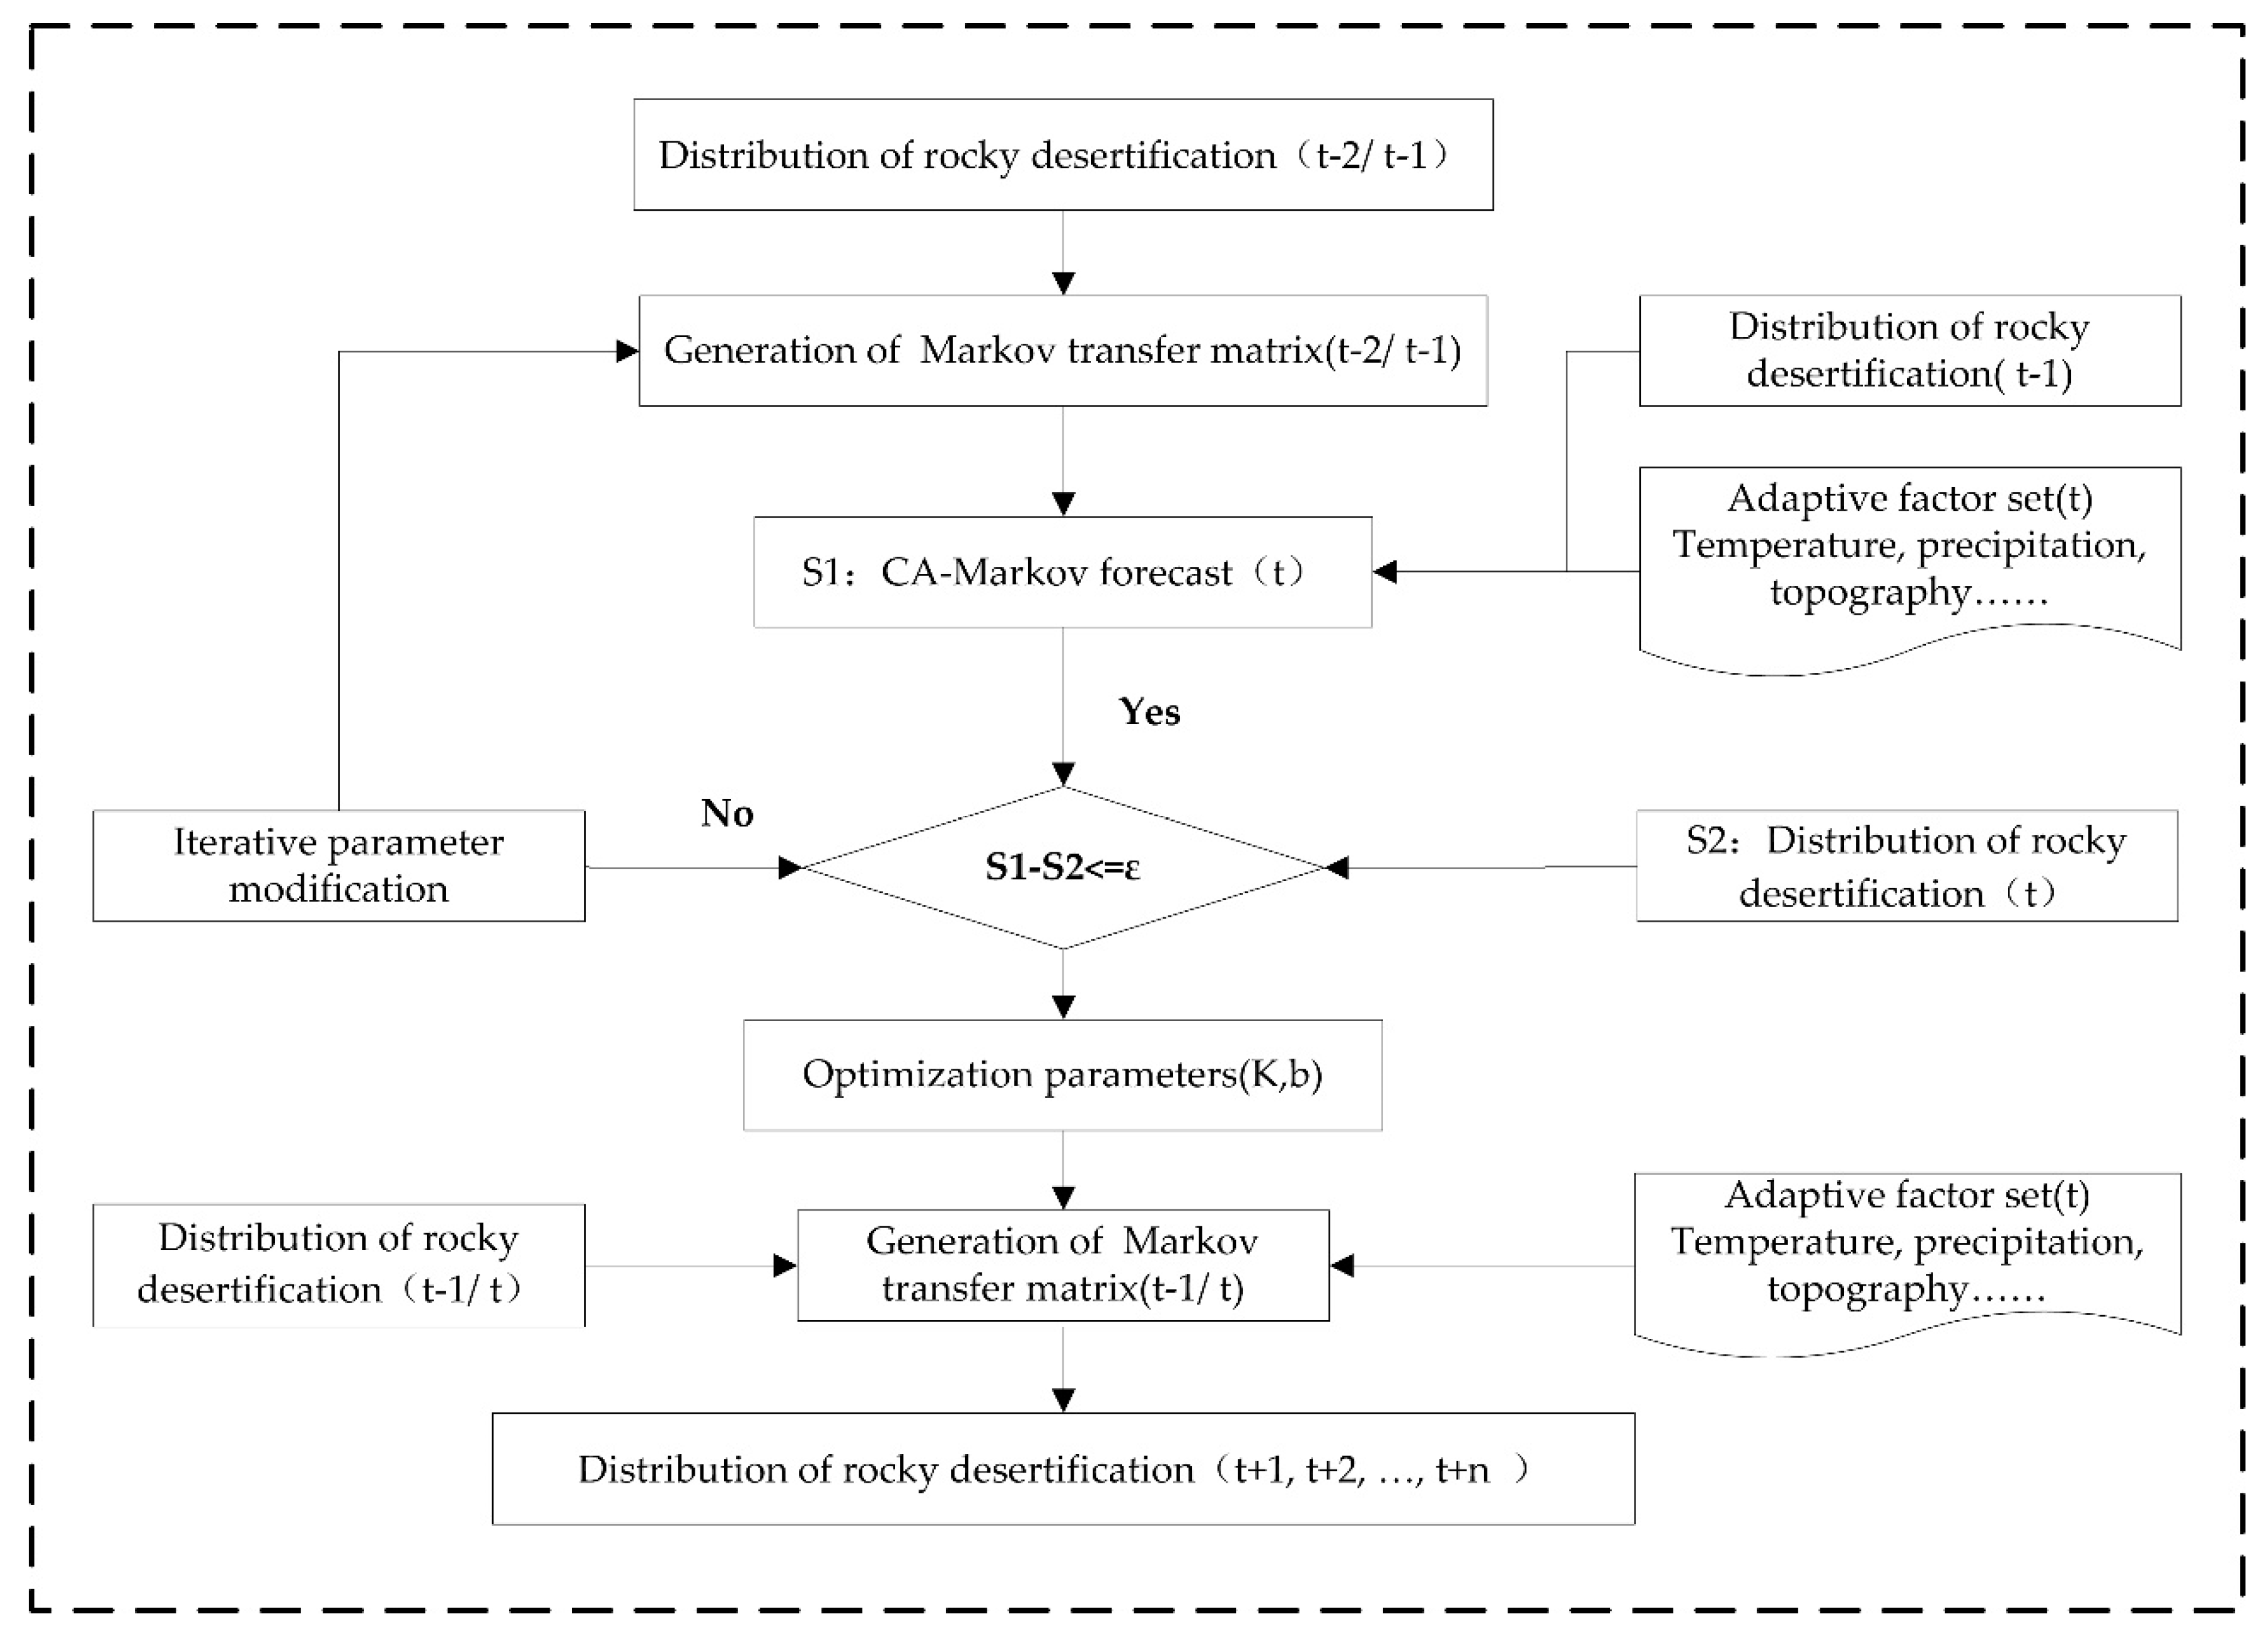
3.1. Processing Workflow
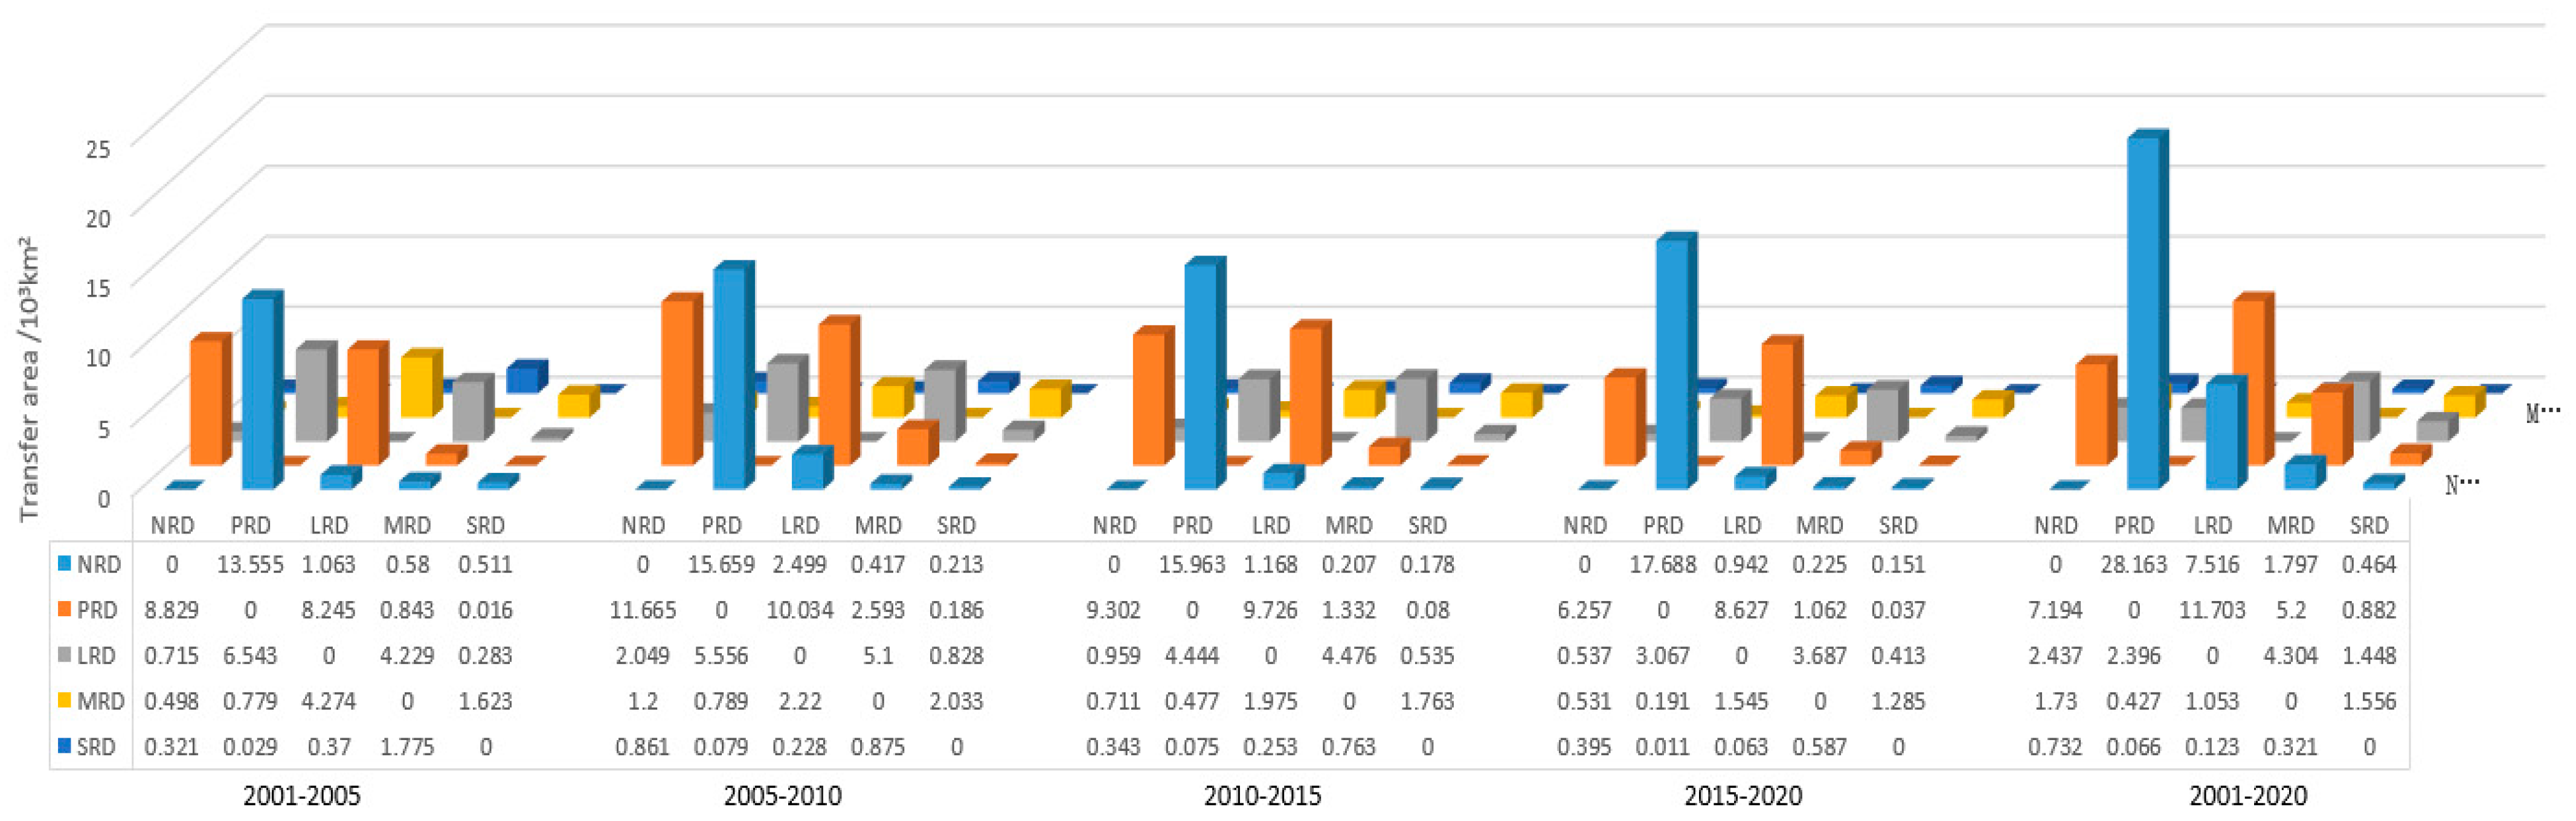
3.2. Transition Matrix
3.3. Dynamic Degree
3.4. CA-Markov Model
3.4.1. Traditional CA-Markov Model
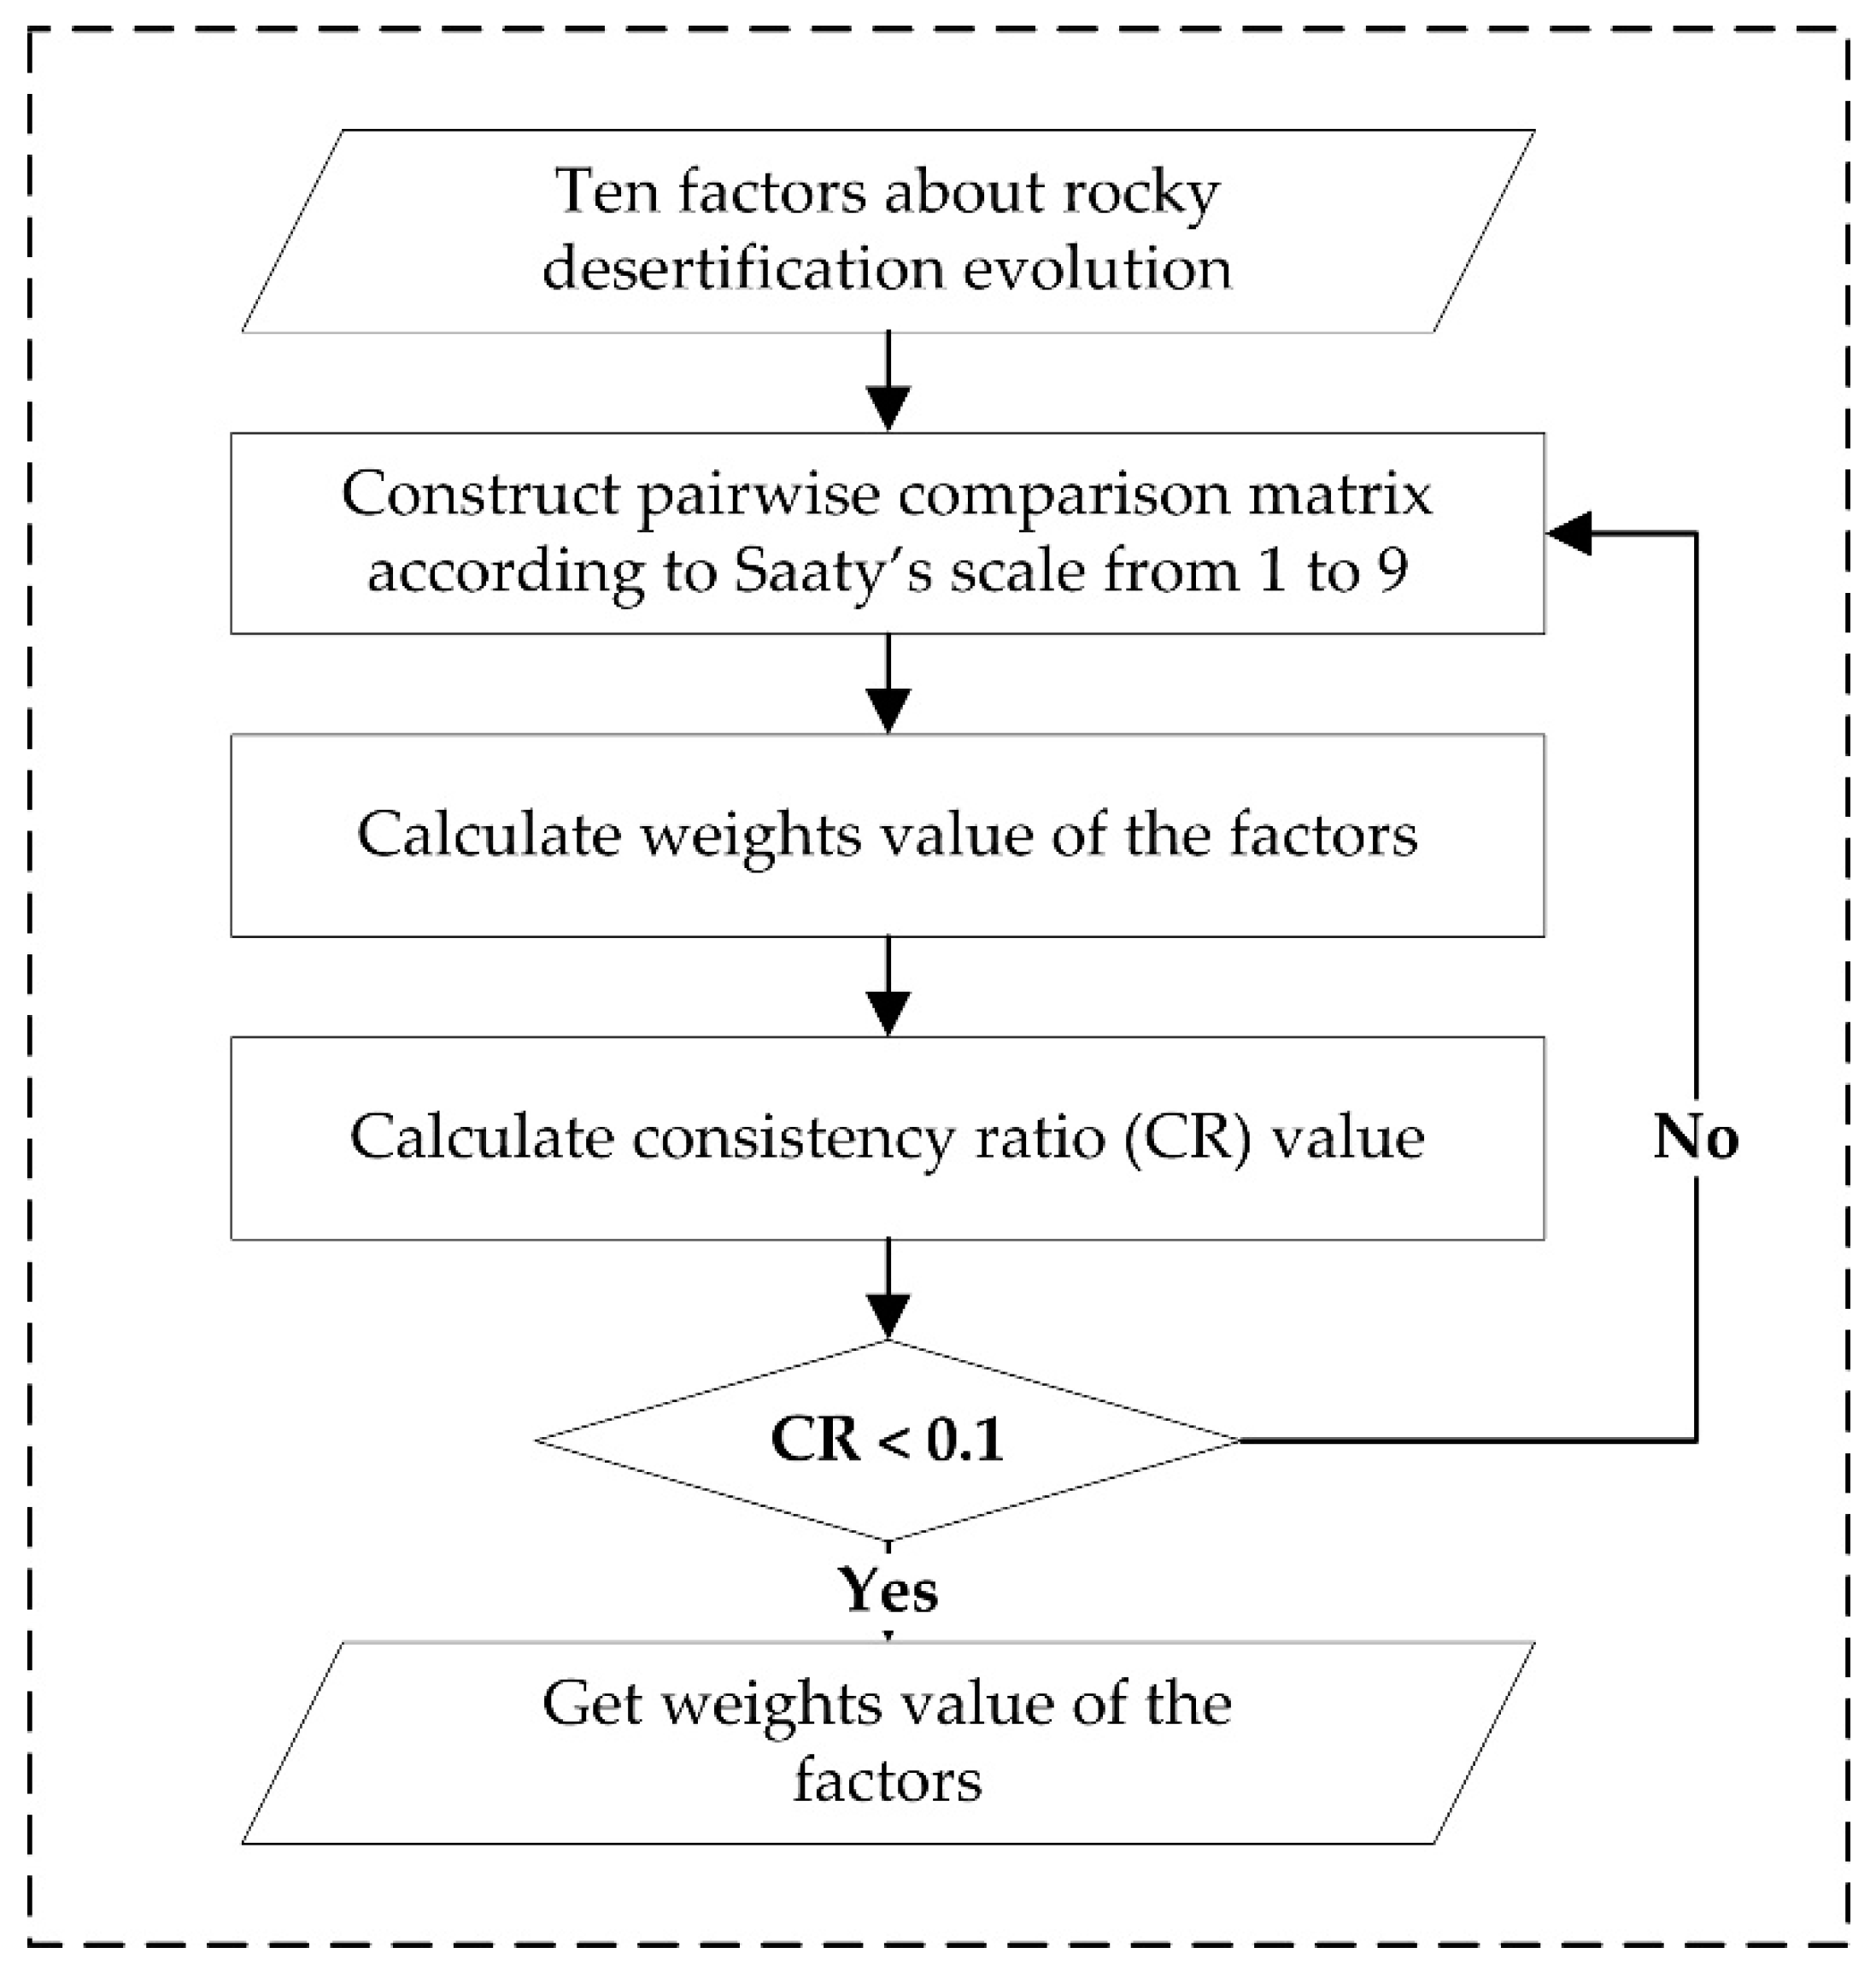
3.4.2. Factor Weighting Based on Analytical Hierarchy Process (AHP)
3.4.3. Improved CA-Markov Model
3.5. Lee–Sallee Index
3.6. Figure of Merit (FOM) Index
4. Results and Analysis
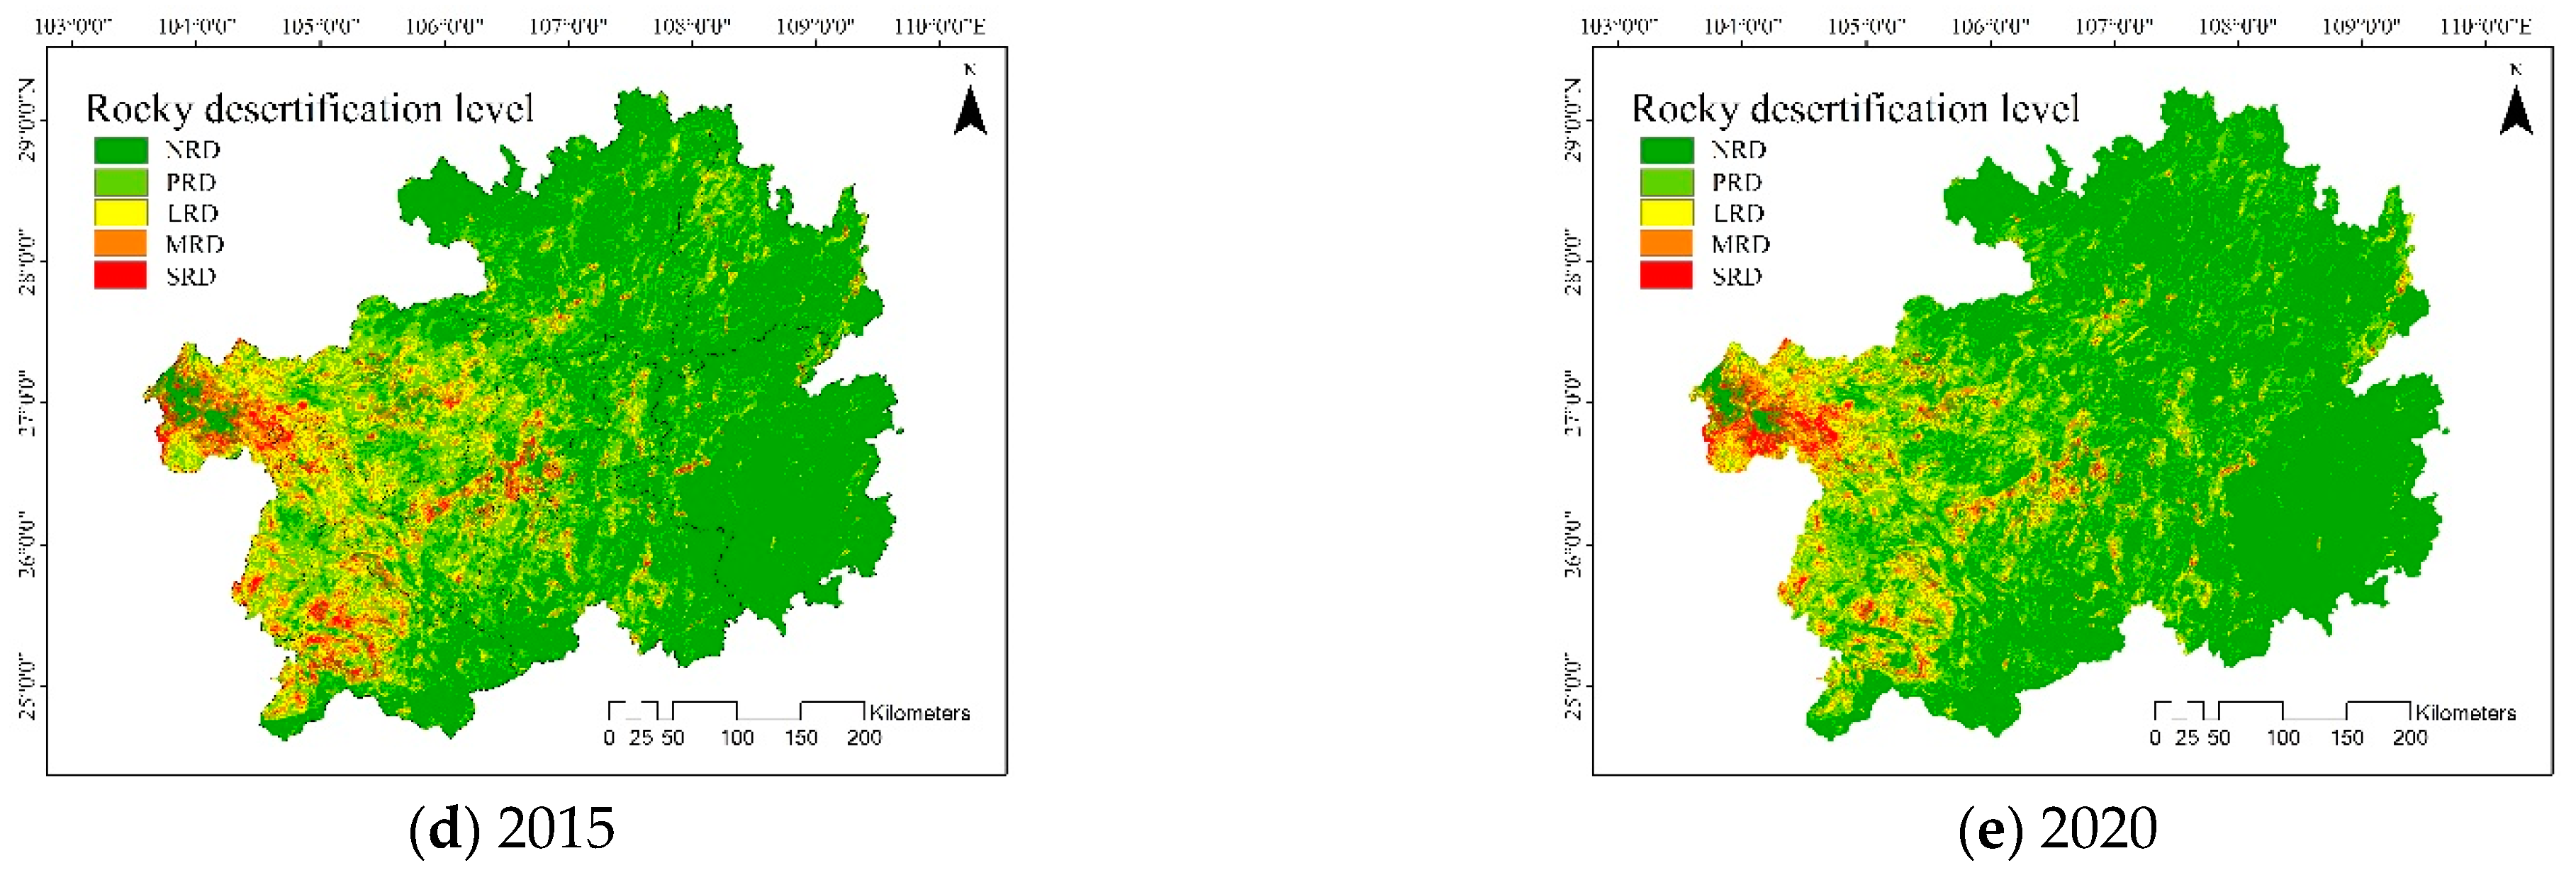
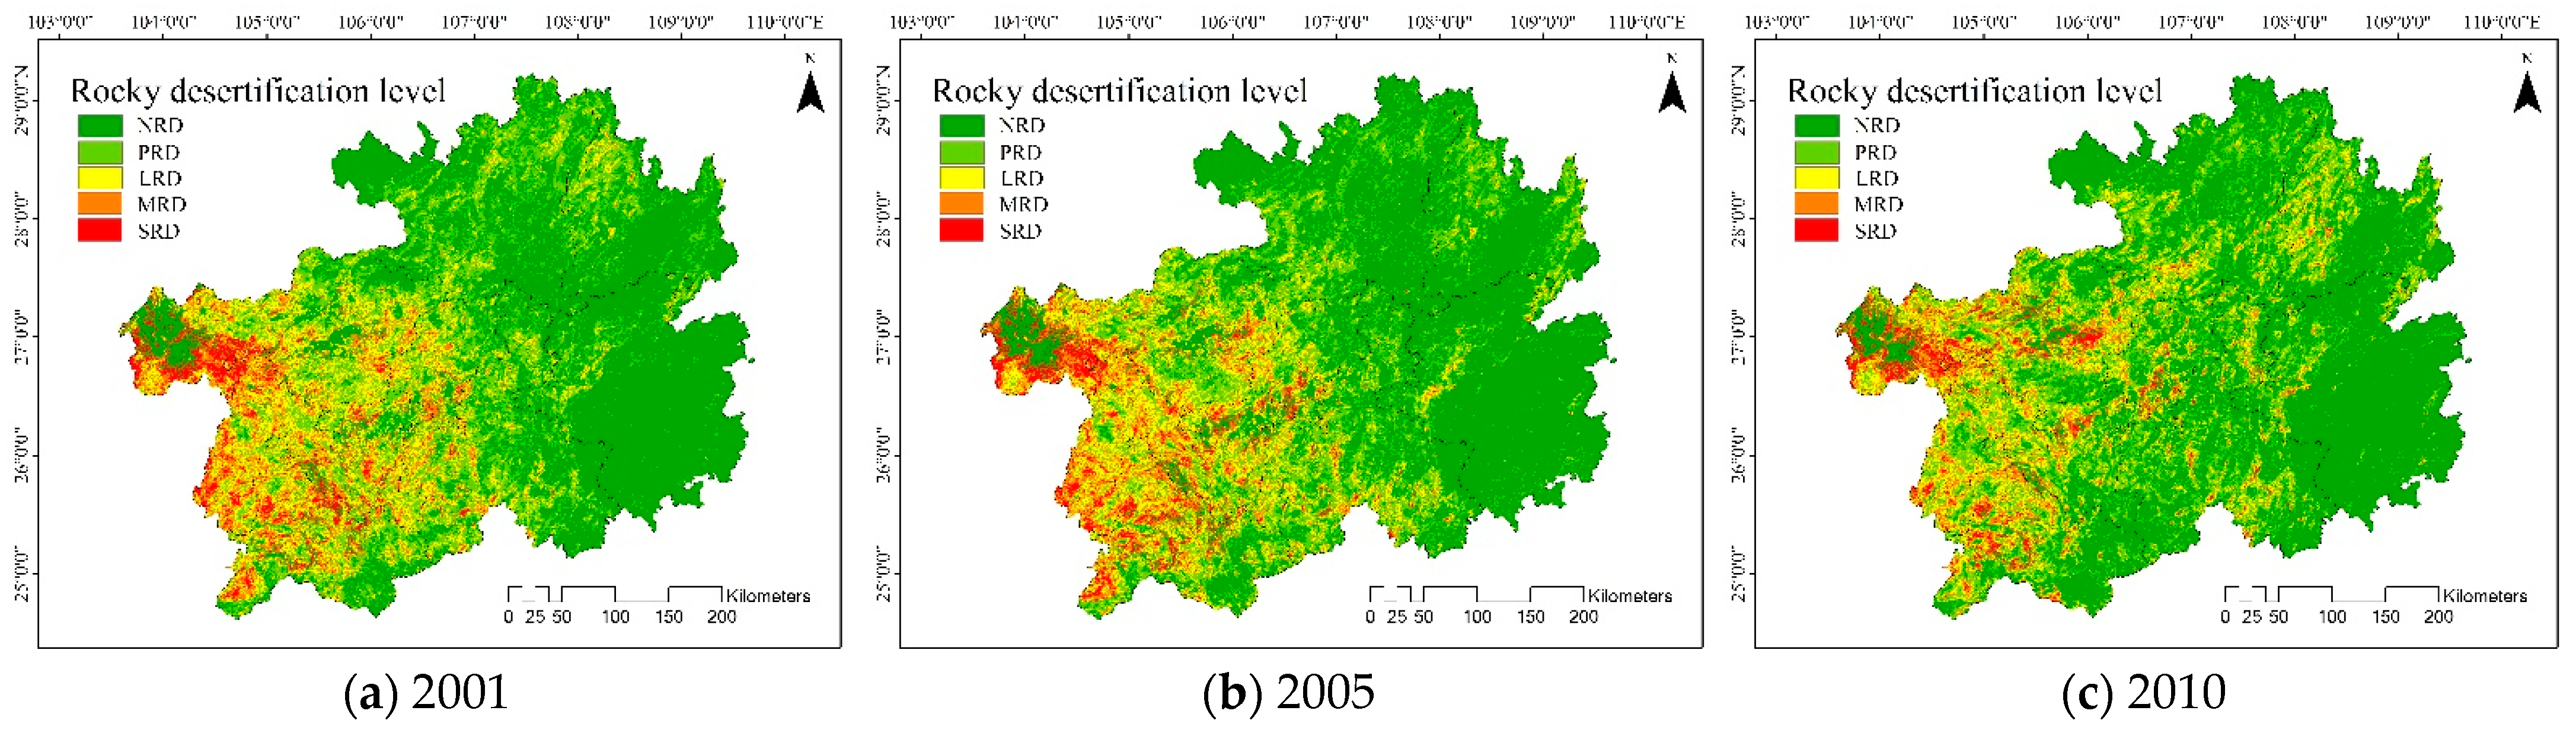
4.1. Spatiotemporal Distribution of Rocky Desertification Evolution
4.1.1. Dynamic Degree of Rocky Desertification Evolution
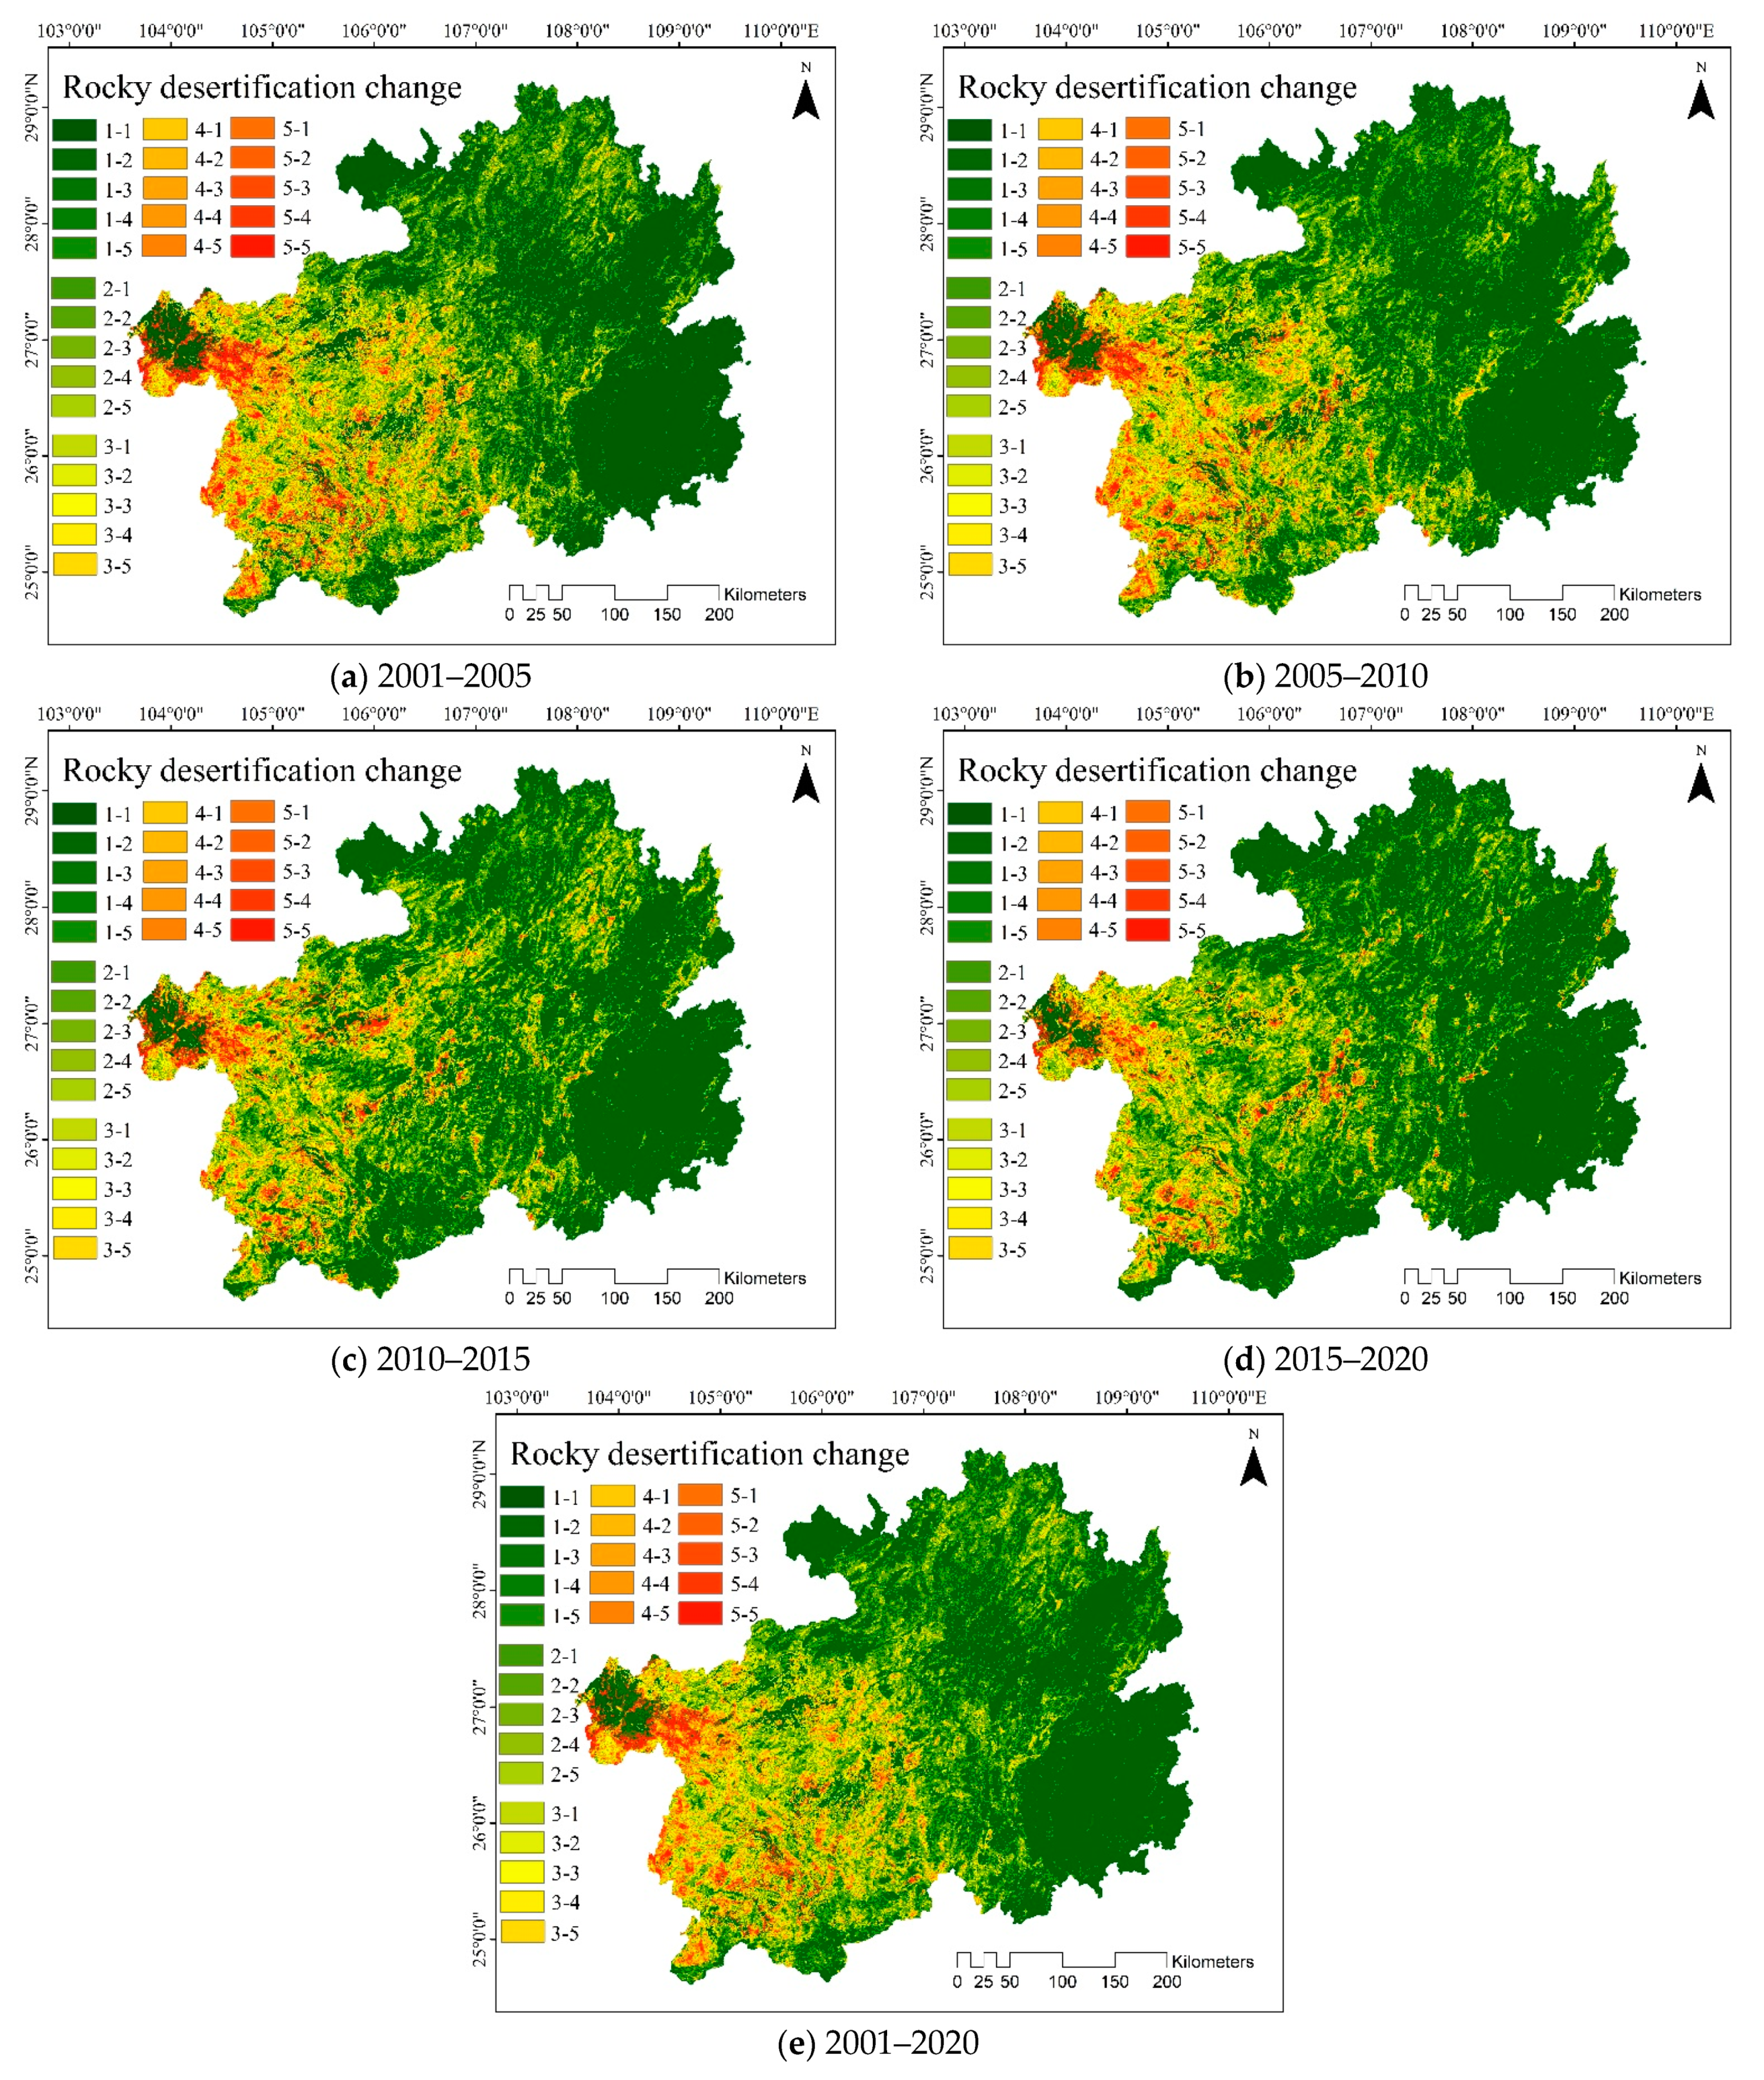
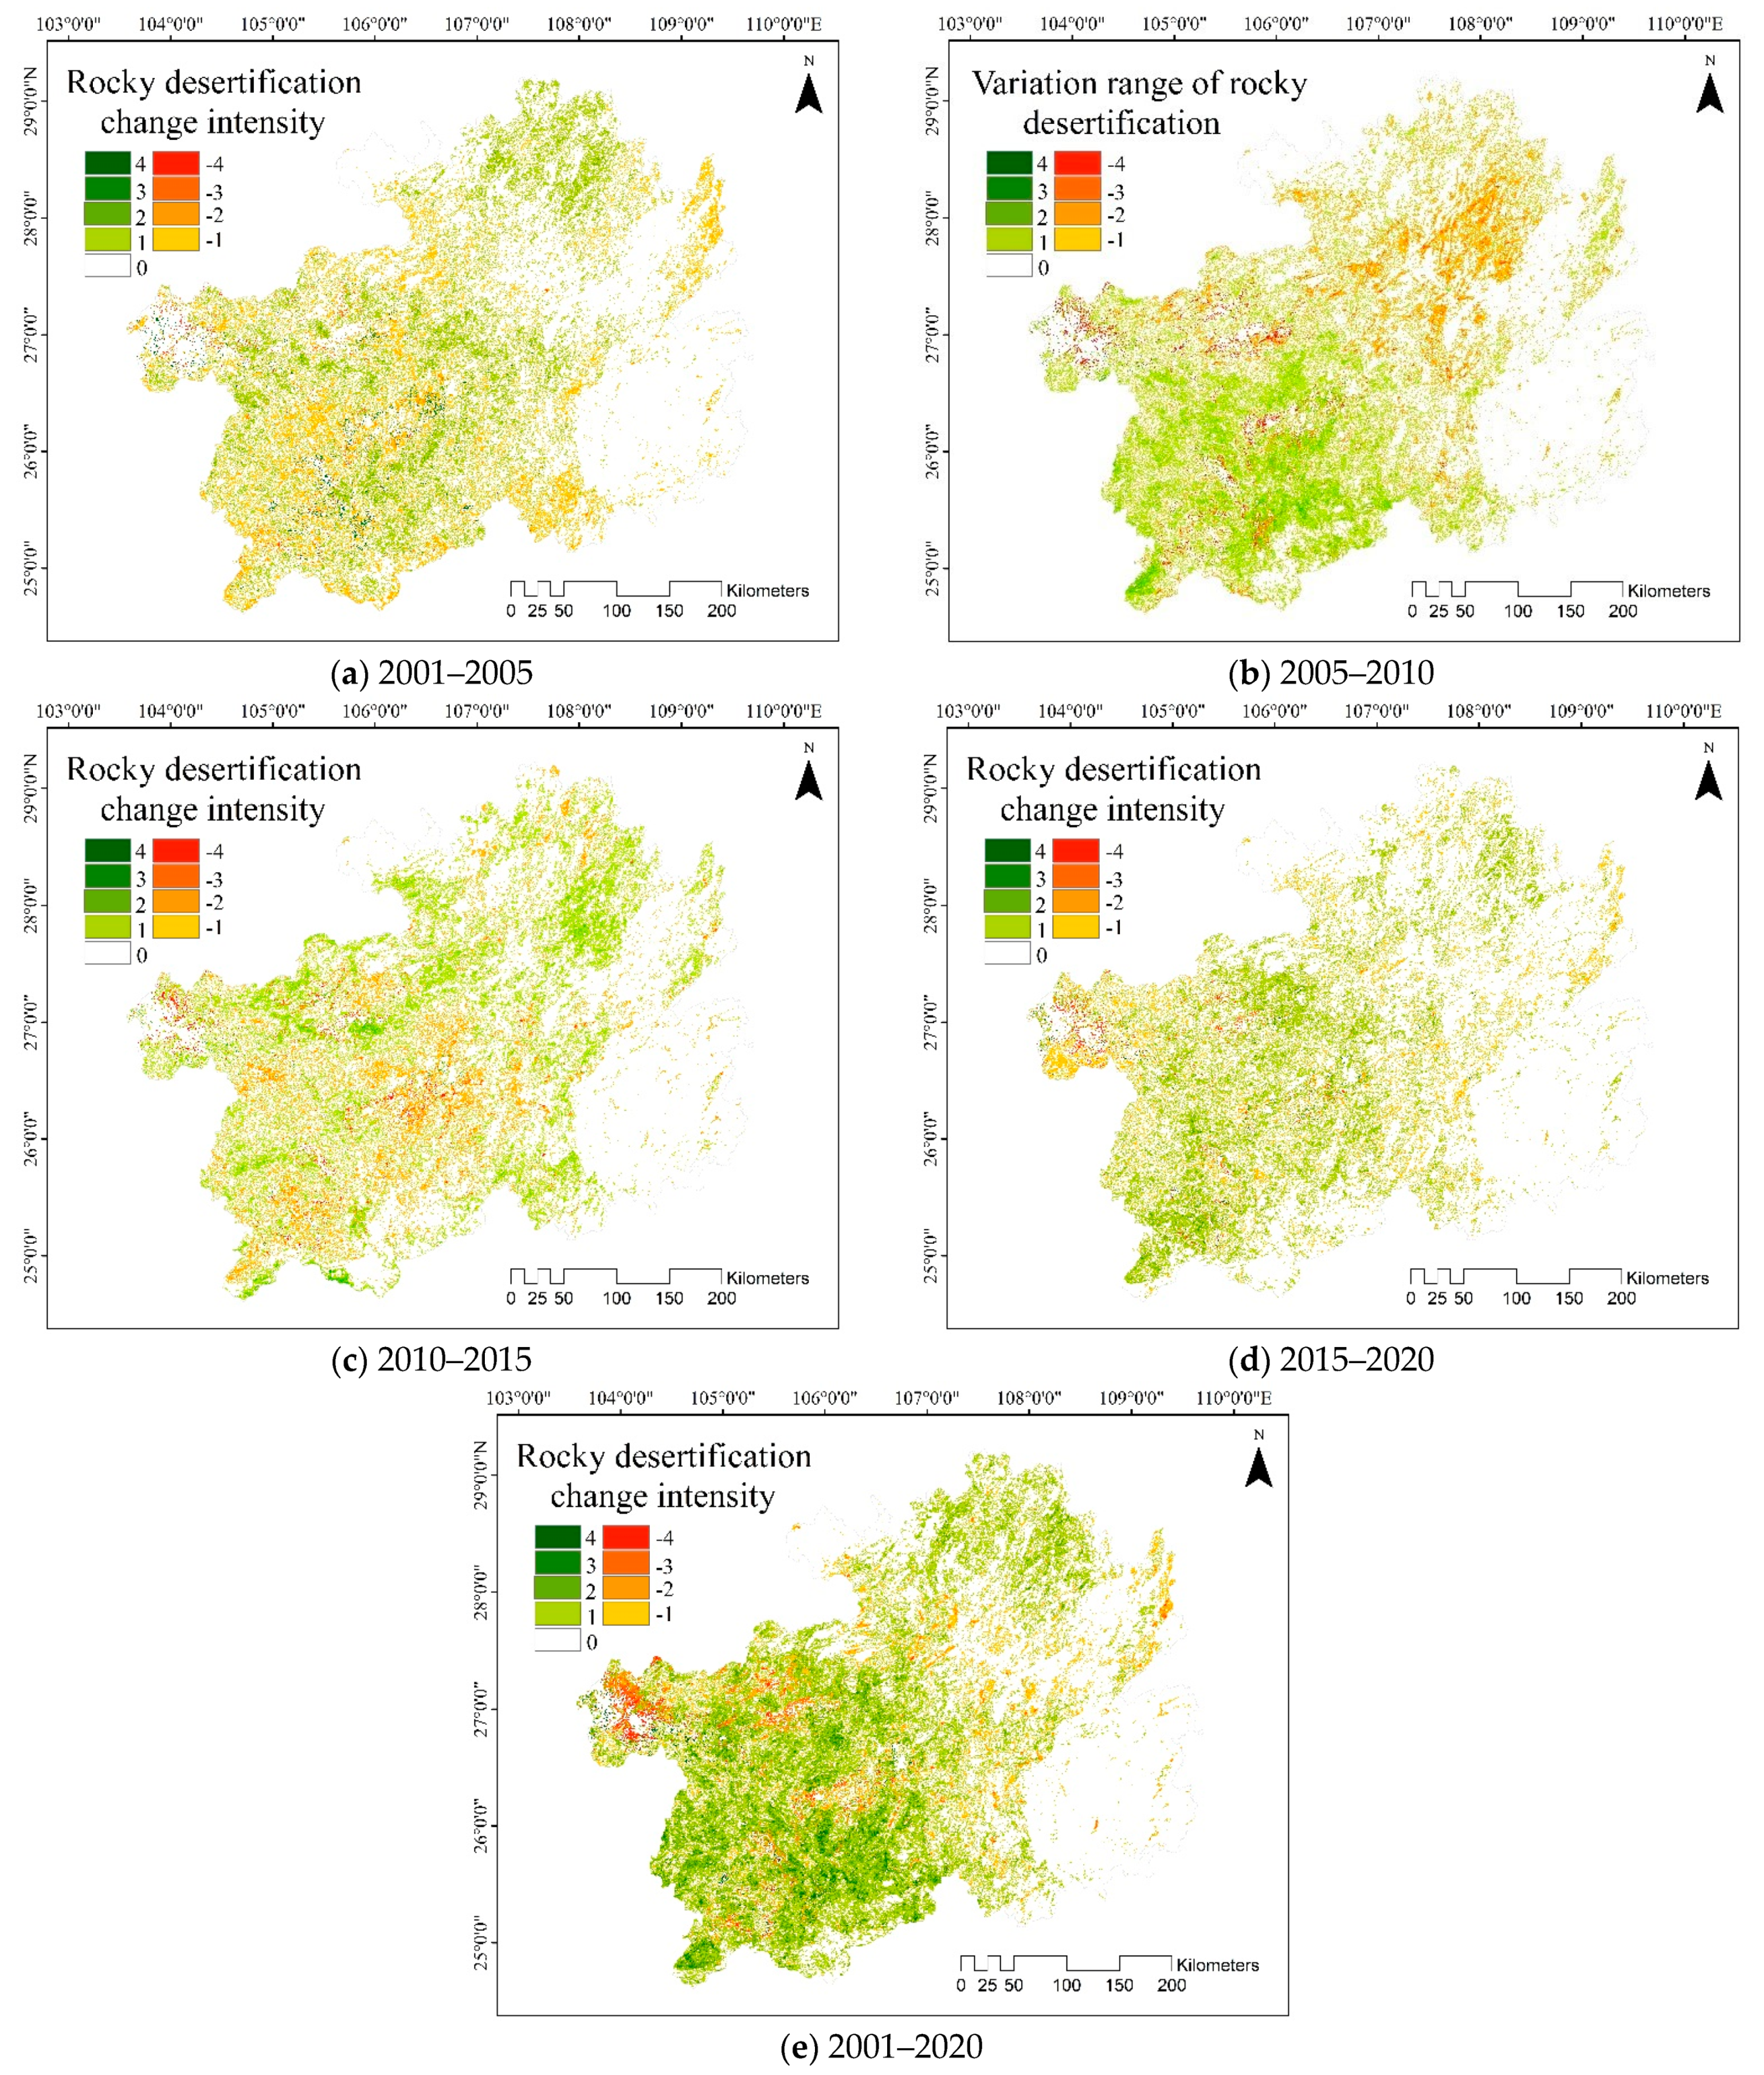
4.1.2. Spatiotemporal Rocky Desertification Evolution Intensity
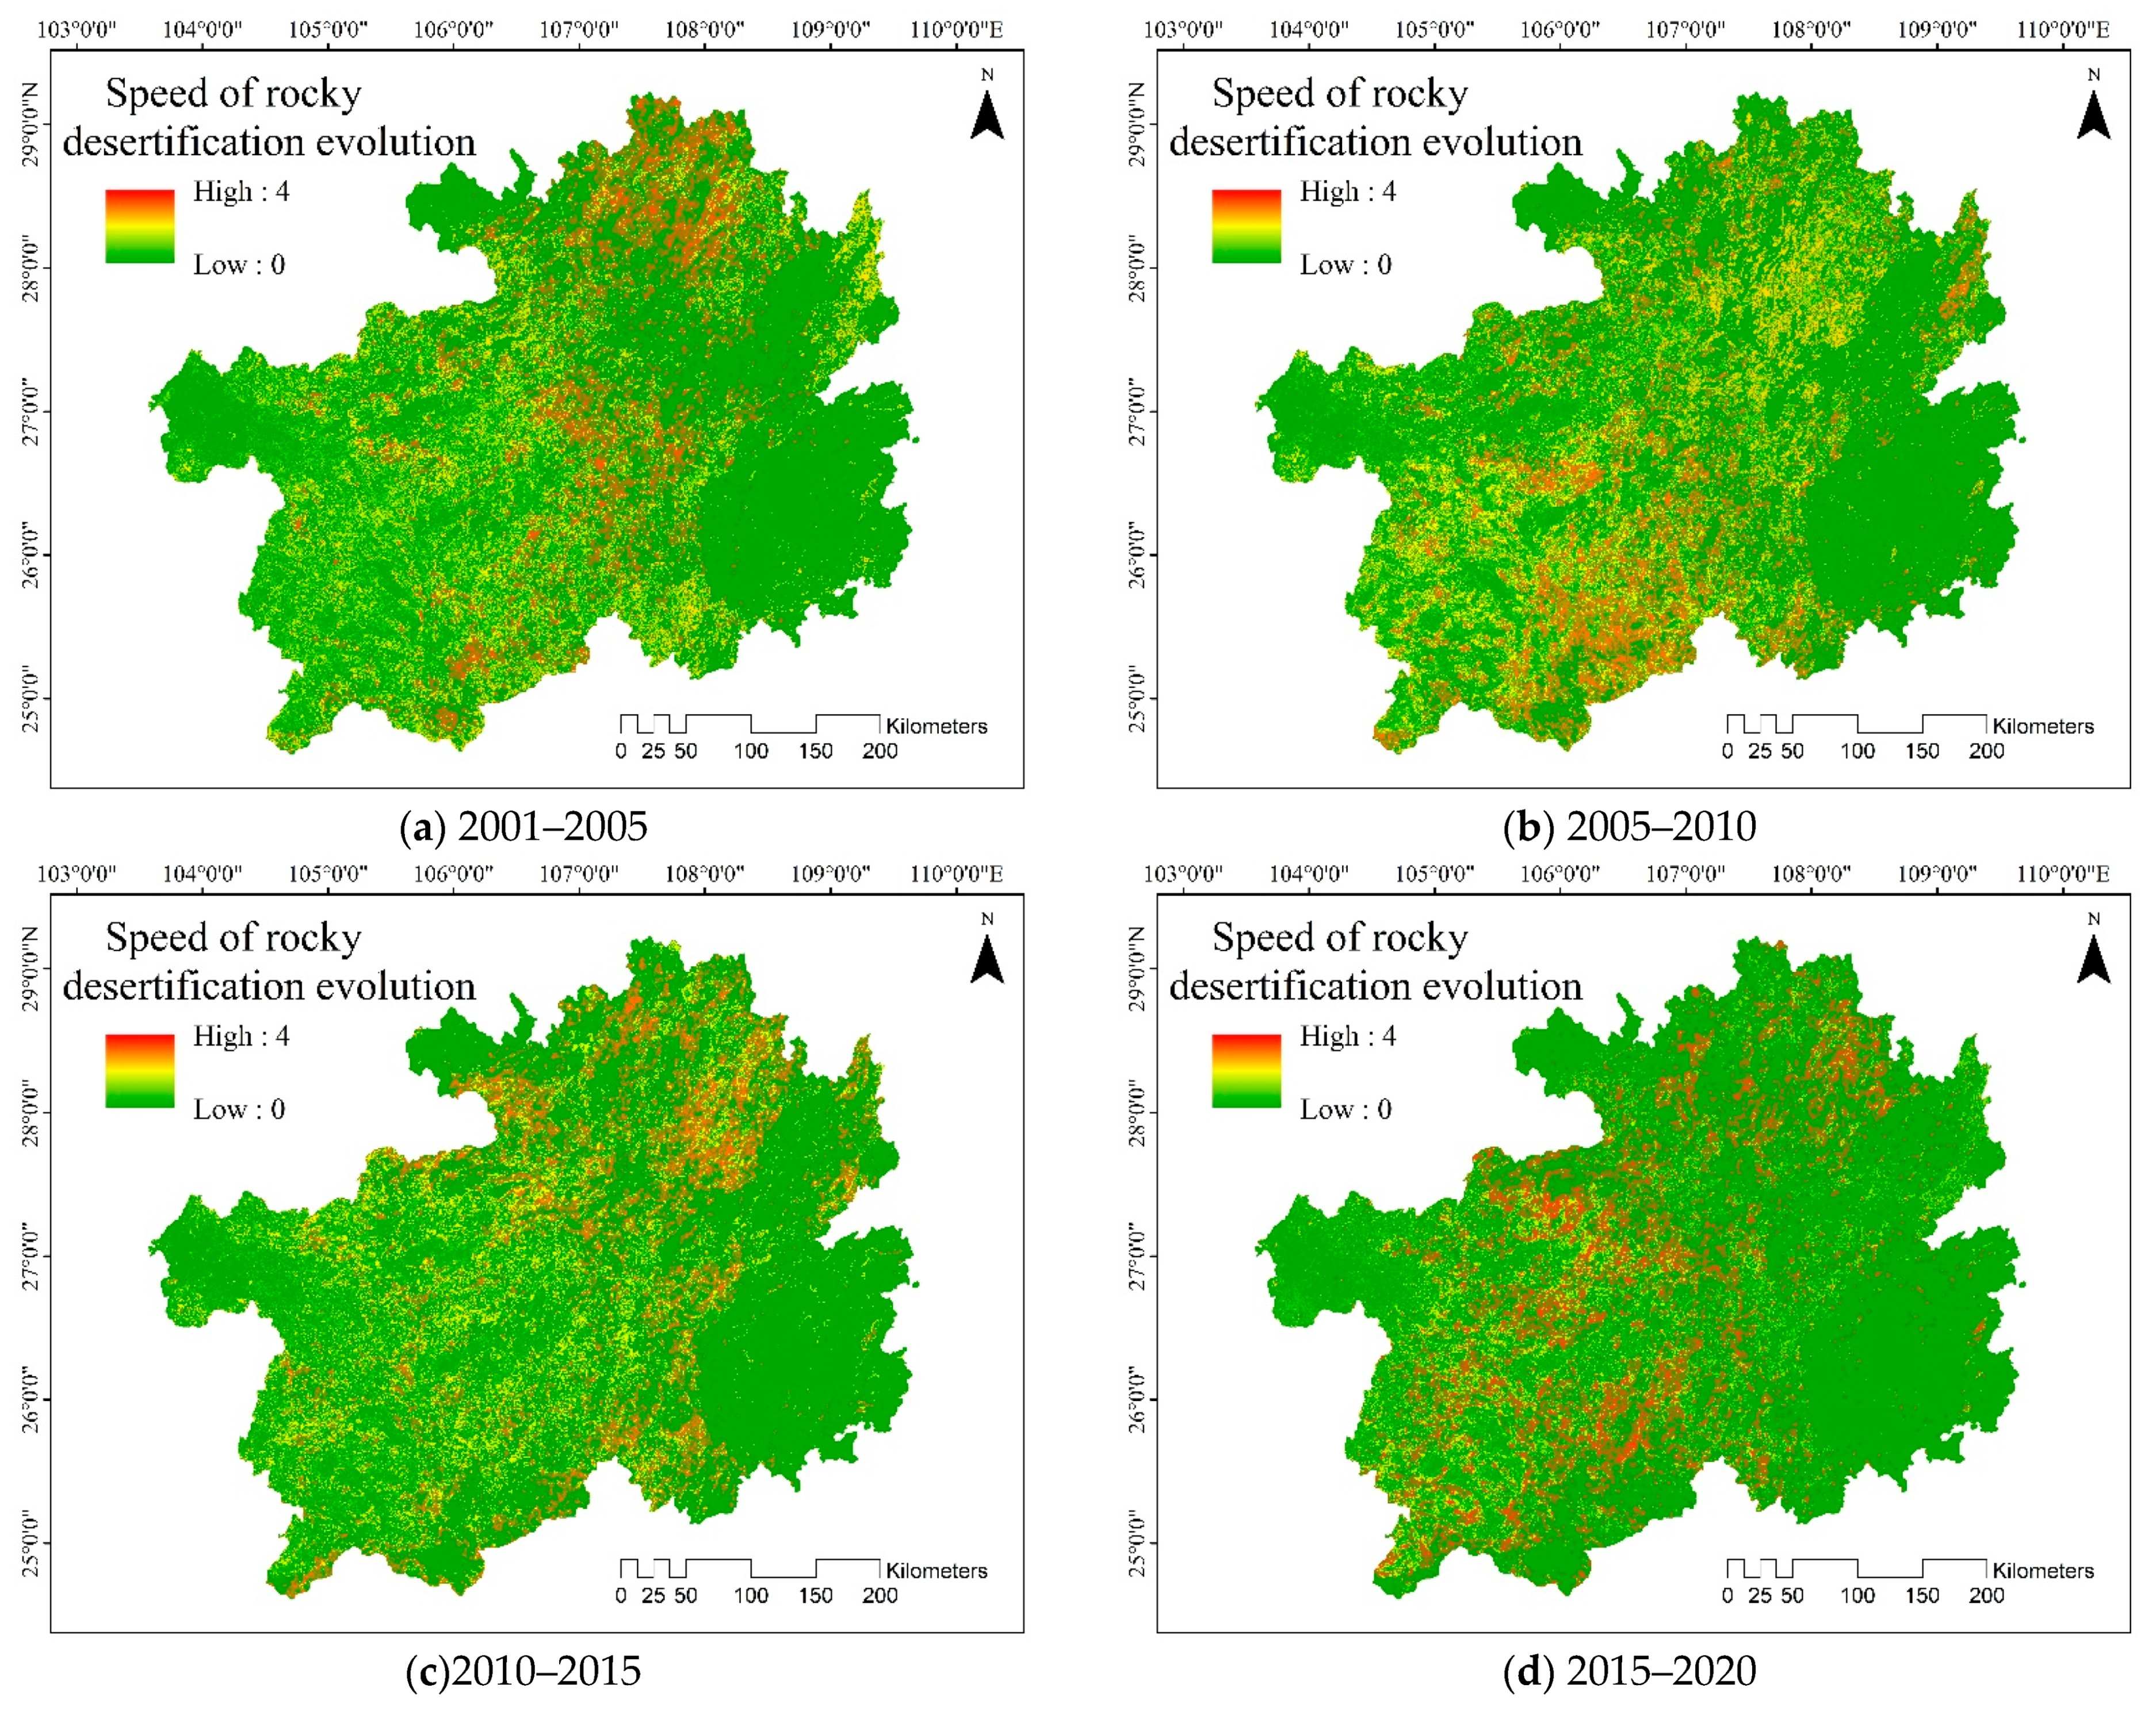
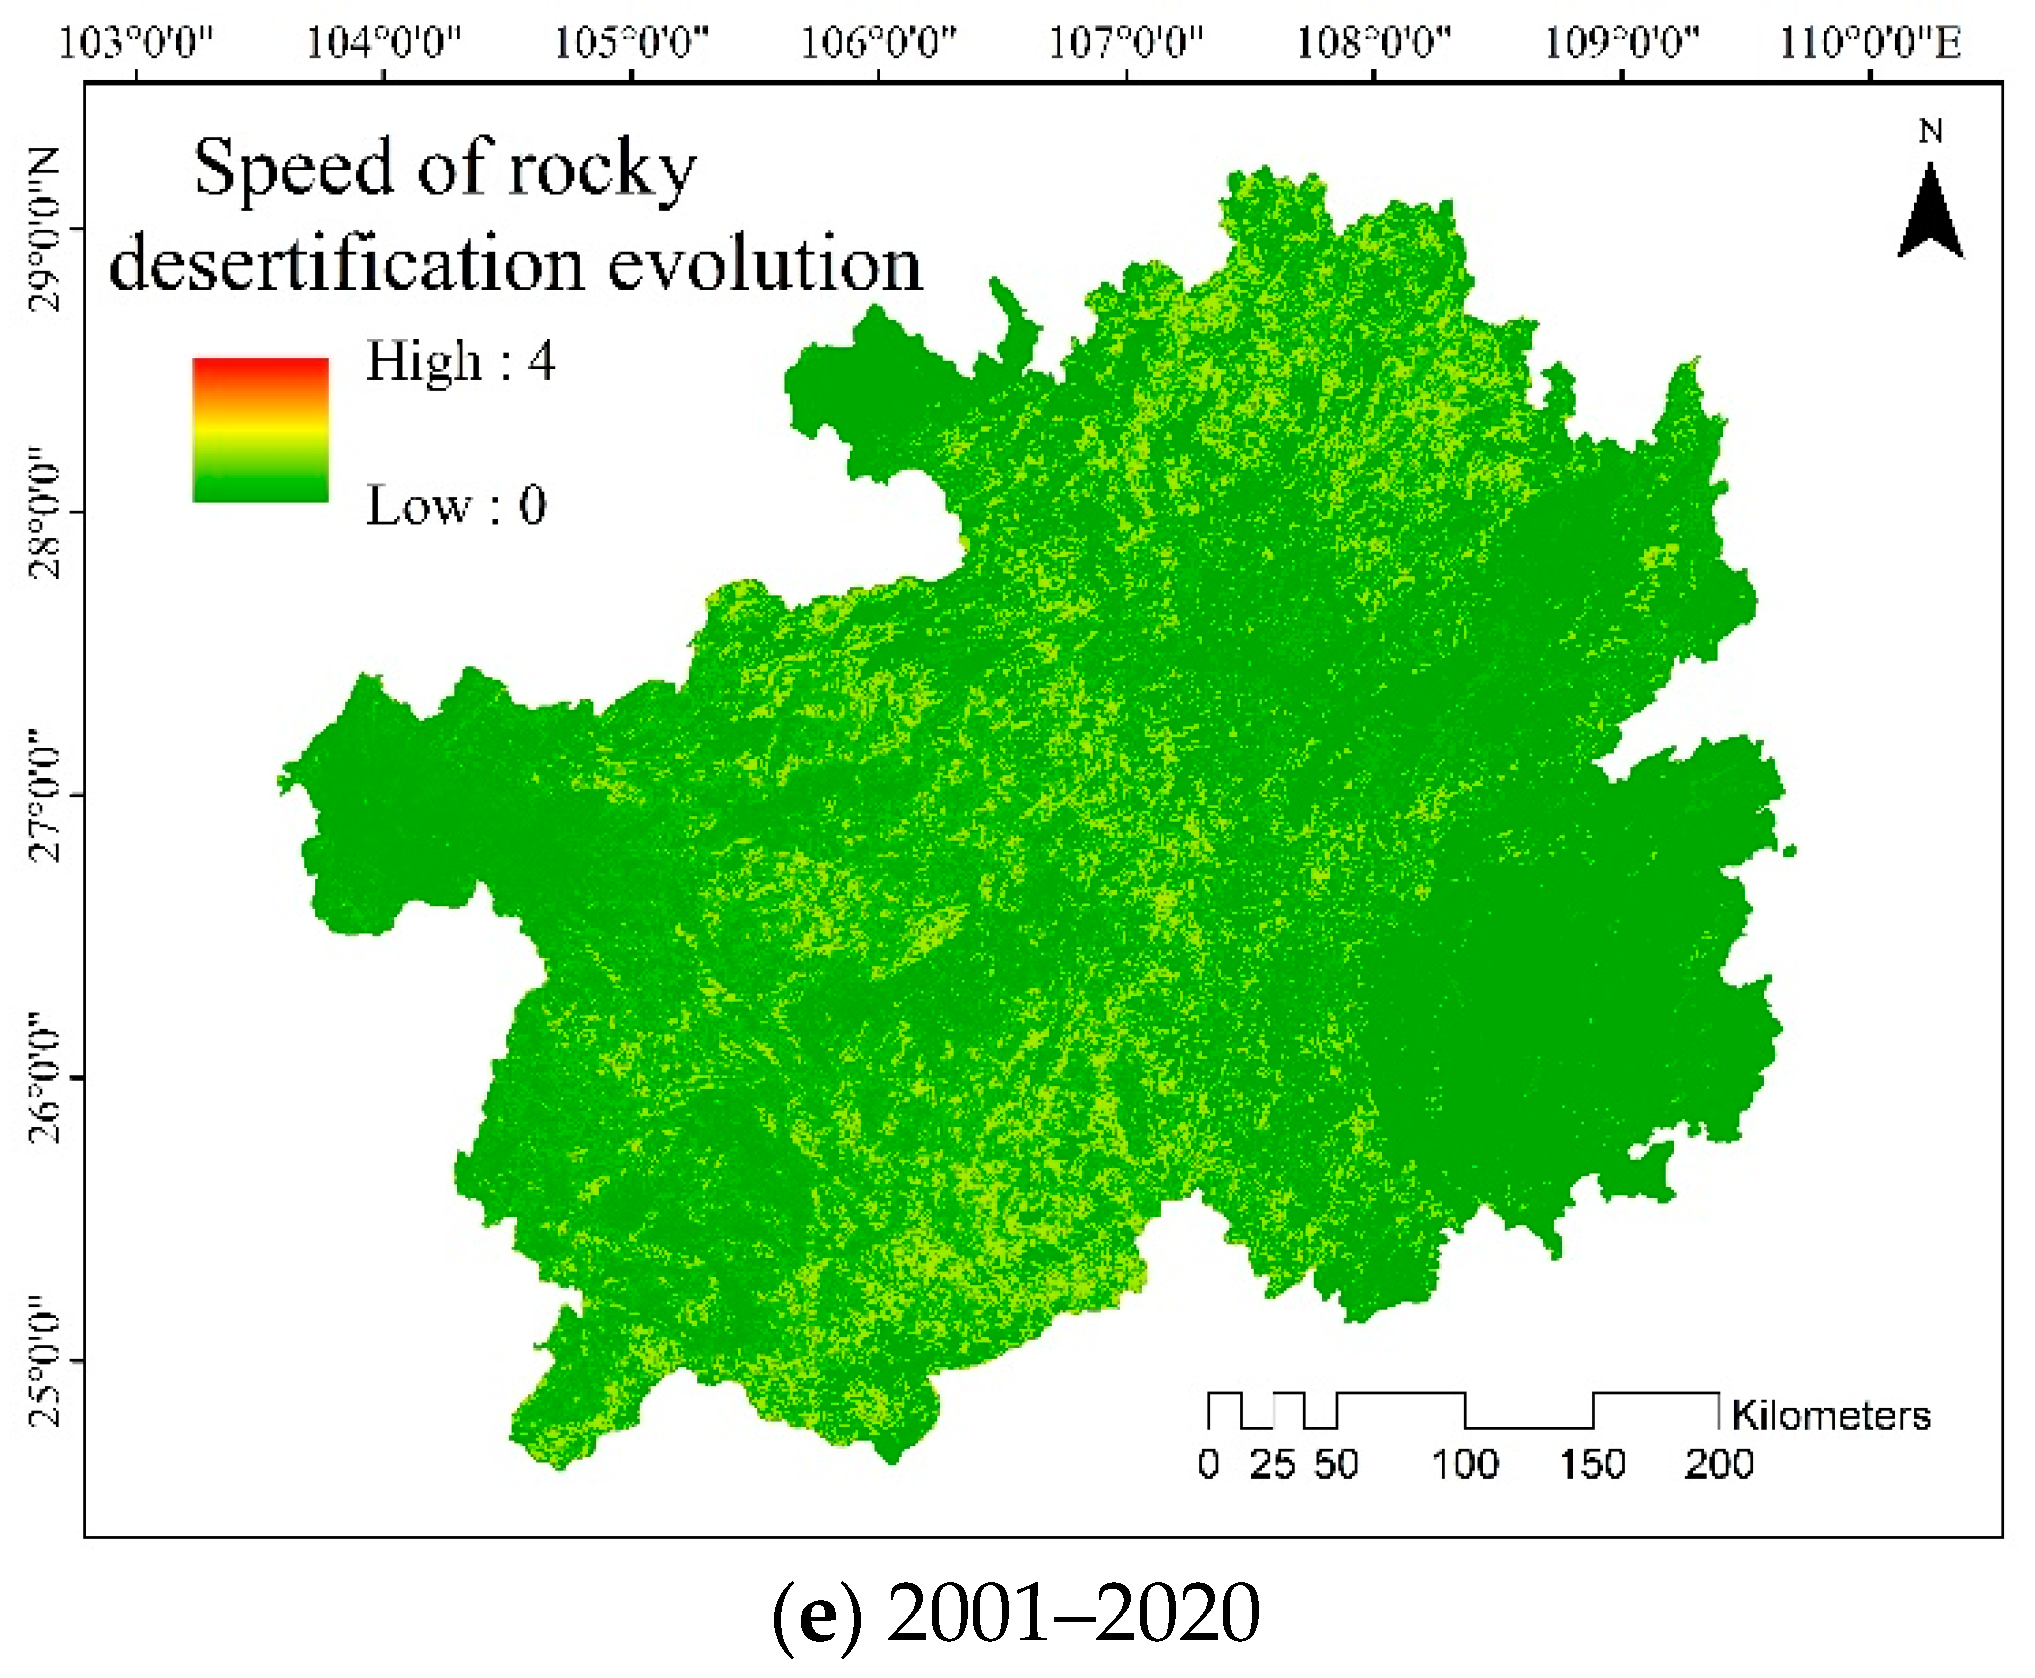
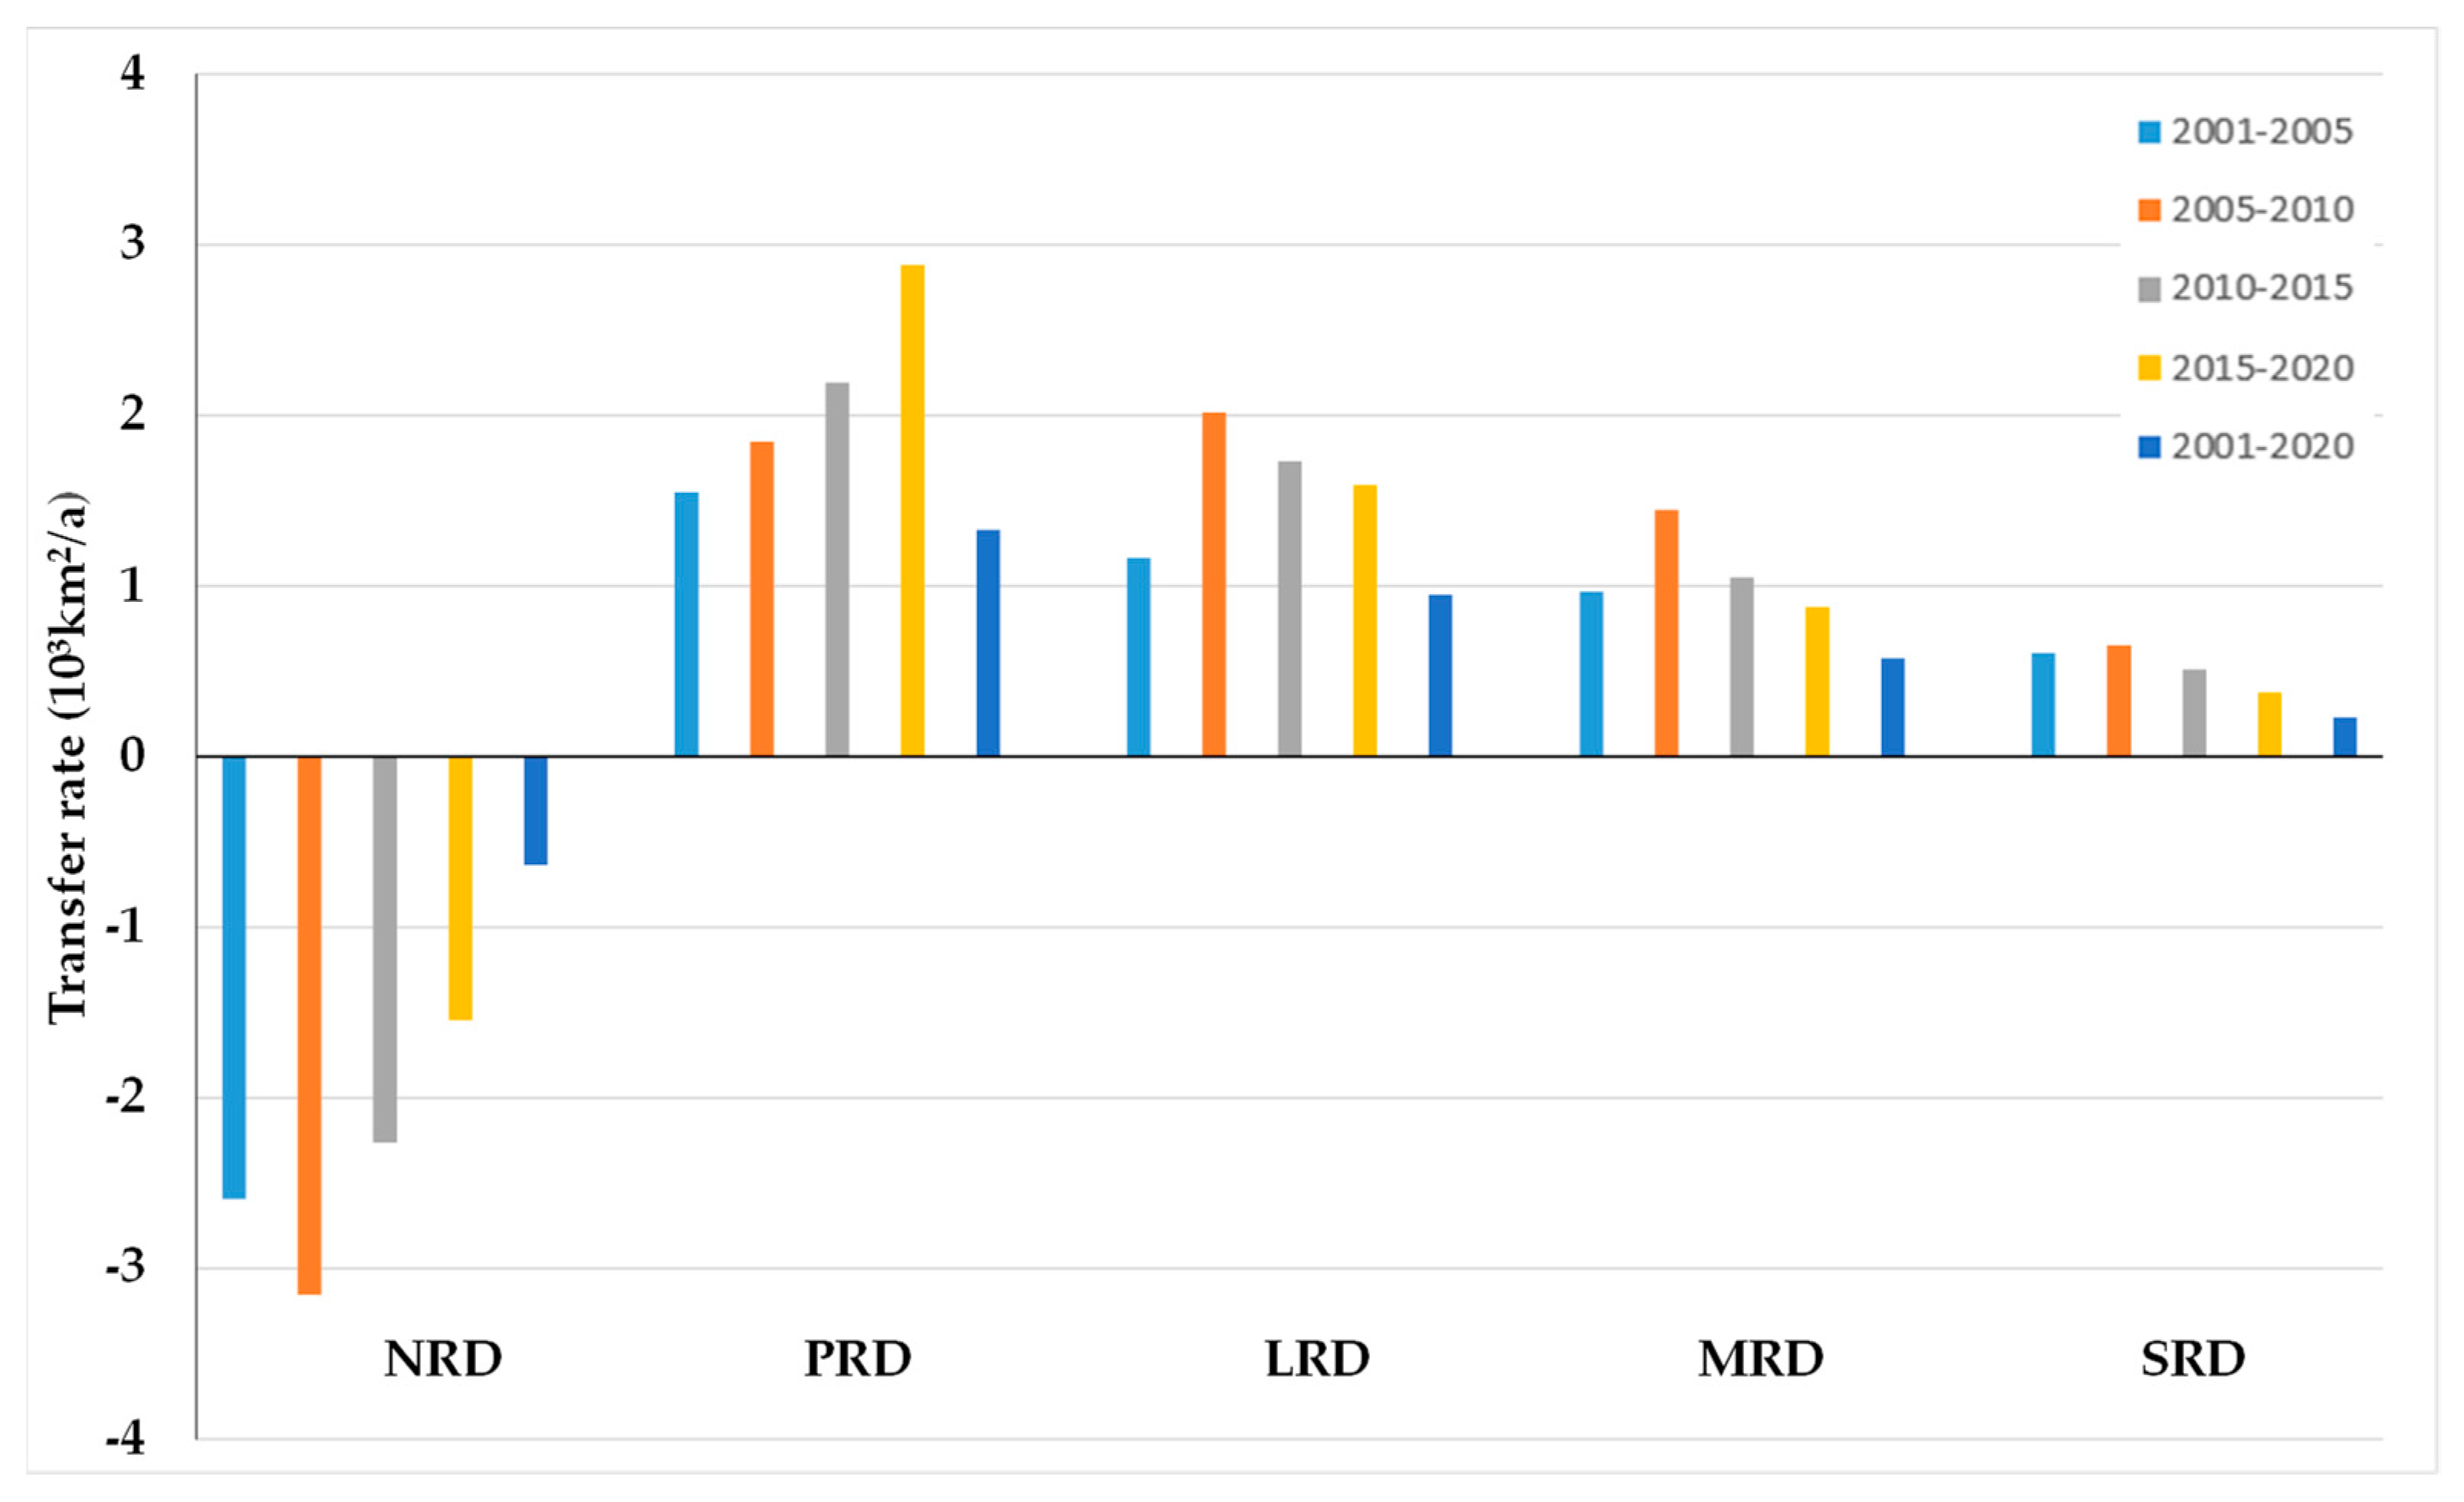
4.1.3. Spatiotemporal Rocky Desertification Evolution Speed
4.2. Future Scenario Prediction of Rocky Desertification
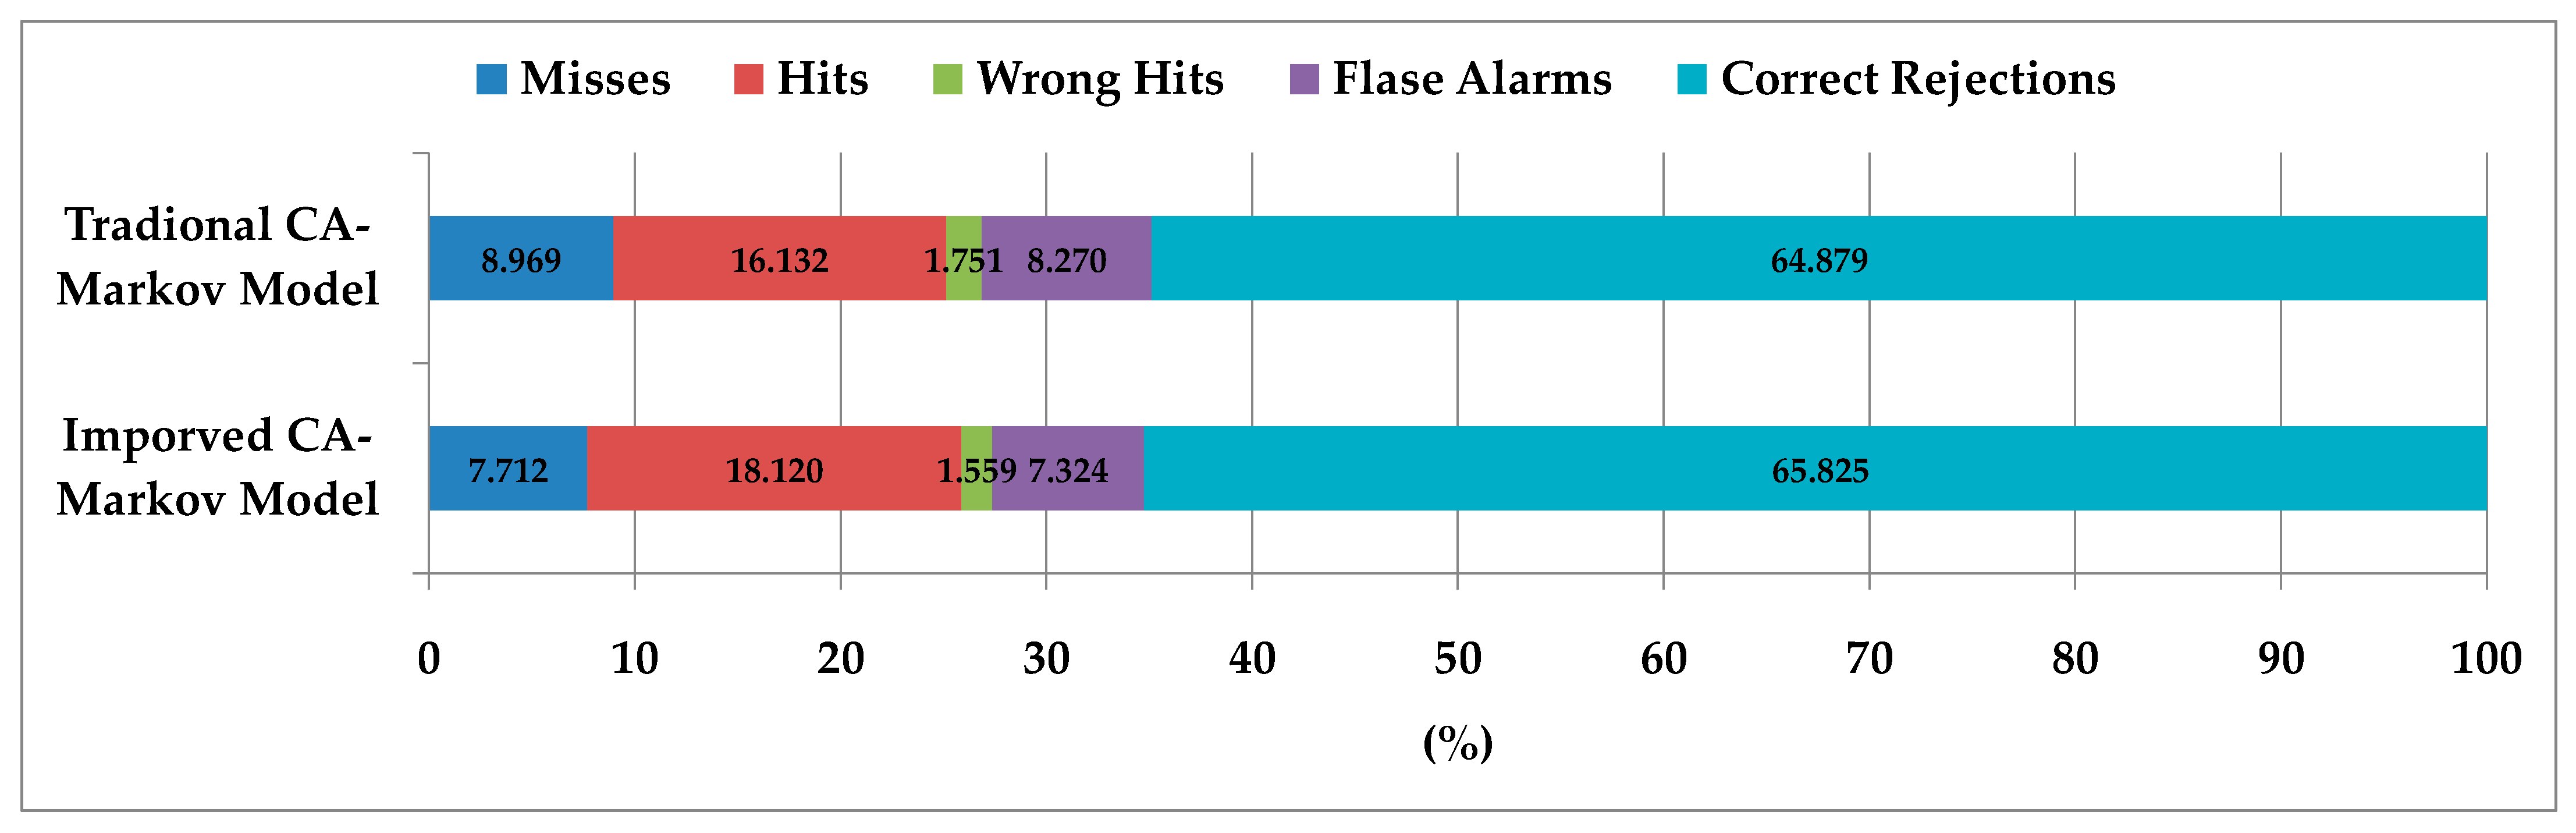
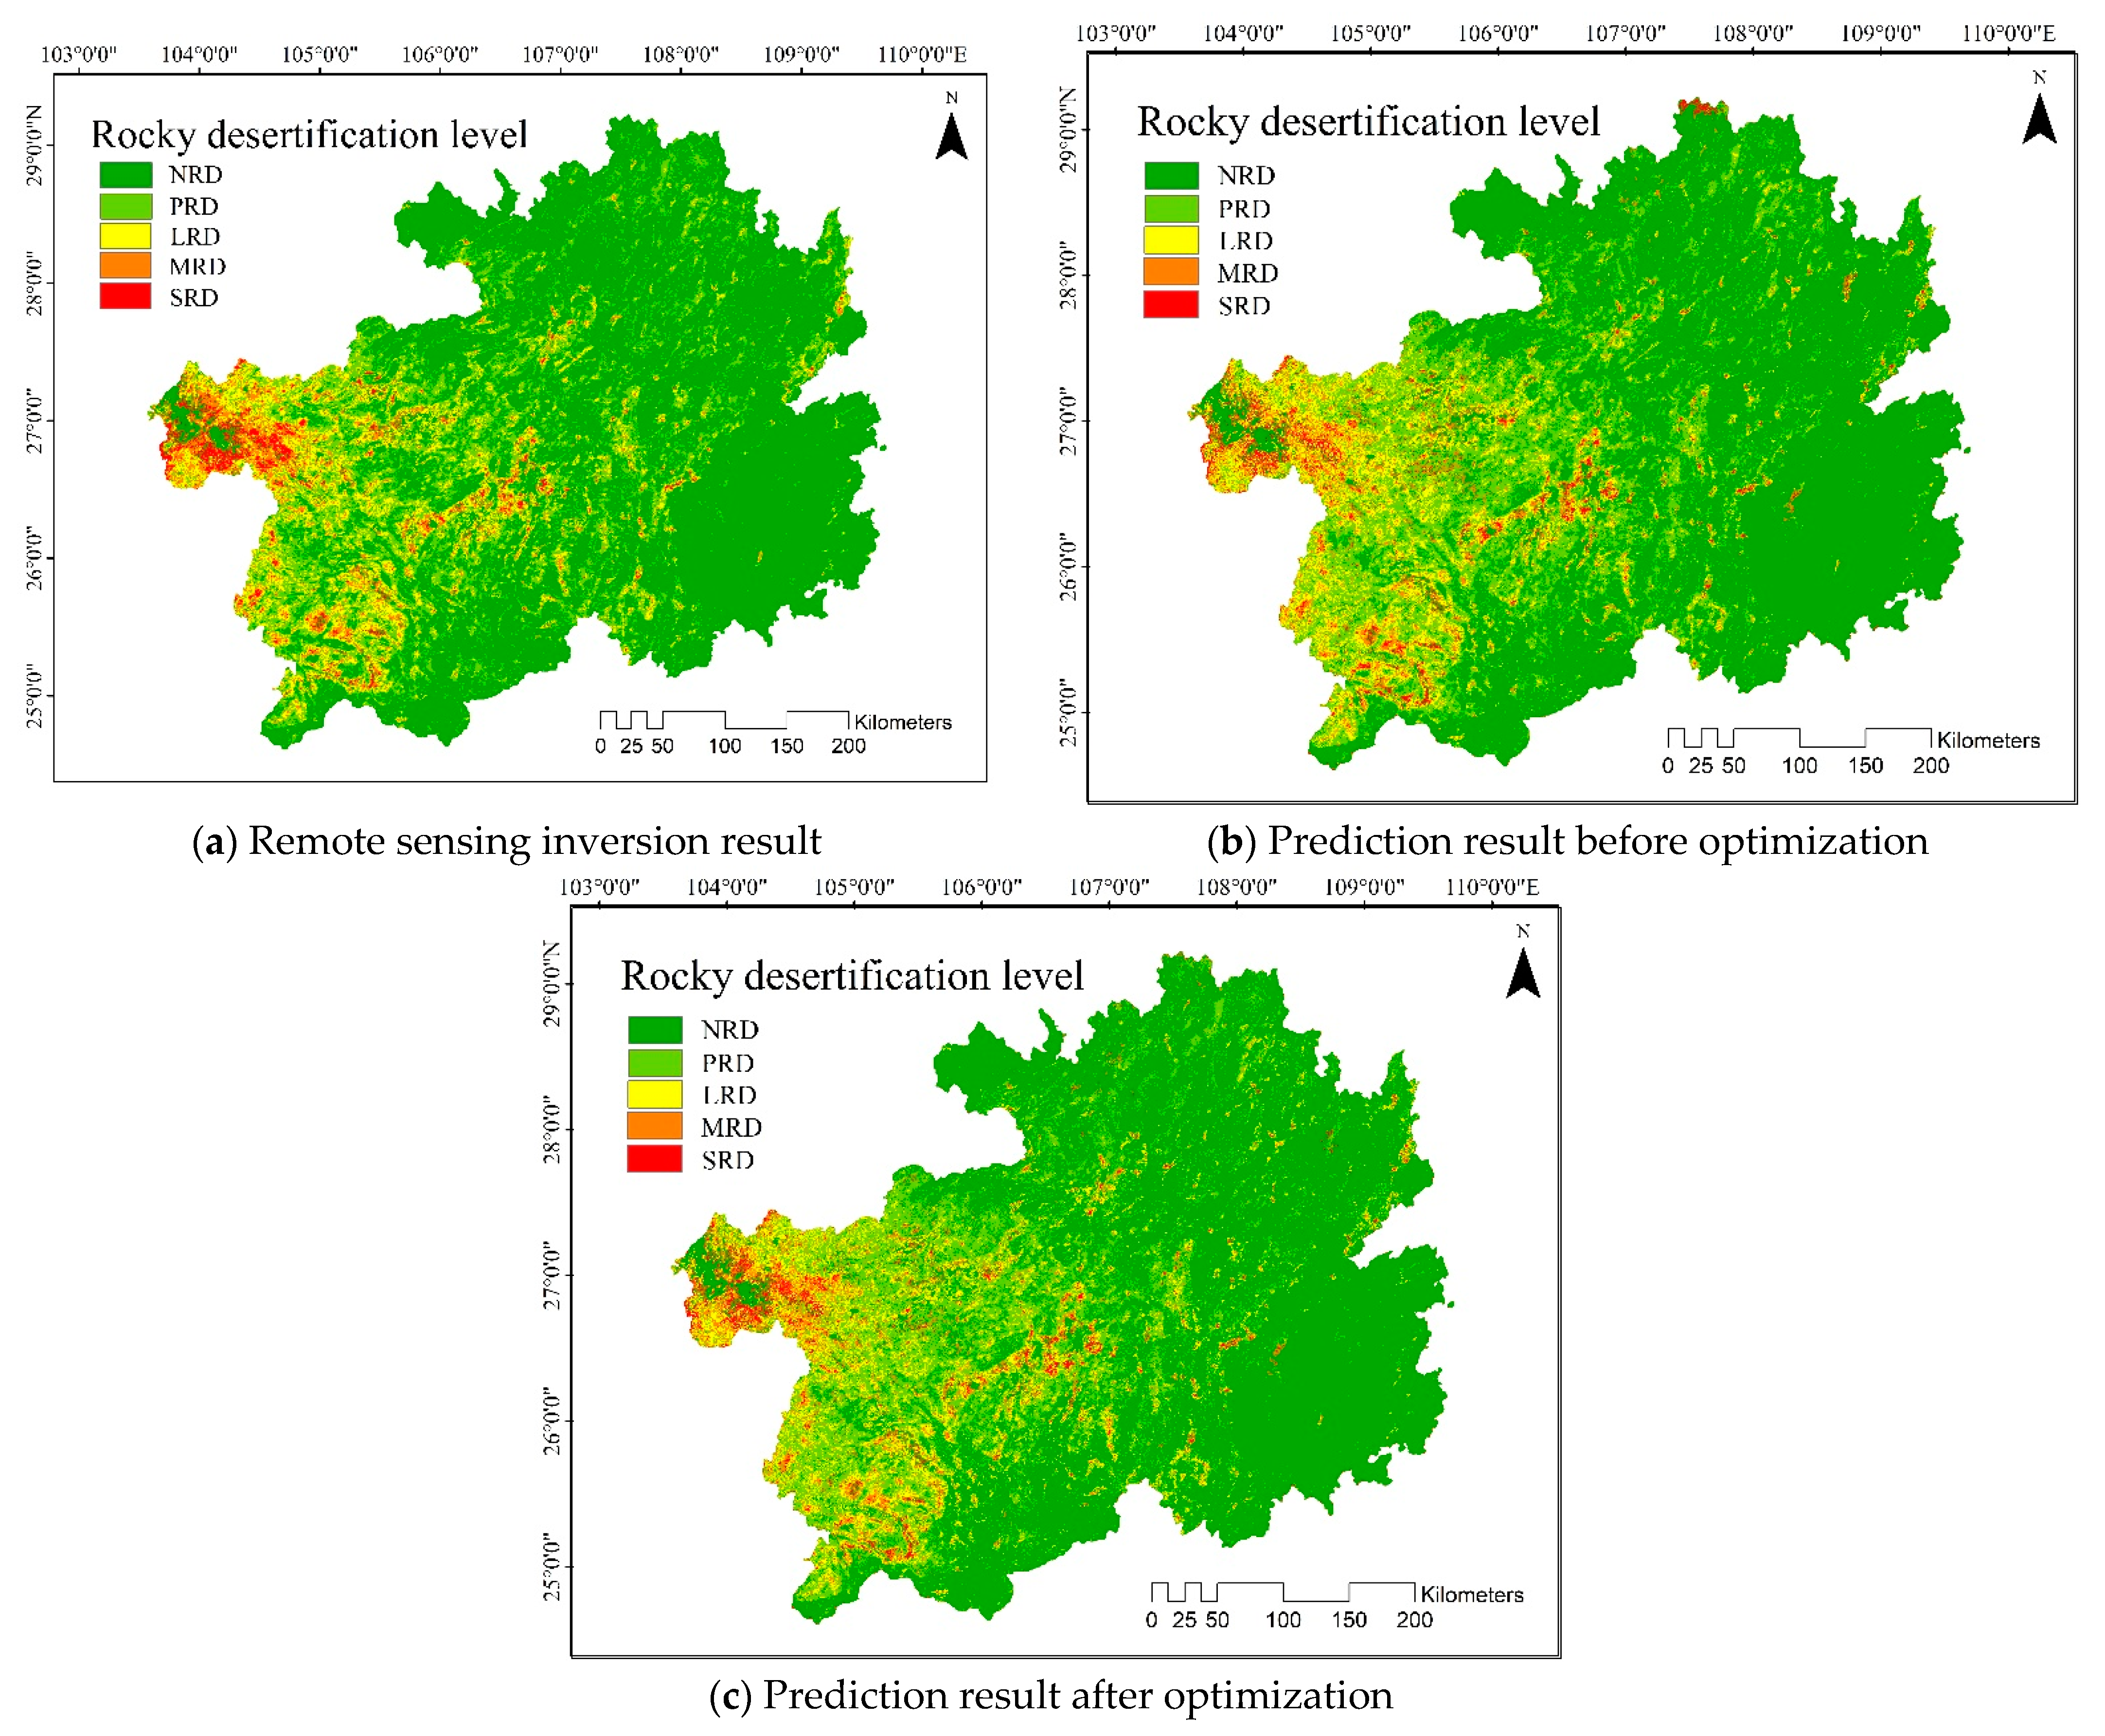
4.2.1. Improved CA-Markov Prediction Model Performance
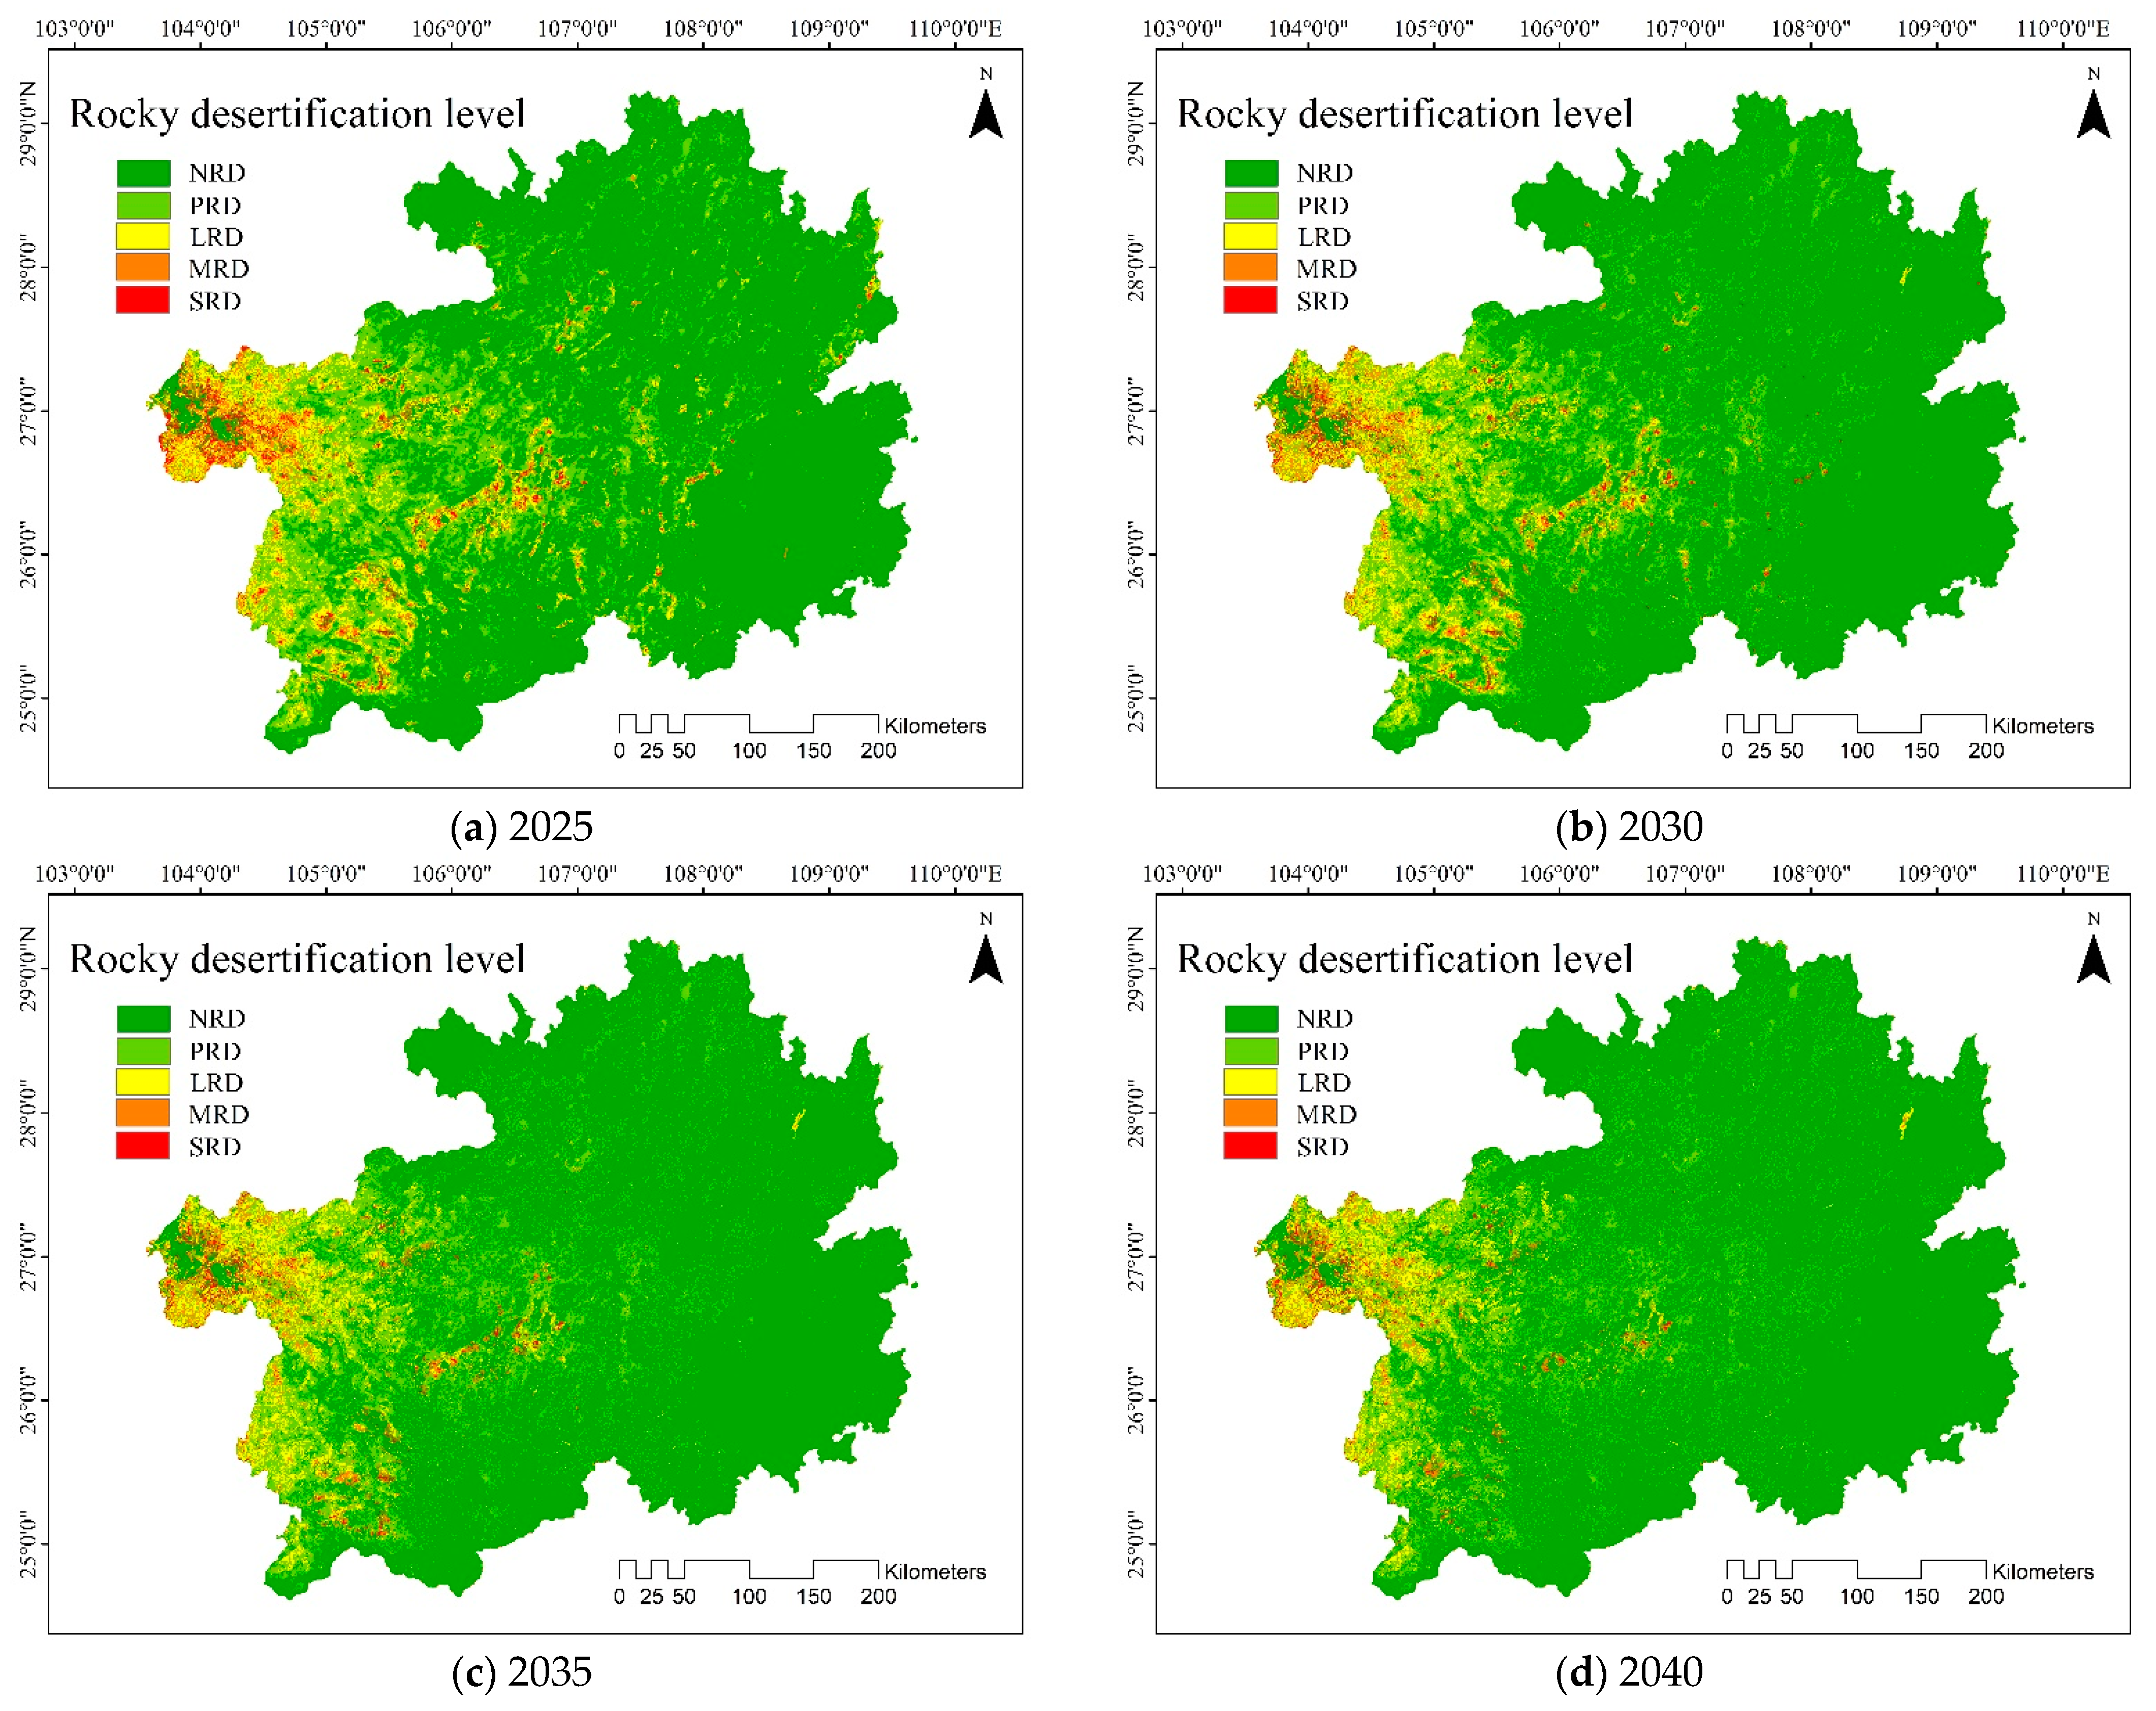
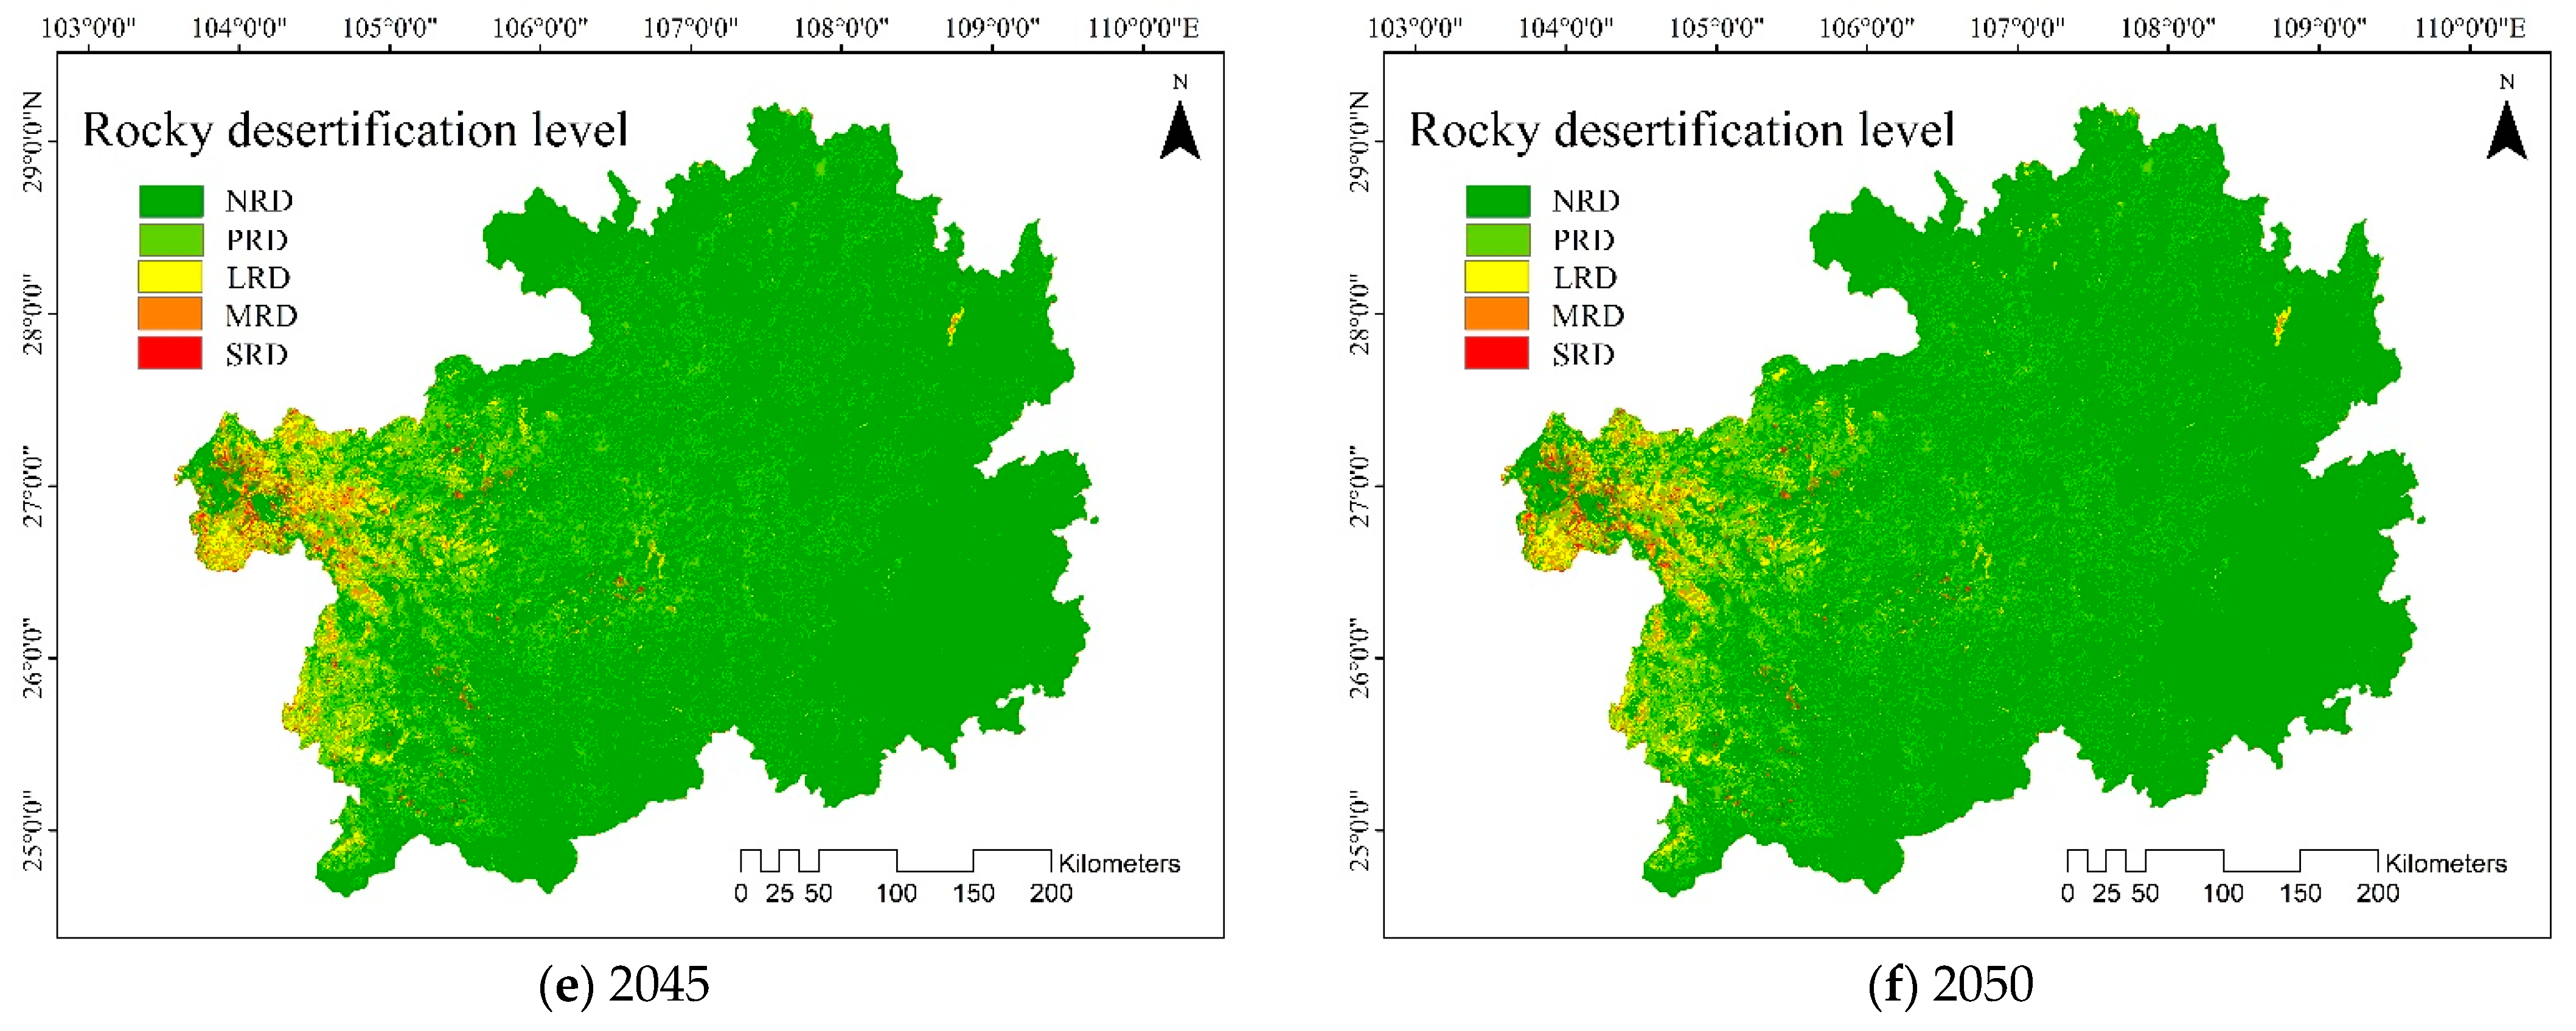
4.2.2. Future Scenario Prediction Based on Improved CA-Markov Prediction Model
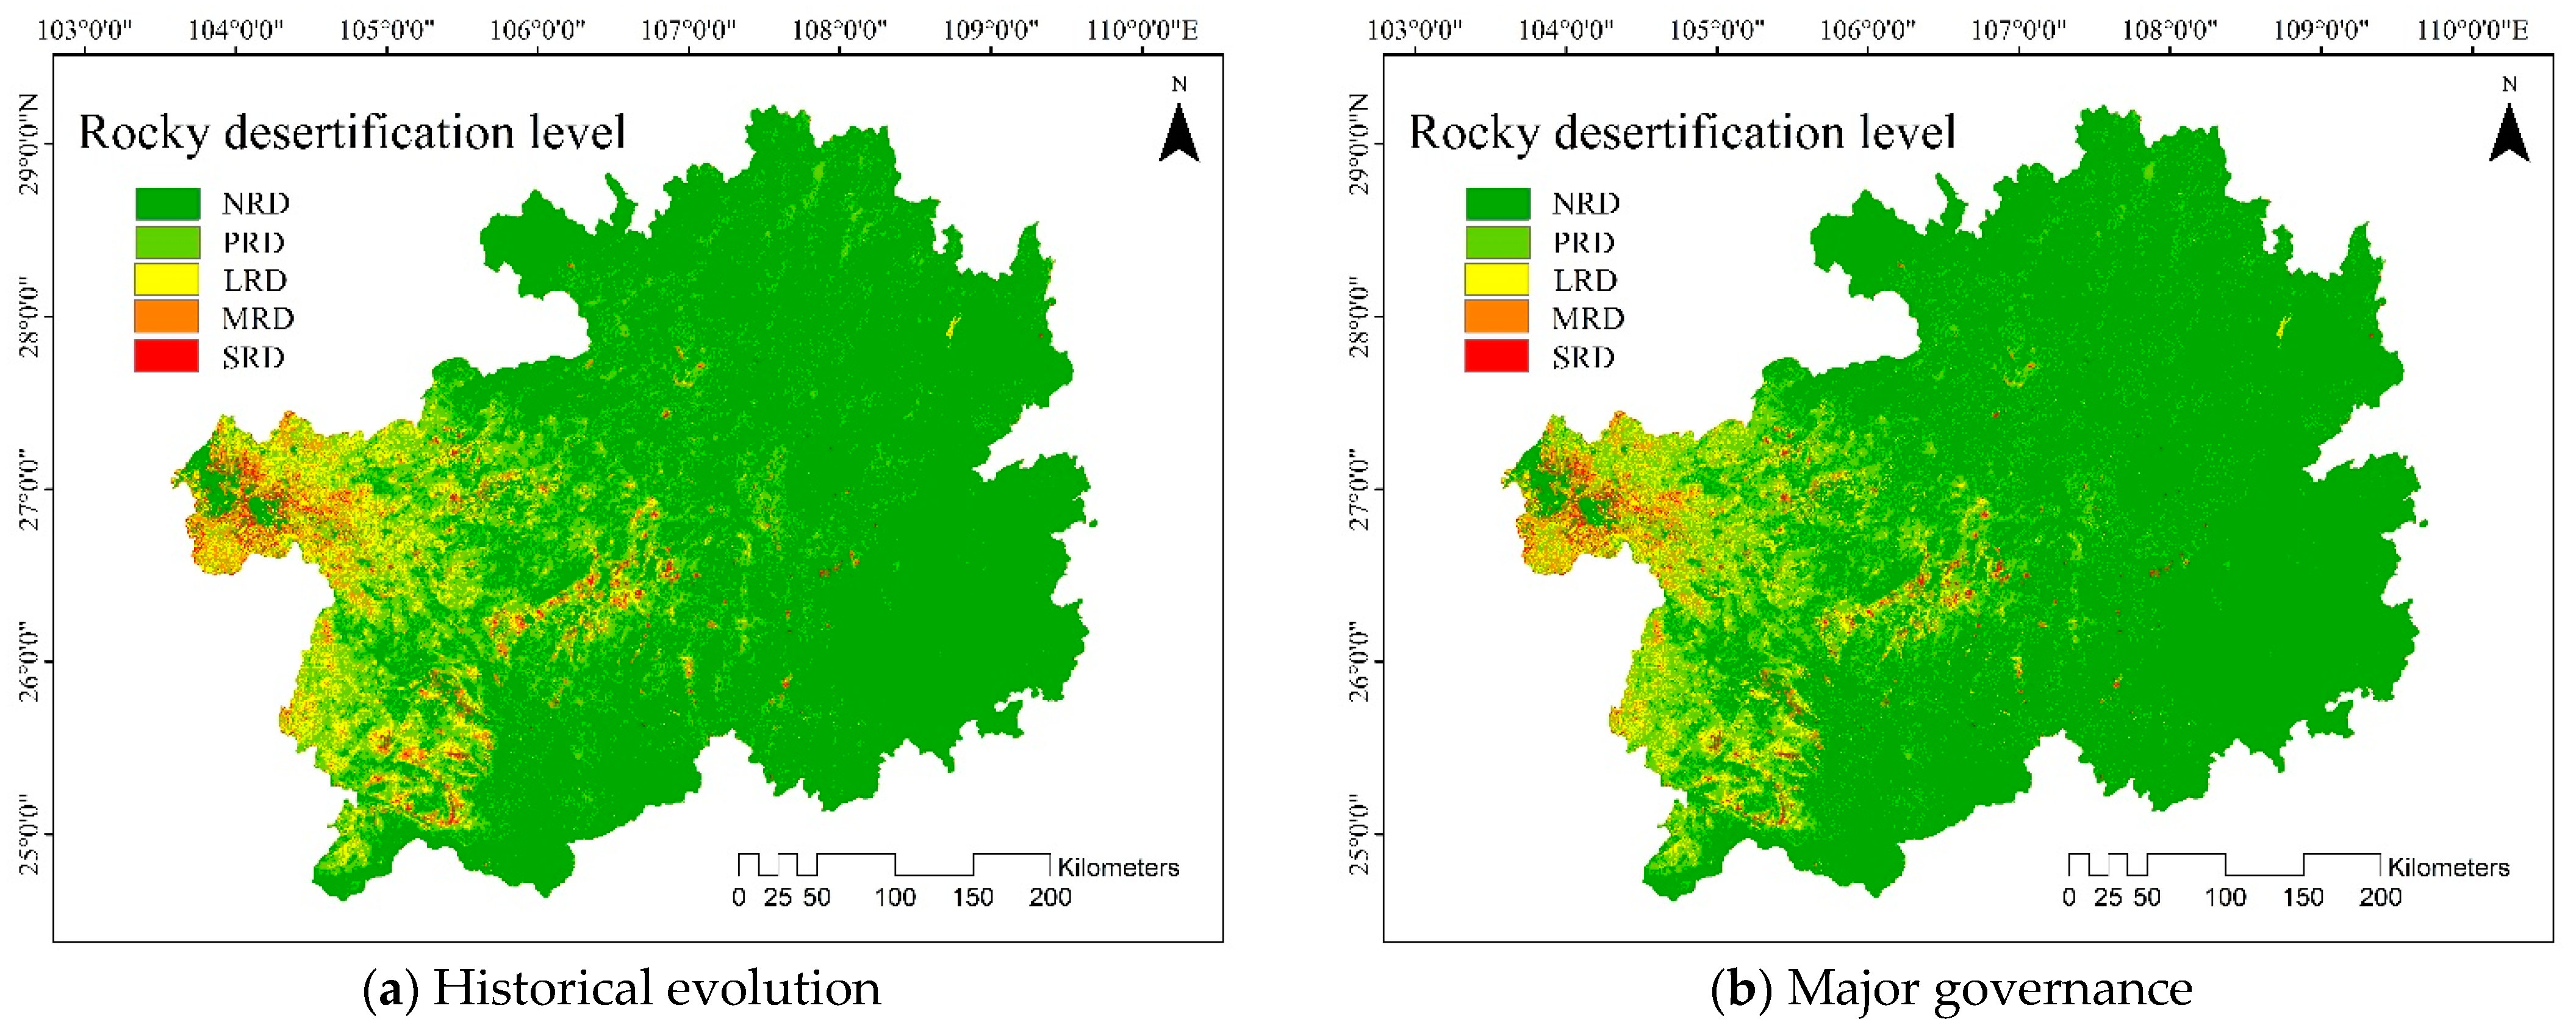
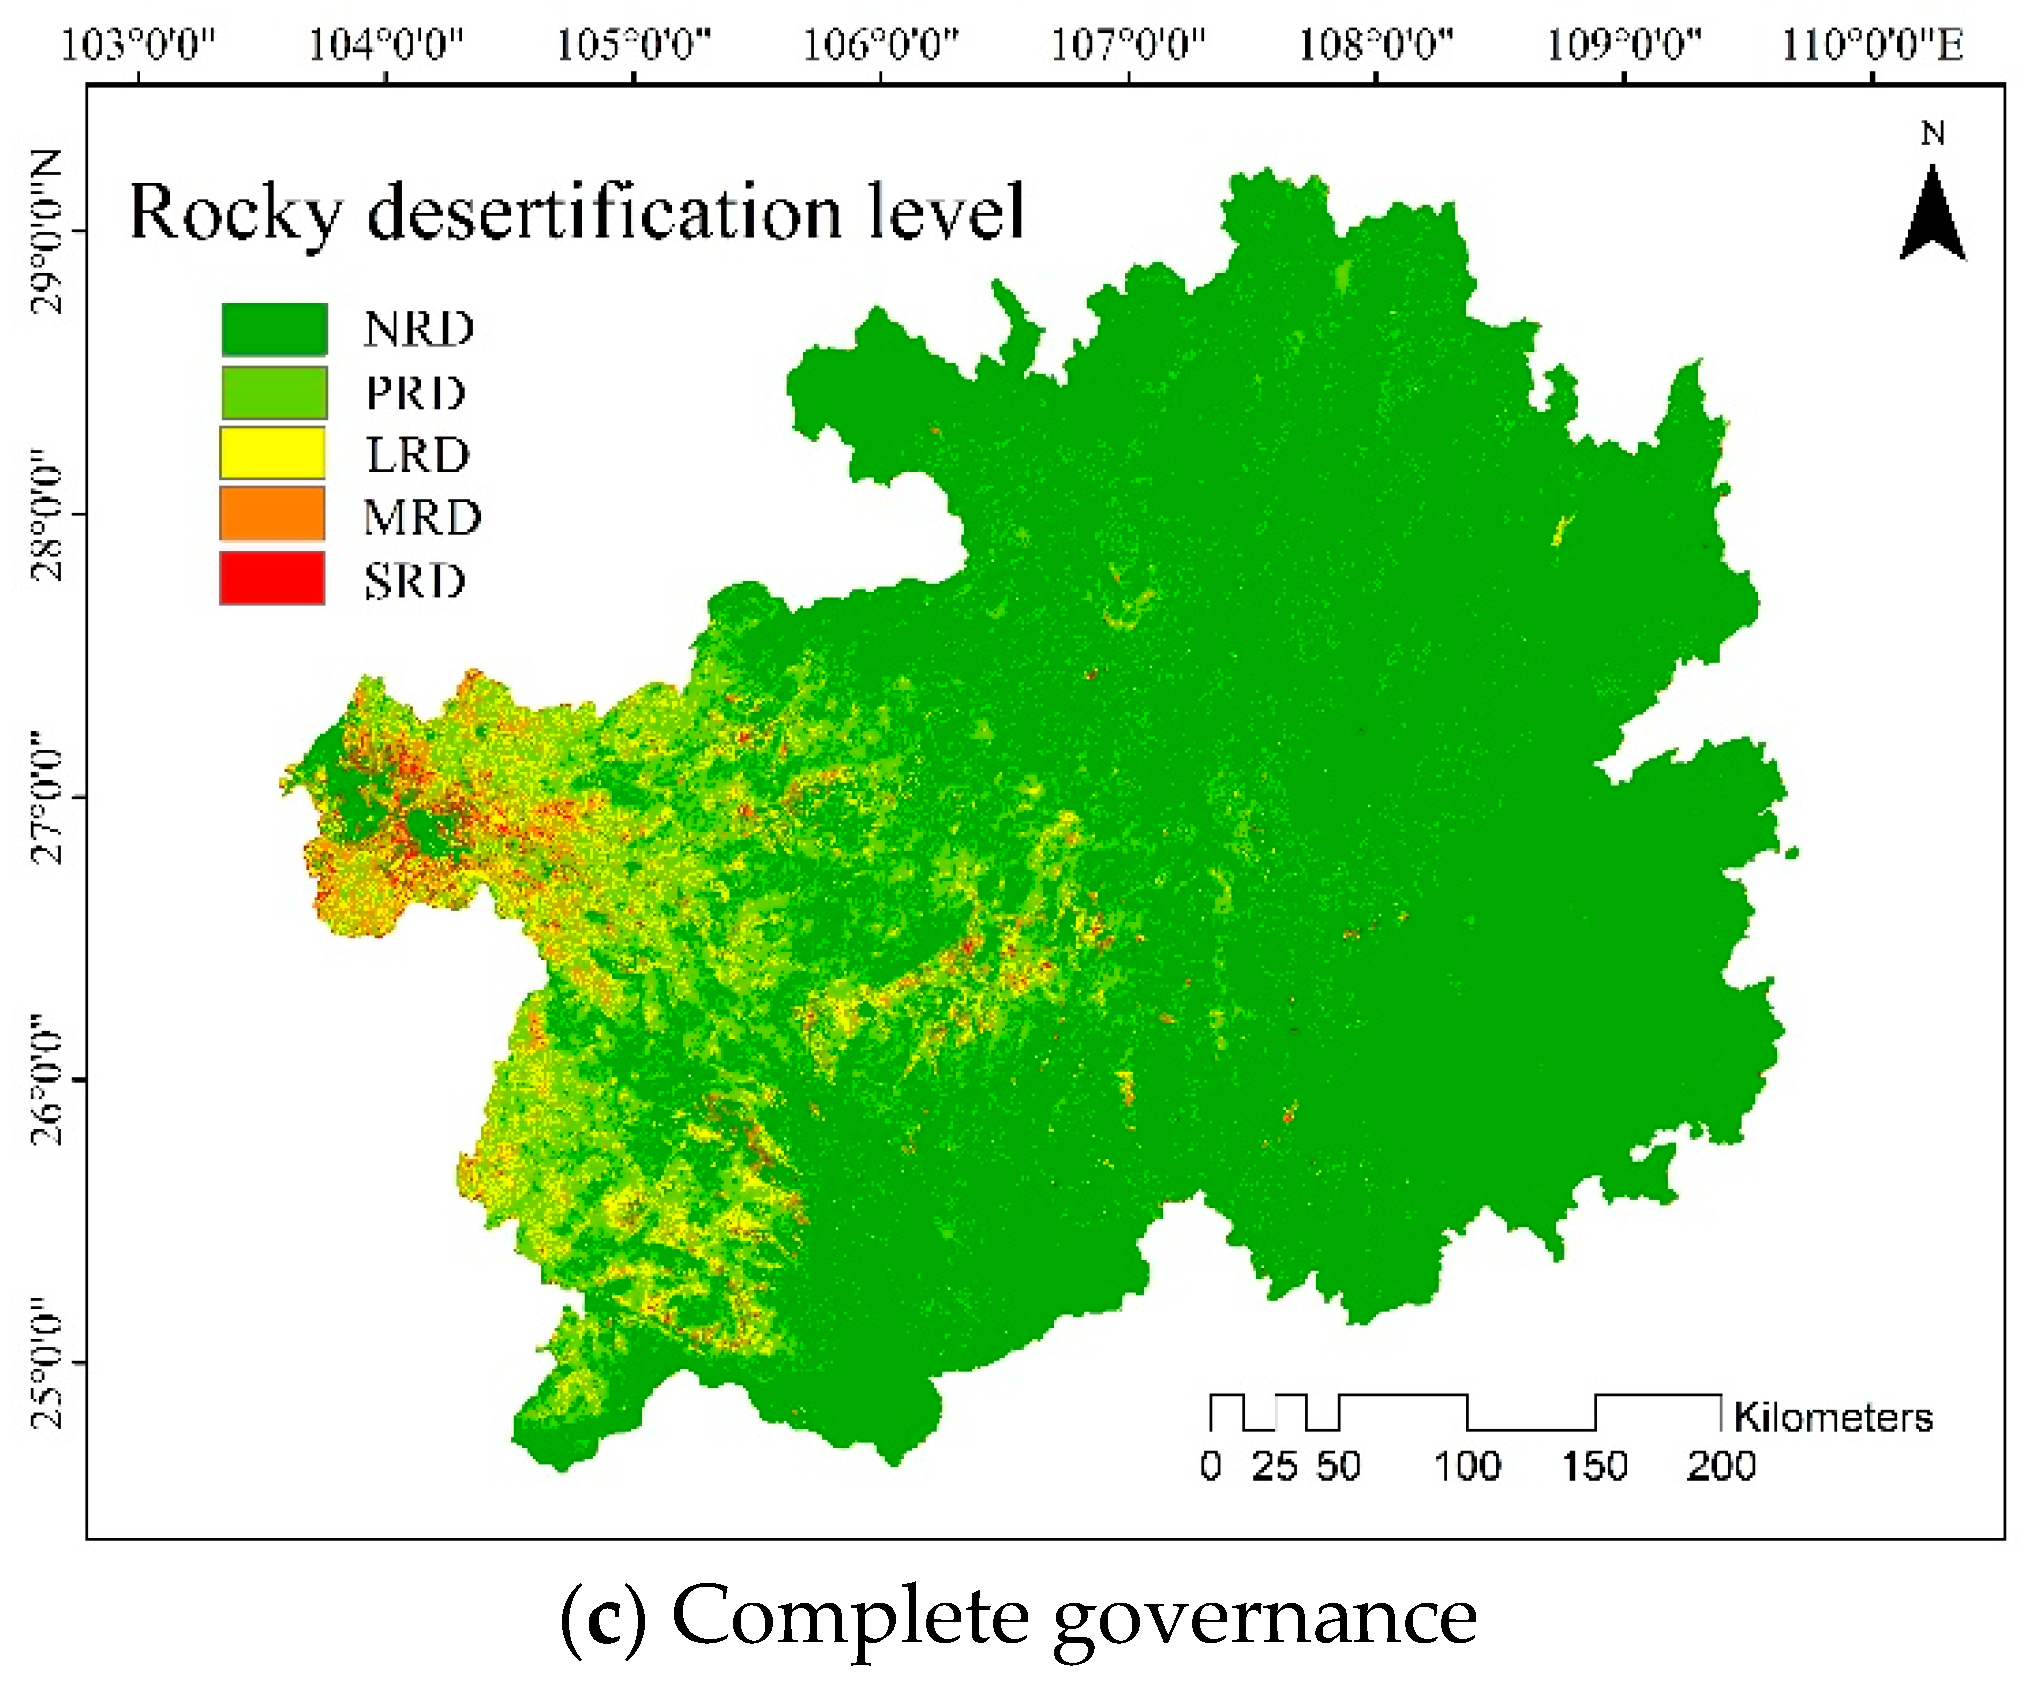
4.2.3. Future Scenario Prediction of Rocky Desertification under Different Governance Scenarios
5. Discussion
5.1. Improvement of Future Prediction Accuracy by Modifying Markov Transition Matrix
5.2. Temporal and Spatial Evolution of Rocky Desertification and Its Influence
5.3. Discussion on Suitability Governance of Future Scenarios of Rocky Desertification
6. Conclusions
Author Contributions
Funding
Institutional Review Board Statement
Informed Consent Statement
Data Availability Statement
Conflicts of Interest
Appendix A

| Level | NRD | PRD | LRD | MRD | SRD | |
|---|---|---|---|---|---|---|
| Before optimization | NRD | 0.9163 | 0.0551 | 0.0083 | 0.0148 | 0.0055 |
| PRD | 0.3265 | 0.5964 | 0.0752 | 0.0019 | 0.0000 | |
| LRD | 0.0000 | 0.5355 | 0.3785 | 0.0720 | 0.0140 | |
| MRD | 0.0000 | 0.1284 | 0.4815 | 0.3293 | 0.0608 | |
| SRD | 0.0000 | 0.0000 | 0.1447 | 0.4482 | 0.4072 | |
| After optimization | NRD | 0.9273 | 0.0479 | 0.0072 | 0.0129 | 0.0048 |
| PRD | 0.4052 | 0.5363 | 0.0571 | 0.0014 | 0.0000 | |
| LRD | 0.0000 | 0.5548 | 0.3623 | 0.0694 | 0.0135 | |
| MRD | 0.0000 | 0.1370 | 0.5138 | 0.2925 | 0.0567 | |
| SRD | 0.0000 | 0.0000 | 0.1589 | 0.4921 | 0.3490 | |
References
- Reynolds, J.F.; Stafford Smith, D.M.; Lambin, E.F.; Turner, B.L.; Mortimore, M.; Batterbury, S.P.J.; Downing, T.E.; Dowlatabadi, H.; Fernandez, R.J.; Herrick, J.E.; et al. Global desertification: Building a science for dryland development. Science 2007, 316, 847–851. [Google Scholar] [CrossRef] [PubMed] [Green Version]
- Zhang, M.; Wang, K.; Liu, H.; Zhang, C.; Wang, J.; Yue, Y.; Qi, X. How ecological restoration alters ecosystem services: An analysis of vegetation carbon sequestration in the karst area of northwest Guangxi, China. Environ. Earth Sci. 2015, 74, 5307–5317. [Google Scholar] [CrossRef]
- Zhang, J.Y.; Dai, M.H.; Wang, L.C.; Zeng, C.F.; Su, W.C. The challenge and future of rocky desertification control in karst areas in southwest China. Solid Earth 2016, 7, 83–91. [Google Scholar] [CrossRef] [Green Version]
- Zhao, Y.; Han, R.; Cui, N.; Yang, J.; Guo, L. The Impact of Urbanization on Ecosystem Health in Typical Karst Areas: A Case Study of Liupanshui City, China. Int. J. Environ. Res. Public Health 2021, 18, 93. [Google Scholar] [CrossRef]
- Wang, S.J.; Li, R.L.; Sun, C.X.; Zhang, D.F.; Li, F.Q.; Zhou, D.Q.; Xiong, K.N.; Zhou, Z.F. How types of carbonate rock assemblages constrain the distribution of karst rocky desertified land in Guizhou Province, PR China: Phenomena and mechanisms. Land Degrad. Dev. 2004, 15, 123–131. [Google Scholar] [CrossRef]
- Yuan, D.X. Innovation in the field of karst resources and environment in China. Carsologica Sin. 2015, 34, 98–100. [Google Scholar]
- Xiong, K.N.; Liu, L.; Luo, Y. The Evaluation Studies Progress and Prospects of Sustainable Development in Rocky Desertification Reegion. Ecol. Econ. 2012, 1, 44–49. [Google Scholar]
- Ying, B.; Xiao, S.Z.; Xiong, K.N.; Cheng, Q.W.; Luo, J.S. Comparative studies of the distribution characteristics of rocky desertification and land use/land cover classes in typical areas of Guizhou province, China. Environ. Earth Sci. 2014, 71, 631–645. [Google Scholar] [CrossRef]
- Tang, J.; Tang, X.; Qin, Y.; He, Q.; Yi, Y.; Ji, Z. Karst rocky desertification progress: Soil calcium as a possible driving force. Sci. Total Environ. 2019, 649, 1250–1259. [Google Scholar] [CrossRef]
- Rang, C.; Bai, X.; Tan, Q.; Luo, X.L.; Chen, H.; Xi, H.P. Response of the landscape pattern of rocky desertification to land use change in Typical Karst Area. Acta Ecol. Sin. 2018, 38, 8901–8910. [Google Scholar]
- Xiao, J.Y.; Wang, S.J.; Bai, X.Y.; Zhou, D.Q.; Tian, Y.C.; Li, Q.; Qian, Q.Q.; Chen, F.; Zeng, C. Temporal and spatial changes of vegetation in key karst zones and its driving factors. Acta Ecol. Sin. 2018, 38, 8799–8812. [Google Scholar]
- Zhang, S.; Zhang, Y.; Xiong, K.; Yu, Y.; Min, X. Changes of leaf functional traits in karst rocky desertification ecological environment and the driving factors. Glob. Ecol. Conserv. 2020, 24, e01381. [Google Scholar] [CrossRef]
- Luo, X.L.; W, S.J.; Bai, X.Y.; Tan, Q.; Rang, C.; Chen, H.; Xi, H.P.; Chen, F.; Cao, Y.; Wu, L.H. Spatiotemporal evolution of rocky desertification in karst area of Southwest China. Acta Ecol. Sin. 2021, 41, 680–693. [Google Scholar]
- Zhang, C.; Qi, X.; Wang, K.; Zhang, M.; Yue, Y. The application of geospatial techniques in monitoring karst vegetation recovery in southwest China: A review. Prog. Phys. Geogr.-Earth Environ. 2017, 41, 450–477. [Google Scholar] [CrossRef]
- Wu, X.; Liu, H.; Zhou, T. Human driving forces: Analysis of rocky desertification in karst region in Guanling County, Guizhou Province. Chin. Geogr. Sci. 2011, 21, 92–100. [Google Scholar] [CrossRef]
- Chen, F.; Wang, S.; Bai, X.; Liu, F.; Zhou, D.; Tian, Y.; Luo, G.; Li, Q.; Wu, L. Assessing spatial-temporal evolution processes and driving forces of karst rocky desertification. Geocarto Int. 2021, 36, 262–280. [Google Scholar] [CrossRef]
- Xiong, Y.J.; Qiu, G.Y.; Mo, D.K.; Lin, H.; Sun, H.; Wang, Q.X.; Zhao, S.H.; Yin, J. Rocky desertification and its causes in karst areas: A case study in Yongshun County, Hunan Province, China. Environ. Geol. 2009, 57, 1481–1488. [Google Scholar] [CrossRef]
- Huang, Q.; Cai, Y.; Xing, X. Rocky desertification, antidesertification, and sustainable development in the karst mountain region of Southwest China. Ambio 2008, 37, 390–392. [Google Scholar] [CrossRef] [PubMed]
- Yin, C.; Zhou, Z.F.; Tan, W.Y.; Wang, P.; Feng, Q. Inversion model of soil profile moisture content in rocky desertification area based on microwave and optical remote sensing. J. Infrared Millim. Waves 2018, 37, 360–370. [Google Scholar] [CrossRef]
- Zhang, M.; Wang, K.; Zhang, C.; Chen, H.; Liu, H.; Yue, Y.; Luffman, I.; Qi, X. Using the radial basis function network model to assess rocky desertification in northwest Guangxi, China. Environ. Earth Sci. 2011, 62, 69–76. [Google Scholar] [CrossRef]
- Hu, Y.; Han, Y.; Zhang, Y. Information Extraction and Spatial Distribution of Research Hot Regions on Rocky Desertification in China. Appl. Sci. 2018, 8, 2075. [Google Scholar] [CrossRef] [Green Version]
- Verburg, P.H.; Overmars, K.P. Dynamic simulation of land-use change trajectories with the clue-s model. In Modelling Land-Use Change: Progress and Applications; Koomen, E., Stillwell, J., Bakema, A., Scholten, H.J., Eds.; Springer: Dordrecht, The Netherlands, 2007. [Google Scholar]
- Rodrigues, H.; Soares-Filho, B. A short presentation of dynamic ego. In Geomatic Approaches for Modeling Land Change Scenarios; Camacho Olmedo, M.T., Paegelow, M., Mas, J.F., Escobar, F., Eds.; Springer International Publishing: Cham, Switzerland, 2018. [Google Scholar]
- Sleeter, B.M.; Wood, N.J.; Soulard, C.E.; Wilson, T.S. Projecting community changes in hazard exposure to support long-term risk reduction: A case study of tsunami hazards in the U.S. Pacific northwest. Int. J. Disaster Risk Reduct. 2017, 22, 10–22. [Google Scholar] [CrossRef] [Green Version]
- Clarke, K.C. Land use change modeling with sleuth: Improving calibration with a genetic algorithm. In Geomatic Approaches for Modeling Land Change Scenarios; Camacho Olmedo, M.T., Paegelow, M., Mas, J.-F., Escobar, F., Eds.; Springer International Publishing: Cham, Switzerland, 2018. [Google Scholar]
- Theobald, D. Landscape patterns of exurban growth in the USA from 1980 to 2020. Ecol. Soc. 2005, 10, art32. [Google Scholar] [CrossRef] [Green Version]
- Bhagawat, R.; Hamidreza, K.; Nigel, S.; Sushila, R. Forest Cover and Sustainable Development in the Lumbini Province, Nepal: Past, Present and Future. Remote Sens. 2021, 13, 4093. [Google Scholar] [CrossRef]
- Kim, J.W.; Lu, Z.; Kaufmann, J. Evolution of sinkholes over Wink, Texas, observed by high-resolution optical, and SAR imagery. Remote Sens. Environ. 2019, 222, 119–132. [Google Scholar] [CrossRef]
- Qi, X.K.; Zhang, C.H.; Wang, K.L. Comparing remote sensing methods for monitoring karst rocky desertification at sub-pixel scales in a highly heterogeneous karst region. Sci. Rep. 2019, 9, 13368. [Google Scholar] [CrossRef] [PubMed] [Green Version]
- Ajaj, Q.M.; Pradhan, B.; Noori, A.M.; Jebur, M.N. Spatial Monitoring of Desertification Extent in Western Iraq using Landsat Images and GIS. Land Degrad. Dev. 2017, 28, 2418–2431. [Google Scholar] [CrossRef]
- Yang, Q.; Jiang, Z.; Yuan, D.; Ma, Z.; Xie, Y. Temporal and spatial changes of karst rocky desertification in ecological reconstruction region of Southwest China. Environ. Earth Sci. 2014, 72, 4483–4489. [Google Scholar] [CrossRef]
- Xiong, K.N.; Chen, Q.W. Discussion on the evolution law and trend of rocky desertification based on ecological comprehensive management. Carsologica Sin. 2010, 29, 27–273. [Google Scholar]
- Bai, X.Y.; Wang, S.J.; Chen, Q.W. Temporal and spatial evolution process and evaluation of land rocky desertification types in Guizhou. Acta Geogr. Sin. 2009, 64, 609–618. [Google Scholar]
- Zhuo, T.A.; Diao, C.T.; Su, W.C.; Sun, X.F.; Yan, D.J. Temporal and spatial evolution process and evolution characteristics of rocky desertification in Bijie Experimental Area. Acta Ecol. Sin. 2014, 34, 7067–7077. [Google Scholar]
- Liu, H.L. Oriented Remote Sensing Monitoring and Process Simulation of Rocky Desertification. Master’s Thesis, Kunming University of Science and Technology, Kuming, China, 2015. [Google Scholar]
- Zhao, L.P. Spatiotemporal Evolution Characteristics of Rocky Desertification in Karst Area Based on MODIS Data. Master’s Thesis, China University of Geosciences, Beijing, China, 2015. [Google Scholar]
- Ma, S.B.; Zhang, Y.R.; An, Y.L. Study on spatial variation law of rocky desertification based on logistic CA Markov model. Carsologica Sin. 2015, 34, 591–598. [Google Scholar]
- Zhang, Y.R.; Zhou, Z.F.; MA, S.B. Analysis and prediction of urban land use landscape pattern based on Markov model. J. Cent. China Norm. Univ. Nat. Sci. 2012, 46, 363–367. [Google Scholar]
- An, H.F.; An, Y.L.; Yuan, S.C. Dynamic evolution and simulation prediction of rocky desertification sensitivity in Guizhou Province. Chin. Agric. Sci. Bull. 2010, 26, 388–395. [Google Scholar] [CrossRef]
- Cao, Y.; Wang, S.J.; Bai, X.Y.; Li, H.W.; Chen, F.; Wang, M.M.; Wu, L.H.; Xu, Y.; Li, Q. Temporal and spatial evolution and future scenario simulation of soil erosion in Karst Valley Area. Acta Ecol. Sin. 2019, 39, 6061–6071. [Google Scholar]
- Chen, X.X.; Zhang, Y.F. Analysis and prediction of temporal and spatial evolution of county land use based on Ca Markov model. J. Anhui Agric. Sci. 2020, 48, 65–69. [Google Scholar]
- Li, S.; Wu, H. Mapping karst rocky desertification using Landsat 8 images. Remote Sens. Lett. 2015, 6, 657–666. [Google Scholar] [CrossRef]
- Ma, S.B.; Zhang, Y.R.; Yang, Q.; Lin, C.S. Analysis on the change of rocky desertification landscape pattern in karst area of Guizhou Province from 1990 to 2010—Taking Liuzhi special area of Guizhou Province as an example. J. Chongqing Norm. Univ. Nat. Sci. Ed. 2014, 31, 114–118. [Google Scholar]
- Yuan, Y.L.; Lian, B.; An, Y.L.; Tang, Y.; Wang, S.J.; Yi, Z.Y. Ecological environment protection and sustainable development in Karst Area. Earth Environ. 2013, 41, 388–397. [Google Scholar]
- Ma, S.B.; Yang, G.B.; An, Y.L.; Zhang, Y.R. Vegetation degradation and attribution in Guizhou Province Based on MODIS NDVI. Carsologica Sin. 2019, 38, 227–232. [Google Scholar]
- Liu, L.C.; Xiong, K.N.; Luo, Y. Advances in Evaluation of Sustainable Development Capability in Karst Region. Guizhou Agric. Sci. 2012, 40, 67–72. [Google Scholar]
- Tian, X.L.; Xia, J.; Xia, H.B. Forest biomass and its spatial pattern in Guizhou Province. Chin. J. Appl. Ecol. 2011, 22, 287–294. [Google Scholar]
- Guide to Google Earth Engine. 2021. Available online: https://code.earthengine.google.com (accessed on 13 May 2021).
- MODIS Collections in Earth Engine. 2021. Available online: https://developers.google.com/earth-engine/datasets/catalog/modis (accessed on 13 May 2021).
- Forest Resources Management Department. Technical Regulations of National Forest Resources Continuous Inventory National; Forestry Administration: Beijing, China, 2014.
- Qian, C.H.; Qiang, H.Q.; Wang, F.; Li, M.Y. Optimization of Rocky Desertification Classification Model Based on Vegetation Type and Seasonal Characteristic. Remote Sens. 2021, 13, 2935. [Google Scholar] [CrossRef]
- Björn, W.; Jón, A.B. Fusion of Support Vector Machines for Classification of Multisensor Data. IEEE Trans. Geosci. Remote Sens. 2007, 45, 3858. [Google Scholar] [CrossRef]
- Xi, H.P.; Wang, S.J.; Bai, X.Y.; Wu, L.H.; Tang, H.; Chen, F.; Xiao, J.Y.; Wang, M.M.; Cao, Y.; Chen, H. Temporal and spatial evolution characteristics of rocky desertification in typical karst areas in Southwest China—A case study of Puding County, Guizhou Province. Acta Ecol. Sin. 2018, 38, 8919–8933. [Google Scholar]
- Shi, Y.C.; Shu, Y.G. Temporal and spatial variation characteristics and driving factors of Karst Rocky Desertification—A case study of Qinglong County, Guizhou Province. For. Resour. Manag. 2017, 1, 135–143. [Google Scholar]
- Wen, L.Q.; Li, Z.F. Status and dynamic evolution characteristics of rocky desertification in Guizhou Province from 2004 to 2016. Acta Ecol. Sin. 2020, 40, 5928–5939. [Google Scholar]
- Aburas, M.M.; Ho, Y.M.; Pradhan, B.; Salleh, A.H.; Alazaiza, M.Y. Spatio-temporal simulation of future urban growth trends using an integrated CA-Markov model. Arab. J. Geosci. 2021, 14, 131–143. [Google Scholar] [CrossRef]
- Guan, D.J.; Zhao, Z.L.; Tan, J. Dynamic simulation of land use change based on logistic-CA-Markov and WLC-CA-Markov models: A case study in three gorges reservoir area of Chongqing, China. Environ. Sci. Pollut. Res. 2019, 26, 20669–20688. [Google Scholar] [CrossRef]
- Huang, Y.C.; Yang, B.G.; Wang, M.; Liu, B.W.; Yang, X.D. Analysis of the future land cover change in Beijing using CA-Markov chain model. Environ. Earth Sci. 2020, 79, 60. [Google Scholar] [CrossRef]
- Saaty, R. The analytic hierarchy process—What it is and how it is used. Math. Model. 1987, 9, 161–176. [Google Scholar] [CrossRef] [Green Version]
- Zhang, Q.; Zhang, S.X.; Zhang, Y.; Li, M.K.; Wei, Y.; Chen, M.; Zhang, Z.Y.; Dai, Z.Q. GIS-Based Groundwater Potential Assessment in Varied Topographic Areas of Mianyang City, Southwestern China, Using AHP. Remote Sens. 2021, 13, 4684. [Google Scholar] [CrossRef]
- Mu, E.; Pereyra-Rojas, M. Understanding the analytic hierarchy process. In Practical Decision Making Using Super Decisions; Mu, E., Ed.; Springer: Cham, Switzerland, 2017; pp. 7–22. [Google Scholar]
- Orsolya, G.V.; Robert, G.P.; Sudhir, K.S.; Sudhird, S. Intensity Analysis and the Figure of Merit’s components for assessment of a Cellular Automata—Markov simulation model. Ecol. Indic. 2019, 101, 933–942. [Google Scholar]
- Pontius, R.G., Jr.; Peethambaram, S.; Castella, J. Comparison of three maps at multiple resolutions: A case study of land change simulation in Cho Don District, Vietnam. Ann. Assoc. Am. Geogr. 2011, 101, 45–62. [Google Scholar] [CrossRef]
- Xu, E.Q. Description of Karst Rocky Desertification Evolution Process and Information Mining Technology; Science Press: Beijing, China, 2020; pp. 120–135. [Google Scholar]
- Wang, P.B.; An, Y.L. Spatial and temporal characteristics of rocky desertification in Guizhou karst area from 2000 to 2010. J. Guizhou Norm. Univ. Nat. Sci. Ed. 2014, 32, 10–21. [Google Scholar]
- Chen, Q.W.; Xiong, K.N.; Lan, A.J. Remote sensing monitoring of Karst Rocky Desertification in Guizhou Province Based on 3S. J. Arid. Land Resour. Environ. J. Arid. Land Resour. Env. 2014, 28, 62–67. [Google Scholar]
- Zhong, H.Z.; Xu, X.L.; Zhang, R.F.; Liu, M.X. MODIS-driven estimation of regional evapotranspiration in Karst area of Southwest China based on the Penman-Monteith-Leuning algorithm. Chin. J. Appl. Ecol. 2018, 29, 1617–1625. [Google Scholar]


| Scale | Degree of Preference | Description |
|---|---|---|
| 1 | Equally | When two parameters contribute equally |
| 2 | Intermediate | Preference between 1 and 3 |
| 3 | Moderately | The judgment slightly to moderately favors one parameter |
| 4 | Intermediate | Preference between 3 and 5 |
| 5 | Strongly | The judgment strongly or essentially favors one parameter |
| 6 | Intermediate | Preference between 5 and 7 |
| 7 | Very strongly | Very strong preference or importance |
| 8 | Intermediate | Preference between 7 and 9 |
| 9 | Extremely | Quite preferred or quite important |
| Level | 2001–2005 | 2005–2010 | 2010–2015 | 2015–2020 | ||||
|---|---|---|---|---|---|---|---|---|
| Evolution Area (103 km2) | Annual Average Dynamic Degree (%) | Evolution Area (103 km2) | Annual Average Dynamic Degree (%) | Evolution Area (103 km2) | Annual Average Dynamic Degree (%) | Evolution Area (103 km2) | Annual Average Dynamic Degree (%) | |
| NRD | 5.346 | 1.553 | 3.011 | 0.659 | 6.202 | 1.314 | 11.287 | 2.243 |
| PRD | −2.973 | −1.602 | 2.395 | 1.103 | −0.518 | −0.226 | −4.976 | −2.198 |
| LRD | −2.182 | −2.202 | −1.447 | −1.281 | −2.707 | −2.561 | −3.473 | −3.768 |
| MRD | −0.253 | −0.466 | −2.742 | −4.120 | −1.852 | −3.504 | −2.009 | −4.609 |
| SRD | 0.062 | 0.288 | −1.217 | −4.471 | −1.124 | −5.318 | −0.828 | −5.337 |
| Year | 2001–2005 | 2005–2010 | 2010–2015 | 2015–2020 | 2001–2020 |
|---|---|---|---|---|---|
| Net profit speed (103 km2/a) | 1.704 | 2.808 | 3.225 | 4.937 | 2.515 |
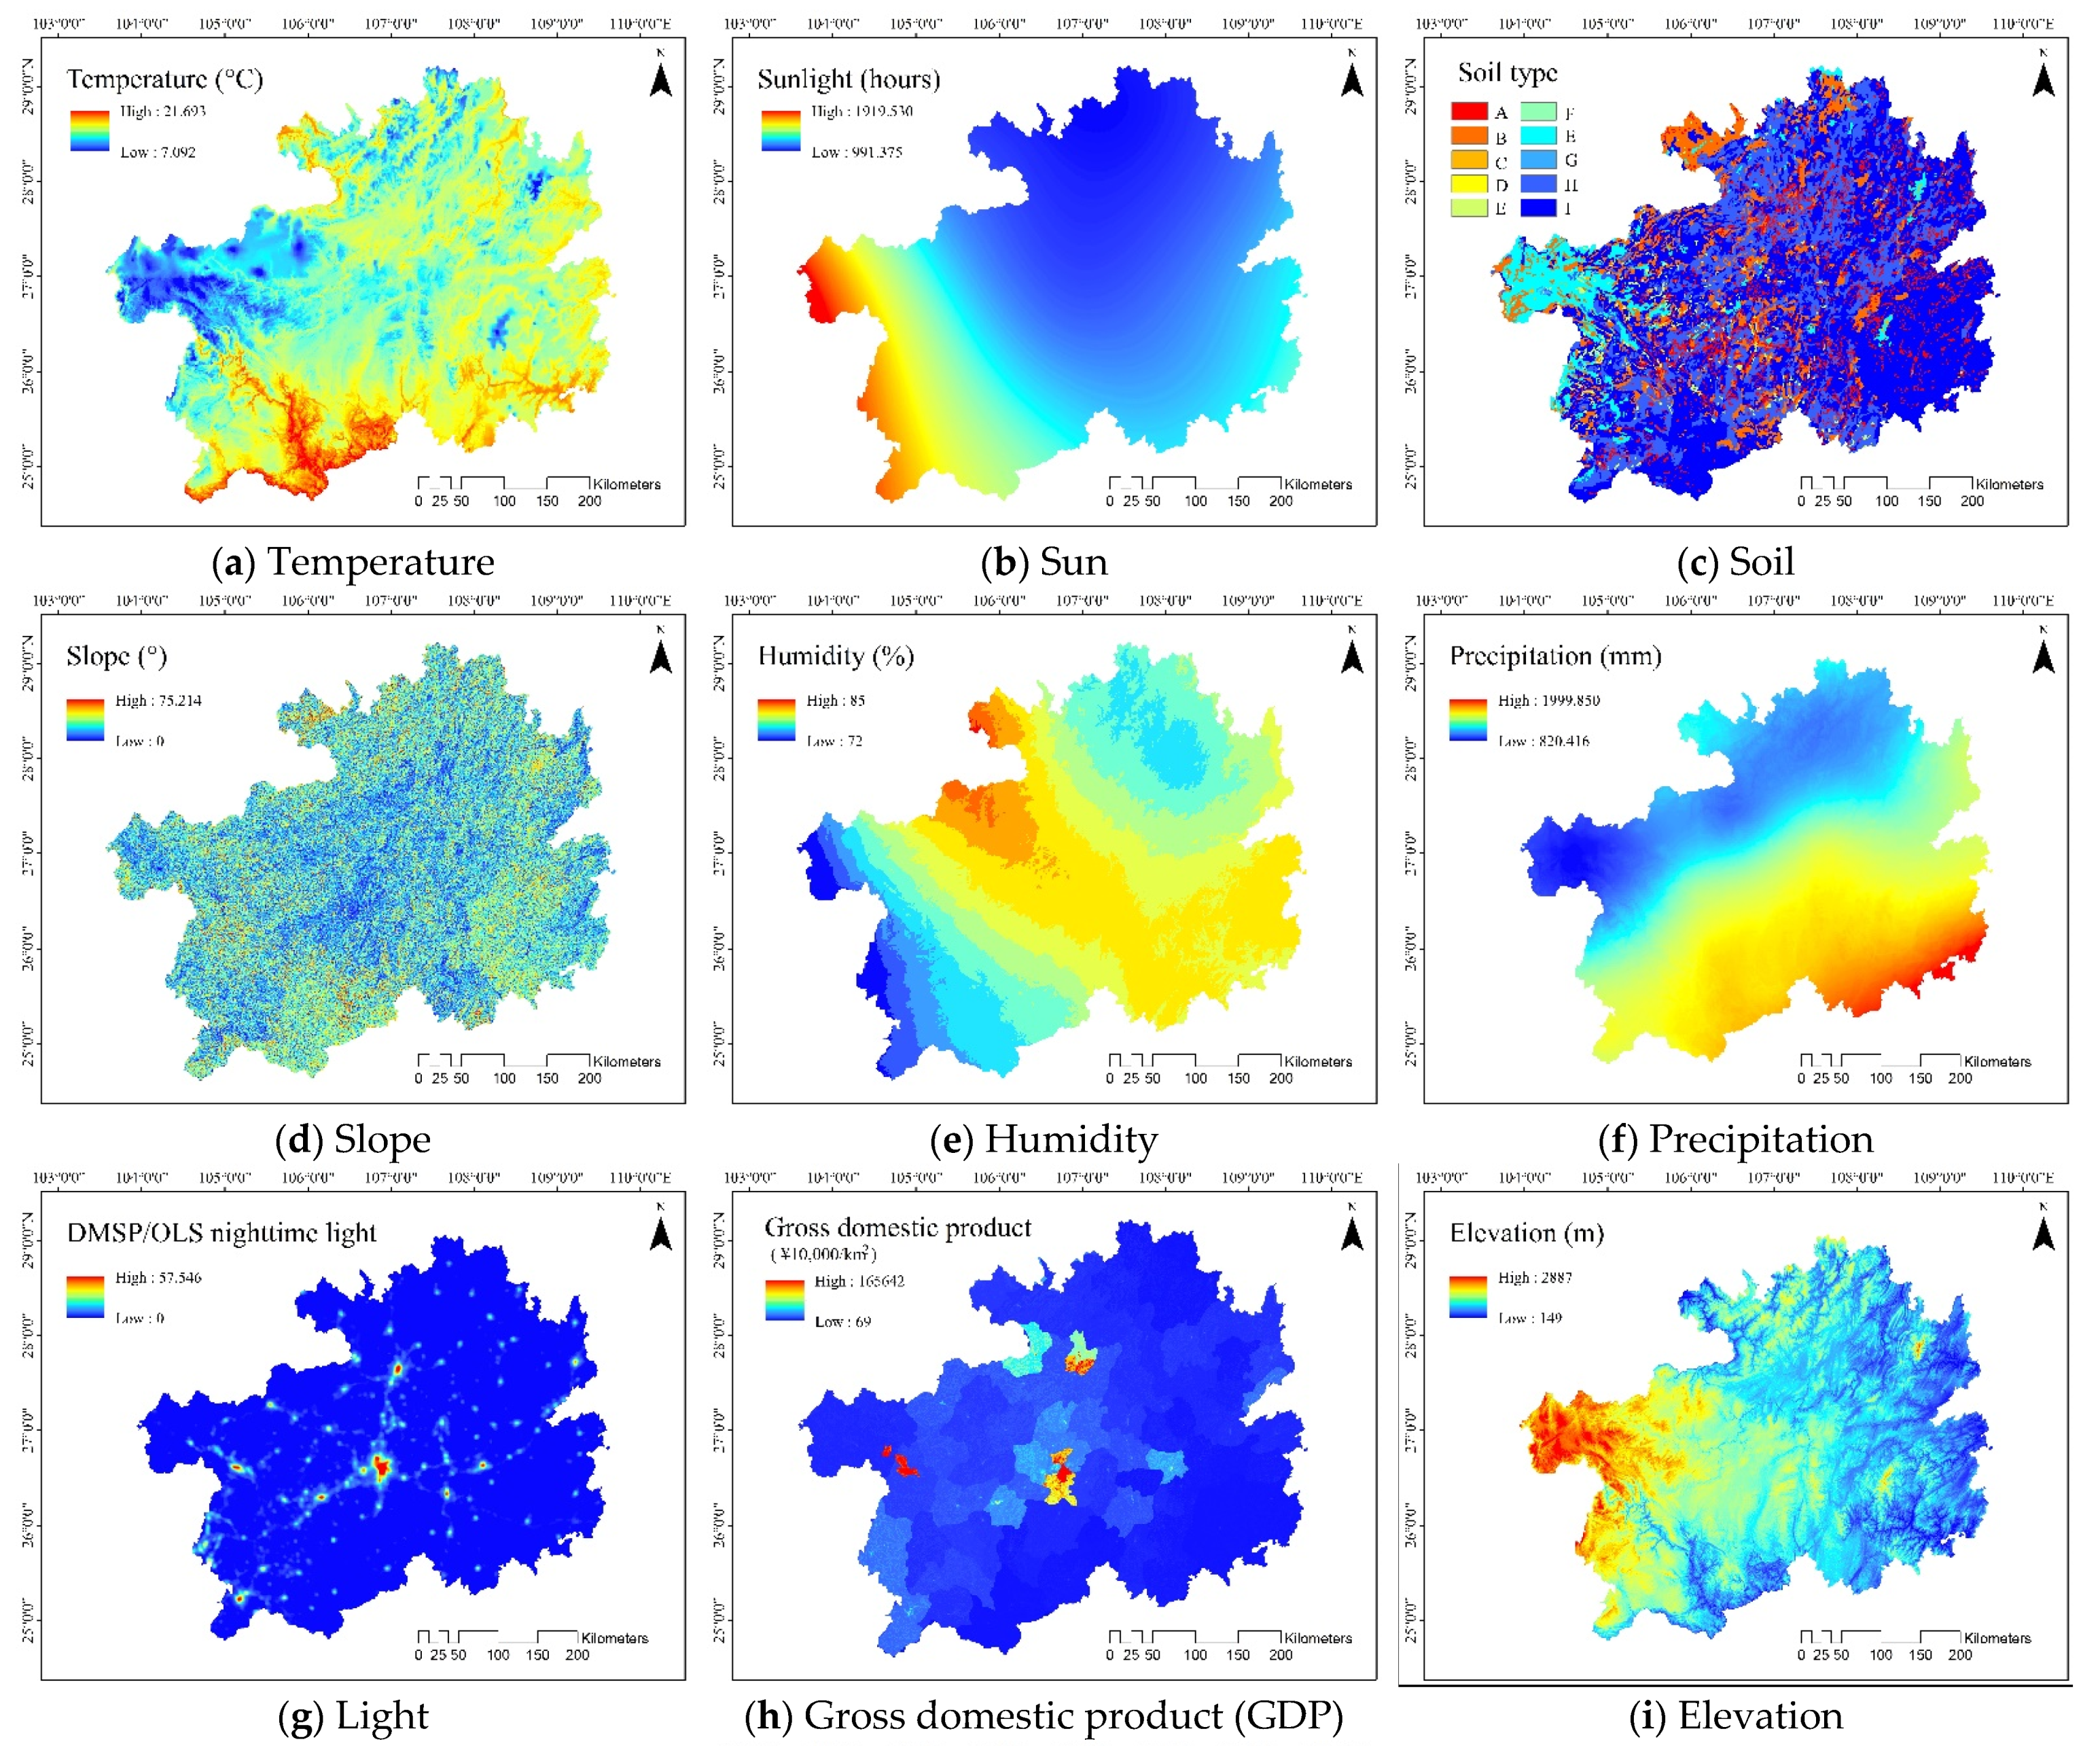
| Factor | Precipitation | Temperature | Sun | Lithology | Soil | Slope | Humidity | Light | GDP | Elevation |
|---|---|---|---|---|---|---|---|---|---|---|
| Weight | 0.0717 | 0.0466 | 0.0686 | 0.2467 | 0.1985 | 0.0328 | 0.0753 | 0.0170 | 0.0170 | 0.2257 |
| NRD | PRD | LRD | MRD | SRD | |
|---|---|---|---|---|---|
| ROC | 0.9209 | 0.8169 | 0.8481 | 0.8637 | 0.8361 |
| NRD | PRD | LRD | MRD | SRD | |
|---|---|---|---|---|---|
| (%) | |||||
| Remote sensing inversion | 63.527 | 22.881 | 8.492 | 3.809 | 1.291 |
| Prediction result before optimization | 61.869 | 23.969 | 8.804 | 3.950 | 1.408 |
| Prediction result after optimization | 63.520 | 22.906 | 8.498 | 3.765 | 1.312 |
| Prediction (%) | Inversion Reality (%) | ||||||
|---|---|---|---|---|---|---|---|
| Level | NRD | PRD | LRD | MRD | SRD | Total | |
| Traditional CA-Markov Model | NRD | 56.993 | 4.186 | 0.328 | 0.211 | 0.150 | 61.869 |
| PRD | 5.237 | 16.295 | 2.127 | 0.287 | 0.024 | 23.969 | |
| LRD | 0.532 | 2.096 | 5.042 | 0.921 | 0.214 | 8.804 | |
| MRD | 0.552 | 0.263 | 0.849 | 2.031 | 0.255 | 3.950 | |
| SRD | 0.214 | 0.041 | 0.145 | 0.360 | 0.649 | 1.408 | |
| Total | 63.527 | 22.881 | 8.492 | 3.809 | 1.291 | 100 | |
| Improved CA-Markov Model | NRD | 58.536 | 4.291 | 0.413 | 0.167 | 0.113 | 63.520 |
| PRD | 4.045 | 16.682 | 1.718 | 0.420 | 0.040 | 22.906 | |
| LRD | 0.456 | 1.623 | 5.618 | 0.623 | 0.178 | 8.498 | |
| MRD | 0.352 | 0.254 | 0.616 | 2.345 | 0.197 | 3.765 | |
| SRD | 0.138 | 0.031 | 0.127 | 0.253 | 0.763 | 1.312 | |
| Total | 63.527 | 22.881 | 8.492 | 3.809 | 1.291 | 100 | |
| Lee–Sallee Index | Overall Accuracy | Kstandard | |
|---|---|---|---|
| Improved CA-Markov Model | 0.723 | 0.839 | 0.700 |
| Tradtional CA-Markov Model | 0.681 | 0.810 | 0.650 |
| Ma et al. [37] | 0.629 | - |
| Year 2030 | NRD | PRD | LRD | MRD | SRD | |||||
|---|---|---|---|---|---|---|---|---|---|---|
| Area (103 km2) | Rate (%) | Area (103 km2) | Rate (%) | Area (103 km2) | Rate (%) | Area (103 km2) | Rate (%) | Area (103 km2) | Rate (%) | |
| Historical evolution | 128.103 | 72.717 | 33.146 | 18.815 | 9.753 | 5.536 | 3.889 | 2.208 | 1.276 | 0.724 |
| Major governance | 133.521 | 75.792 | 30.849 | 17.511 | 7.857 | 4.460 | 2.765 | 1.569 | 1.175 | 0.667 |
| Complete governance | 135.711 | 77.035 | 28.856 | 16.380 | 7.839 | 4.450 | 2.887 | 1.639 | 0.874 | 0.496 |
Publisher’s Note: MDPI stays neutral with regard to jurisdictional claims in published maps and institutional affiliations. |
© 2022 by the authors. Licensee MDPI, Basel, Switzerland. This article is an open access article distributed under the terms and conditions of the Creative Commons Attribution (CC BY) license (https://creativecommons.org/licenses/by/4.0/).
Share and Cite
Qian, C.; Qiang, H.; Qin, C.; Wang, Z.; Li, M. Spatiotemporal Evolution Analysis and Future Scenario Prediction of Rocky Desertification in a Subtropical Karst Region. Remote Sens. 2022, 14, 292. https://doi.org/10.3390/rs14020292
Qian C, Qiang H, Qin C, Wang Z, Li M. Spatiotemporal Evolution Analysis and Future Scenario Prediction of Rocky Desertification in a Subtropical Karst Region. Remote Sensing. 2022; 14(2):292. https://doi.org/10.3390/rs14020292
Chicago/Turabian StyleQian, Chunhua, Hequn Qiang, Changyou Qin, Zi Wang, and Mingyang Li. 2022. "Spatiotemporal Evolution Analysis and Future Scenario Prediction of Rocky Desertification in a Subtropical Karst Region" Remote Sensing 14, no. 2: 292. https://doi.org/10.3390/rs14020292
APA StyleQian, C., Qiang, H., Qin, C., Wang, Z., & Li, M. (2022). Spatiotemporal Evolution Analysis and Future Scenario Prediction of Rocky Desertification in a Subtropical Karst Region. Remote Sensing, 14(2), 292. https://doi.org/10.3390/rs14020292