
Prediction of Changeable Eddy Structures around Luzon Strait Using an Artificial Neural Network Model


Abstract
:1. Introduction
2. Materials and Methods
2.1. Datasets
2.2. EOF Analysis
2.3. ANN
2.4. Forecasting Process
2.5. The Method of Evaluation
3. Results
3.1. SLA Prediction
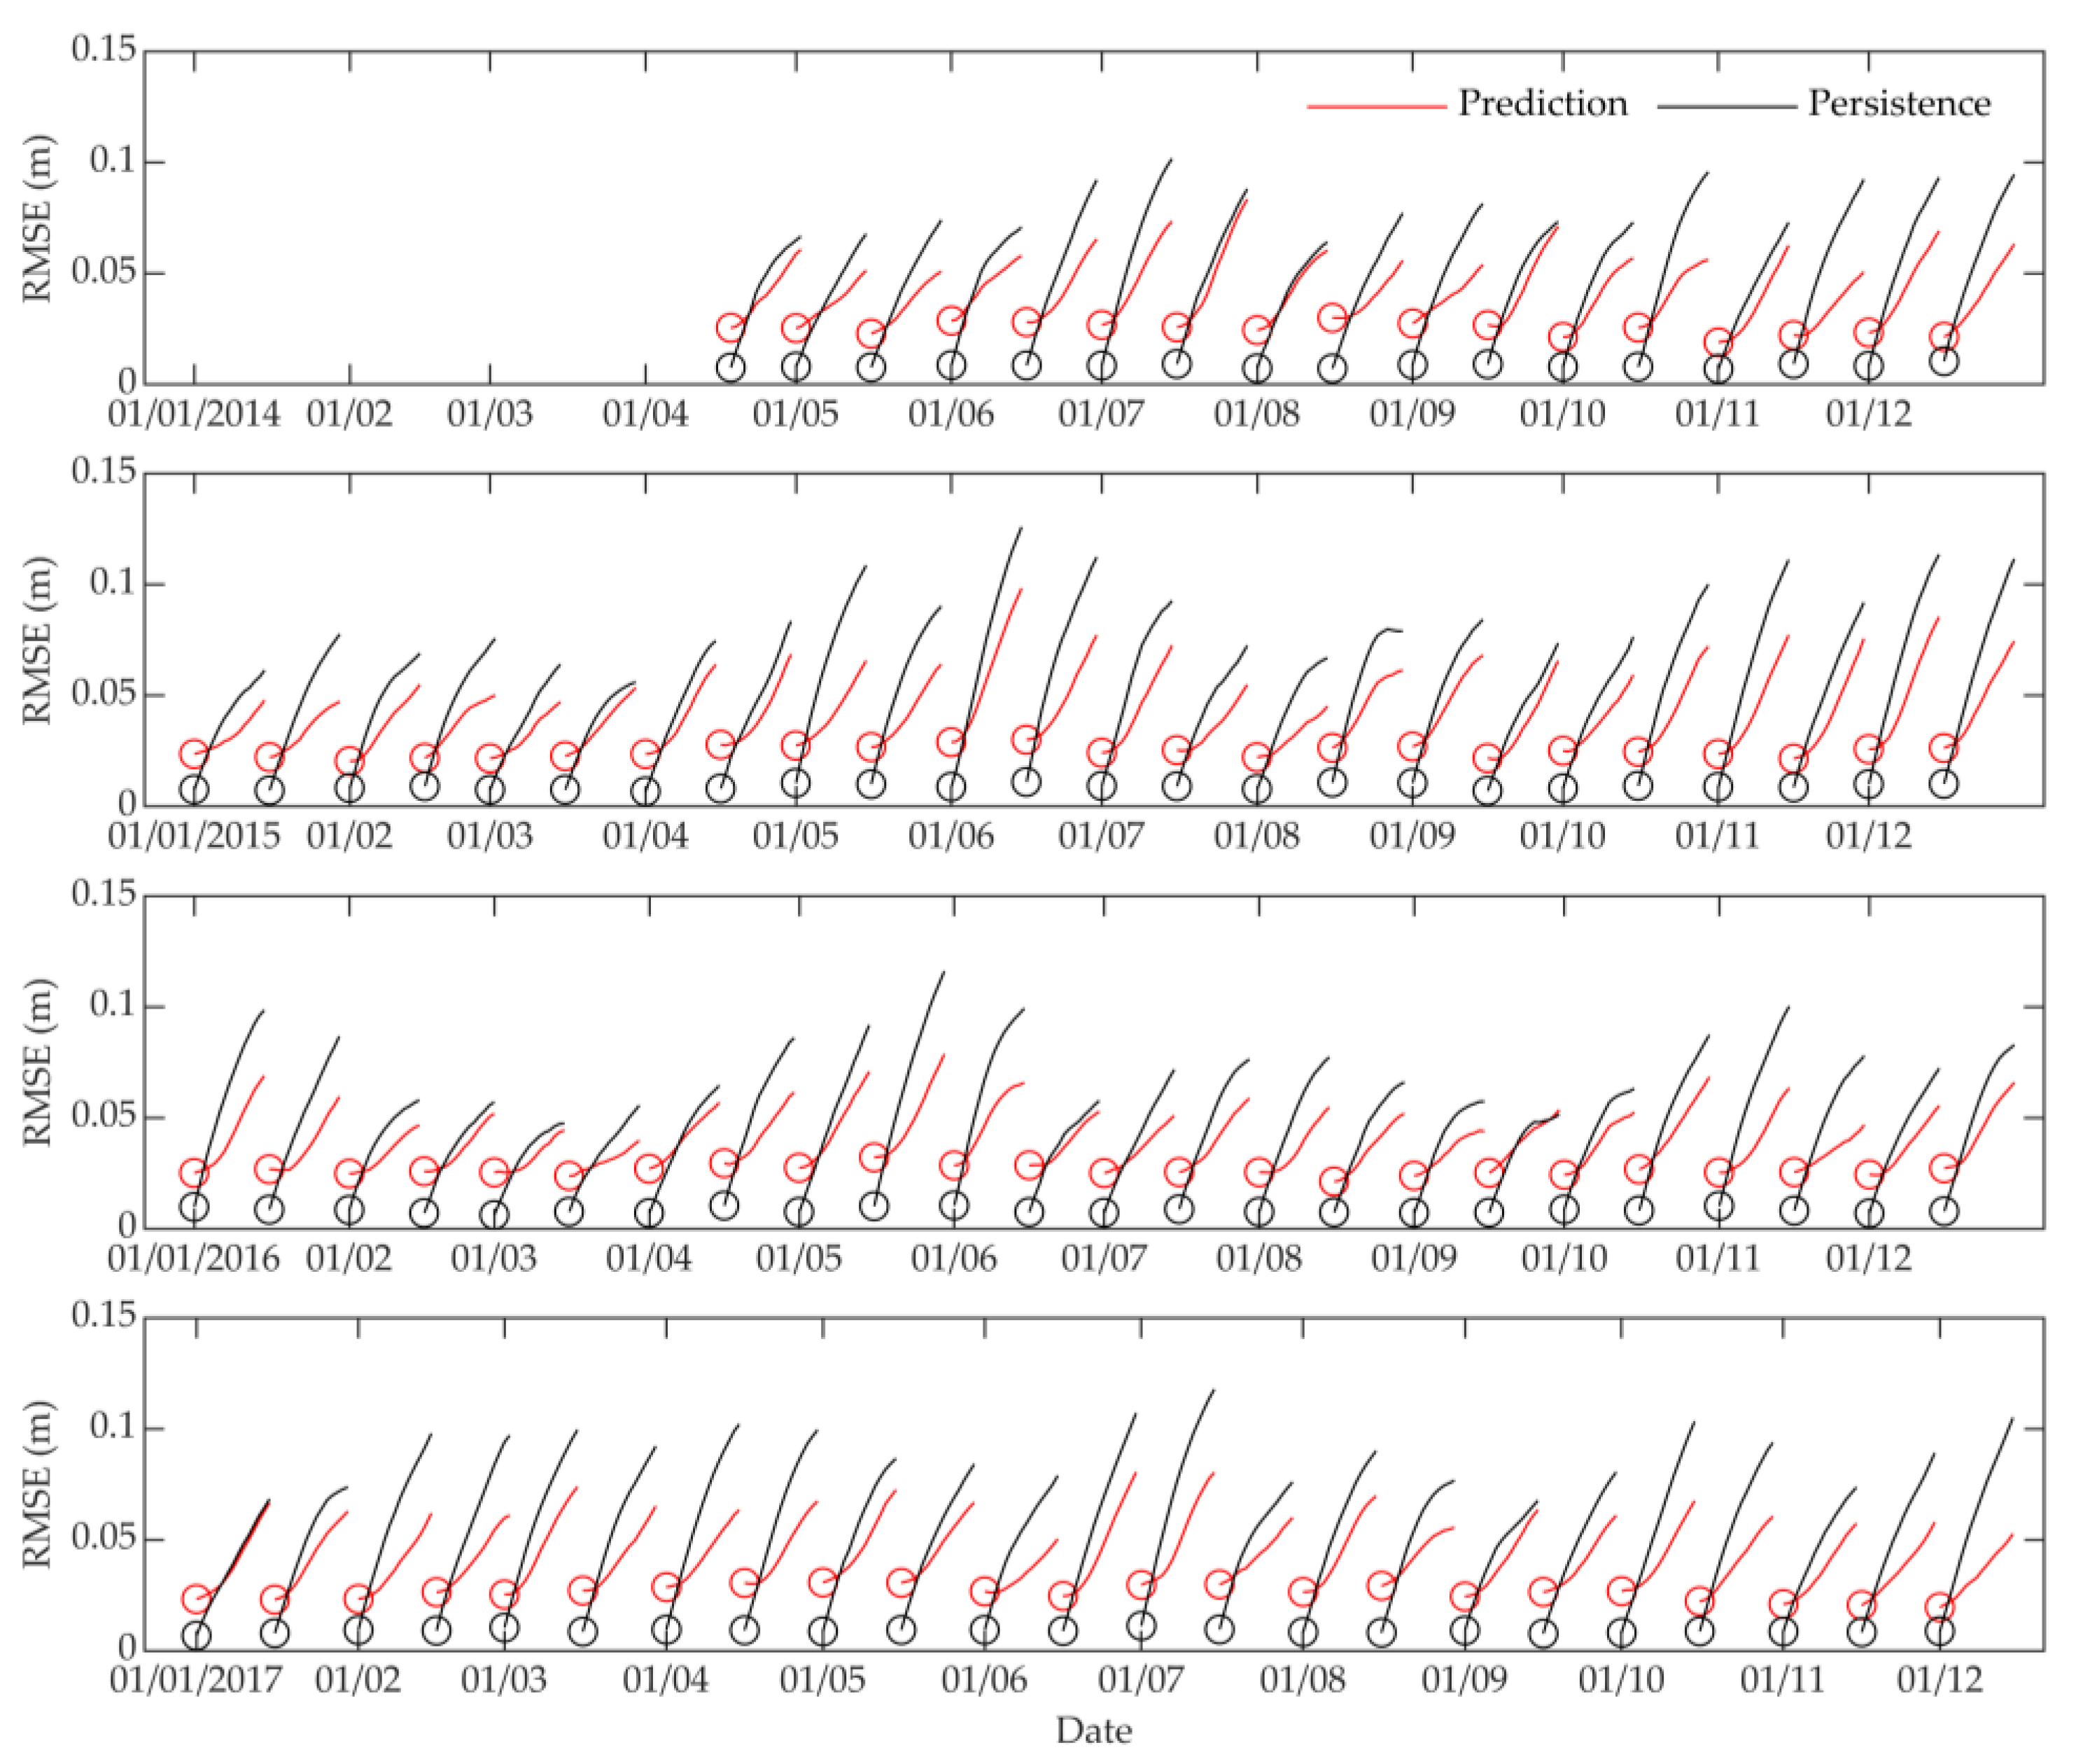
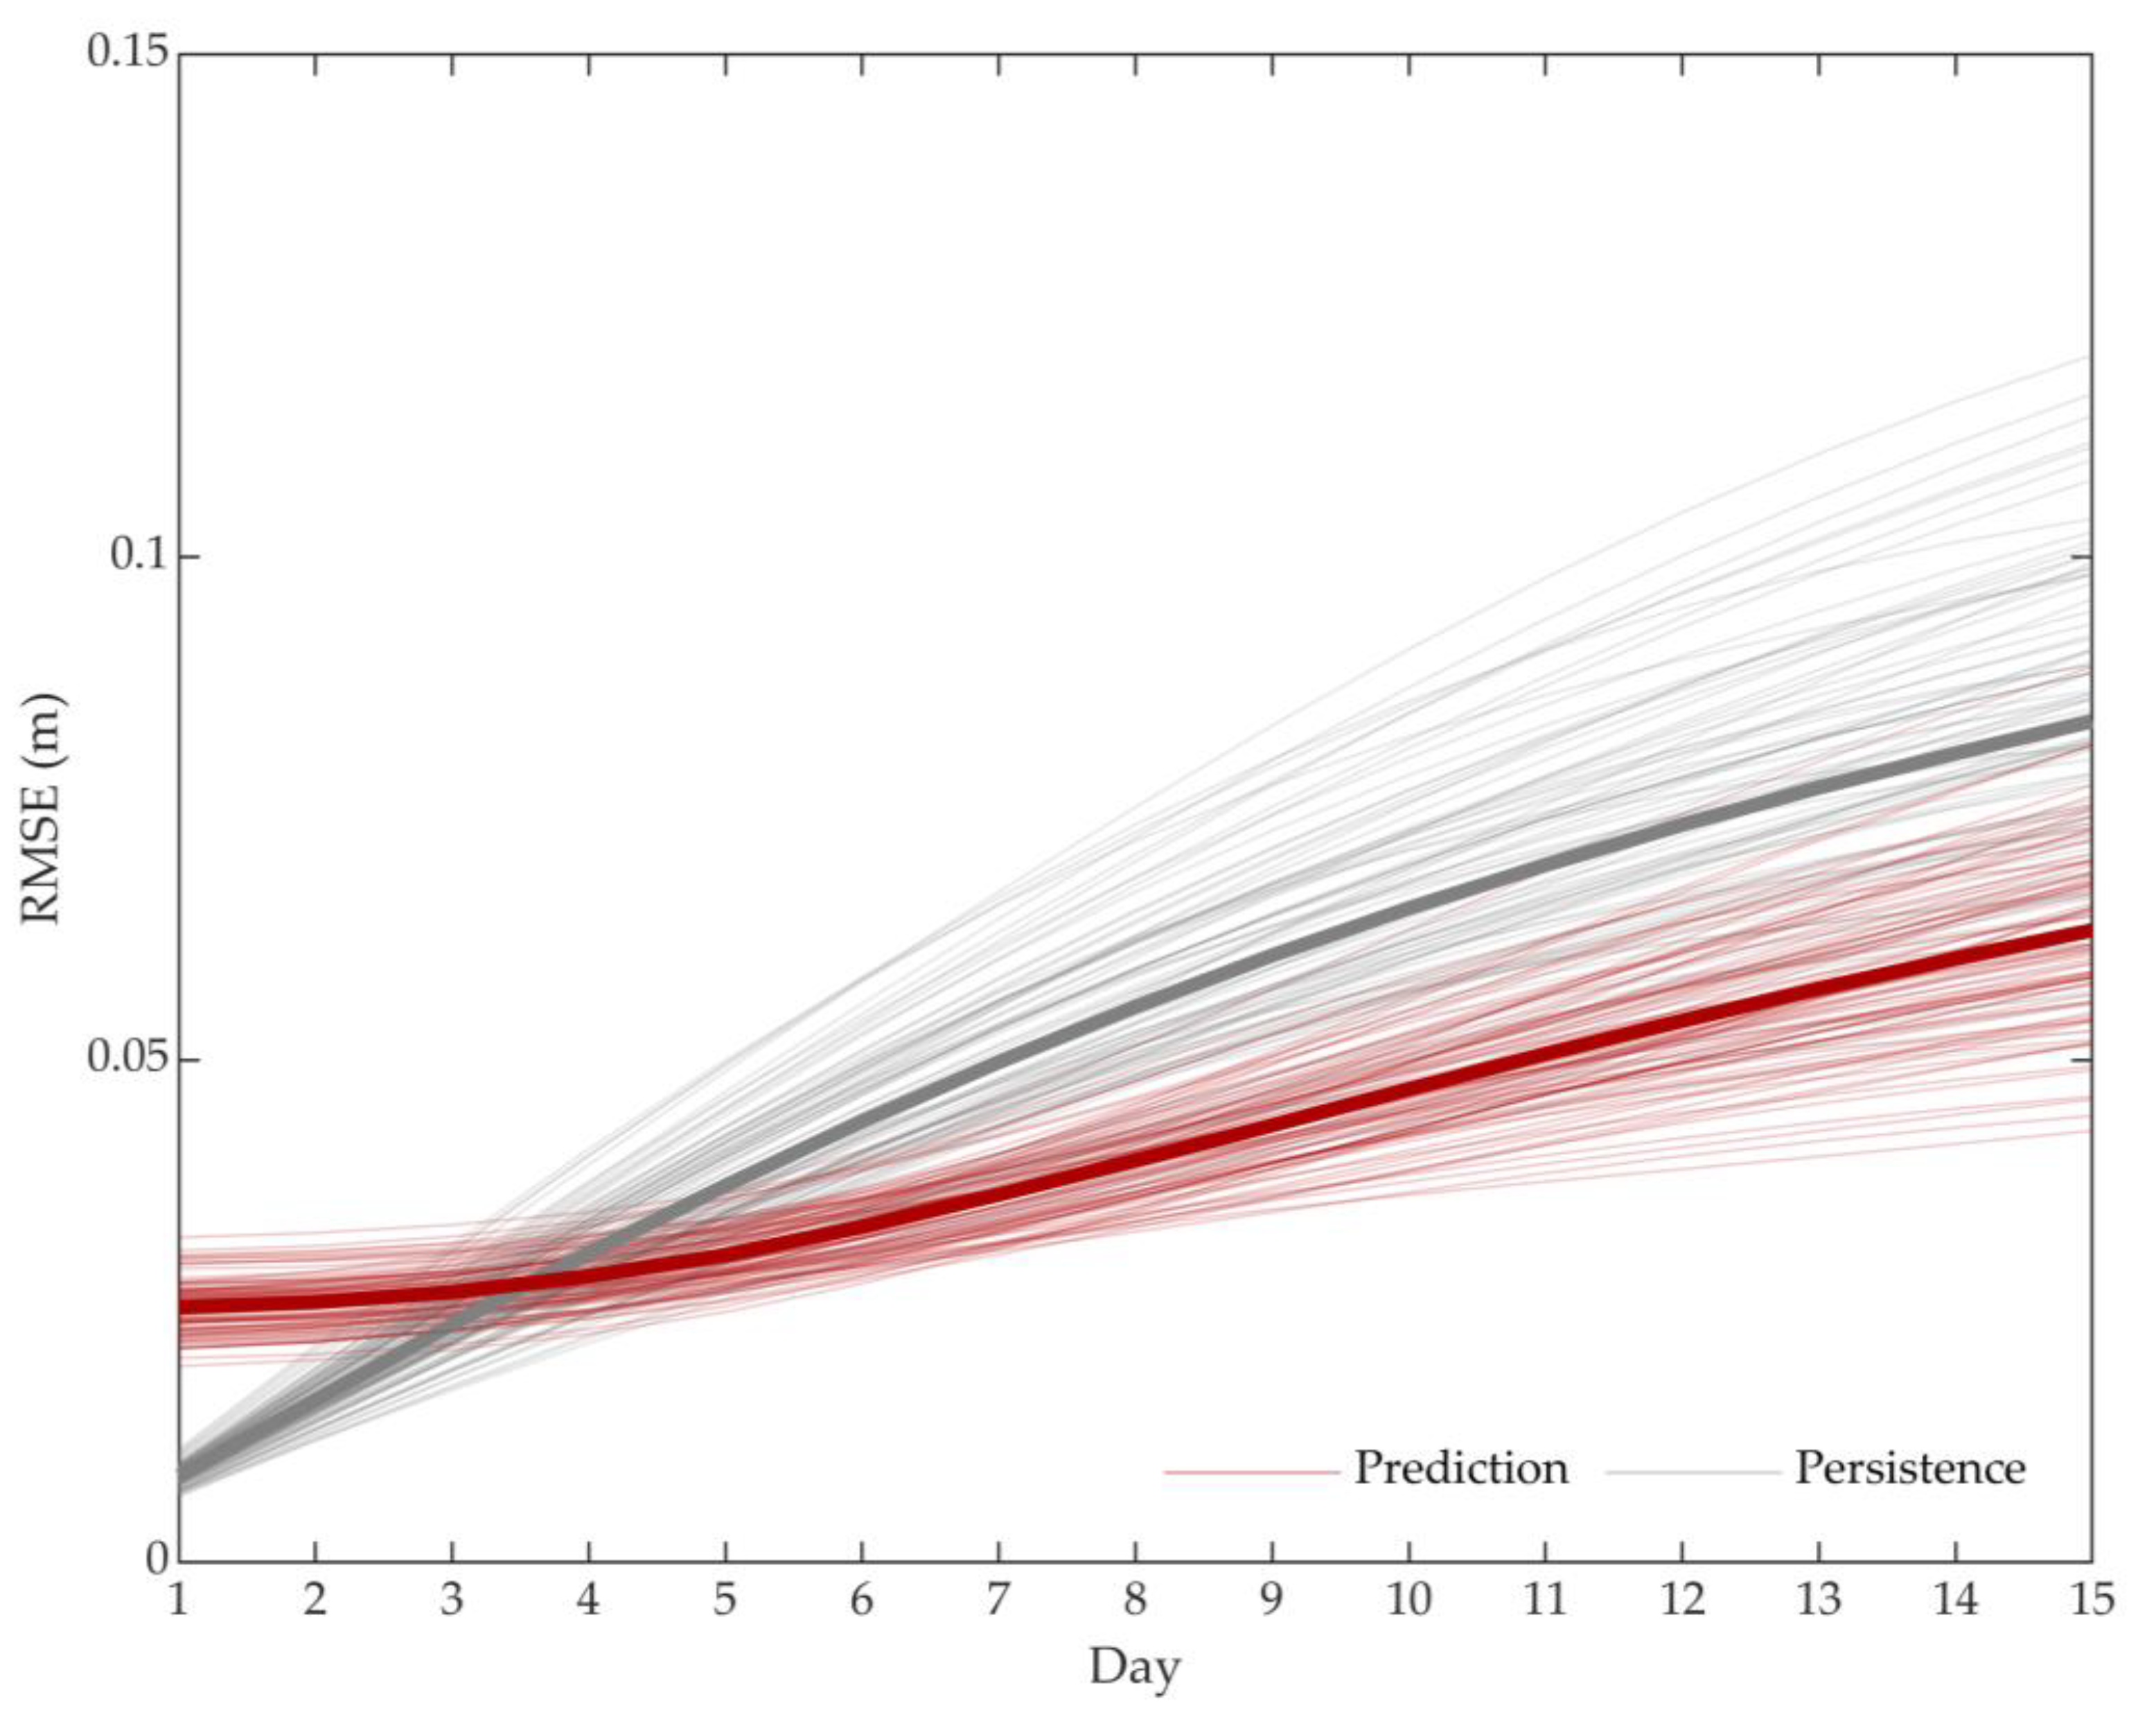
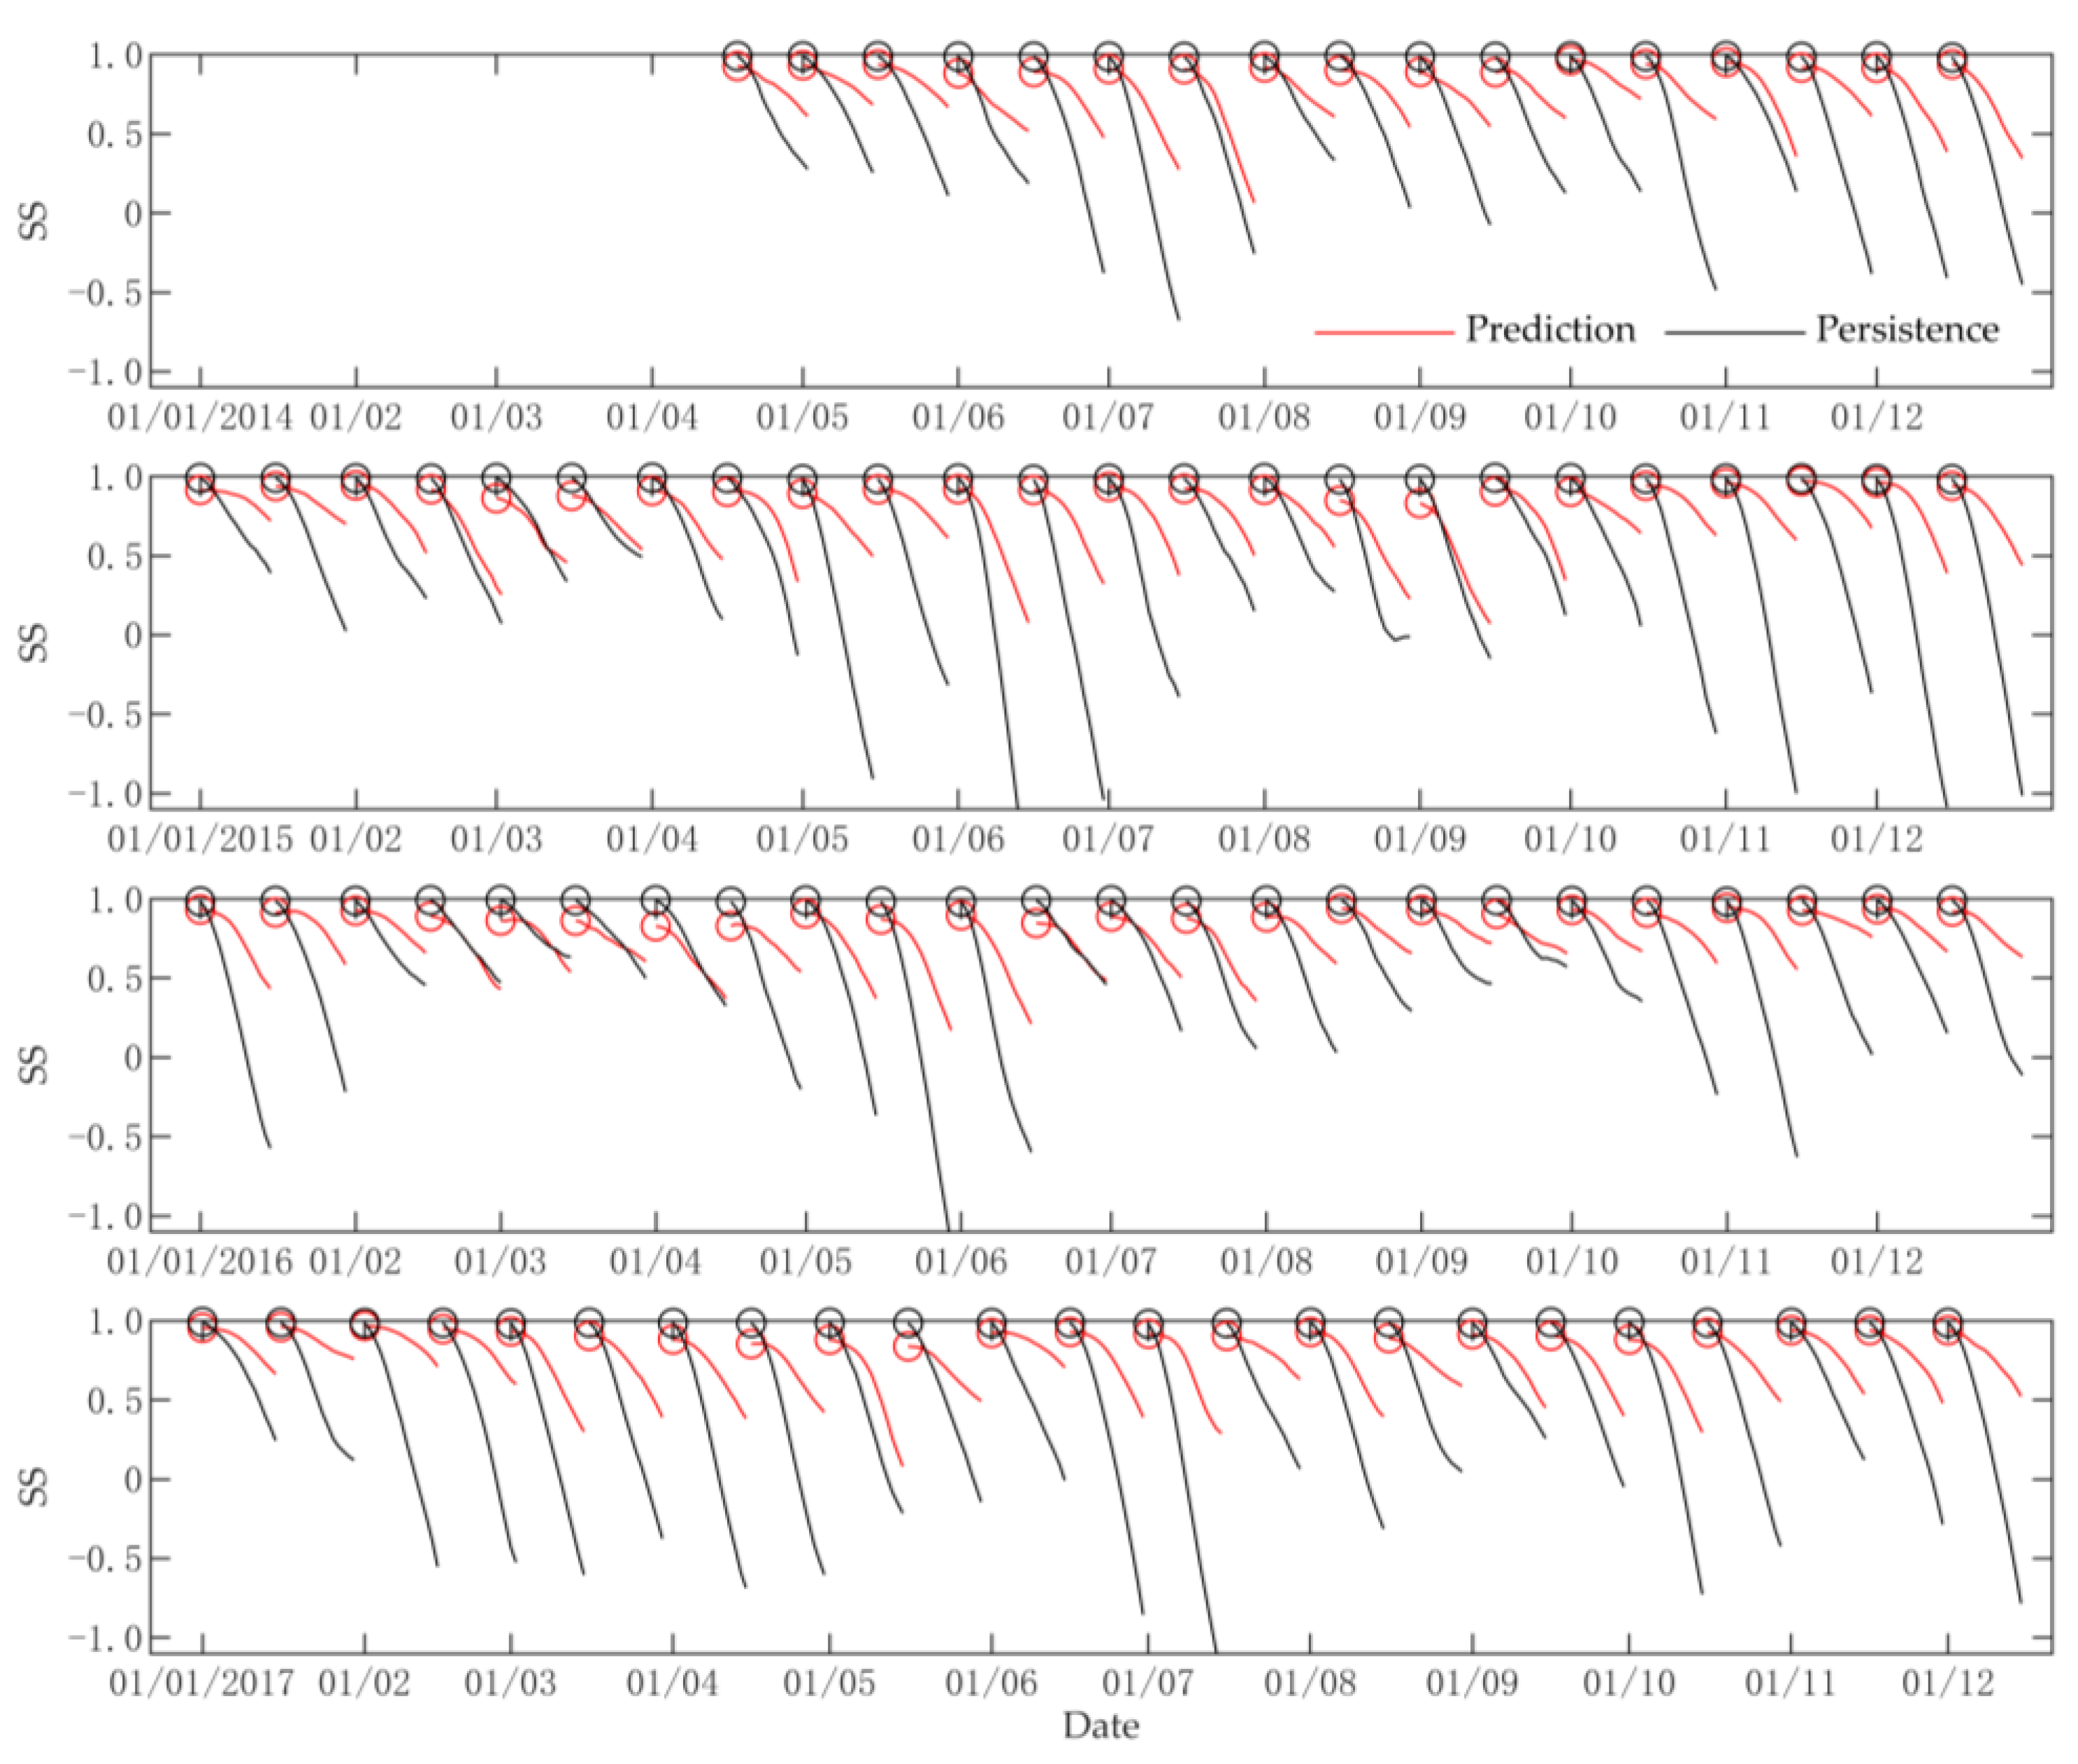
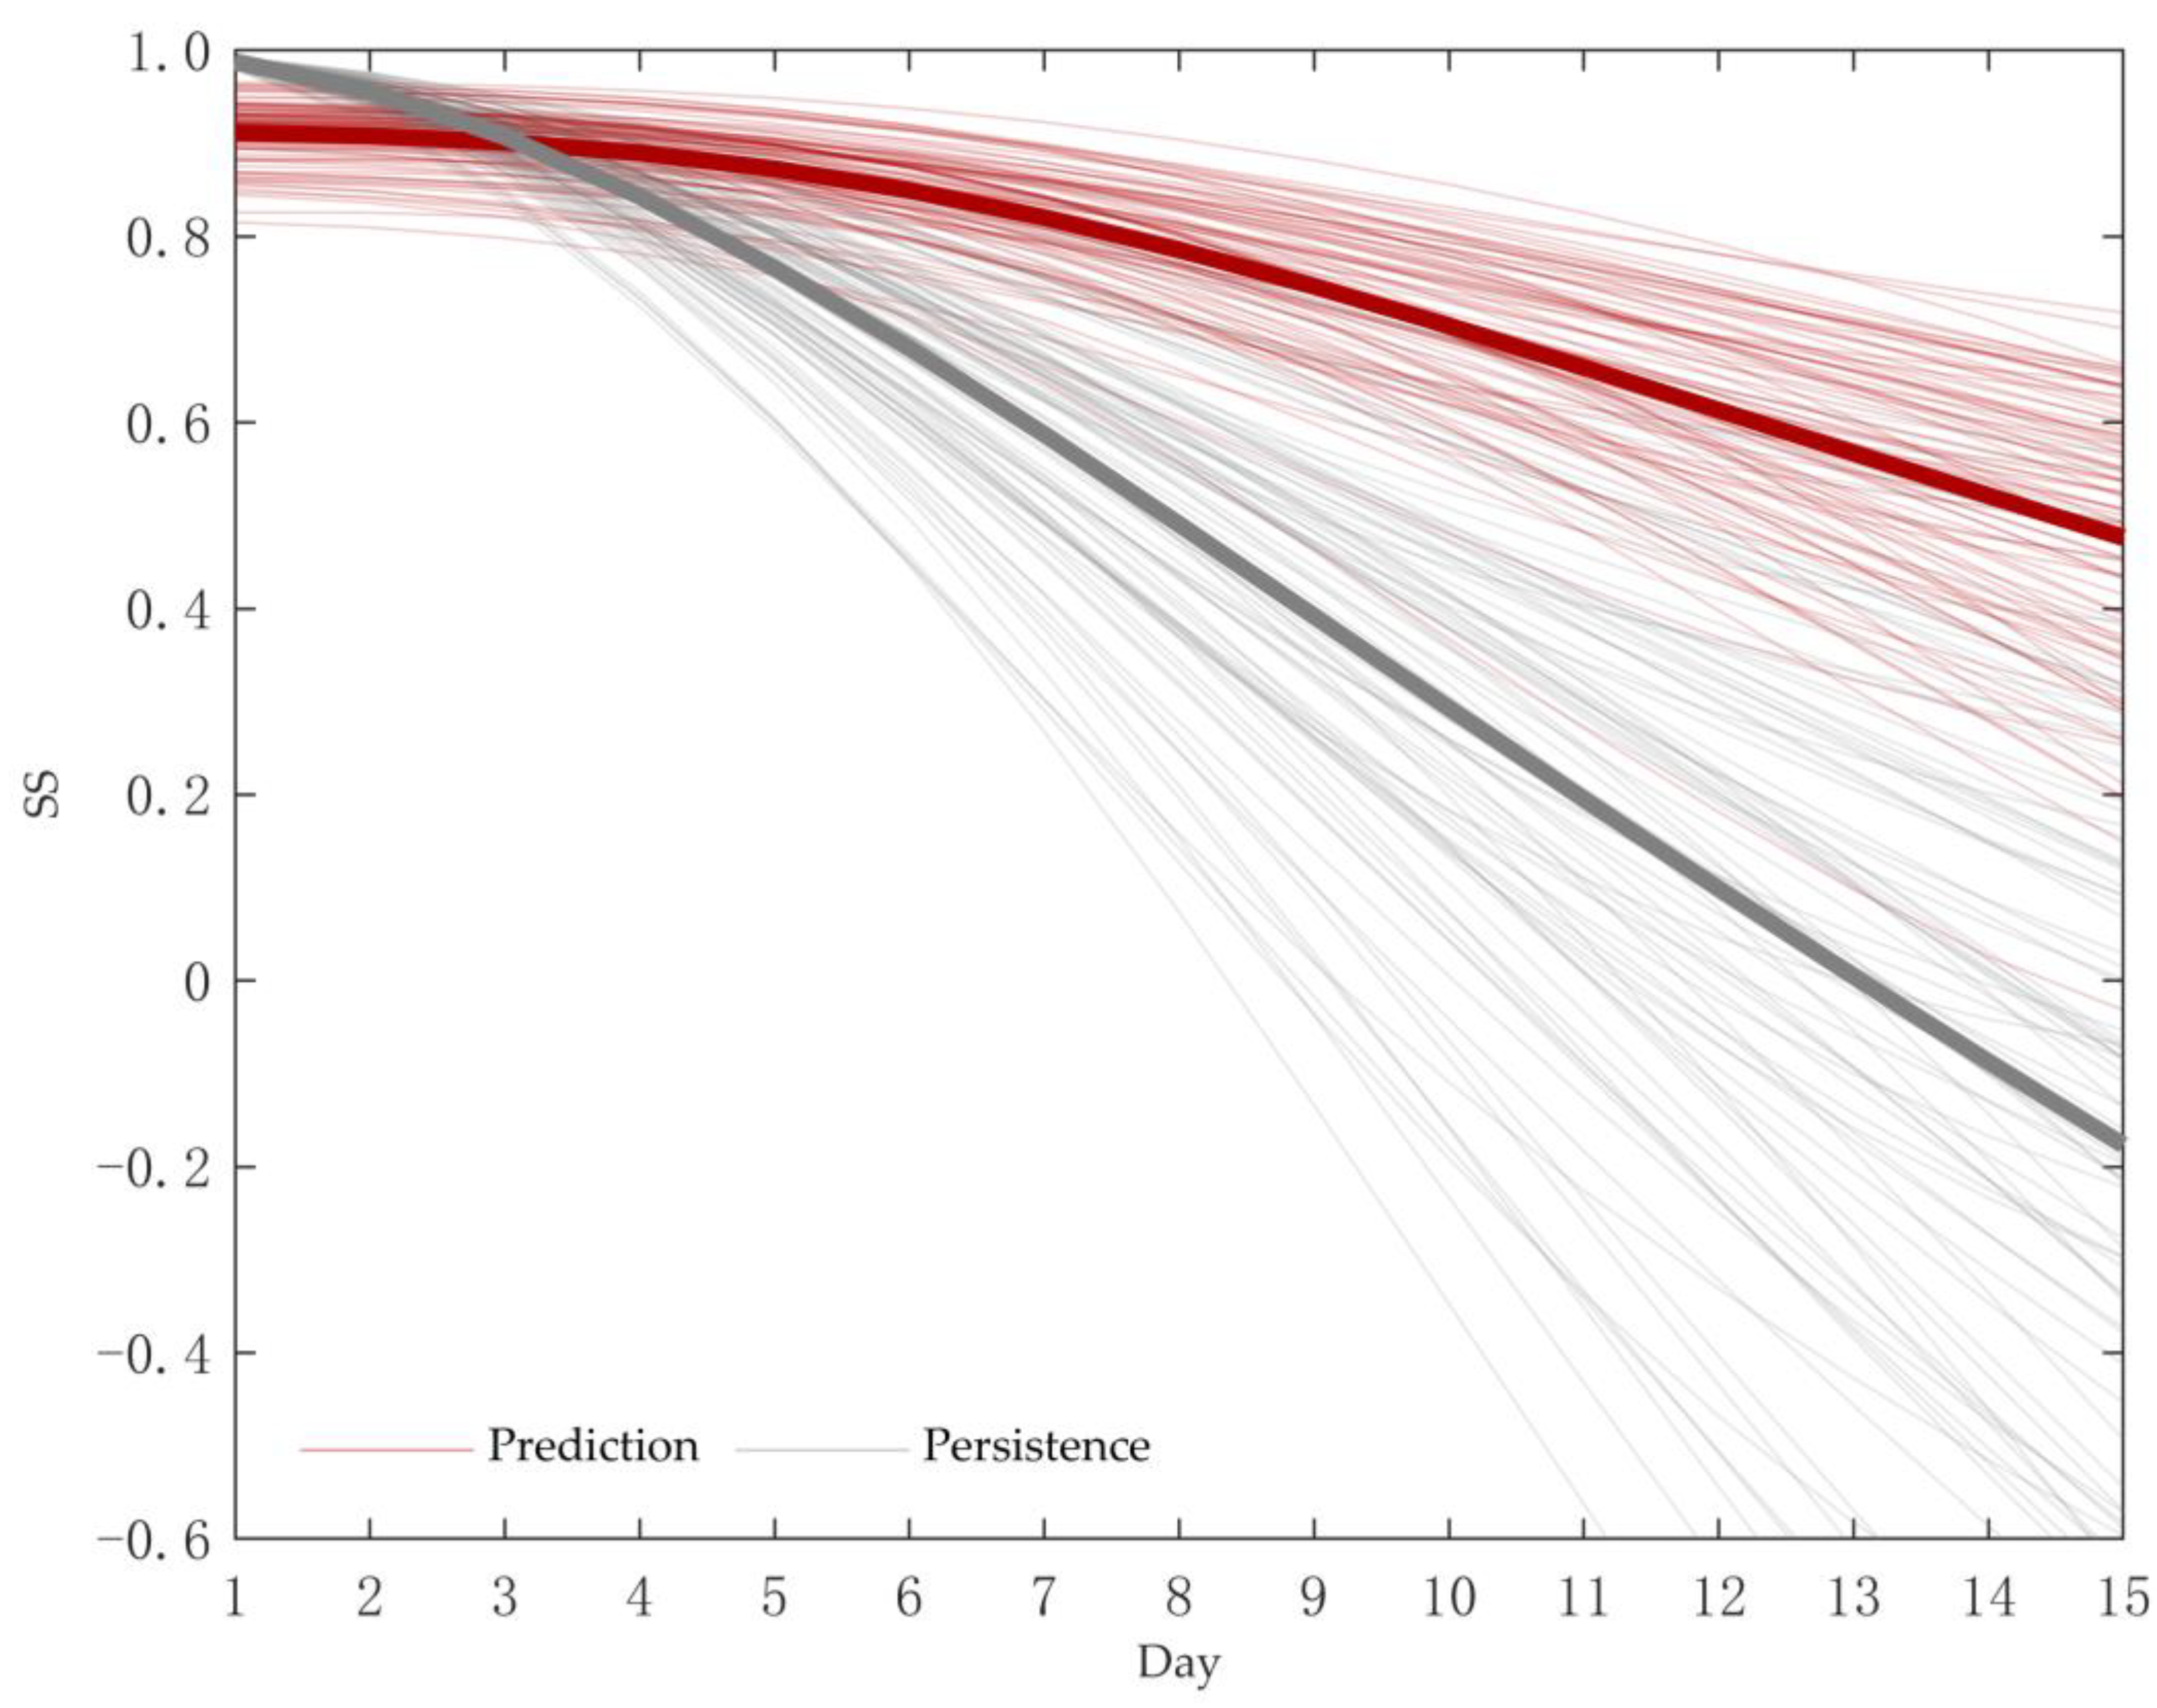
3.2. SLA Evaluation
3.3. Four Eddy Event Examples
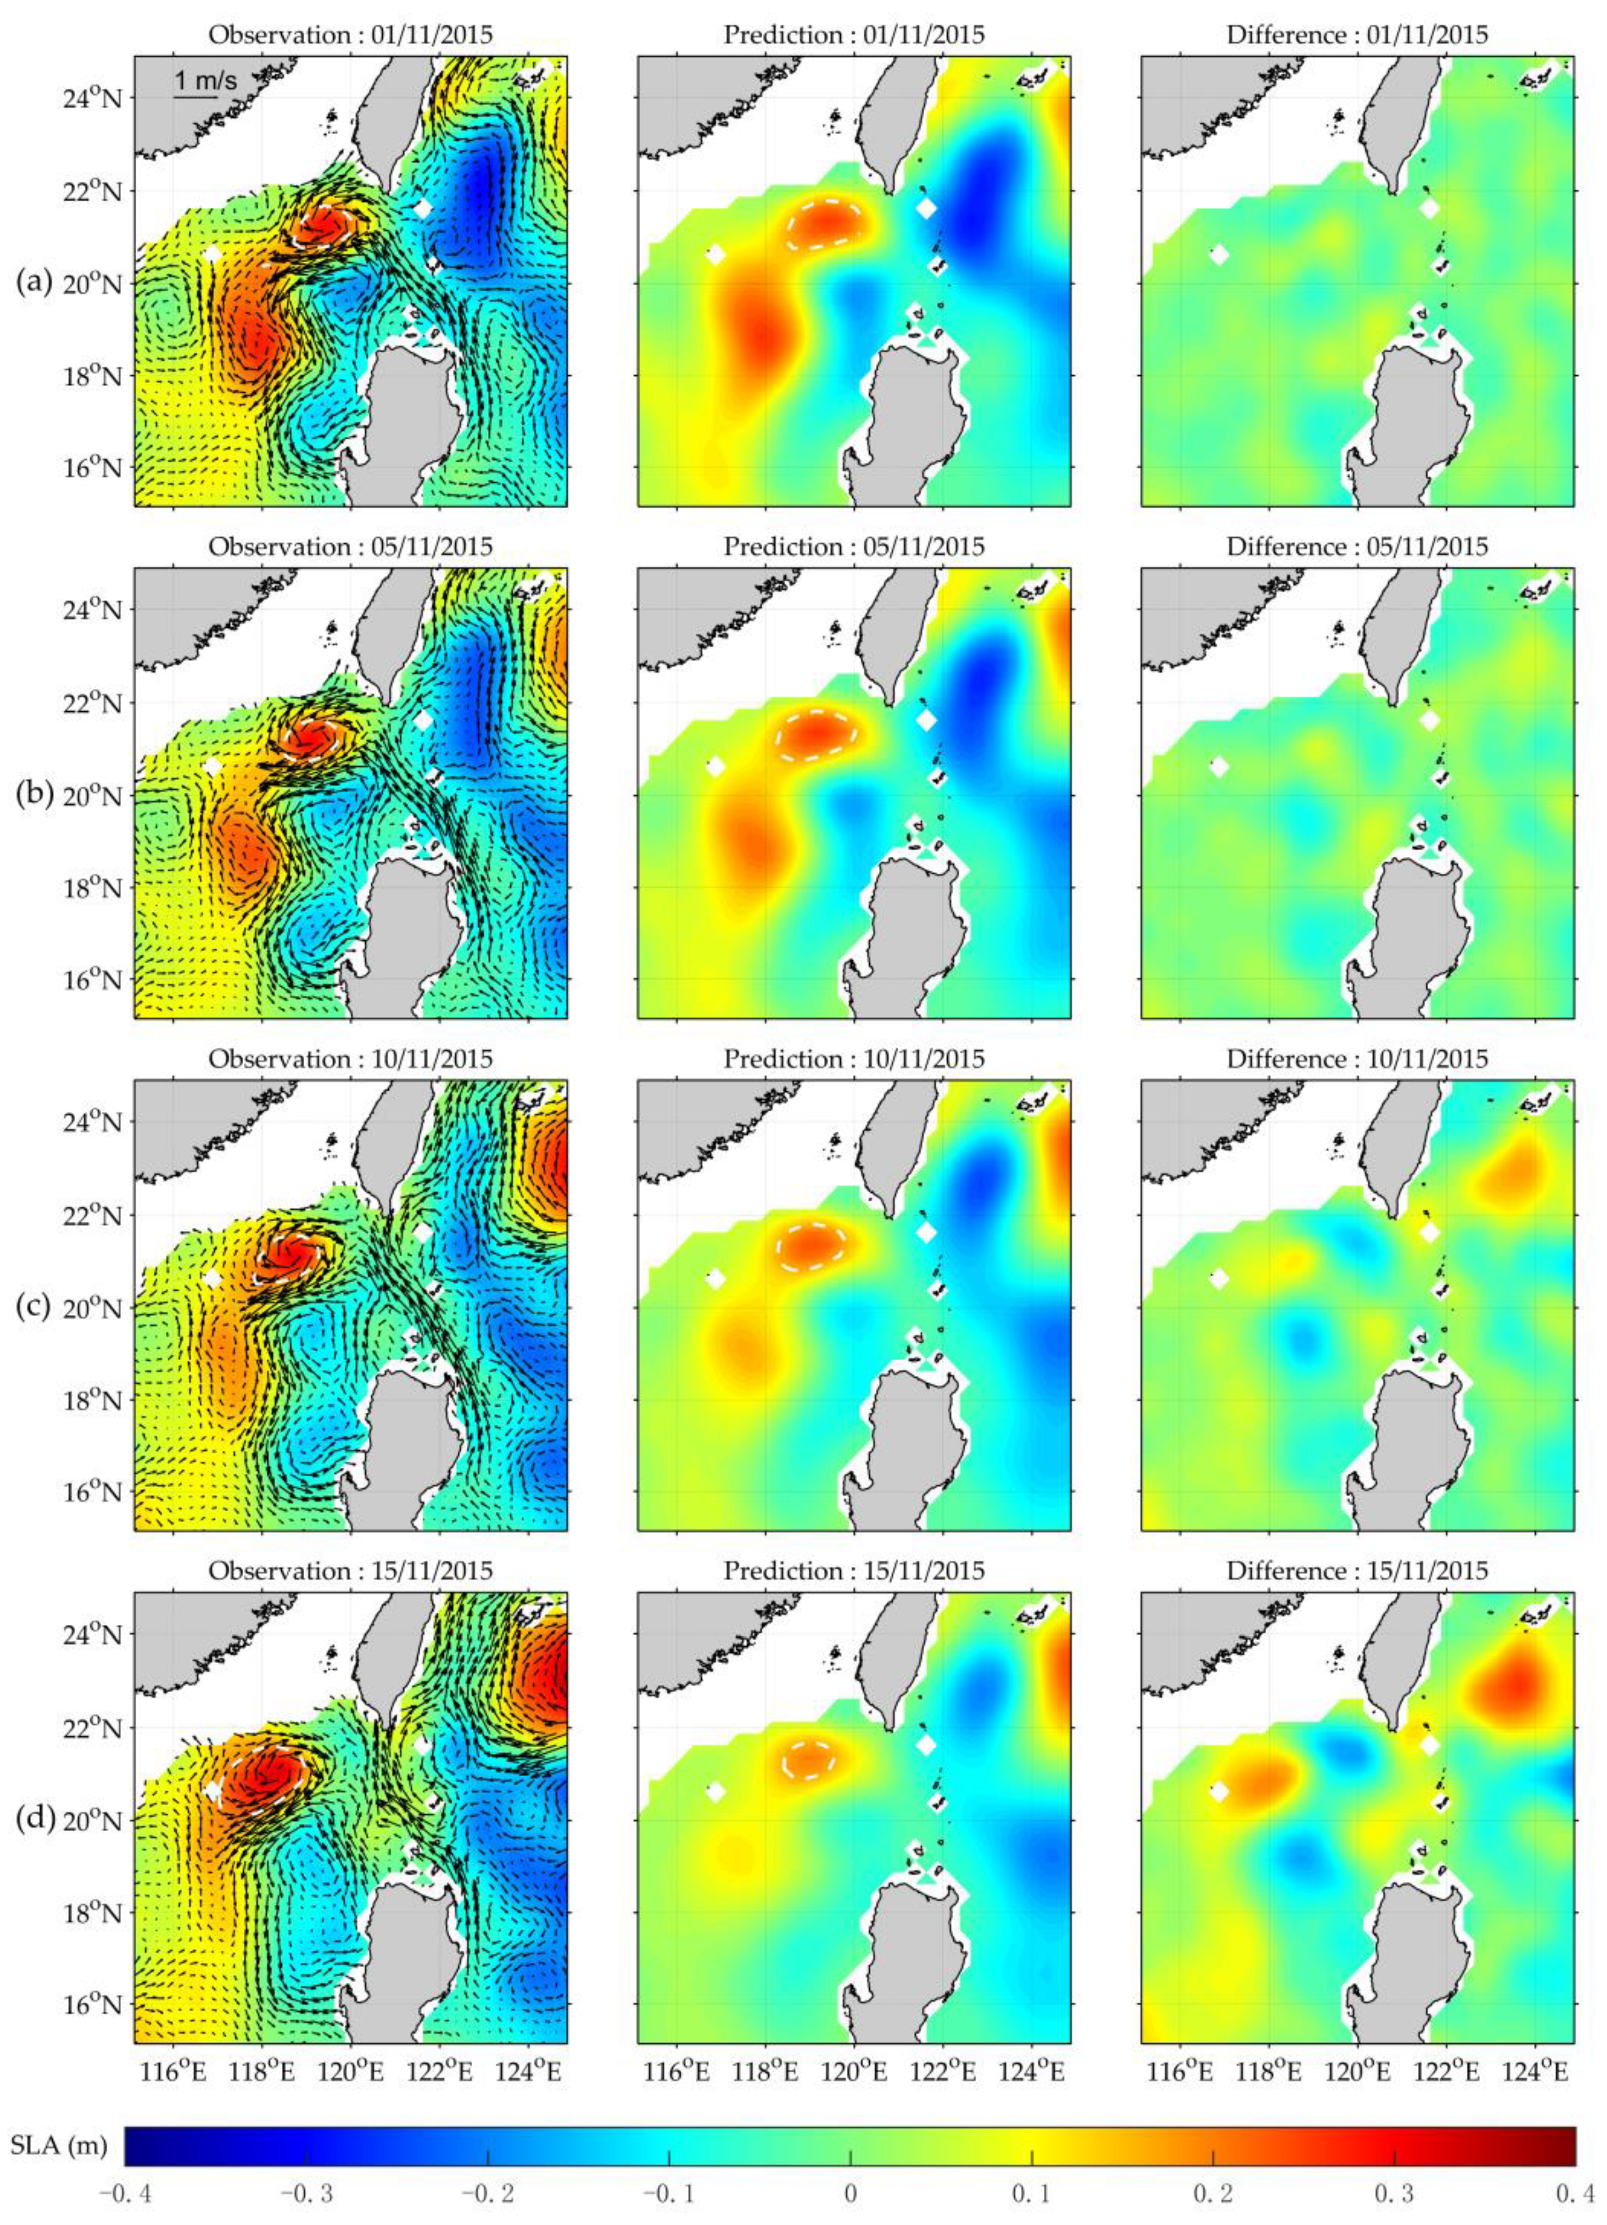
3.3.1. A Cyclone Eddy and the Loop Path of Kuroshio in Winter
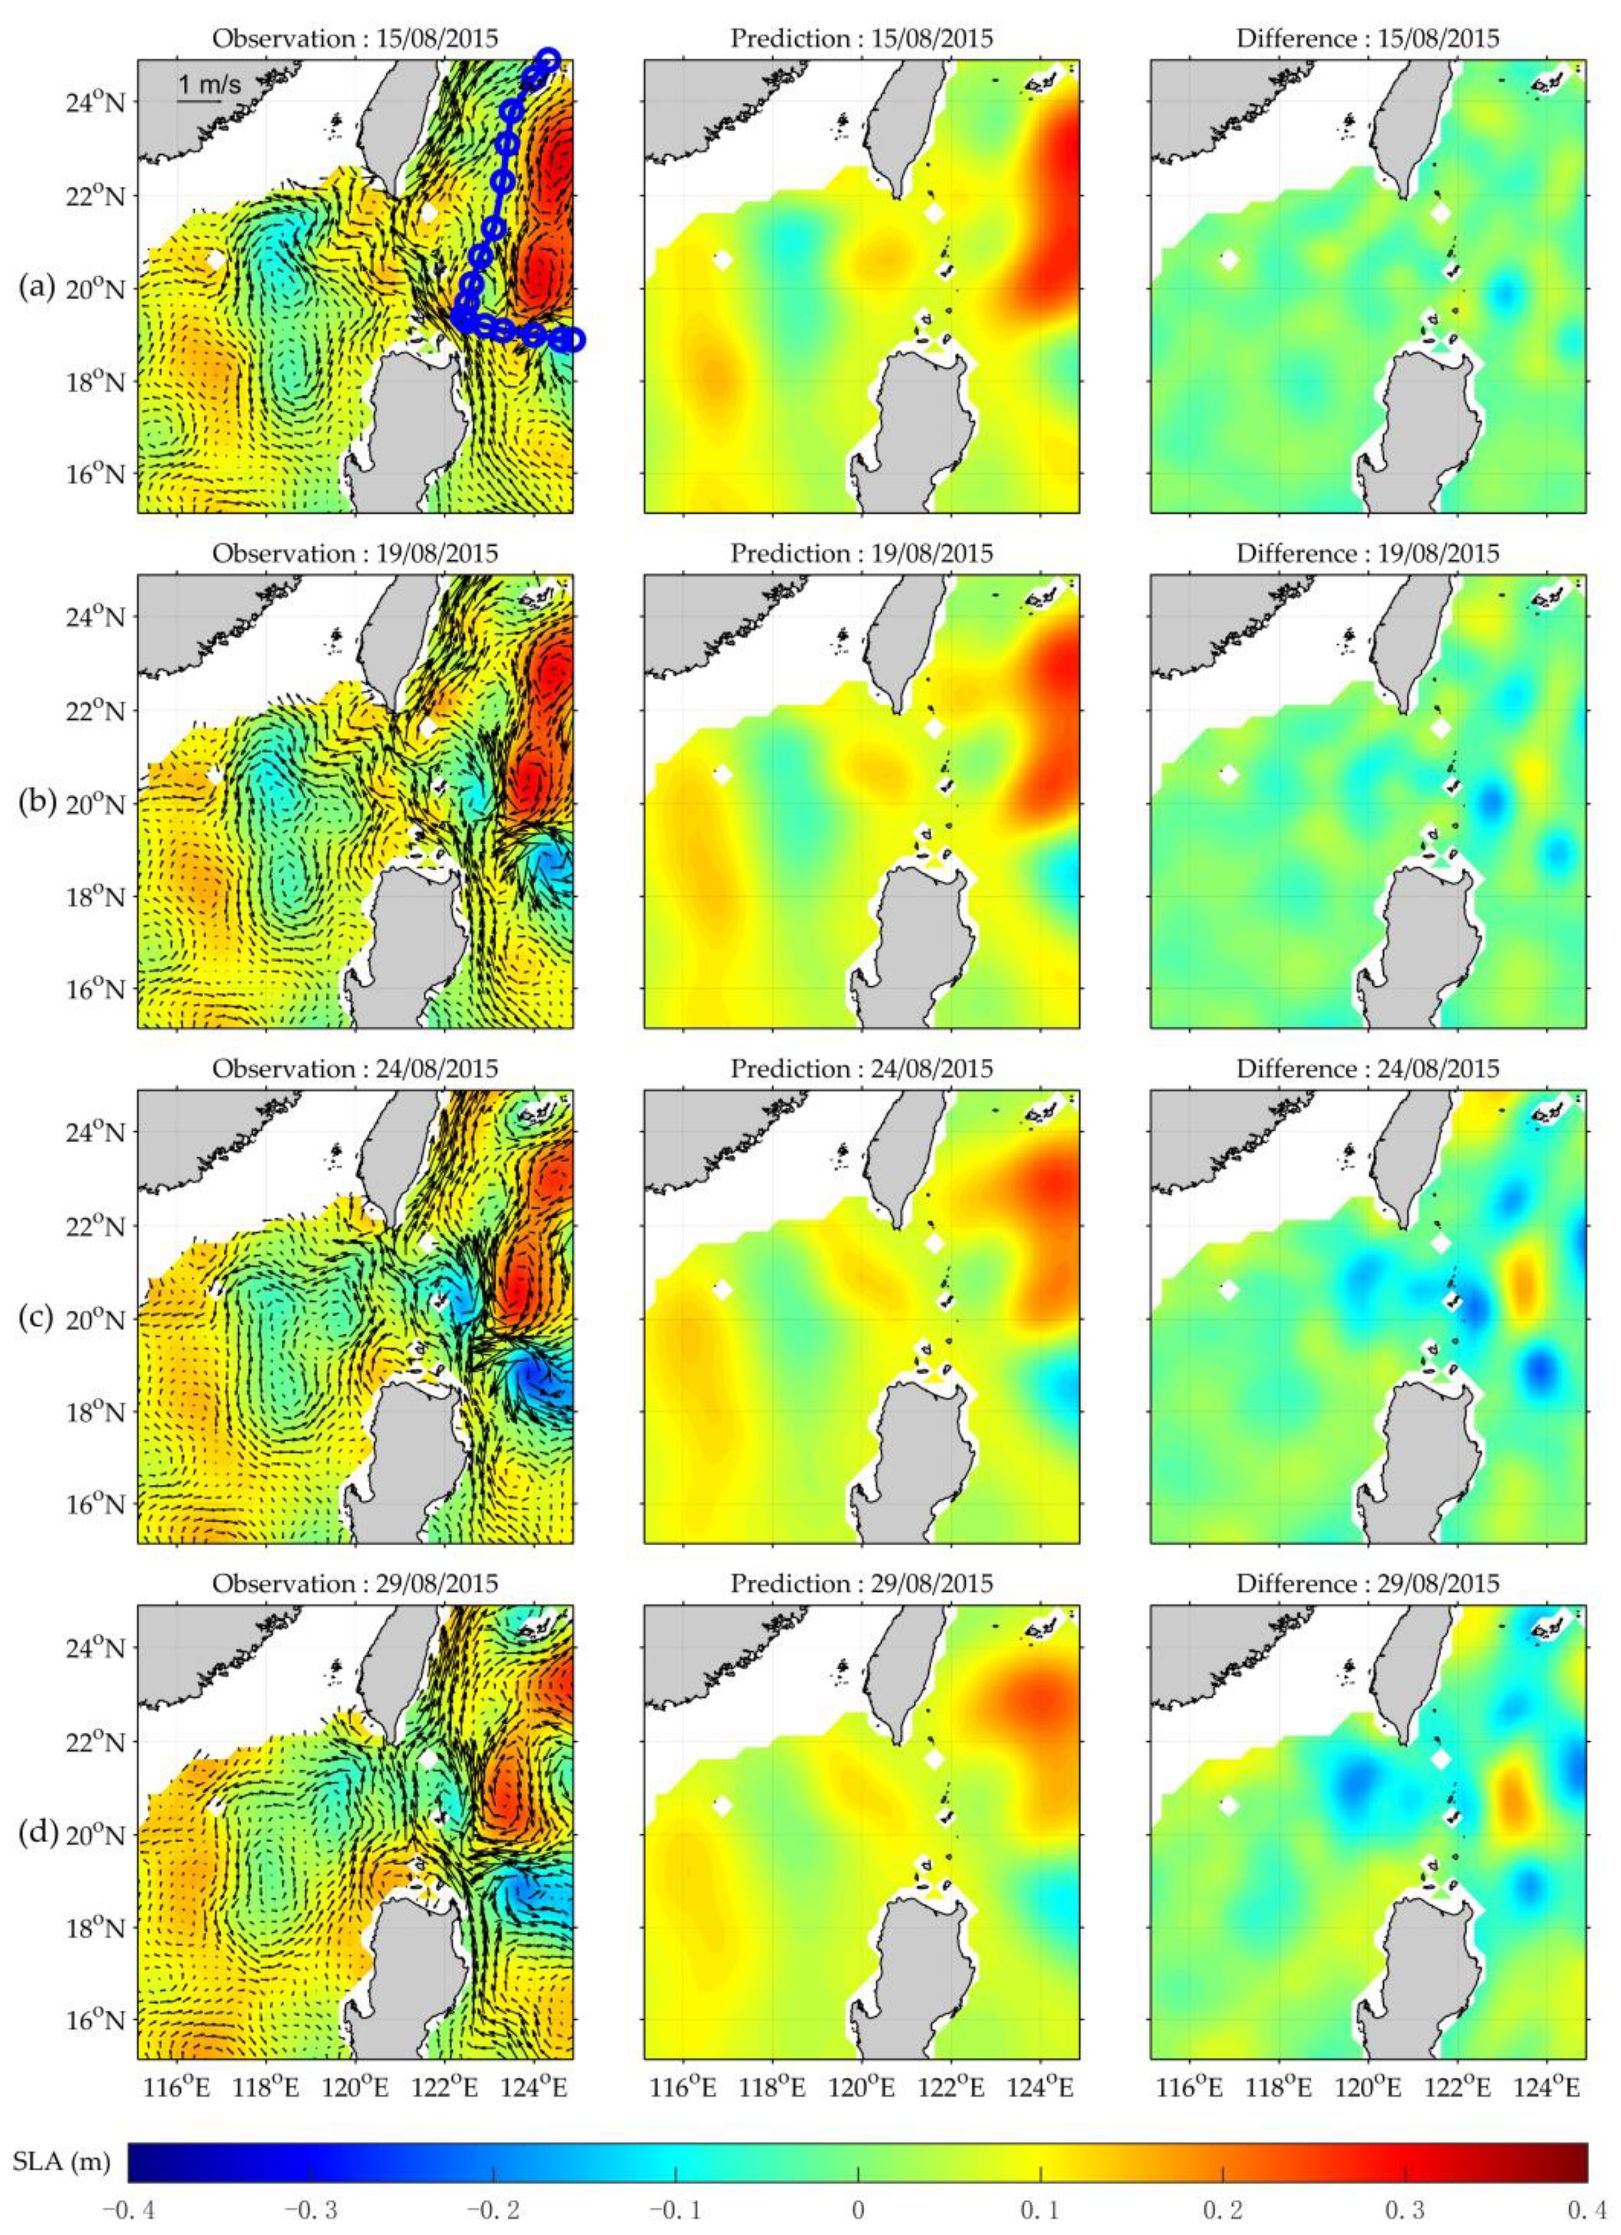
3.3.2. Rings of Kuroshio
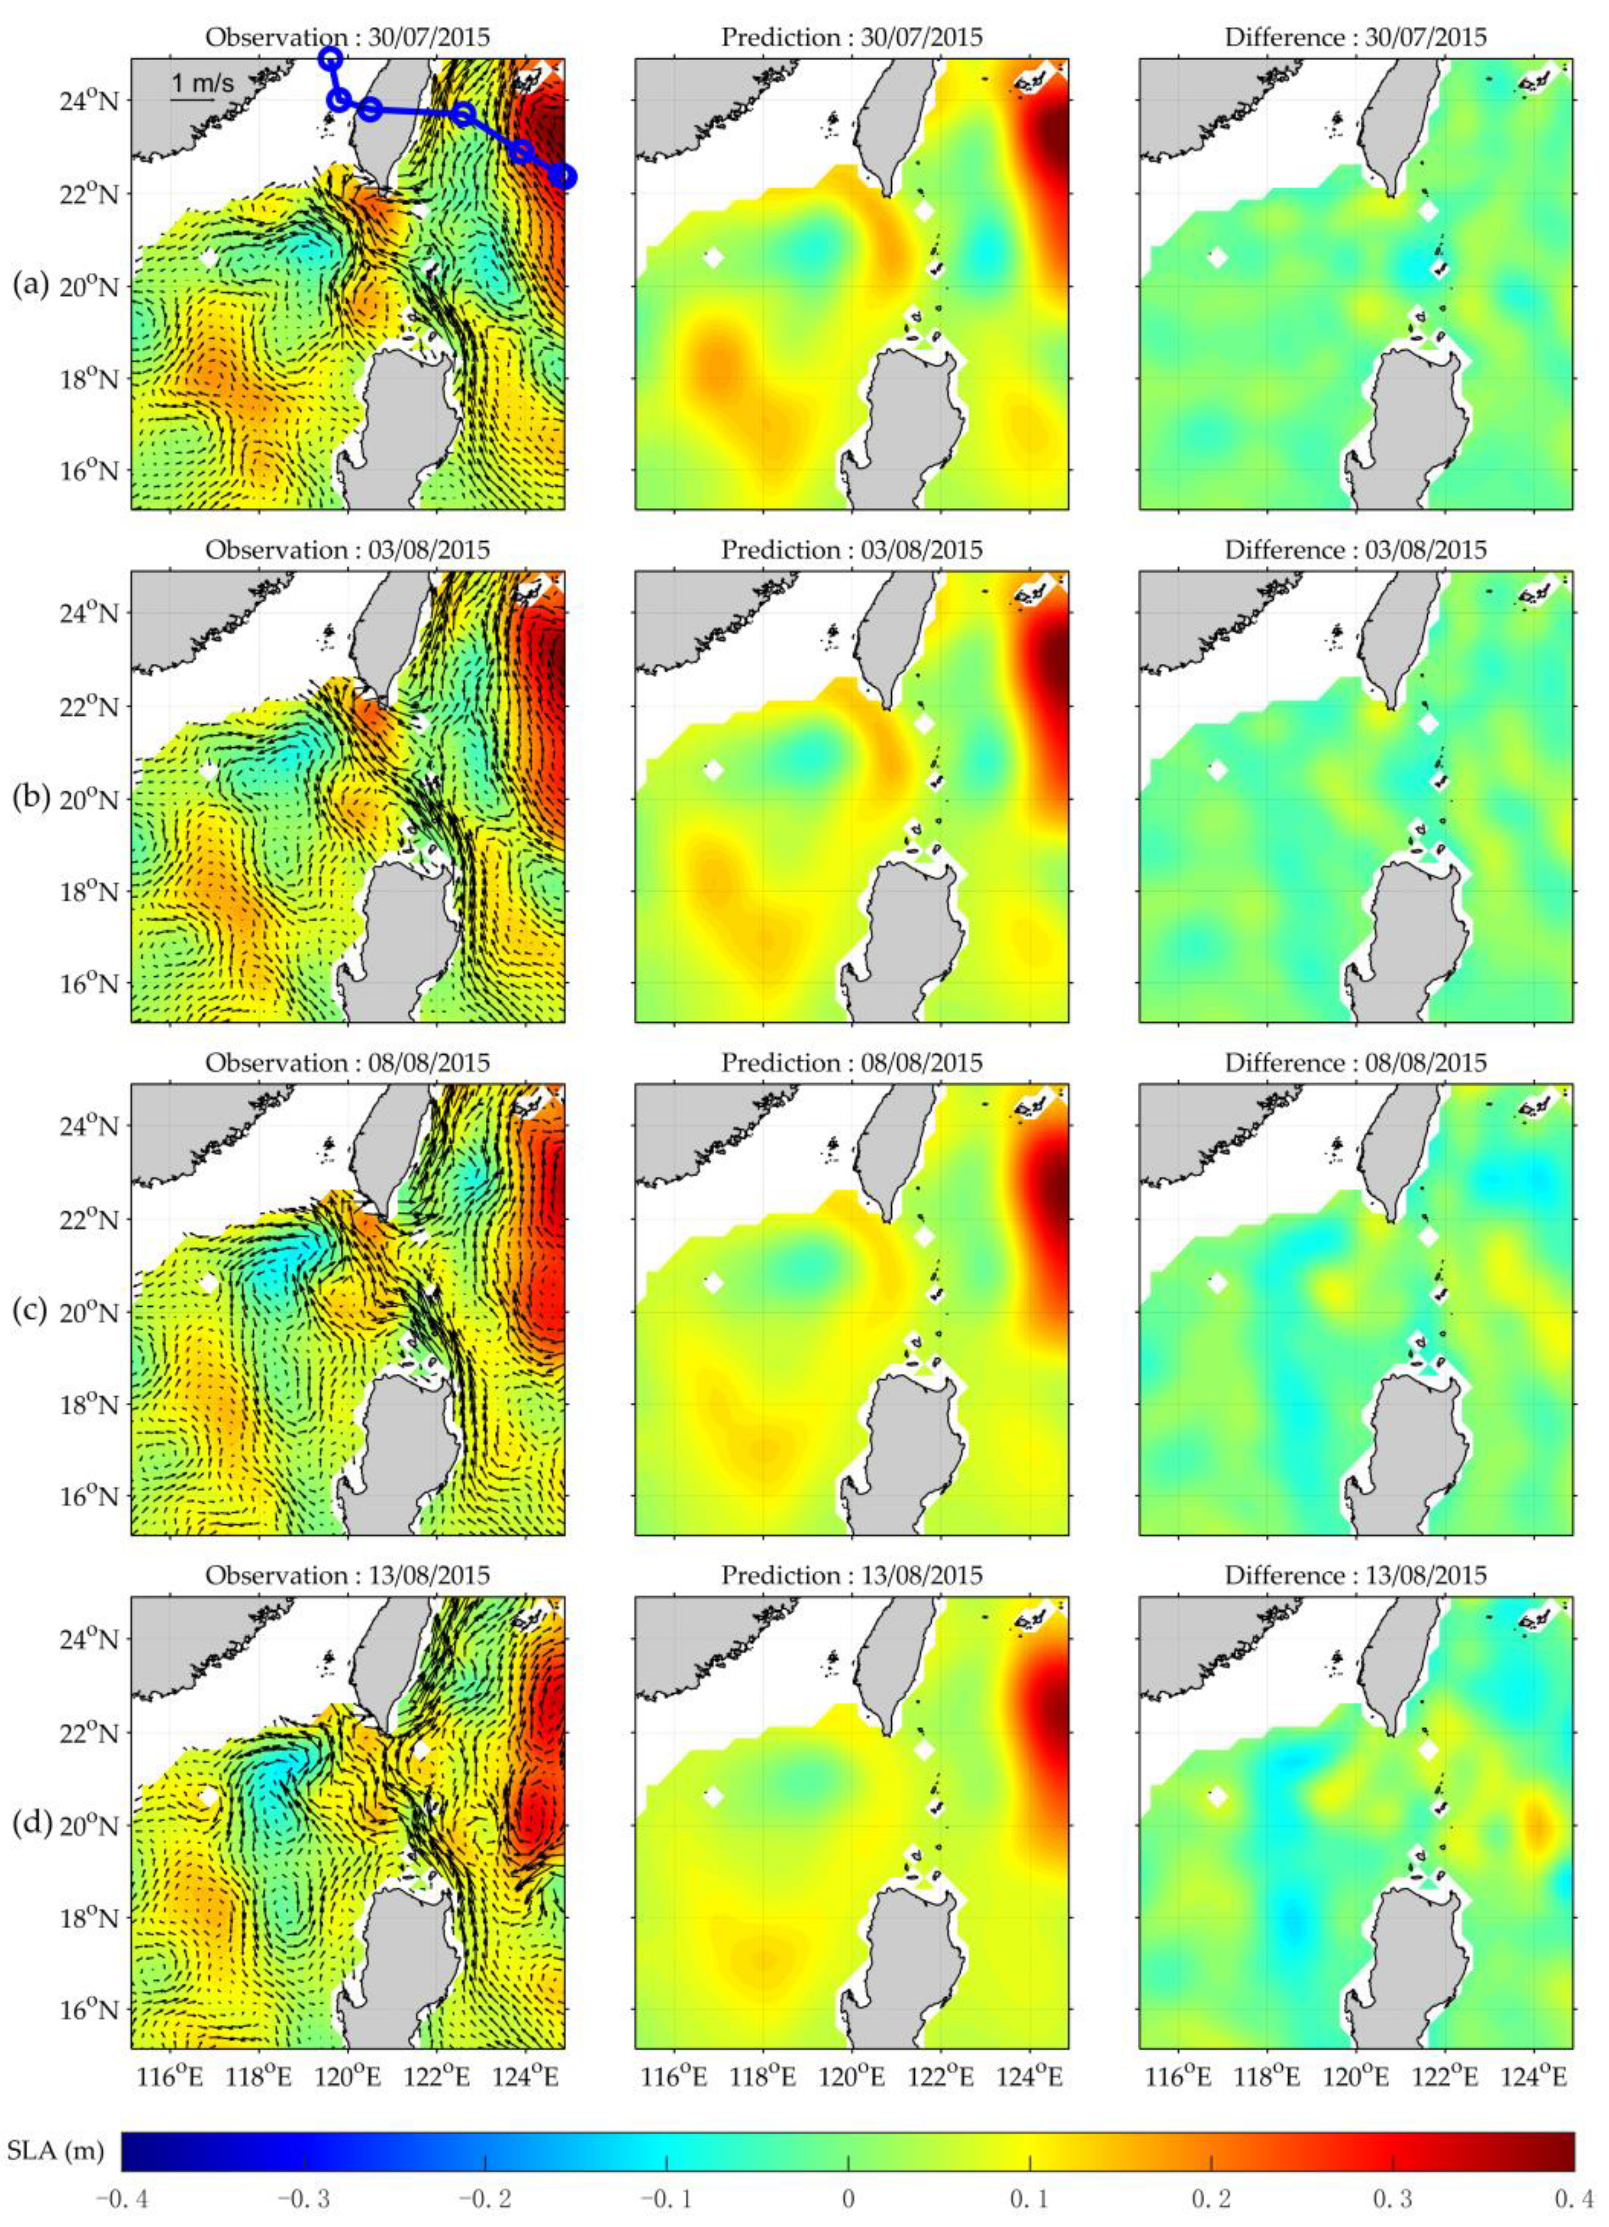
3.3.3. An Anticyclone Eddy and the Leaping Path of Kuroshio in Summer
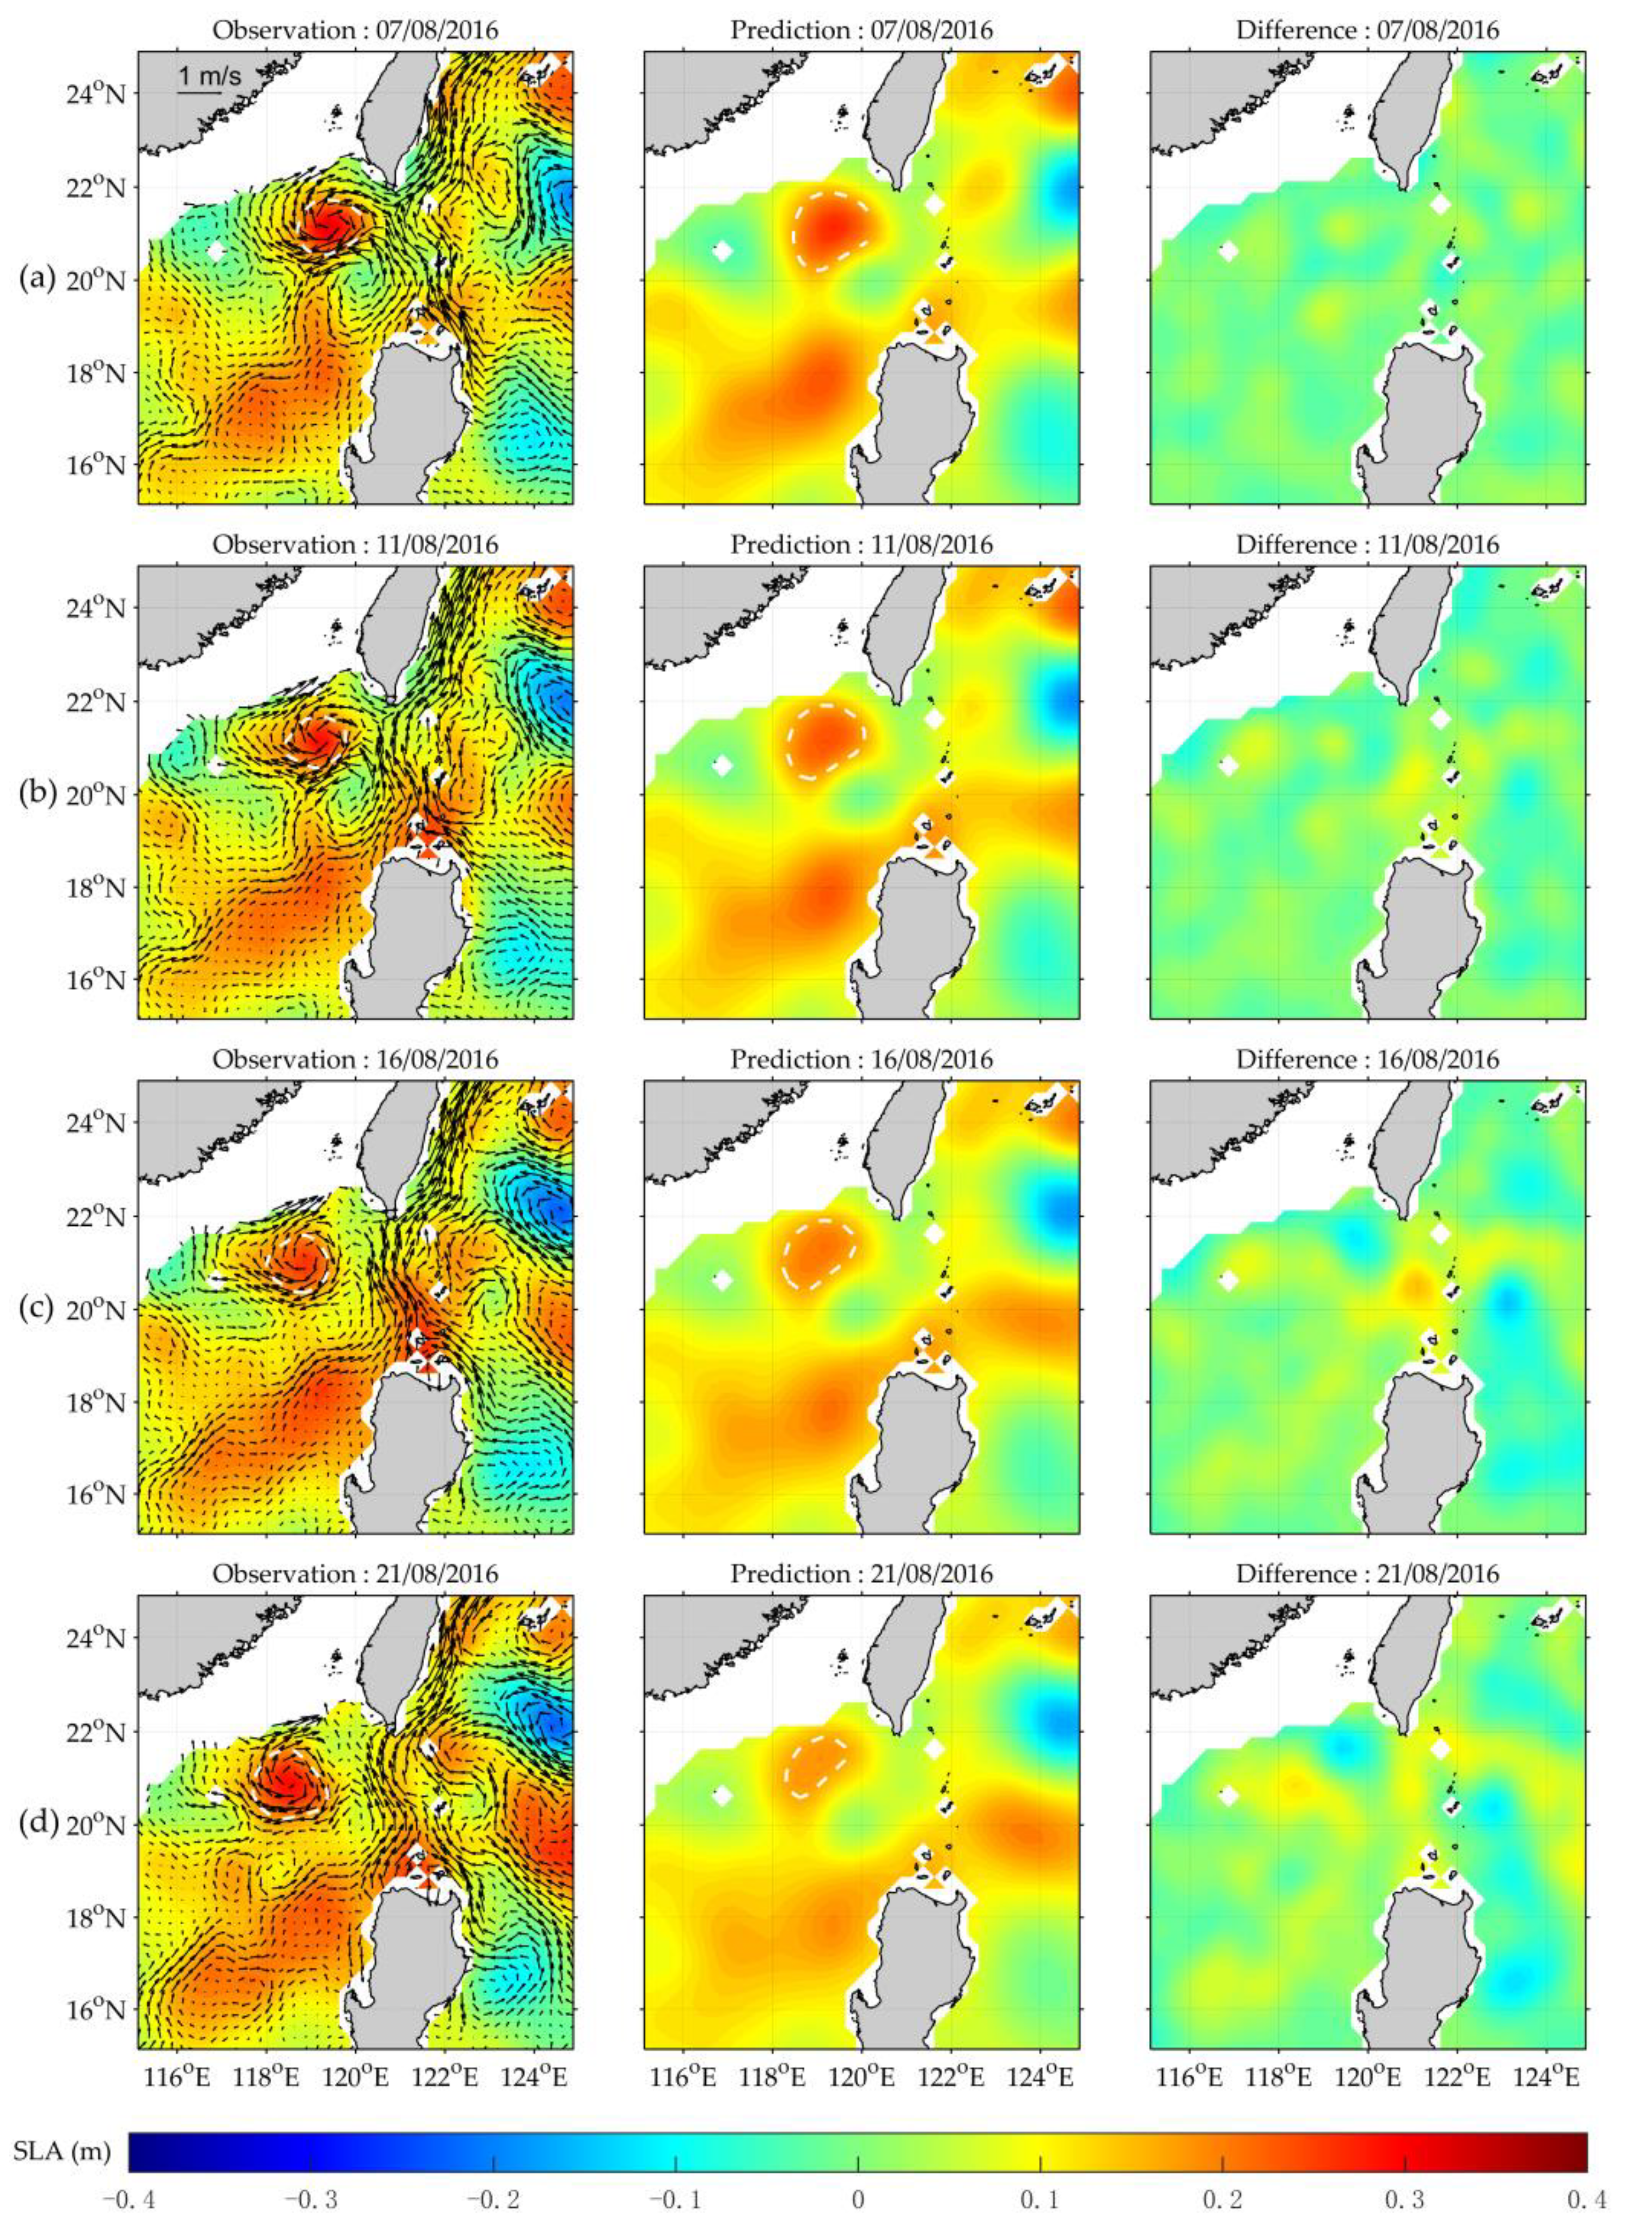
3.3.4. An Abnormal Anticyclonic Eddy and the Strong Loop Path of Kuroshio
4. Discussions about the Influence of Extreme Weather to Prediction Model
5. Conclusions
Author Contributions
Funding
Institutional Review Board Statement
Informed Consent Statement
Data Availability Statement
Acknowledgments
Conflicts of Interest
References
- Wyrtki, K. Physical Oceanography of the Southeast Asian Waters; Naga Report Scientific Results of Marine Investigations of the South China Sea & the Gulf of Thailand; University of California, Scripps Institution of Oceanography: La Jolla, CA, USA, 1961; Volume 2, pp. 1–195. [Google Scholar]
- He, Z.G.; Wang, X.D.; Hu, J.Y. Features of eddy kinetic energy and variations of upper circulation in the South China Sea. Acta Oceanol. Sin. 2002, 21, 305–314. [Google Scholar]
- Li, L.; Wu, B. A Kuroshio loop in South China Sea?-On circulations of the northeastern South China Sea. J. Oceanogr. Taiwan Strait 1989, 8, 89–95. [Google Scholar]
- Chen, G.X.; Hou, Y.J.; Chu, X.Q. Mesoscale eddies in the South China Sea: Mean properties, spatiotemporal variability, and impact on thermohaline structure. J. Geophys. Res. Ocean. 2011, 116, C06018. [Google Scholar] [CrossRef]
- Liu, Z.Y.; Yang, H.J.; Liu, Q.Y. Regional Dynamics of Seasonal Variability in the South China Sea. J. Phys. Oceanogr. 2001, 31, 272–284. [Google Scholar] [CrossRef] [Green Version]
- Lu, E.; Chan, C.L. A Unified Monsoon Index for South China. J. Clim. 1999, 12, 2375–2385. [Google Scholar] [CrossRef]
- Sheu, W.J.; Wu, C.R.; Oey, L.Y. Blocking and Westward Passage of Eddies in the Luzon Strait. Deep-Sea Res. Part II 2010, 57, 1783–1791. [Google Scholar] [CrossRef]
- Zhang, Z.W.; Zhao, W.; Tian, J.W.; Liang, X.F. A mesoscale eddy pair southwest of Taiwan and its influence on deep circulation. J. Geophys. Res. Ocean. 2013, 118, 6479–6494. [Google Scholar] [CrossRef]
- Li, L.; Nowlin, W.D.; Su, J.L. Anticyclonic rings from the Kuroshio in the South China Sea. Deep Sea Res. Part I 1998, 45, 1469–1482. [Google Scholar] [CrossRef]
- He, Y.H.; Cai, S.Q.; Wang, D.X.; He, J.L. A model study of Luzon cold eddies in the northern South China Sea. Deep Sea Res. Part I. 2015, 97, 107–123. [Google Scholar] [CrossRef] [Green Version]
- Chen, Y.L.; Chen, H.Y.; Lin, I.I.; Lee, M.-A.; Chang, J. Effects of cold eddy on phytoplankton production and assemblages in Luzon strait bordering the South China Sea. J. Oceanogr. 2007, 63, 671–683. [Google Scholar] [CrossRef]
- Su, J.Z.; Lu, J.L.; Hou, Y.J.; Fang, G.H.; Wei, Z.X.; Yin, B.S. Analysis of Satellite-tracked Drifting Buoys in the South China Sea. Oceanol. Limnol. Sinica 2002, 33, 121–127. [Google Scholar] [CrossRef]
- Yuan, D.L.; Han, W.Q.; Hu, D.X. Surface Kuroshio path in the Luzon Strait area derived from satellite remote sensing data. J. Geophys. Res. Ocean. 2006, 111, C1107. [Google Scholar] [CrossRef] [Green Version]
- Caruso, M.J.; Gawarkiewicz, G.G.; Beardsley, R.C. Interannual variability of the Kuroshio intrusion in the South China Sea. J. Oceanogr. 2006, 62, 559–575. [Google Scholar] [CrossRef]
- Qiu, B.; Lukas, R. Seasonal and interannual variability of the North Equatorial Current, the Mindanao Current, and the Kuroshio along the Pacific western boundary. J. Geophys. Res. Ocean. 1996, 101, 12315–12330. [Google Scholar] [CrossRef]
- Nan, F.; Xue, H.; Chai, F.; Shi, L.; Shi, M.; Guo, P. Identification of different types of Kuroshio intrusion into the South China. Sea. Ocean Dyn. 2011, 61, 1291–1304. [Google Scholar] [CrossRef]
- Nan, F.; Xue, H.; Fei, Y. Kuroshio intrusion into the South China Sea: A review. Prog. Oceanogr. 2015, 137, 314–333. [Google Scholar] [CrossRef] [Green Version]
- Chu, P.C.; Edmons, N.L.; Fan, C. Dynamical Mechanisms for the South China Sea Seasonal Circulation and Thermohaline Variabilities. J. Phys. Oceanogr. 1999, 29, 2971–2989. [Google Scholar] [CrossRef]
- Metzger, E.J.; Hurlburt, H.E. The Nondeterministic Nature of Kuroshio Penetration and Eddy Shedding in the South China Sea. J. Phys. Oceanogr. 2001, 31, 1712–1732. [Google Scholar] [CrossRef]
- Qu, T. Role of ocean dynamics in determining the mean seasonal cycle of the South China Sea surface temperature. J. Geophys. Res. Ocean. 2001, 106, 6943–6955. [Google Scholar] [CrossRef]
- Centurioni, L.R.; Niiler, P.P.; Lee, D.K. Observations of Inflow of Philippine Sea Surface Water into the South China Sea through the Luzon Strait. J. Phys. Oceanogr. 2004, 34, 113–121. [Google Scholar] [CrossRef]
- Jia, Y.; Liu, Q. Eddy Shedding from the Kuroshio Bend at Luzon Strai. J. Oceanogr. 2004, 60, 1063–1069. [Google Scholar] [CrossRef]
- Shaw, P.-T. The seasonal variation of the intrusion of the Philippine sea water into the South China Sea. J. Geophys. Res. 1991, 96, 821–827. [Google Scholar] [CrossRef]
- Wu, C.R. Interannual modulation of the Pacific Decadal Oscillation (PDO) on the low-latitude western North Pacific. Prog. Oceanogr. 2013, 110, 49–58. [Google Scholar] [CrossRef]
- Sun, Z.B.; Zhang, Z.W.; Qiu, B.; Zhang, X.; Zhou, C.; Huang, X.; Zhao, W.; Tian, J. Three-Dimensional Structure and Interannual Variability of the Kuroshio Loop Current in the Northeastern South China Sea. J. Phys. Oceanogr. 2020, 50, 2437–2455. [Google Scholar] [CrossRef]
- Qiu, D.; Yang, T.; Guo, Z. A west-flowing currene in the northern part of the South China Sea in summer. J. Trop. Oceanogr. 1984, 3, 65–73. [Google Scholar]
- Hu, J.Y.; Kawamura, H.; Hong, H.S.; Qi, Y.Q. A Review on the Currents in the South China Sea: Seasonal Circulation, South China Sea Warm Current and Kuroshio Intrusion. J. Oceanogr. 2000, 56, 607–624. [Google Scholar] [CrossRef]
- Liang, W.-D.; Yang, Y.J.; Tang, T.Y.; Chuang, W.-S. Kuroshio in the Luzon Strait. J. Geophys. Res. Space Phys. 2008, 113, C08048. [Google Scholar] [CrossRef]
- Xiu, P.; Guo, M.; Zeng, L.; Liu, N.; Chai, F. Seasonal and spatial variability of surface chlorophyll inside mesoscale eddies in the South China Sea. Aquat. Ecosyst. Health 2016, 19, 250–259. [Google Scholar] [CrossRef]
- Zhang, Z.W.; Zhao, W.; Qiu, B.; Tian, J.W. Anticyclonic Eddy Sheddings from Kuroshio Loop and the Accompanying Cyclonic Eddy in the Northeastern South China Sea. J. Phys. Oceanogr. 2017, 47, 1243–1259. [Google Scholar] [CrossRef] [Green Version]
- Sun, Z.Y.; Hu, J.Y.; Chen, Z.Z.; Zhu, J.; Yang, L.; Chen, X.; Wu, X. A Strong Kuroshio Intrusion into the South China Sea and Its Accompanying Cold-Core Anticyclonic Eddy in Winter 2020–2021. Remote Sens. 2021, 13, 2645. [Google Scholar] [CrossRef]
- Zeng, X.M.; Li, Y.Z.; He, R.Y. Predictability of the Loop Current Variation and Eddy Shedding Process in the Gulf of Mexico Using an Artificial Neural Network Approach. J. Atmos. Ocean. Technol. 2015, 32, 1098–1111. [Google Scholar] [CrossRef] [Green Version]
- Wang, J.L.; Zhuang, H.; Chérubin, L.M.; Ibrahim, A.K.; Ali, A.M. Medium-Term Forecasting of Loop Current Eddy Cameron and Eddy Darwin Formation in the Gulf of Mexico With a Divide-and-Conquer Machine Learning Approach. J. Geophys. Res. Ocean. 2019, 124, 5586–5606. [Google Scholar] [CrossRef]
- Ying, M.; Zhang, W.; Yu, H.; Lu, X.Q.; Feng, J.X.; Fan, Y.; Zhu, Y.; Chen, D. An overview of the China Meteorological Administration tropical cyclone database. J. Atmos. Ocean. Technol. 2014, 31, 287–301. [Google Scholar] [CrossRef] [Green Version]
- Lu, X.Q.; Yu, H.; Ying, M.; Zhao, B.K.; Zhang, S.; Lin, L.; Bai, L.; Wan, R. Western North Pacific tropical cyclone database created by the China Meteorological Administration. Adv. Atmos. Sci. 2021, 38, 690–699. [Google Scholar] [CrossRef]
- Jolliffe, I.T. Principal Component Analysis. J. Mark. Res. 2002, 87, 513. [Google Scholar]
- Beckers, J.M.; Rixen, M. EOF calculations and data filling from incomplete oceanographic datasets. J. Atmos. Ocean. Technol. 2003, 20, 1839–1856. [Google Scholar] [CrossRef]
- Abdi, H.; Williams, L.J. Principal component analysis. Wiley Interdiscip. Rev. Comput. Stat. 2010, 2, 433–459. [Google Scholar] [CrossRef]
- Dayhoff, J.E.; Deleo, J.M. Artificial neural networks. Cancer Interdiscip. Int. J. Am. Cancer Soc. 2001, 91, 1615–1635. [Google Scholar] [CrossRef]
- Jain, A.K.; Mao, J.; Mohiuddin, K.M. Artificial neural networks: A tutorial. Computer 1996, 29, 31–44. [Google Scholar] [CrossRef] [Green Version]
- Rumelhart, D.E.; Hinton, G.E.; Williams, R.J. Learning Internal Representations by Error Propagation; California Univ San Diego La Jolla Inst fr Cognitive Science: La Jolla, CA, USA, 1985. [Google Scholar]
- Zhang, G.; Patuwo, B.E.; Hu, M.Y. Forecasting with artificial neural networks: The state of the art. Int. J. Forecast. 1998, 14, 35–62. [Google Scholar] [CrossRef]
- Basheer, I.A.; Hajmeer, M. Artificial neural networks: Fundamentals, computing, design, and application. J. Microbiol. Methods 2000, 43, 3–31. [Google Scholar] [CrossRef]
- Oey, L.-Y.; Ezer, T.; Forristall, G.; Cooper, C.; DiMarco, S.; Fan, S. An exercise in forecasting loop current and eddy frontal positions in the Gulf of Mexico. Geophys. Res. Lett. 2005, 32, L12611. [Google Scholar] [CrossRef] [Green Version]
- Murphy, A.H. Skill Scores Based on the Mean Square Error and Their Relationships to the Correlation Coefficient. Mon. Weather Rev. 1988, 116, 2417–2424. [Google Scholar] [CrossRef]
- Chen, Y. Study on Statistical Dynamics-Full Track Synthesis Method for Typhoon Hazard Analysis; Harbin Institute of Technology: Shenzhen, China, 2019. [Google Scholar]
- Xiao, F.J.; Xiao, Z.N. Characteristics of tropical cyclones in China and their impacts analysis. Nat. Hazards 2010, 5, 827–837. [Google Scholar]


| PC No. | PC Percentage (%) | Day 1 | Day 5 | Day 10 | Day 15 | Day 16 | Day 20 | Day 30 |
|---|---|---|---|---|---|---|---|---|
| 7 | 75 | 0.7481 | 0.7418 | 0.7021 | 0.6220 | 0.6030 | 0.5230 | 0.3214 |
| 0.0575 | 0.0583 | 0.0630 | 0.0709 | 0.0725 | 0.0785 | 0.0896 | ||
| 10 | 80 | 0.8035 | 0.7948 | 0.7441 | 0.6532 | 0.6326 | 0.5474 | 0.3432 |
| 0.0747 | 0.0752 | 0.0798 | 0.0866 | 0.0880 | 0.0930 | 0.1017 | ||
| 14 | 85 | 0.8730 | 0.8620 | 0.8016 | 0.6941 | 0.6699 | 0.5724 | 0.3479 |
| 0.0421 | 0.0441 | 0.0533 | 0.0654 | 0.0677 | 0.0753 | 0.0878 | ||
| 20 | 90 | 0.9106 | 0.8971 | 0.8260 | 0.7078 | 0.6823 | 0.5813 | 0.3534 |
| 0.0354 | 0.0383 | 0.0502 | 0.0643 | 0.0668 | 0.0752 | 0.0886 | ||
| 35 | 95 | 0.9545 | 0.9349 | 0.8452 | 0.7120 | 0.6847 | 0.5783 | 0.3444 |
| 0.0254 | 0.0308 | 0.0478 | 0.0640 | 0.0667 | 0.0755 | 0.0889 | ||
| 40 | 96 | 0.9629 | 0.9415 | 0.8453 | 0.7060 | 0.6777 | 0.5944 | 0.3329 |
| 0.0230 | 0.0293 | 0.0477 | 0.0643 | 0.0670 | 0.0759 | 0.0888 |
Publisher’s Note: MDPI stays neutral with regard to jurisdictional claims in published maps and institutional affiliations. |
© 2022 by the authors. Licensee MDPI, Basel, Switzerland. This article is an open access article distributed under the terms and conditions of the Creative Commons Attribution (CC BY) license (https://creativecommons.org/licenses/by/4.0/).
Share and Cite
Kong, Y.; Zhang, L.; Sun, Y.; Liu, Z.; Guo, Y.; Fang, Y. Prediction of Changeable Eddy Structures around Luzon Strait Using an Artificial Neural Network Model. Remote Sens. 2022, 14, 281. https://doi.org/10.3390/rs14020281
Kong Y, Zhang L, Sun Y, Liu Z, Guo Y, Fang Y. Prediction of Changeable Eddy Structures around Luzon Strait Using an Artificial Neural Network Model. Remote Sensing. 2022; 14(2):281. https://doi.org/10.3390/rs14020281
Chicago/Turabian StyleKong, Yuan, Lu Zhang, Yanhua Sun, Ze Liu, Yunxia Guo, and Yong Fang. 2022. "Prediction of Changeable Eddy Structures around Luzon Strait Using an Artificial Neural Network Model" Remote Sensing 14, no. 2: 281. https://doi.org/10.3390/rs14020281
APA StyleKong, Y., Zhang, L., Sun, Y., Liu, Z., Guo, Y., & Fang, Y. (2022). Prediction of Changeable Eddy Structures around Luzon Strait Using an Artificial Neural Network Model. Remote Sensing, 14(2), 281. https://doi.org/10.3390/rs14020281