1. Introduction
Numerical weather prediction (NWP) is important to make an objective and quantitative weather forecast. High quality satellite observations have long been an important source of key observations for NWP, especially for microwave (MW) sounders onboard a polar-orbiting environmental satellite. From the MW sounding unit (MSU) onboard the early television and infrared observation satellite operational vertical sounder (TOVS) to the advanced MW sounding unit-A (AMSU-A) onboard the advanced TOVS (ATOVS), MW temperature sounders have always been considered one of the important components of the global observing system [
1]. Another major advancement from the absence to the later AMSU-B and MW humidity sounder (MHS) is the greater utilization of humidity sensitive channels. The additional humidity information is considered one of the factors for the NWP improvement [
2]. The successor—ATMS, which covers the oxygen and water vapor absorption band, provides information on atmospheric temperature and humidity as well as wind, leading to effective improvements on the initial global field accuracy of NWP.
Similar to ATMS, the Fengyun-3 series equipped with MW sounding instruments is a second-generation polar-orbiting environmental satellite built to meet China’s urgent needs for weather forecasting. The first satellite in this series, FY-3A, was successfully launched in 2008, followed by FY-3B in 2010. They carry the initial generation of four-channel MWTS and five-channel MWHS [
3]. FY-3C is the first payload of China’s operational polar-orbiting environmental satellite, carrying MWTS-II and MWHS-II. FY-3D is also equipped with the same instruments. The channel frequency settings of these two instruments and ATMS are similar. However, MWHS-II has eight additional oxygen absorption channels [
4,
5]. The newly-launched FY-3E is the fifth flight unit of the Fengyun-3 series, which is the world’s first civilian early-morning orbit meteorological satellite [
6]. Similar to the US and Europe, the existing polar-orbiting environmental satellite observations in China are concentrated at around 10:00 a.m. and 2:00 p.m. In every 6-h observation assimilation time window of NWP, there is always a gap in observations from polar satellites, equivalent to 2 to 3 orbits, that prevents full global observation coverage. The FY-3E satellite works synergistically with FY-3C and FY-3D satellites in orbit and can provide complete global coverage for NWP system every 6 h, which effectively improves and enhances the accuracy and timeliness of global numerical weather forecasting.
In order for the further applications of these MW instruments on NWP, the quality assurance of observation data and the characterization of observation errors are the prerequisites. Since microwave sounding instruments are cross-track scanning radiometers, scan angle-dependent bias and striping noise are the main concerns of the evaluation. One of the things to note is the significant biases of FY-3A MWTS caused by the shifts of channel passband frequency and the nonlinearity [
1,
7]. Zou et al. [
8] also found notable MWTS biases variations related to earth scene brightness temperature. After variational bias correction, the impact of FY-3A data in the NWP system was neutral to slightly positive [
9]. Similar evaluations were performed for the FY-3B MW instruments. Strong latitudinal dependence and asymmetric angular dependent bias for the MWTS channel were found [
3]. The noise equivalent delta temperature (NEDT) of MWHS is higher compared to the similar MW Humidity Sounder (MHS) on board MetOp-B. The newly-added channels show some air-mass dependent biases for the evaluations for FY-3C [
10]. In the case of FY-3D, the performance of these newly-added 118-GHz channels is better than that for water vapor channels [
4]. The performance of FY-3D temperature sounding channels was improved compared to FY-3C [
11]. Similar to the performance of the FY-3B MWTS instrument, the MWTS-II also exhibits asymmetrical patterns through the scan angle-dependent bias [
12] and a clear striping pattern [
13]. The MWTS-II onboard FY-3D has no significant improvements compared to FY-3C [
11].
Satellite MW observation was successfully assimilated in NWP. Together with a high-resolution infrared sounder, it is the top contributor to improve the accuracy of NWP and is utilized operationally in the current data assimilation system. In general, most improvements are exhibited by the use of MW data under clear sky conditions. The current efforts to assimilate MW radiance are focused on the exploitation of increasing MW observation and enhancing the use in all-sky conditions and over all surface types [
14]. To exploit MW observation effectively, the study on assimilation in NWP was carried out. There are several key technologies, including observation operator, bias correction, quality control and so on, associated with intimate satellite data assimilation to exploit these observations effectively [
14,
15]. The fast radiative transfer (RT) model, as the observation operator, simulates the radiances from the NWP model state and obtains the observation innovation. Two fast RT models, RTTOV and CRTM developed by the NWP SAF of EUMETSAT [
16] and JCSDA [
17], respectively, are used predominantly in NWP satellite data assimilation. Instead of RTTOV, CMA-GFS is turning to use the Advanced Radiative Transfer Modeling System (ARMS) developed in CMA [
18,
19].
It is necessary to select and adjust the assimilation strategies according to the characteristics and quality of the new satellite observations. Bias correction is performed to correct systematic biases in observations. It was found that bias varies significantly with scan angle in FY MW temperature observations. Cloud detection is another key step in quality control. FY-3D MWTS-II lacks two key window channels, making it hard to perform quality control. Li et al. [
13] applied the cloud fraction product of a visible and infrared radiometer (VIRR) for MWTS-II assimilation. However, due to the different characteristics of infrared and MW, this may lead to misclassification of clouds. Han and Dong et al. produced the synthetic channels at 23.8 GHz and 31.4 GHz through machine learning and used them for cloud detection [
20,
21]. With the same channel setting, it allows the application of a physical retrieval algorithm for the cloud liquid water path for FY-3E MW sounders [
22]. In addition, Han et al. [
23] developed a cloud emission and scattering index (CESI) for cloud detection at different vertical levels. It is proven to have some advantages in comparison with the traditional scheme, but so far, it was not applied and evaluated in operational NWP.
For the first application of MW sounders onboard an early-morning orbit satellite, the first consideration is the assessment of the instrument quality. The assessment scheme used in this paper is the double-difference method with final (FNL) reanalysis data produced by the National Center for Environmental Prediction (NCEP) Global Forecast System (GFS), which can directly reflect the biases between compared datasets [
5]. Then, the impact of the data on NWP is evaluated in the CMA-GFS system. This paper reports on the comparison of FY-3E instruments with their predecessors on FY-3D and with ATMS instruments. The structure of the article is as follows:
Section 2 describes the instrument characteristics;
Section 3 presents the results of data quality assessments. In
Section 4, the analysis for assimilation experiments results is shown;
Section 5 gives the conclusions.
2. Instrument Characteristics
FY-3E is equipped with an MW temperature and humidity sounder. FY-3E MWHS-II inherits the instrument characteristics of the previous instruments onboard FY-3D, a 15-channel cross-track scanning radiometer. The instrument focuses on improving radiation calibration accuracy, detection sensitivity and service life. MWHS-II has 8 channels for atmospheric temperature detection near the oxygen absorption line at 118.75 GHz, compared to ATMS (
Table 1). These channels, combined with the humidity detection channels around 183 GHz and two window channels, can obtain atmospheric humidity and a temperature vertical distribution profile, precipitation detection and other products. There is no change in the channel frequency setting except for the minor adjustment of the frequency of MWHS-II channel 10. It is worth noting that although the five channels at 183 GHz are set at the same frequency, the bandwidth at 183.31 ± 1.8 GHz is slightly different than the ATMS settings [
4]. The smaller bandwidth makes it more sensitive to water vapor at a certain height in the troposphere, due to the narrower range of weighting function peaks. However, it also means the instrument has less sensitivity and higher NEDT.
FY-3E MWTS-III has an upgrade from the FY-3D MWTS-II instrument. Based on the previous one, the instrument was increased to 17 channels with 4 additional channels of 23.8 GHz, 31.4 GHz, 53.246 ± 0.08 GHz and 53.948 ± 0.081 GHz. The combination of newly-added 23.8 GHz and 31.4 GHz channels can compensate for the previous FY-3D instruments’ inability to apply the cloud liquid water algorithm for quality control in the Gridpoint Statistical Interpolation (GSI) system. In addition, the 53.246 ± 0.08 GHz and 53.948 ± 0.081 GHz channels complement each other well for temperature detection at 4 km and 6 km altitude in the troposphere. Unlike the channel for FY-3D, Channel 7 for FY-3E MWTS-III changed to double side bands. In addition, the scanning angle range of MWTS-III was expanded compared to ATMS, and the corresponding local zenith angle could reach 70°. This feature allows the instrument to obtain more observations. Along each scan line, MWTS-III has a total of 98 fields of view (FOV), an increase compared to the ATMS (96). A detailed comparison of these characteristics is given in
Table 2. The polarization information in
Table 1 and
Table 2 are obtained from the official website of the National Satellite Meteorological Center (see in
http://www.nsmc.org.cn/nsmc/cn/instrument/MWTS-3.html and
http://www.nsmc.org.cn/nsmc/en/instrument/MWHS-2.html, accessed on 20 September 2022).
The polarization of each channel is a fundamental feature of the instrument and has a great impact on the subsequent simulations and applications. For further applications, the polarization of FY-3E microwave instruments is an issue of concern. According to previous studies [
24,
25], non-ideal antenna reflector emissivity can result in significant cross-scan biases in the measured brightness temperatures. Furthermore, ocean emissivity is strongly polarization-dependent, and therefore, the polarization response of the instrument needs to be modeled correctly.
For cross-track scanning radiometers, two types of polarization, quasi-horizontal (Qh) and quasi-vertical (Qv), are usually included. The radiances for Qv and Qh channels are derived from the Hagen–Rubens equation [
26], as follows:
where
and
are the radiance contributed from the reflector emitted radiation.
and
are the quasi-V and -H radiances.
and
are the radiation component at pure vertical polarization and horizontal polarization.
and
are the third Stokes component and the radiance emitted from reflector, respectively.
and
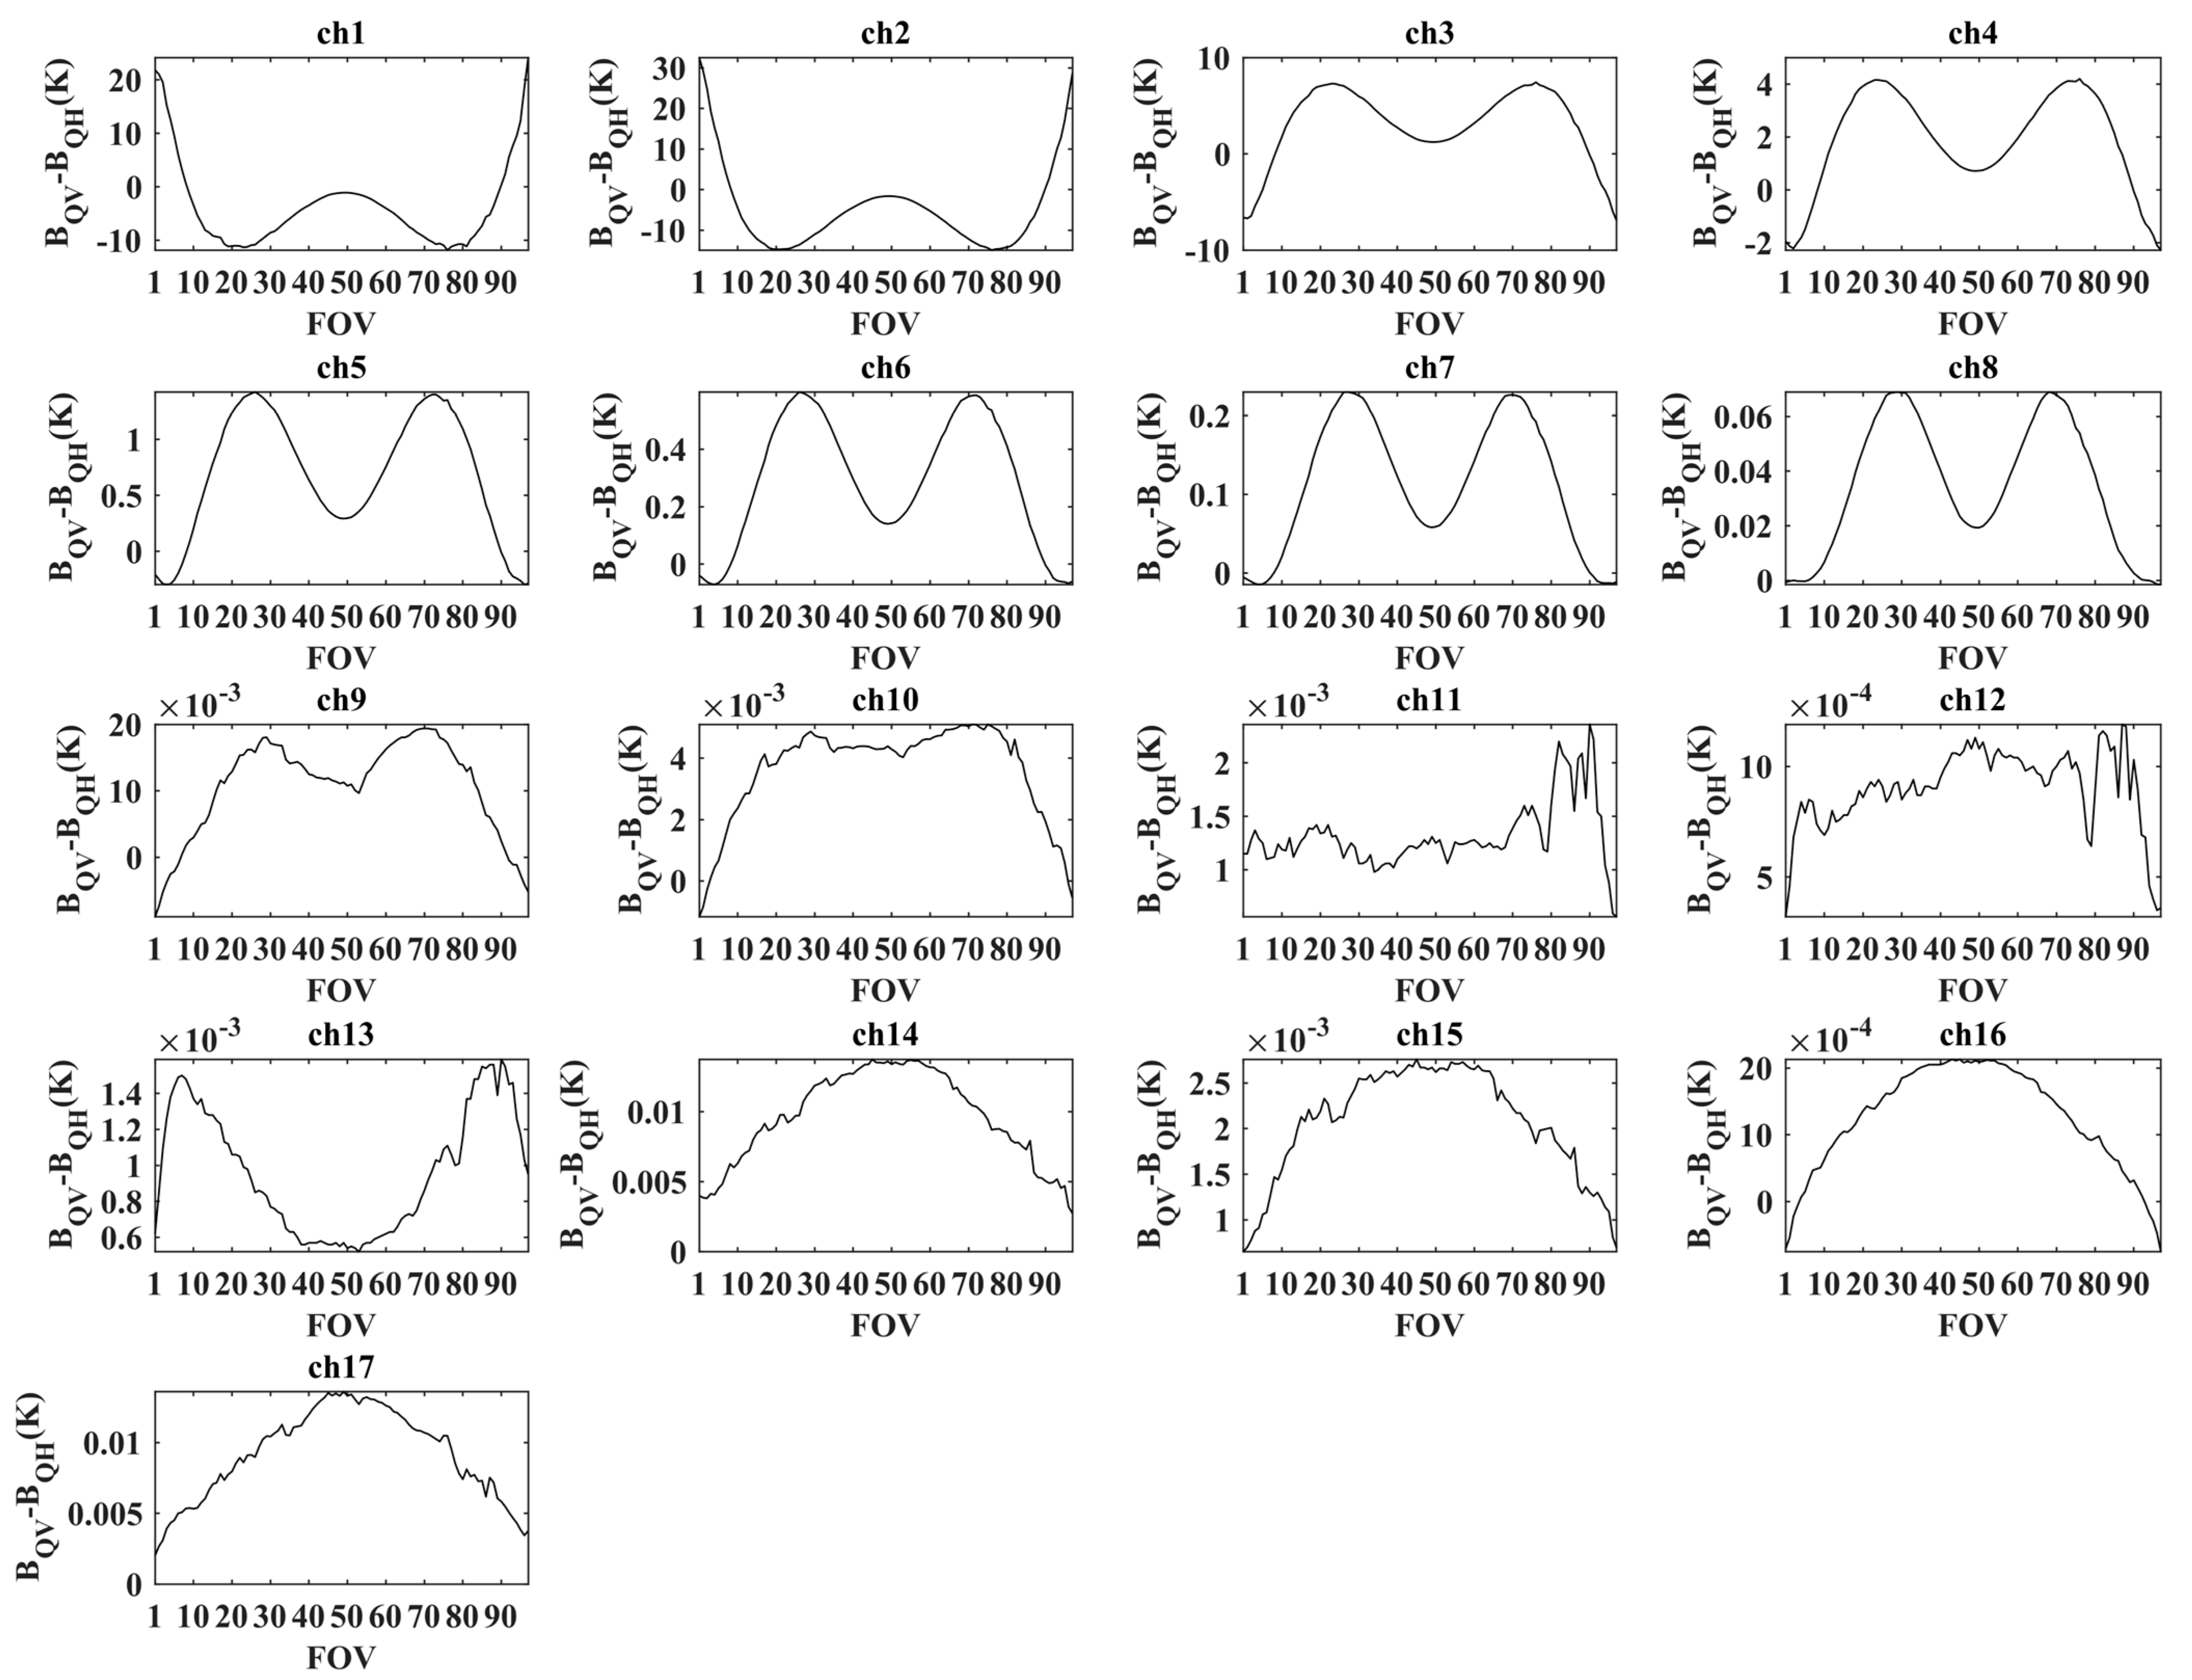
are the emissivity of the reflector at vertical and horizontal polarization. From the Equation above, all Qv channels have a sinusoidal square function, and all Qh channels have a cosine square function, which exactly explains why the figures have this shape.
For ATMS, the pitch maneuver data under cold space background can reflect the scan-angle-dependent bias of instrument [
24]. However, this phenomenon can also be identified by the difference between observations and simulations (O minus B, O−B) under clear sky. Due to the lack of pitch maneuver data, the O−B results under a clear ocean scene are considered for discussion. According to the initial polarization information provided by the National Satellite Meteorological Center, the clear-sky simulation bias is shown in
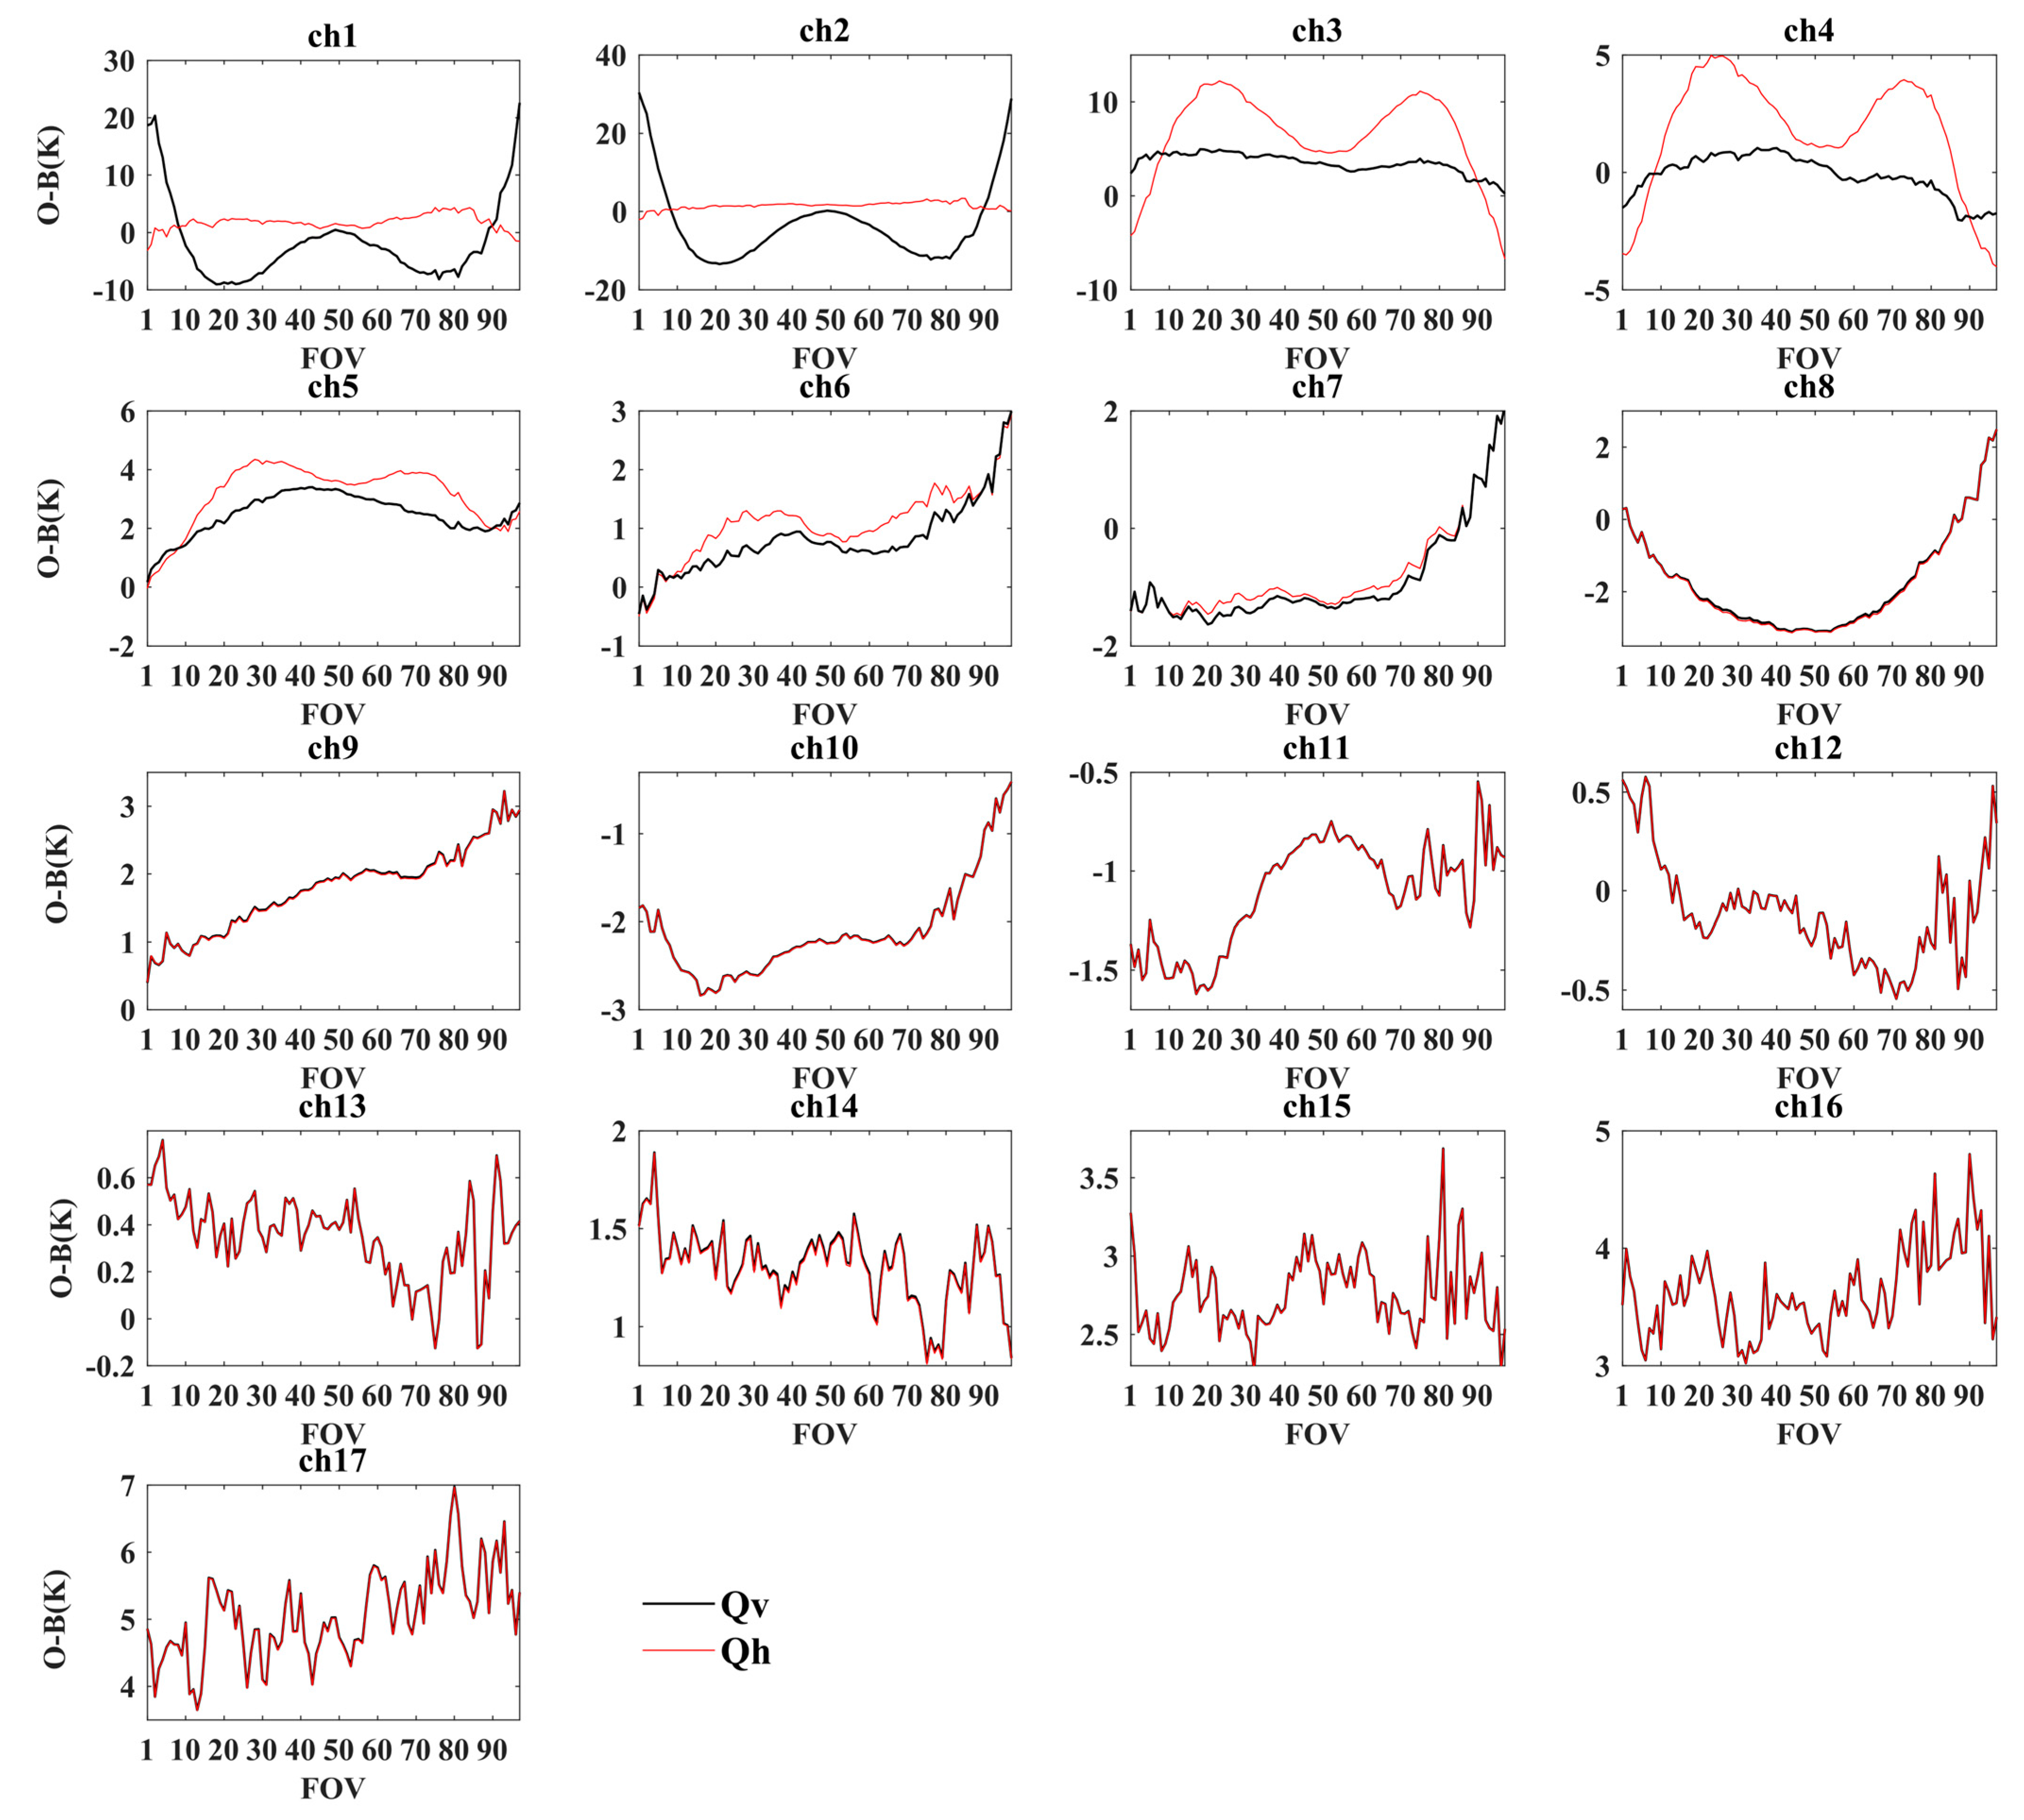
Figure 1, taking FY-3E MWTS-III as an example. The
x-axis contains the instrument FOV numbers and the middle one contains the nadir point. In the figure, the initial polarization of channels 1 and 2 is Qv, hence, the graph shows a significant upward ‘W’ shape. The initial polarization of channels 3 and 4 is Qh, so the graph exhibits a significant downward ‘M’ shape. Interestingly, the O−B results for most channels are shown as asymmetric patterns. Channels 6 to 10 have a maximum value at the right edge of scan position, while the position of the minimum is almost to the left of the nadir position. The striping noise due to the variation of the scan position is still evident in the figure. Overall, the O−B results of the remaining channels are basically reasonable, except for the first four channels. Although the first four channels show the corresponding patterns according to the polarization, the biases are large, with channels 1 and 2 even up to 30 K.
To further understand the huge angular dependent bias of the first four channels, we analyze the bias according to the different polarizations as well. The red line shows the results for Qv and the black for Qh. Polarization variations mainly affect the channels with lower weighting function peak. This is also shown in
Figure 2. The simulation differences due to polarization in channels 1–7 are more obvious, especially in channels 1–4. The same phenomenon is also shown in
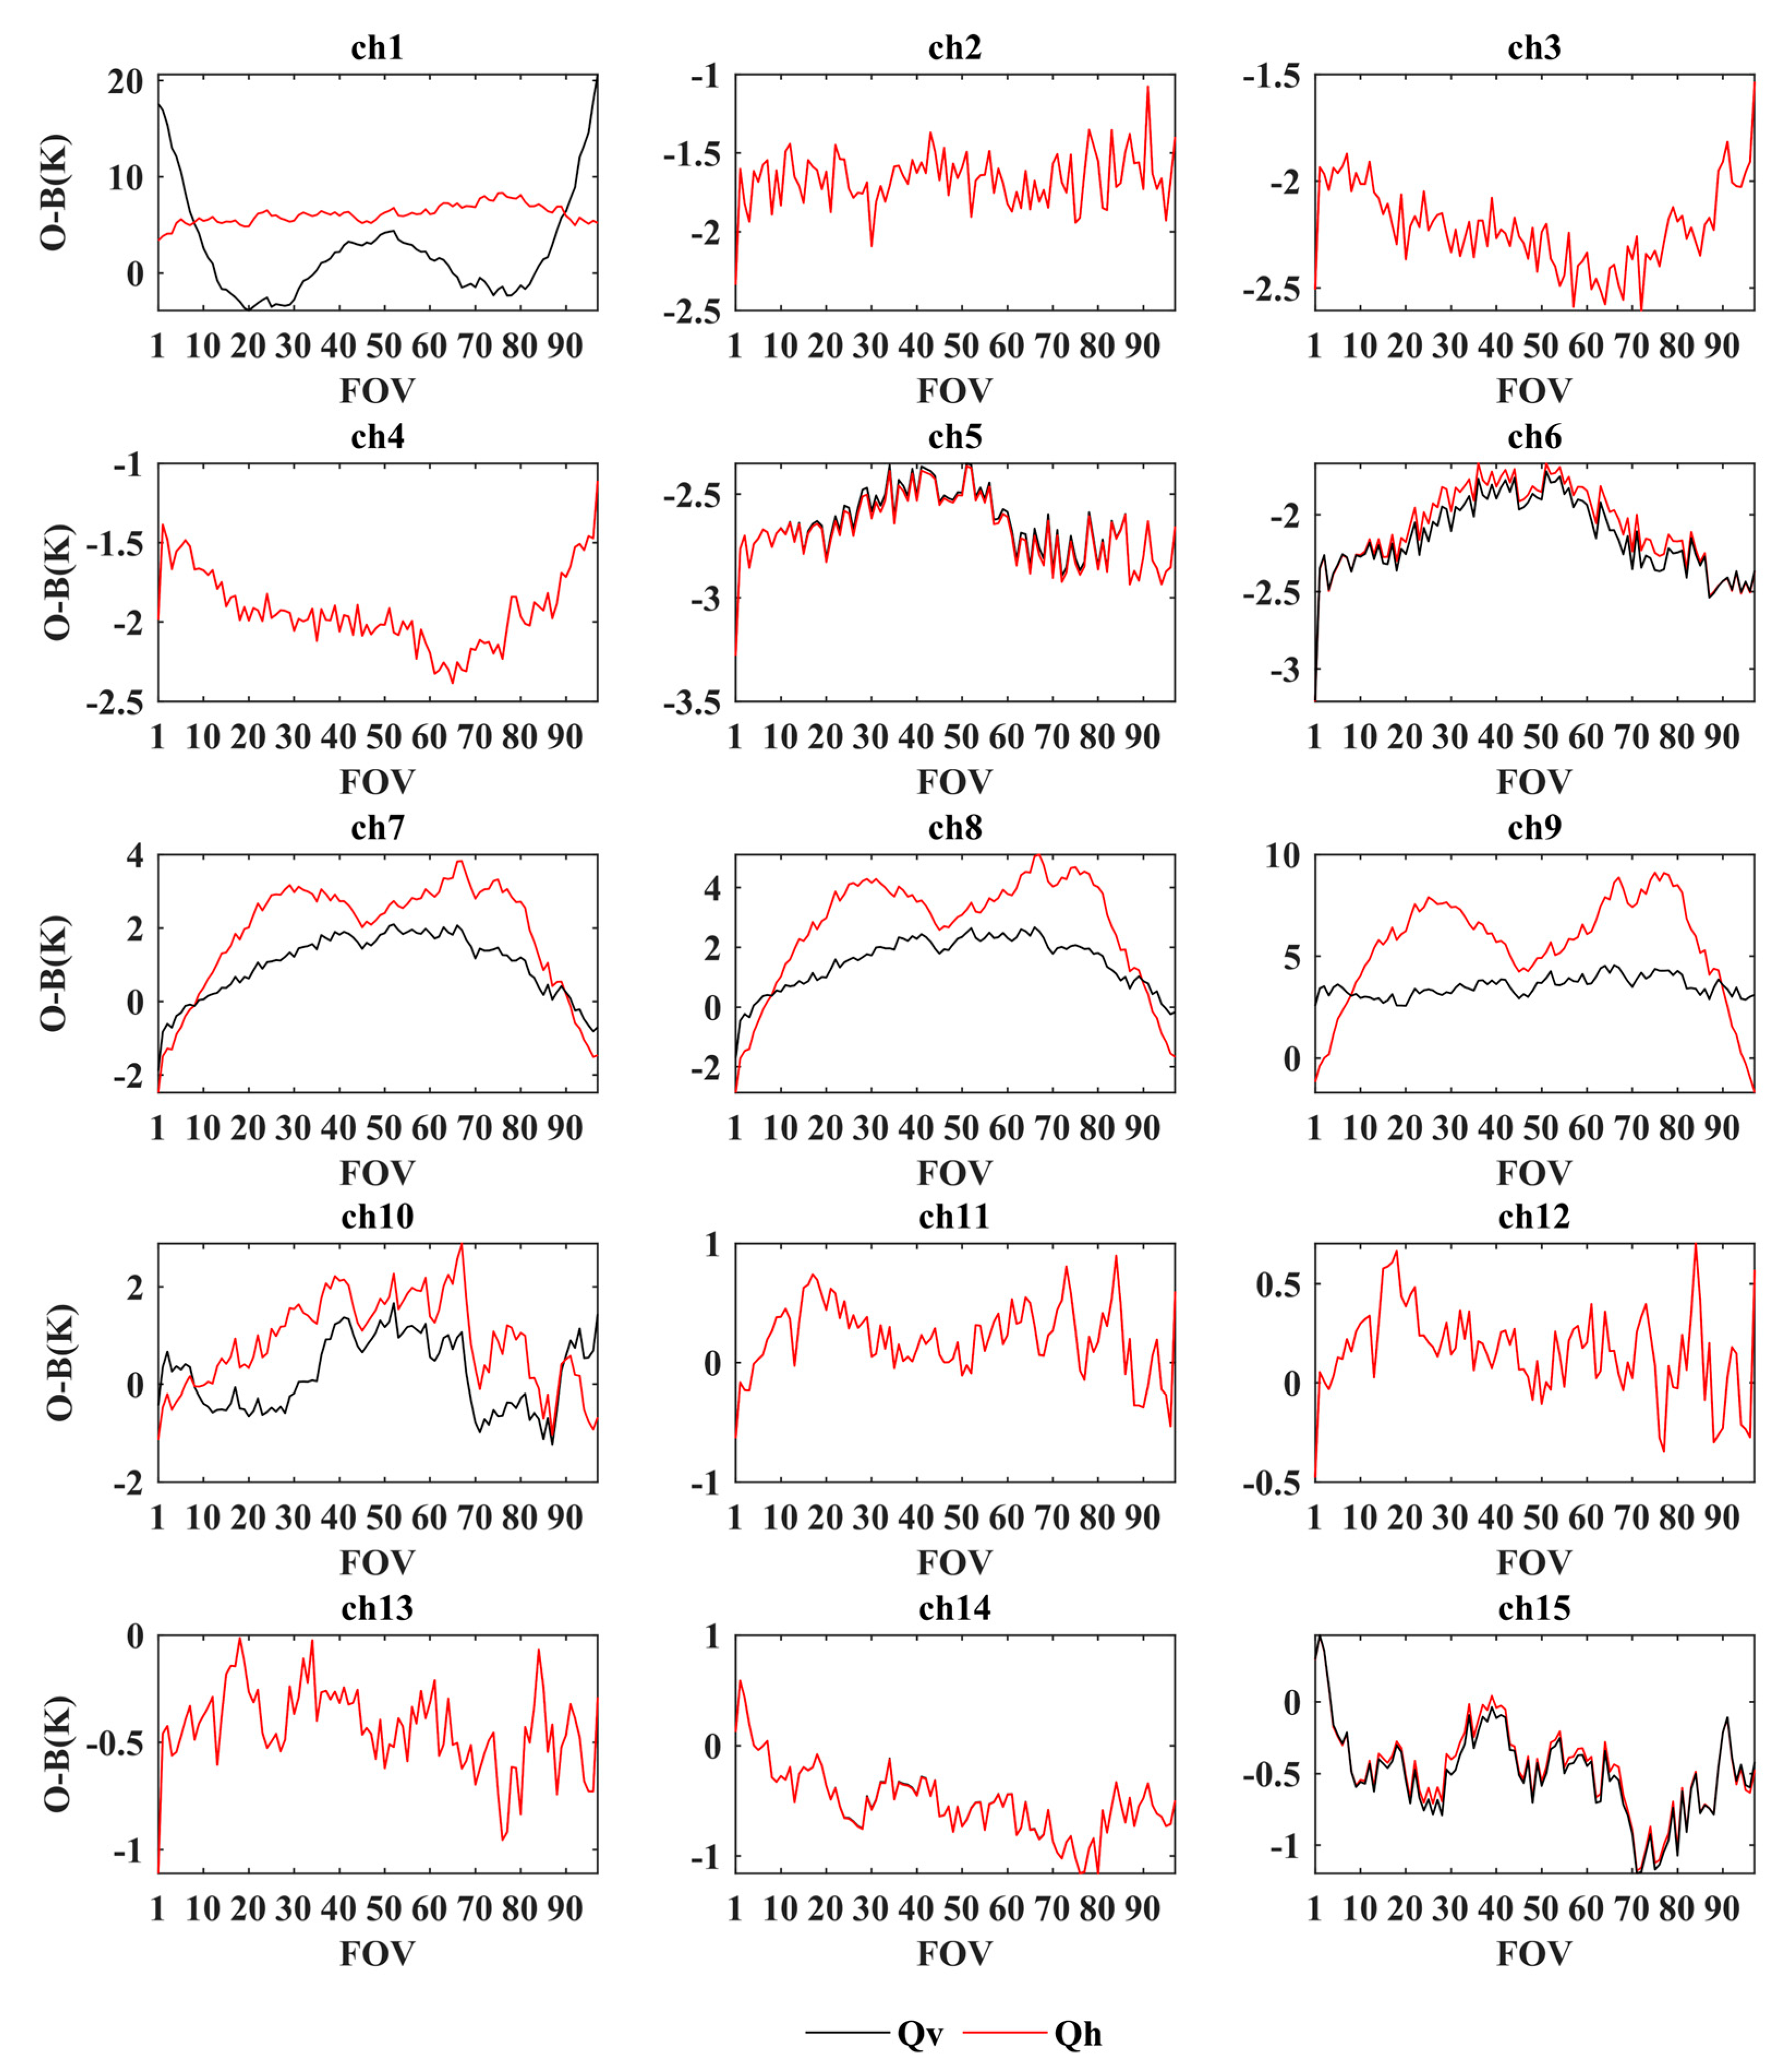
Figure 3. After the polarization reversal, the angular dependent bias of the MWHS-II channels is also significantly reduced as the results in the case of the MWTS-III channels.
Combined with the above theory, the opposite polarization has a clear difference in the pattern. Simultaneously, the shape change is accompanied by a corresponding reduction in the scan-angle-dependent bias to a reasonable range. Specifically for channels 1 and 2, the graphs coincide with the polarization characteristics. When the channel polarization is Qv, the angle-dependent bias of the instrument exceeds 20 K, which is unreasonable. The deviation under Qh polarization, however, is more plausible. Similarly, the change in polarization resulted in a significant reduction in the angular dependent characteristics of channels 3–6. However, perhaps influenced by other factors, the change in polarization is not shown in the patterns. However, considering the follow-up simulations, it is still believed that the polarization of MWTS channels should all be reversed, as well as MWHS. However, considering the follow-up simulations, it is believed that the actual polarization used in the radiative transfer model for MWTS-III, channels 1 and 2 are Qh and the remaining channels are Qv. For MWHS-II, channels 1 and 10 are Qh and the remaining channels are Qv.
3. Assessment of Data Quality
A thorough quality assessment and bias analysis is required before new instrument information can be entered into the NWP system. Based on the above comparison of the basic instrument characteristics between the FY-3E, FY-3D and ATMS, the simulation bias characteristics are further compared.
ARMS is the new-generation of fast radiative transfer models independently developed by China [
18]. It is becoming an important tool for domestic satellite research and applications [
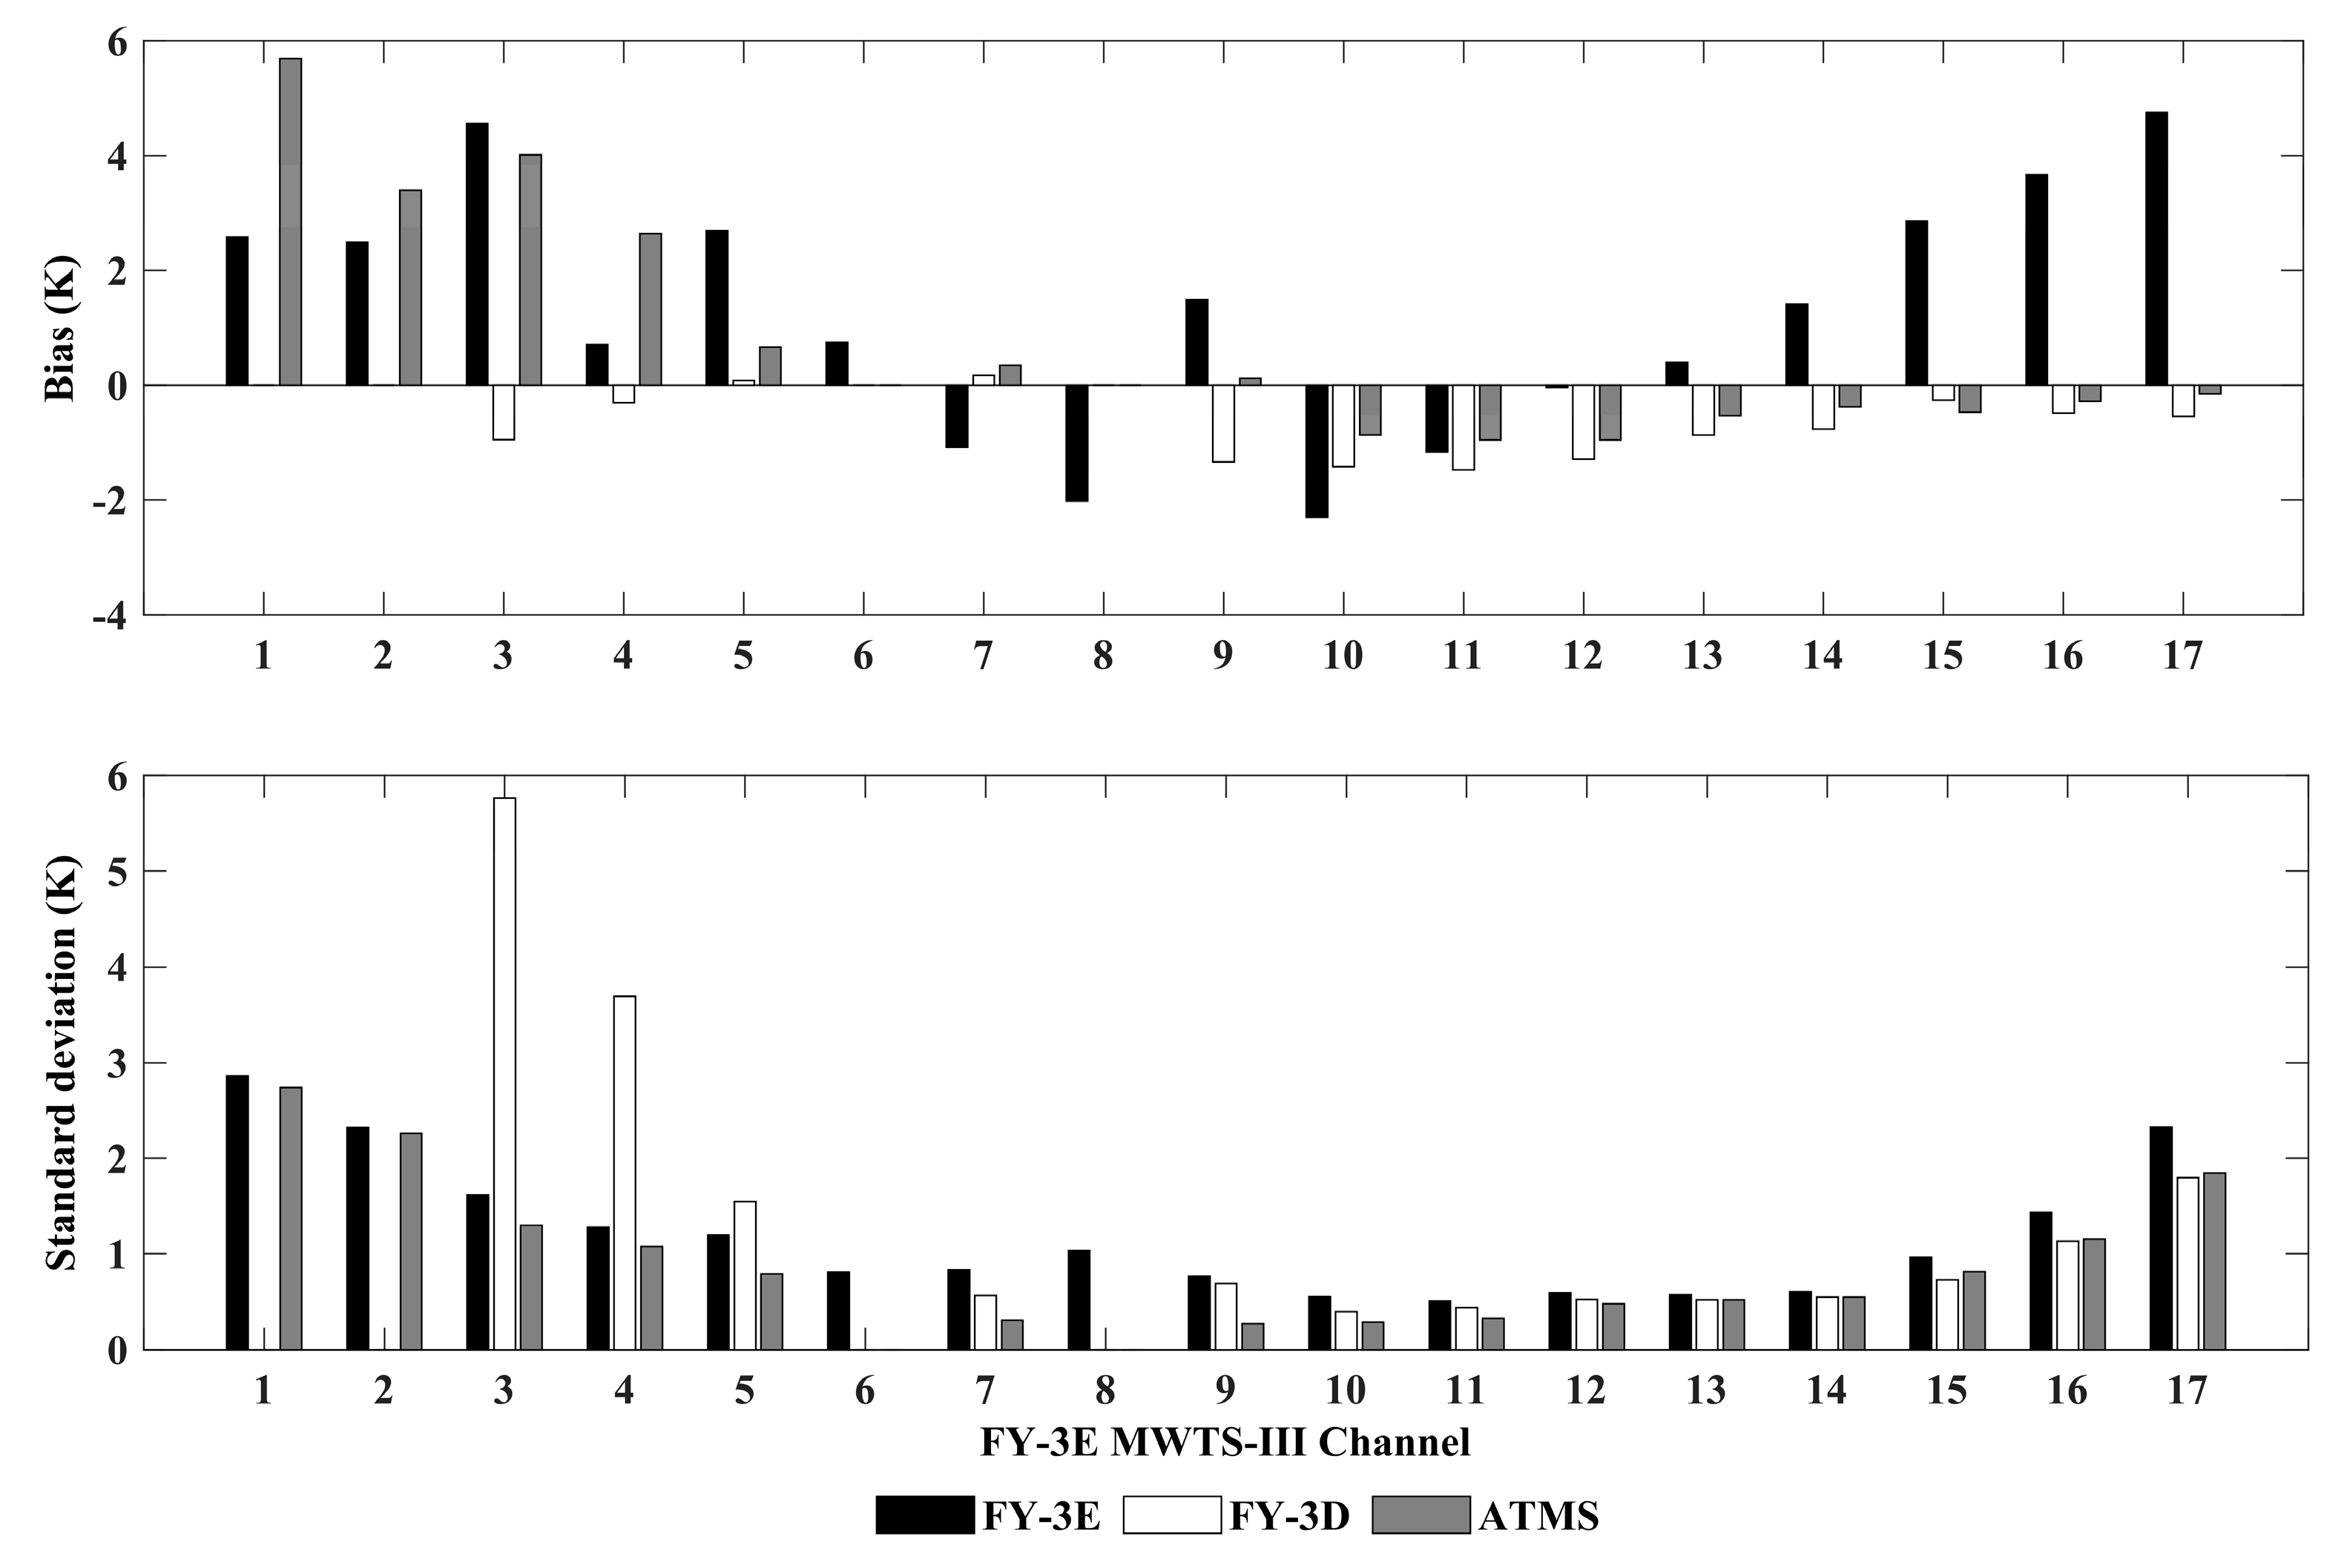
27]. The simulations are conducted by ARMS with FNL gridded analysis data as inputs. To minimize model errors and the effect of surface emissivity, subsequent simulations use only points on the ocean surface under clear sky conditions. The cloud mask products of the FY-4A Advanced Geostationary Radiation Imager (AGRI) are used for cloud detection. Due to the difference in resolution, the FOV of MW sounders is clear if more than 95% of the matched points within the FOV are clear. The evaluation time period was from 15 July 2021 to 15 August 2021, over 30 days. The FNL data in the above time period between 55°S and 55°N provide the required pressure, temperature, humidity and wind information for the ARMS simulation. The polarization of the channels is based on the results discussed in the previous section. The error statistics for the observation and simulation of equivalent channels are shown in
Figure 1. The
x-axis coordinate on the graph is the channel number of the FY-3E instrument.
For the two newly added window channels of MWTS-III, the bias is lower than the equivalent channels of ATMS, while the standard deviation is slightly higher (
Figure 4). For other equivalent channels, the standard deviation of MWTS-III is higher than that of ATMS. In the comparison of the same channel with the FY-3D, the performance of FY-3E is relatively poor for most channels. During the assessment, only the bias of channel 11–13 is slightly lower than that of FY-3D. The bias of channel 12 to 17 gradually increases from 0.02 K to 4.89 K. Although the standard deviation of the channels varies between instruments, the standard deviation of all instruments is larger in the surface sensitive channel and the upper stratosphere channel. This conclusion is consistent with the article by Carminati et al. [
5]. However, the standard deviation of FY-3D MWTS-II channels 3 and 4 is significant. The difference between the two instruments is up to 4 K. It is noted that the bias values of O−B are larger than the mean bias of the FY-3D instrument evaluated by Carminati et al. [
5].
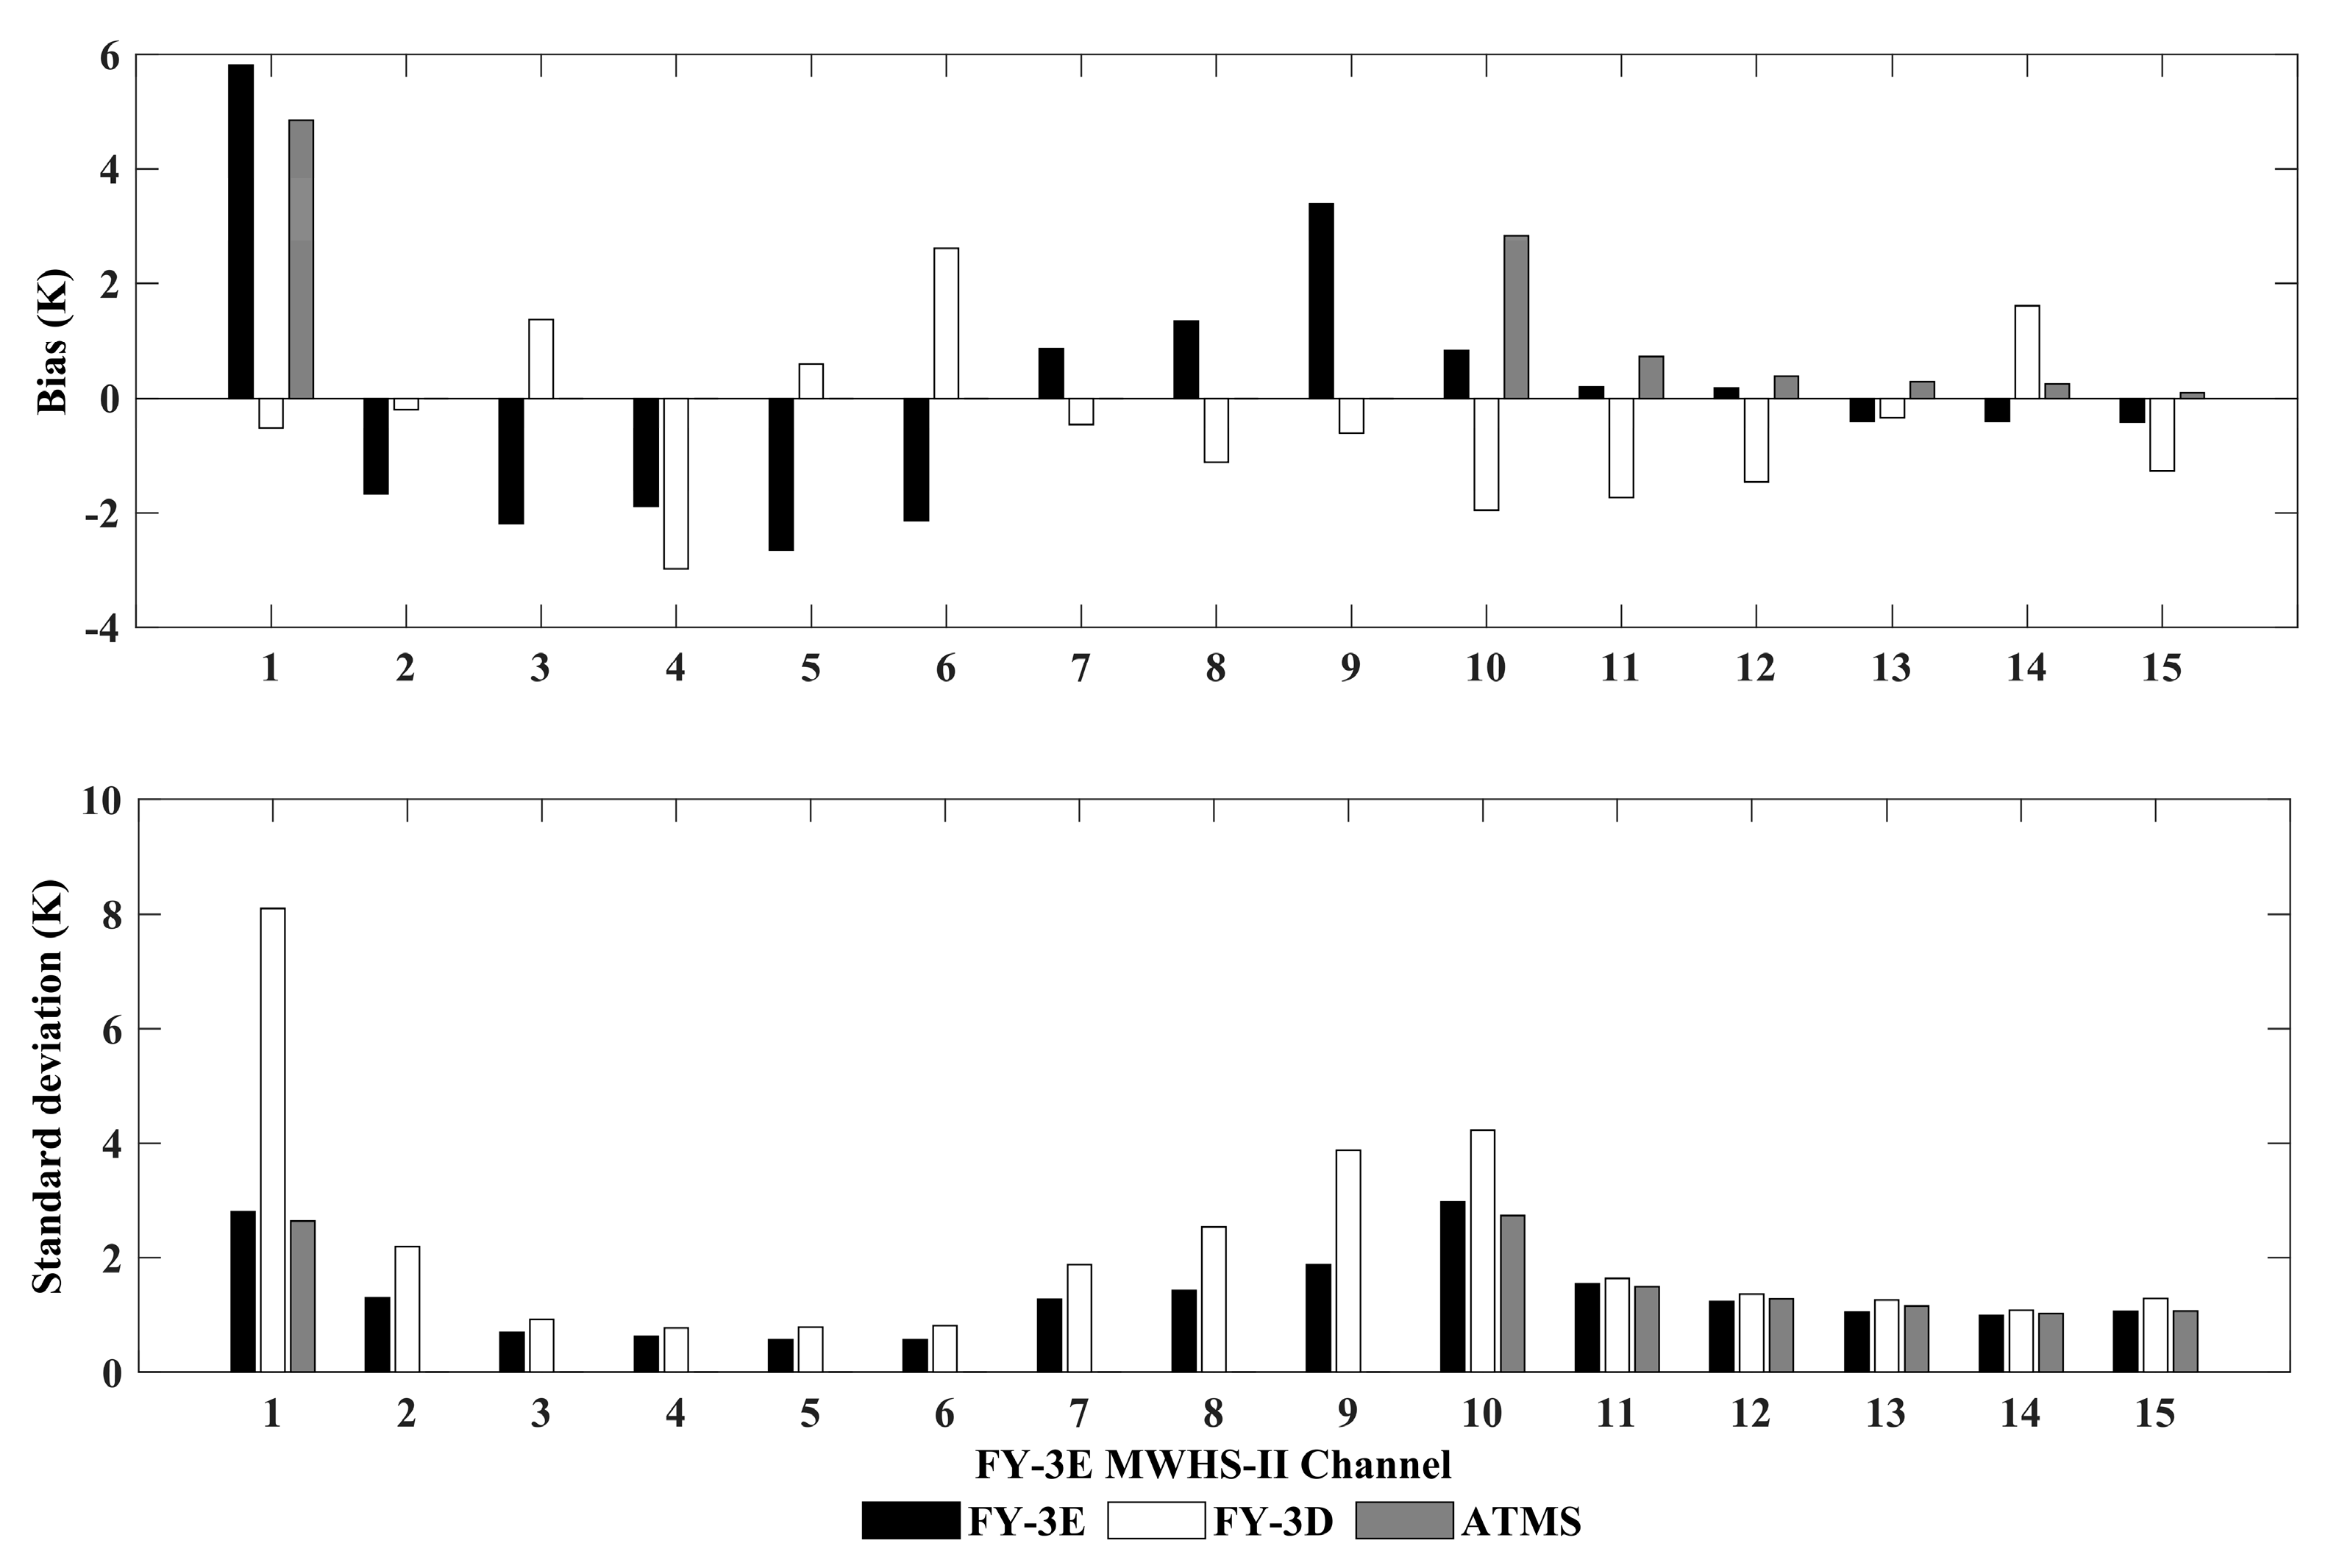
The global mean clear-sky O−B bias and standard deviation for the MW humidity sounder over ocean are statistically represented in the
Figure 5. The FY-3E, FY-3D MWHS-II and equivalent channels at ATMS are considered. Except for channels 10–12, the bias of ATMS is lower than that of FY-3E MWHS-II for all channels. In the water vapor absorption channels 11–15, the standard deviation of FY-3E is smaller than that of FY-3D and ATMS. The difference between the equivalent channels of the three instruments is small. Similar to the above assessment results, FY-3D MWHS-II performed poorly in the window and near-surface channels, especially for channel 1 (89 GHz). It is presumed that the data quality of FY-3D has decreased during the simulated time period compared to previous studies.
Overall, the accuracy of each channel for FY-3E MWHS-II is improved compared to the FY-3D and is close to that of the ATMS. In the water vapor absorption channels (channels 11–15), the standard deviation of FY-3E is smaller than that of FY-3D and ATMS. The values of standard deviation are almost similar for the three instruments. For the 118 GHz channels (MWTS channels 2 to 9), it is worth noting that theFY-3E instrument has an improved performance in terms of standard deviation.
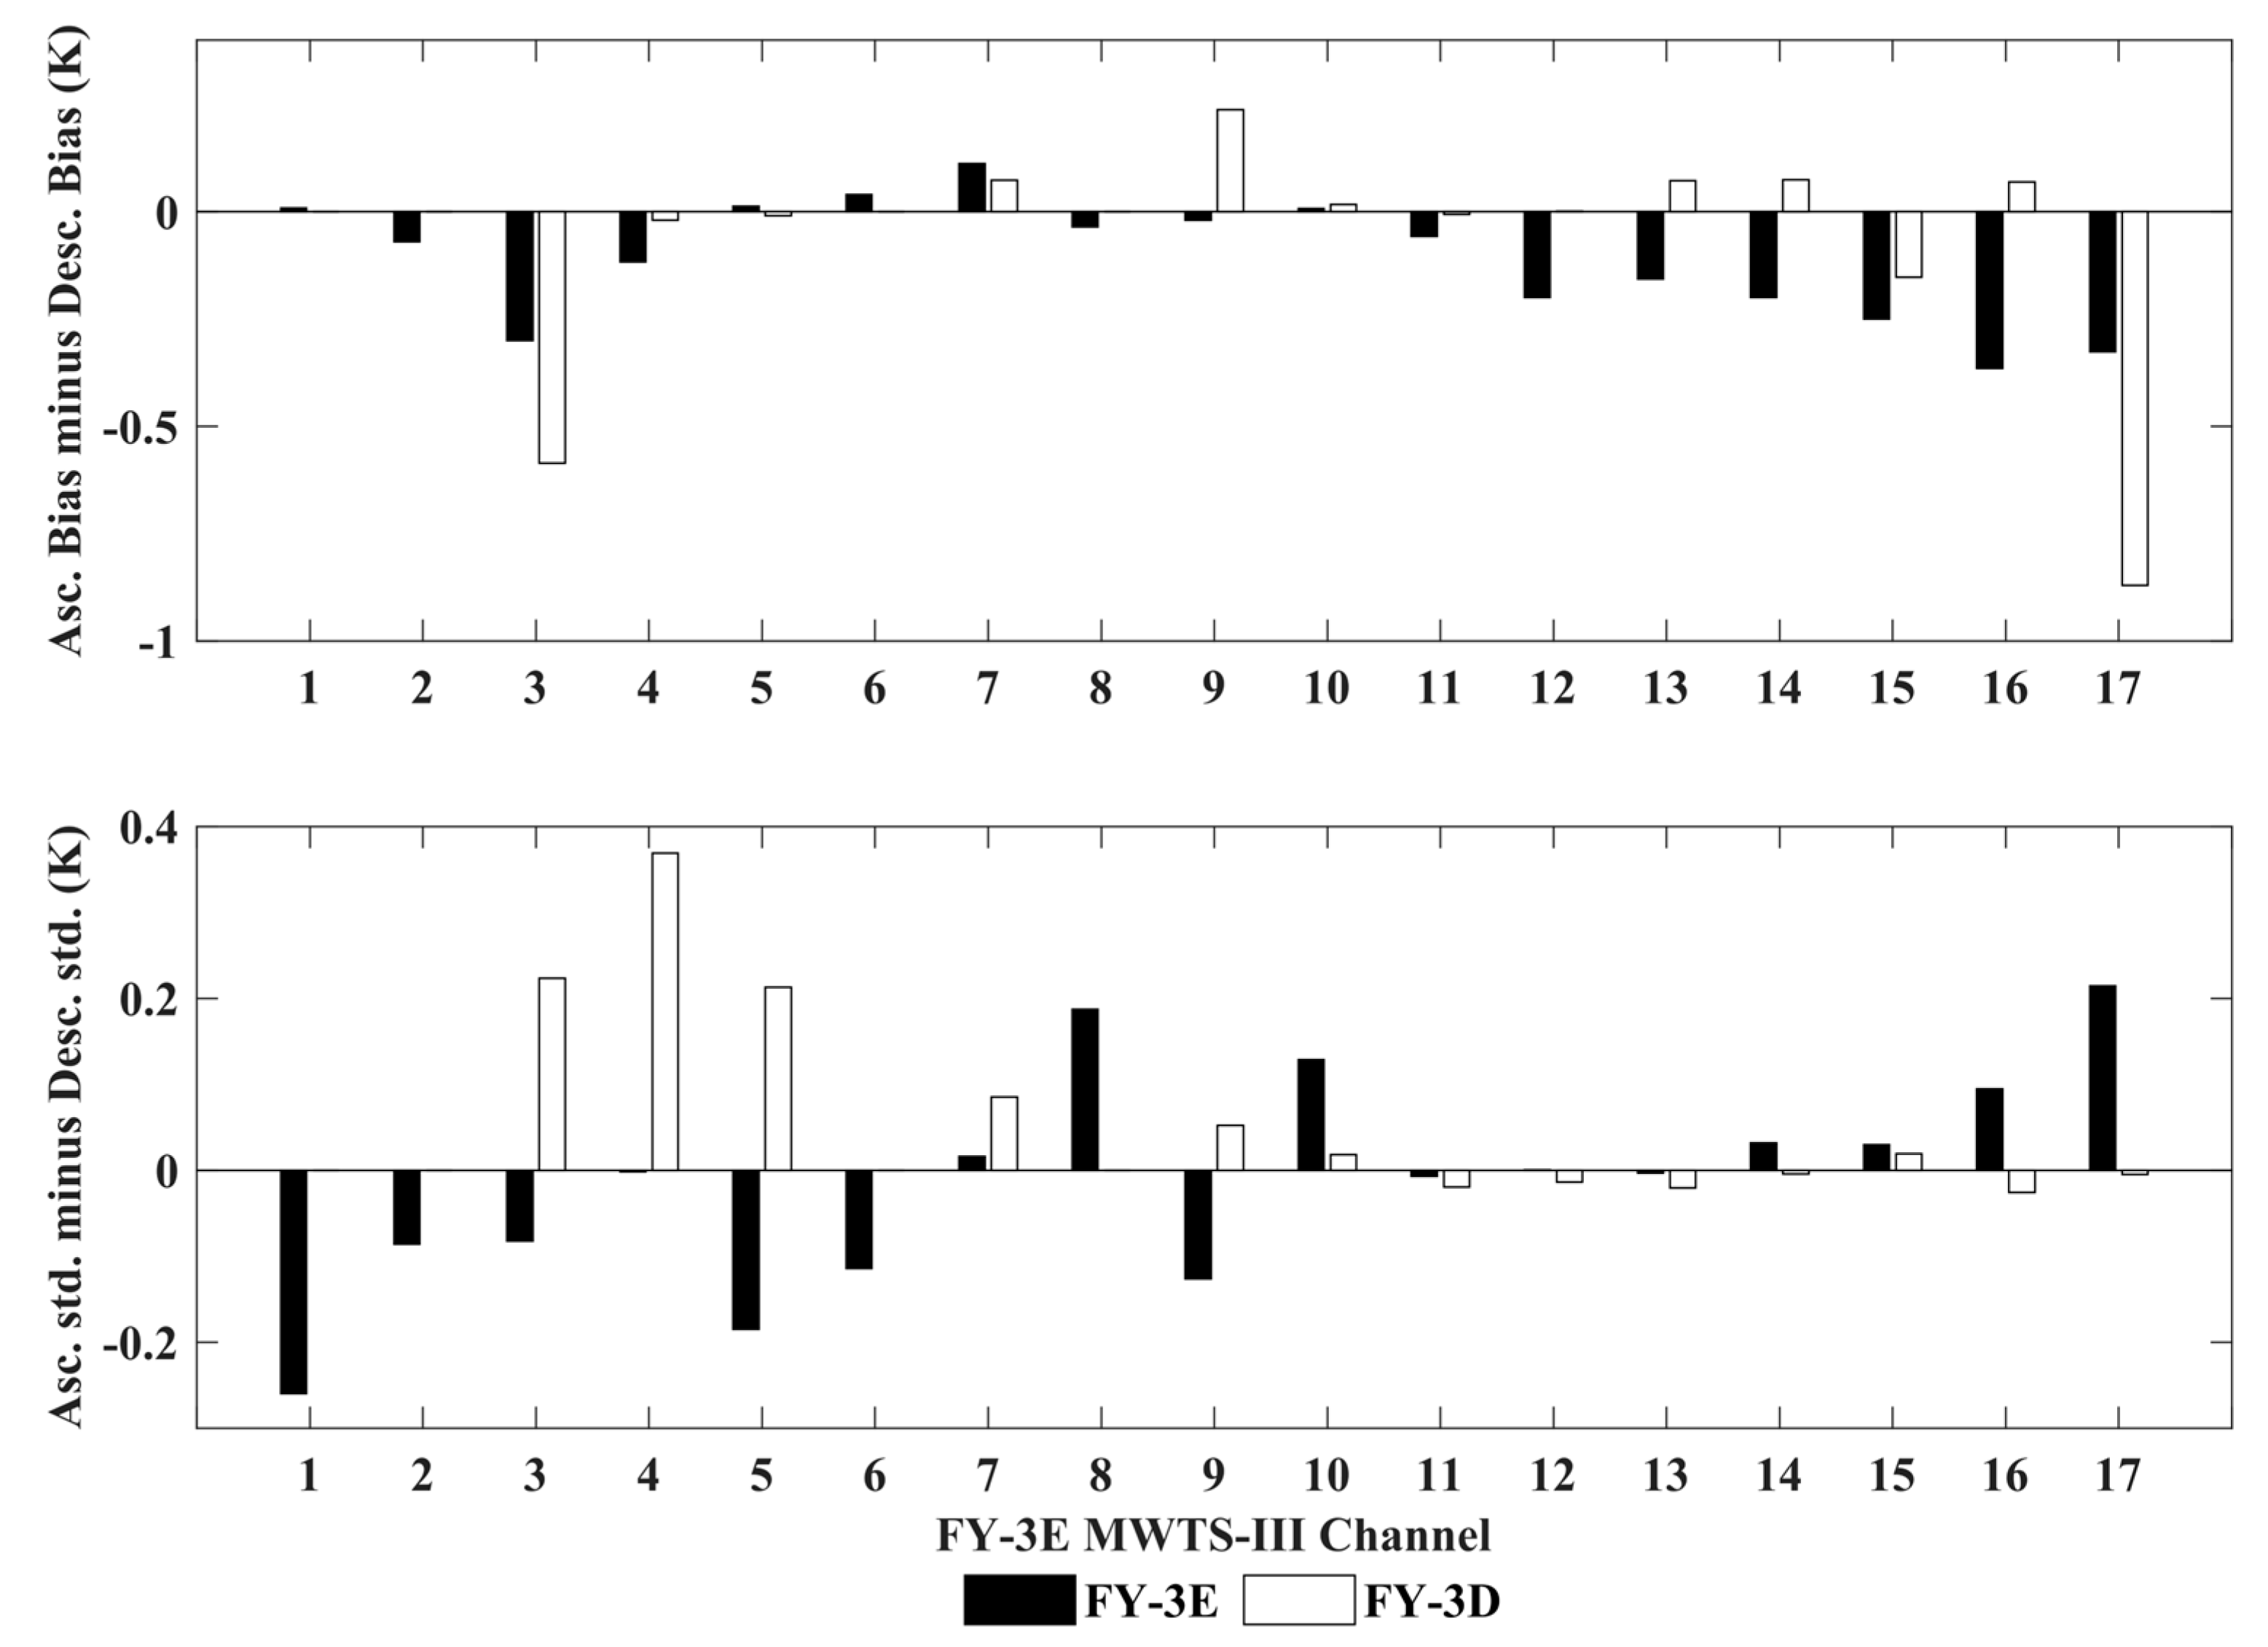
As the first operational satellite in early-morning orbit, the difference between the ascending and descending orbits is of interest. The ascending and descending orbit errors are calculated separately, and the
Figure 6 and
Figure 7 show the bias and standard deviation of the ascending and descending orbit errors. For most of the FY-3E MWTS-III channels (in
Figure 6), the descending orbit has not only a greater bias than the ascending orbit, but also a larger standard deviation. For the comparison of FY-3D MWTS-II, the differences for channel 3 and 17 are more pronounced. The discrepancy between the ascending and descending orbit biases reaches 0.8 K for channel 17 of FY-3D MWTS, a phenomenon consistent with that in Carminati et al. [
5], which may be due to the calibration issue identified as sub-optimal averaging of calibration counts in the operational level 1 processor. As for standard deviation, the difference in channels 3–5 and channel 7 is significantly larger than that of FY-3E. It may contribute to the larger standard deviation of FY-3D MWTS-II channels 3 and 4 in
Figure 3. With respect to these FY-3D MWTS-II channels, the standard deviation of the ascending orbit is greater than that of the descending orbit. Combined with the statistical results above, the accuracy of these channels on FY-3D MWTS-II is relatively poor, but the accuracy difference between the ascending and descending orbits is not significant. In general, the difference between the ascending and descending deviations of FY-3E is more significant than that of FY-3D, which may be due to the characteristics of the morning orbits. This problem may be more apparent in the channels with higher peak height of the weighting function.
As far as the MWHS instrument is concerned (
Figure 7), the range of differences between the MWHS ascending and descending orbit is much larger compared to the MWTS. The overall bias ranges from −3 K to 2 K and the standard deviation from −0.5 K to 2 K. The larger differences may be due to the fact that the channel is a window channel or the lower peak height of the weight function, which is more influenced by the surface emissivity. In the comparison of similar channels, the difference between FY-3E and FY-3D is clear, particularly in channel 1 and channel 7–10. There is a significant orbit variation in these channels of FY-3D, up to over 1.5 K. Unlike channel 1, the orbital difference for FY-3E is significantly smaller than that of FY-3D. There is also a significantly larger orbital difference for FY-3E at channel 10, even larger than FY-3D. In the upper water vapor absorption channel (channel 11 and 12), the differences between the two instruments are also pronounced, with the difference in standard deviation reaching 0.3 K. Although the track difference of FY-3E is smaller than that of FY-3D for most channels, the large difference of channel 10 should be taken into account.
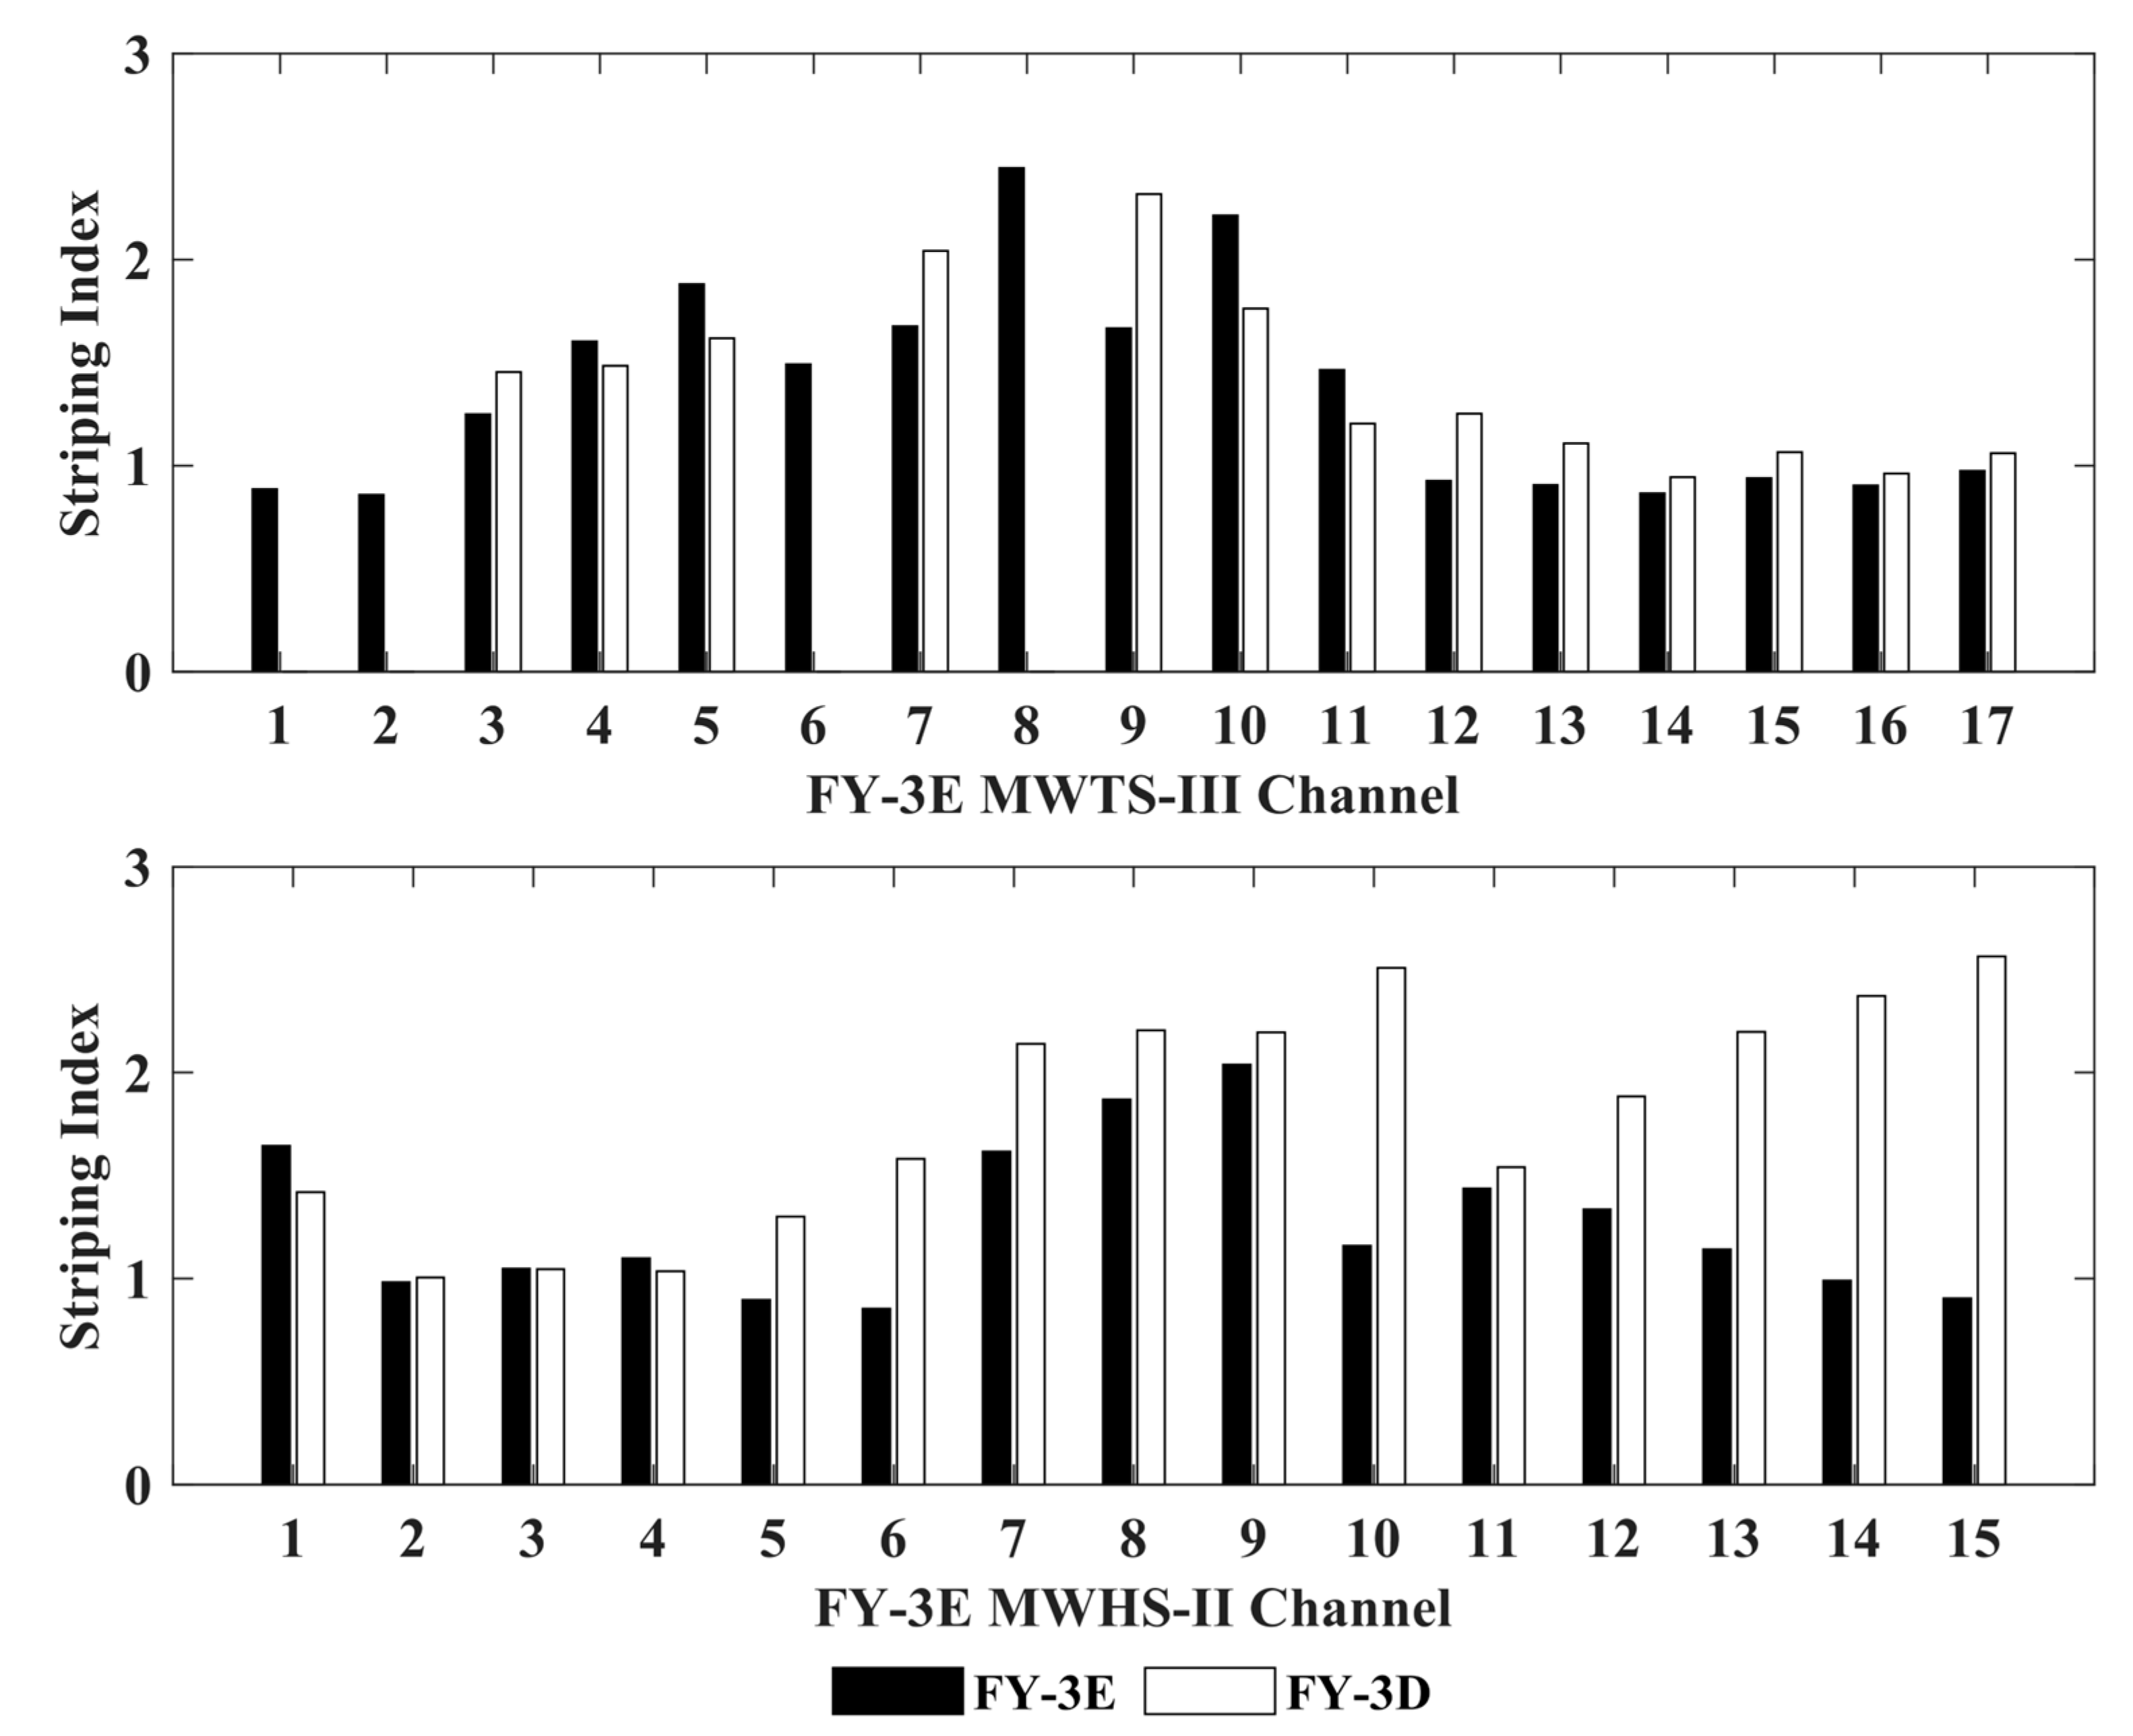
According to the previous research results, MWTS-II has obvious striping noise mitigation. In order to further explore whether FY-3E MWTS-III and MWHS-II also have this feature, the striping index is calculated for a single day selected randomly. The calculation of striping indices is performed as described in Zou et al. [
28] by selecting approximately 20 scan lines. All 98 FOVs were used in the calculation of along-track and cross-track variances.
Figure 8 shows the calculated striping index for each channel for comparable instruments on FY-3D and FY-3E. The black column represents FY-3E and the white one is FY-3D. It is very obvious that in a similar channel comparison, the striping indices of most channels of the FY-3E are lower than that of the FY-3D. However, the striping indices of MWTS-III channels 4–5, 10–11 and MWHS-II channels 1 and 4 are higher than that of FY-3D, particularly, MWTS-III channel 10. For MWHS-II window and water vapor channels 10–15, the striping indices are significantly reduced. Although the striping noise of FY-3E is reduced compared with that of FY-3D, the indices of most channels are still greater than 1, which should be taken seriously.
4. Assimilation Experiment
The weather numerical forecasting system CMA-GFS, also known as the Global/Regional Assimilation and Forecasting System (GRAPES) [
29], was developed and has been in operation in the CMA. The performance of CMA-GFS has presented the promising forecast skill in global weather prediction. Many efforts must still be made to narrow the gaps between CMA-GFS and other leading global forecast systems. Specific comparisons with various systems (ECMWF, NCEP, Russia, CMA-GFS, JMA and UK) were made by Yu et al. [
30].
The one month long assimilation experiment for FY-3E MW sounding observation in NWP was carried out over the period from 16 July to 15 August 2021, by using version 3.2 CMA-GFS. The observation was assimilated in the four dimensional-variational (4D-Var) framework. The improved incremental analysis utilizing multiple loops was performed to assimilate the observations at multiple time points. The data in the 6 h time window of the assimilation was divided into 0.5 h slots and assimilated in the three-dimensional-variational (3D-Var) method. The model horizontal resolution was 0.5 degrees in longitude and latitude. The simulated observation and the innovation were calculated on this resolution. The tangent linear and adjoint models were integrated in the degraded resolution of 1.0 degree. The forecast model used the nonhydrostatic dynamical core and a semi-Lagrangian transport method. The vertical discretization takes a height-based terrain-following vertical coordinate. The new simplified Arakawa–Schubert cumulus parameterization and double parameters microphysics scheme were used for cumulus convection and cloud parameterization, respectively. The new medium-range forecast (NMRF) boundary layer scheme was applied. The 240 h (10 days) forecasts were made with 12 h interval output.
In all satellite MW sounders except ATMS, the temperature and humidity sensors are two separate units. Therefore, there is a significant difference in the field of view and resolution of the temperature and humidity observations. In general, one data stream is designed for one kind of observation in the data assimilation system. Different data streams are independent of each other. As a result, there are two data streams for MW sounding, and the separate data streams make it impossible to combine information from the two instruments when assimilating. In order to jointly apply the observations of the two instruments, the MW sounding of the FY-3E was pre-processed firstly in the assimilation experiment. MWTS and MWHS are matched to the same field of view size and produced a new combined MW sounder data (named CMWS) with a total of 32 channels and both temperature and humidity measurement, similar to ATMS. CMWS combined data streams were resampled using Backus and Gilbert’s footprint matching method [
31]. New observations can be remapped by selecting the resolution of MWTS or the higher resolution of MWHS. The CMWS data on MWTS FOV matching the model resolution were used in our experiment. The data were averaged to reduce the noise before they were assimilated, for both ATMS and CMWS, and all satellite data were thinned to 120 km in the assimilation experiments. Note that the assessments of data quality (in
Section 3) were all conducted using the original observations, before averaging.
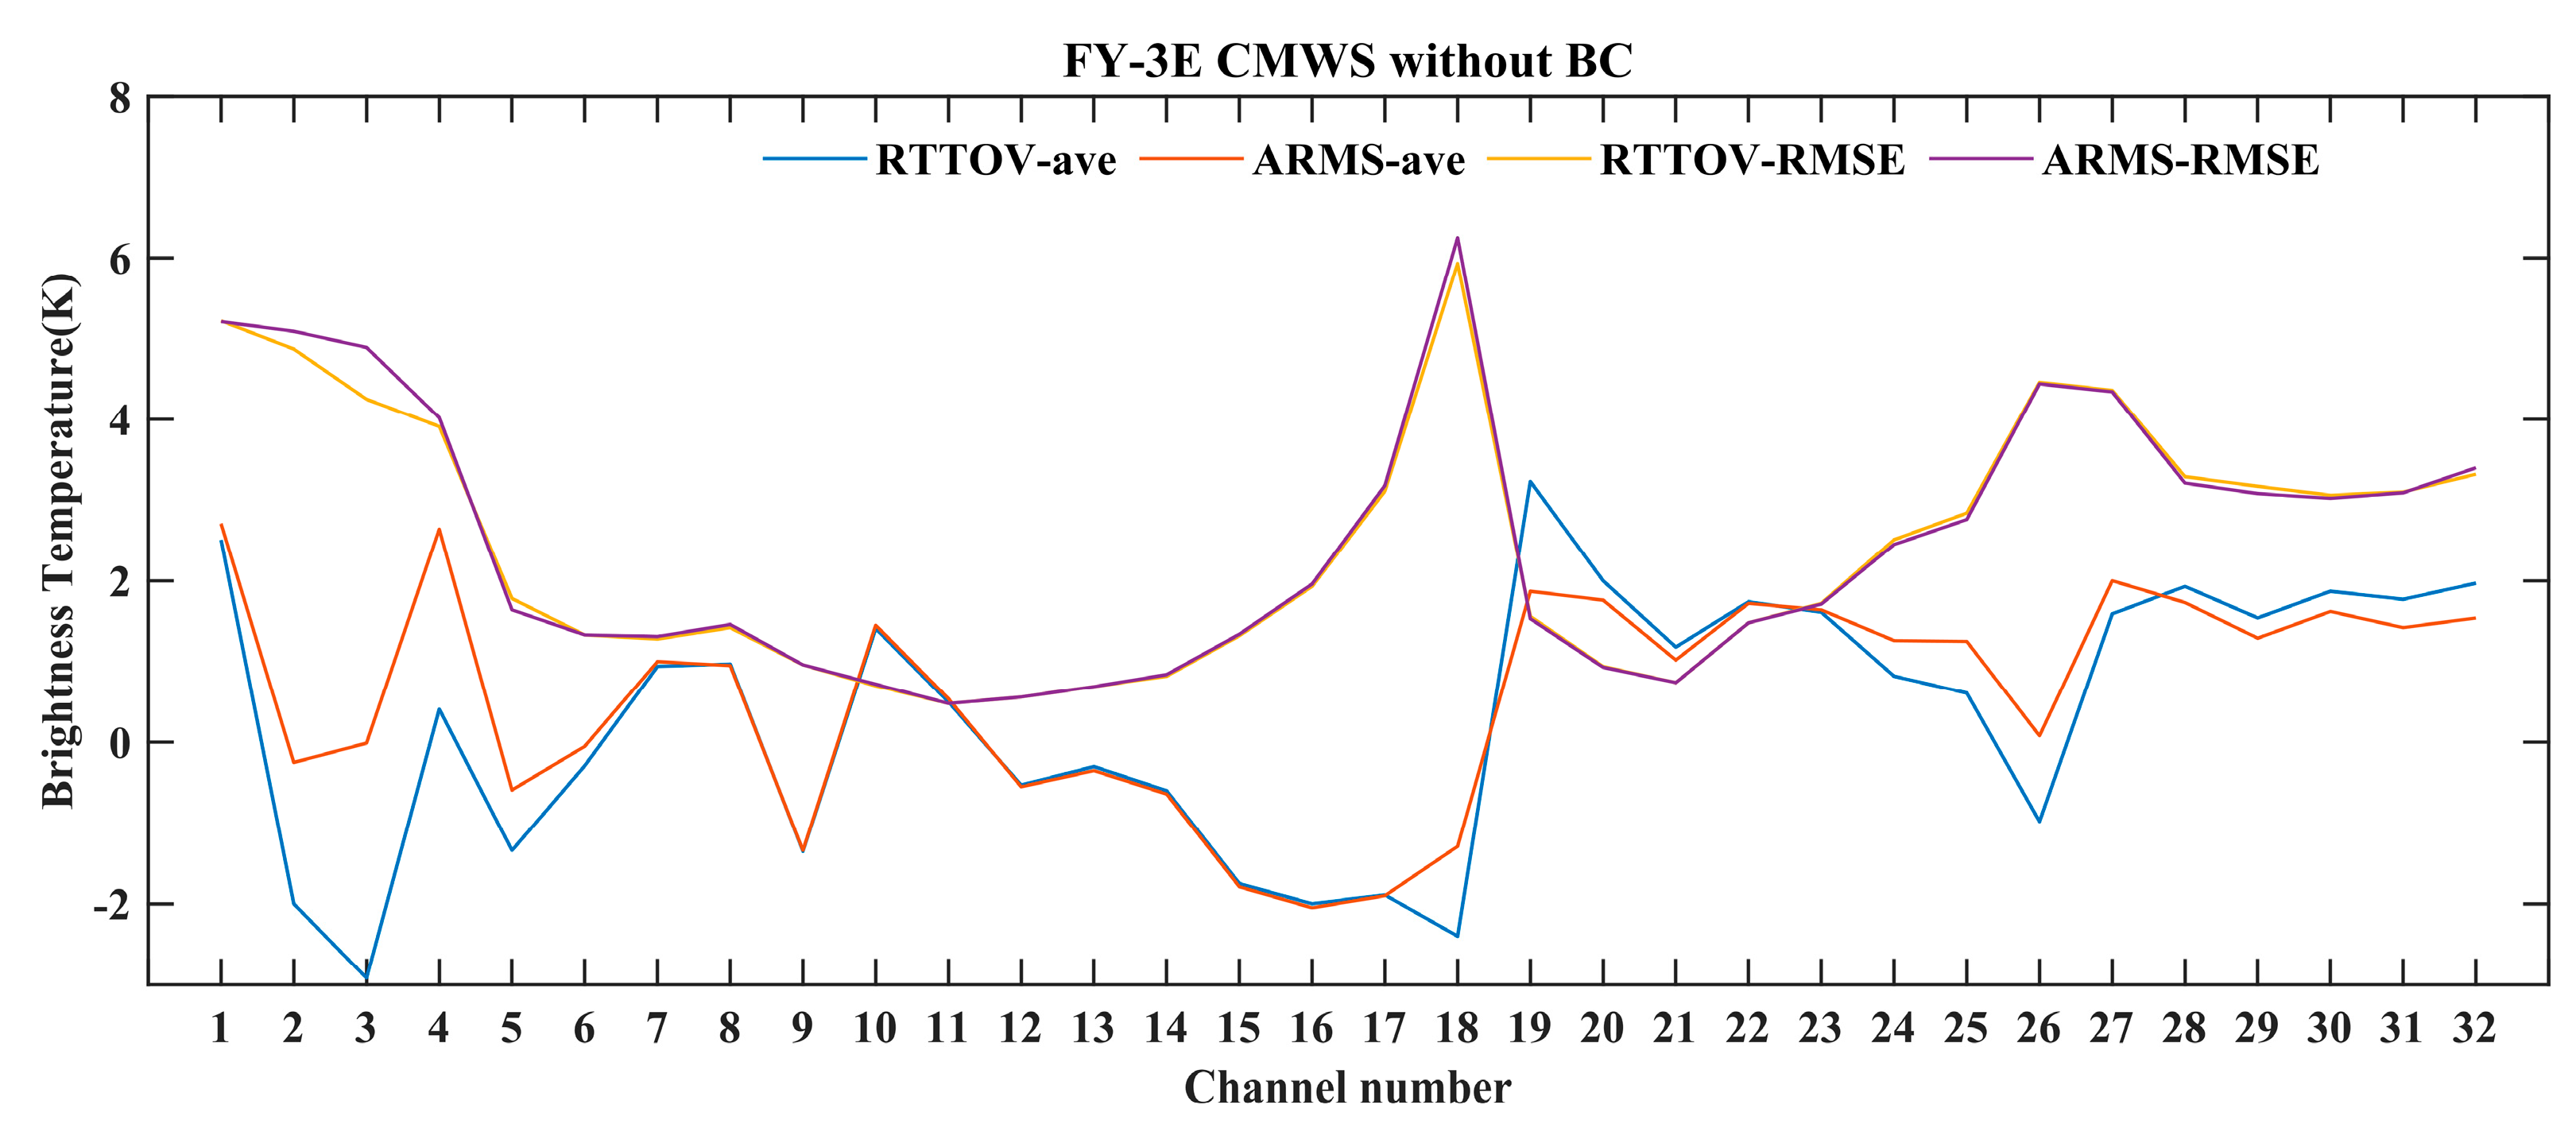
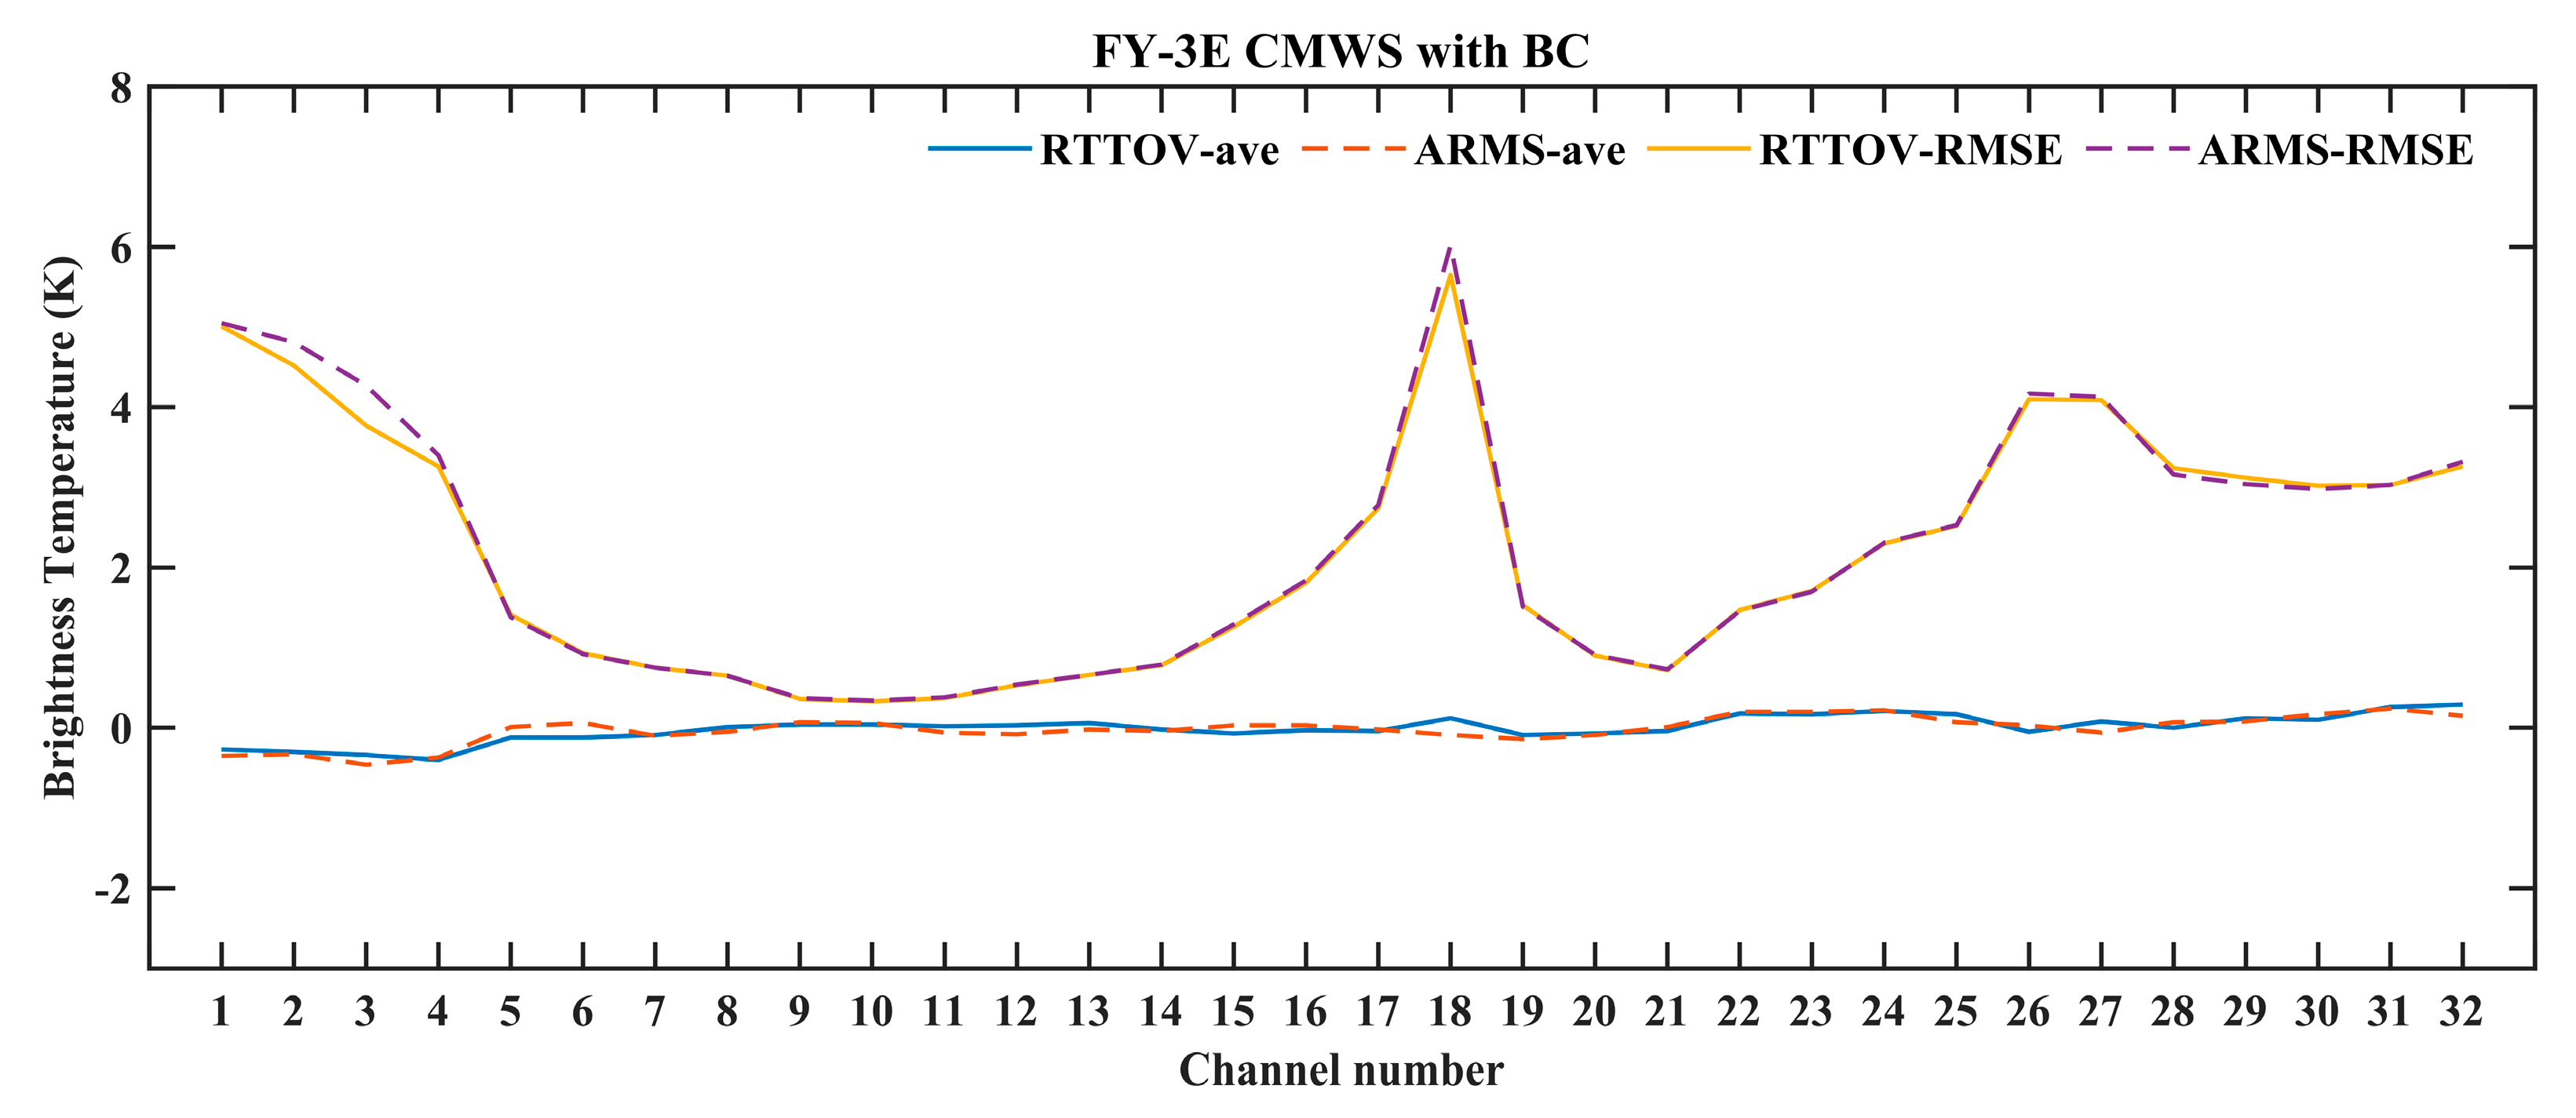
A fast and accurate radiative transfer model is necessary in satellite radiance assimilation to obtain the simulated observation equivalent to the NWP atmospheric state and the adjoint gradient information for the minimization procedure of the target function. ARMS is plugged into CMA-GFS and takes the place of RTTOV, used previously. ARMS is also enhanced with the rapid atmospheric transmittance modeling of FY-3E CMWS. The performance and accuracy of ARMS modules on CMWS are checked and verified, including the forward, tangent linear and adjoint.
Figure 9 shows the bias and root mean squares error of observed brightness temperature and simulation of two observation operators, ARMS and RTTOV, respectively. Although the biases of the two models vary on different channels, their root mean square errors (RMSEs) are relatively close. It could be found that ARMS has an equivalent performance to RTTOV.
There is always bias in the satellite observation, and the bias correction is important for radiance assimilation. The offline statistics method proposed by Harris and Kelly [
32] and the variational bias correction (VarBC) schemes pioneered by Derber and Wu [
33] are utilized in satellite data assimilation. As mentioned before, there is notable bias for FY-3E varying with the scan angle (
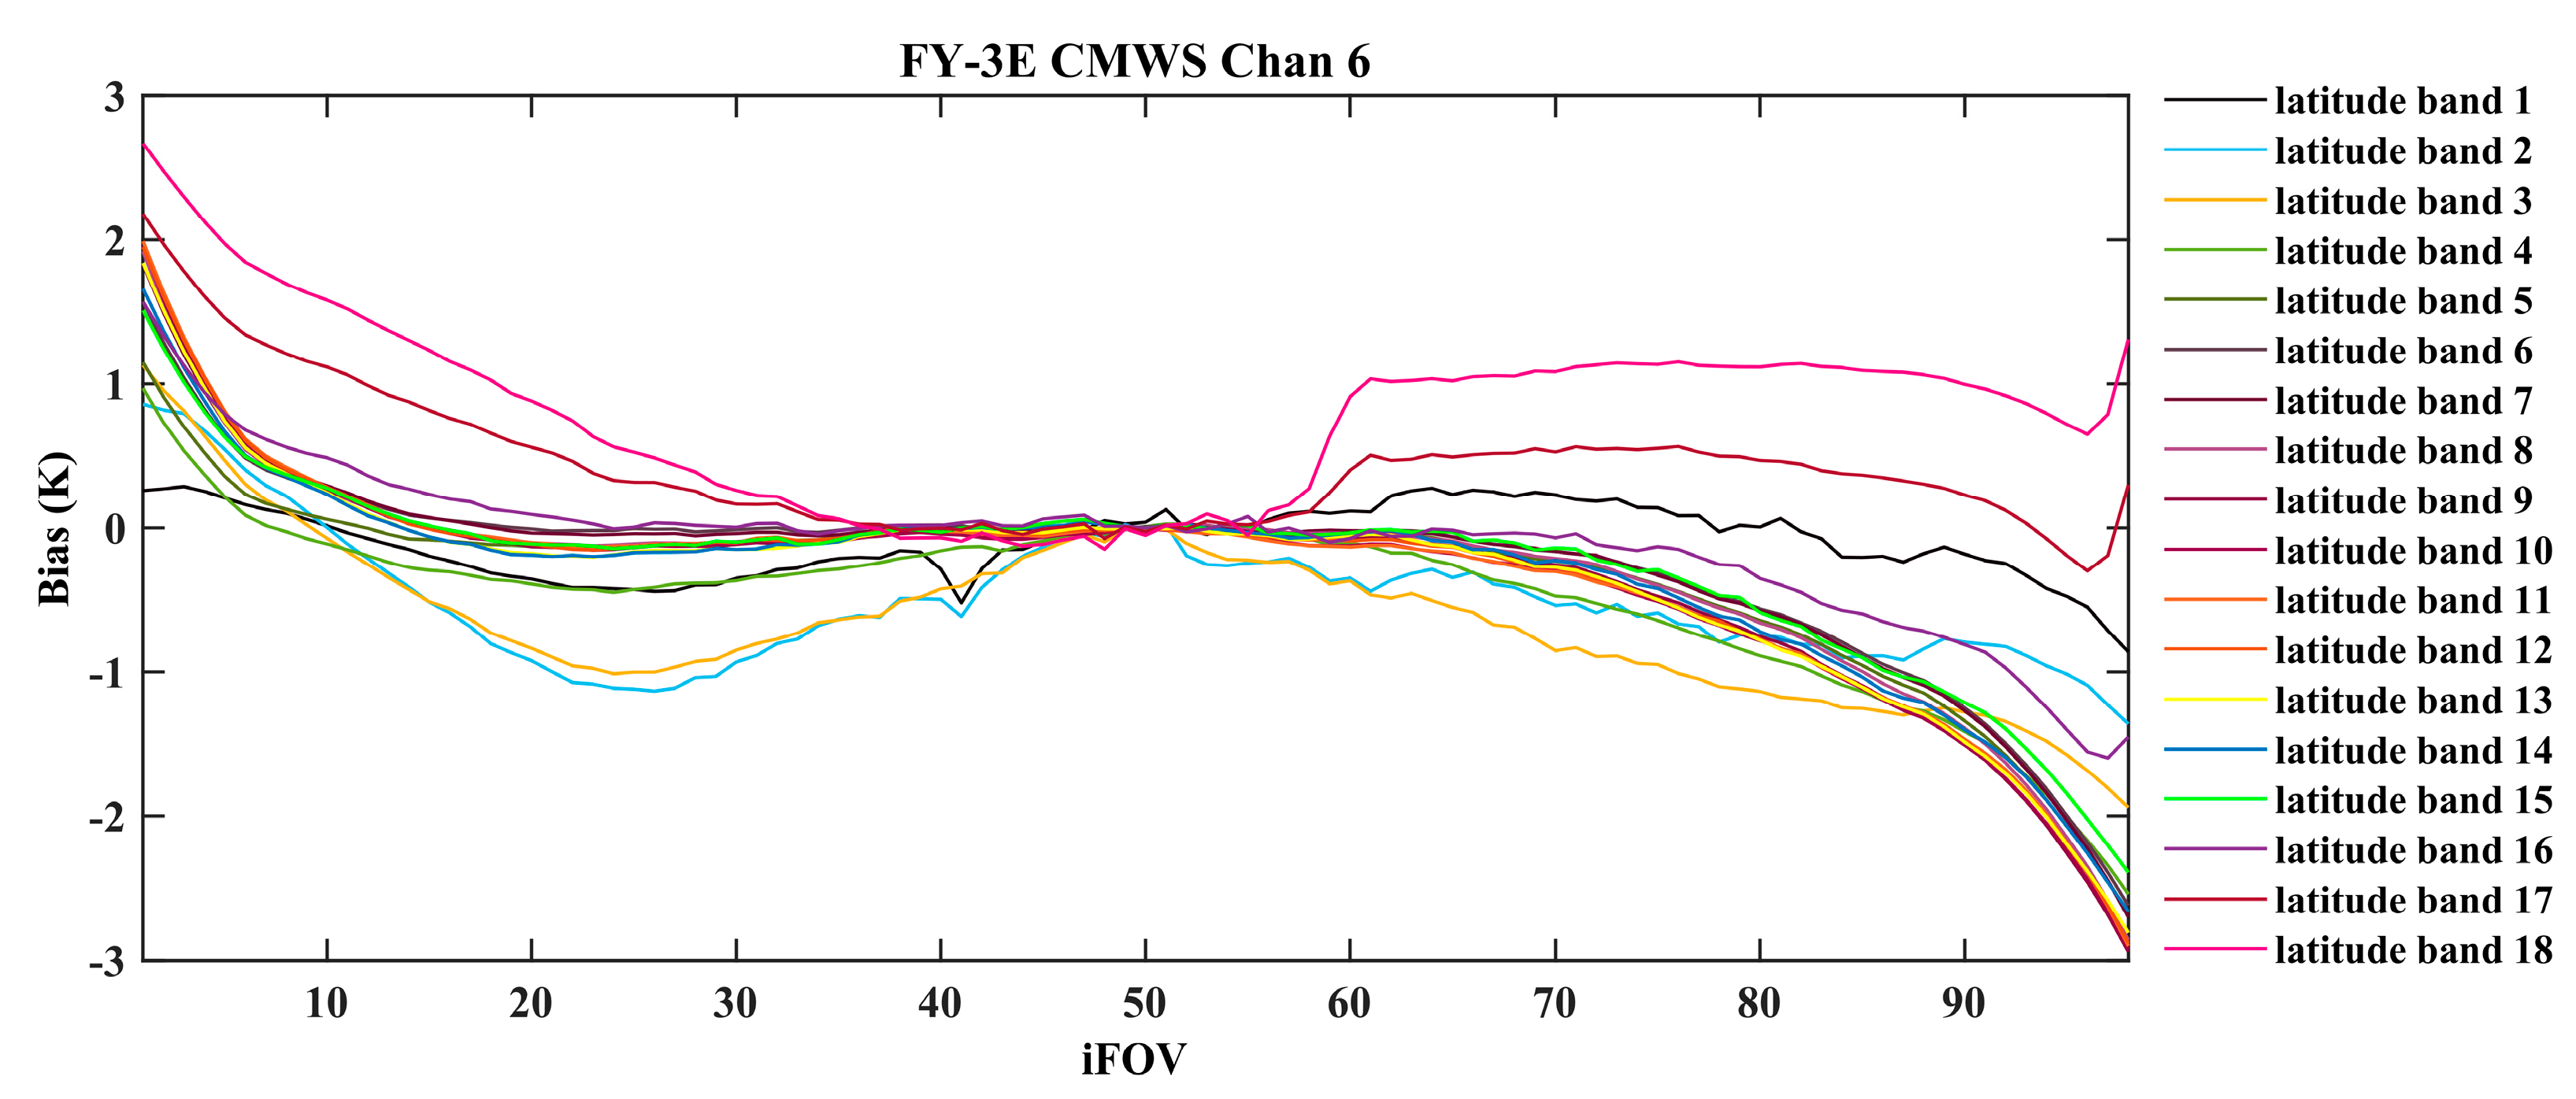
Figure 1), which is called scan angle-dependent bias. It could be handled in both bias correction schemes in which the bias is all classified into the scan and air mass bias associated with satellite scanning and atmospheric properties, respectively. In past studies, it was found that the scan-dependent bias of FY-3D MW data varied with latitude. However, the predictors for scan bias in the variational bias correction are only composed with scan angle, and it is difficult to take the latitude into consideration at the same time. Therefore, an offline scan bias correction procedure is used to correct for scan bias with latitude. The globe is divided into 18 latitudinal bands and the correction is performed. The scan bias of the FY-3E CMWS channel 6 is statistically calculated by the divided latitude band in
Figure 10. It could be seen that the scan bias is well discriminated, and the feature of a latitude-dependent scan bias is significant as well. The bias correction scheme was applied to FY-3E CMWS. It is anticipated that the bias could be corrected in the FY-3E CMWS data assimilation (
Figure 11). The bias between simulated and observation data after bias correction is almost zero. It is implied that the distribution of the satellite observation innovation approaches the asymptotic normality with the bias correction to satisfy the requirement of data assimilation.
Quality control is another crucial procedure for the assimilation. The cloud detection scheme is one of the most important factors for radiance assimilation in clear sky conditions. The cloud contaminated observation is distinguished and discarded to ensure the analysis and subsequent forecast quality. The satellite observation-based retrieval of cloud liquid water (CLW) from two channels at the frequency of 23.8 GHz and 31.4 GHz is a popular cloud detection scheme generally used for MW temperature observation. For the previous generation of MW sounding observations of FY-3E, such as FY-3D, these two key window channels are missing. The difference between simulated and observed brightness temperature at the frequency of 50.3 GHz proposed by ECMWF to assimilate ATMS is utilized. With the supplementary channels at the frequency of 23.8 and 31.4 GHz, retrieved CLW is an optional cloud detection method for FY-3E as follows [
34]:
where
is the scan angle.
is the surface temperature.
and
are the observed brightness temperature at the frequency 23.8 GHz and 31.4 GHz, respectively.
is the function of scan angle and is represented as:
in which,
,
and
, along with
and
are the regression coefficients and could be obtained from the training dataset. The physical algorithm for retrieving the cloud liquid water path was developed for ATMS. The performances of the physical and empirical algorithms are assessed and compared [
22]. The scheme could be applied for FY-3E MW observation. The CLW retrieval takes the seemingly similar formula:
However, there are core differences between the physical algorithm and the conventional method in determining the coefficients , and . In this algorithm, cloud temperature, sea surface temperature and sea surface wind speed are used to imply the physical constraints in the CLW retrieval.
Another alternative scheme to discriminate the cloud information is taking the advantage of the unique eight sounding channels around 118.75 GHz [
23,
35] onboard MWHS. Three paired oxygen absorption band channels with the almost same peaking weighting function altitude could be used to achieve the corresponding scattering information. The paired channels are MWTS 52.80 GHz and MWHS 118.75 ± 2.5 GHz, MWTS 53.596 GHz and MWHS 118.75 ± 1.1 GHz, and MWTS 54.40 GHz and MWHS 118.75 ± 0.8 GHz. It was found that the relationship between the paired MWTS and MWHS brightness temperature was approximately linear. Therefore, the regressed MWHS brightness temperature
can be obtained from the paired MWTS observed brightness temperature
by:
where
are the regression coefficients derived from observations of matched channels.
is defined as the difference between the regressed and observed MWHS brightness temperature,
could represent the cloud liquid and ice water scattering effect. The more and larger the cloud drop is, the stronger the scattering. As MW temperature and humidity observation are assimilated in two data streams, there is a need for a separate cloud detection scheme for humidity data. The scattering index composed by channels at the frequency of 89.0 GHz and 165.0 GHz is generally used. This cloud detection scheme for humidity observation and the single channel at 50.3 GHz method for temperature data, operationally utilized for FY-3D MW observation, are named the FY MW sequence cloud detection scheme in our experiment. By using the CMWS data, the temperature and humidity observation are in one data stream, similar to ATMS. It is convenient to apply the consistent quality control for temperature and humidity data. In particular, it also makes the implementation of paired oxygen absorption band index much easier in one data stream rather than two data streams.
Thus, the assimilation experiments are grouped with in total five individuals to evaluate the forecast impact of FY-3E MW sounding data with the emphasis on the cloud detection scheme at the same time. The experiments are listed in
Table 3. The first experiment, ARMS_nocmws, is the baseline run and most of the conventional and unconventional observations used in operation at CMA are assimilated. The former includes sound, synop, ship and airplane observation, and the latter are GPS occultation and mainly satellite radiance from NOAA-15 AMSUA, NOAA-18 AMSUA, NOAA-19 AMSUA, NOAA-19 MHS, SNPP ATMS, EOS AIRS, MetOp-A AMSUA, MetOp-A MHS, MetOp-A IASI, MetOp-B AMSUA, MetOp-B MHS and MetOp-B IASI.
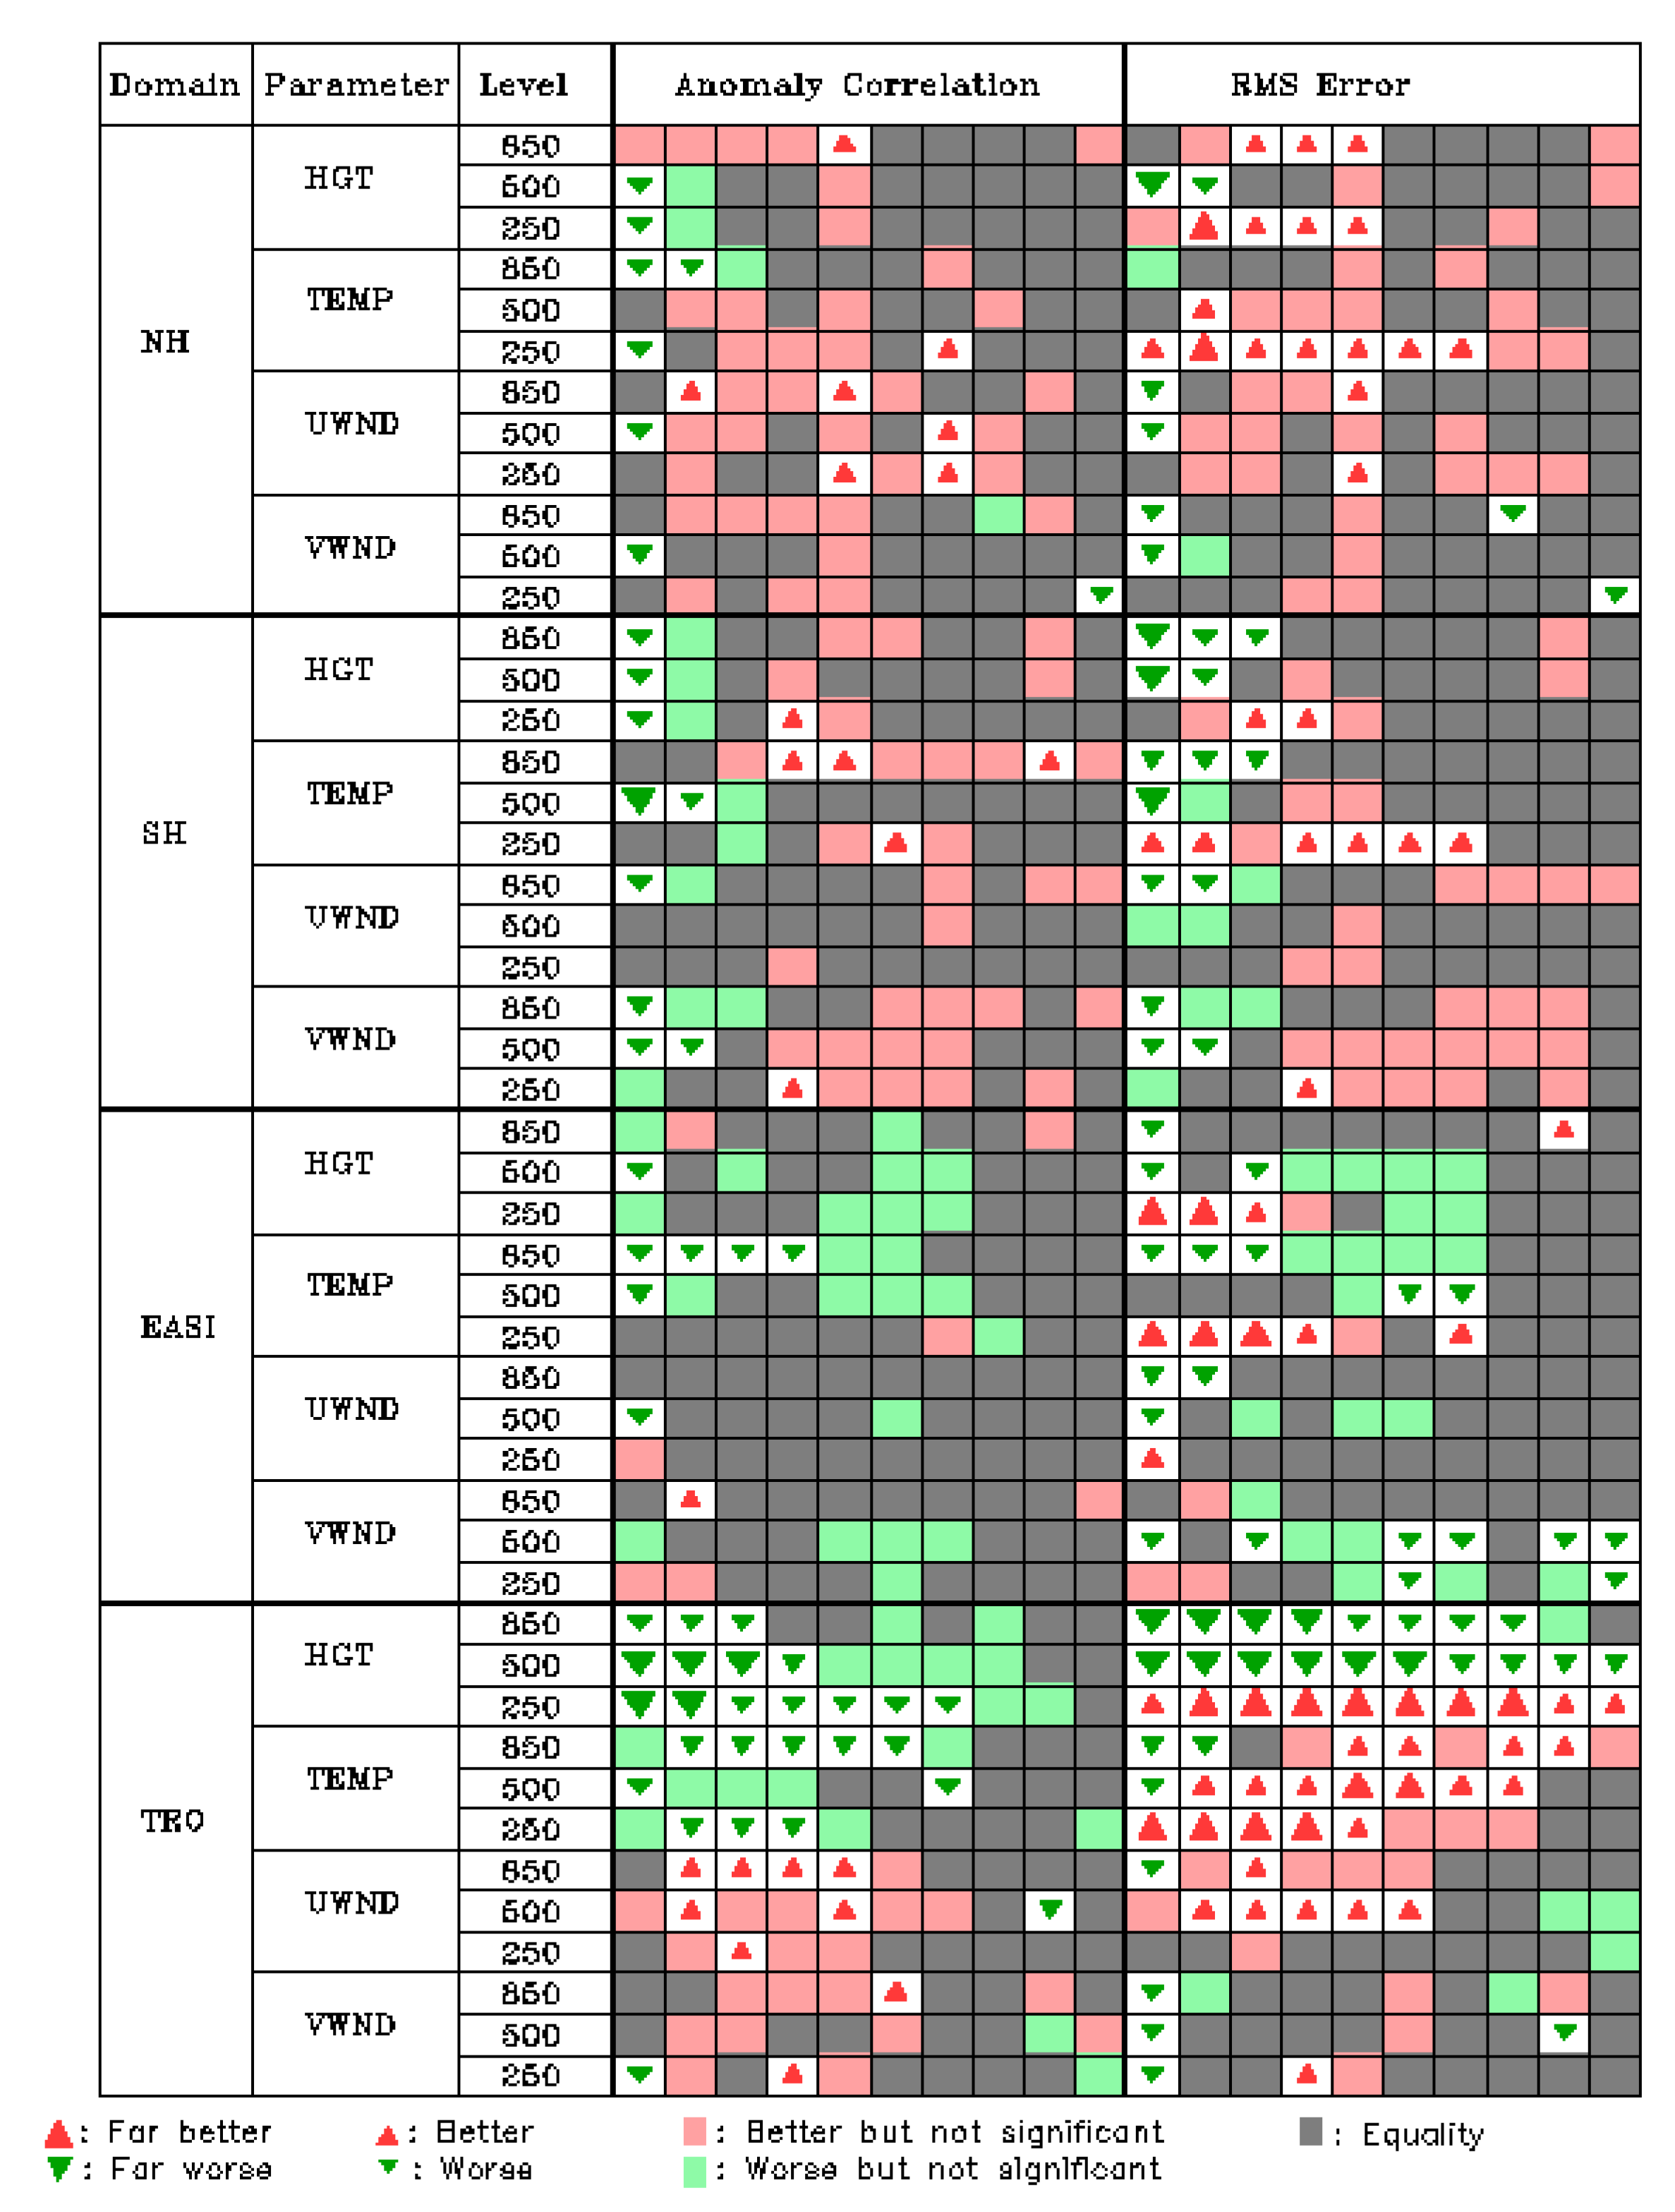
The operational evaluation of the composite score is used to access the impact on NWP and obtain a comprehensive view on key atmospheric variables through the change in the anomaly correlation coefficient (ACC) and RMSE over different regions (northern hemisphere, southern hemisphere, East Asia and the tropic) in a range of forecast lead times over the period 16 July to 15 August 2021 (
Figure 12a). It is very exciting to find that not only the forecasts of the southern hemisphere and the tropics are improved significantly, but also the predictions for the northern hemisphere show some improvements in an overall neutral change. It is just a pity that a little extent degradation is caused in the East Asia region. For the main, the impact is very positive for the assimilation of FY-3E MW sounding observation on the numerical weather forecast in the CMA-GFS system.
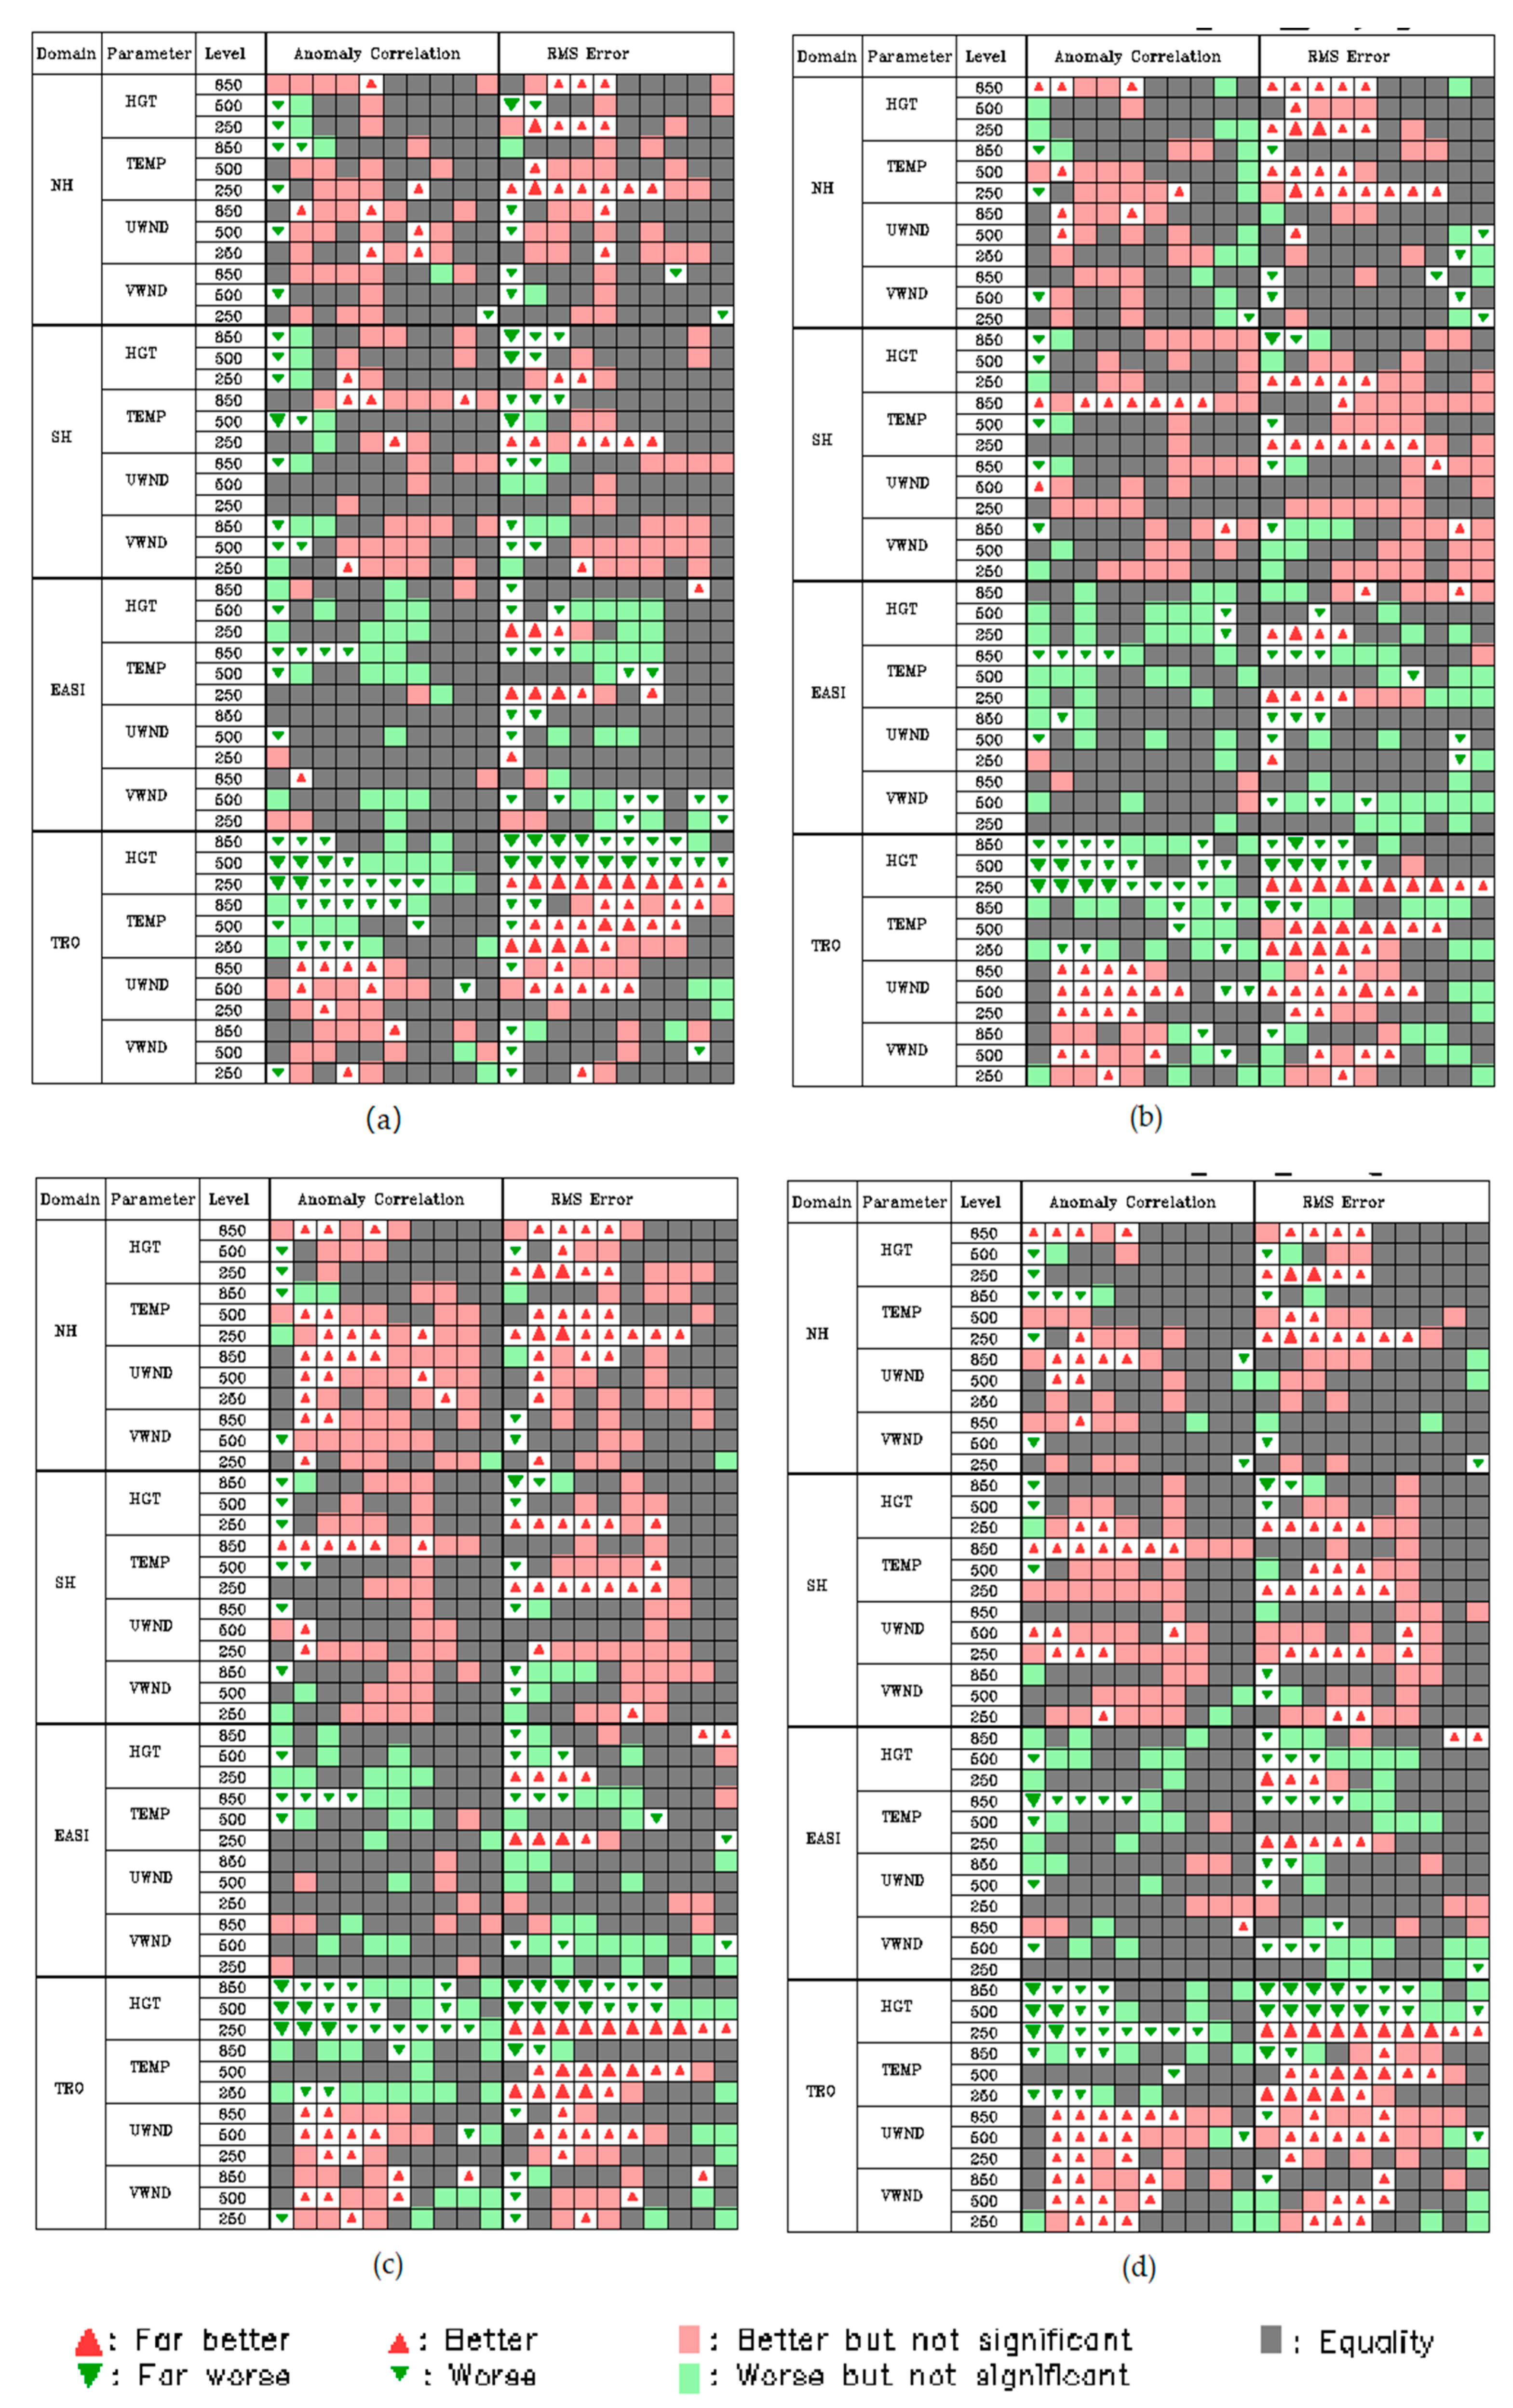
It was shown that the cloud detection scheme has a significant effect on the impact of FY-3E
Figure 12b–d). Compared with
Figure 12a, it could be found that the extent of forecast improvement was reduced substantially for the Grody scheme, though the impact of FY-3E CMWS was positive in general. The overall benefits gained with both Exp4 and Exp5 with the physical algorithm and paired oxygen absorption band scheme, respectively, are better than that of Exp3 with Grody scheme. It is noted that the changes over the northern hemisphere were obviously improved, though it was a degradation over the southern hemisphere. Especially, the improvement over the northern hemisphere was the most significant for the assimilation of FY-3E MW observation with cloud detection using physical retrieved cloud liquid water.
It is demonstrated a neutral to positive impact on the forecast in most previous experiments in which MW instruments onboard Chinese FY satellite were assimilated [
5,
13]. The impact is investigated by adding the FY observation into the numerical forecast system in which radiances from many satellites are utilized. There may be information saturation for the NWP system. The greater the saturation, the harder it is for a new data type to make a positive impact. An extended experiment is conducted. FY-3E CMWS is assimilated on top of the baseline while ATMS is kicked out.
Table 4 gives the list of extended assimilation experiments.
The same composite score is presented in
Figure 13 as
Figure 12 but for the extended experiment. It is promising to see that the overall change of the forecast from adding FY-3E MW instrument without ATMS is neutral against that of the baseline. It is illustrated that the impact of FY-3E MW radiance is equivalent to ATMS as they are assimilated into the NWP system individually.
5. Conclusions
FY-3E is the latest Chinese early-morning orbit meteorological satellite. In this study, a detailed characterization of data quality and its impact on the numerical weather forecast of MW sounding observation from the morning-orbit satellite FY-3E is investigated in the CMA-GFS, the operational global forecast system in the Chinese Meteorology Administration. ARMS, a fast radiative transfer model developed in CMA, is coupled into the prediction system to be the observation operator of satellite radiance. It is verified that ARMS has an equivalent performance to the RTTOV. After confirmation of the polarization characteristics of the FY-3E instrument, the assessment was first performed by comparison with similar channels of FY-3D and ATMS using ARMS. In the comparison of standard deviations, the two new channels added to MWTS-III performed worse than the equivalent channels in ATMS. Overall, the FY-3E MWTS-III channels performed slightly worse than the FY-3D and ATMS equivalents. For MWHS-II, the performance of each channel of FY-3E improved compared to FY-3D and was similar to ATMS. In addition, the biases of the ascending and descending orbits of FY-3E MWTS-III were more pronounced than those of FY-3D due to the differences in the morning and evening orbits. The deviation of the descending orbit was not only larger than that of the ascending orbit, but also the standard deviation. The range of differences between the ascending and descending orbits was much larger for MWHS-II compared to MWTS-III. Increasing attention is paid to the striping noise of MWTS instrument. Although the striping noise of FY-3E MWTS-III is reduced compared with that of FY-3D, the phenomenon is still apparent in channels 5–10.
In order to combine temperature and humidity instrument observations similar to ATMS, the MW sounding observations of FY-3E were preprocessed into a new data set named CMWS. The temperature and humidity observation are matched to the same field of view by using the Backus and Gilbert footprint matching method. It makes CMWS a MW satellite measurement similar to ATMS from USA SNPP or NOAA-20. The data stream in the assimilation system is, thus, transferred to one data stream from two separate data streams for independent temperature and humidity observation, and it is convenient to use a consistent procedure for temperature and humidity data.
The bias in the FY-3E MW data revealed from the analysis of data quality was carefully corrected. To remove bias varying with the scan angle, the scan-dependent bias correction is allowed to vary with latitude. Off-line bias correction was adapted to obtain the scan bias on 18 latitude belts globally. It is verified that the scan bias is successfully corrected.
Two groups with a total of six individual one month long assimilation experiments were conducted over the period from 16 July to 15 August 2021. The observation was assimilated in the 4D-Var framework with a 6 h time assimilation window. Then, the 10 days forecast is made. The operational evaluation of the composite score on key atmospheric variables through the change in the ACC and RMSE over different regions in a range of forecast lead times was used to assess the impact on NWP. With the assimilation of FY-3E CMWS, it was shown that not only the forecasts for the southern hemisphere and tropics were improved significantly but also the predictions for the northern hemisphere show some improvements in an overall neutral change. FY-3E CMWS could have an equivalent impact to ATMS. In addition, it is illustrated that the cloud detection scheme plays a crucial effect on the impact of FY-3E. The forecast over the northern hemisphere was improved by using physical CLW algorithm.
This study was carried out using the one month data at the initial stage of the satellite launch. As the world’s first civilian early-morning orbit meteorological satellite, it is valuable to assimilate the FY-3E MW observations and evaluate their potential impact on NWP. It also provides some guidelines to use the data more effectively. The current work is to adjust and optimize the relevant strategies by using real-time observations, and according to the experimental results, the forecasting effect was improved. As this article only has a preliminary discussion of the impact of cloud detection schemes, our next step is planned to carry out research on the region-dependent cloud detection scheme.
